UNITED STATES
SECURITIES AND EXCHANGE COMMISSION
Washington, D.C. 20549
FORM N-CSR
CERTIFIED SHAREHOLDER REPORT OF REGISTERED
MANAGEMENT INVESTMENT COMPANIES
Investment Company Act file number 811-03407
Fidelity Boylston Street Trust
(Exact name of registrant as specified in charter)
245 Summer St., Boston, MA 02210
(Address of principal executive offices) (Zip code)
Marc Bryant, Secretary
245 Summer St.
Boston, Massachusetts 02210
(Name and address of agent for service)
Registrant's telephone number, including area code:
617-563-7000
Date of fiscal year end: | March 31 |
Date of reporting period: | September 30, 2016 |
Item 1.
Reports to Stockholders
Fidelity® Multi-Manager Target Date Funds (formerly Strategic Advisers® Multi-Manager Target Date Funds) - Income, 2005, 2010, 2015, 2020, 2025, 2030, 2035, 2040, 2045, 2050, 2055, 2060 Semi-Annual Report September 30, 2016 |
 |
Contents
Fidelity® Multi-Manager Income Fund | |
Fidelity® Multi-Manager 2005 Fund | |
Fidelity® Multi-Manager 2010 Fund | |
Fidelity® Multi-Manager 2015 Fund | |
Fidelity® Multi-Manager 2020 Fund | |
Fidelity® Multi-Manager 2025 Fund | |
Fidelity® Multi-Manager 2030 Fund | |
Fidelity® Multi-Manager 2035 Fund | |
Fidelity® Multi-Manager 2040 Fund | |
Fidelity® Multi-Manager 2045 Fund | |
Fidelity® Multi-Manager 2050 Fund | |
Fidelity® Multi-Manager 2055 Fund | |
Fidelity® Multi-Manager 2060 Fund | |
Board Approval of Investment Advisory Contracts and Management Fees |
To view a fund's proxy voting guidelines and proxy voting record for the 12-month period ended June 30, visit http://www.fidelity.com/proxyvotingresults or visit the Securities and Exchange Commission's (SEC) web site at http://www.sec.gov.
You may also call 1-800-835-5095 (plan accounts) or 1-800-544-3455 (all other accounts) to request a free copy of the proxy voting guidelines.
Standard & Poor's, S&P and S&P 500 are registered service marks of The McGraw-Hill Companies, Inc. and have been licensed for use by Fidelity Distributors Corporation.
Other third-party marks appearing herein are the property of their respective owners.
All other marks appearing herein are registered or unregistered trademarks or service marks of FMR LLC or an affiliated company. © 2016 FMR LLC. All rights reserved.
This report and the financial statements contained herein are submitted for the general information of the shareholders of the Funds. This report is not authorized for distribution to prospective investors in the Funds unless preceded or accompanied by an effective prospectus.
A fund files its complete schedule of portfolio holdings with the SEC for the first and third quarters of each fiscal year on Form N-Q. Forms N-Q are available on the SEC’s web site at http://www.sec.gov. A fund's Forms N-Q may be reviewed and copied at the SEC’s Public Reference Room in Washington, DC. Information regarding the operation of the SEC's Public Reference Room may be obtained by calling 1-800-SEC-0330.
For a complete list of a fund's portfolio holdings, view the most recent holdings listing, semiannual report, or annual report on Fidelity's web site at http://www.fidelity.com, http://www.institutional.fidelity.com, or http://www.401k.com, as applicable.
NOT FDIC INSURED •MAY LOSE VALUE •NO BANK GUARANTEE
Neither the Funds nor Fidelity Distributors Corporation is a bank.
Fidelity® Multi-Manager Income Fund
Investment Summary (Unaudited)
The information in the following tables is based on the direct investments of the Fund.Top Holdings as of September 30, 2016
| % of fund's net assets | % of fund's net assets 6 months ago | |
| Strategic Advisers Core Income Multi-Manager Fund Class F | 37.5 | 38.9 |
| Fidelity Investments Money Market Government Portfolio Institutional Class 0.31% | 17.3 | 16.5 |
| Fidelity Series Short-Term Credit Fund Class F | 9.3 | 9.0 |
| Strategic Advisers International Multi-Manager Fund Class F | 5.5 | 4.5 |
| Strategic Advisers Emerging Markets Fund of Funds Class F | 4.9 | 4.5 |
| Strategic Advisers Core Multi-Manager Fund Class F | 4.7 | 5.2 |
| Strategic Advisers Value Multi-Manager Fund Class F | 4.7 | 5.2 |
| Strategic Advisers Growth Multi-Manager Fund Class F | 4.0 | 4.3 |
| Fidelity Series Inflation-Protected Bond Index Fund Class F | 3.8 | 3.8 |
| Strategic Advisers Income Opportunities Fund of Funds Class F | 2.8 | 3.0 |
| 94.5 | 94.9 |
Asset Allocation (% of fund's net assets)
| Period end | ||
| Domestic Equity Funds | 17.4% | |
| International Equity Funds | 10.4% | |
| Bond Funds | 45.6% | |
| Short-Term Funds | 26.6% | |

| Six months ago | ||
| Domestic Equity Funds | 18.5% | |
| International Equity Funds | 9.0% | |
| Bond Funds | 47.0% | |
| Short-Term Funds | 25.5% | |

Domestic Equity Funds category includes Fidelity Series Commodity Strategy Fund which invests in commodity-related investments.
Fidelity® Multi-Manager Income Fund
Investments September 30, 2016 (Unaudited)
Showing Percentage of Net Assets
| Domestic Equity Funds - 17.4% | |||
| Shares | Value | ||
| Fidelity Series Commodity Strategy Fund Class F (a)(b) | 4,060 | $21,720 | |
| Strategic Advisers Core Multi-Manager Fund Class F (b) | 5,396 | 64,369 | |
| Strategic Advisers Growth Multi-Manager Fund Class F (b) | 4,125 | 53,997 | |
| Strategic Advisers Small-Mid Cap Multi-Manager Fund Class F (b) | 2,998 | 32,441 | |
| Strategic Advisers Value Multi-Manager Fund Class F (b) | 4,721 | 64,302 | |
| TOTAL DOMESTIC EQUITY FUNDS | |||
| (Cost $246,156) | 236,829 | ||
| International Equity Funds - 10.4% | |||
| Strategic Advisers Emerging Markets Fund of Funds Class F (b) | 7,061 | 66,300 | |
| Strategic Advisers International Multi-Manager Fund Class F (b) | 6,467 | 74,502 | |
| TOTAL INTERNATIONAL EQUITY FUNDS | |||
| (Cost $137,740) | 140,802 | ||
| Bond Funds - 45.6% | |||
| Fidelity Series Emerging Markets Debt Fund Class F (b) | 879 | 9,103 | |
| Fidelity Series Floating Rate High Income Fund Class F (b) | 370 | 3,490 | |
| Fidelity Series Inflation-Protected Bond Index Fund Class F (b) | 5,189 | 52,309 | |
| Fidelity Series Real Estate Income Fund Class F (b) | 596 | 6,687 | |
| Strategic Advisers Core Income Multi-Manager Fund Class F (b) | 50,521 | 511,276 | |
| Strategic Advisers Income Opportunities Fund of Funds Class F (b) | 3,906 | 38,670 | |
| TOTAL BOND FUNDS | |||
| (Cost $607,755) | 621,535 | ||
| Short-Term Funds - 26.6% | |||
| Fidelity Investments Money Market Government Portfolio Institutional Class 0.31% (b)(c) | 235,885 | 235,885 | |
| Fidelity Series Short-Term Credit Fund Class F (b) | 12,650 | 126,881 | |
| TOTAL SHORT-TERM FUNDS | |||
| (Cost $362,256) | 362,766 | ||
| TOTAL INVESTMENT PORTFOLIO - 100.0% | |||
| (Cost $1,353,907) | 1,361,932 | ||
| NET OTHER ASSETS (LIABILITIES) - 0.0% | (76) | ||
| NET ASSETS - 100% | $1,361,856 |
Legend
(a) Non-income producing
(b) Affiliated Fund
(c) The rate quoted is the annualized seven-day yield of the fund at period end.
Affiliated Underlying Funds
Information regarding the Fund's fiscal year to date purchases and sales of the affiliated Underlying Funds and income earned by the Fund from investments in affiliated Underlying Funds is as follows:
| Affiliate | Value, beginning of period | Purchases | Sales Proceeds | Dividend Income | Value, end of period |
| Fidelity Investments Money Market Government Portfolio Institutional Class 0.31% | $170,557 | $90,317 | $24,990 | $306 | $235,885 |
| Fidelity Series Commodity Strategy Fund Class F | 12,821 | 14,372 | 6,680 | -- | 21,720 |
| Fidelity Series Emerging Markets Debt Fund Class F | 6,498 | 2,801 | 891 | 222 | 9,103 |
| Fidelity Series Floating Rate High Income Fund Class F | 2,578 | 1,144 | 371 | 70 | 3,490 |
| Fidelity Series Inflation-Protected Bond Index Fund Class F | 39,172 | 18,045 | 5,891 | 54 | 52,309 |
| Fidelity Series Real Estate Income Fund Class F | 4,962 | 2,445 | 872 | 166 | 6,687 |
| Fidelity Series Short-Term Credit Fund Class F | 92,426 | 47,441 | 13,456 | 598 | 126,881 |
| Strategic Advisers Core Income Multi-Manager Fund Class F | 400,970 | 165,481 | 66,981 | 5,448 | 511,276 |
| Strategic Advisers Core Multi-Manager Fund Class F | 53,445 | 22,583 | 11,831 | 209 | 64,369 |
| Strategic Advisers Emerging Markets Fund of Funds Class F | 45,826 | 20,553 | 6,610 | -- | 66,300 |
| Strategic Advisers Growth Multi-Manager Fund Class F | 44,598 | 18,811 | 9,714 | 159 | 53,997 |
| Strategic Advisers Income Opportunities Fund of Funds Class F | 31,145 | 9,454 | 4,209 | 968 | 38,670 |
| Strategic Advisers International Multi-Manager Fund Class F | 46,760 | 32,424 | 8,007 | -- | 74,502 |
| Strategic Advisers Small-Mid Cap Multi-Manager Fund Class F | 26,768 | 9,375 | 6,518 | -- | 32,441 |
| Strategic Advisers Value Multi-Manager Fund Class F | 53,390 | 21,251 | 11,567 | 443 | 64,302 |
| Total | $1,031,916 | $476,497 | $178,588 | $8,643 | $1,361,932 |
Investment Valuation
All investments are categorized as Level 1 under the Fair Value Hierarchy. The inputs or methodology used for valuing securities may not be an indication of the risk associated with investing in those securities. For more information on valuation inputs please refer to the Investment Valuation section in the accompanying Notes to Financial Statements.
See accompanying notes which are an integral part of the financial statements.
Fidelity® Multi-Manager Income Fund
Financial Statements
Statement of Assets and Liabilities
| September 30, 2016 (Unaudited) | ||
| Assets | ||
| Investment in securities, at value (cost $1,353,907) — See accompanying schedule | $1,361,932 | |
| Receivable for investments sold | 56,567 | |
| Receivable for fund shares sold | 2,669 | |
| Total assets | 1,421,168 | |
| Liabilities | ||
| Payable for fund shares redeemed | $59,233 | |
| Distribution and service plan fees payable | 22 | |
| Other affiliated payables | 57 | |
| Total liabilities | 59,312 | |
| Net Assets | $1,361,856 | |
| Net Assets consist of: | ||
| Paid in capital | $1,360,055 | |
| Undistributed net investment income | 1,462 | |
| Accumulated undistributed net realized gain (loss) on investments | (7,686) | |
| Net unrealized appreciation (depreciation) on investments | 8,025 | |
| Net Assets | $1,361,856 | |
| Multi-Manager Income: | ||
| Net Asset Value, offering price and redemption price per share ($1,153,778 ÷ 112,507 shares) | $10.26 | |
| Class L: | ||
| Net Asset Value, offering price and redemption price per share ($104,408 ÷ 10,180 shares) | $10.26 | |
| Class N: | ||
| Net Asset Value, offering price and redemption price per share ($103,670 ÷ 10,114 shares) | $10.25 |
See accompanying notes which are an integral part of the financial statements.
Statement of Operations
| Six months ended September 30, 2016 (Unaudited) | ||
| Investment Income | ||
| Income distributions from underlying funds | $8,643 | |
| Expenses | ||
| Transfer agent fees | $322 | |
| Distribution and service plan fees | 127 | |
| Independent trustees' fees and expenses | 3 | |
| Total expenses | 452 | |
| Net investment income (loss) | 8,191 | |
| Realized and Unrealized Gain (Loss) | ||
| Realized gain (loss) on sale of underlying fund shares | (821) | |
| Capital gain distributions from underlying funds | 7,877 | |
| Total net realized gain (loss) | �� | 7,056 |
| Change in net unrealized appreciation (depreciation) on underlying funds | 32,927 | |
| Net gain (loss) | 39,983 | |
| Net increase (decrease) in net assets resulting from operations | $48,174 |
See accompanying notes which are an integral part of the financial statements.
Statement of Changes in Net Assets
| Six months ended September 30, 2016 (Unaudited) | Year ended March 31, 2016 | |
| Increase (Decrease) in Net Assets | ||
| Operations | ||
| Net investment income (loss) | $8,191 | $18,510 |
| Net realized gain (loss) | 7,056 | (5,422) |
| Change in net unrealized appreciation (depreciation) | 32,927 | (25,916) |
| Net increase (decrease) in net assets resulting from operations | 48,174 | (12,828) |
| Distributions to shareholders from net investment income | (7,610) | (18,299) |
| Distributions to shareholders from net realized gain | – | (21,320) |
| Total distributions | (7,610) | (39,619) |
| Share transactions - net increase (decrease) | 289,436 | (48,542) |
| Total increase (decrease) in net assets | 330,000 | (100,989) |
| Net Assets | ||
| Beginning of period | 1,031,856 | 1,132,845 |
| End of period | $1,361,856 | $1,031,856 |
| Other Information | ||
| Undistributed net investment income end of period | $1,462 | $881 |
See accompanying notes which are an integral part of the financial statements.
Financial Highlights — Fidelity Multi-Manager Income Fund
| Six months ended (Unaudited) September 30, | Years ended March 31, | ||||
| 2016 | 2016 | 2015 | 2014 | 2013 A | |
| Selected Per–Share Data | |||||
| Net asset value, beginning of period | $9.91 | $10.33 | $10.29 | $10.14 | $10.00 |
| Income from Investment Operations | |||||
| Net investment income (loss)B | .07 | .17 | .18 | .14 | .04 |
| Net realized and unrealized gain (loss) | .34 | (.24) | .22 | .24 | .13 |
| Total from investment operations | .41 | (.07) | .40 | .38 | .17 |
| Distributions from net investment income | (.06) | (.16) | (.19) | (.12) | (.03) |
| Distributions from net realized gain | – | (.19) | (.18) | (.11) | – |
| Total distributions | (.06) | (.35) | (.36)C | (.23) | (.03) |
| Net asset value, end of period | $10.26 | $9.91 | $10.33 | $10.29 | $10.14 |
| Total ReturnD,E | 4.18% | (.65)% | 3.98% | 3.79% | 1.71% |
| Ratios to Average Net AssetsF,G | |||||
| Expenses before reductions | .05%H | .05% | .05% | .06% | .15%H |
| Expenses net of fee waivers, if any | .05%H | .05% | .05% | .06% | .06%H |
| Expenses net of all reductions | .05%H | .05% | .05% | .06% | .06%H |
| Net investment income (loss) | 1.36%H | 1.66% | 1.77% | 1.43% | 1.52%H |
| Supplemental Data | |||||
| Net assets, end of period (000 omitted) | $1,154 | $822 | $921 | $702 | $102 |
| Portfolio turnover rateF | 29%H | 44% | 23% | 40% | 0%I |
A For the period December 20, 2012 (commencement of operations) to March 31, 2013.
B Calculated based on average shares outstanding during the period.
C Total distributions of $.36 per share is comprised of distributions from net investment income of $.186 and distributions from net realized gain of $.177 per share.
D Total returns for periods of less than one year are not annualized.
E Total returns would have been lower if certain expenses had not been reduced during the applicable periods shown.
F Amounts do not include the activity of the Underlying Funds.
G Expense ratios reflect operating expenses of the class. Expenses before reductions do not reflect amounts reimbursed by the investment adviser or reductions from expense offset arrangements and do not represent the amount paid by the class during periods when reimbursements or reductions occur. Expense ratios before reductions for start-up periods may not be representative of longer-term operating periods. Expenses net of fee waivers reflect expenses after reimbursement by the investment adviser but prior to reductions from expense offset arrangements. Expenses net of all reductions represent the net expenses paid by the class but do not include expenses of the underlying funds in which the Fund invests.
H Annualized
I Amount not annualized.
See accompanying notes which are an integral part of the financial statements.
Financial Highlights — Fidelity Multi-Manager Income Fund Class L
| Six months ended (Unaudited) September 30, | Years ended March 31, | |||
| 2016 | 2016 | 2015 | 2014 A | |
| Selected Per–Share Data | ||||
| Net asset value, beginning of period | $9.92 | $10.33 | $10.29 | $10.19 |
| Income from Investment Operations | ||||
| Net investment income (loss)B | .07 | .17 | .18 | .05 |
| Net realized and unrealized gain (loss) | .33 | (.23) | .22 | .15 |
| Total from investment operations | .40 | (.06) | .40 | .20 |
| Distributions from net investment income | (.06) | (.16) | (.19) | (.04) |
| Distributions from net realized gain | – | (.19) | (.18) | (.06) |
| Total distributions | (.06) | (.35) | (.36)C | (.10) |
| Net asset value, end of period | $10.26 | $9.92 | $10.33 | $10.29 |
| Total ReturnD | 4.08% | (.57)% | 3.97% | 2.00% |
| Ratios to Average Net AssetsE,F | ||||
| Expenses before reductions | .05%G | .05% | .06% | .06%G |
| Expenses net of fee waivers, if any | .05%G | .05% | .06% | .06%G |
| Expenses net of all reductions | .05%G | .05% | .06% | .06%G |
| Net investment income (loss) | 1.36%G | 1.66% | 1.77% | 1.62%G |
| Supplemental Data | ||||
| Net assets, end of period (000 omitted) | $104 | $105 | $106 | $102 |
| Portfolio turnover rateE | 29%G | 44% | 23% | 40% |
A For the period December 4, 2013 (commencement of sale of shares) to March 31, 2014.
B Calculated based on average shares outstanding during the period.
C Total distributions of $.36 per share is comprised of distributions from net investment income of $.185 and distributions from net realized gain of $.177 per share.
D Total returns for periods of less than one year are not annualized.
E Amounts do not include the activity of the Underlying Funds.
F Expense ratios reflect operating expenses of the class. Expenses before reductions do not reflect amounts reimbursed by the investment adviser or reductions from expense offset arrangements and do not represent the amount paid by the class during periods when reimbursements or reductions occur. Expenses net of fee waivers reflect expenses after reimbursement by the investment adviser but prior to reductions from expense offset arrangements. Expenses net of all reductions represent the net expenses paid by the class but do not include expenses of the underlying funds in which the Fund invests.
G Annualized
See accompanying notes which are an integral part of the financial statements.
Financial Highlights — Fidelity Multi-Manager Income Fund Class N
| Six months ended (Unaudited) September 30, | Years ended March 31, | |||
| 2016 | 2016 | 2015 | 2014 A | |
| Selected Per–Share Data | ||||
| Net asset value, beginning of period | $9.91 | $10.33 | $10.29 | $10.19 |
| Income from Investment Operations | ||||
| Net investment income (loss)B | .06 | .14 | .16 | .04 |
| Net realized and unrealized gain (loss) | .33 | (.23) | .22 | .16 |
| Total from investment operations | .39 | (.09) | .38 | .20 |
| Distributions from net investment income | (.05) | (.14) | (.16) | (.04) |
| Distributions from net realized gain | – | (.19) | (.18) | (.06) |
| Total distributions | (.05) | (.33) | (.34) | (.10) |
| Net asset value, end of period | $10.25 | $9.91 | $10.33 | $10.29 |
| Total ReturnC | 3.96% | (.90)% | 3.71% | 1.94% |
| Ratios to Average Net AssetsD,E | ||||
| Expenses before reductions | .30%F | .30% | .31% | .32%F |
| Expenses net of fee waivers, if any | .30%F | .30% | .31% | .32%F |
| Expenses net of all reductions | .30%F | .30% | .31% | .32%F |
| Net investment income (loss) | 1.11%F | 1.41% | 1.52% | 1.36%F |
| Supplemental Data | ||||
| Net assets, end of period (000 omitted) | $104 | $105 | $106 | $102 |
| Portfolio turnover rateD | 29%F | 44% | 23% | 40% |
A For the period December 4, 2013 (commencement of sale of shares) to March 31, 2014.
B Calculated based on average shares outstanding during the period.
C Total returns for periods of less than one year are not annualized.
D Amounts do not include the activity of the Underlying Funds.
E Expense ratios reflect operating expenses of the class. Expenses before reductions do not reflect amounts reimbursed by the investment adviser or reductions from expense offset arrangements and do not represent the amount paid by the class during periods when reimbursements or reductions occur. Expenses net of fee waivers reflect expenses after reimbursement by the investment adviser but prior to reductions from expense offset arrangements. Expenses net of all reductions represent the net expenses paid by the class but do not include expenses of the underlying funds in which the Fund invests.
F Annualized
See accompanying notes which are an integral part of the financial statements.
Fidelity® Multi-Manager 2005 Fund
Investment Summary (Unaudited)
The information in the following tables is based on the direct investments of the Fund.Top Holdings as of September 30, 2016
| % of fund's net assets | % of fund's net assets 6 months ago | |
| Strategic Advisers Core Income Multi-Manager Fund Class F | 33.3 | 34.5 |
| Fidelity Investments Money Market Government Portfolio Institutional Class 0.31% | 12.6 | 11.4 |
| Strategic Advisers International Multi-Manager Fund Class F | 8.2 | 7.5 |
| Strategic Advisers Core Multi-Manager Fund Class F | 7.2 | 7.8 |
| Strategic Advisers Value Multi-Manager Fund Class F | 7.2 | 7.8 |
| Fidelity Series Short-Term Credit Fund Class F | 6.7 | 6.1 |
| Strategic Advisers Growth Multi-Manager Fund Class F | 6.1 | 6.5 |
| Strategic Advisers Emerging Markets Fund of Funds Class F | 5.9 | 5.5 |
| Strategic Advisers Small-Mid Cap Multi-Manager Fund Class F | 3.6 | 3.9 |
| Fidelity Series Inflation-Protected Bond Index Fund Class F | 3.3 | 3.3 |
| 94.1 | 94.3 |
Asset Allocation (% of fund's net assets)
| Period end | ||
| Domestic Equity Funds | 25.6% | |
| International Equity Funds | 14.1% | |
| Bond Funds | 41.0% | |
| Short-Term Funds | 19.3% | |

| Six months ago | ||
| Domestic Equity Funds | 27.3% | |
| International Equity Funds | 13.0% | |
| Bond Funds | 42.2% | |
| Short-Term Funds | 17.5% | |

Domestic Equity Funds category includes Fidelity Series Commodity Strategy Fund which invests in commodity-related investments.
Fidelity® Multi-Manager 2005 Fund
Investments September 30, 2016 (Unaudited)
Showing Percentage of Net Assets
| Domestic Equity Funds - 25.6% | |||
| Shares | Value | ||
| Fidelity Series Commodity Strategy Fund Class F (a)(b) | 956 | $5,117 | |
| Strategic Advisers Core Multi-Manager Fund Class F (b) | 2,035 | 24,280 | |
| Strategic Advisers Growth Multi-Manager Fund Class F (b) | 1,556 | 20,366 | |
| Strategic Advisers Small-Mid Cap Multi-Manager Fund Class F (b) | 1,131 | 12,239 | |
| Strategic Advisers Value Multi-Manager Fund Class F (b) | 1,781 | 24,256 | |
| TOTAL DOMESTIC EQUITY FUNDS | |||
| (Cost $88,281) | 86,258 | ||
| International Equity Funds - 14.1% | |||
| Strategic Advisers Emerging Markets Fund of Funds Class F (b) | 2,134 | 20,039 | |
| Strategic Advisers International Multi-Manager Fund Class F (b) | 2,395 | 27,596 | |
| TOTAL INTERNATIONAL EQUITY FUNDS | |||
| (Cost $47,495) | 47,635 | ||
| Bond Funds - 41.0% | |||
| Fidelity Series Emerging Markets Debt Fund Class F (b) | 222 | 2,302 | |
| Fidelity Series Floating Rate High Income Fund Class F (b) | 91 | 855 | |
| Fidelity Series Inflation-Protected Bond Index Fund Class F (b) | 1,123 | 11,319 | |
| Fidelity Series Real Estate Income Fund Class F (b) | 149 | 1,674 | |
| Strategic Advisers Core Income Multi-Manager Fund Class F (b) | 11,104 | 112,375 | |
| Strategic Advisers Income Opportunities Fund of Funds Class F (b) | 1,015 | 10,045 | |
| TOTAL BOND FUNDS | |||
| (Cost $135,501) | 138,570 | ||
| Short-Term Funds - 19.3% | |||
| Fidelity Investments Money Market Government Portfolio Institutional Class 0.31% (b)(c) | 42,405 | 42,405 | |
| Fidelity Series Short-Term Credit Fund Class F (b) | 2,264 | 22,707 | |
| TOTAL SHORT-TERM FUNDS | |||
| (Cost $65,024) | 65,112 | ||
| TOTAL INVESTMENT PORTFOLIO - 100.0% | |||
| (Cost $336,301) | 337,575 | ||
| NET OTHER ASSETS (LIABILITIES) - 0.0% | (36) | ||
| NET ASSETS - 100% | $337,539 |
Legend
(a) Non-income producing
(b) Affiliated Fund
(c) The rate quoted is the annualized seven-day yield of the fund at period end.
Affiliated Underlying Funds
Information regarding the Fund's fiscal year to date purchases and sales of the affiliated Underlying Funds and income earned by the Fund from investments in affiliated Underlying Funds is as follows:
| Affiliate | Value, beginning of period | Purchases | Sales Proceeds | Dividend Income | Value, end of period |
| Fidelity Investments Money Market Government Portfolio Institutional Class 0.31% | $39,271 | $5,744 | $2,611 | $60 | $42,405 |
| Fidelity Series Commodity Strategy Fund Class F | 4,349 | 787 | 336 | -- | 5,117 |
| Fidelity Series Emerging Markets Debt Fund Class F | 2,184 | 70 | 145 | 62 | 2,302 |
| Fidelity Series Floating Rate High Income Fund Class F | 850 | 26 | 61 | 19 | 855 |
| Fidelity Series Inflation-Protected Bond Index Fund Class F | 11,468 | 480 | 844 | 13 | 11,319 |
| Fidelity Series Real Estate Income Fund Class F | 1,668 | 112 | 156 | 42 | 1,674 |
| Fidelity Series Short-Term Credit Fund Class F | 21,047 | 3,055 | 1,478 | 116 | 22,707 |
| Strategic Advisers Core Income Multi-Manager Fund Class F | 118,898 | 1,958 | 11,336 | 1,342 | 112,375 |
| Strategic Advisers Core Multi-Manager Fund Class F | 26,954 | 1,511 | 4,395 | 85 | 24,280 |
| Strategic Advisers Emerging Markets Fund of Funds Class F | 19,015 | 287 | 1,299 | -- | 20,039 |
| Strategic Advisers Growth Multi-Manager Fund Class F | 22,492 | 1,364 | 3,677 | 63 | 20,366 |
| Strategic Advisers Income Opportunities Fund of Funds Class F | 10,370 | 304 | 1,302 | 289 | 10,045 |
| Strategic Advisers International Multi-Manager Fund Class F | 25,864 | 2,925 | 2,600 | -- | 27,596 |
| Strategic Advisers Small-Mid Cap Multi-Manager Fund Class F | 13,500 | 73 | 2,544 | -- | 12,239 |
| Strategic Advisers Value Multi-Manager Fund Class F | 26,926 | 1,079 | 4,406 | 180 | 24,256 |
| Total | $344,856 | $19,775 | $37,190 | $2,271 | $337,575 |
Investment Valuation
All investments are categorized as Level 1 under the Fair Value Hierarchy. The inputs or methodology used for valuing securities may not be an indication of the risk associated with investing in those securities. For more information on valuation inputs please refer to the Investment Valuation section in the accompanying Notes to Financial Statements.
See accompanying notes which are an integral part of the financial statements.
Fidelity® Multi-Manager 2005 Fund
Financial Statements
Statement of Assets and Liabilities
| September 30, 2016 (Unaudited) | ||
| Assets | ||
| Investment in securities, at value (cost $336,301) — See accompanying schedule | $337,575 | |
| Receivable for investments sold | 6,568 | |
| Total assets | 344,143 | |
| Liabilities | ||
| Payable for fund shares redeemed | $6,569 | |
| Distribution and service plan fees payable | 22 | |
| Other affiliated payables | 13 | |
| Total liabilities | 6,604 | |
| Net Assets | $337,539 | |
| Net Assets consist of: | ||
| Paid in capital | $337,635 | |
| Undistributed net investment income | 1,944 | |
| Accumulated undistributed net realized gain (loss) on investments | (3,314) | |
| Net unrealized appreciation (depreciation) on investments | 1,274 | |
| Net Assets | $337,539 | |
| Multi-Manager 2005: | ||
| Net Asset Value, offering price and redemption price per share ($126,853 ÷ 12,174 shares) | $10.42 | |
| Class L: | ||
| Net Asset Value, offering price and redemption price per share ($105,713 ÷ 10,155 shares) | $10.41 | |
| Class N: | ||
| Net Asset Value, offering price and redemption price per share ($104,973 ÷ 10,096 shares) | $10.40 |
See accompanying notes which are an integral part of the financial statements.
Statement of Operations
| Six months ended September 30, 2016 (Unaudited) | ||
| Investment Income | ||
| Income distributions from underlying funds | $2,271 | |
| Expenses | ||
| Transfer agent fees | $130 | |
| Distribution and service plan fees | 129 | |
| Independent trustees' fees and expenses | 1 | |
| Total expenses | 260 | |
| Net investment income (loss) | 2,011 | |
| Realized and Unrealized Gain (Loss) | ||
| Realized gain (loss) on sale of underlying fund shares | (1,618) | |
| Capital gain distributions from underlying funds | 3,178 | |
| Total net realized gain (loss) | 1,560 | |
| Change in net unrealized appreciation (depreciation) on underlying funds | 11,752 | |
| Net gain (loss) | 13,312 | |
| Net increase (decrease) in net assets resulting from operations | $15,323 |
See accompanying notes which are an integral part of the financial statements.
Statement of Changes in Net Assets
| Six months ended September 30, 2016 (Unaudited) | Year ended March 31, 2016 | |
| Increase (Decrease) in Net Assets | ||
| Operations | ||
| Net investment income (loss) | $2,011 | $5,519 |
| Net realized gain (loss) | 1,560 | (698) |
| Change in net unrealized appreciation (depreciation) | 11,752 | (10,838) |
| Net increase (decrease) in net assets resulting from operations | 15,323 | (6,017) |
| Distributions to shareholders from net investment income | (886) | (5,516) |
| Distributions to shareholders from net realized gain | – | (10,129) |
| Total distributions | (886) | (15,645) |
| Share transactions - net increase (decrease) | (21,718) | 31,453 |
| Total increase (decrease) in net assets | (7,281) | 9,791 |
| Net Assets | ||
| Beginning of period | 344,820 | 335,029 |
| End of period | $337,539 | $344,820 |
| Other Information | ||
| Undistributed net investment income end of period | $1,944 | $819 |
See accompanying notes which are an integral part of the financial statements.
Financial Highlights — Fidelity Multi-Manager 2005 Fund
| Six months ended (Unaudited) September 30, | Years ended March 31, | ||||
| 2016 | 2016 | 2015 | 2014 | 2013 A | |
| Selected Per–Share Data | |||||
| Net asset value, beginning of period | $9.98 | $10.58 | $10.65 | $10.27 | $10.00 |
| Income from Investment Operations | |||||
| Net investment income (loss)B | .07 | .16 | .19 | .14 | .05 |
| Net realized and unrealized gain (loss) | .40 | (.30) | .31 | .49 | .22 |
| Total from investment operations | .47 | (.14) | .50 | .63 | .27 |
| Distributions from net investment income | (.03) | (.16) | (.19) | (.10) | – |
| Distributions from net realized gain | – | (.30) | (.39) | (.15) | – |
| Total distributions | (.03) | (.46) | (.57)C | (.25) | – |
| Net asset value, end of period | $10.42 | $9.98 | $10.58 | $10.65 | $10.27 |
| Total ReturnD,E | 4.71% | (1.34)% | 4.83% | 6.18% | 2.70% |
| Ratios to Average Net AssetsF,G | |||||
| Expenses before reductions | .07%H | .06% | .05% | .06% | .15%H |
| Expenses net of fee waivers, if any | .07%H | .06% | .05% | .06% | .06%H |
| Expenses net of all reductions | .07%H | .06% | .05% | .06% | .06%H |
| Net investment income (loss) | 1.28%H | 1.63% | 1.76% | 1.32% | 1.63%H |
| Supplemental Data | |||||
| Net assets, end of period (000 omitted) | $127 | $133 | $120 | $115 | $103 |
| Portfolio turnover rateF | 12%H | 48% | 17% | 44% | 1%I |
A For the period December 20, 2012 (commencement of operations) to March 31, 2013.
B Calculated based on average shares outstanding during the period.
C Total distributions of $.57 per share is comprised of distributions from net investment income of $.186 and distributions from net realized gain of $.385 per share.
D Total returns for periods of less than one year are not annualized.
E Total returns would have been lower if certain expenses had not been reduced during the applicable periods shown.
F Amounts do not include the activity of the Underlying Funds.
G Expense ratios reflect operating expenses of the class. Expenses before reductions do not reflect amounts reimbursed by the investment adviser or reductions from expense offset arrangements and do not represent the amount paid by the class during periods when reimbursements or reductions occur. Expense ratios before reductions for start-up periods may not be representative of longer-term operating periods. Expenses net of fee waivers reflect expenses after reimbursement by the investment adviser but prior to reductions from expense offset arrangements. Expenses net of all reductions represent the net expenses paid by the class but do not include expenses of the underlying funds in which the Fund invests.
H Annualized
I Amount not annualized.
See accompanying notes which are an integral part of the financial statements.
Financial Highlights — Fidelity Multi-Manager 2005 Fund Class L
| Six months ended (Unaudited) September 30, | Years ended March 31, | |||
| 2016 | 2016 | 2015 | 2014 A | |
| Selected Per–Share Data | ||||
| Net asset value, beginning of period | $9.97 | $10.57 | $10.64 | $10.51 |
| Income from Investment Operations | ||||
| Net investment income (loss)B | .06 | .16 | .18 | .06 |
| Net realized and unrealized gain (loss) | .41 | (.30) | .32 | .22 |
| Total from investment operations | .47 | (.14) | .50 | .28 |
| Distributions from net investment income | (.03) | (.16) | (.18) | (.06) |
| Distributions from net realized gain | – | (.30) | (.39) | (.09) |
| Total distributions | (.03) | (.46) | (.57) | (.15) |
| Net asset value, end of period | $10.41 | $9.97 | $10.57 | $10.64 |
| Total ReturnC,D | 4.72% | (1.39)% | 4.79% | 2.64% |
| Ratios to Average Net AssetsE,F | ||||
| Expenses before reductions | .09%G | .09% | .10% | .07%G |
| Expenses net of fee waivers, if any | .09%G | .09% | .10% | .07%G |
| Expenses net of all reductions | .09%G | .09% | .10% | .07%G |
| Net investment income (loss) | 1.26%G | 1.59% | 1.71% | 1.90%G |
| Supplemental Data | ||||
| Net assets, end of period (000 omitted) | $106 | $106 | $108 | $103 |
| Portfolio turnover rateE | 12%G | 48% | 17% | 44% |
A For the period December 4, 2013 (commencement of sale of shares) to March 31, 2014.
B Calculated based on average shares outstanding during the period.
C Total returns for periods of less than one year are not annualized.
D Total returns would have been lower if certain expenses had not been reduced during the applicable periods shown.
E Amounts do not include the activity of the Underlying Funds.
F Expense ratios reflect operating expenses of the class. Expenses before reductions do not reflect amounts reimbursed by the investment adviser or reductions from expense offset arrangements and do not represent the amount paid by the class during periods when reimbursements or reductions occur. Expenses net of fee waivers reflect expenses after reimbursement by the investment adviser but prior to reductions from expense offset arrangements. Expenses net of all reductions represent the net expenses paid by the class but do not include expenses of the underlying funds in which the Fund invests.
G Annualized
See accompanying notes which are an integral part of the financial statements.
Financial Highlights — Fidelity Multi-Manager 2005 Fund Class N
| Six months ended (Unaudited) September 30, | Years ended March 31, | |||
| 2016 | 2016 | 2015 | 2014 A | |
| Selected Per–Share Data | ||||
| Net asset value, beginning of period | $9.96 | $10.56 | $10.63 | $10.51 |
| Income from Investment Operations | ||||
| Net investment income (loss)B | .05 | .14 | .16 | .05 |
| Net realized and unrealized gain (loss) | .41 | (.31) | .31 | .21 |
| Total from investment operations | .46 | (.17) | .47 | .26 |
| Distributions from net investment income | (.02) | (.13) | (.16) | (.06) |
| Distributions from net realized gain | – | (.30) | (.39) | (.09) |
| Total distributions | (.02) | (.43) | (.54)C | (.14)D |
| Net asset value, end of period | $10.40 | $9.96 | $10.56 | $10.63 |
| Total ReturnE,F | 4.65% | (1.64)% | 4.53% | 2.52% |
| Ratios to Average Net AssetsG,H | ||||
| Expenses before reductions | .33%I | .34% | .35% | .33%I |
| Expenses net of fee waivers, if any | .33%I | .34% | .35% | .33%I |
| Expenses net of all reductions | .33%I | .34% | .35% | .33%I |
| Net investment income (loss) | 1.01%I | 1.34% | 1.46% | 1.65%I |
| Supplemental Data | ||||
| Net assets, end of period (000 omitted) | $105 | $105 | $107 | $103 |
| Portfolio turnover rateG | 12%I | 48% | 17% | 44% |
A For the period December 4, 2013 (commencement of sale of shares) to March 31, 2014.
B Calculated based on average shares outstanding during the period.
C Total distributions of $.54 per share is comprised of distributions from net investment income of $.155 and distributions from net realized gain of $.385 per share.
D Total distributions of $.14 per share is comprised of distributions from net investment income of $.055 and distributions from net realized gain of $.088 per share.
E Total returns for periods of less than one year are not annualized.
F Total returns would have been lower if certain expenses had not been reduced during the applicable periods shown.
G Amounts do not include the activity of the Underlying Funds.
H Expense ratios reflect operating expenses of the class. Expenses before reductions do not reflect amounts reimbursed by the investment adviser or reductions from expense offset arrangements and do not represent the amount paid by the class during periods when reimbursements or reductions occur. Expenses net of fee waivers reflect expenses after reimbursement by the investment adviser but prior to reductions from expense offset arrangements. Expenses net of all reductions represent the net expenses paid by the class but do not include expenses of the underlying funds in which the Fund invests.
I Annualized
See accompanying notes which are an integral part of the financial statements.
Fidelity® Multi-Manager 2010 Fund
Investment Summary (Unaudited)
The information in the following tables is based on the direct investments of the Fund.Top Holdings as of September 30, 2016
| % of fund's net assets | % of fund's net assets 6 months ago | |
| Strategic Advisers Core Income Multi-Manager Fund Class F | 29.8 | 31.4 |
| Strategic Advisers International Multi-Manager Fund Class F | 10.2 | 9.6 |
| Fidelity Investments Money Market Government Portfolio Institutional Class 0.31% | 9.4 | 7.8 |
| Strategic Advisers Core Multi-Manager Fund Class F | 9.0 | 9.7 |
| Strategic Advisers Value Multi-Manager Fund Class F | 9.0 | 9.7 |
| Strategic Advisers Growth Multi-Manager Fund Class F | 7.6 | 8.1 |
| Strategic Advisers Emerging Markets Fund of Funds Class F | 6.9 | 6.3 |
| Fidelity Series Short-Term Credit Fund Class F | 5.0 | 4.3 |
| Strategic Advisers Small-Mid Cap Multi-Manager Fund Class F | 4.5 | 4.8 |
| Strategic Advisers Income Opportunities Fund of Funds Class F | 2.8 | 3.0 |
| 94.2 | 94.7 |
Asset Allocation (% of fund's net assets)
| Period end | ||
| Domestic Equity Funds | 31.7% | |
| International Equity Funds | 17.1% | |
| Bond Funds | 36.8% | |
| Short-Term Funds | 14.4% | |

| Six months ago | ||
| Domestic Equity Funds | 33.5% | |
| International Equity Funds | 15.9% | |
| Bond Funds | 38.5% | |
| Short-Term Funds | 12.1% | |

Domestic Equity Funds category includes Fidelity Series Commodity Strategy Fund which invests in commodity-related investments.
Fidelity® Multi-Manager 2010 Fund
Investments September 30, 2016 (Unaudited)
Showing Percentage of Net Assets
| Domestic Equity Funds - 31.7% | |||
| Shares | Value | ||
| Fidelity Series Commodity Strategy Fund Class F (a)(b) | 2,026 | $10,840 | |
| Strategic Advisers Core Multi-Manager Fund Class F (b) | 5,254 | 62,680 | |
| Strategic Advisers Growth Multi-Manager Fund Class F (b) | 4,017 | 52,588 | |
| Strategic Advisers Small-Mid Cap Multi-Manager Fund Class F (b) | 2,921 | 31,609 | |
| Strategic Advisers Value Multi-Manager Fund Class F (b) | 4,598 | 62,627 | |
| TOTAL DOMESTIC EQUITY FUNDS | |||
| (Cost $226,216) | 220,344 | ||
| International Equity Funds - 17.1% | |||
| Strategic Advisers Emerging Markets Fund of Funds Class F (b) | 5,067 | 47,583 | |
| Strategic Advisers International Multi-Manager Fund Class F (b) | 6,150 | 70,851 | |
| TOTAL INTERNATIONAL EQUITY FUNDS | |||
| (Cost $117,138) | 118,434 | ||
| Bond Funds - 36.8% | |||
| Fidelity Series Emerging Markets Debt Fund Class F (b) | 457 | 4,735 | |
| Fidelity Series Floating Rate High Income Fund Class F (b) | 187 | 1,762 | |
| Fidelity Series Inflation-Protected Bond Index Fund Class F (b) | 1,866 | 18,814 | |
| Fidelity Series Real Estate Income Fund Class F (b) | 306 | 3,430 | |
| Strategic Advisers Core Income Multi-Manager Fund Class F (b)�� | 20,466 | 207,116 | |
| Strategic Advisers Income Opportunities Fund of Funds Class F (b) | 1,970 | 19,502 | |
| TOTAL BOND FUNDS | |||
| (Cost $249,679) | 255,359 | ||
| Short-Term Funds - 14.4% | |||
| Fidelity Investments Money Market Government Portfolio Institutional Class 0.31% (b)(c) | 65,014 | 65,014 | |
| Fidelity Series Short-Term Credit Fund Class F (b) | 3,469 | 34,798 | |
| TOTAL SHORT-TERM FUNDS | |||
| (Cost $99,670) | 99,812 | ||
| TOTAL INVESTMENT PORTFOLIO - 100.0% | |||
| (Cost $692,703) | 693,949 | ||
| NET OTHER ASSETS (LIABILITIES) - 0.0% | (49) | ||
| NET ASSETS - 100% | $693,900 |
Legend
(a) Non-income producing
(b) Affiliated Fund
(c) The rate quoted is the annualized seven-day yield of the fund at period end.
Affiliated Underlying Funds
Information regarding the Fund's fiscal year to date purchases and sales of the affiliated Underlying Funds and income earned by the Fund from investments in affiliated Underlying Funds is as follows:
| Affiliate | Value, beginning of period | Purchases | Sales Proceeds | Dividend Income | Value, end of period |
| Fidelity Investments Money Market Government Portfolio Institutional Class 0.31% | $61,062 | $25,726 | $21,774 | $94 | $65,014 |
| Fidelity Series Commodity Strategy Fund Class F | 9,775 | 4,866 | 4,678 | -- | 10,840 |
| Fidelity Series Emerging Markets Debt Fund Class F | 4,958 | 928 | 1,564 | 135 | 4,735 |
| Fidelity Series Floating Rate High Income Fund Class F | 1,952 | 372 | 651 | 41 | 1,762 |
| Fidelity Series Inflation-Protected Bond Index Fund Class F | 21,280 | 4,406 | 7,242 | 23 | 18,814 |
| Fidelity Series Real Estate Income Fund Class F | 3,787 | 850 | 1,319 | 90 | 3,430 |
| Fidelity Series Short-Term Credit Fund Class F | 33,200 | 13,362 | 11,898 | 184 | 34,798 |
| Strategic Advisers Core Income Multi-Manager Fund Class F | 246,174 | 41,499 | 86,074 | 2,621 | 207,116 |
| Strategic Advisers Core Multi-Manager Fund Class F | 75,753 | 15,525 | 28,854 | 231 | 62,680 |
| Strategic Advisers Emerging Markets Fund of Funds Class F | 49,602 | 9,163 | 15,914 | -- | 47,583 |
| Strategic Advisers Growth Multi-Manager Fund Class F | 63,213 | 13,590 | 24,484 | 174 | 52,588 |
| Strategic Advisers Income Opportunities Fund of Funds Class F | 23,422 | 1,984 | 7,263 | 582 | 19,502 |
| Strategic Advisers International Multi-Manager Fund Class F | 75,106 | 19,607 | 27,430 | -- | 70,851 |
| Strategic Advisers Small-Mid Cap Multi-Manager Fund Class F | 37,941 | 5,793 | 15,143 | -- | 31,609 |
| Strategic Advisers Value Multi-Manager Fund Class F | 75,674 | 14,277 | 28,743 | 489 | 62,627 |
| Total | $782,899 | $171,948 | $283,031 | $4,664 | $693,949 |
Investment Valuation
All investments are categorized as Level 1 under the Fair Value Hierarchy. The inputs or methodology used for valuing securities may not be an indication of the risk associated with investing in those securities. For more information on valuation inputs please refer to the Investment Valuation section in the accompanying Notes to Financial Statements.
See accompanying notes which are an integral part of the financial statements.
Fidelity® Multi-Manager 2010 Fund
Financial Statements
Statement of Assets and Liabilities
| September 30, 2016 (Unaudited) | ||
| Assets | ||
| Investment in securities, at value (cost $692,703) — See accompanying schedule | $693,949 | |
| Receivable for investments sold | 26,635 | |
| Total assets | 720,584 | |
| Liabilities | ||
| Payable for fund shares redeemed | $26,635 | |
| Distribution and service plan fees payable | 22 | |
| Other affiliated payables | 27 | |
| Total liabilities | 26,684 | |
| Net Assets | $693,900 | |
| Net Assets consist of: | ||
| Paid in capital | $703,015 | |
| Undistributed net investment income | 4,223 | |
| Accumulated undistributed net realized gain (loss) on investments | (14,584) | |
| Net unrealized appreciation (depreciation) on investments | 1,246 | |
| Net Assets | $693,900 | |
| Multi-Manager 2010: | ||
| Net Asset Value, offering price and redemption price per share ($481,328 ÷ 45,491 shares) | $10.58 | |
| Class L: | ||
| Net Asset Value, offering price and redemption price per share ($106,663 ÷ 10,077 shares) | $10.58 | |
| Class N: | ||
| Net Asset Value, offering price and redemption price per share ($105,909 ÷ 10,019 shares) | $10.57 |
See accompanying notes which are an integral part of the financial statements.
Statement of Operations
| Six months ended September 30, 2016 (Unaudited) | ||
| Investment Income | ||
| Income distributions from underlying funds | $4,664 | |
| Expenses | ||
| Transfer agent fees | $181 | |
| Distribution and service plan fees | 129 | |
| Independent trustees' fees and expenses | 2 | |
| Total expenses | 312 | |
| Net investment income (loss) | 4,352 | |
| Realized and Unrealized Gain (Loss) | ||
| Realized gain (loss) on sale of underlying fund shares | (16,590) | |
| Capital gain distributions from underlying funds | 8,634 | |
| Total net realized gain (loss) | (7,956) | |
| Change in net unrealized appreciation (depreciation) on underlying funds | 38,719 | |
| Net gain (loss) | 30,763 | |
| Net increase (decrease) in net assets resulting from operations | $35,115 |
See accompanying notes which are an integral part of the financial statements.
Statement of Changes in Net Assets
| Six months ended September 30, 2016 (Unaudited) | Year ended March 31, 2016 | |
| Increase (Decrease) in Net Assets | ||
| Operations | ||
| Net investment income (loss) | $4,352 | $12,003 |
| Net realized gain (loss) | (7,956) | 8,334 |
| Change in net unrealized appreciation (depreciation) | 38,719 | (35,995) |
| Net increase (decrease) in net assets resulting from operations | 35,115 | (15,658) |
| Distributions to shareholders from net investment income | (1,623) | (12,026) |
| Distributions to shareholders from net realized gain | (5,351) | (26,838) |
| Total distributions | (6,974) | (38,864) |
| Share transactions - net increase (decrease) | (117,090) | 70,458 |
| Total increase (decrease) in net assets | (88,949) | 15,936 |
| Net Assets | ||
| Beginning of period | 782,849 | 766,913 |
| End of period | $693,900 | $782,849 |
| Other Information | ||
| Undistributed net investment income end of period | $4,223 | $1,494 |
See accompanying notes which are an integral part of the financial statements.
Financial Highlights — Fidelity Multi-Manager 2010 Fund
| Six months ended (Unaudited) September 30, | Years ended March 31, | ||||
| 2016 | 2016 | 2015 | 2014 | 2013 A | |
| Selected Per–Share Data | |||||
| Net asset value, beginning of period | $10.14 | $10.87 | $10.87 | $10.35 | $10.00 |
| Income from Investment Operations | |||||
| Net investment income (loss)B | .06 | .16 | .19 | .15 | .05 |
| Net realized and unrealized gain (loss) | .47 | (.35) | .37 | .67 | .30 |
| Total from investment operations | .53 | (.19) | .56 | .82 | .35 |
| Distributions from net investment income | (.02) | (.17) | (.17) | (.12) | – |
| Distributions from net realized gain | (.07) | (.37) | (.40) | (.18) | – |
| Total distributions | (.09) | (.54) | (.56)C | (.30) | – |
| Net asset value, end of period | $10.58 | $10.14 | $10.87 | $10.87 | $10.35 |
| Total ReturnD,E | 5.29% | (1.85)% | 5.31% | 8.00% | 3.50% |
| Ratios to Average Net AssetsF,G | |||||
| Expenses before reductions | .05%H | .05% | .05% | .06% | .17%H |
| Expenses net of fee waivers, if any | .05%H | .05% | .05% | .06% | .06%H |
| Expenses net of all reductions | .05%H | .05% | .05% | .06% | .06%H |
| Net investment income (loss) | 1.23%H | 1.58% | 1.73% | 1.45% | 1.87%H |
| Supplemental Data | |||||
| Net assets, end of period (000 omitted) | $481 | $571 | $550 | $277 | $104 |
| Portfolio turnover rateF | 47%H | 32% | 15% | 24% | 1%I |
A For the period December 20, 2012 (commencement of operations) to March 31, 2013.
B Calculated based on average shares outstanding during the period.
C Total distributions of $.56 per share is comprised of distributions from net investment income of $.167 and distributions from net realized gain of $.397 per share.
D Total returns for periods of less than one year are not annualized.
E Total returns would have been lower if certain expenses had not been reduced during the applicable periods shown.
F Amounts do not include the activity of the Underlying Funds.
G Expense ratios reflect operating expenses of the class. Expenses before reductions do not reflect amounts reimbursed by the investment adviser or reductions from expense offset arrangements and do not represent the amount paid by the class during periods when reimbursements or reductions occur. Expense ratios before reductions for start-up periods may not be representative of longer-term operating periods. Expenses net of fee waivers reflect expenses after reimbursement by the investment adviser but prior to reductions from expense offset arrangements. Expenses net of all reductions represent the net expenses paid by the class but do not include expenses of the underlying funds in which the Fund invests.
H Annualized
I Amount not annualized.
See accompanying notes which are an integral part of the financial statements.
Financial Highlights — Fidelity Multi-Manager 2010 Fund Class L
| Six months ended (Unaudited) September 30, | Years ended March 31, | |||
| 2016 | 2016 | 2015 | 2014 A | |
| Selected Per–Share Data | ||||
| Net asset value, beginning of period | $10.15 | $10.88 | $10.87 | $10.73 |
| Income from Investment Operations | ||||
| Net investment income (loss)B | .06 | .16 | .19 | .07 |
| Net realized and unrealized gain (loss) | .46 | (.35) | .38 | .25 |
| Total from investment operations | .52 | (.19) | .57 | .32 |
| Distributions from net investment income | (.02) | (.16) | (.16) | (.07) |
| Distributions from net realized gain | (.07) | (.37) | (.40) | (.11) |
| Total distributions | (.09) | (.54)C | (.56) | (.18) |
| Net asset value, end of period | $10.58 | $10.15 | $10.88 | $10.87 |
| Total ReturnD | 5.29% | (1.86)% | 5.37% | 2.97% |
| Ratios to Average Net AssetsE,F | ||||
| Expenses before reductions | .06%G | .06% | .07% | .07%G |
| Expenses net of fee waivers, if any | .06%G | .06% | .07% | .07%G |
| Expenses net of all reductions | .06%G | .06% | .07% | .07%G |
| Net investment income (loss) | 1.22%G | 1.56% | 1.71% | 1.96%G |
| Supplemental Data | ||||
| Net assets, end of period (000 omitted) | $107 | $106 | $108 | $103 |
| Portfolio turnover rateE | 47%G | 32% | 15% | 24% |
A For the period December 4, 2013 (commencement of sale of shares) to March 31, 2014.
B Calculated based on average shares outstanding during the period.
C Total distributions of $.54 per share is comprised of distributions from net investment income of $.164 and distributions from net realized gain of $.371 per share.
D Total returns for periods of less than one year are not annualized.
E Amounts do not include the activity of the Underlying Funds.
F Expense ratios reflect operating expenses of the class. Expenses before reductions do not reflect amounts reimbursed by the investment adviser or reductions from expense offset arrangements and do not represent the amount paid by the class during periods when reimbursements or reductions occur. Expenses net of fee waivers reflect expenses after reimbursement by the investment adviser but prior to reductions from expense offset arrangements. Expenses net of all reductions represent the net expenses paid by the class but do not include expenses of the underlying funds in which the Fund invests.
G Annualized
See accompanying notes which are an integral part of the financial statements.
Financial Highlights — Fidelity Multi-Manager 2010 Fund Class N
| Six months ended (Unaudited) September 30, | Years ended March 31, | |||
| 2016 | 2016 | 2015 | 2014 A | |
| Selected Per–Share Data | ||||
| Net asset value, beginning of period | $10.14 | $10.87 | $10.87 | $10.73 |
| Income from Investment Operations | ||||
| Net investment income (loss)B | .05 | .14 | .16 | .06 |
| Net realized and unrealized gain (loss) | .47 | (.36) | .37 | .25 |
| Total from investment operations | .52 | (.22) | .53 | .31 |
| Distributions from net investment income | (.02) | (.14) | (.14) | (.07) |
| Distributions from net realized gain | (.07) | (.37) | (.40) | (.11) |
| Total distributions | (.09) | (.51) | (.53)C | (.17)D |
| Net asset value, end of period | $10.57 | $10.14 | $10.87 | $10.87 |
| Total ReturnE | 5.13% | (2.11)% | 5.01% | 2.95% |
| Ratios to Average Net AssetsF,G | ||||
| Expenses before reductions | .31%H | .31% | .32% | .32%H |
| Expenses net of fee waivers, if any | .31%H | .31% | .32% | .32%H |
| Expenses net of all reductions | .31%H | .31% | .32% | .32%H |
| Net investment income (loss) | .97%H | 1.31% | 1.46% | 1.70%H |
| Supplemental Data | ||||
| Net assets, end of period (000 omitted) | $106 | $106 | $108 | $103 |
| Portfolio turnover rateF | 47%H | 32% | 15% | 24% |
A For the period December 4, 2013 (commencement of sale of shares) to March 31, 2014.
B Calculated based on average shares outstanding during the period.
C Total distributions of $.53 per share is comprised of distributions from net investment income of $.136 and distributions from net realized gain of $.397 per share.
D Total distributions of $.17 per share is comprised of distributions from net investment income of $.066 and distributions from net realized gain of $.108 per share.
E Total returns for periods of less than one year are not annualized.
F Amounts do not include the activity of the Underlying Funds.
G Expense ratios reflect operating expenses of the class. Expenses before reductions do not reflect amounts reimbursed by the investment adviser or reductions from expense offset arrangements and do not represent the amount paid by the class during periods when reimbursements or reductions occur. Expenses net of fee waivers reflect expenses after reimbursement by the investment adviser but prior to reductions from expense offset arrangements. Expenses net of all reductions represent the net expenses paid by the class but do not include expenses of the underlying funds in which the Fund invests.
H Annualized
See accompanying notes which are an integral part of the financial statements.
Fidelity® Multi-Manager 2015 Fund
Investment Summary (Unaudited)
The information in the following tables is based on the direct investments of the Fund.Top Holdings as of September 30, 2016
| % of fund's net assets | % of fund's net assets 6 months ago | |
| Strategic Advisers Core Income Multi-Manager Fund Class F | 26.2 | 28.5 |
| Strategic Advisers International Multi-Manager Fund Class F | 12.3 | 11.7 |
| Strategic Advisers Core Multi-Manager Fund Class F | 10.9 | 11.5 |
| Strategic Advisers Value Multi-Manager Fund Class F | 10.9 | 11.5 |
| Strategic Advisers Growth Multi-Manager Fund Class F | 9.1 | 9.6 |
| Strategic Advisers Emerging Markets Fund of Funds Class F | 7.4 | 6.9 |
| Fidelity Investments Money Market Government Portfolio Institutional Class 0.31% | 6.4 | 4.6 |
| Strategic Advisers Small-Mid Cap Multi-Manager Fund Class F | 5.5 | 5.7 |
| Fidelity Series Short-Term Credit Fund Class F | 3.4 | 2.5 |
| Strategic Advisers Income Opportunities Fund of Funds Class F | 3.0 | 3.0 |
| 95.1 | 95.5 |
Asset Allocation (% of fund's net assets)
| Period end | ||
| Domestic Equity Funds | 38.0% | |
| International Equity Funds | 19.7% | |
| Bond Funds | 32.5% | |
| Short-Term Funds | 9.8% | |

| Six months ago | ||
| Domestic Equity Funds | 39.6% | |
| International Equity Funds | 18.6% | |
| Bond Funds | 34.7% | |
| Short-Term Funds | 7.1% | |

Domestic Equity Funds category includes Fidelity Series Commodity Strategy Fund which invests in commodity-related investments.
Fidelity® Multi-Manager 2015 Fund
Investments September 30, 2016 (Unaudited)
Showing Percentage of Net Assets
| Domestic Equity Funds - 38.0% | |||
| Shares | Value | ||
| Fidelity Series Commodity Strategy Fund Class F (a)(b) | 4,644 | $24,844 | |
| Strategic Advisers Core Multi-Manager Fund Class F (b) | 14,465 | 172,572 | |
| Strategic Advisers Growth Multi-Manager Fund Class F (b) | 11,056 | 144,726 | |
| Strategic Advisers Small-Mid Cap Multi-Manager Fund Class F (b) | 8,031 | 86,898 | |
| Strategic Advisers Value Multi-Manager Fund Class F (b) | 12,658 | 172,405 | |
| TOTAL DOMESTIC EQUITY FUNDS | |||
| (Cost $633,540) | 601,445 | ||
| International Equity Funds - 19.7% | |||
| Strategic Advisers Emerging Markets Fund of Funds Class F (b) | 12,487 | 117,257 | |
| Strategic Advisers International Multi-Manager Fund Class F (b) | 16,874 | 194,390 | |
| TOTAL INTERNATIONAL EQUITY FUNDS | |||
| (Cost $321,103) | 311,647 | ||
| Bond Funds - 32.5% | |||
| Fidelity Series Emerging Markets Debt Fund Class F (b) | 1,044 | 10,821 | |
| Fidelity Series Floating Rate High Income Fund Class F (b) | 425 | 4,005 | |
| Fidelity Series Inflation-Protected Bond Index Fund Class F (b) | 2,975 | 29,984 | |
| Fidelity Series Real Estate Income Fund Class F (b) | 701 | 7,863 | |
| Strategic Advisers Core Income Multi-Manager Fund Class F (b) | 40,973 | 414,645 | |
| Strategic Advisers Income Opportunities Fund of Funds Class F (b) | 4,724 | 46,766 | |
| TOTAL BOND FUNDS | |||
| (Cost $503,035) | 514,084 | ||
| Short-Term Funds - 9.8% | |||
| Fidelity Investments Money Market Government Portfolio Institutional Class 0.31% (b)(c) | 100,804 | 100,804 | |
| Fidelity Series Short-Term Credit Fund Class F (b) | 5,369 | 53,851 | |
| TOTAL SHORT-TERM FUNDS | |||
| (Cost $154,474) | 154,655 | ||
| TOTAL INVESTMENT PORTFOLIO - 100.0% | |||
| (Cost $1,612,152) | 1,581,831 | ||
| NET OTHER ASSETS (LIABILITIES) - 0.0% | (125) | ||
| NET ASSETS - 100% | $1,581,706 |
Legend
(a) Non-income producing
(b) Affiliated Fund
(c) The rate quoted is the annualized seven-day yield of the fund at period end.
Affiliated Underlying Funds
Information regarding the Fund's fiscal year to date purchases and sales of the affiliated Underlying Funds and income earned by the Fund from investments in affiliated Underlying Funds is as follows:
| Affiliate | Value, beginning of period | Purchases | Sales Proceeds | Dividend Income | Value, end of period |
| Fidelity Investments Money Market Government Portfolio Institutional Class 0.31% | $79,055 | $35,385 | $13,636 | $132 | $100,804 |
| Fidelity Series Commodity Strategy Fund Class F | 21,585 | 5,394 | 3,710 | -- | 24,844 |
| Fidelity Series Emerging Markets Debt Fund Class F | 10,915 | 562 | 1,559 | 290 | 10,821 |
| Fidelity Series Floating Rate High Income Fund Class F | 4,267 | 201 | 655 | 88 | 4,005 |
| Fidelity Series Inflation-Protected Bond Index Fund Class F | 32,684 | 2,250 | 5,506 | 34 | 29,984 |
| Fidelity Series Real Estate Income Fund Class F | 8,341 | 702 | 1,418 | 194 | 7,863 |
| Fidelity Series Short-Term Credit Fund Class F | 42,482 | 18,525 | 7,343 | 257 | 53,851 |
| Strategic Advisers Core Income Multi-Manager Fund Class F | 487,943 | 18,565 | 102,398 | 4,924 | 414,645 |
| Strategic Advisers Core Multi-Manager Fund Class F | 197,019 | 14,455 | 40,240 | 569 | 172,572 |
| Strategic Advisers Emerging Markets Fund of Funds Class F | 118,496 | 5,521 | 17,794 | -- | 117,257 |
| Strategic Advisers Growth Multi-Manager Fund Class F | 164,402 | 13,596 | 34,394 | 430 | 144,726 |
| Strategic Advisers Income Opportunities Fund of Funds Class F | 50,996 | 2,224 | 9,534 | 1,327 | 46,766 |
| Strategic Advisers International Multi-Manager Fund Class F | 199,533 | 20,369 | 34,892 | -- | 194,390 |
| Strategic Advisers Small-Mid Cap Multi-Manager Fund Class F | 98,673 | 2,583 | 22,298 | -- | 86,898 |
| Strategic Advisers Value Multi-Manager Fund Class F | 196,814 | 11,562 | 40,234 | 1,205 | 172,405 |
| Total | $1,713,205 | $151,894 | $335,611 | $9,450 | $1,581,831 |
Investment Valuation
All investments are categorized as Level 1 under the Fair Value Hierarchy. The inputs or methodology used for valuing securities may not be an indication of the risk associated with investing in those securities. For more information on valuation inputs please refer to the Investment Valuation section in the accompanying Notes to Financial Statements.
See accompanying notes which are an integral part of the financial statements.
Fidelity® Multi-Manager 2015 Fund
Financial Statements
Statement of Assets and Liabilities
| September 30, 2016 (Unaudited) | ||
| Assets | ||
| Investment in securities, at value (cost $1,612,152) — See accompanying schedule | $1,581,831 | |
| Receivable for investments sold | 1,523 | |
| Receivable for fund shares sold | 342 | |
| Total assets | 1,583,696 | |
| Liabilities | ||
| Payable for investments purchased | $1,870 | |
| Distribution and service plan fees payable | 22 | |
| Other affiliated payables | 98 | |
| Total liabilities | 1,990 | |
| Net Assets | $1,581,706 | |
| Net Assets consist of: | ||
| Paid in capital | $1,619,760 | |
| Undistributed net investment income | 8,362 | |
| Accumulated undistributed net realized gain (loss) on investments | (16,095) | |
| Net unrealized appreciation (depreciation) on investments | (30,321) | |
| Net Assets | $1,581,706 | |
| Multi-Manager 2015: | ||
| Net Asset Value, offering price and redemption price per share ($1,367,783 ÷ 126,964 shares) | $10.77 | |
| Class L: | ||
| Net Asset Value, offering price and redemption price per share ($107,339 ÷ 9,959 shares) | $10.78 | |
| Class N: | ||
| Net Asset Value, offering price and redemption price per share ($106,584 ÷ 9,903 shares) | $10.76 |
See accompanying notes which are an integral part of the financial statements.
Statement of Operations
| Six months ended September 30, 2016 (Unaudited) | ||
| Investment Income | ||
| Income distributions from underlying funds | $9,450 | |
| Expenses | ||
| Transfer agent fees | $605 | |
| Distribution and service plan fees | 130 | |
| Independent trustees' fees and expenses | 4 | |
| Total expenses | 739 | |
| Net investment income (loss) | 8,711 | |
| Realized and Unrealized Gain (Loss) | ||
| Realized gain (loss) on sale of underlying fund shares | (24,600) | |
| Capital gain distributions from underlying funds | 21,266 | |
| Total net realized gain (loss) | (3,334) | |
| Change in net unrealized appreciation (depreciation) on underlying funds | 76,941 | |
| Net gain (loss) | 73,607 | |
| Net increase (decrease) in net assets resulting from operations | $82,318 |
See accompanying notes which are an integral part of the financial statements.
Statement of Changes in Net Assets
| Six months ended September 30, 2016 (Unaudited) | Year ended March 31, 2016 | |
| Increase (Decrease) in Net Assets | ||
| Operations | ||
| Net investment income (loss) | $8,711 | $28,236 |
| Net realized gain (loss) | (3,334) | 16,148 |
| Change in net unrealized appreciation (depreciation) | 76,941 | (100,177) |
| Net increase (decrease) in net assets resulting from operations | 82,318 | (55,793) |
| Distributions to shareholders from net investment income | (4,244) | (28,254) |
| Distributions to shareholders from net realized gain | (1,754) | (67,187) |
| Total distributions | (5,998) | (95,441) |
| Share transactions - net increase (decrease) | (207,687) | 53,122 |
| Total increase (decrease) in net assets | (131,367) | (98,112) |
| Net Assets | ||
| Beginning of period | 1,713,073 | 1,811,185 |
| End of period | $1,581,706 | $1,713,073 |
| Other Information | ||
| Undistributed net investment income end of period | $8,362 | $3,895 |
See accompanying notes which are an integral part of the financial statements.
Financial Highlights — Fidelity Multi-Manager 2015 Fund
| Six months ended (Unaudited) September 30, | Years ended March 31, | ||||
| 2016 | 2016 | 2015 | 2014 | 2013 A | |
| Selected Per–Share Data | |||||
| Net asset value, beginning of period | $10.23 | $11.04 | $10.97 | $10.36 | $10.00 |
| Income from Investment Operations | |||||
| Net investment income (loss)B | .06 | .16 | .19 | .15 | .05 |
| Net realized and unrealized gain (loss) | .52 | (.40) | .42 | .74 | .31 |
| Total from investment operations | .58 | (.24) | .61 | .89 | .36 |
| Distributions from net investment income | (.03) | (.17) | (.15) | (.12) | – |
| Distributions from net realized gain | (.01) | (.40) | (.39) | (.16) | – |
| Total distributions | (.04) | (.57) | (.54) | (.28) | – |
| Net asset value, end of period | $10.77 | $10.23 | $11.04 | $10.97 | $10.36 |
| Total ReturnC,D | 5.67% | (2.32)% | 5.70% | 8.68% | 3.60% |
| Ratios to Average Net AssetsE,F | |||||
| Expenses before reductions | .08%G | .08% | .09% | .10% | .21%G |
| Expenses net of fee waivers, if any | .08%G | .08% | .09% | .10% | .09%G |
| Expenses net of all reductions | .08%G | .08% | .09% | .10% | .09%G |
| Net investment income (loss) | 1.14%G | 1.53% | 1.73% | 1.44% | 1.88%G |
| Supplemental Data | |||||
| Net assets, end of period (000 omitted) | $1,368 | $1,500 | $1,593 | $654 | $104 |
| Portfolio turnover rateE | 19%G | 37% | 16% | 38% | 1%H |
A For the period December 20, 2012 (commencement of operations) to March 31, 2013.
B Calculated based on average shares outstanding during the period.
C Total returns for periods of less than one year are not annualized.
D Total returns would have been lower if certain expenses had not been reduced during the applicable periods shown.
E Amounts do not include the activity of the Underlying Funds.
F Expense ratios reflect operating expenses of the class. Expenses before reductions do not reflect amounts reimbursed by the investment adviser or reductions from expense offset arrangements and do not represent the amount paid by the class during periods when reimbursements or reductions occur. Expense ratios before reductions for start-up periods may not be representative of longer-term operating periods. Expenses net of fee waivers reflect expenses after reimbursement by the investment adviser but prior to reductions from expense offset arrangements. Expenses net of all reductions represent the net expenses paid by the class but do not include expenses of the underlying funds in which the Fund invests.
G Annualized
H Amount not annualized.
See accompanying notes which are an integral part of the financial statements.
Financial Highlights — Fidelity Multi-Manager 2015 Fund Class L
| Six months ended (Unaudited) September 30, | Years ended March 31, | |||
| 2016 | 2016 | 2015 | 2014 A | |
| Selected Per–Share Data | ||||
| Net asset value, beginning of period | $10.24 | $11.04 | $10.97 | $10.77 |
| Income from Investment Operations | ||||
| Net investment income (loss)B | .06 | .16 | .19 | .06 |
| Net realized and unrealized gain (loss) | .52 | (.40) | .42 | .30 |
| Total from investment operations | .58 | (.24) | .61 | .36 |
| Distributions from net investment income | (.03) | (.16) | (.15) | (.07) |
| Distributions from net realized gain | (.01) | (.40) | (.39) | (.09) |
| Total distributions | (.04) | (.56) | (.54) | (.16) |
| Net asset value, end of period | $10.78 | $10.24 | $11.04 | $10.97 |
| Total ReturnC,D | 5.67% | (2.24)% | 5.66% | 3.34% |
| Ratios to Average Net AssetsE,F | ||||
| Expenses before reductions | .08%G | .08% | .09% | .10%G |
| Expenses net of fee waivers, if any | .08%G | .08% | .09% | .10%G |
| Expenses net of all reductions | .08%G | .08% | .09% | .10%G |
| Net investment income (loss) | 1.13%G | 1.52% | 1.72% | 1.81%G |
| Supplemental Data | ||||
| Net assets, end of period (000 omitted) | $107 | $107 | $109 | $103 |
| Portfolio turnover rateE | 19%G | 37% | 16% | 38% |
A For the period December 4, 2013 (commencement of sale of shares) to March 31, 2014.
B Calculated based on average shares outstanding during the period.
C Total returns for periods of less than one year are not annualized.
D Total returns would have been lower if certain expenses had not been reduced during the applicable periods shown.
E Amounts do not include the activity of the Underlying Funds.
F Expense ratios reflect operating expenses of the class. Expenses before reductions do not reflect amounts reimbursed by the investment adviser or reductions from expense offset arrangements and do not represent the amount paid by the class during periods when reimbursements or reductions occur. Expenses net of fee waivers reflect expenses after reimbursement by the investment adviser but prior to reductions from expense offset arrangements. Expenses net of all reductions represent the net expenses paid by the class but do not include expenses of the underlying funds in which the Fund invests.
G Annualized
See accompanying notes which are an integral part of the financial statements.
Financial Highlights — Fidelity Multi-Manager 2015 Fund Class N
| Six months ended (Unaudited) September 30, | Years ended March 31, | |||
| 2016 | 2016 | 2015 | 2014 A | |
| Selected Per–Share Data | ||||
| Net asset value, beginning of period | $10.23 | $11.04 | $10.96 | $10.77 |
| Income from Investment Operations | ||||
| Net investment income (loss)B | .05 | .13 | .16 | .05 |
| Net realized and unrealized gain (loss) | .51 | (.40) | .43 | .30 |
| Total from investment operations | .56 | (.27) | .59 | .35 |
| Distributions from net investment income | (.02) | (.14) | (.12) | (.07) |
| Distributions from net realized gain | (.01) | (.40) | (.39) | (.09) |
| Total distributions | (.03) | (.54) | (.51) | (.16) |
| Net asset value, end of period | $10.76 | $10.23 | $11.04 | $10.96 |
| Total ReturnC,D | 5.51% | (2.57)% | 5.51% | 3.22% |
| Ratios to Average Net AssetsE,F | ||||
| Expenses before reductions | .33%G | .33% | .34% | .36%G |
| Expenses net of fee waivers, if any | .33%G | .33% | .34% | .35%G |
| Expenses net of all reductions | .33%G | .33% | .34% | .35%G |
| Net investment income (loss) | .88%G | 1.27% | 1.47% | 1.56%G |
| Supplemental Data | ||||
| Net assets, end of period (000 omitted) | $107 | $106 | $109 | $103 |
| Portfolio turnover rateE | 19%G | 37% | 16% | 38% |
A For the period December 4, 2013 (commencement of sale of shares) to March 31, 2014.
B Calculated based on average shares outstanding during the period.
C Total returns for periods of less than one year are not annualized.
D Total returns would have been lower if certain expenses had not been reduced during the applicable periods shown.
E Amounts do not include the activity of the Underlying Funds.
F Expense ratios reflect operating expenses of the class. Expenses before reductions do not reflect amounts reimbursed by the investment adviser or reductions from expense offset arrangements and do not represent the amount paid by the class during periods when reimbursements or reductions occur. Expenses net of fee waivers reflect expenses after reimbursement by the investment adviser but prior to reductions from expense offset arrangements. Expenses net of all reductions represent the net expenses paid by the class but do not include expenses of the underlying funds in which the Fund invests.
G Annualized
See accompanying notes which are an integral part of the financial statements.
Fidelity® Multi-Manager 2020 Fund
Investment Summary (Unaudited)
The information in the following tables is based on the direct investments of the Fund.Top Holdings as of September 30, 2016
| % of fund's net assets | % of fund's net assets 6 months ago | |
| Strategic Advisers Core Income Multi-Manager Fund Class F | 23.9 | 24.9 |
| Strategic Advisers International Multi-Manager Fund Class F | 13.6 | 13.0 |
| Strategic Advisers Core Multi-Manager Fund Class F | 12.1 | 12.8 |
| Strategic Advisers Value Multi-Manager Fund Class F | 12.1 | 12.8 |
| Strategic Advisers Growth Multi-Manager Fund Class F | 10.2 | 10.6 |
| Strategic Advisers Emerging Markets Fund of Funds Class F | 7.9 | 7.4 |
| Strategic Advisers Small-Mid Cap Multi-Manager Fund Class F | 6.1 | 6.4 |
| Fidelity Investments Money Market Government Portfolio Institutional Class 0.31% | 4.6 | 3.5 |
| Strategic Advisers Income Opportunities Fund of Funds Class F | 2.9 | 3.0 |
| Fidelity Series Short-Term Credit Fund Class F | 2.5 | 1.9 |
| 95.9 | 96.3 |
Asset Allocation (% of fund's net assets)
| Period end | ||
| Domestic Equity Funds | 42.1% | |
| International Equity Funds | 21.5% | |
| Bond Funds | 29.3% | |
| Short-Term Funds | 7.1% | |

| Six months ago | ||
| Domestic Equity Funds | 43.9% | |
| International Equity Funds | 20.4% | |
| Bond Funds | 30.3% | |
| Short-Term Funds | 5.4% | |

Domestic Equity Funds category includes Fidelity Series Commodity Strategy Fund which invests in commodity-related investments.
Fidelity® Multi-Manager 2020 Fund
Investments September 30, 2016 (Unaudited)
Showing Percentage of Net Assets
| Domestic Equity Funds - 42.1% | |||
| Shares | Value | ||
| Fidelity Series Commodity Strategy Fund Class F (a)(b) | 12,245 | $65,509 | |
| Strategic Advisers Core Multi-Manager Fund Class F (b) | 41,227 | 491,837 | |
| Strategic Advisers Growth Multi-Manager Fund Class F (b) | 31,514 | 412,519 | |
| Strategic Advisers Small-Mid Cap Multi-Manager Fund Class F (b) | 22,892 | 247,697 | |
| Strategic Advisers Value Multi-Manager Fund Class F (b) | 36,078 | 491,384 | |
| TOTAL DOMESTIC EQUITY FUNDS | |||
| (Cost $1,789,997) | 1,708,946 | ||
| International Equity Funds - 21.5% | |||
| Strategic Advisers Emerging Markets Fund of Funds Class F (b) | 33,894 | 318,266 | |
| Strategic Advisers International Multi-Manager Fund Class F (b) | 47,990 | 552,846 | |
| TOTAL INTERNATIONAL EQUITY FUNDS | |||
| (Cost $878,468) | 871,112 | ||
| Bond Funds - 29.3% | |||
| Fidelity Series Emerging Markets Debt Fund Class F (b) | 2,674 | 27,699 | |
| Fidelity Series Floating Rate High Income Fund Class F (b) | 1,091 | 10,278 | |
| Fidelity Series Inflation-Protected Bond Index Fund Class F (b) | 4,417 | 44,524 | |
| Fidelity Series Real Estate Income Fund Class F (b) | 1,773 | 19,888 | |
| Strategic Advisers Core Income Multi-Manager Fund Class F (b) | 95,825 | 969,743 | |
| Strategic Advisers Income Opportunities Fund of Funds Class F (b) | 11,864 | 117,457 | |
| TOTAL BOND FUNDS | |||
| (Cost $1,165,980) | 1,189,589 | ||
| Short-Term Funds - 7.1% | |||
| Fidelity Investments Money Market Government Portfolio Institutional Class 0.31% (b)(c) | 189,140 | 189,140 | |
| Fidelity Series Short-Term Credit Fund Class F (b) | 10,073 | 101,028 | |
| TOTAL SHORT-TERM FUNDS | |||
| (Cost $289,819) | 290,168 | ||
| TOTAL INVESTMENT PORTFOLIO - 100.0% | |||
| (Cost $4,124,264) | 4,059,815 | ||
| NET OTHER ASSETS (LIABILITIES) - 0.0% | (290) | ||
| NET ASSETS - 100% | $4,059,525 |
Legend
(a) Non-income producing
(b) Affiliated Fund
(c) The rate quoted is the annualized seven-day yield of the fund at period end.
Affiliated Underlying Funds
Information regarding the Fund's fiscal year to date purchases and sales of the affiliated Underlying Funds and income earned by the Fund from investments in affiliated Underlying Funds is as follows:
| Affiliate | Value, beginning of period | Purchases | Sales Proceeds | Dividend Income | Value, end of period |
| Fidelity Investments Money Market Government Portfolio Institutional Class 0.31% | $156,531 | $75,201 | $42,593 | $236 | $189,140 |
| Fidelity Series Commodity Strategy Fund Class F | 55,937 | 21,694 | 16,337 | -- | 65,509 |
| Fidelity Series Emerging Markets Debt Fund Class F | 28,062 | 3,905 | 6,554 | 739 | 27,699 |
| Fidelity Series Floating Rate High Income Fund Class F | 11,023 | 1,544 | 2,783 | 225 | 10,278 |
| Fidelity Series Inflation-Protected Bond Index Fund Class F | 47,618 | 8,574 | 12,479 | 50 | 44,524 |
| Fidelity Series Real Estate Income Fund Class F | 21,220 | 3,728 | 5,644 | 487 | 19,888 |
| Fidelity Series Short-Term Credit Fund Class F | 84,084 | 39,513 | 22,886 | 458 | 101,028 |
| Strategic Advisers Core Income Multi-Manager Fund Class F | 1,097,033 | 144,499 | 295,924 | 11,363 | 969,743 |
| Strategic Advisers Core Multi-Manager Fund Class F | 563,341 | 89,171 | 164,185 | 1,544 | 491,837 |
| Strategic Advisers Emerging Markets Fund of Funds Class F | 324,060 | 46,040 | 80,089 | -- | 318,266 |
| Strategic Advisers Growth Multi-Manager Fund Class F | 470,079 | 79,752 | 140,130 | 1,164 | 412,519 |
| Strategic Advisers Income Opportunities Fund of Funds Class F | 131,580 | 12,601 | 34,461 | 3,352 | 117,457 |
| Strategic Advisers International Multi-Manager Fund Class F | 573,764 | 109,243 | 156,057 | -- | 552,846 |
| Strategic Advisers Small-Mid Cap Multi-Manager Fund Class F | 282,137 | 32,023 | 88,020 | -- | 247,697 |
| Strategic Advisers Value Multi-Manager Fund Class F | 562,756 | 81,320 | 164,253 | 3,269 | 491,384 |
| Total | $4,409,225 | $748,808 | $1,232,395 | $22,887 | $4,059,815 |
Investment Valuation
All investments are categorized as Level 1 under the Fair Value Hierarchy. The inputs or methodology used for valuing securities may not be an indication of the risk associated with investing in those securities. For more information on valuation inputs please refer to the Investment Valuation section in the accompanying Notes to Financial Statements.
See accompanying notes which are an integral part of the financial statements.
Fidelity® Multi-Manager 2020 Fund
Financial Statements
Statement of Assets and Liabilities
| September 30, 2016 (Unaudited) | ||
| Assets | ||
| Investment in securities, at value (cost $4,124,264) — See accompanying schedule | $4,059,815 | |
| Receivable for investments sold | 7,118 | |
| Receivable for fund shares sold | 3,177 | |
| Total assets | 4,070,110 | |
| Liabilities | ||
| Payable for investments purchased | $4,512 | |
| Payable for fund shares redeemed | 5,788 | |
| Distribution and service plan fees payable | 22 | |
| Other affiliated payables | 263 | |
| Total liabilities | 10,585 | |
| Net Assets | $4,059,525 | |
| Net Assets consist of: | ||
| Paid in capital | $4,171,558 | |
| Undistributed net investment income | 20,454 | |
| Accumulated undistributed net realized gain (loss) on investments | (68,038) | |
| Net unrealized appreciation (depreciation) on investments | (64,449) | |
| Net Assets | $4,059,525 | |
| Multi-Manager 2020: | ||
| Net Asset Value, offering price and redemption price per share ($3,844,662 ÷ 357,086 shares) | $10.77 | |
| Class L: | ||
| Net Asset Value, offering price and redemption price per share ($107,812 ÷ 10,014 shares) | $10.77 | |
| Class N: | ||
| Net Asset Value, offering price and redemption price per share ($107,051 ÷ 9,958 shares) | $10.75 |
See accompanying notes which are an integral part of the financial statements.
Statement of Operations
| Six months ended September 30, 2016 (Unaudited) | ||
| Investment Income | ||
| Income distributions from underlying funds | $22,887 | |
| Expenses | ||
| Transfer agent fees | $1,566 | |
| Distribution and service plan fees | 130 | |
| Independent trustees' fees and expenses | 9 | |
| Total expenses | 1,705 | |
| Net investment income (loss) | 21,182 | |
| Realized and Unrealized Gain (Loss) | ||
| Realized gain (loss) on sale of underlying fund shares | (88,109) | |
| Capital gain distributions from underlying funds | 57,692 | |
| Total net realized gain (loss) | (30,417) | |
| Change in net unrealized appreciation (depreciation) on underlying funds | 222,285 | |
| Net gain (loss) | 191,868 | |
| Net increase (decrease) in net assets resulting from operations | $213,050 |
See accompanying notes which are an integral part of the financial statements.
Statement of Changes in Net Assets
| Six months ended September 30, 2016 (Unaudited) | Year ended March 31, 2016 | |
| Increase (Decrease) in Net Assets | ||
| Operations | ||
| Net investment income (loss) | $21,182 | $62,846 |
| Net realized gain (loss) | (30,417) | 87,058 |
| Change in net unrealized appreciation (depreciation) | 222,285 | (271,767) |
| Net increase (decrease) in net assets resulting from operations | 213,050 | (121,863) |
| Distributions to shareholders from net investment income | (8,782) | (60,710) |
| Distributions to shareholders from net realized gain | (36,629) | (163,441) |
| Total distributions | (45,411) | (224,151) |
| Share transactions - net increase (decrease) | (517,044) | 1,358,231 |
| Total increase (decrease) in net assets | (349,405) | 1,012,217 |
| Net Assets | ||
| Beginning of period | 4,408,930 | 3,396,713 |
| End of period | $4,059,525 | $4,408,930 |
| Other Information | ||
| Undistributed net investment income end of period | $20,454 | $8,054 |
See accompanying notes which are an integral part of the financial statements.
Financial Highlights — Fidelity Multi-Manager 2020 Fund
| Six months ended (Unaudited) September 30, | Years ended March 31, | ||||
| 2016 | 2016 | 2015 | 2014 | 2013 A | |
| Selected Per–Share Data | |||||
| Net asset value, beginning of period | $10.27 | $11.15 | $11.12 | $10.40 | $10.00 |
| Income from Investment Operations | |||||
| Net investment income (loss)B | .06 | .16 | .19 | .15 | .06 |
| Net realized and unrealized gain (loss) | .55 | (.43) | .45 | .83 | .34 |
| Total from investment operations | .61 | (.27) | .64 | .98 | .40 |
| Distributions from net investment income | (.02) | (.15) | (.16) | (.12) | – |
| Distributions from net realized gain | (.09) | (.46) | (.45) | (.14) | – |
| Total distributions | (.11) | (.61) | (.61) | (.26) | – |
| Net asset value, end of period | $10.77 | $10.27 | $11.15 | $11.12 | $10.40 |
| Total ReturnC,D | 5.98% | (2.56)% | 5.91% | 9.50% | 4.00% |
| Ratios to Average Net AssetsE,F | |||||
| Expenses before reductions | .08%G | .08% | .08% | .10% | .21%G |
| Expenses net of fee waivers, if any | .08%G | .08% | .08% | .10% | .09%G |
| Expenses net of all reductions | .08%G | .08% | .08% | .10% | .09%G |
| Net investment income (loss) | 1.07%G | 1.51% | 1.71% | 1.41% | 1.97%G |
| Supplemental Data | |||||
| Net assets, end of period (000 omitted) | $3,845 | $4,196 | $3,178 | $1,527 | $104 |
| Portfolio turnover rateE | 37%G | 29% | 19% | 51% | 1%H |
A For the period December 20, 2012 (commencement of operations) to March 31, 2013.
B Calculated based on average shares outstanding during the period.
C Total returns for periods of less than one year are not annualized.
D Total returns would have been lower if certain expenses had not been reduced during the applicable periods shown.
E Amounts do not include the activity of the Underlying Funds.
F Expense ratios reflect operating expenses of the class. Expenses before reductions do not reflect amounts reimbursed by the investment adviser or reductions from expense offset arrangements and do not represent the amount paid by the class during periods when reimbursements or reductions occur. Expense ratios before reductions for start-up periods may not be representative of longer-term operating periods. Expenses net of fee waivers reflect expenses after reimbursement by the investment adviser but prior to reductions from expense offset arrangements. Expenses net of all reductions represent the net expenses paid by the class but do not include expenses of the underlying funds in which the Fund invests.
G Annualized
H Amount not annualized.
See accompanying notes which are an integral part of the financial statements.
Financial Highlights — Fidelity Multi-Manager 2020 Fund Class L
| Six months ended (Unaudited) September 30, | Years ended March 31, | |||
| 2016 | 2016 | 2015 | 2014 A | |
| Selected Per–Share Data | ||||
| Net asset value, beginning of period | $10.27 | $11.15 | $11.11 | $10.89 |
| Income from Investment Operations | ||||
| Net investment income (loss)B | .06 | .16 | .19 | .06 |
| Net realized and unrealized gain (loss) | .55 | (.43) | .46 | .32 |
| Total from investment operations | .61 | (.27) | .65 | .38 |
| Distributions from net investment income | (.02) | (.15) | (.16) | (.08) |
| Distributions from net realized gain | (.09) | (.46) | (.45) | (.09) |
| Total distributions | (.11) | (.61) | (.61) | (.16)C |
| Net asset value, end of period | $10.77 | $10.27 | $11.15 | $11.11 |
| Total ReturnD | 5.98% | (2.58)% | 5.98% | 3.55% |
| Ratios to Average Net AssetsE,F | ||||
| Expenses before reductions | .08%G | .08% | .09% | .09%G |
| Expenses net of fee waivers, if any | .08%G | .08% | .09% | .09%G |
| Expenses net of all reductions | .08%G | .08% | .09% | .09%G |
| Net investment income (loss) | 1.08%G | 1.51% | 1.71% | 1.75%G |
| Supplemental Data | ||||
| Net assets, end of period (000 omitted) | $108 | $107 | $110 | $104 |
| Portfolio turnover rateE | 37%G | 29% | 19% | 51% |
A For the period December 4, 2013 (commencement of sale of shares) to March 31, 2014.
B Calculated based on average shares outstanding during the period.
C Total distributions of $.16 per share is comprised of distributions from net investment income of $.077 and distributions from net realized gain of $.087 per share.
D Total returns for periods of less than one year are not annualized.
E Amounts do not include the activity of the Underlying Funds.
F Expense ratios reflect operating expenses of the class. Expenses before reductions do not reflect amounts reimbursed by the investment adviser or reductions from expense offset arrangements and do not represent the amount paid by the class during periods when reimbursements or reductions occur. Expenses net of fee waivers reflect expenses after reimbursement by the investment adviser but prior to reductions from expense offset arrangements. Expenses net of all reductions represent the net expenses paid by the class but do not include expenses of the underlying funds in which the Fund invests.
G Annualized
See accompanying notes which are an integral part of the financial statements.
Financial Highlights — Fidelity Multi-Manager 2020 Fund Class N
| Six months ended (Unaudited) September 30, | Years ended March 31, | |||
| 2016 | 2016 | 2015 | 2014 A | |
| Selected Per–Share Data | ||||
| Net asset value, beginning of period | $10.26 | $11.14 | $11.11 | $10.89 |
| Income from Investment Operations | ||||
| Net investment income (loss)B | .04 | .13 | .16 | .05 |
| Net realized and unrealized gain (loss) | .55 | (.43) | .45 | .33 |
| Total from investment operations | .59 | (.30) | .61 | .38 |
| Distributions from net investment income | (.02) | (.12) | (.13) | (.08) |
| Distributions from net realized gain | (.09) | (.46) | (.45) | (.09) |
| Total distributions | (.10)C | (.58) | (.58) | (.16)D |
| Net asset value, end of period | $10.75 | $10.26 | $11.14 | $11.11 |
| Total ReturnE | 5.83% | (2.82)% | 5.63% | 3.53% |
| Ratios to Average Net AssetsF,G | ||||
| Expenses before reductions | .33%H | .33% | .34% | .35%H |
| Expenses net of fee waivers, if any | .33%H | .33% | .34% | .35%H |
| Expenses net of all reductions | .33%H | .33% | .34% | .35%H |
| Net investment income (loss) | .83%H | 1.26% | 1.46% | 1.50%H |
| Supplemental Data | ||||
| Net assets, end of period (000 omitted) | $107 | $106 | $109 | $103 |
| Portfolio turnover rateF | 37%H | 29% | 19% | 51% |
A For the period December 4, 2013 (commencement of sale of shares) to March 31, 2014.
B Calculated based on average shares outstanding during the period.
C Total distributions of $.10 per share is comprised of distributions from net investment income of $.015 and distributions from net realized gain of $.087 per share.
D Total distributions of $.16 per share is comprised of distributions from net investment income of $.075 and distributions from net realized gain of $.087 per share.
E Total returns for periods of less than one year are not annualized.
F Amounts do not include the activity of the Underlying Funds.
G Expense ratios reflect operating expenses of the class. Expenses before reductions do not reflect amounts reimbursed by the investment adviser or reductions from expense offset arrangements and do not represent the amount paid by the class during periods when reimbursements or reductions occur. Expenses net of fee waivers reflect expenses after reimbursement by the investment adviser but prior to reductions from expense offset arrangements. Expenses net of all reductions represent the net expenses paid by the class but do not include expenses of the underlying funds in which the Fund invests.
H Annualized
See accompanying notes which are an integral part of the financial statements.
Fidelity® Multi-Manager 2025 Fund
Investment Summary (Unaudited)
The information in the following tables is based on the direct investments of the Fund.Top Holdings as of September 30, 2016
| % of fund's net assets | % of fund's net assets 6 months ago | |
| Strategic Advisers Core Income Multi-Manager Fund Class F | 20.4 | 19.9 |
| Strategic Advisers International Multi-Manager Fund Class F | 15.0 | 14.6 |
| Strategic Advisers Core Multi-Manager Fund Class F | 13.4 | 14.2 |
| Strategic Advisers Value Multi-Manager Fund Class F | 13.4 | 14.2 |
| Strategic Advisers Growth Multi-Manager Fund Class F | 11.3 | 11.8 |
| Strategic Advisers Emerging Markets Fund of Funds Class F | 8.3 | 7.8 |
| Strategic Advisers Small-Mid Cap Multi-Manager Fund Class F | 6.7 | 7.1 |
| Fidelity Investments Money Market Government Portfolio Institutional Class 0.31% | 3.3 | 2.7 |
| Strategic Advisers Income Opportunities Fund of Funds Class F | 2.7 | 3.0 |
| Fidelity Series Commodity Strategy Fund Class F | 1.8 | 1.3 |
| 96.3 | 96.6 |
Asset Allocation (% of fund's net assets)
| Period end | ||
| Domestic Equity Funds | 46.6% | |
| International Equity Funds | 23.3% | |
| Bond Funds | 25.1% | |
| Short-Term Funds | 5.0% | |

| Six months ago | ||
| Domestic Equity Funds | 48.6% | |
| International Equity Funds | 22.4% | |
| Bond Funds | 24.8% | |
| Short-Term Funds | 4.2% | |

Domestic Equity Funds category includes Fidelity Series Commodity Strategy Fund which invests in commodity-related investments.
Fidelity® Multi-Manager 2025 Fund
Investments September 30, 2016 (Unaudited)
Showing Percentage of Net Assets
| Domestic Equity Funds - 46.6% | |||
| Shares | Value | ||
| Fidelity Series Commodity Strategy Fund Class F (a)(b) | 7,092 | $37,945 | |
| Strategic Advisers Core Multi-Manager Fund Class F (b) | 23,907 | 285,209 | |
| Strategic Advisers Growth Multi-Manager Fund Class F (b) | 18,265 | 239,093 | |
| Strategic Advisers Small-Mid Cap Multi-Manager Fund Class F (b) | 13,254 | 143,411 | |
| Strategic Advisers Value Multi-Manager Fund Class F (b) | 20,923 | 284,967 | |
| TOTAL DOMESTIC EQUITY FUNDS | |||
| (Cost $999,235) | 990,625 | ||
| International Equity Funds - 23.3% | |||
| Strategic Advisers Emerging Markets Fund of Funds Class F (b) | 18,804 | 176,571 | |
| Strategic Advisers International Multi-Manager Fund Class F (b) | 27,604 | 317,993 | |
| TOTAL INTERNATIONAL EQUITY FUNDS | |||
| (Cost $484,060) | 494,564 | ||
| Bond Funds - 25.1% | |||
| Fidelity Series Emerging Markets Debt Fund Class F (b) | 1,346 | 13,942 | |
| Fidelity Series Floating Rate High Income Fund Class F (b) | 570 | 5,372 | |
| Fidelity Series Inflation-Protected Bond Index Fund Class F (b) | 1,246 | 12,564 | |
| Fidelity Series Real Estate Income Fund Class F (b) | 923 | 10,357 | |
| Strategic Advisers Core Income Multi-Manager Fund Class F (b) | 42,857 | 433,713 | |
| Strategic Advisers Income Opportunities Fund of Funds Class F (b) | 5,779 | 57,217 | |
| TOTAL BOND FUNDS | |||
| (Cost $523,400) | 533,165 | ||
| Short-Term Funds - 5.0% | |||
| Fidelity Investments Money Market Government Portfolio Institutional Class 0.31% (b)(c) | 68,963 | 68,963 | |
| Fidelity Series Short-Term Credit Fund Class F (b) | 3,675 | 36,863 | |
| TOTAL SHORT-TERM FUNDS | |||
| (Cost $105,682) | 105,826 | ||
| TOTAL INVESTMENT PORTFOLIO - 100.0% | |||
| (Cost $2,112,377) | 2,124,180 | ||
| NET OTHER ASSETS (LIABILITIES) - 0.0% | (183) | ||
| NET ASSETS - 100% | $2,123,997 |
Legend
(a) Non-income producing
(b) Affiliated Fund
(c) The rate quoted is the annualized seven-day yield of the fund at period end.
Affiliated Underlying Funds
Information regarding the Fund's fiscal year to date purchases and sales of the affiliated Underlying Funds and income earned by the Fund from investments in affiliated Underlying Funds is as follows:
| Affiliate | Value, beginning of period | Purchases | Sales Proceeds | Dividend Income | Value, end of period |
| Fidelity Investments Money Market Government Portfolio Institutional Class 0.31% | $52,133 | $28,548 | $11,719 | $84 | $68,963 |
| Fidelity Series Commodity Strategy Fund Class F | 24,392 | 17,253 | 5,530 | -- | 37,945 |
| Fidelity Series Emerging Markets Debt Fund Class F | 11,879 | 3,314 | 2,344 | 345 | 13,942 |
| Fidelity Series Floating Rate High Income Fund Class F | 4,720 | 1,399 | 977 | 108 | 5,372 |
| Fidelity Series Inflation-Protected Bond Index Fund Class F | 9,701 | 4,755 | 2,090 | 12 | 12,564 |
| Fidelity Series Real Estate Income Fund Class F | 9,219 | 2,930 | 2,081 | 239 | 10,357 |
| Fidelity Series Short-Term Credit Fund Class F | 28,055 | 15,008 | 6,304 | 163 | 36,863 |
| Strategic Advisers Core Income Multi-Manager Fund Class F | 377,754 | 129,984 | 83,583 | 4,490 | 433,713 |
| Strategic Advisers Core Multi-Manager Fund Class F | 268,916 | 79,191 | 66,506 | 880 | 285,209 |
| Strategic Advisers Emerging Markets Fund of Funds Class F | 148,282 | 40,542 | 29,429 | -- | 176,571 |
| Strategic Advisers Growth Multi-Manager Fund Class F | 224,397 | 69,016 | 57,726 | 664 | 239,093 |
| Strategic Advisers Income Opportunities Fund of Funds Class F | 56,162 | 8,620 | 11,445 | 1,600 | 57,217 |
| Strategic Advisers International Multi-Manager Fund Class F | 276,773 | 85,204 | 60,235 | -- | 317,993 |
| Strategic Advisers Small-Mid Cap Multi-Manager Fund Class F | 134,681 | 32,606 | 37,479 | -- | 143,411 |
| Strategic Advisers Value Multi-Manager Fund Class F | 268,637 | 74,762 | 66,823 | 1,865 | 284,967 |
| Total | $1,895,701 | $593,132 | $444,271 | $10,450 | $2,124,180 |
Investment Valuation
All investments are categorized as Level 1 under the Fair Value Hierarchy. The inputs or methodology used for valuing securities may not be an indication of the risk associated with investing in those securities. For more information on valuation inputs please refer to the Investment Valuation section in the accompanying Notes to Financial Statements.
See accompanying notes which are an integral part of the financial statements.
Fidelity® Multi-Manager 2025 Fund
Financial Statements
Statement of Assets and Liabilities
| September 30, 2016 (Unaudited) | ||
| Assets | ||
| Investment in securities, at value (cost $2,112,377) — See accompanying schedule | $2,124,180 | |
| Receivable for fund shares sold | 174,084 | |
| Receivable from investment adviser for expense reductions | 13 | |
| Total assets | 2,298,277 | |
| Liabilities | ||
| Payable for investments purchased | $174,089 | |
| Distribution and service plan fees payable | 22 | |
| Other affiliated payables | 169 | |
| Total liabilities | 174,280 | |
| Net Assets | $2,123,997 | |
| Net Assets consist of: | ||
| Paid in capital | $2,109,893 | |
| Undistributed net investment income | 9,048 | |
| Accumulated undistributed net realized gain (loss) on investments | (6,747) | |
| Net unrealized appreciation (depreciation) on investments | 11,803 | |
| Net Assets | $2,123,997 | |
| Multi-Manager 2025: | ||
| Net Asset Value, offering price and redemption price per share ($1,907,871 ÷ 174,175 shares) | $10.95 | |
| Class L: | ||
| Net Asset Value, offering price and redemption price per share ($108,445 ÷ 9,889 shares) | $10.97 | |
| Class N: | ||
| Net Asset Value, offering price and redemption price per share ($107,681 ÷ 9,833 shares) | $10.95 |
See accompanying notes which are an integral part of the financial statements.
Statement of Operations
| Six months ended September 30, 2016 (Unaudited) | ||
| Investment Income | ||
| Income distributions from underlying funds | $10,450 | |
| Expenses | ||
| Transfer agent fees | $1,005 | |
| Distribution and service plan fees | 131 | |
| Independent trustees' fees and expenses | 4 | |
| Total expenses before reductions | 1,140 | |
| Expense reductions | (73) | 1,067 |
| Net investment income (loss) | 9,383 | |
| Realized and Unrealized Gain (Loss) | ||
| Realized gain (loss) on sale of underlying fund shares | (29,158) | |
| Capital gain distributions from underlying funds | 32,882 | |
| Total net realized gain (loss) | 3,724 | |
| Change in net unrealized appreciation (depreciation) on underlying funds | 108,777 | |
| Net gain (loss) | 112,501 | |
| Net increase (decrease) in net assets resulting from operations | $121,884 |
See accompanying notes which are an integral part of the financial statements.
Statement of Changes in Net Assets
| Six months ended September 30, 2016 (Unaudited) | Year ended March 31, 2016 | |
| Increase (Decrease) in Net Assets | ||
| Operations | ||
| Net investment income (loss) | $9,383 | $21,004 |
| Net realized gain (loss) | 3,724 | 36,619 |
| Change in net unrealized appreciation (depreciation) | 108,777 | (102,762) |
| Net increase (decrease) in net assets resulting from operations | 121,884 | (45,139) |
| Distributions to shareholders from net investment income | (3,057) | (19,664) |
| Distributions to shareholders from net realized gain | (16,961) | (64,890) |
| Total distributions | (20,018) | (84,554) |
| Share transactions - net increase (decrease) | 126,603 | 870,589 |
| Total increase (decrease) in net assets | 228,469 | 740,896 |
| Net Assets | ||
| Beginning of period | 1,895,528 | 1,154,632 |
| End of period | $2,123,997 | $1,895,528 |
| Other Information | ||
| Undistributed net investment income end of period | $9,048 | $2,722 |
See accompanying notes which are an integral part of the financial statements.
Financial Highlights — Fidelity Multi-Manager 2025 Fund
| Six months ended (Unaudited) September 30, | Years ended March 31, | ||||
| 2016 | 2016 | 2015 | 2014 | 2013 A | |
| Selected Per–Share Data | |||||
| Net asset value, beginning of period | $10.43 | $11.40 | $11.37 | $10.48 | $10.00 |
| Income from Investment Operations | |||||
| Net investment income (loss)B | .05 | .15 | .19 | .16 | .06 |
| Net realized and unrealized gain (loss) | .59 | (.48) | .51 | 1.06 | .42 |
| Total from investment operations | .64 | (.33) | .70 | 1.22 | .48 |
| Distributions from net investment income | (.02) | (.13) | (.15) | (.15) | – |
| Distributions from net realized gain | (.10) | (.51) | (.52) | (.18) | – |
| Total distributions | (.12) | (.64) | (.67) | (.33) | – |
| Net asset value, end of period | $10.95 | $10.43 | $11.40 | $11.37 | $10.48 |
| Total ReturnC,D | 6.17% | (3.05)% | 6.37% | 11.77% | 4.80% |
| Ratios to Average Net AssetsE,F | |||||
| Expenses before reductions | .11%G | .11% | .12% | .12% | .21%G |
| Expenses net of fee waivers, if any | .10%G | .10% | .10% | .10% | .09%G |
| Expenses net of all reductions | .10%G | .10% | .10% | .10% | .09%G |
| Net investment income (loss) | 1.00%G | 1.37% | 1.67% | 1.49% | 2.08%G |
| Supplemental Data | |||||
| Net assets, end of period (000 omitted) | $1,908 | $1,682 | $934 | $347 | $105 |
| Portfolio turnover rateE | 45%G | 17% | 21% | 88% | 1%H |
A For the period December 20, 2012 (commencement of operations) to March 31, 2013.
B Calculated based on average shares outstanding during the period.
C Total returns for periods of less than one year are not annualized.
D Total returns would have been lower if certain expenses had not been reduced during the applicable periods shown.
E Amounts do not include the activity of the Underlying Funds.
F Expense ratios reflect operating expenses of the class. Expenses before reductions do not reflect amounts reimbursed by the investment adviser or reductions from expense offset arrangements and do not represent the amount paid by the class during periods when reimbursements or reductions occur. Expense ratios before reductions for start-up periods may not be representative of longer-term operating periods. Expenses net of fee waivers reflect expenses after reimbursement by the investment adviser but prior to reductions from expense offset arrangements. Expenses net of all reductions represent the net expenses paid by the class but do not include expenses of the underlying funds in which the Fund invests.
G Annualized
H Amount not annualized.
See accompanying notes which are an integral part of the financial statements.
Financial Highlights — Fidelity Multi-Manager 2025 Fund Class L
| Six months ended (Unaudited) September 30, | Years ended March 31, | |||
| 2016 | 2016 | 2015 | 2014 A | |
| Selected Per–Share Data | ||||
| Net asset value, beginning of period | $10.44 | $11.41 | $11.37 | $11.14 |
| Income from Investment Operations | ||||
| Net investment income (loss)B | .05 | .15 | .19 | .08 |
| Net realized and unrealized gain (loss) | .60 | (.48) | .52 | .36 |
| Total from investment operations | .65 | (.33) | .71 | .44 |
| Distributions from net investment income | (.02) | (.13) | (.15) | (.09) |
| Distributions from net realized gain | (.10) | (.51) | (.52) | (.12) |
| Total distributions | (.12) | (.64) | (.67) | (.21) |
| Net asset value, end of period | $10.97 | $10.44 | $11.41 | $11.37 |
| Total ReturnC,D | 6.26% | (3.05)% | 6.41% | 3.96% |
| Ratios to Average Net AssetsE,F | ||||
| Expenses before reductions | .08%G | .09% | .11% | .11%G |
| Expenses net of fee waivers, if any | .08%G | .09% | .10% | .10%G |
| Expenses net of all reductions | .08%G | .09% | .10% | .10%G |
| Net investment income (loss) | 1.01%G | 1.38% | 1.67% | 2.19%G |
| Supplemental Data | ||||
| Net assets, end of period (000 omitted) | $108 | $107 | $111 | $104 |
| Portfolio turnover rateE | 45%G | 17% | 21% | 88% |
A For the period December 4, 2013 (commencement of sale of shares) to March 31, 2014.
B Calculated based on average shares outstanding during the period.
C Total returns for periods of less than one year are not annualized.
D Total returns would have been lower if certain expenses had not been reduced during the applicable periods shown.
E Amounts do not include the activity of the Underlying Funds.
F Expense ratios reflect operating expenses of the class. Expenses before reductions do not reflect amounts reimbursed by the investment adviser or reductions from expense offset arrangements and do not represent the amount paid by the class during periods when reimbursements or reductions occur. Expenses net of fee waivers reflect expenses after reimbursement by the investment adviser but prior to reductions from expense offset arrangements. Expenses net of all reductions represent the net expenses paid by the class but do not include expenses of the underlying funds in which the Fund invests.
G Annualized
See accompanying notes which are an integral part of the financial statements.
Financial Highlights — Fidelity Multi-Manager 2025 Fund Class N
| Six months ended (Unaudited) September 30, | Years ended March 31, | |||
| 2016 | 2016 | 2015 | 2014 A | |
| Selected Per–Share Data | ||||
| Net asset value, beginning of period | $10.43 | $11.40 | $11.37 | $11.14 |
| Income from Investment Operations | ||||
| Net investment income (loss)B | .04 | .12 | .16 | .07 |
| Net realized and unrealized gain (loss) | .59 | (.48) | .51 | .37 |
| Total from investment operations | .63 | (.36) | .67 | .44 |
| Distributions from net investment income | (.01) | (.10) | (.12) | (.09) |
| Distributions from net realized gain | (.10) | (.51) | (.52) | (.12) |
| Total distributions | (.11) | (.61) | (.64) | (.21) |
| Net asset value, end of period | $10.95 | $10.43 | $11.40 | $11.37 |
| Total ReturnC,D | 6.11% | (3.31)% | 6.07% | 3.94% |
| Ratios to Average Net AssetsE,F | ||||
| Expenses before reductions | .33%G | .34% | .36% | .37%G |
| Expenses net of fee waivers, if any | .33%G | .34% | .35% | .35%G |
| Expenses net of all reductions | .33%G | .34% | .35% | .35%G |
| Net investment income (loss) | .76%G | 1.13% | 1.42% | 1.94%G |
| Supplemental Data | ||||
| Net assets, end of period (000 omitted) | $108 | $107 | $110 | $104 |
| Portfolio turnover rateE | 45%G | 17% | 21% | 88% |
A For the period December 4, 2013 (commencement of sale of shares) to March 31, 2014.
B Calculated based on average shares outstanding during the period.
C Total returns for periods of less than one year are not annualized.
D Total returns would have been lower if certain expenses had not been reduced during the applicable periods shown.
E Amounts do not include the activity of the Underlying Funds.
F Expense ratios reflect operating expenses of the class. Expenses before reductions do not reflect amounts reimbursed by the investment adviser or reductions from expense offset arrangements and do not represent the amount paid by the class during periods when reimbursements or reductions occur. Expenses net of fee waivers reflect expenses after reimbursement by the investment adviser but prior to reductions from expense offset arrangements. Expenses net of all reductions represent the net expenses paid by the class but do not include expenses of the underlying funds in which the Fund invests.
G Annualized
See accompanying notes which are an integral part of the financial statements.
Fidelity® Multi-Manager 2030 Fund
Investment Summary (Unaudited)
The information in the following tables is based on the direct investments of the Fund.Top Holdings as of September 30, 2016
| % of fund's net assets | % of fund's net assets 6 months ago | |
| Strategic Advisers International Multi-Manager Fund Class F | 18.3 | 18.0 |
| Strategic Advisers Core Multi-Manager Fund Class F | 16.6 | 17.2 |
| Strategic Advisers Value Multi-Manager Fund Class F | 16.5 | 17.2 |
| Strategic Advisers Growth Multi-Manager Fund Class F | 13.9 | 14.4 |
| Strategic Advisers Core Income Multi-Manager Fund Class F | 10.6 | 9.6 |
| Strategic Advisers Emerging Markets Fund of Funds Class F | 9.4 | 8.8 |
| Strategic Advisers Small-Mid Cap Multi-Manager Fund Class F | 8.3 | 8.6 |
| Strategic Advisers Income Opportunities Fund of Funds Class F | 2.8 | 3.0 |
| Fidelity Series Commodity Strategy Fund Class F | 1.6 | 1.3 |
| Fidelity Series Emerging Markets Debt Fund Class F | 0.7 | 0.6 |
| 98.7 | 98.7 |
Asset Allocation (% of fund's net assets)
| Period end | ||
| Domestic Equity Funds | 56.9% | |
| International Equity Funds | 27.7% | |
| Bond Funds | 15.4% | |

| Six months ago | ||
| Domestic Equity Funds | 58.7% | |
| International Equity Funds | 26.8% | |
| Bond Funds | 14.4% | |
| Short-Term Funds | 0.1% | |

Domestic Equity Funds category includes Fidelity Series Commodity Strategy Fund which invests in commodity-related investments.
Fidelity® Multi-Manager 2030 Fund
Investments September 30, 2016 (Unaudited)
Showing Percentage of Net Assets
| Domestic Equity Funds - 56.9% | |||
| Shares | Value | ||
| Fidelity Series Commodity Strategy Fund Class F (a)(b) | 5,244 | $28,054 | |
| Strategic Advisers Core Multi-Manager Fund Class F (b) | 24,208 | 288,803 | |
| Strategic Advisers Growth Multi-Manager Fund Class F (b) | 18,510 | 242,295 | |
| Strategic Advisers Small-Mid Cap Multi-Manager Fund Class F (b) | 13,446 | 145,487 | |
| Strategic Advisers Value Multi-Manager Fund Class F (b) | 21,184 | 288,520 | |
| TOTAL DOMESTIC EQUITY FUNDS | |||
| (Cost $1,005,250) | 993,159 | ||
| International Equity Funds - 27.7% | |||
| Strategic Advisers Emerging Markets Fund of Funds Class F (b) | 17,457 | 163,925 | |
| Strategic Advisers International Multi-Manager Fund Class F (b) | 27,818 | 320,463 | |
| TOTAL INTERNATIONAL EQUITY FUNDS | |||
| (Cost $483,701) | 484,388 | ||
| Bond Funds - 15.4% | |||
| Fidelity Series Emerging Markets Debt Fund Class F (b) | 1,102 | 11,422 | |
| Fidelity Series Floating Rate High Income Fund Class F (b) | 463 | 4,358 | |
| Fidelity Series Inflation-Protected Bond Index Fund Class F (b) | 1,031 | 10,391 | |
| Fidelity Series Real Estate Income Fund Class F (b) | 752 | 8,435 | |
| Strategic Advisers Core Income Multi-Manager Fund Class F (b) | 18,316 | 185,354 | |
| Strategic Advisers Income Opportunities Fund of Funds Class F (b) | 4,885 | 48,361 | |
| TOTAL BOND FUNDS | |||
| (Cost $263,817) | 268,321 | ||
| Short-Term Funds - 0.0% | |||
| Fidelity Investments Money Market Government Portfolio Institutional Class 0.31% (b)(c) | 558 | 558 | |
| Fidelity Series Short-Term Credit Fund Class F (b) | 30 | 300 | |
| TOTAL SHORT-TERM FUNDS | |||
| (Cost $857) | 858 | ||
| TOTAL INVESTMENT PORTFOLIO - 100.0% | |||
| (Cost $1,753,625) | 1,746,726 | ||
| NET OTHER ASSETS (LIABILITIES) - 0.0% | (157) | ||
| NET ASSETS - 100% | $1,746,569 |
Legend
(a) Non-income producing
(b) Affiliated Fund
(c) The rate quoted is the annualized seven-day yield of the fund at period end.
Affiliated Underlying Funds
Information regarding the Fund's fiscal year to date purchases and sales of the affiliated Underlying Funds and income earned by the Fund from investments in affiliated Underlying Funds is as follows:
| Affiliate | Value, beginning of period | Purchases | Sales Proceeds | Dividend Income | Value, end of period |
| Fidelity Investments Money Market Government Portfolio Institutional Class 0.31% | $479 | $137 | $58 | $-- | $558 |
| Fidelity Series Commodity Strategy Fund Class F | 18,828 | 14,321 | 6,660 | -- | 28,054 |
| Fidelity Series Emerging Markets Debt Fund Class F | 9,206 | 2,292 | 987 | 290 | 11,422 |
| Fidelity Series Floating Rate High Income Fund Class F | 3,660 | 925 | 411 | 91 | 4,358 |
| Fidelity Series Inflation-Protected Bond Index Fund Class F | 7,578 | 3,704 | 1,072 | 10 | 10,391 |
| Fidelity Series Real Estate Income Fund Class F | 7,102 | 2,099 | 988 | 210 | 8,435 |
| Fidelity Series Short-Term Credit Fund Class F | 255 | 90 | 46 | 2 | 300 |
| Strategic Advisers Core Income Multi-Manager Fund Class F | 141,028 | 57,116 | 16,854 | 1,875 | 185,354 |
| Strategic Advisers Core Multi-Manager Fund Class F | 253,389 | 68,322 | 34,230 | 937 | 288,803 |
| Strategic Advisers Emerging Markets Fund of Funds Class F | 129,851 | 32,064 | 14,473 | -- | 163,925 |
| Strategic Advisers Growth Multi-Manager Fund Class F | 211,438 | 58,821 | 29,819 | 707 | 242,295 |
| Strategic Advisers Income Opportunities Fund of Funds Class F | 43,810 | 6,259 | 4,702 | 1,280 | 48,361 |
| Strategic Advisers International Multi-Manager Fund Class F | 264,490 | 75,285 | 34,636 | -- | 320,463 |
| Strategic Advisers Small-Mid Cap Multi-Manager Fund Class F | 126,904 | 25,683 | 19,844 | -- | 145,487 |
| Strategic Advisers Value Multi-Manager Fund Class F | 253,127 | 62,625 | 33,368 | 1,983 | 288,520 |
| Total | $1,471,145 | $409,743 | $198,148 | $7,385 | $1,746,726 |
Investment Valuation
All investments are categorized as Level 1 under the Fair Value Hierarchy. The inputs or methodology used for valuing securities may not be an indication of the risk associated with investing in those securities. For more information on valuation inputs please refer to the Investment Valuation section in the accompanying Notes to Financial Statements.
See accompanying notes which are an integral part of the financial statements.
Fidelity® Multi-Manager 2030 Fund
Financial Statements
Statement of Assets and Liabilities
| September 30, 2016 (Unaudited) | ||
| Assets | ||
| Investment in securities, at value (cost $1,753,625) — See accompanying schedule | $1,746,726 | |
| Receivable for investments sold | 3,995 | |
| Receivable for fund shares sold | 4,438 | |
| Receivable from investment adviser for expense reductions | 23 | |
| Total assets | 1,755,182 | |
| Liabilities | ||
| Payable for investments purchased | $8,432 | |
| Distribution and service plan fees payable | 22 | |
| Other affiliated payables | 159 | |
| Total liabilities | 8,613 | |
| Net Assets | $1,746,569 | |
| Net Assets consist of: | ||
| Paid in capital | $1,751,683 | |
| Undistributed net investment income | 6,235 | |
| Accumulated undistributed net realized gain (loss) on investments | (4,450) | |
| Net unrealized appreciation (depreciation) on investments | (6,899) | |
| Net Assets | $1,746,569 | |
| Multi-Manager 2030: | ||
| Net Asset Value, offering price and redemption price per share ($1,529,558 ÷ 141,989 shares) | $10.77 | |
| Class L: | ||
| Net Asset Value, offering price and redemption price per share ($108,890 ÷ 10,111 shares) | $10.77 | |
| Class N: | ||
| Net Asset Value, offering price and redemption price per share ($108,121 ÷ 10,055 shares) | $10.75 |
See accompanying notes which are an integral part of the financial statements.
Statement of Operations
| Six months ended September 30, 2016 (Unaudited) | ||
| Investment Income | ||
| Income distributions from underlying funds | $7,385 | |
| Expenses | ||
| Transfer agent fees | $917 | |
| Distribution and service plan fees | 131 | |
| Independent trustees' fees and expenses | 3 | |
| Total expenses before reductions | 1,051 | |
| Expense reductions | (121) | 930 |
| Net investment income (loss) | 6,455 | |
| Realized and Unrealized Gain (Loss) | ||
| Realized gain (loss) on sale of underlying fund shares | (9,583) | |
| Capital gain distributions from underlying funds | 34,963 | |
| Total net realized gain (loss) | 25,380 | |
| Change in net unrealized appreciation (depreciation) on underlying funds | 73,570 | |
| Net gain (loss) | 98,950 | |
| Net increase (decrease) in net assets resulting from operations | $105,405 |
See accompanying notes which are an integral part of the financial statements.
Statement of Changes in Net Assets
| Six months ended September 30, 2016 (Unaudited) | Year ended March 31, 2016 | |
| Increase (Decrease) in Net Assets | ||
| Operations | ||
| Net investment income (loss) | $6,455 | $15,279 |
| Net realized gain (loss) | 25,380 | 9,998 |
| Change in net unrealized appreciation (depreciation) | 73,570 | (59,522) |
| Net increase (decrease) in net assets resulting from operations | 105,405 | (34,245) |
| Distributions to shareholders from net investment income | (1,210) | (14,250) |
| Distributions to shareholders from net realized gain | – | (83,657) |
| Total distributions | (1,210) | (97,907) |
| Share transactions - net increase (decrease) | 171,357 | 179,577 |
| Total increase (decrease) in net assets | 275,552 | 47,425 |
| Net Assets | ||
| Beginning of period | 1,471,017 | 1,423,592 |
| End of period | $1,746,569 | $1,471,017 |
| Other Information | ||
| Undistributed net investment income end of period | $6,235 | $990 |
See accompanying notes which are an integral part of the financial statements.
Financial Highlights — Fidelity Multi-Manager 2030 Fund
| Six months ended (Unaudited) September 30, | Years ended March 31, | ||||
| 2016 | 2016 | 2015 | 2014 | 2013 A | |
| Selected Per–Share Data | |||||
| Net asset value, beginning of period | $10.09 | $11.31 | $11.52 | $10.50 | $10.00 |
| Income from Investment Operations | |||||
| Net investment income (loss)B | .04 | .11 | .15 | .19 | .06 |
| Net realized and unrealized gain (loss) | .65 | (.52) | .59 | 1.14 | .44 |
| Total from investment operations | .69 | (.41) | .74 | 1.33 | .50 |
| Distributions from net investment income | (.01) | (.12) | (.16) | (.14) | – |
| Distributions from net realized gain | – | (.68) | (.79) | (.17) | – |
| Total distributions | (.01) | (.81)C | (.95) | (.31) | – |
| Net asset value, end of period | $10.77 | $10.09 | $11.31 | $11.52 | $10.50 |
| Total ReturnD,E | 6.83% | (3.92)% | 6.71% | 12.76% | 5.00% |
| Ratios to Average Net AssetsF,G | |||||
| Expenses before reductions | .12%H | .12% | .11% | .13% | .21%H |
| Expenses net of fee waivers, if any | .10%H | .10% | .10% | .10% | .09%H |
| Expenses net of all reductions | .10%H | .10% | .10% | .10% | .09%H |
| Net investment income (loss) | .81%H | 1.08% | 1.34% | 1.74% | 2.14%H |
| Supplemental Data | |||||
| Net assets, end of period (000 omitted) | $1,530 | $1,257 | $1,201 | $801 | $105 |
| Portfolio turnover rateF | 25%H | 54% | 27% | 63% | 1%I |
A For the period December 20, 2012 (commencement of operations) to March 31, 2013.
B Calculated based on average shares outstanding during the period.
C Total distributions of $.81 per share is comprised of distributions from net investment income of $.122 and distributions from net realized gain of $.684 per share.
D Total returns for periods of less than one year are not annualized.
E Total returns would have been lower if certain expenses had not been reduced during the applicable periods shown.
F Amounts do not include the activity of the Underlying Funds.
G Expense ratios reflect operating expenses of the class. Expenses before reductions do not reflect amounts reimbursed by the investment adviser or reductions from expense offset arrangements and do not represent the amount paid by the class during periods when reimbursements or reductions occur. Expense ratios before reductions for start-up periods may not be representative of longer-term operating periods. Expenses net of fee waivers reflect expenses after reimbursement by the investment adviser but prior to reductions from expense offset arrangements. Expenses net of all reductions represent the net expenses paid by the class but do not include expenses of the underlying funds in which the Fund invests.
H Annualized
I Amount not annualized.
See accompanying notes which are an integral part of the financial statements.
Financial Highlights — Fidelity Multi-Manager 2030 Fund Class L
| Six months ended (Unaudited) September 30, | Years ended March 31, | |||
| 2016 | 2016 | 2015 | 2014 A | |
| Selected Per–Share Data | ||||
| Net asset value, beginning of period | $10.09 | $11.31 | $11.51 | $11.22 |
| Income from Investment Operations | ||||
| Net investment income (loss)B | .04 | .11 | .15 | .08 |
| Net realized and unrealized gain (loss) | .65 | (.52) | .60 | .40 |
| Total from investment operations | .69 | (.41) | .75 | .48 |
| Distributions from net investment income | (.01) | (.12) | (.16) | (.08) |
| Distributions from net realized gain | – | (.68) | (.79) | (.11) |
| Total distributions | (.01) | (.81)C | (.95) | (.19) |
| Net asset value, end of period | $10.77 | $10.09 | $11.31 | $11.51 |
| Total ReturnD,E | 6.83% | (3.90)% | 6.80% | 4.32% |
| Ratios to Average Net AssetsF,G | ||||
| Expenses before reductions | .09%H | .10% | .11% | .11%H |
| Expenses net of fee waivers, if any | .09%H | .10% | .10% | .10%H |
| Expenses net of all reductions | .09%H | .10% | .10% | .10%H |
| Net investment income (loss) | .82%H | 1.08% | 1.34% | 2.25%H |
| Supplemental Data | ||||
| Net assets, end of period (000 omitted) | $109 | $107 | $111 | $104 |
| Portfolio turnover rateF | 25%H | 54% | 27% | 63% |
A For the period December 4, 2013 (commencement of sale of shares) to March 31, 2014.
B Calculated based on average shares outstanding during the period.
C Total distributions of $.81 per share is comprised of distributions from net investment income of $.124 and distributions from net realized gain of $.684 per share.
D Total returns for periods of less than one year are not annualized.
E Total returns would have been lower if certain expenses had not been reduced during the applicable periods shown.
F Amounts do not include the activity of the Underlying Funds.
G Expense ratios reflect operating expenses of the class. Expenses before reductions do not reflect amounts reimbursed by the investment adviser or reductions from expense offset arrangements and do not represent the amount paid by the class during periods when reimbursements or reductions occur. Expenses net of fee waivers reflect expenses after reimbursement by the investment adviser but prior to reductions from expense offset arrangements. Expenses net of all reductions represent the net expenses paid by the class but do not include expenses of the underlying funds in which the Fund invests.
H Annualized
See accompanying notes which are an integral part of the financial statements.
Financial Highlights — Fidelity Multi-Manager 2030 Fund Class N
| Six months ended (Unaudited) September 30, | Years ended March 31, | |||
| 2016 | 2016 | 2015 | 2014 A | |
| Selected Per–Share Data | ||||
| Net asset value, beginning of period | $10.08 | $11.30 | $11.51 | $11.22 |
| Income from Investment Operations | ||||
| Net investment income (loss)B | .03 | .09 | .13 | .07 |
| Net realized and unrealized gain (loss) | .64 | (.53) | .58 | .41 |
| Total from investment operations | .67 | (.44) | .71 | .48 |
| Distributions from net investment income | –C | (.10) | (.13) | (.08) |
| Distributions from net realized gain | – | (.68) | (.79) | (.11) |
| Total distributions | –C | (.78) | (.92) | (.19) |
| Net asset value, end of period | $10.75 | $10.08 | $11.30 | $11.51 |
| Total ReturnD,E | 6.68% | (4.12)% | 6.44% | 4.30% |
| Ratios to Average Net AssetsF,G | ||||
| Expenses before reductions | .34%H | .35% | .36% | .37%H |
| Expenses net of fee waivers, if any | .34%H | .35% | .35% | .35%H |
| Expenses net of all reductions | .34%H | .35% | .35% | .35%H |
| Net investment income (loss) | .57%H | .83% | 1.09% | 2.00%H |
| Supplemental Data | ||||
| Net assets, end of period (000 omitted) | $108 | $106 | $111 | $104 |
| Portfolio turnover rateF | 25%H | 54% | 27% | 63% |
A For the period December 4, 2013 (commencement of sale of shares) to March 31, 2014.
B Calculated based on average shares outstanding during the period.
C Amount represents less than $.005 per share.
D Total returns for periods of less than one year are not annualized.
E Total returns would have been lower if certain expenses had not been reduced during the applicable periods shown.
F Amounts do not include the activity of the Underlying Funds.
G Expense ratios reflect operating expenses of the class. Expenses before reductions do not reflect amounts reimbursed by the investment adviser or reductions from expense offset arrangements and do not represent the amount paid by the class during periods when reimbursements or reductions occur. Expenses net of fee waivers reflect expenses after reimbursement by the investment adviser but prior to reductions from expense offset arrangements. Expenses net of all reductions represent the net expenses paid by the class but do not include expenses of the underlying funds in which the Fund invests.
H Annualized
See accompanying notes which are an integral part of the financial statements.
Fidelity® Multi-Manager 2035 Fund
Investment Summary (Unaudited)
The information in the following tables is based on the direct investments of the Fund.Top Holdings as of September 30, 2016
| % of fund's net assets | % of fund's net assets 6 months ago | |
| Strategic Advisers International Multi-Manager Fund Class F | 20.7 | 20.1 |
| Strategic Advisers Core Multi-Manager Fund Class F | 18.6 | 19.1 |
| Strategic Advisers Value Multi-Manager Fund Class F | 18.6 | 19.1 |
| Strategic Advisers Growth Multi-Manager Fund Class F | 15.7 | 16.0 |
| Strategic Advisers Emerging Markets Fund of Funds Class F | 10.0 | 9.4 |
| Strategic Advisers Small-Mid Cap Multi-Manager Fund Class F | 9.4 | 9.6 |
| Strategic Advisers Income Opportunities Fund of Funds Class F | 2.8 | 2.9 |
| Fidelity Series Commodity Strategy Fund Class F | 1.7 | 1.3 |
| Fidelity Series Emerging Markets Debt Fund Class F | 0.7 | 0.6 |
| Fidelity Series Inflation-Protected Bond Index Fund Class F | 0.6 | 0.5 |
| 98.8 | 98.6 |
Asset Allocation (% of fund's net assets)
| Period end | ||
| Domestic Equity Funds | 64.0% | |
| International Equity Funds | 30.7% | |
| Bond Funds | 5.3% | |

| Six months ago | ||
| Domestic Equity Funds | 65.1% | |
| International Equity Funds | 29.5% | |
| Bond Funds | 5.3% | |
| Short-Term Funds | 0.1% | |

Domestic Equity Funds category includes Fidelity Series Commodity Strategy Fund which invests in commodity-related investments.
Fidelity® Multi-Manager 2035 Fund
Investments September 30, 2016 (Unaudited)
Showing Percentage of Net Assets
| Domestic Equity Funds - 64.0% | |||
| Shares | Value | ||
| Fidelity Series Commodity Strategy Fund Class F (a)(b) | 5,939 | $31,772 | |
| Strategic Advisers Core Multi-Manager Fund Class F (b) | 29,300 | 349,551 | |
| Strategic Advisers Growth Multi-Manager Fund Class F (b) | 22,412 | 293,368 | |
| Strategic Advisers Small-Mid Cap Multi-Manager Fund Class F (b) | 16,271 | 176,056 | |
| Strategic Advisers Value Multi-Manager Fund Class F (b) | 25,650 | 349,352 | |
| TOTAL DOMESTIC EQUITY FUNDS | |||
| (Cost $1,223,360) | 1,200,099 | ||
| International Equity Funds - 30.7% | |||
| Strategic Advisers Emerging Markets Fund of Funds Class F (b) | 19,973 | 187,548 | |
| Strategic Advisers International Multi-Manager Fund Class F (b) | 33,714 | 388,378 | |
| TOTAL INTERNATIONAL EQUITY FUNDS | |||
| (Cost $569,967) | 575,926 | ||
| Bond Funds - 5.3% | |||
| Fidelity Series Emerging Markets Debt Fund Class F (b) | 1,198 | 12,410 | |
| Fidelity Series Floating Rate High Income Fund Class F (b) | 497 | 4,681 | |
| Fidelity Series Inflation-Protected Bond Index Fund Class F (b) | 1,106 | 11,151 | |
| Fidelity Series Real Estate Income Fund Class F (b) | 816 | 9,159 | |
| Strategic Advisers Core Income Multi-Manager Fund Class F (b) | 900 | 9,112 | |
| Strategic Advisers Income Opportunities Fund of Funds Class F (b) | 5,349 | 52,954 | |
| TOTAL BOND FUNDS | |||
| (Cost $98,984) | 99,467 | ||
| Short-Term Funds - 0.0% | |||
| Fidelity Investments Money Market Government Portfolio Institutional Class 0.31% (b)(c) | 598 | 598 | |
| Fidelity Series Short-Term Credit Fund Class F (b) | 32 | 323 | |
| TOTAL SHORT-TERM FUNDS | |||
| (Cost $920) | 921 | ||
| TOTAL INVESTMENT PORTFOLIO - 100.0% | |||
| (Cost $1,893,231) | 1,876,413 | ||
| NET OTHER ASSETS (LIABILITIES) - 0.0% | (164) | ||
| NET ASSETS - 100% | $1,876,249 |
Legend
(a) Non-income producing
(b) Affiliated Fund
(c) The rate quoted is the annualized seven-day yield of the fund at period end.
Affiliated Underlying Funds
Information regarding the Fund's fiscal year to date purchases and sales of the affiliated Underlying Funds and income earned by the Fund from investments in affiliated Underlying Funds is as follows:
| Affiliate | Value, beginning of period | Purchases | Sales Proceeds | Dividend Income | Value, end of period |
| Fidelity Investments Money Market Government Portfolio Institutional Class 0.31% | $574 | $136 | $111 | $-- | $598 |
| Fidelity Series Commodity Strategy Fund Class F | 23,073 | 11,840 | 4,980 | -- | 31,772 |
| Fidelity Series Emerging Markets Debt Fund Class F | 11,299 | 2,129 | 2,040 | 328 | 12,410 |
| Fidelity Series Floating Rate High Income Fund Class F | 4,467 | 851 | 850 | 101 | 4,681 |
| Fidelity Series Inflation-Protected Bond Index Fund Class F | 9,257 | 3,698 | 2,001 | 11 | 11,151 |
| Fidelity Series Real Estate Income Fund Class F | 8,740 | 1,984 | 1,828 | 230 | 9,159 |
| Fidelity Series Short-Term Credit Fund Class F | 287 | 108 | 73 | 2 | 323 |
| Strategic Advisers Core Income Multi-Manager Fund Class F | 8,995 | 3,222 | 3,338 | 102 | 9,112 |
| Strategic Advisers Core Multi-Manager Fund Class F | 343,740 | 70,059 | 67,266 | 1,084 | 349,551 |
| Strategic Advisers Emerging Markets Fund of Funds Class F | 168,959 | 32,634 | 32,211 | -- | 187,548 |
| Strategic Advisers Growth Multi-Manager Fund Class F | 286,826 | 60,653 | 56,948 | 818 | 293,368 |
| Strategic Advisers Income Opportunities Fund of Funds Class F | 52,943 | 6,615 | 10,002 | 1,465 | 52,954 |
| Strategic Advisers International Multi-Manager Fund Class F | 361,510 | 81,299 | 72,152 | -- | 388,378 |
| Strategic Advisers Small-Mid Cap Multi-Manager Fund Class F | 172,149 | 24,182 | 36,071 | -- | 176,056 |
| Strategic Advisers Value Multi-Manager Fund Class F | 343,389 | 62,367 | 64,935 | 2,293 | 349,352 |
| Total | $1,796,208 | $361,777 | $354,806 | $6,434 | $1,876,413 |
Investment Valuation
All investments are categorized as Level 1 under the Fair Value Hierarchy. The inputs or methodology used for valuing securities may not be an indication of the risk associated with investing in those securities. For more information on valuation inputs please refer to the Investment Valuation section in the accompanying Notes to Financial Statements.
See accompanying notes which are an integral part of the financial statements.
Fidelity® Multi-Manager 2035 Fund
Financial Statements
Statement of Assets and Liabilities
| September 30, 2016 (Unaudited) | ||
| Assets | ||
| Investment in securities, at value (cost $1,893,231) — See accompanying schedule | $1,876,413 | |
| Receivable for investments sold | 2,010 | |
| Receivable for fund shares sold | 12,362 | |
| Receivable from investment adviser for expense reductions | 77 | |
| Total assets | 1,890,862 | |
| Liabilities | ||
| Payable for investments purchased | $14,371 | |
| Distribution and service plan fees payable | 22 | |
| Other affiliated payables | 220 | |
| Total liabilities | 14,613 | |
| Net Assets | $1,876,249 | |
| Net Assets consist of: | ||
| Paid in capital | $1,885,231 | |
| Undistributed net investment income | 5,472 | |
| Accumulated undistributed net realized gain (loss) on investments | 2,364 | |
| Net unrealized appreciation (depreciation) on investments | (16,818) | |
| Net Assets | $1,876,249 | |
| Multi-Manager 2035: | ||
| Net Asset Value, offering price and redemption price per share ($1,659,137 ÷ 150,503 shares) | $11.02 | |
| Class L: | ||
| Net Asset Value, offering price and redemption price per share ($108,939 ÷ 9,880 shares) | $11.03 | |
| Class N: | ||
| Net Asset Value, offering price and redemption price per share ($108,173 ÷ 9,829 shares) | $11.01 |
See accompanying notes which are an integral part of the financial statements.
Statement of Operations
| Six months ended September 30, 2016 (Unaudited) | ||
| Investment Income | ||
| Income distributions from underlying funds | $6,434 | |
| Expenses | ||
| Transfer agent fees | $1,320 | |
| Distribution and service plan fees | 131 | |
| Independent trustees' fees and expenses | 4 | |
| Total expenses before reductions | 1,455 | |
| Expense reductions | (426) | 1,029 |
| Net investment income (loss) | 5,405 | |
| Realized and Unrealized Gain (Loss) | ||
| Realized gain (loss) on sale of underlying fund shares | (22,426) | |
| Capital gain distributions from underlying funds | 40,431 | |
| Total net realized gain (loss) | 18,005 | |
| Change in net unrealized appreciation (depreciation) on underlying funds | 95,658 | |
| Net gain (loss) | 113,663 | |
| Net increase (decrease) in net assets resulting from operations | $119,068 |
See accompanying notes which are an integral part of the financial statements.
Statement of Changes in Net Assets
| Six months ended September 30, 2016 (Unaudited) | Year ended March 31, 2016 | |
| Increase (Decrease) in Net Assets | ||
| Operations | ||
| Net investment income (loss) | $5,405 | $14,634 |
| Net realized gain (loss) | 18,005 | 42,042 |
| Change in net unrealized appreciation (depreciation) | 95,658 | (101,836) |
| Net increase (decrease) in net assets resulting from operations | 119,068 | (45,160) |
| Distributions to shareholders from net investment income | (476) | (14,091) |
| Distributions to shareholders from net realized gain | (22,028) | (77,195) |
| Total distributions | (22,504) | (91,286) |
| Share transactions - net increase (decrease) | (16,373) | 736,362 |
| Total increase (decrease) in net assets | 80,191 | 599,916 |
| Net Assets | ||
| Beginning of period | 1,796,058 | 1,196,142 |
| End of period | $1,876,249 | $1,796,058 |
| Other Information | ||
| Undistributed net investment income end of period | $5,472 | $543 |
See accompanying notes which are an integral part of the financial statements.
Financial Highlights — Fidelity Multi-Manager 2035 Fund
| Six months ended (Unaudited) September 30, | Years ended March 31, | ||||
| 2016 | 2016 | 2015 | 2014 | 2013 A | |
| Selected Per–Share Data | |||||
| Net asset value, beginning of period | $10.42 | $11.65 | $11.75 | $10.56 | $10.00 |
| Income from Investment Operations | |||||
| Net investment income (loss)B | .03 | .11 | .15 | .15 | .05 |
| Net realized and unrealized gain (loss) | .70 | (.59) | .64 | 1.36 | .51 |
| Total from investment operations | .73 | (.48) | .79 | 1.51 | .56 |
| Distributions from net investment income | –C | (.10) | (.15) | (.14) | – |
| Distributions from net realized gain | (.13) | (.64) | (.75) | (.18) | – |
| Total distributions | (.13) | (.75)D | (.89)E | (.32) | – |
| Net asset value, end of period | $11.02 | $10.42 | $11.65 | $11.75 | $10.56 |
| Total ReturnF,G | 7.14% | (4.45)% | 6.95% | 14.45% | 5.60% |
| Ratios to Average Net AssetsH,I | |||||
| Expenses before reductions | .15%J | .16% | .18% | .17% | .20%J |
| Expenses net of fee waivers, if any | .10%J | .10% | .10% | .10% | .10%J |
| Expenses net of all reductions | .10%J | .10% | .10% | .10% | .10%J |
| Net investment income (loss) | .61%J | 1.07% | 1.25% | 1.36% | 1.84%J |
| Supplemental Data | |||||
| Net assets, end of period (000 omitted) | $1,659 | $1,583 | $973 | $412 | $127 |
| Portfolio turnover rateI | 39%J | 18% | 11% | 32% | 1%K |
A For the period December 20, 2012 (commencement of operations) to March 31, 2013.
B Calculated based on average shares outstanding during the period.
C Amount represents less than $.005 per share.
D Total distributions of $.75 per share is comprised of distributions from net investment income of $.103 and distributions from net realized gain of $.643 per share.
E Total distributions of $.89 per share is comprised of distributions from net investment income of $.145 and distributions from net realized gain of $.745 per share.
F Total returns for periods of less than one year are not annualized.
G Total returns would have been lower if certain expenses had not been reduced during the applicable periods shown.
H Expense ratios reflect operating expenses of the class. Expenses before reductions do not reflect amounts reimbursed by the investment adviser or reductions from expense offset arrangements and do not represent the amount paid by the class during periods when reimbursements or reductions occur. Expense ratios before reductions for start-up periods may not be representative of longer-term operating periods. Expenses net of fee waivers reflect expenses after reimbursement by the investment adviser but prior to reductions from expense offset arrangements. Expenses net of all reductions represent the net expenses paid by the class but do not include expenses of the underlying funds in which the Fund invests.
I Amounts do not include the activity of the Underlying Funds.
J Annualized
K Amount not annualized.
See accompanying notes which are an integral part of the financial statements.
Financial Highlights — Fidelity Multi-Manager 2035 Fund Class L
| Six months ended (Unaudited) September 30, | Years ended March 31, | |||
| 2016 | 2016 | 2015 | 2014 A | |
| Selected Per–Share Data | ||||
| Net asset value, beginning of period | $10.43 | $11.65 | $11.75 | $11.47 |
| Income from Investment Operations | ||||
| Net investment income (loss)B | .03 | .12 | .15 | .08 |
| Net realized and unrealized gain (loss) | .70 | (.59) | .64 | .43 |
| Total from investment operations | .73 | (.47) | .79 | .51 |
| Distributions from net investment income | –C | (.10) | (.14) | (.09) |
| Distributions from net realized gain | (.13) | (.64) | (.75) | (.14) |
| Total distributions | (.13) | (.75)D | (.89) | (.23) |
| Net asset value, end of period | $11.03 | $10.43 | $11.65 | $11.75 |
| Total ReturnE,F | 7.14% | (4.36)% | 6.94% | 4.50% |
| Ratios to Average Net AssetsG,H | ||||
| Expenses before reductions | .10%I | .10% | .12% | .12%I |
| Expenses net of fee waivers, if any | .10%I | .10% | .10% | .10%I |
| Expenses net of all reductions | .10%I | .10% | .10% | .10%I |
| Net investment income (loss) | .62%I | 1.07% | 1.25% | 2.08%I |
| Supplemental Data | ||||
| Net assets, end of period (000 omitted) | $109 | $107 | $112 | $105 |
| Portfolio turnover rateH | 39%I | 18% | 11% | 32% |
A For the period December 4, 2013 (commencement of sale of shares) to March 31, 2014.
B Calculated based on average shares outstanding during the period.
C Amount represents less than $.005 per share.
D Total distributions of $.75 per share is comprised of distributions from net investment income of $.102 and distributions from net realized gain of $.643 per share.
E Total returns for periods of less than one year are not annualized.
F Total returns would have been lower if certain expenses had not been reduced during the applicable periods shown.
G Expense ratios reflect operating expenses of the class. Expenses before reductions do not reflect amounts reimbursed by the investment adviser or reductions from expense offset arrangements and do not represent the amount paid by the class during periods when reimbursements or reductions occur. Expenses net of fee waivers reflect expenses after reimbursement by the investment adviser but prior to reductions from expense offset arrangements. Expenses net of all reductions represent the net expenses paid by the class but do not include expenses of the underlying funds in which the Fund invests.
H Amounts do not include the activity of the Underlying Funds.
I Annualized
See accompanying notes which are an integral part of the financial statements.
Financial Highlights — Fidelity Multi-Manager 2035 Fund Class N
| Six months ended (Unaudited) September 30, | Years ended March 31, | |||
| 2016 | 2016 | 2015 | 2014 A | |
| Selected Per–Share Data | ||||
| Net asset value, beginning of period | $10.41 | $11.64 | $11.75 | $11.47 |
| Income from Investment Operations | ||||
| Net investment income (loss)B | .02 | .09 | .12 | .07 |
| Net realized and unrealized gain (loss) | .71 | (.60) | .63 | .44 |
| Total from investment operations | .73 | (.51) | .75 | .51 |
| Distributions from net investment income | – | (.08) | (.11) | (.09) |
| Distributions from net realized gain | (.13) | (.64) | (.75) | (.14) |
| Total distributions | (.13) | (.72) | (.86) | (.23) |
| Net asset value, end of period | $11.01 | $10.41 | $11.64 | $11.75 |
| Total ReturnC,D | 6.99% | (4.65)% | 6.58% | 4.48% |
| Ratios to Average Net AssetsE,F | ||||
| Expenses before reductions | .35%G | .35% | .37% | .38%G |
| Expenses net of fee waivers, if any | .35%G | .35% | .35% | .35%G |
| Expenses net of all reductions | .35%G | .35% | .35% | .35%G |
| Net investment income (loss) | .37%G | .81% | 1.00% | 1.83%G |
| Supplemental Data | ||||
| Net assets, end of period (000 omitted) | $108 | $106 | $111 | $104 |
| Portfolio turnover rateF | 39%G | 18% | 11% | 32% |
A For the period December 4, 2013 (commencement of sale of shares) to March 31, 2014.
B Calculated based on average shares outstanding during the period.
C Total returns for periods of less than one year are not annualized.
D Total returns would have been lower if certain expenses had not been reduced during the applicable periods shown.
E Expense ratios reflect operating expenses of the class. Expenses before reductions do not reflect amounts reimbursed by the investment adviser or reductions from expense offset arrangements and do not represent the amount paid by the class during periods when reimbursements or reductions occur. Expenses net of fee waivers reflect expenses after reimbursement by the investment adviser but prior to reductions from expense offset arrangements. Expenses net of all reductions represent the net expenses paid by the class but do not include expenses of the underlying funds in which the Fund invests.
F Amounts do not include the activity of the Underlying Funds.
G Annualized
See accompanying notes which are an integral part of the financial statements.
Fidelity® Multi-Manager 2040 Fund
Investment Summary (Unaudited)
The information in the following tables is based on the direct investments of the Fund.Top Holdings as of September 30, 2016
| % of fund's net assets | % of fund's net assets 6 months ago | |
| Strategic Advisers International Multi-Manager Fund Class F | 20.7 | 20.2 |
| Strategic Advisers Core Multi-Manager Fund Class F | 18.6 | 19.0 |
| Strategic Advisers Value Multi-Manager Fund Class F | 18.6 | 19.1 |
| Strategic Advisers Growth Multi-Manager Fund Class F | 15.7 | 15.9 |
| Strategic Advisers Emerging Markets Fund of Funds Class F | 10.0 | 9.4 |
| Strategic Advisers Small-Mid Cap Multi-Manager Fund Class F | 9.4 | 9.8 |
| Strategic Advisers Income Opportunities Fund of Funds Class F | 2.8 | 2.9 |
| Fidelity Series Commodity Strategy Fund Class F | 1.7 | 1.3 |
| Fidelity Series Emerging Markets Debt Fund Class F | 0.7 | 0.6 |
| Fidelity Series Inflation-Protected Bond Index Fund Class F | 0.6 | 0.5 |
| 98.8 | 98.7 |
Asset Allocation (% of fund's net assets)
| Period end | ||
| Domestic Equity Funds | 64.0% | |
| International Equity Funds | 30.7% | |
| Bond Funds | 5.3% | |

| Six months ago | ||
| Domestic Equity Funds | 65.1% | |
| International Equity Funds | 29.6% | |
| Bond Funds | 5.3% | |

Domestic Equity Funds category includes Fidelity Series Commodity Strategy Fund which invests in commodity-related investments.
Fidelity® Multi-Manager 2040 Fund
Investments September 30, 2016 (Unaudited)
Showing Percentage of Net Assets
| Domestic Equity Funds - 64.0% | |||
| Shares | Value | ||
| Fidelity Series Commodity Strategy Fund Class F (a)(b) | 3,200 | $17,120 | |
| Strategic Advisers Core Multi-Manager Fund Class F (b) | 15,738 | 187,760 | |
| Strategic Advisers Growth Multi-Manager Fund Class F (b) | 12,047 | 157,700 | |
| Strategic Advisers Small-Mid Cap Multi-Manager Fund Class F (b) | 8,747 | 94,638 | |
| Strategic Advisers Value Multi-Manager Fund Class F (b) | 13,782 | 187,707 | |
| TOTAL DOMESTIC EQUITY FUNDS | |||
| (Cost $667,601) | 644,925 | ||
| International Equity Funds - 30.7% | |||
| Strategic Advisers Emerging Markets Fund of Funds Class F (b) | 10,740 | 100,846 | |
| Strategic Advisers International Multi-Manager Fund Class F (b) | 18,112 | 208,645 | |
| TOTAL INTERNATIONAL EQUITY FUNDS | |||
| (Cost $311,419) | 309,491 | ||
| Bond Funds - 5.3% | |||
| Fidelity Series Emerging Markets Debt Fund Class F (b) | 653 | 6,763 | |
| Fidelity Series Floating Rate High Income Fund Class F (b) | 267 | 2,518 | |
| Fidelity Series Inflation-Protected Bond Index Fund Class F (b) | 594 | 5,989 | |
| Fidelity Series Real Estate Income Fund Class F (b) | 442 | 4,965 | |
| Strategic Advisers Core Income Multi-Manager Fund Class F (b) | 488 | 4,943 | |
| Strategic Advisers Income Opportunities Fund of Funds Class F (b) | 2,835 | 28,065 | |
| TOTAL BOND FUNDS | |||
| (Cost $53,786) | 53,243 | ||
| Short-Term Funds - 0.0% | |||
| Fidelity Investments Money Market Government Portfolio Institutional Class 0.31% (b)(c) | 322 | 322 | |
| Fidelity Series Short-Term Credit Fund Class F (b) | 17 | 172 | |
| TOTAL SHORT-TERM FUNDS | |||
| (Cost $494) | 494 | ||
| TOTAL INVESTMENT PORTFOLIO - 100.0% | |||
| (Cost $1,033,300) | 1,008,153 | ||
| NET OTHER ASSETS (LIABILITIES) - 0.0% | (101) | ||
| NET ASSETS - 100% | $1,008,052 |
Legend
(a) Non-income producing
(b) Affiliated Fund
(c) The rate quoted is the annualized seven-day yield of the fund at period end.
Affiliated Underlying Funds
Information regarding the Fund's fiscal year to date purchases and sales of the affiliated Underlying Funds and income earned by the Fund from investments in affiliated Underlying Funds is as follows:
| Affiliate | Value, beginning of period | Purchases | Sales Proceeds | Dividend Income | Value, end of period |
| Fidelity Investments Money Market Government Portfolio Institutional Class 0.31% | $301 | $93 | $72 | $-- | $322 |
| Fidelity Series Commodity Strategy Fund Class F | 12,113 | 6,998 | 2,945 | -- | 17,120 |
| Fidelity Series Emerging Markets Debt Fund Class F | 6,035 | 1,529 | 1,342 | 176 | 6,763 |
| Fidelity Series Floating Rate High Income Fund Class F | 2,346 | 617 | 559 | 54 | 2,518 |
| Fidelity Series Inflation-Protected Bond Index Fund Class F | 4,913 | 2,391 | 1,414 | 6 | 5,989 |
| Fidelity Series Real Estate Income Fund Class F | 4,636 | 1,377 | 1,179 | 124 | 4,965 |
| Fidelity Series Short-Term Credit Fund Class F | 151 | 69 | 48 | 1 | 172 |
| Strategic Advisers Core Income Multi-Manager Fund Class F | 4,724 | 1,969 | 1,866 | 54 | 4,943 |
| Strategic Advisers Core Multi-Manager Fund Class F | 179,585 | 52,420 | 45,239 | 593 | 187,760 |
| Strategic Advisers Emerging Markets Fund of Funds Class F | 88,703 | 23,966 | 21,325 | -- | 100,846 |
| Strategic Advisers Growth Multi-Manager Fund Class F | 149,643 | 44,688 | 37,787 | 447 | 157,700 |
| Strategic Advisers Income Opportunities Fund of Funds Class F | 27,408 | 5,168 | 6,259 | 758 | 28,065 |
| Strategic Advisers International Multi-Manager Fund Class F | 190,064 | 57,231 | 48,487 | -- | 208,645 |
| Strategic Advisers Small-Mid Cap Multi-Manager Fund Class F | 92,320 | 19,500 | 25,344 | -- | 94,638 |
| Strategic Advisers Value Multi-Manager Fund Class F | 180,338 | 46,525 | 43,223 | 1,253 | 187,707 |
| Total | $943,280 | $264,541 | $237,089 | $3,466 | $1,008,153 |
Investment Valuation
All investments are categorized as Level 1 under the Fair Value Hierarchy. The inputs or methodology used for valuing securities may not be an indication of the risk associated with investing in those securities. For more information on valuation inputs please refer to the Investment Valuation section in the accompanying Notes to Financial Statements.
See accompanying notes which are an integral part of the financial statements.
Fidelity® Multi-Manager 2040 Fund
Financial Statements
Statement of Assets and Liabilities
| September 30, 2016 (Unaudited) | ||
| Assets | ||
| Investment in securities, at value (cost $1,033,300) — See accompanying schedule | $1,008,153 | |
| Receivable for investments sold | 30,345 | |
| Receivable for fund shares sold | 12,156 | |
| Receivable from investment adviser for expense reductions | 84 | |
| Total assets | 1,050,738 | |
| Liabilities | ||
| Payable to custodian bank | $1 | |
| Payable for investments purchased | 1,891 | |
| Payable for fund shares redeemed | 40,612 | |
| Distribution and service plan fees payable | 22 | |
| Other affiliated payables | 160 | |
| Total liabilities | 42,686 | |
| Net Assets | $1,008,052 | |
| Net Assets consist of: | ||
| Paid in capital | $1,033,521 | |
| Undistributed net investment income | 2,858 | |
| Accumulated undistributed net realized gain (loss) on investments | (3,180) | |
| Net unrealized appreciation (depreciation) on investments | (25,147) | |
| Net Assets | $1,008,052 | |
| Multi-Manager 2040: | ||
| Net Asset Value, offering price and redemption price per share ($790,936 ÷ 72,214 shares) | $10.95 | |
| Class L: | ||
| Net Asset Value, offering price and redemption price per share ($108,941 ÷ 9,946 shares) | $10.95 | |
| Class N: | ||
| Net Asset Value, offering price and redemption price per share ($108,175 ÷ 9,896 shares) | $10.93 |
See accompanying notes which are an integral part of the financial statements.
Statement of Operations
| Six months ended September 30, 2016 (Unaudited) | ||
| Investment Income | ||
| Income distributions from underlying funds | $3,466 | |
| Expenses | ||
| Transfer agent fees | $932 | |
| Distribution and service plan fees | 131 | |
| Independent trustees' fees and expenses | 2 | |
| Total expenses before reductions | 1,065 | |
| Expense reductions | (457) | 608 |
| Net investment income (loss) | 2,858 | |
| Realized and Unrealized Gain (Loss) | ||
| Realized gain (loss) on sale of underlying fund shares | (11,676) | |
| Capital gain distributions from underlying funds | 22,107 | |
| Total net realized gain (loss) | 10,431 | |
| Change in net unrealized appreciation (depreciation) on underlying funds | 49,095 | |
| Net gain (loss) | 59,526 | |
| Net increase (decrease) in net assets resulting from operations | $62,384 |
See accompanying notes which are an integral part of the financial statements.
Statement of Changes in Net Assets
| Six months ended September 30, 2016 (Unaudited) | Year ended March 31, 2016 | |
| Increase (Decrease) in Net Assets | ||
| Operations | ||
| Net investment income (loss) | $2,858 | $8,704 |
| Net realized gain (loss) | 10,431 | 24,573 |
| Change in net unrealized appreciation (depreciation) | 49,095 | (70,157) |
| Net increase (decrease) in net assets resulting from operations | 62,384 | (36,880) |
| Distributions to shareholders from net investment income | – | (8,470) |
| Distributions to shareholders from net realized gain | (13,224) | (52,618) |
| Total distributions | (13,224) | (61,088) |
| Share transactions - net increase (decrease) | 15,706 | 273,688 |
| Total increase (decrease) in net assets | 64,866 | 175,720 |
| Net Assets | ||
| Beginning of period | 943,186 | 767,466 |
| End of period | $1,008,052 | $943,186 |
| Other Information | ||
| Undistributed net investment income end of period | $2,858 | $– |
See accompanying notes which are an integral part of the financial statements.
Financial Highlights — Fidelity Multi-Manager 2040 Fund
| Six months ended (Unaudited) September 30, | Years ended March 31, | ||||
| 2016 | 2016 | 2015 | 2014 | 2013 A | |
| Selected Per–Share Data | |||||
| Net asset value, beginning of period | $10.37 | $11.65 | $11.80 | $10.57 | $10.00 |
| Income from Investment Operations | |||||
| Net investment income (loss)B | .03 | .11 | .15 | .15 | .06 |
| Net realized and unrealized gain (loss) | .70 | (.58) | .63 | 1.39 | .51 |
| Total from investment operations | .73 | (.47) | .78 | 1.54 | .57 |
| Distributions from net investment income | – | (.10) | (.15) | (.14) | – |
| Distributions from net realized gain | (.15) | (.71) | (.77) | (.17) | – |
| Total distributions | (.15) | (.81) | (.93)C | (.31) | – |
| Net asset value, end of period | $10.95 | $10.37 | $11.65 | $11.80 | $10.57 |
| Total ReturnD,E | 7.11% | (4.35)% | 6.81% | 14.75% | 5.70% |
| Ratios to Average Net AssetsF,G | |||||
| Expenses before reductions | .22%H | .21% | .23% | .21% | .21%H |
| Expenses net of fee waivers, if any | .10%H | .10% | .10% | .10% | .10%H |
| Expenses net of all reductions | .10%H | .10% | .10% | .10% | .10%H |
| Net investment income (loss) | .63%H | 1.06% | 1.28% | 1.32% | 2.04%H |
| Supplemental Data | |||||
| Net assets, end of period (000 omitted) | $791 | $730 | $544 | $307 | $106 |
| Portfolio turnover rateG | 49%H | 18% | 24% | 54% | 1%I |
A For the period December 20, 2012 (commencement of operations) to March 31, 2013.
B Calculated based on average shares outstanding during the period.
C Total distributions of $.93 per share is comprised of distributions from net investment income of $.154 and distributions from net realized gain of $.772 per share.
D Total returns for periods of less than one year are not annualized.
E Total returns would have been lower if certain expenses had not been reduced during the applicable periods shown.
F Expense ratios reflect operating expenses of the class. Expenses before reductions do not reflect amounts reimbursed by the investment adviser or reductions from expense offset arrangements and do not represent the amount paid by the class during periods when reimbursements or reductions occur. Expense ratios before reductions for start-up periods may not be representative of longer-term operating periods. Expenses net of fee waivers reflect expenses after reimbursement by the investment adviser but prior to reductions from expense offset arrangements. Expenses net of all reductions represent the net expenses paid by the class but do not include expenses of the underlying funds in which the Fund invests.
G Amounts do not include the activity of the Underlying Funds.
H Annualized
I Amount not annualized.
See accompanying notes which are an integral part of the financial statements.
Financial Highlights — Fidelity Multi-Manager 2040 Fund Class L
| Six months ended (Unaudited) September 30, | Years ended March 31, | |||
| 2016 | 2016 | 2015 | 2014 A | |
| Selected Per–Share Data | ||||
| Net asset value, beginning of period | $10.37 | $11.65 | $11.79 | $11.49 |
| Income from Investment Operations | ||||
| Net investment income (loss)B | .03 | .11 | .15 | .07 |
| Net realized and unrealized gain (loss) | .70 | (.58) | .63 | .44 |
| Total from investment operations | .73 | (.47) | .78 | .51 |
| Distributions from net investment income | – | (.10) | (.15) | (.09) |
| Distributions from net realized gain | (.15) | (.71) | (.77) | (.13) |
| Total distributions | (.15) | (.81) | (.92) | (.21)C |
| Net asset value, end of period | $10.95 | $10.37 | $11.65 | $11.79 |
| Total ReturnD,E | 7.11% | (4.36)% | 6.87% | 4.50% |
| Ratios to Average Net AssetsF,G | ||||
| Expenses before reductions | .10%H | .11% | .13% | .12%H |
| Expenses net of fee waivers, if any | .10%H | .10% | .10% | .10%H |
| Expenses net of all reductions | .10%H | .10% | .10% | .10%H |
| Net investment income (loss) | .63%H | 1.06% | 1.28% | 2.03%H |
| Supplemental Data | ||||
| Net assets, end of period (000 omitted) | $109 | $107 | $112 | $105 |
| Portfolio turnover rateG | 49%H | 18% | 24% | 54% |
A For the period December 4, 2013 (commencement of sale of shares) to March 31, 2014.
B Calculated based on average shares outstanding during the period.
C Total distributions of $.21 per share is comprised of distributions from net investment income of $.088 and distributions from net realized gain of $.126 per share.
D Total returns for periods of less than one year are not annualized.
E Total returns would have been lower if certain expenses had not been reduced during the applicable periods shown.
F Expense ratios reflect operating expenses of the class. Expenses before reductions do not reflect amounts reimbursed by the investment adviser or reductions from expense offset arrangements and do not represent the amount paid by the class during periods when reimbursements or reductions occur. Expenses net of fee waivers reflect expenses after reimbursement by the investment adviser but prior to reductions from expense offset arrangements. Expenses net of all reductions represent the net expenses paid by the class but do not include expenses of the underlying funds in which the Fund invests.
G Amounts do not include the activity of the Underlying Funds.
H Annualized
See accompanying notes which are an integral part of the financial statements.
Financial Highlights — Fidelity Multi-Manager 2040 Fund Class N
| Six months ended (Unaudited) September 30, | Years ended March 31, | |||
| 2016 | 2016 | 2015 | 2014 A | |
| Selected Per–Share Data | ||||
| Net asset value, beginning of period | $10.36 | $11.64 | $11.79 | $11.49 |
| Income from Investment Operations | ||||
| Net investment income (loss)B | .02 | .09 | .12 | .07 |
| Net realized and unrealized gain (loss) | .70 | (.59) | .62 | .44 |
| Total from investment operations | .72 | (.50) | .74 | .51 |
| Distributions from net investment income | – | (.08) | (.12) | (.09) |
| Distributions from net realized gain | (.15) | (.70) | (.77) | (.13) |
| Total distributions | (.15) | (.78) | (.89) | (.21)C |
| Net asset value, end of period | $10.93 | $10.36 | $11.64 | $11.79 |
| Total ReturnD,E | 7.02% | (4.60)% | 6.53% | 4.49% |
| Ratios to Average Net AssetsF,G | ||||
| Expenses before reductions | .36%H | .36% | .38% | .38%H |
| Expenses net of fee waivers, if any | .35%H | .35% | .35% | .35%H |
| Expenses net of all reductions | .35%H | .35% | .35% | .35%H |
| Net investment income (loss) | .38%H | .81% | 1.03% | 1.79%H |
| Supplemental Data | ||||
| Net assets, end of period (000 omitted) | $108 | $106 | $111 | $104 |
| Portfolio turnover rateG | 49%H | 18% | 24% | 54% |
A For the period December 4, 2013 (commencement of sale of shares) to March 31, 2014.
B Calculated based on average shares outstanding during the period.
C Total distributions of $.21 per share is comprised of distributions from net investment income of $.086 and distributions from net realized gain of $.126 per share.
D Total returns for periods of less than one year are not annualized.
E Total returns would have been lower if certain expenses had not been reduced during the applicable periods shown.
F Expense ratios reflect operating expenses of the class. Expenses before reductions do not reflect amounts reimbursed by the investment adviser or reductions from expense offset arrangements and do not represent the amount paid by the class during periods when reimbursements or reductions occur. Expenses net of fee waivers reflect expenses after reimbursement by the investment adviser but prior to reductions from expense offset arrangements. Expenses net of all reductions represent the net expenses paid by the class but do not include expenses of the underlying funds in which the Fund invests.
G Amounts do not include the activity of the Underlying Funds.
H Annualized
See accompanying notes which are an integral part of the financial statements.
Fidelity® Multi-Manager 2045 Fund
Investment Summary (Unaudited)
The information in the following tables is based on the direct investments of the Fund.Top Holdings as of September 30, 2016
| % of fund's net assets | % of fund's net assets 6 months ago | |
| Strategic Advisers International Multi-Manager Fund Class F | 20.7 | 20.2 |
| Strategic Advisers Core Multi-Manager Fund Class F | 18.6 | 19.1 |
| Strategic Advisers Value Multi-Manager Fund Class F | 18.6 | 19.1 |
| Strategic Advisers Growth Multi-Manager Fund Class F | 15.7 | 16.0 |
| Strategic Advisers Emerging Markets Fund of Funds Class F | 10.0 | 9.4 |
| Strategic Advisers Small-Mid Cap Multi-Manager Fund Class F | 9.4 | 9.6 |
| Strategic Advisers Income Opportunities Fund of Funds Class F | 2.8 | 2.9 |
| Fidelity Series Commodity Strategy Fund Class F | 1.7 | 1.3 |
| Fidelity Series Emerging Markets Debt Fund Class F | 0.7 | 0.6 |
| Fidelity Series Inflation-Protected Bond Index Fund Class F | 0.6 | 0.5 |
| 98.8 | 98.7 |
Asset Allocation (% of fund's net assets)
| Period end | ||
| Domestic Equity Funds | 64.0% | |
| International Equity Funds | 30.7% | |
| Bond Funds | 5.3% | |

| Six months ago | ||
| Domestic Equity Funds | 65.1% | |
| International Equity Funds | 29.6% | |
| Bond Funds | 5.3% | |

Domestic Equity Funds category includes Fidelity Series Commodity Strategy Fund which invests in commodity-related investments.
Fidelity® Multi-Manager 2045 Fund
Investments September 30, 2016 (Unaudited)
Showing Percentage of Net Assets
| Domestic Equity Funds - 64.0% | |||
| Shares | Value | ||
| Fidelity Series Commodity Strategy Fund Class F (a)(b) | 5,599 | $29,956 | |
| Strategic Advisers Core Multi-Manager Fund Class F (b) | 27,362 | 326,424 | |
| Strategic Advisers Growth Multi-Manager Fund Class F (b) | 20,927 | 273,931 | |
| Strategic Advisers Small-Mid Cap Multi-Manager Fund Class F (b) | 15,195 | 164,405 | |
| Strategic Advisers Value Multi-Manager Fund Class F (b) | 23,951 | 326,217 | |
| TOTAL DOMESTIC EQUITY FUNDS | |||
| (Cost $1,157,224) | 1,120,933 | ||
| International Equity Funds - 30.7% | |||
| Strategic Advisers Emerging Markets Fund of Funds Class F (b) | 18,683 | 175,437 | |
| Strategic Advisers International Multi-Manager Fund Class F (b) | 31,499 | 362,874 | |
| TOTAL INTERNATIONAL EQUITY FUNDS | |||
| (Cost $540,972) | 538,311 | ||
| Bond Funds - 5.3% | |||
| Fidelity Series Emerging Markets Debt Fund Class F (b) | 1,125 | 11,658 | |
| Fidelity Series Floating Rate High Income Fund Class F (b) | 464 | 4,367 | |
| Fidelity Series Inflation-Protected Bond Index Fund Class F (b) | 1,047 | 10,549 | |
| Fidelity Series Real Estate Income Fund Class F (b) | 767 | 8,602 | |
| Strategic Advisers Core Income Multi-Manager Fund Class F (b) | 868 | 8,785 | |
| Strategic Advisers Income Opportunities Fund of Funds Class F (b) | 4,924 | 48,749 | |
| TOTAL BOND FUNDS | |||
| (Cost $92,953) | 92,710 | ||
| Short-Term Funds - 0.0% | |||
| Fidelity Investments Money Market Government Portfolio Institutional Class 0.31% (b)(c) | 571 | 571 | |
| Fidelity Series Short-Term Credit Fund Class F (b) | 31 | 308 | |
| TOTAL SHORT-TERM FUNDS | |||
| (Cost $877) | 879 | ||
| TOTAL INVESTMENT PORTFOLIO - 100.0% | |||
| (Cost $1,792,026) | 1,752,833 | ||
| NET OTHER ASSETS (LIABILITIES) - 0.0% | (155) | ||
| NET ASSETS - 100% | $1,752,678 |
Legend
(a) Non-income producing
(b) Affiliated Fund
(c) The rate quoted is the annualized seven-day yield of the fund at period end.
Affiliated Underlying Funds
Information regarding the Fund's fiscal year to date purchases and sales of the affiliated Underlying Funds and income earned by the Fund from investments in affiliated Underlying Funds is as follows:
| Affiliate | Value, beginning of period | Purchases | Sales Proceeds | Dividend Income | Value, end of period |
| Fidelity Investments Money Market Government Portfolio Institutional Class 0.31% | $471 | $170 | $70 | $-- | $571 |
| Fidelity Series Commodity Strategy Fund Class F | 18,893 | 13,012 | 3,524 | -- | 29,956 |
| Fidelity Series Emerging Markets Debt Fund Class F | 9,450 | 2,667 | 1,354 | 291 | 11,658 |
| Fidelity Series Floating Rate High Income Fund Class F | 3,669 | 1,079 | 564 | 89 | 4,367 |
| Fidelity Series Inflation-Protected Bond Index Fund Class F | 7,681 | 4,067 | 1,370 | 10 | 10,549 |
| Fidelity Series Real Estate Income Fund Class F | 7,270 | 2,388 | 1,276 | 207 | 8,602 |
| Fidelity Series Short-Term Credit Fund Class F | 237 | 116 | 46 | 1 | 308 |
| Strategic Advisers Core Income Multi-Manager Fund Class F | 7,386 | 3,868 | 2,666 | 89 | 8,785 |
| Strategic Advisers Core Multi-Manager Fund Class F | 282,279 | 91,304 | 49,306 | 973 | 326,424 |
| Strategic Advisers Emerging Markets Fund of Funds Class F | 138,627 | 39,623 | 19,372 | -- | 175,437 |
| Strategic Advisers Growth Multi-Manager Fund Class F | 235,538 | 78,026 | 41,998 | 735 | 273,931 |
| Strategic Advisers Income Opportunities Fund of Funds Class F | 42,627 | 9,541 | 6,263 | 1,236 | 48,749 |
| Strategic Advisers International Multi-Manager Fund Class F | 297,517 | 92,660 | 44,311 | -- | 362,874 |
| Strategic Advisers Small-Mid Cap Multi-Manager Fund Class F | 141,368 | 35,637 | 26,491 | -- | 164,405 |
| Strategic Advisers Value Multi-Manager Fund Class F | 281,995 | 83,409 | 46,363 | 2,063 | 326,217 |
| Total | $1,475,008 | $457,567 | $244,974 | $5,694 | $1,752,833 |
Investment Valuation
All investments are categorized as Level 1 under the Fair Value Hierarchy. The inputs or methodology used for valuing securities may not be an indication of the risk associated with investing in those securities. For more information on valuation inputs please refer to the Investment Valuation section in the accompanying Notes to Financial Statements.
See accompanying notes which are an integral part of the financial statements.
Fidelity® Multi-Manager 2045 Fund
Financial Statements
Statement of Assets and Liabilities
| September 30, 2016 (Unaudited) | ||
| Assets | ||
| Investment in securities, at value (cost $1,792,026) — See accompanying schedule | $1,752,833 | |
| Receivable for investments sold | 1,392 | |
| Receivable for fund shares sold | 13,384 | |
| Receivable from investment adviser for expense reductions | 116 | |
| Total assets | 1,767,725 | |
| Liabilities | ||
| Payable for investments purchased | $14,781 | |
| Distribution and service plan fees payable | 22 | |
| Other affiliated payables | 244 | |
| Total liabilities | 15,047 | |
| Net Assets | $1,752,678 | |
| Net Assets consist of: | ||
| Paid in capital | $1,786,690 | |
| Undistributed net investment income | 4,772 | |
| Accumulated undistributed net realized gain (loss) on investments | 409 | |
| Net unrealized appreciation (depreciation) on investments | (39,193) | |
| Net Assets | $1,752,678 | |
| Multi-Manager 2045: | ||
| Net Asset Value, offering price and redemption price per share ($1,535,600 ÷ 137,509 shares) | $11.17 | |
| Class L: | ||
| Net Asset Value, offering price and redemption price per share ($108,920 ÷ 9,752 shares) | $11.17 | |
| Class N: | ||
| Net Asset Value, offering price and redemption price per share ($108,158 ÷ 9,700 shares) | $11.15 |
See accompanying notes which are an integral part of the financial statements.
Statement of Operations
| Six months ended September 30, 2016 (Unaudited) | ||
| Investment Income | ||
| Income distributions from underlying funds | $5,694 | |
| Expenses | ||
| Transfer agent fees | $1,421 | |
| Distribution and service plan fees | 131 | |
| Independent trustees' fees and expenses | 3 | |
| Total expenses before reductions | 1,555 | |
| Expense reductions | (633) | 922 |
| Net investment income (loss) | 4,772 | |
| Realized and Unrealized Gain (Loss) | ||
| Realized gain (loss) on sale of underlying fund shares | 312 | |
| Capital gain distributions from underlying funds | 36,340 | |
| Total net realized gain (loss) | 36,652 | |
| Change in net unrealized appreciation (depreciation) on underlying funds | 64,919 | |
| Net gain (loss) | 101,571 | |
| Net increase (decrease) in net assets resulting from operations | $106,343 |
See accompanying notes which are an integral part of the financial statements.
Statement of Changes in Net Assets
| Six months ended September 30, 2016 (Unaudited) | Year ended March 31, 2016 | |
| Increase (Decrease) in Net Assets | ||
| Operations | ||
| Net investment income (loss) | $4,772 | $14,454 |
| Net realized gain (loss) | 36,652 | 18,047 |
| Change in net unrealized appreciation (depreciation) | 64,919 | (93,334) |
| Net increase (decrease) in net assets resulting from operations | 106,343 | (60,833) |
| Distributions to shareholders from net investment income | – | (14,640) |
| Distributions to shareholders from net realized gain | (18,309) | (69,085) |
| Total distributions | (18,309) | (83,725) |
| Share transactions - net increase (decrease) | 189,780 | 452,162 |
| Total increase (decrease) in net assets | 277,814 | 307,604 |
| Net Assets | ||
| Beginning of period | 1,474,864 | 1,167,260 |
| End of period | $1,752,678 | $1,474,864 |
| Other Information | ||
| Undistributed net investment income end of period | $4,772 | $– |
See accompanying notes which are an integral part of the financial statements.
Financial Highlights — Fidelity Multi-Manager 2045 Fund
| Six months ended (Unaudited) September 30, | Years ended March 31, | ||||
| 2016 | 2016 | 2015 | 2014 | 2013 A | |
| Selected Per–Share Data | |||||
| Net asset value, beginning of period | $10.55 | $11.73 | $11.83 | $10.59 | $10.00 |
| Income from Investment Operations | |||||
| Net investment income (loss)B | .03 | .12 | .15 | .15 | .06 |
| Net realized and unrealized gain (loss) | .72 | (.61) | .64 | 1.42 | .53 |
| Total from investment operations | .75 | (.49) | .79 | 1.57 | .59 |
| Distributions from net investment income | – | (.11) | (.15) | (.15) | – |
| Distributions from net realized gain | (.13) | (.59) | (.74) | (.19) | – |
| Total distributions | (.13) | (.69)C | (.89) | (.33)D | – |
| Net asset value, end of period | $11.17 | $10.55 | $11.73 | $11.83 | $10.59 |
| Total ReturnE,F | 7.20% | (4.40)% | 6.88% | 15.00% | 5.90% |
| Ratios to Average Net AssetsG,H | |||||
| Expenses before reductions | .19%I | .20% | .25% | .25% | .21%I |
| Expenses net of fee waivers, if any | .10%I | .10% | .10% | .10% | .10%I |
| Expenses net of all reductions | .10%I | .10% | .10% | .10% | .10%I |
| Net investment income (loss) | .62%I | 1.09% | 1.23% | 1.34% | 2.05%I |
| Supplemental Data | |||||
| Net assets, end of period (000 omitted) | $1,536 | $1,262 | $944 | $331 | $106 |
| Portfolio turnover rateG | 31%I | 23% | 16% | 38% | 1%J |
A For the period December 20, 2012 (commencement of operations) to March 31, 2013.
B Calculated based on average shares outstanding during the period.
C Total distributions of $.69 per share is comprised of distributions from net investment income of $.107 and distributions from net realized gain of $.587 per share.
D Total distributions of $.33 per share is comprised of distributions from net investment income of $.146 and distributions from net realized gain of $.187 per share.
E Total returns for periods of less than one year are not annualized.
F Total returns would have been lower if certain expenses had not been reduced during the applicable periods shown.
G Amounts do not include the activity of the Underlying Funds.
H Expense ratios reflect operating expenses of the class. Expenses before reductions do not reflect amounts reimbursed by the investment adviser or reductions from expense offset arrangements and do not represent the amount paid by the class during periods when reimbursements or reductions occur. Expense ratios before reductions for start-up periods may not be representative of longer-term operating periods. Expenses net of fee waivers reflect expenses after reimbursement by the investment adviser but prior to reductions from expense offset arrangements. Expenses net of all reductions represent the net expenses paid by the class but do not include expenses of the underlying funds in which the Fund invests.
I Annualized
J Amount not annualized.
See accompanying notes which are an integral part of the financial statements.
Financial Highlights — Fidelity Multi-Manager 2045 Fund Class L
| Six months ended (Unaudited) September 30, | Years ended March 31, | |||
| 2016 | 2016 | 2015 | 2014 A | |
| Selected Per–Share Data | ||||
| Net asset value, beginning of period | $10.56 | $11.73 | $11.83 | $11.54 |
| Income from Investment Operations | ||||
| Net investment income (loss)B | .03 | .12 | .15 | .07 |
| Net realized and unrealized gain (loss) | .71 | (.60) | .63 | .45 |
| Total from investment operations | .74 | (.48) | .78 | .52 |
| Distributions from net investment income | – | (.11) | (.14) | (.09) |
| Distributions from net realized gain | (.13) | (.59) | (.74) | (.14) |
| Total distributions | (.13) | (.69)C | (.88) | (.23) |
| Net asset value, end of period | $11.17 | $10.56 | $11.73 | $11.83 |
| Total ReturnD,E | 7.10% | (4.33)% | 6.85% | 4.51% |
| Ratios to Average Net AssetsF,G | ||||
| Expenses before reductions | .10%H | .10% | .12% | .12%H |
| Expenses net of fee waivers, if any | .10%H | .10% | .10% | .10%H |
| Expenses net of all reductions | .10%H | .10% | .10% | .10%H |
| Net investment income (loss) | .62%H | 1.09% | 1.23% | 1.94%H |
| Supplemental Data | ||||
| Net assets, end of period (000 omitted) | $109 | $107 | $112 | $105 |
| Portfolio turnover rateF | 31%H | 23% | 16% | 38% |
A For the period December 4, 2013 (commencement of sale of shares) to March 31, 2014.
B Calculated based on average shares outstanding during the period.
C Total distributions of $.69 per share is comprised of distributions from net investment income of $.105 and distributions from net realized gain of $.587 per share.
D Total returns for periods of less than one year are not annualized.
E Total returns would have been lower if certain expenses had not been reduced during the applicable periods shown.
F Amounts do not include the activity of the Underlying Funds.
G Expense ratios reflect operating expenses of the class. Expenses before reductions do not reflect amounts reimbursed by the investment adviser or reductions from expense offset arrangements and do not represent the amount paid by the class during periods when reimbursements or reductions occur. Expenses net of fee waivers reflect expenses after reimbursement by the investment adviser but prior to reductions from expense offset arrangements. Expenses net of all reductions represent the net expenses paid by the class but do not include expenses of the underlying funds in which the Fund invests.
H Annualized
See accompanying notes which are an integral part of the financial statements.
Financial Highlights — Fidelity Multi-Manager 2045 Fund Class N
| Six months ended (Unaudited) September 30, | Years ended March 31, | |||
| 2016 | 2016 | 2015 | 2014 A | |
| Selected Per–Share Data | ||||
| Net asset value, beginning of period | $10.55 | $11.73 | $11.82 | $11.54 |
| Income from Investment Operations | ||||
| Net investment income (loss)B | .02 | .09 | .12 | .06 |
| Net realized and unrealized gain (loss) | .71 | (.60) | .65 | .45 |
| Total from investment operations | .73 | (.51) | .77 | .51 |
| Distributions from net investment income | – | (.08) | (.12) | (.09) |
| Distributions from net realized gain | (.13) | (.58) | (.74) | (.14) |
| Total distributions | (.13) | (.67)C | (.86) | (.23) |
| Net asset value, end of period | $11.15 | $10.55 | $11.73 | $11.82 |
| Total ReturnD,E | 6.98% | (4.65)% | 6.68% | 4.41% |
| Ratios to Average Net AssetsF,G | ||||
| Expenses before reductions | .35%H | .35% | .37% | .38%H |
| Expenses net of fee waivers, if any | .35%H | .35% | .35% | .35%H |
| Expenses net of all reductions | .35%H | .35% | .35% | .35%H |
| Net investment income (loss) | .37%H | .84% | .98% | 1.70%H |
| Supplemental Data | ||||
| Net assets, end of period (000 omitted) | $108 | $106 | $111 | $104 |
| Portfolio turnover rateF | 31%H | 23% | 16% | 38% |
A For the period December 4, 2013 (commencement of sale of shares) to March 31, 2014.
B Calculated based on average shares outstanding during the period.
C Total distributions of $.67 per share is comprised of distributions from net investment income of $.084 and distributions from net realized gain of $.581 per share.
D Total returns for periods of less than one year are not annualized.
E Total returns would have been lower if certain expenses had not been reduced during the applicable periods shown.
F Amounts do not include the activity of the Underlying Funds.
G Expense ratios reflect operating expenses of the class. Expenses before reductions do not reflect amounts reimbursed by the investment adviser or reductions from expense offset arrangements and do not represent the amount paid by the class during periods when reimbursements or reductions occur. Expenses net of fee waivers reflect expenses after reimbursement by the investment adviser but prior to reductions from expense offset arrangements. Expenses net of all reductions represent the net expenses paid by the class but do not include expenses of the underlying funds in which the Fund invests.
H Annualized
See accompanying notes which are an integral part of the financial statements.
Fidelity® Multi-Manager 2050 Fund
Investment Summary (Unaudited)
The information in the following tables is based on the direct investments of the Fund.Top Holdings as of September 30, 2016
| % of fund's net assets | % of fund's net assets 6 months ago | |
| Strategic Advisers International Multi-Manager Fund Class F | 20.7 | 20.2 |
| Strategic Advisers Core Multi-Manager Fund Class F | 18.6 | 19.1 |
| Strategic Advisers Value Multi-Manager Fund Class F | 18.6 | 19.1 |
| Strategic Advisers Growth Multi-Manager Fund Class F | 15.7 | 16.0 |
| Strategic Advisers Emerging Markets Fund of Funds Class F | 10.0 | 9.4 |
| Strategic Advisers Small-Mid Cap Multi-Manager Fund Class F | 9.4 | 9.6 |
| Strategic Advisers Income Opportunities Fund of Funds Class F | 2.8 | 2.9 |
| Fidelity Series Commodity Strategy Fund Class F | 1.7 | 1.3 |
| Fidelity Series Emerging Markets Debt Fund Class F | 0.7 | 0.6 |
| Fidelity Series Inflation-Protected Bond Index Fund Class F | 0.6 | 0.5 |
| 98.8 | 98.7 |
Asset Allocation (% of fund's net assets)
| Period end | ||
| Domestic Equity Funds | 64.0% | |
| International Equity Funds | 30.7% | |
| Bond Funds | 5.3% | |

| Six months ago | ||
| Domestic Equity Funds | 65.1% | |
| International Equity Funds | 29.6% | |
| Bond Funds | 5.3% | |

Domestic Equity Funds category includes Fidelity Series Commodity Strategy Fund which invests in commodity-related investments.
Fidelity® Multi-Manager 2050 Fund
Investments September 30, 2016 (Unaudited)
Showing Percentage of Net Assets
| Domestic Equity Funds - 64.0% | |||
| Shares | Value | ||
| Fidelity Series Commodity Strategy Fund Class F (a)(b) | 4,538 | $24,278 | |
| Strategic Advisers Core Multi-Manager Fund Class F (b) | 22,383 | 267,023 | |
| Strategic Advisers Growth Multi-Manager Fund Class F (b) | 17,135 | 224,295 | |
| Strategic Advisers Small-Mid Cap Multi-Manager Fund Class F (b) | 12,445 | 134,653 | |
| Strategic Advisers Value Multi-Manager Fund Class F (b) | 19,601 | 266,972 | |
| TOTAL DOMESTIC EQUITY FUNDS | |||
| (Cost $941,210) | 917,221 | ||
| International Equity Funds - 30.7% | |||
| Strategic Advisers Emerging Markets Fund of Funds Class F (b) | 15,280 | 143,477 | |
| Strategic Advisers International Multi-Manager Fund Class F (b) | 25,757 | 296,717 | |
| TOTAL INTERNATIONAL EQUITY FUNDS | |||
| (Cost $439,904) | 440,194 | ||
| Bond Funds - 5.3% | |||
| Fidelity Series Emerging Markets Debt Fund Class F (b) | 922 | 9,554 | |
| Fidelity Series Floating Rate High Income Fund Class F (b) | 379 | 3,572 | |
| Fidelity Series Inflation-Protected Bond Index Fund Class F (b) | 845 | 8,520 | |
| Fidelity Series Real Estate Income Fund Class F (b) | 626 | 7,019 | |
| Strategic Advisers Core Income Multi-Manager Fund Class F (b) | 688 | 6,960 | |
| Strategic Advisers Income Opportunities Fund of Funds Class F (b) | 4,038 | 39,975 | |
| TOTAL BOND FUNDS | |||
| (Cost $76,221) | 75,600 | ||
| Short-Term Funds - 0.0% | |||
| Fidelity Investments Money Market Government Portfolio Institutional Class 0.31% (b)(c) | 456 | 456 | |
| Fidelity Series Short-Term Credit Fund Class F (b) | 25 | 248 | |
| TOTAL SHORT-TERM FUNDS | |||
| (Cost $702) | 704 | ||
| TOTAL INVESTMENT PORTFOLIO - 100.0% | |||
| (Cost $1,458,037) | 1,433,719 | ||
| NET OTHER ASSETS (LIABILITIES) - 0.0% | (131) | ||
| NET ASSETS - 100% | $1,433,588 |
Legend
(a) Non-income producing
(b) Affiliated Fund
(c) The rate quoted is the annualized seven-day yield of the fund at period end.
Affiliated Underlying Funds
Information regarding the Fund's fiscal year to date purchases and sales of the affiliated Underlying Funds and income earned by the Fund from investments in affiliated Underlying Funds is as follows:
| Affiliate | Value, beginning of period | Purchases | Sales Proceeds | Dividend Income | Value, end of period |
| Fidelity Investments Money Market Government Portfolio Institutional Class 0.31% | $431 | $123 | $98 | $-- | $456 |
| Fidelity Series Commodity Strategy Fund Class F | 17,336 | 9,337 | 3,709 | -- | 24,278 |
| Fidelity Series Emerging Markets Debt Fund Class F | 8,585 | 1,959 | 1,767 | 253 | 9,554 |
| Fidelity Series Floating Rate High Income Fund Class F | 3,358 | 788 | 736 | 77 | 3,572 |
| Fidelity Series Inflation-Protected Bond Index Fund Class F | 6,986 | 3,250 | 1,865 | 9 | 8,520 |
| Fidelity Series Real Estate Income Fund Class F | 6,605 | 1,789 | 1,568 | 179 | 7,019 |
| Fidelity Series Short-Term Credit Fund Class F | 219 | 88 | 61 | 1 | 248 |
| Strategic Advisers Core Income Multi-Manager Fund Class F | 6,761 | 2,554 | 2,527 | 78 | 6,960 |
| Strategic Advisers Core Multi-Manager Fund Class F | 258,069 | 66,323 | 59,102 | 871 | 267,023 |
| Strategic Advisers Emerging Markets Fund of Funds Class F | 126,946 | 30,439 | 28,167 | -- | 143,477 |
| Strategic Advisers Growth Multi-Manager Fund Class F | 215,609 | 56,205 | 49,508 | 657 | 224,295 |
| Strategic Advisers Income Opportunities Fund of Funds Class F | 39,163 | 6,607 | 8,348 | 1,099 | 39,975 |
| Strategic Advisers International Multi-Manager Fund Class F | 272,269 | 74,504 | 64,295 | -- | 296,717 |
| Strategic Advisers Small-Mid Cap Multi-Manager Fund Class F | 129,729 | 23,762 | 31,102 | -- | 134,653 |
| Strategic Advisers Value Multi-Manager Fund Class F | 258,133 | 58,832 | 56,186 | 1,845 | 266,972 |
| Total | $1,350,199 | $336,560 | $309,039 | $5,069 | $1,433,719 |
Investment Valuation
All investments are categorized as Level 1 under the Fair Value Hierarchy. The inputs or methodology used for valuing securities may not be an indication of the risk associated with investing in those securities. For more information on valuation inputs please refer to the Investment Valuation section in the accompanying Notes to Financial Statements.
See accompanying notes which are an integral part of the financial statements.
Fidelity® Multi-Manager 2050 Fund
Financial Statements
Statement of Assets and Liabilities
| September 30, 2016 (Unaudited) | ||
| Assets | ||
| Investment in securities, at value (cost $1,458,037) — See accompanying schedule | $1,433,719 | |
| Receivable for investments sold | 49,658 | |
| Receivable for fund shares sold | 16,028 | |
| Receivable from investment adviser for expense reductions | 111 | |
| Total assets | 1,499,516 | |
| Liabilities | ||
| Payable for investments purchased | $2,441 | |
| Payable for fund shares redeemed | 63,245 | |
| Distribution and service plan fees payable | 22 | |
| Other affiliated payables | 220 | |
| Total liabilities | 65,928 | |
| Net Assets | $1,433,588 | |
| Net Assets consist of: | ||
| Paid in capital | $1,454,386 | |
| Undistributed net investment income | 4,199 | |
| Accumulated undistributed net realized gain (loss) on investments | (679) | |
| Net unrealized appreciation (depreciation) on investments | (24,318) | |
| Net Assets | $1,433,588 | |
| Multi-Manager 2050: | ||
| Net Asset Value, offering price and redemption price per share ($1,216,540 ÷ 111,108 shares) | $10.95 | |
| Class L: | ||
| Net Asset Value, offering price and redemption price per share ($108,907 ÷ 9,944 shares) | $10.95 | |
| Class N: | ||
| Net Asset Value, offering price and redemption price per share ($108,141 ÷ 9,892 shares) | $10.93 |
See accompanying notes which are an integral part of the financial statements.
Statement of Operations
| Six months ended September 30, 2016 (Unaudited) | ||
| Investment Income | ||
| Income distributions from underlying funds | $5,069 | |
| Expenses | ||
| Transfer agent fees | $1,288 | |
| Distribution and service plan fees | 131 | |
| Independent trustees' fees and expenses | 3 | |
| Total expenses before reductions | 1,422 | |
| Expense reductions | (601) | 821 |
| Net investment income (loss) | 4,248 | |
| Realized and Unrealized Gain (Loss) | ||
| Realized gain (loss) on sale of underlying fund shares | (13,599) | |
| Capital gain distributions from underlying funds | 32,510 | |
| Total net realized gain (loss) | 18,911 | |
| Change in net unrealized appreciation (depreciation) on underlying funds | 69,596 | |
| Net gain (loss) | 88,507 | |
| Net increase (decrease) in net assets resulting from operations | $92,755 |
See accompanying notes which are an integral part of the financial statements.
Statement of Changes in Net Assets
| Six months ended September 30, 2016 (Unaudited) | Year ended March 31, 2016 | |
| Increase (Decrease) in Net Assets | ||
| Operations | ||
| Net investment income (loss) | $4,248 | $12,305 |
| Net realized gain (loss) | 18,911 | 31,574 |
| Change in net unrealized appreciation (depreciation) | 69,596 | (85,853) |
| Net increase (decrease) in net assets resulting from operations | 92,755 | (41,974) |
| Distributions to shareholders from net investment income | (336) | (12,018) |
| Distributions to shareholders from net realized gain | (18,095) | (76,953) |
| Total distributions | (18,431) | (88,971) |
| Share transactions - net increase (decrease) | 9,185 | 302,445 |
| Total increase (decrease) in net assets | 83,509 | 171,500 |
| Net Assets | ||
| Beginning of period | 1,350,079 | 1,178,579 |
| End of period | $1,433,588 | $1,350,079 |
| Other Information | ||
| Undistributed net investment income end of period | $4,199 | $287 |
See accompanying notes which are an integral part of the financial statements.
Financial Highlights — Fidelity Multi-Manager 2050 Fund
| Six months ended (Unaudited) September 30, | Years ended March 31, | ||||
| 2016 | 2016 | 2015 | 2014 | 2013 A | |
| Selected Per–Share Data | |||||
| Net asset value, beginning of period | $10.37 | $11.67 | $11.85 | $10.60 | $10.00 |
| Income from Investment Operations | |||||
| Net investment income (loss)B | .03 | .11 | .15 | .16 | .06 |
| Net realized and unrealized gain (loss) | .70 | (.58) | .63 | 1.43 | .54 |
| Total from investment operations | .73 | (.47) | .78 | 1.59 | .60 |
| Distributions from net investment income | –C | (.11) | (.16) | (.15) | – |
| Distributions from net realized gain | (.15) | (.72) | (.81) | (.19) | – |
| Total distributions | (.15) | (.83) | (.96)D | (.34) | – |
| Net asset value, end of period | $10.95 | $10.37 | $11.67 | $11.85 | $10.60 |
| Total ReturnE,F | 7.13% | (4.38)% | 6.85% | 15.13% | 6.00% |
| Ratios to Average Net AssetsG,H | |||||
| Expenses before reductions | .20%I | .22% | .20% | .20% | .21%I |
| Expenses net of fee waivers, if any | .10%I | .10% | .10% | .10% | .10%I |
| Expenses net of all reductions | .10%I | .10% | .10% | .10% | .10%I |
| Net investment income (loss) | .64%I | 1.06% | 1.28% | 1.38% | 2.04%I |
| Supplemental Data | |||||
| Net assets, end of period (000 omitted) | $1,217 | $1,137 | $956 | $611 | $106 |
| Portfolio turnover rateG | 45%I | 31% | 15% | 21% | 1%J |
A For the period December 20, 2012 (commencement of operations) to March 31, 2013.
B Calculated based on average shares outstanding during the period.
C Amount represents less than $.005 per share.
D Total distributions of $.96 per share is comprised of distributions from net investment income of $.156 and distributions from net realized gain of $.806 per share.
E Total returns for periods of less than one year are not annualized.
F Total returns would have been lower if certain expenses had not been reduced during the applicable periods shown.
G Amounts do not include the activity of the Underlying Funds.
H Expense ratios reflect operating expenses of the class. Expenses before reductions do not reflect amounts reimbursed by the investment adviser or reductions from expense offset arrangements and do not represent the amount paid by the class during periods when reimbursements or reductions occur. Expense ratios before reductions for start-up periods may not be representative of longer-term operating periods. Expenses net of fee waivers reflect expenses after reimbursement by the investment adviser but prior to reductions from expense offset arrangements. Expenses net of all reductions represent the net expenses paid by the class but do not include expenses of the underlying funds in which the Fund invests.
I Annualized
J Amount not annualized.
See accompanying notes which are an integral part of the financial statements.
Financial Highlights — Fidelity Multi-Manager 2050 Fund Class L
| Six months ended (Unaudited) September 30, | Years ended March 31, | |||
| 2016 | 2016 | 2015 | 2014 A | |
| Selected Per–Share Data | ||||
| Net asset value, beginning of period | $10.37 | $11.67 | $11.85 | $11.56 |
| Income from Investment Operations | ||||
| Net investment income (loss)B | .03 | .11 | .15 | .07 |
| Net realized and unrealized gain (loss) | .70 | (.58) | .63 | .45 |
| Total from investment operations | .73 | (.47) | .78 | .52 |
| Distributions from net investment income | –C | (.11) | (.16) | (.09) |
| Distributions from net realized gain | (.15) | (.72) | (.81) | (.15) |
| Total distributions | (.15) | (.83) | (.96)D | (.23)E |
| Net asset value, end of period | $10.95 | $10.37 | $11.67 | $11.85 |
| Total ReturnF,G | 7.12% | (4.39)% | 6.84% | 4.54% |
| Ratios to Average Net AssetsH,I | ||||
| Expenses before reductions | .10%J | .11% | .11% | .11%J |
| Expenses net of fee waivers, if any | .10%J | .10% | .10% | .10%J |
| Expenses net of all reductions | .10%J | .10% | .10% | .10%J |
| Net investment income (loss) | .63%J | 1.05% | 1.28% | 1.99%J |
| Supplemental Data | ||||
| Net assets, end of period (000 omitted) | $109 | $107 | $112 | $105 |
| Portfolio turnover rateH | 45%J | 31% | 15% | 21% |
A For the period December 4, 2013 (commencement of sale of shares) to March 31, 2014.
B Calculated based on average shares outstanding during the period.
C Amount represents less than $.005 per share.
D Total distributions of $.96 per share is comprised of distributions from net investment income of $.156 and distributions from net realized gain of $.806 per share.
E Total distributions of $.23 per share is comprised of distributions from net investment income of $.086 and distributions from net realized gain of $.145 per share.
F Total returns for periods of less than one year are not annualized.
G Total returns would have been lower if certain expenses had not been reduced during the applicable periods shown.
H Amounts do not include the activity of the Underlying Funds.
I Expense ratios reflect operating expenses of the class. Expenses before reductions do not reflect amounts reimbursed by the investment adviser or reductions from expense offset arrangements and do not represent the amount paid by the class during periods when reimbursements or reductions occur. Expenses net of fee waivers reflect expenses after reimbursement by the investment adviser but prior to reductions from expense offset arrangements. Expenses net of all reductions represent the net expenses paid by the class but do not include expenses of the underlying funds in which the Fund invests.
J Annualized
See accompanying notes which are an integral part of the financial statements.
Financial Highlights — Fidelity Multi-Manager 2050 Fund Class N
| Six months ended (Unaudited) September 30, | Years ended March 31, | |||
| 2016 | 2016 | 2015 | 2014 A | |
| Selected Per–Share Data | ||||
| Net asset value, beginning of period | $10.36 | $11.66 | $11.84 | $11.56 |
| Income from Investment Operations | ||||
| Net investment income (loss)B | .02 | .09 | .12 | .06 |
| Net realized and unrealized gain (loss) | .69 | (.59) | .63 | .45 |
| Total from investment operations | .71 | (.50) | .75 | .51 |
| Distributions from net investment income | – | (.09) | (.13) | (.08) |
| Distributions from net realized gain | (.14) | (.71) | (.81) | (.15) |
| Total distributions | (.14) | (.80) | (.93)C | (.23) |
| Net asset value, end of period | $10.93 | $10.36 | $11.66 | $11.84 |
| Total ReturnD,E | 6.99% | (4.62)% | 6.57% | 4.43% |
| Ratios to Average Net AssetsF,G | ||||
| Expenses before reductions | .35%H | .36% | .36% | .37%H |
| Expenses net of fee waivers, if any | .35%H | .35% | .35% | .35%H |
| Expenses net of all reductions | .35%H | .35% | .35% | .35%H |
| Net investment income (loss) | .38%H | .80% | 1.03% | 1.74%H |
| Supplemental Data | ||||
| Net assets, end of period (000 omitted) | $108 | $106 | $111 | $104 |
| Portfolio turnover rateF | 45%H | 31% | 15% | 21% |
A For the period December 4, 2013 (commencement of sale of shares) to March 31, 2014.
B Calculated based on average shares outstanding during the period.
C Total distributions of $.93 per share is comprised of distributions from net investment income of $.125 and distributions from net realized gain of $.806 per share.
D Total returns for periods of less than one year are not annualized.
E Total returns would have been lower if certain expenses had not been reduced during the applicable periods shown.
F Amounts do not include the activity of the Underlying Funds.
G Expense ratios reflect operating expenses of the class. Expenses before reductions do not reflect amounts reimbursed by the investment adviser or reductions from expense offset arrangements and do not represent the amount paid by the class during periods when reimbursements or reductions occur. Expenses net of fee waivers reflect expenses after reimbursement by the investment adviser but prior to reductions from expense offset arrangements. Expenses net of all reductions represent the net expenses paid by the class but do not include expenses of the underlying funds in which the Fund invests.
H Annualized
See accompanying notes which are an integral part of the financial statements.
Fidelity® Multi-Manager 2055 Fund
Investment Summary (Unaudited)
The information in the following tables is based on the direct investments of the Fund.Top Holdings as of September 30, 2016
| % of fund's net assets | % of fund's net assets 6 months ago | |
| Strategic Advisers International Multi-Manager Fund Class F | 20.7 | 20.2 |
| Strategic Advisers Core Multi-Manager Fund Class F | 18.6 | 19.1 |
| Strategic Advisers Value Multi-Manager Fund Class F | 18.6 | 19.1 |
| Strategic Advisers Growth Multi-Manager Fund Class F | 15.6 | 16.0 |
| Strategic Advisers Emerging Markets Fund of Funds Class F | 10.0 | 9.4 |
| Strategic Advisers Small-Mid Cap Multi-Manager Fund Class F | 9.4 | 9.6 |
| Strategic Advisers Income Opportunities Fund of Funds Class F | 2.8 | 2.9 |
| Fidelity Series Commodity Strategy Fund Class F | 1.7 | 1.3 |
| Fidelity Series Emerging Markets Debt Fund Class F | 0.7 | 0.6 |
| Fidelity Series Inflation-Protected Bond Index Fund Class F | 0.6 | 0.5 |
| 98.7 | 98.7 |
Asset Allocation (% of fund's net assets)
| Period end | ||
| Domestic Equity Funds | 63.9% | |
| International Equity Funds | 30.7% | |
| Bond Funds | 5.3% | |
| Short-Term Funds | 0.1% | |

| Six months ago | ||
| Domestic Equity Funds | 65.1% | |
| International Equity Funds | 29.6% | |
| Bond Funds | 5.3% | |

Domestic Equity Funds category includes Fidelity Series Commodity Strategy Fund which invests in commodity-related investments.
Fidelity® Multi-Manager 2055 Fund
Investments September 30, 2016 (Unaudited)
Showing Percentage of Net Assets
| Domestic Equity Funds - 63.9% | |||
| Shares | Value | ||
| Fidelity Series Commodity Strategy Fund Class F (a)(b) | 4,590 | $24,556 | |
| Strategic Advisers Core Multi-Manager Fund Class F (b) | 22,702 | 270,830 | |
| Strategic Advisers Growth Multi-Manager Fund Class F (b) | 17,368 | 227,348 | |
| Strategic Advisers Small-Mid Cap Multi-Manager Fund Class F (b) | 12,611 | 136,447 | |
| Strategic Advisers Value Multi-Manager Fund Class F (b) | 19,872 | 270,656 | |
| TOTAL DOMESTIC EQUITY FUNDS | |||
| (Cost $962,197) | 929,837 | ||
| International Equity Funds - 30.7% | |||
| Strategic Advisers Emerging Markets Fund of Funds Class F (b) | 15,466 | 145,223 | |
| Strategic Advisers International Multi-Manager Fund Class F (b) | 26,124 | 300,952 | |
| TOTAL INTERNATIONAL EQUITY FUNDS | |||
| (Cost $448,854) | 446,175 | ||
| Bond Funds - 5.3% | |||
| Fidelity Series Emerging Markets Debt Fund Class F (b) | 942 | 9,762 | |
| Fidelity Series Floating Rate High Income Fund Class F (b) | 385 | 3,627 | |
| Fidelity Series Inflation-Protected Bond Index Fund Class F (b) | 857 | 8,639 | |
| Fidelity Series Real Estate Income Fund Class F (b) | 635 | 7,129 | |
| Strategic Advisers Core Income Multi-Manager Fund Class F (b) | 691 | 6,991 | |
| Strategic Advisers Income Opportunities Fund of Funds Class F (b) | 4,173 | 41,313 | |
| TOTAL BOND FUNDS | |||
| (Cost $78,255) | 77,461 | ||
| Short-Term Funds - 0.1% | |||
| Fidelity Investments Money Market Government Portfolio Institutional Class 0.31% (b)(c) | 465 | 465 | |
| Fidelity Series Short-Term Credit Fund Class F (b) | 25 | 249 | |
| TOTAL SHORT-TERM FUNDS | |||
| (Cost $713) | 714 | ||
| TOTAL INVESTMENT PORTFOLIO - 100.0% | |||
| (Cost $1,490,019) | 1,454,187 | ||
| NET OTHER ASSETS (LIABILITIES) - 0.0% | (136) | ||
| NET ASSETS - 100% | $1,454,051 |
Legend
(a) Non-income producing
(b) Affiliated Fund
(c) The rate quoted is the annualized seven-day yield of the fund at period end.
Affiliated Underlying Funds
Information regarding the Fund's fiscal year to date purchases and sales of the affiliated Underlying Funds and income earned by the Fund from investments in affiliated Underlying Funds is as follows:
| Affiliate | Value, beginning of period | Purchases | Sales Proceeds | Dividend Income | Value, end of period |
| Fidelity Investments Money Market Government Portfolio Institutional Class 0.31% | $439 | $128 | $103 | $-- | $465 |
| Fidelity Series Commodity Strategy Fund Class F | 17,731 | 9,389 | 3,869 | -- | 24,556 |
| Fidelity Series Emerging Markets Debt Fund Class F | 8,817 | 2,102 | 1,930 | 252 | 9,762 |
| Fidelity Series Floating Rate High Income Fund Class F | 3,424 | 847 | 805 | 76 | 3,627 |
| Fidelity Series Inflation-Protected Bond Index Fund Class F | 7,044 | 3,297 | 1,850 | 8 | 8,639 |
| Fidelity Series Real Estate Income Fund Class F | 6,737 | 1,898 | 1,695 | 176 | 7,129 |
| Fidelity Series Short-Term Credit Fund Class F | 211 | 106 | 69 | 1 | 249 |
| Strategic Advisers Core Income Multi-Manager Fund Class F | 6,894 | 2,536 | 2,609 | 76 | 6,991 |
| Strategic Advisers Core Multi-Manager Fund Class F | 263,072 | 70,116 | 64,019 | 846 | 270,830 |
| Strategic Advisers Emerging Markets Fund of Funds Class F | 129,496 | 32,151 | 30,266 | -- | 145,223 |
| Strategic Advisers Growth Multi-Manager Fund Class F | 219,840 | 59,672 | 54,091 | 638 | 227,348 |
| Strategic Advisers Income Opportunities Fund of Funds Class F | 39,820 | 8,287 | 9,326 | 1,097 | 41,313 |
| Strategic Advisers International Multi-Manager Fund Class F | 277,647 | 79,082 | 69,619 | -- | 300,952 |
| Strategic Advisers Small-Mid Cap Multi-Manager Fund Class F | 132,336 | 26,082 | 33,791 | -- | 136,447 |
| Strategic Advisers Value Multi-Manager Fund Class F | 263,199 | 63,221 | 61,654 | 1,793 | 270,656 |
| Total | $1,376,707 | $358,914 | $335,696 | $4,963 | $1,454,187 |
Investment Valuation
All investments are categorized as Level 1 under the Fair Value Hierarchy. The inputs or methodology used for valuing securities may not be an indication of the risk associated with investing in those securities. For more information on valuation inputs please refer to the Investment Valuation section in the accompanying Notes to Financial Statements.
See accompanying notes which are an integral part of the financial statements.
Fidelity® Multi-Manager 2055 Fund
Financial Statements
Statement of Assets and Liabilities
| September 30, 2016 (Unaudited) | ||
| Assets | ||
| Investment in securities, at value (cost $1,490,019) — See accompanying schedule | $1,454,187 | |
| Receivable for investments sold | 48,778 | |
| Receivable for fund shares sold | 16,903 | |
| Receivable from investment adviser for expense reductions | 146 | |
| Total assets | 1,520,014 | |
| Liabilities | ||
| Payable for investments purchased | $2,624 | |
| Payable for fund shares redeemed | 63,063 | |
| Distribution and service plan fees payable | 22 | |
| Other affiliated payables | 254 | |
| Total liabilities | 65,963 | |
| Net Assets | $1,454,051 | |
| Net Assets consist of: | ||
| Paid in capital | $1,488,856 | |
| Undistributed net investment income | 4,151 | |
| Accumulated undistributed net realized gain (loss) on investments | (3,124) | |
| Net unrealized appreciation (depreciation) on investments | (35,832) | |
| Net Assets | $1,454,051 | |
| Multi-Manager 2055: | ||
| Net Asset Value, offering price and redemption price per share ($1,237,043 ÷ 110,895 shares) | $11.16 | |
| Class L: | ||
| Net Asset Value, offering price and redemption price per share ($108,885 ÷ 9,759 shares) | $11.16 | |
| Class N: | ||
| Net Asset Value, offering price and redemption price per share ($108,123 ÷ 9,715 shares) | $11.13 |
See accompanying notes which are an integral part of the financial statements.
Statement of Operations
| Six months ended September 30, 2016 (Unaudited) | ||
| Investment Income | ||
| Income distributions from underlying funds | $4,963 | |
| Expenses | ||
| Transfer agent fees | $1,497 | |
| Distribution and service plan fees | 131 | |
| Independent trustees' fees and expenses | 3 | |
| Total expenses before reductions | 1,631 | |
| Expense reductions | (819) | 812 |
| Net investment income (loss) | 4,151 | |
| Realized and Unrealized Gain (Loss) | ||
| Realized gain (loss) on sale of underlying fund shares | (23,011) | |
| Capital gain distributions from underlying funds | 31,584 | |
| Total net realized gain (loss) | 8,573 | |
| Change in net unrealized appreciation (depreciation) on underlying funds | 77,270 | |
| Net gain (loss) | 85,843 | |
| Net increase (decrease) in net assets resulting from operations | $89,994 |
See accompanying notes which are an integral part of the financial statements.
Statement of Changes in Net Assets
| Six months ended September 30, 2016 (Unaudited) | Year ended March 31, 2016 | |
| Increase (Decrease) in Net Assets | ||
| Operations | ||
| Net investment income (loss) | $4,151 | $12,241 |
| Net realized gain (loss) | 8,573 | 38,291 |
| Change in net unrealized appreciation (depreciation) | 77,270 | (97,832) |
| Net increase (decrease) in net assets resulting from operations | 89,994 | (47,300) |
| Distributions to shareholders from net investment income | – | (11,755) |
| Distributions to shareholders from net realized gain | (18,897) | (69,001) |
| Total distributions | (18,897) | (80,756) |
| Share transactions - net increase (decrease) | 6,374 | 425,655 |
| Total increase (decrease) in net assets | 77,471 | 297,599 |
| Net Assets | ||
| Beginning of period | 1,376,580 | 1,078,981 |
| End of period | $1,454,051 | $1,376,580 |
| Other Information | ||
| Undistributed net investment income end of period | $4,151 | $– |
See accompanying notes which are an integral part of the financial statements.
Financial Highlights — Fidelity Multi-Manager 2055 Fund
| Six months ended (Unaudited) September 30, | Years ended March 31, | ||||
| 2016 | 2016 | 2015 | 2014 | 2013 A | |
| Selected Per–Share Data | |||||
| Net asset value, beginning of period | $10.57 | $11.84 | $11.95 | $10.62 | $10.00 |
| Income from Investment Operations | |||||
| Net investment income (loss)B | .03 | .11 | .15 | .15 | .06 |
| Net realized and unrealized gain (loss) | .72 | (.59) | .64 | 1.50 | .56 |
| Total from investment operations | .75 | (.48) | .79 | 1.65 | .62 |
| Distributions from net investment income | – | (.10) | (.15) | (.14) | – |
| Distributions from net realized gain | (.16) | (.68) | (.75) | (.18) | – |
| Total distributions | (.16) | (.79)C | (.90) | (.32) | – |
| Net asset value, end of period | $11.16 | $10.57 | $11.84 | $11.95 | $10.62 |
| Total ReturnD,E | 7.17% | (4.38)% | 6.83% | 15.67% | 6.20% |
| Ratios to Average Net AssetsF,G | |||||
| Expenses before reductions | .24%H | .25% | .26% | .24% | .21%H |
| Expenses net of fee waivers, if any | .10%H | .10% | .10% | .10% | .10%H |
| Expenses net of all reductions | .10%H | .10% | .10% | .10% | .10%H |
| Net investment income (loss) | .63%H | 1.05% | 1.26% | 1.34% | 1.98%H |
| Supplemental Data | |||||
| Net assets, end of period (000 omitted) | $1,237 | $1,164 | $856 | $357 | $106 |
| Portfolio turnover rateG | 49%H | 15% | 11% | 19% | 1%I |
A For the period December 20, 2012 (commencement of operations) to March 31, 2013.
B Calculated based on average shares outstanding during the period.
C Total distributions of $.79 per share is comprised of distributions from net investment income of $.104 and distributions from net realized gain of $.683 per share.
D Total returns for periods of less than one year are not annualized.
E Total returns would have been lower if certain expenses had not been reduced during the applicable periods shown.
F Expense ratios reflect operating expenses of the class. Expenses before reductions do not reflect amounts reimbursed by the investment adviser or reductions from expense offset arrangements and do not represent the amount paid by the class during periods when reimbursements or reductions occur. Expense ratios before reductions for start-up periods may not be representative of longer-term operating periods. Expenses net of fee waivers reflect expenses after reimbursement by the investment adviser but prior to reductions from expense offset arrangements. Expenses net of all reductions represent the net expenses paid by the class but do not include expenses of the underlying funds in which the Fund invests.
G Amounts do not include the activity of the Underlying Funds.
H Annualized
I Amount not annualized.
See accompanying notes which are an integral part of the financial statements.
Financial Highlights — Fidelity Multi-Manager 2055 Fund Class L
| Six months ended (Unaudited) September 30, | Years ended March 31, | |||
| 2016 | 2016 | 2015 | 2014 A | |
| Selected Per–Share Data | ||||
| Net asset value, beginning of period | $10.57 | $11.84 | $11.95 | $11.64 |
| Income from Investment Operations | ||||
| Net investment income (loss)B | .03 | .12 | .15 | .07 |
| Net realized and unrealized gain (loss) | .72 | (.60) | .64 | .46 |
| Total from investment operations | .75 | (.48) | .79 | .53 |
| Distributions from net investment income | – | (.10) | (.15) | (.08) |
| Distributions from net realized gain | (.16) | (.68) | (.75) | (.14) |
| Total distributions | (.16) | (.79)C | (.90) | (.22) |
| Net asset value, end of period | $11.16 | $10.57 | $11.84 | $11.95 |
| Total ReturnD,E | 7.17% | (4.39)% | 6.81% | 4.54% |
| Ratios to Average Net AssetsF,G | ||||
| Expenses before reductions | .10%H | .11% | .12% | .12%H |
| Expenses net of fee waivers, if any | .10%H | .10% | .10% | .10%H |
| Expenses net of all reductions | .10%H | .10% | .10% | .10%H |
| Net investment income (loss) | .63%H | 1.05% | 1.26% | 1.96%H |
| Supplemental Data | ||||
| Net assets, end of period (000 omitted) | $109 | $107 | $112 | $105 |
| Portfolio turnover rateG | 49%H | 15% | 11% | 19% |
A For the period December 4, 2013 (commencement of sale of shares) to March 31, 2014.
B Calculated based on average shares outstanding during the period.
C Total distributions of $.79 per share is comprised of distributions from net investment income of $.103 and distributions from net realized gain of $.683 per share.
D Total returns for periods of less than one year are not annualized.
E Total returns would have been lower if certain expenses had not been reduced during the applicable periods shown.
F Expense ratios reflect operating expenses of the class. Expenses before reductions do not reflect amounts reimbursed by the investment adviser or reductions from expense offset arrangements and do not represent the amount paid by the class during periods when reimbursements or reductions occur. Expenses net of fee waivers reflect expenses after reimbursement by the investment adviser but prior to reductions from expense offset arrangements. Expenses net of all reductions represent the net expenses paid by the class but do not include expenses of the underlying funds in which the Fund invests.
G Amounts do not include the activity of the Underlying Funds.
H Annualized
See accompanying notes which are an integral part of the financial statements.
Financial Highlights — Fidelity Multi-Manager 2055 Fund Class N
| Six months ended (Unaudited) September 30, | Years ended March 31, | |||
| 2016 | 2016 | 2015 | 2014 A | |
| Selected Per–Share Data | ||||
| Net asset value, beginning of period | $10.56 | $11.83 | $11.94 | $11.64 |
| Income from Investment Operations | ||||
| Net investment income (loss)B | .02 | .09 | .12 | .06 |
| Net realized and unrealized gain (loss) | .71 | (.59) | .64 | .45 |
| Total from investment operations | .73 | (.50) | .76 | .51 |
| Distributions from net investment income | – | (.08) | (.12) | (.08) |
| Distributions from net realized gain | (.16) | (.68) | (.75) | (.14) |
| Total distributions | (.16) | (.77)C | (.87) | (.21)D |
| Net asset value, end of period | $11.13 | $10.56 | $11.83 | $11.94 |
| Total ReturnE,F | 6.99% | (4.57)% | 6.54% | 4.44% |
| Ratios to Average Net AssetsG,H | ||||
| Expenses before reductions | .35%I | .36% | .37% | .38%I |
| Expenses net of fee waivers, if any | .35%I | .35% | .35% | .35%I |
| Expenses net of all reductions | .35%I | .35% | .35% | .35%I |
| Net investment income (loss) | .38%I | .80% | 1.01% | 1.71%I |
| Supplemental Data | ||||
| Net assets, end of period (000 omitted) | $108 | $106 | $111 | $104 |
| Portfolio turnover rateH | 49%I | 15% | 11% | 19% |
A For the period December 4, 2013 (commencement of sale of shares) to March 31, 2014.
B Calculated based on average shares outstanding during the period.
C Total distributions of $.77 per share is comprised of distributions from net investment income of $.082 and distributions from net realized gain of $.683 per share.
D Total distributions of $.21 per share is comprised of distributions from net investment income of $.076 and distributions from net realized gain of $.137 per share.
E Total returns for periods of less than one year are not annualized.
F Total returns would have been lower if certain expenses had not been reduced during the applicable periods shown.
G Expense ratios reflect operating expenses of the class. Expenses before reductions do not reflect amounts reimbursed by the investment adviser or reductions from expense offset arrangements and do not represent the amount paid by the class during periods when reimbursements or reductions occur. Expenses net of fee waivers reflect expenses after reimbursement by the investment adviser but prior to reductions from expense offset arrangements. Expenses net of all reductions represent the net expenses paid by the class but do not include expenses of the underlying funds in which the Fund invests.
H Amounts do not include the activity of the Underlying Funds.
I Annualized
See accompanying notes which are an integral part of the financial statements.
Fidelity® Multi-Manager 2060 Fund
Investment Summary (Unaudited)
The information in the following tables is based on the direct investments of the Fund.Top Holdings as of September 30, 2016
| % of fund's net assets | % of fund's net assets 6 months ago | |
| Strategic Advisers International Multi-Manager Fund Class F | 20.7 | 20.1 |
| Strategic Advisers Core Multi-Manager Fund Class F | 18.6 | 19.1 |
| Strategic Advisers Value Multi-Manager Fund Class F | 18.6 | 19.1 |
| Strategic Advisers Growth Multi-Manager Fund Class F | 15.6 | 16.0 |
| Strategic Advisers Emerging Markets Fund of Funds Class F | 10.0 | 9.4 |
| Strategic Advisers Small-Mid Cap Multi-Manager Fund Class F | 9.4 | 9.6 |
| Strategic Advisers Income Opportunities Fund of Funds Class F | 2.8 | 3.0 |
| Fidelity Series Commodity Strategy Fund Class F | 1.7 | 1.3 |
| Fidelity Series Emerging Markets Debt Fund Class F | 0.7 | 0.6 |
| Fidelity Series Inflation-Protected Bond Index Fund Class F | 0.6 | 0.5 |
| 98.7 | 98.7 |
Asset Allocation (% of fund's net assets)
| Period end | ||
| Domestic Equity Funds | 63.9% | |
| International Equity Funds | 30.7% | |
| Bond Funds | 5.3% | |
| Short-Term Funds | 0.1% | |

| Six months ago | ||
| Domestic Equity Funds | 65.1% | |
| International Equity Funds | 29.5% | |
| Bond Funds | 5.4% | |

Domestic Equity Funds category includes Fidelity Series Commodity Strategy Fund which invests in commodity-related investments.
Fidelity® Multi-Manager 2060 Fund
Investments September 30, 2016 (Unaudited)
Showing Percentage of Net Assets
| Domestic Equity Funds - 63.9% | |||
| Shares | Value | ||
| Fidelity Series Commodity Strategy Fund Class F (a)(b) | 1,705 | $9,121 | |
| Strategic Advisers Core Multi-Manager Fund Class F (b) | 8,334 | 99,427 | |
| Strategic Advisers Growth Multi-Manager Fund Class F (b) | 6,376 | 83,466 | |
| Strategic Advisers Small-Mid Cap Multi-Manager Fund Class F (b) | 4,629 | 50,084 | |
| Strategic Advisers Value Multi-Manager Fund Class F (b) | 7,296 | 99,373 | |
| TOTAL DOMESTIC EQUITY FUNDS | |||
| (Cost $351,071) | 341,471 | ||
| International Equity Funds - 30.7% | |||
| Strategic Advisers Emerging Markets Fund of Funds Class F (b) | 5,673 | 53,268 | |
| Strategic Advisers International Multi-Manager Fund Class F (b) | 9,594 | 110,522 | |
| TOTAL INTERNATIONAL EQUITY FUNDS | |||
| (Cost $166,031) | 163,790 | ||
| Bond Funds - 5.3% | |||
| Fidelity Series Emerging Markets Debt Fund Class F (b) | 340 | 3,520 | |
| Fidelity Series Floating Rate High Income Fund Class F (b) | 141 | 1,329 | |
| Fidelity Series Inflation-Protected Bond Index Fund Class F (b) | 318 | 3,208 | |
| Fidelity Series Real Estate Income Fund Class F (b) | 233 | 2,610 | |
| Strategic Advisers Core Income Multi-Manager Fund Class F (b) | 264 | 2,670 | |
| Strategic Advisers Income Opportunities Fund of Funds Class F (b) | 1,532 | 15,163 | |
| TOTAL BOND FUNDS | |||
| (Cost $28,756) | 28,500 | ||
| Short-Term Funds - 0.1% | |||
| Fidelity Investments Money Market Government Portfolio Institutional Class 0.31% (b)(c) | 171 | 171 | |
| Fidelity Series Short-Term Credit Fund Class F (b) | 9 | 91 | |
| TOTAL SHORT-TERM FUNDS | |||
| (Cost $262) | 262 | ||
| TOTAL INVESTMENT PORTFOLIO - 100.0% | |||
| (Cost $546,120) | 534,023 | ||
| NET OTHER ASSETS (LIABILITIES) - 0.0% | (13) | ||
| NET ASSETS - 100% | $534,010 |
Legend
(a) Non-income producing
(b) Affiliated Fund
(c) The rate quoted is the annualized seven-day yield of the fund at period end.
Affiliated Underlying Funds
Information regarding the Fund's fiscal year to date purchases and sales of the affiliated Underlying Funds and income earned by the Fund from investments in affiliated Underlying Funds is as follows:
| Affiliate | Value, beginning of period | Purchases | Sales Proceeds | Dividend Income | Value, end of period |
| Fidelity Investments Money Market Government Portfolio Institutional Class 0.31% | $157 | $36 | $22 | $-- | $171 |
| Fidelity Series Commodity Strategy Fund Class F | 6,272 | 3,168 | 793 | -- | 9,121 |
| Fidelity Series Emerging Markets Debt Fund Class F | 3,094 | 534 | 397 | 93 | 3,520 |
| Fidelity Series Floating Rate High Income Fund Class F | 1,221 | 213 | 166 | 29 | 1,329 |
| Fidelity Series Inflation-Protected Bond Index Fund Class F | 2,541 | 1,030 | 418 | 3 | 3,208 |
| Fidelity Series Real Estate Income Fund Class F | 2,403 | 512 | 379 | 66 | 2,610 |
| Fidelity Series Short-Term Credit Fund Class F | 78 | 27 | 14 | -- | 91 |
| Strategic Advisers Core Income Multi-Manager Fund Class F | 2,459 | 902 | 755 | 29 | 2,670 |
| Strategic Advisers Core Multi-Manager Fund Class F | 93,978 | 18,636 | 13,867 | 329 | 99,427 |
| Strategic Advisers Emerging Markets Fund of Funds Class F | 46,146 | 8,015 | 6,331 | -- | 53,268 |
| Strategic Advisers Growth Multi-Manager Fund Class F | 78,419 | 16,278 | 11,986 | 247 | 83,466 |
| Strategic Advisers Income Opportunities Fund of Funds Class F | 14,594 | 1,945 | 2,370 | 428 | 15,163 |
| Strategic Advisers International Multi-Manager Fund Class F | 98,771 | 21,158 | 14,970 | -- | 110,522 |
| Strategic Advisers Small-Mid Cap Multi-Manager Fund Class F | 47,067 | 6,246 | 7,863 | -- | 50,084 |
| Strategic Advisers Value Multi-Manager Fund Class F | 93,886 | 16,304 | 13,219 | 695 | 99,373 |
| Total | $491,086 | $95,004 | $73,550 | $1,919 | $534,023 |
Investment Valuation
All investments are categorized as Level 1 under the Fair Value Hierarchy. The inputs or methodology used for valuing securities may not be an indication of the risk associated with investing in those securities. For more information on valuation inputs please refer to the Investment Valuation section in the accompanying Notes to Financial Statements.
See accompanying notes which are an integral part of the financial statements.
Fidelity® Multi-Manager 2060 Fund
Financial Statements
Statement of Assets and Liabilities
| September 30, 2016 (Unaudited) | ||
| Assets | ||
| Investment in securities, at value (cost $546,120) — See accompanying schedule | $534,023 | |
| Cash | 66 | |
| Receivable for investments sold | 13,987 | |
| Receivable for fund shares sold | 4,268 | |
| Receivable from investment adviser for expense reductions | 31 | |
| Total assets | 552,375 | |
| Liabilities | ||
| Payable for investments purchased | $1,032 | |
| Payable for fund shares redeemed | 17,243 | |
| Distribution and service plan fees payable | 21 | |
| Other affiliated payables | 69 | |
| Total liabilities | 18,365 | |
| Net Assets | $534,010 | |
| Net Assets consist of: | ||
| Paid in capital | $537,040 | |
| Undistributed net investment income | 1,539 | |
| Accumulated undistributed net realized gain (loss) on investments | 7,528 | |
| Net unrealized appreciation (depreciation) on investments | (12,097) | |
| Net Assets | $534,010 | |
| Multi-Manager 2060: | ||
| Net Asset Value, offering price and redemption price per share ($329,595 ÷ 33,795 shares) | $9.75 | |
| Class L: | ||
| Net Asset Value, offering price and redemption price per share ($102,484 ÷ 10,505 shares) | $9.76 | |
| Class N: | ||
| Net Asset Value, offering price and redemption price per share ($101,931 ÷ 10,473 shares) | $9.73 |
See accompanying notes which are an integral part of the financial statements.
Statement of Operations
| Six months ended September 30, 2016 (Unaudited) | ||
| Investment Income | ||
| Income distributions from underlying funds | $1,919 | |
| Expenses | ||
| Transfer agent fees | $423 | |
| Distribution and service plan fees | 123 | |
| Independent trustees' fees and expenses | 1 | |
| Total expenses before reductions | 547 | |
| Expense reductions | (167) | 380 |
| Net investment income (loss) | 1,539 | |
| Realized and Unrealized Gain (Loss) | ||
| Realized gain (loss) on sale of underlying fund shares | (3,050) | |
| Capital gain distributions from underlying funds | 12,246 | |
| Total net realized gain (loss) | 9,196 | |
| Change in net unrealized appreciation (depreciation) on underlying funds | 24,605 | |
| Net gain (loss) | 33,801 | |
| Net increase (decrease) in net assets resulting from operations | $35,340 |
See accompanying notes which are an integral part of the financial statements.
Statement of Changes in Net Assets
| Six months ended September 30, 2016 (Unaudited) | Year ended March 31, 2016 | |
| Increase (Decrease) in Net Assets | ||
| Operations | ||
| Net investment income (loss) | $1,539 | $4,003 |
| Net realized gain (loss) | 9,196 | 14,202 |
| Change in net unrealized appreciation (depreciation) | 24,605 | (33,708) |
| Net increase (decrease) in net assets resulting from operations | 35,340 | (15,503) |
| Distributions to shareholders from net investment income | – | (3,886) |
| Distributions to shareholders from net realized gain | (6,755) | (22,886) |
| Total distributions | (6,755) | (26,772) |
| Share transactions - net increase (decrease) | 14,419 | 185,709 |
| Total increase (decrease) in net assets | 43,004 | 143,434 |
| Net Assets | ||
| Beginning of period | 491,006 | 347,572 |
| End of period | $534,010 | $491,006 |
| Other Information | ||
| Undistributed net investment income end of period | $1,539 | $– |
See accompanying notes which are an integral part of the financial statements.
Financial Highlights — Fidelity Multi-Manager 2060 Fund
| Six months ended (Unaudited) September 30, | Years ended March 31, | ||
| 2016 | 2016 | 2015 A | |
| Selected Per–Share Data | |||
| Net asset value, beginning of period | $9.23 | $10.33 | $10.00 |
| Income from Investment Operations | |||
| Net investment income (loss)B | .03 | .10 | .08 |
| Net realized and unrealized gain (loss) | .62 | (.52) | .42 |
| Total from investment operations | .65 | (.42) | .50 |
| Distributions from net investment income | – | (.09) | (.08) |
| Distributions from net realized gain | (.13) | (.60) | (.09) |
| Total distributions | (.13) | (.68)C | (.17) |
| Net asset value, end of period | $9.75 | $9.23 | $10.33 |
| Total ReturnD,E | 7.15% | (4.37)% | 5.02% |
| Ratios to Average Net AssetsF,G | |||
| Expenses before reductions | .19%H | .20% | .15%H |
| Expenses net of fee waivers, if any | .10%H | .10% | .10%H |
| Expenses net of all reductions | .10%H | .10% | .10%H |
| Net investment income (loss) | .65%H | 1.07% | 1.14%H |
| Supplemental Data | |||
| Net assets, end of period (000 omitted) | $330 | $290 | $138 |
| Portfolio turnover rateG | 28%H | 8% | 13%H |
A For the period August 5, 2014 (commencement of operations) to March 31, 2015.
B Calculated based on average shares outstanding during the period.
C Total distributions of $.68 per share is comprised of distributions from net investment income of $.086 and distributions from net realized gain of $.596 per share.
D Total returns for periods of less than one year are not annualized.
E Total returns would have been lower if certain expenses had not been reduced during the applicable periods shown.
F Expense ratios reflect operating expenses of the class. Expenses before reductions do not reflect amounts reimbursed by the investment adviser or reductions from expense offset arrangements and do not represent the amount paid by the class during periods when reimbursements or reductions occur. Expense ratios before reductions for start-up periods may not be representative of longer-term operating periods. Expenses net of fee waivers reflect expenses after reimbursement by the investment adviser but prior to reductions from expense offset arrangements. Expenses net of all reductions represent the net expenses paid by the class but do not include expenses of the underlying funds in which the Fund invests.
G Amounts do not include the activity of the Underlying Funds.
H Annualized
See accompanying notes which are an integral part of the financial statements.
Financial Highlights — Fidelity Multi-Manager 2060 Fund Class L
| Six months ended (Unaudited) September 30, | Years ended March 31, | ||
| 2016 | 2016 | 2015 A | |
| Selected Per–Share Data | |||
| Net asset value, beginning of period | $9.24 | $10.34 | $10.00 |
| Income from Investment Operations | |||
| Net investment income (loss)B | .03 | .10 | .08 |
| Net realized and unrealized gain (loss) | .62 | (.52) | .43 |
| Total from investment operations | .65 | (.42) | .51 |
| Distributions from net investment income | – | (.08) | (.08) |
| Distributions from net realized gain | (.13) | (.60) | (.09) |
| Total distributions | (.13) | (.68) | (.17) |
| Net asset value, end of period | $9.76 | $9.24 | $10.34 |
| Total ReturnC,D | 7.14% | (4.38)% | 5.12% |
| Ratios to Average Net AssetsE,F | |||
| Expenses before reductions | .12%G | .14% | .14%G |
| Expenses net of fee waivers, if any | .10%G | .10% | .10%G |
| Expenses net of all reductions | .10%G | .10% | .10%G |
| Net investment income (loss) | .65%G | 1.08% | 1.13%G |
| Supplemental Data | |||
| Net assets, end of period (000 omitted) | $102 | $100 | $105 |
| Portfolio turnover rateF | 28%G | 8% | 13%G |
A For the period August 5, 2014 (commencement of operations) to March 31, 2015.
B Calculated based on average shares outstanding during the period.
C Total returns for periods of less than one year are not annualized.
D Total returns would have been lower if certain expenses had not been reduced during the applicable periods shown.
E Expense ratios reflect operating expenses of the class. Expenses before reductions do not reflect amounts reimbursed by the investment adviser or reductions from expense offset arrangements and do not represent the amount paid by the class during periods when reimbursements or reductions occur. Expenses net of fee waivers reflect expenses after reimbursement by the investment adviser but prior to reductions from expense offset arrangements. Expenses net of all reductions represent the net expenses paid by the class but do not include expenses of the underlying funds in which the Fund invests.
F Amounts do not include the activity of the Underlying Funds.
G Annualized
See accompanying notes which are an integral part of the financial statements.
Financial Highlights — Fidelity Multi-Manager 2060 Fund Class N
| Six months ended (Unaudited) September 30, | Years ended March 31, | ||
| 2016 | 2016 | 2015 A | |
| Selected Per–Share Data | |||
| Net asset value, beginning of period | $9.23 | $10.33 | $10.00 |
| Income from Investment Operations | |||
| Net investment income (loss)B | .02 | .08 | .06 |
| Net realized and unrealized gain (loss) | .61 | (.52) | .43 |
| Total from investment operations | .63 | (.44) | .49 |
| Distributions from net investment income | – | (.07) | (.07) |
| Distributions from net realized gain | (.13) | (.60) | (.09) |
| Total distributions | (.13) | (.66)C | (.16) |
| Net asset value, end of period | $9.73 | $9.23 | $10.33 |
| Total ReturnD,E | 6.93% | (4.57)% | 4.91% |
| Ratios to Average Net AssetsF,G | |||
| Expenses before reductions | .37%H | .39% | .38%H |
| Expenses net of fee waivers, if any | .35%H | .35% | .35%H |
| Expenses net of all reductions | .35%H | .35% | .35%H |
| Net investment income (loss) | .40%H | .82% | .89%H |
| Supplemental Data | |||
| Net assets, end of period (000 omitted) | $102 | $100 | $105 |
| Portfolio turnover rateG | 28%H | 8% | 13%H |
A For the period August 5, 2014 (commencement of operations) to March 31, 2015.
B Calculated based on average shares outstanding during the period.
C Total distributions of $.66 per share is comprised of distributions from net investment income of $.065 and distributions from net realized gain of $.596 per share.
D Total returns for periods of less than one year are not annualized.
E Total returns would have been lower if certain expenses had not been reduced during the applicable periods shown.
F Expense ratios reflect operating expenses of the class. Expenses before reductions do not reflect amounts reimbursed by the investment adviser or reductions from expense offset arrangements and do not represent the amount paid by the class during periods when reimbursements or reductions occur. Expenses net of fee waivers reflect expenses after reimbursement by the investment adviser but prior to reductions from expense offset arrangements. Expenses net of all reductions represent the net expenses paid by the class but do not include expenses of the underlying funds in which the Fund invests.
G Amounts do not include the activity of the Underlying Funds.
H Annualized
See accompanying notes which are an integral part of the financial statements.
Notes to Financial Statements (Unaudited)
For the period ended September 30, 2016
1. Organization.
Fidelity Multi-Manager Income Fund, Fidelity Multi-Manager 2005 Fund, Fidelity Multi-Manager 2010 Fund, Fidelity Multi-Manager 2015 Fund, Fidelity Multi-Manager 2020 Fund, Fidelity Multi-Manager 2025 Fund, Fidelity Multi-Manager 2030 Fund, Fidelity Multi-Manager 2035 Fund, Fidelity Multi-Manager 2040 Fund, Fidelity Multi-Manager 2045 Fund, Fidelity Multi-Manager 2050 Fund, Fidelity Multi-Manager 2055 Fund and Fidelity Multi-Manager 2060 Fund (the Funds) (formerly Strategic Advisers Multi-Manager Target Date Funds) are funds of Fidelity Boylston Street Trust (the Trust). The Trust is registered under the Investment Company Act of 1940, as amended (the 1940 Act), as an open-end management investment company organized as a Delaware statutory trust. Each Fund is authorized to issue an unlimited number of shares. The Funds invest primarily in affiliated and may also invest in unaffiliated mutual funds (the Underlying Funds). The Funds are available only to certain employer-sponsored retirement plans and certain Fidelity brokerage or mutual fund accounts. Each Fund offers Multi-Manager, Class L and Class N shares, each of which has equal rights as to assets and voting privileges. Each class has exclusive voting rights with respect to matters that affect that class.
2. Significant Accounting Policies.
The financial statements have been prepared in conformity with accounting principles generally accepted in the United States of America (GAAP), which require management to make certain estimates and assumptions at the date of the financial statements. Actual results could differ from those estimates. Subsequent events, if any, through the date that the financial statements were issued have been evaluated in the preparation of the financial statements. The following summarizes the significant accounting policies of the Funds:
Investment Valuation. Investments are valued as of 4:00 p.m. Eastern time on the last calendar day of the period. Each Fund categorizes the inputs to valuation techniques used to value its investments into a disclosure hierarchy consisting of three levels as shown below:
- Level 1 – quoted prices in active markets for identical investments
- Level 2 – other significant observable inputs (including quoted prices for similar investments, interest rates, prepayment speeds, etc.)
- Level 3 – unobservable inputs (including the Fund's own assumptions based on the best information available)
Valuation techniques used to value each Fund's investments by major category are as follows. Investments in the Underlying Funds are valued at their closing net asset value (NAV) each business day and are categorized as Level 1 in the hierarchy.
Investment Transactions and Income. For financial reporting purposes, the Funds' investment holdings and NAV include trades executed through the end of the last business day of the period. The NAV per share for processing shareholder transactions is calculated as of the close of business of the New York Stock Exchange (NYSE), normally 4:00 p.m. Eastern time and includes trades executed through the end of the prior business day. Gains and losses on securities sold are determined on the basis of identified cost. Income and capital gain distributions from the Underlying Funds, if any, are recorded on the ex-dividend date.
Class Allocations and Expenses. Investment income, realized and unrealized capital gains and losses, common expenses of each Fund, and certain fund-level expense reductions, if any, are allocated daily on a pro-rata basis to each class based on the relative net assets of each class to the total net assets of each Fund. Each class differs with respect to transfer agent and distribution and service plan fees incurred. Certain expense reductions may also differ by class. For the reporting period, the allocated portion of income and expenses to each class as a percent of its average net assets may vary due to the timing of recording these transactions in relation to fluctuating net assets of the classes. Expenses directly attributable to a fund are charged to that fund. Expenses attributable to more than one fund are allocated among the respective funds on the basis of relative net assets or other appropriate methods. Expenses included in the accompanying financial statements reflect the expenses of each Fund and do not include any expenses associated with the Underlying Funds. Although not included in each Fund's expenses, each Fund indirectly bears its proportionate share of the Underlying Funds' expenses through the impact of these expenses on each Underlying Fund's NAV. Expense estimates are accrued in the period to which they relate and adjustments are made when actual amounts are known.
Income Tax Information and Distributions to Shareholders. Each year, each Fund intends to qualify as a regulated investment company under Subchapter M of the Internal Revenue Code, including distributing substantially all of its taxable income and realized gains. As a result, no provision for U.S. Federal income taxes is required. Each Fund files a U.S. federal tax return, in addition to state and local tax returns as required. Each Fund's federal income tax returns are subject to examination by the Internal Revenue Service (IRS) for a period of three fiscal years after they are filed. State and local tax returns may be subject to examination for an additional fiscal year depending on the jurisdiction.
Distributions are declared and recorded on the ex-dividend date. Income dividends and capital gain distributions are declared separately for each class. Income and capital gain distributions are determined in accordance with income tax regulations, which may differ from GAAP.
Capital accounts within the financial statements are adjusted for permanent book-tax differences. These adjustments have no impact on net assets or the results of operations. Capital accounts are not adjusted for temporary book-tax differences which will reverse in a subsequent period.
Book-tax differences are primarily due to the short-term gain distributions from the Underlying Funds, losses deferred due to wash sales and excise tax regulations.
The federal tax cost of investment securities and unrealized appreciation (depreciation) as of period end were as follows for each Fund:
| Tax cost | Gross unrealized appreciation | Gross unrealized depreciation | Net unrealized appreciation (depreciation) on securities | |
| Fidelity Multi-Manager Income Fund | $1,358,211 | $24,161 | $(20,440) | $3,721 |
| Fidelity Multi-Manager 2005 Fund | 338,470 | 7,848 | (8,743) | (895) |
| Fidelity Multi-Manager 2010 Fund | 695,403 | 16,144 | (17,598) | (1,454) |
| Fidelity Multi-Manager 2015 Fund | 1,619,775 | 24,957 | (62,901) | (37,944) |
| Fidelity Multi-Manager 2020 Fund | 4,152,037 | 65,573 | (157,795) | (92,222) |
| Fidelity Multi-Manager 2025 Fund | 2,134,462 | 43,572 | (53,854) | (10,282) |
| Fidelity Multi-Manager 2030 Fund | 1,768,899 | 48,010 | (70,183) | (22,173) |
| Fidelity Multi-Manager 2035 Fund | 1,922,585 | 48,362 | (94,534) | (46,172) |
| Fidelity Multi-Manager 2040 Fund | 1,043,078 | 19,730 | (54,655) | (34,925) |
| Fidelity Multi-Manager 2045 Fund | 1,827,247 | 23,766 | (98,180) | (74,414) |
| Fidelity Multi-Manager 2050 Fund | 1,481,440 | 26,412 | (74,133) | (47,721) |
| Fidelity Multi-Manager 2055 Fund | 1,503,070 | 28,378 | (77,261) | (48,883) |
| Fidelity Multi-Manager 2060 Fund | 548,374 | 8,917 | (23,268) | (14,351) |
Certain of the Funds elected to defer to the next fiscal year capital losses recognized during the period November 1, 2015 to March 31, 2016. Loss deferrals were as follows:
| Capital losses | |
| Fidelity Multi-Manager Income Fund | $(5,515) |
| Fidelity Multi-Manager 2005 Fund | (1,356) |
| Fidelity Multi-Manager 2020 Fund | (6,580) |
| Fidelity Multi-Manager 2025 Fund | (475) |
| Fidelity Multi-Manager 2030 Fund | (11,853) |
3. Purchases and Redemptions of Underlying Fund Shares.
Purchases and redemptions of the Underlying Fund shares, are noted in the table below.
| Purchases ($) | Redemptions ($) | |
| Fidelity Multi-Manager Income Fund | 476,497 | 178,588 |
| Fidelity Multi-Manager 2005 Fund | 19,775 | 37,190 |
| Fidelity Multi-Manager 2010 Fund | 171,948 | 283,031 |
| Fidelity Multi-Manager 2015 Fund | 151,894 | 335,611 |
| Fidelity Multi-Manager 2020 Fund | 748,808 | 1,232,395 |
| Fidelity Multi-Manager 2025 Fund | 593,132 | 444,271 |
| Fidelity Multi-Manager 2030 Fund | 409,743 | 198,148 |
| Fidelity Multi-Manager 2035 Fund | 361,777 | 354,806 |
| Fidelity Multi-Manager 2040 Fund | 264,541 | 237,089 |
| Fidelity Multi-Manager 2045 Fund | 457,567 | 244,974 |
| Fidelity Multi-Manager 2050 Fund | 336,560 | 309,039 |
| Fidelity Multi-Manager 2055 Fund | 358,914 | 335,696 |
| Fidelity Multi-Manager 2060 Fund | 95,004 | 73,550 |
4. Fees and Other Transactions with Affiliates.
Management Fee. FMR Co., Inc. (the investment adviser), an affiliate of Fidelity Management & Research Company (FMR) provides the Funds with investment management related services. The Funds do not pay any fees for these services.
Other Transactions. The investment adviser has entered into an administration agreement with FMR under which FMR provides management and administrative services (other than investment advisory services) necessary for the operation of each Fund. Pursuant to this agreement, FMR pays all expenses of each Fund, excluding distribution and service fees, transfer agent fees, compensation of the independent Trustees and certain other expenses such as interest expense. FMR also contracts with other Fidelity companies to perform the services necessary for the operation of each Fund. The Funds do not pay any fees for these services.
Distribution and Service Plan Fees. In accordance with Rule 12b-1 of the 1940 Act, each Fund has adopted separate Distribution and Service Plans for each class of shares. Each Fund's Class N pays Fidelity Distributors Corporation (FDC), an affiliate of the investment adviser, a Service Fee based on an annual percentage of Class N's average net assets. In addition, FDC may pay financial intermediaries for selling shares of the Funds and providing shareholder support services. For the period, the Service Fee rate, total service fees and amounts retained by FDC were as follows:
| Service Fee | Total Fees | Retained by FDC | |
| Fidelity Multi-Manager Income Fund | |||
| Class N | .25% | $ 127 | $ 127 |
| Fidelity Multi-Manager 2005 Fund | |||
| Class N | .25% | $ 129 | $ 129 |
| Fidelity Multi-Manager 2010 Fund | |||
| Class N | .25% | $ 129 | $ 129 |
| Fidelity Multi-Manager 2015 Fund | |||
| Class N | .25% | $ 130 | $ 130 |
| Fidelity Multi-Manager 2020 Fund | |||
| Class N | .25% | $ 130 | $ 130 |
| Fidelity Multi-Manager 2025 Fund | |||
| Class N | .25% | $ 131 | $ 130 |
| Fidelity Multi-Manager 2030 Fund | |||
| Class N | .25% | $ 131 | $ 131 |
| Fidelity Multi-Manager 2035 Fund | |||
| Class N | .25% | $ 131 | $131 |
| Fidelity Multi-Manager 2040 Fund | |||
| Class N | .25% | $ 131 | $131 |
| Fidelity Multi-Manager 2045 Fund | |||
| Class N | .25% | $ 131 | $131 |
| Fidelity Multi-Manager 2050 Fund | |||
| Class N | .25% | $ 131 | $131 |
| Fidelity Multi-Manager 2055 Fund | |||
| Class N | .25% | $ 131 | $131 |
| Fidelity Multi-Manager 2060 Fund | |||
| Class N | .25% | $ 123 | $ 123 |
Transfer Agent Fees. Fidelity Investments Institutional Operations Company, Inc., (FIIOC), an affiliate of the investment adviser, is the transfer, dividend disbursing and shareholder servicing agent for each class of the Funds. FIIOC receives account fees and asset-based fees that vary according to the account size and type of account of the shareholders of the respective classes of each Fund. FIIOC pays for typesetting, printing and mailing of shareholder reports, except proxy statements. For the period, transfer agent fees for each class were as follows:
| Amount | % of Class-Level Average Net Assets(a) | |
| Fidelity Multi-Manager Income Fund | ||
| Multi-Manager Income | $ 270 | .05 |
| Class L | 26 | .05 |
| Class N | 26 | .05 |
| $322 | ||
| Fidelity Multi-Manager 2005 Fund | ||
| Multi-Manager 2005 | $ 43 | .07 |
| Class L | 44 | .08 |
| Class N | 43 | .08 |
| $130 | ||
| Fidelity Multi-Manager 2010 Fund | ||
| Multi-Manager 2010 | $121 | .05 |
| Class L | 30 | .06 |
| Class N | 30 | .06 |
| $181 | ||
| Fidelity Multi-Manager 2015 Fund | ||
| Multi-Manager 2015 | $521 | .08 |
| Class L | 42 | .08 |
| Class N | 42 | .08 |
| $605 | ||
| Fidelity Multi-Manager 2020 Fund | ||
| Multi-Manager 2020 | $1,486 | .08 |
| Class L | 40 | .08 |
| Class N | 40 | .08 |
| $1,566 | ||
| Fidelity Multi-Manager 2025 Fund | ||
| Multi-Manager 2025 | $917 | .11 |
| Class L | 44 | .08 |
| Class N | 44 | .08 |
| $1,005 | ||
| Fidelity Multi-Manager 2030 Fund | ||
| Multi-Manager 2030 | $820 | .12 |
| Class L | 49 | .09 |
| Class N | 48 | .09 |
| $917 | ||
| Fidelity Multi-Manager 2035 Fund | ||
| Multi-Manager 2035 | $1,218 | .15 |
| Class L | 51 | .10 |
| Class N | 51 | .10 |
| $1,320 | ||
| Fidelity Multi-Manager 2040 Fund | ||
| Multi-Manager 2040 | $822 | .22 |
| Class L | 55 | .10 |
| Class N | 55 | .11 |
| $932 | ||
| Fidelity Multi-Manager 2045 Fund | ||
| Multi-Manager 2045 | $1,317 | .19 |
| Class L | 52 | .10 |
| Class N | 52 | .10 |
| $1,421 | ||
| Fidelity Multi-Manager 2050 Fund | ||
| Multi-Manager 2050 | $1,182 | .20 |
| Class L | 53 | .10 |
| Class N | 53 | .10 |
| $1,288 | ||
| Fidelity Multi-Manager 2055 Fund | ||
| Multi-Manager 2055 | $1,392 | .24 |
| Class L | 53 | .10 |
| Class N | 52 | .10 |
| $1,497 | ||
| Fidelity Multi-Manager 2060 Fund | ||
| Multi-Manager 2060 | $304 | .24 |
| Class L | 60 | .10 |
| Class N | 59 | .10 |
| $423 |
(a) Annualized
5. Expense Reductions.
The investment adviser contractually agreed to reimburse funds to the extent annual operating expenses exceeded certain levels of average net assets as noted in the table below. This reimbursement will remain in place through May 31, 2017. Some expenses, for example interest expense, are excluded from this reimbursement.
The following classes of each applicable Fund were in reimbursement during the period:
| Expense Limitations | Reimbursement | |
| Fidelity Multi-Manager 2025 Fund | ||
| Multi-Manager 2025 | .10% | $73 |
| Class L | .10% | – |
| Class N | .35% | – |
| Fidelity Multi-Manager 2030 Fund | ||
| Multi-Manager 2030 | .10% | $121 |
| Class L | .10% | – |
| Class N | .35% | – |
| Fidelity Multi-Manager 2035 Fund | ||
| Multi-Manager 2035 | .10% | $426 |
| Class L | .10% | – |
| Class N | .35% | – |
| Fidelity Multi-Manager 2040 Fund | ||
| Multi-Manager 2040 | .10% | $451 |
| Class L | .10% | 3 |
| Class N | .35% | 3 |
| Fidelity Multi-Manager 2045 Fund | ||
| Multi-Manager 2045 | .10% | $633 |
| Class L | .10% | – |
| Class N | .35% | – |
| Fidelity Multi-Manager 2050 Fund | ||
| Multi-Manager 2050 | .10% | $601 |
| Class L | .10% | – |
| Class N | .35% | – |
| Fidelity Multi-Manager 2055 Fund | ||
| Multi-Manager 2055 | .10% | $819 |
| Class L | .10% | – |
| Class N | .35% | – |
| Fidelity Multi-Manager 2060 Fund | ||
| Multi-Manager 2060 | .10% | $146 |
| Class L | .10% | 11 |
| Class N | .35% | 10 |
6. Distributions to Shareholders.
Distributions to shareholders of each class were as follows:
| Six months ended September 30, 2016 | Year ended March 31, 2016 | |
| Fidelity Multi-Manager Income Fund | ||
| From net investment income | ||
| Multi-Manager Income | $6,457 | $15,176 |
| Class L | 639 | 1,685 |
| Class N | 514 | 1,438 |
| Total | $7,610 | $18,299 |
| From net realized gain | ||
| Multi-Manager Income | $– | $17,414 |
| Class L | – | 1,957 |
| Class N | – | 1,949 |
| Total | $– | $21,320 |
| Fidelity Multi-Manager 2005 Fund | ||
| From net investment income | ||
| Multi-Manager 2005 | $370 | $2,539 |
| Class L | 294 | 1,625 |
| Class N | 222 | 1,352 |
| Total | $886 | $5,516 |
| From net realized gain | ||
| Multi-Manager 2005 | $– | $3,986 |
| Class L | – | 3,076 |
| Class N | – | 3,067 |
| Total | $– | $10,129 |
| Fidelity Multi-Manager 2010 Fund | ||
| From net investment income | ||
| Multi-Manager 2010 | $1,244 | $8,965 |
| Class L | 220 | 1,670 |
| Class N | 159 | 1,391 |
| Total | $1,623 | $12,026 |
| From net realized gain | ||
| Multi-Manager 2010 | $3,957 | $19,386 |
| Class L | 699 | 3,731 |
| Class N | 695 | 3,721 |
| Total | $5,351 | $26,838 |
| Fidelity Multi-Manager 2015 Fund | ||
| From net investment income | ||
| Multi-Manager 2015 | $3,769 | $25,199 |
| Class L | 268 | 1,661 |
| Class N | 207 | 1,394 |
| Total | $4,244 | $28,254 |
| From net realized gain | ||
| Multi-Manager 2015 | $1,536 | $59,222 |
| Class L | 109 | 3,988 |
| Class N | 109 | 3,977 |
| Total | $1,754 | $67,187 |
| Fidelity Multi-Manager 2020 Fund | ||
| From net investment income | ||
| Multi-Manager 2020 | $8,426 | $58,011 |
| Class L | 208 | 1,482 |
| Class N | 148 | 1,217 |
| Total | $8,782 | $60,710 |
| From net realized gain | ||
| Multi-Manager 2020 | $34,909 | $154,346 |
| Class L | 862 | 4,554 |
| Class N | 858 | 4,541 |
| Total | $36,629 | $163,441 |
| Fidelity Multi-Manager 2025 Fund | ||
| From net investment income | ||
| Multi-Manager 2025 | $2,764 | $17,411 |
| Class L | 176 | 1,267 |
| Class N | 117 | 986 |
| Total | $3,057 | $19,664 |
| From net realized gain | ||
| Multi-Manager 2025 | $15,050 | $54,834 |
| Class L | 958 | 5,035 |
| Class N | 953 | 5,021 |
| Total | $16,961 | $64,890 |
| Fidelity Multi-Manager 2030 Fund | ||
| From net investment income | ||
| Multi-Manager 2030 | $1,089 | $11,967 |
| Class L | 91 | 1,265 |
| Class N | 30 | 1,018 |
| Total | $1,210 | $14,250 |
| From net realized gain | ||
| Multi-Manager 2030 | $– | $70,000 |
| Class L | – | 6,838 |
| Class N | – | 6,819 |
| Total | $– | $83,657 |
| Fidelity Multi-Manager 2035 Fund | ||
| From net investment income | ||
| Multi-Manager 2035 | $447 | $12,275 |
| Class L | 29 | 1,013 |
| Class N | – | 803 |
| Total | $476 | $14,091 |
| From net realized gain | ||
| Multi-Manager 2035 | $19,507 | $64,720 |
| Class L | 1,278 | 6,246 |
| Class N | 1,243 | 6,229 |
| Total | $22,028 | $77,195 |
| Fidelity Multi-Manager 2040 Fund | ||
| From net investment income | ||
| Multi-Manager 2040 | $– | $6,618 |
| Class L | – | 1,027 |
| Class N | – | 825 |
| Total | $– | $8,470 |
| From net realized gain | ||
| Multi-Manager 2040 | $10,369 | $38,980 |
| Class L | 1,431 | 6,862 |
| Class N | 1,424 | 6,776 |
| Total | $13,224 | $52,618 |
| Fidelity Multi-Manager 2045 Fund | ||
| From net investment income | ||
| Multi-Manager 2045 | $– | $12,787 |
| Class L | – | 1,031 |
| Class N | – | 822 |
| Total | $– | $14,640 |
| From net realized gain | ||
| Multi-Manager 2045 | $15,840 | $57,849 |
| Class L | 1,252 | 5,654 |
| Class N | 1,217 | 5,582 |
| Total | $18,309 | $69,085 |
| Fidelity Multi-Manager 2050 Fund | ||
| From net investment income | ||
| Multi-Manager 2050 | $316 | $10,018 |
| Class L | 20 | 1,106 |
| Class N | – | 894 |
| Total | $336 | $12,018 |
| From net realized gain | ||
| Multi-Manager 2050 | $15,279 | $63,137 |
| Class L | 1,421 | 6,937 |
| Class N | 1,395 | 6,879 |
| Total | $18,095 | $76,953 |
| Fidelity Multi-Manager 2055 Fund | ||
| From net investment income | ||
| Multi-Manager 2055 | $– | $9,947 |
| Class L | $– | $1,008 |
| Class N | – | 800 |
| Total | $– | $11,755 |
| From net realized gain | ||
| Multi-Manager 2055 | $15,904 | $55,964 |
| Class L | 1,500 | 6,527 |
| Class N | 1,493 | 6,510 |
| Total | $18,897 | $69,001 |
| Fidelity Multi-Manager 2060 Fund | ||
| From net investment income | ||
| Multi-Manager 2060 | $– | $2,311 |
| Class L | – | 888 |
| Class N | – | 687 |
| Total | $– | $3,886 |
| From net realized gain | ||
| Multi-Manager 2060 | $4,067 | $10,623 |
| Class L | 1,346 | 6,135 |
| Class N | 1,342 | 6,128 |
| Total | $6,755 | $22,886 |
7. Share Transactions.
Share transactions for each class were as follows and may contain automatic conversions between classes or exchanges between affiliated funds:
| Shares | Shares | Dollars | Dollars | |
| Six months ended September 30, 2016 | Year ended March 31, 2016 | Six months ended September 30, 2016 | Year ended March 31, 2016 | |
| Fidelity Multi-Manager Income Fund | ||||
| Multi-Manager Income | ||||
| Shares sold | 43,013 | 11,399 | $433,162 | $113,683 |
| Reinvestment of distributions | 639 | 3,251 | 6,457 | 32,590 |
| Shares redeemed | (14,019) | (20,904) | (141,214) | (201,844) |
| Net increase (decrease) | 29,633 | (6,254) | $298,405 | $(55,571) |
| Class L | ||||
| Reinvestment of distributions | 63 | 363 | $639 | $3,642 |
| Shares redeemed | (513) | – | (5,075) | – |
| Net increase (decrease) | (450) | 363 | $(4,436) | $3,642 |
| Class N | ||||
| Reinvestment of distributions | 51 | 338 | $514 | $3,387 |
| Shares redeemed | (511) | – | (5,047) | – |
| Net increase (decrease) | (460) | 338 | $(4,533) | $3,387 |
| Fidelity Multi-Manager 2005 Fund | ||||
| Multi-Manager 2005 | ||||
| Shares sold | 107 | 9,150 | $1,092 | $93,793 |
| Reinvestment of distributions | 37 | 645 | 370 | 6,525 |
| Shares redeemed | (1,331) | (7,808) | (13,545) | (77,985) |
| Net increase (decrease) | (1,187) | 1,987 | $(12,083) | $22,333 |
| Class L | ||||
| Reinvestment of distributions | 29 | 463 | $294 | $4,701 |
| Shares redeemed | (513) | – | (5,090) | – |
| Net increase (decrease) | (484) | 463 | $(4,796) | $4,701 |
| Class N | ||||
| Reinvestment of distributions | 22 | 435 | $222 | $4,419 |
| Shares redeemed | (510) | – | (5,061) | – |
| Net increase (decrease) | (488) | 435 | $(4,839) | $4,419 |
| Fidelity Multi-Manager 2010 Fund | ||||
| Multi-Manager 2010 | ||||
| Shares sold | 12,723 | 10,422 | $130,381 | $110,816 |
| Reinvestment of distributions | 516 | 2,726 | 5,201 | 28,351 |
| Shares redeemed | (23,991) | (7,541) | (244,278) | (79,222) |
| Net increase (decrease) | (10,752) | 5,607 | $(108,696) | $59,945 |
| Class L | ||||
| Reinvestment of distributions | 91 | 519 | $919 | $5,401 |
| Shares redeemed | (505) | – | (5,098) | – |
| Net increase (decrease) | (414) | 519 | $(4,179) | $5,401 |
| Class N | ||||
| Reinvestment of distributions | 85 | 491 | $854 | $5,112 |
| Shares redeemed | (503) | – | (5,069) | – |
| Net increase (decrease) | (418) | 491 | $(4,215) | $5,112 |
| Fidelity Multi-Manager 2015 Fund | ||||
| Multi-Manager 2015 | ||||
| Shares sold | 4,231 | 32,066 | $45,337 | $343,602 |
| Reinvestment of distributions | 520 | 7,990 | 5,305 | 84,421 |
| Shares redeemed | (24,386) | (37,772) | (248,852) | (385,921) |
| Net increase (decrease) | (19,635) | 2,284 | $(198,210) | $42,102 |
| Class L | ||||
| Reinvestment of distributions | 37 | 534 | $377 | $5,649 |
| Shares redeemed | (502) | – | (5,099) | – |
| Net increase (decrease) | (465) | 534 | $(4,722) | $5,649 |
| Class N | ||||
| Reinvestment of distributions | 31 | 507 | $316 | $5,371 |
| Shares redeemed | (500) | – | (5,071) | – |
| Net increase (decrease) | (469) | 507 | $(4,755) | $5,371 |
| Fidelity Multi-Manager 2020 Fund | ||||
| Multi-Manager 2020 | ||||
| Shares sold | 42,021 | 156,312 | $446,947 | $1,694,454 |
| Reinvestment of distributions | 4,265 | 20,068 | 43,335 | 212,357 |
| Shares redeemed | (97,800) | (52,653) | (999,230) | (560,374) |
| Net increase (decrease) | (51,514) | 123,727 | $(508,948) | $1,346,437 |
| Class L | ||||
| Reinvestment of distributions | 105 | 567 | $1,070 | $6,036 |
| Shares redeemed | (501) | – | (5,100) | – |
| Net increase (decrease) | (396) | 567 | $(4,030) | $6,036 |
| Class N | ||||
| Reinvestment of distributions | 99 | 541 | $1,006 | $5,758 |
| Shares redeemed | (499) | – | (5,072) | – |
| Net increase (decrease) | (400) | 541 | $(4,066) | $5,758 |
| Fidelity Multi-Manager 2025 Fund | ||||
| Multi-Manager 2025 | ||||
| Shares sold | 51,928 | 76,777 | $549,421 | $829,793 |
| Reinvestment of distributions | 1,730 | 6,677 | 17,814 | 72,245 |
| Shares redeemed | (40,739) | (4,097) | (432,643) | (43,758) |
| Net increase (decrease) | 12,919 | 79,357 | $134,592 | $858,280 |
| Class L | ||||
| Reinvestment of distributions | 110 | 577 | $1,134 | $6,302 |
| Shares redeemed | (494) | – | (5,111) | – |
| Net increase (decrease) | (384) | 577 | $(3,977) | $6,302 |
| Class N | ||||
| Reinvestment of distributions | 104 | 550 | $1,070 | $6,007 |
| Shares redeemed | (492) | – | (5,082) | – |
| Net increase (decrease) | (388) | 550 | $(4,012) | $6,007 |
| Fidelity Multi-Manager 2030 Fund | ||||
| Multi-Manager 2030 | ||||
| Shares sold | 32,461 | 74,942 | $335,644 | $775,264 |
| Reinvestment of distributions | 108 | 7,670 | 1,089 | 81,967 |
| Shares redeemed | (15,177) | (64,261) | (155,350) | (693,594) |
| Net increase (decrease) | 17,392 | 18,351 | $181,383 | $163,637 |
| Class L | ||||
| Reinvestment of distributions | 9 | 761 | $91 | $8,103 |
| Shares redeemed | (510) | – | (5,088) | – |
| Net increase (decrease) | (501) | 761 | $(4,997) | $8,103 |
| Class N | ||||
| Reinvestment of distributions | 3 | 735 | $30 | $7,837 |
| Shares redeemed | (508) | – | (5,059) | – |
| Net increase (decrease) | (505) | 735 | $(5,029) | $7,837 |
| Fidelity Multi-Manager 2035 Fund | ||||
| Multi-Manager 2035 | ||||
| Shares sold | 28,527 | 77,261 | $303,861 | $824,537 |
| Reinvestment of distributions | 1,949 | 6,983 | 19,954 | 76,995 |
| Shares redeemed | (31,822) | (15,936) | (332,630) | (179,461) |
| Net increase (decrease) | (1,346) | 68,308 | $(8,815) | $722,071 |
| Class L | ||||
| Reinvestment of distributions | 128 | 654 | $1,307 | $7,259 |
| Shares redeemed | (493) | – | (5,068) | – |
| Net increase (decrease) | (365) | 654 | $(3,761) | $7,259 |
| Class N | ||||
| Reinvestment of distributions | 121 | 633 | $1,243 | $7,032 |
| Shares redeemed | (491) | – | (5,040) | – |
| Net increase (decrease) | (370) | 633 | $(3,797) | $7,032 |
| Fidelity Multi-Manager 2040 Fund | ||||
| Multi-Manager 2040 | ||||
| Shares sold | 22,120 | 30,701 | $236,268 | $332,212 |
| Reinvestment of distributions | 1,019 | 4,142 | 10,369 | 45,598 |
| Shares redeemed | (21,332) | (11,151) | (223,678) | (119,612) |
| Net increase (decrease) | 1,807 | 23,692 | $22,959 | $258,198 |
| Class L | ||||
| Reinvestment of distributions | 141 | 713 | $1,431 | $7,889 |
| Shares redeemed | (495) | – | (5,068) | – |
| Net increase (decrease) | (354) | 713 | $(3,637) | $7,889 |
| Class N | ||||
| Reinvestment of distributions | 140 | 687 | $1,424 | $7,601 |
| Shares redeemed | (493) | – | (5,040) | – |
| Net increase (decrease) | (353) | 687 | $(3,616) | $7,601 |
| Fidelity Multi-Manager 2045 Fund | ||||
| Multi-Manager 2045 | ||||
| Shares sold | 41,129 | 58,212 | $445,050 | $630,540 |
| Reinvestment of distributions | 1,526 | 6,357 | 15,840 | 70,636 |
| Shares redeemed | (24,698) | (25,485) | (263,472) | (262,103) |
| Net increase (decrease) | 17,957 | 39,084 | $197,418 | $439,073 |
| Class L | ||||
| Reinvestment of distributions | 121 | 597 | $1,252 | $6,685 |
| Shares redeemed | (487) | – | $(5,068) | $– |
| Net increase (decrease) | (366) | 597 | $(3,816) | $6,685 |
| Class N | ||||
| Reinvestment of distributions | 117 | 572 | $1,217 | $6,404 |
| Shares redeemed | (485) | – | (5,039) | – |
| Net increase (decrease) | (368) | 572 | $(3,822) | $6,404 |
| Fidelity Multi-Manager 2050 Fund | ||||
| Multi-Manager 2050 | ||||
| Shares sold | 31,743 | 52,504 | $338,461 | $560,155 |
| Reinvestment of distributions | 1,533 | 6,608 | 15,595 | 73,155 |
| Shares redeemed | (31,820) | (31,341) | (337,601) | (346,681) |
| Net increase (decrease) | 1,456 | 27,771 | $16,455 | $286,629 |
| Class L | ||||
| Reinvestment of distributions | 142 | 727 | $1,441 | $8,043 |
| Shares redeemed | (495) | – | (5,067) | – |
| Net increase (decrease) | (353) | 727 | $(3,626) | $8,043 |
| Class N | ||||
| Reinvestment of distributions | 137 | 702 | $1,395 | $7,773 |
| Shares redeemed | (493) | – | (5,039) | – |
| Net increase (decrease) | (356) | 702 | $(3,644) | $7,773 |
| Fidelity Multi-Manager 2055 Fund | ||||
| Multi-Manager 2055 | ||||
| Shares sold | 30,541 | 45,428 | $331,521 | $496,282 |
| Reinvestment of distributions | 1,534 | 5,889 | 15,904 | 65,911 |
| Shares redeemed | (31,280) | (13,518) | (333,941) | (151,383) |
| Net increase (decrease) | 795 | 37,799 | $13,484 | $410,810 |
| Class L | ||||
| Reinvestment of distributions | 145 | 670 | $1,500 | $7,535 |
| Shares redeemed | (486) | – | (5,066) | – |
| Net increase (decrease) | (341) | 670 | $(3,566) | $7,535 |
| Class N | ||||
| Reinvestment of distributions | 144 | 649 | $1,493 | $7,310 |
| Shares redeemed | (484) | – | (5,037) | – |
| Net increase (decrease) | (340) | 649 | $(3,544) | $7,310 |
| Fidelity Multi-Manager 2060 Fund | ||||
| Multi-Manager 2060 | ||||
| Shares sold | 7,859 | 17,277 | $74,206 | $163,354 |
| Reinvestment of distributions | 449 | 1,332 | 4,067 | 12,934 |
| Shares redeemed | (5,971) | (464) | (57,026) | (4,417) |
| Net increase (decrease) | 2,337 | 18,145 | $21,247 | $171,871 |
| Class L | ||||
| Reinvestment of distributions | 148 | 713 | $1,346 | $7,023 |
| Shares redeemed | (523) | – | (4,767) | – |
| Net increase (decrease) | (375) | 713 | $(3,421) | $7,023 |
| Class N | ||||
| Reinvestment of distributions | 148 | 691 | $1,342 | $6,815 |
| Shares redeemed | (522) | – | (4,749) | – |
| Net increase (decrease) | (374) | 691 | $(3,407) | $6,815 |
8. Other.
The Funds' organizational documents provide former and current trustees and officers with a limited indemnification against liabilities arising in connection with the performance of their duties to the Funds. In the normal course of business, the Funds may also enter into contracts that provide general indemnifications. The Funds' maximum exposure under these arrangements is unknown as this would be dependent on future claims that may be made against the Funds. The risk of material loss from such claims is considered remote.
At the end of the period, the investment adviser or its affiliates were owners of record of more than 10% of the outstanding shares of the following Funds:
| Affiliated | |
| Fidelity Multi-Manager Income Fund | 16% |
| Fidelity Multi-Manager 2005 Fund | 93% |
| Fidelity Multi-Manager 2010 Fund | 40% |
| Fidelity Multi-Manager 2015 Fund | 16% |
| Fidelity Multi-Manager 2025 Fund | 12% |
| Fidelity Multi-Manager 2030 Fund | 16% |
| Fidelity Multi-Manager 2035 Fund | 14% |
| Fidelity Multi-Manager 2040 Fund | 27% |
| Fidelity Multi-Manager 2045 Fund | 16% |
| Fidelity Multi-Manager 2050 Fund | 16% |
| Fidelity Multi-Manager 2055 Fund | 16% |
| Fidelity Multi-Manager 2060 Fund | 53% |
Shareholder Expense Example
As a shareholder of a Fund, you incur two types of costs: (1) transaction costs, and (2) ongoing costs, including distribution and/or service (12b-1) fees and other Fund expenses. This Example is intended to help you understand your ongoing costs (in dollars) of investing in the Funds and to compare these costs with the ongoing costs of investing in other mutual funds.
The Example is based on an investment of $1,000 invested at the beginning of the period and held for the entire period (April 1, 2016 to September 30, 2016).
Actual Expenses
The first line of the accompanying table for each class of each fund provides information about actual account values and actual expenses. You may use the information in this line, together with the amount you invested, to estimate the expenses that you paid over the period. Simply divide your account value by $1,000.00 (for example, an $8,600 account value divided by $1,000.00 = 8.6), then multiply the result by the number in the first line for a class of the fund under the heading entitled "Expenses Paid During Period" to estimate the expenses you paid on your account during this period. A small balance maintenance fee of $12.00 that is charged once a year may apply for certain accounts with a value of less than $2,000. This fee is not included in the table below. If it was, the estimate of expenses you paid during the period would be higher, and your ending account value lower, by this amount. In addition, each Fund, as a shareholder in underlying funds, will indirectly bear its pro-rata share of the fees and expenses incurred by the underlying funds. These fees and expenses are not included in each Fund's annualized expense ratio used to calculate the expense estimates in the table below.
Hypothetical Example for Comparison Purposes
The second line of the accompanying table for each class of each fund provides information about hypothetical account values and hypothetical expenses based on a Class' actual expense ratio and an assumed rate of return of 5% per year before expenses, which is not the Class' actual return. The hypothetical account values and expenses may not be used to estimate the actual ending account balance or expenses you paid for the period. You may use this information to compare the ongoing costs of investing in the Fund and other funds. To do so, compare this 5% hypothetical example with the 5% hypothetical examples that appear in the shareholder reports of the other funds. A small balance maintenance fee of $12.00 that is charged once a year may apply for certain accounts with a value of less than $2,000. This fee is not included in the table below. If it was, the estimate of expenses you paid during the period would be higher, and your ending account value lower, by this amount. In addition, each Fund, as a shareholder in underlying funds, will indirectly bear its pro-rata share of the fees and expenses incurred by the underlying funds. These fees and expenses are not included in each Fund's annualized expense ratio used to calculate the expense estimates in the table below.
Please note that the expenses shown in the table are meant to highlight your ongoing costs only and do not reflect any transaction costs. Therefore, the second line of the table is useful in comparing ongoing costs only, and will not help you determine the relative total costs of owning different funds.
| Annualized Expense Ratio-A | Beginning Account Value April 1, 2016 | Ending Account Value September 30, 2016 | Expenses Paid During Period-B April 1, 2016 to September 30, 2016 | |
| Fidelity Multi-Manager Income Fund | ||||
| Multi-Manager Income | .05% | |||
| Actual | $1,000.00 | $1,041.80 | $.26 | |
| Hypothetical-C | $1,000.00 | $1,024.82 | $.25 | |
| Class L | .05% | |||
| Actual | $1,000.00 | $1,040.80 | $.26 | |
| Hypothetical-C | $1,000.00 | $1,024.82 | $.25 | |
| Class N | .30% | |||
| Actual | $1,000.00 | $1,039.60 | $1.53 | |
| Hypothetical-C | $1,000.00 | $1,023.56 | $1.52 | |
| Fidelity Multi-Manager 2005 Fund | ||||
| Multi-Manager 2005 | .07% | |||
| Actual | $1,000.00 | $1,047.10 | $.36 | |
| Hypothetical-C | $1,000.00 | $1,024.72 | $.36 | |
| Class L | .09% | |||
| Actual | $1,000.00 | $1,047.20 | $.46 | |
| Hypothetical-C | $1,000.00 | $1,024.62 | $.46 | |
| Class N | .33% | |||
| Actual | $1,000.00 | $1,046.50 | $1.69 | |
| Hypothetical-C | $1,000.00 | $1,023.41 | $1.67 | |
| Fidelity Multi-Manager 2010 Fund | ||||
| Multi-Manager 2010 | .05% | |||
| Actual | $1,000.00 | $1,052.90 | $.26 | |
| Hypothetical-C | $1,000.00 | $1,024.82 | $.25 | |
| Class L | .06% | |||
| Actual | $1,000.00 | $1,052.90 | $.31 | |
| Hypothetical-C | $1,000.00 | $1,024.77 | $.30 | |
| Class N | .31% | |||
| Actual | $1,000.00 | $1,051.30 | $1.59 | |
| Hypothetical-C | $1,000.00 | $1,023.51 | $1.57 | |
| Fidelity Multi-Manager 2015 Fund | ||||
| Multi-Manager 2015 | .08% | |||
| Actual | $1,000.00 | $1,056.70 | $.41 | |
| Hypothetical-C | $1,000.00 | $1,024.67 | $.41 | |
| Class L | .08% | |||
| Actual | $1,000.00 | $1,056.70 | $.41 | |
| Hypothetical-C | $1,000.00 | $1,024.67 | $.41 | |
| Class N | .33% | |||
| Actual | $1,000.00 | $1,055.10 | $1.70 | |
| Hypothetical-C | $1,000.00 | $1,023.41 | $1.67 | |
| Fidelity Multi-Manager 2020 Fund | ||||
| Multi-Manager 2020 | .08% | |||
| Actual | $1,000.00 | $1,059.80 | $.41 | |
| Hypothetical-C | $1,000.00 | $1,024.67 | $.41 | |
| Class L | .08% | |||
| Actual | $1,000.00 | $1,059.80 | $.41 | |
| Hypothetical-C | $1,000.00 | $1,024.67 | $.41 | |
| Class N | .33% | |||
| Actual | $1,000.00 | $1,058.30 | $1.70 | |
| Hypothetical-C | $1,000.00 | $1,023.41 | $1.67 | |
| Fidelity Multi-Manager 2025 Fund | ||||
| Multi-Manager 2025 | .10% | |||
| Actual | $1,000.00 | $1,061.70 | $.52 | |
| Hypothetical-C | $1,000.00 | $1,024.57 | $.51 | |
| Class L | .08% | |||
| Actual | $1,000.00 | $1,062.60 | $.41 | |
| Hypothetical-C | $1,000.00 | $1,024.67 | $.41 | |
| Class N | .33% | |||
| Actual | $1,000.00 | $1,061.10 | $1.71 | |
| Hypothetical-C | $1,000.00 | $1,023.41 | $1.67 | |
| Fidelity Multi-Manager 2030 Fund | ||||
| Multi-Manager 2030 | .10% | |||
| Actual | $1,000.00 | $1,068.30 | $.52 | |
| Hypothetical-C | $1,000.00 | $1,024.57 | $.51 | |
| Class L | .09% | |||
| Actual | $1,000.00 | $1,068.30 | $.47 | |
| Hypothetical-C | $1,000.00 | $1,024.62 | $.46 | |
| Class N | .34% | |||
| Actual | $1,000.00 | $1,066.80 | $1.76 | |
| Hypothetical-C | $1,000.00 | $1,023.36 | $1.72 | |
| Fidelity Multi-Manager 2035 Fund | ||||
| Multi-Manager 2035 | .10% | |||
| Actual | $1,000.00 | $1,071.40 | $.52 | |
| Hypothetical-C | $1,000.00 | $1,024.57 | $.51 | |
| Class L | .10% | |||
| Actual | $1,000.00 | $1,071.40 | $.52 | |
| Hypothetical-C | $1,000.00 | $1,024.57 | $.51 | |
| Class N | .35% | |||
| Actual | $1,000.00 | $1,069.90 | $1.82 | |
| Hypothetical-C | $1,000.00 | $1,023.31 | $1.78 | |
| Fidelity Multi-Manager 2040 Fund | ||||
| Multi-Manager 2040 | .10% | |||
| Actual | $1,000.00 | $1,071.10 | $.52 | |
| Hypothetical-C | $1,000.00 | $1,024.57 | $.51 | |
| Class L | .10% | |||
| Actual | $1,000.00 | $1,071.10 | $.52 | |
| Hypothetical-C | $1,000.00 | $1,024.57 | $.51 | |
| Class N | .35% | |||
| Actual | $1,000.00 | $1,070.20 | $1.82 | |
| Hypothetical-C | $1,000.00 | $1,023.31 | $1.78 | |
| Fidelity Multi-Manager 2045 Fund | ||||
| Multi-Manager 2045 | .10% | |||
| Actual | $1,000.00 | $1,072.00 | $.52 | |
| Hypothetical-C | $1,000.00 | $1,024.57 | $.51 | |
| Class L | .10% | |||
| Actual | $1,000.00 | $1,071.00 | $.52 | |
| Hypothetical-C | $1,000.00 | $1,024.57 | $.51 | |
| Class N | .35% | |||
| Actual | $1,000.00 | $1,069.80 | $1.82 | |
| Hypothetical-C | $1,000.00 | $1,023.31 | $1.78 | |
| Fidelity Multi-Manager 2050 Fund | ||||
| Multi-Manager 2050 | .10% | |||
| Actual | $1,000.00 | $1,071.30 | $.52 | |
| Hypothetical-C | $1,000.00 | $1,024.57 | $.51 | |
| Class L | .10% | |||
| Actual | $1,000.00 | $1,071.20 | $.52 | |
| Hypothetical-C | $1,000.00 | $1,024.57 | $.51 | |
| Class N | .35% | |||
| Actual | $1,000.00 | $1,069.90 | $1.82 | |
| Hypothetical-C | $1,000.00 | $1,023.31 | $1.78 | |
| Fidelity Multi-Manager 2055 Fund | ||||
| Multi-Manager 2055 | .10% | |||
| Actual | $1,000.00 | $1,071.70 | $.52 | |
| Hypothetical-C | $1,000.00 | $1,024.57 | $.51 | |
| Class L | .10% | |||
| Actual | $1,000.00 | $1,071.70 | $.52 | |
| Hypothetical-C | $1,000.00 | $1,024.57 | $.51 | |
| Class N | .35% | |||
| Actual | $1,000.00 | $1,069.90 | $1.82 | |
| Hypothetical-C | $1,000.00 | $1,023.31 | $1.78 | |
| Fidelity Multi-Manager 2060 Fund | ||||
| Multi-Manager 2060 | .10% | |||
| Actual | $1,000.00 | $1,071.50 | $.52 | |
| Hypothetical-C | $1,000.00 | $1,024.57 | $.51 | |
| Class L | .10% | |||
| Actual | $1,000.00 | $1,071.40 | $.52 | |
| Hypothetical-C | $1,000.00 | $1,024.57 | $.51 | |
| Class N | .35% | |||
| Actual | $1,000.00 | $1,069.30 | $1.82 | |
| Hypothetical-C | $1,000.00 | $1,023.31 | $1.78 |
A Annualized expense ratio reflects expenses net of applicable fee waivers.
B Expenses are equal to each Class' annualized expense ratio, multiplied by the average account value over the period, multiplied by 183/ 365 (to reflect the one-half year period). The fees and expenses of the underlying Fidelity Funds in which each Fund invests are not included in each Fund's annualized expense ratio.
C 5% return per year before expenses
Board Approval of Investment Advisory Contracts and Management Fees
Fidelity Multi-Manager Target Date Funds (formerly Strategic Advisers Multi-Manager Target Date Funds)
Each year, the Board of Trustees, including the Independent Trustees (together, the Board), votes on the renewal of the management contract (the Advisory Contract) with FMR Co., Inc. (FMRC), an affiliate of Fidelity Management & Research Company (FMR), and the administration agreement between FMRC and FMR for each fund. The Board, assisted by the advice of fund counsel and Independent Trustees' counsel, requests and considers a broad range of information relevant to the renewal of the Advisory Contracts and administration agreements throughout the year.
The Board meets regularly and, at each of its meetings, covers an extensive agenda of topics and materials and considers factors that are relevant to its annual consideration of the renewal of each fund's Advisory Contract and administration agreement, including the services and support provided to each fund and its shareholders. The Board has established four standing committees (Committees) — Operations, Audit, Fair Valuation, and Governance and Nominating — each composed of and chaired by Independent Trustees with varying backgrounds, to which the Board has assigned specific subject matter responsibilities in order to enhance effective decision-making by the Board. The Operations Committee, of which all of the Independent Trustees are members, meets regularly throughout the year and considers, among other matters, information specifically related to the annual consideration of the renewal of each fund's Advisory Contract and administration agreement. The Board, acting directly and through its Committees, requests and receives information concerning the annual consideration of the renewal of each fund's Advisory Contract and administration agreement. The Board also meets as needed to consider matters specifically related to the Board's annual consideration of the renewal of the Advisory Contracts and administration agreements. Members of the Board may also meet with trustees of other Fidelity funds through ad hoc joint committees to discuss certain matters relevant to all of the Fidelity funds.
At its September 2016 meeting, the Board unanimously determined to renew each fund's Advisory Contract and administration agreement. In reaching its determination, the Board considered all factors it believed relevant and reached a determination, with the assistance of fund counsel and Independent Trustees' counsel and through the exercise of its business judgment, that the renewal of the Advisory Contract was in the best interests of each fund and its shareholders and that the fact that no fees are payable under the Advisory Contracts was fair and reasonable. The Board's decision to renew the Advisory Contracts was not based on any single factor, but rather was based on a comprehensive consideration of all the information provided to the Board at its meetings throughout the year. In reaching its determination, the Board was aware that shareholders of each fund have a broad range of investment choices available to them, including a wide choice among funds offered by Fidelity's competitors, and that each fund's shareholders, who have the opportunity to review and weigh the disclosure provided by the fund in its prospectus and other public disclosures, have chosen to invest in that fund, which is part of the Fidelity family of funds.
Nature, Extent, and Quality of Services Provided. The Board considered Fidelity's staffing as it relates to the funds, including the backgrounds of investment personnel of FMRC, and also considered the funds' investment objectives, strategies, and related investment philosophies. The Independent Trustees also had discussions with senior management of Fidelity's investment operations and investment groups with responsibility for the underlying Fidelity funds in which each fund invests. The Board considered the structure of the investment personnel compensation program and whether this structure provides appropriate incentives to act in the best interests of each fund. Additionally, the Board considered the portfolio managers' investments, if any, in the funds that they manage.Resources Dedicated to Investment Management and Support Services. The Board reviewed the general qualifications and capabilities of Fidelity's investment staff, including its size, education, experience, and resources, as well as Fidelity's approach to recruiting, managing, and compensating investment personnel. The Board noted that Fidelity has continued to increase the resources devoted to non-U.S. offices, including expansion of Fidelity's global investment organization. The Board also noted that Fidelity's analysts have extensive resources, tools and capabilities that allow them to conduct sophisticated quantitative and fundamental analysis, as well as credit analysis of issuers, counterparties and guarantors. Further, the Board considered that Fidelity's investment professionals have sufficient access to global information and data so as to provide competitive investment results over time, and that those professionals also have access to sophisticated tools that permit them to assess portfolio construction and risk and performance attribution characteristics continuously, as well as to transmit new information and research conclusions rapidly around the world. Additionally, in its deliberations, the Board considered Fidelity's risk management, compliance, and technology and operations capabilities and resources, which are integral parts of the investment management process.Shareholder and Administrative Services. The Board considered (i) the nature, extent, quality, and cost of advisory, administrative, and shareholder services performed by Fidelity under the Advisory Contract and under separate agreements covering administration, transfer agency, and pricing and bookkeeping services for each fund; (ii) the nature and extent of the supervision of third party service providers, principally custodians, subcustodians, and pricing vendors; and (iii) the resources devoted to, and the record of compliance with, each fund's compliance policies and procedures.The Board noted that the growth of fund assets over time across the complex allows Fidelity to reinvest in the development of services designed to enhance the value or convenience of the Fidelity funds as investment vehicles. These services include 24-hour access to account information and market information through telephone representatives and over the Internet, investor education materials and asset allocation tools, and the expanded availability of Fidelity Investor Centers.Investment in a Large Fund Family. The Board considered the benefits to shareholders of investing in a Fidelity fund, including the benefits of investing in a fund that is part of a large family of funds offering a variety of investment disciplines and providing a large variety of mutual fund investor services. The Board noted that Fidelity had taken, or had made recommendations that resulted in the Fidelity funds taking, a number of actions over the previous year that benefited particular funds, including: (i) continuing to dedicate additional resources to investment research and to the support of the senior management team that oversees asset management; (ii) continuing efforts to enhance Fidelity's global research capabilities; (iii) launching new funds and making other enhancements to meet client needs; (iv) broadening eligibility requirements for certain lower-priced share classes of, and streamlining the fee structure for, certain existing equity index funds; (v) lowering expense caps for certain existing funds and classes to reduce expenses paid by shareholders; (vi) eliminating redemption fees for certain variable insurance product funds and classes; (vii) continuing to launch dedicated lower cost underlying funds to meet portfolio construction needs related to expanding underlying fund options for Fidelity funds of funds, specifically for the Freedom Fund product lines; (viii) launching a lower cost share class for use by the Freedom Index Fund product line; (ix) rationalizing product lines and gaining increased efficiencies through fund mergers and share class consolidations; (x) continuing to develop, acquire and implement systems and technology to improve services to the funds and shareholders, strengthen information security, and increase efficiency; (xi) implementing investment enhancements to further strengthen Fidelity's target date product line to increase investors' probability of success in achieving their goals; (xii) accelerating the conversion of all remaining Class B shares to Class A shares, which have a lower expense structure; and (xiii) implementing changes to Fidelity's money market fund product line in response to recent regulatory reforms.Investment Performance. The Board considered whether each fund has operated in accordance with its investment objective, as well as its record of compliance with its investment restrictions and its performance history.The Board took into account discussions with representatives of the investment adviser about fund investment performance that occur at Board meetings throughout the year. In this regard the Board noted that as part of regularly scheduled fund reviews and other reports to the Board on fund performance, the Board considers annualized return information for each fund for different time periods, measured against one or more securities market indices, including a customized blended index representative of the fund's asset classes (each a "benchmark index") and a peer group of funds with similar objectives ("peer group"), if any. In its evaluation of fund investment performance at meetings throughout the year, the Board gave particular attention to information indicating underperformance of certain Fidelity funds for specific time periods and discussed with the investment adviser the reasons for such underperformance.In addition to reviewing absolute and relative fund performance, the Independent Trustees periodically consider the appropriateness of fund performance metrics in evaluating the results achieved. In general, the Independent Trustees believe that fund performance should be evaluated based on gross performance (before fees and expenses, including acquired fund fees and expenses, but after transaction costs, if any) compared to appropriate benchmark indices, over appropriate time periods that may include full market cycles, and on net performance (after fees and expenses, including acquired fund fees and expenses) compared to peer groups, as applicable, over the same periods, taking into account relevant factors including the following: general market conditions; the extent to which particular underlying funds affected performance; and fund cash flows and other factors. Depending on the circumstances, the Independent Trustees may be satisfied with a fund's performance notwithstanding that it lags its benchmark index or peer group for certain periods.The Independent Trustees recognize that shareholders evaluate performance on a net basis over their own holding periods, for which one-, three-, and five-year periods are often used as a proxy. For this reason, the performance information reviewed by the Board also included net cumulative calendar year total return information for each fund and an appropriate benchmark index for the most recent one- and three-year periods (for the most recent one-year period for Fidelity Multi-Manager 2060 Fund).Based on its review, the Board concluded that the nature, extent, and quality of services provided to each fund under the Advisory Contracts should continue to benefit the shareholders of each fund.Competitiveness of Management Fee and Total Expense Ratio. The Board noted that the funds do not pay FMRC a management fee for investment advisory services, and that each fund bears indirectly the fees and expenses, including the management fees, paid by the underlying Fidelity funds in which it invests. The Board considered each fund's management fee and total expense ratio compared to "mapped groups" of competitive funds and classes created for the purpose of facilitating the Trustees' competitive analysis of management fees and total expenses. Fidelity creates "mapped groups" by combining similar Lipper investment objective categories that have comparable investment mandates. Combining Lipper investment objective categories aids the Board's management fee and total expense ratio comparisons by broadening the competitive group used for comparison.Management Fee. The Board considered two proprietary management fee comparisons for the 12-month (or shorter) periods shown in basis points (BP) in the charts below. The group of Lipper funds used by the Board for management fee comparisons is referred to below as the "Total Mapped Group." The Total Mapped Group comparison focuses on a fund's standing in terms of gross management fees before expense reimbursements or caps relative to the total universe of funds with comparable investment mandates, regardless of whether their management fee structures also are comparable. Funds with comparable investment mandates offer exposure to similar types of securities. Funds with comparable management fee structures have similar management fee contractual arrangements (e.g., flat rate charged for advisory services, all-inclusive fee rate, etc.). "TMG %" represents the percentage of funds in the Total Mapped Group that had management fees that were lower than a fund's. For example, a hypothetical TMG % of 20% would mean that 80% of the funds in the Total Mapped Group had higher, and 20% had lower, management fees than a fund. The funds' actual TMG %s and the number of funds in the Total Mapped Group are in the charts below. The Board also noted that over the past few years, Fidelity has been developing and refining the competitive methodology for the funds to provide a more meaningful competitive comparison. As a result, beginning with the 2014 competitive results, instead of including all funds in one competitive mapped group that includes all funds-of-funds, Fidelity introduced three new Total Mapped Groups that consist of target retirement funds, grouped according to target retirement dates. The Board noted that Fidelity believes that the new Total Mapped Groups provide more meaningful competitive comparisons for the funds because they include target date funds, regardless of whether the fund is a fund of funds, and reflect, among other things, that active target date funds with a higher percentage of assets invested in equities tend to have higher expenses. The "Asset-Size Peer Group" (ASPG) comparison focuses on a fund's standing relative to a subset of non-Fidelity funds within the Total Mapped Group that are similar in size and management fee structure. For example, if a fund is in the first quartile of the ASPG, the fund's management fee ranks in the least expensive or lowest 25% of funds in the ASPG. The ASPG represents at least 15% of the funds in the Total Mapped Group with comparable asset size and management fee structures, subject to a minimum of 50 funds (or all funds in the Total Mapped Group if fewer than 50). Additional information, such as the ASPG quartile in which a fund's management fee rate ranked, is also included in the charts and considered by the Board.Fidelity Multi-Manager 2005 Fund

Fidelity Multi-Manager 2010 Fund

Fidelity Multi-Manager 2015 Fund

Fidelity Multi-Manager 2020 Fund
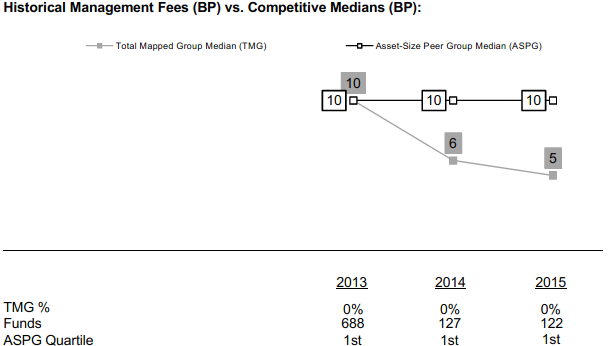
Fidelity Multi-Manager 2025 Fund
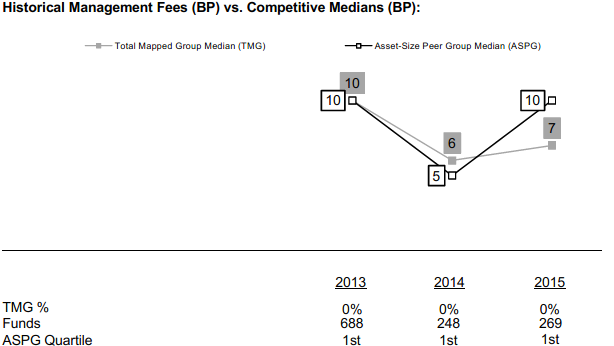
Fidelity Multi-Manager 2030 Fund
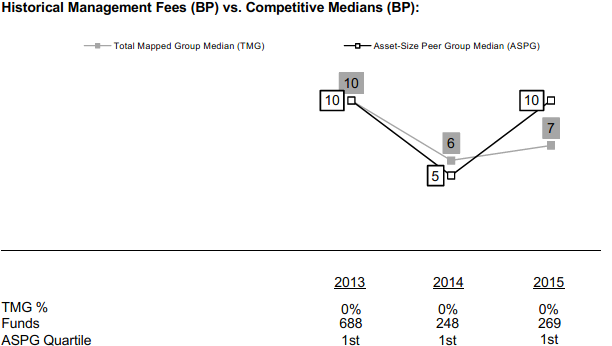
Fidelity Multi-Manager 2035 Fund

Fidelity Multi-Manager 2040 Fund

Fidelity Multi-Manager 2045 Fund
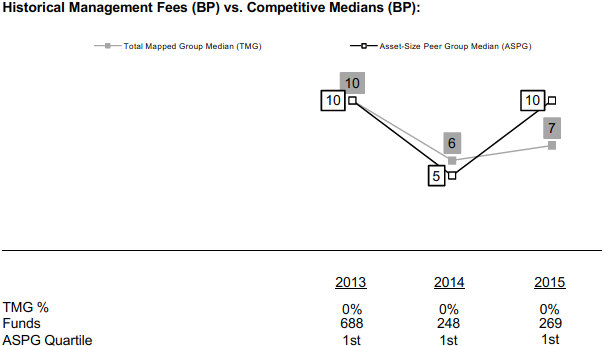
Fidelity Multi-Manager 2050 Fund
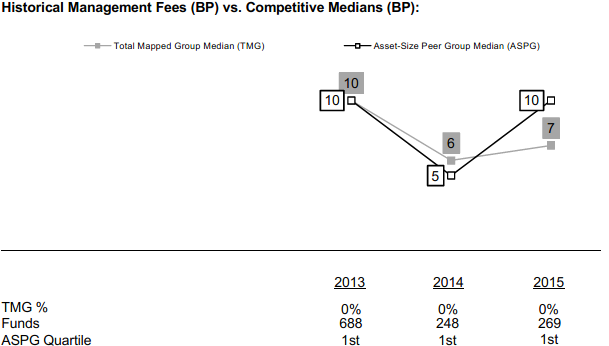
Fidelity Multi-Manager 2055 Fund
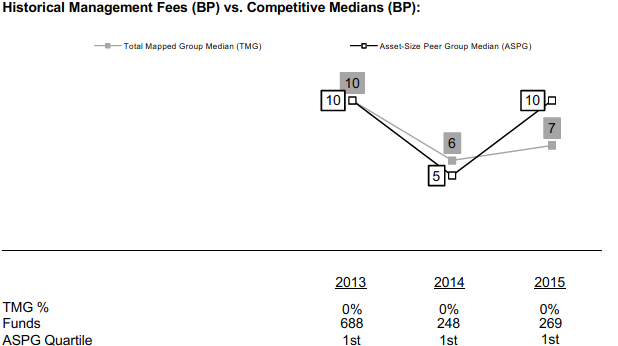
Fidelity Multi-Manager 2060 Fund
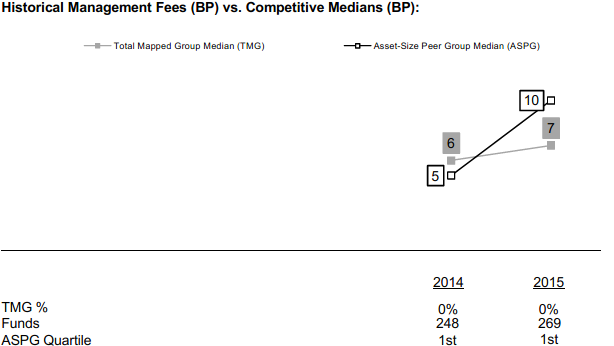
Fidelity Multi-Manager Income Fund
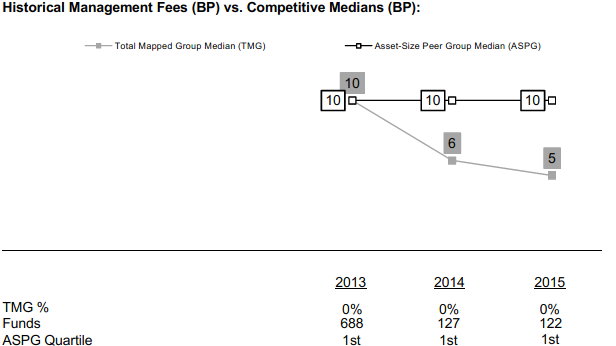
![]()
OLF-SANN-1116
1.954277.103
Fidelity® Multi-Manager Target Date Funds (formerly Strategic Advisers® Multi-Manager Target Date Funds) - Income, 2005, 2010, 2015, 2020, 2025, 2030, 2035, 2040, 2045, 2050, 2055, 2060 Semi-Annual Report September 30, 2016 |
|
Contents
Fidelity® Multi-Manager Income Fund | |
Fidelity® Multi-Manager 2005 Fund | |
Fidelity® Multi-Manager 2010 Fund | |
Fidelity® Multi-Manager 2015 Fund | |
Fidelity® Multi-Manager 2020 Fund | |
Fidelity® Multi-Manager 2025 Fund | |
Fidelity® Multi-Manager 2030 Fund | |
Fidelity® Multi-Manager 2035 Fund | |
Fidelity® Multi-Manager 2040 Fund | |
Fidelity® Multi-Manager 2045 Fund | |
Fidelity® Multi-Manager 2050 Fund | |
Fidelity® Multi-Manager 2055 Fund | |
Fidelity® Multi-Manager 2060 Fund | |
Board Approval of Investment Advisory Contracts and Management Fees |
To view a fund's proxy voting guidelines and proxy voting record for the 12-month period ended June 30, visit http://www.fidelity.com/proxyvotingresults or visit the Securities and Exchange Commission's (SEC) web site at http://www.sec.gov.
You may also call 1-800-835-5095 (plan participants) or 1-877-208-0098 (Advisors and Investment Professionals) to request a free copy of the proxy voting guidelines.
Standard & Poor's, S&P and S&P 500 are registered service marks of The McGraw-Hill Companies, Inc. and have been licensed for use by Fidelity Distributors Corporation.
Other third-party marks appearing herein are the property of their respective owners.
All other marks appearing herein are registered or unregistered trademarks or service marks of FMR LLC or an affiliated company. © 2016 FMR LLC. All rights reserved.
This report and the financial statements contained herein are submitted for the general information of the shareholders of the Funds. This report is not authorized for distribution to prospective investors in the Funds unless preceded or accompanied by an effective prospectus.
A fund files its complete schedule of portfolio holdings with the SEC for the first and third quarters of each fiscal year on Form N-Q. Forms N-Q are available on the SEC’s web site at http://www.sec.gov. A fund's Forms N-Q may be reviewed and copied at the SEC’s Public Reference Room in Washington, DC. Information regarding the operation of the SEC's Public Reference Room may be obtained by calling 1-800-SEC-0330.
For a complete list of a fund's portfolio holdings, view the most recent holdings listing, semiannual report, or annual report on Fidelity's web site at http://www.fidelity.com, http://www.institutional.fidelity.com, or http://www.401k.com, as applicable.
NOT FDIC INSURED •MAY LOSE VALUE •NO BANK GUARANTEE
Neither the Funds nor Fidelity Distributors Corporation is a bank.
Fidelity® Multi-Manager Income Fund
Investment Summary (Unaudited)
The information in the following tables is based on the direct investments of the Fund.Top Holdings as of September 30, 2016
| % of fund's net assets | % of fund's net assets 6 months ago | |
| Strategic Advisers Core Income Multi-Manager Fund Class F | 37.5 | 38.9 |
| Fidelity Investments Money Market Government Portfolio Institutional Class 0.31% | 17.3 | 16.5 |
| Fidelity Series Short-Term Credit Fund Class F | 9.3 | 9.0 |
| Strategic Advisers International Multi-Manager Fund Class F | 5.5 | 4.5 |
| Strategic Advisers Emerging Markets Fund of Funds Class F | 4.9 | 4.5 |
| Strategic Advisers Core Multi-Manager Fund Class F | 4.7 | 5.2 |
| Strategic Advisers Value Multi-Manager Fund Class F | 4.7 | 5.2 |
| Strategic Advisers Growth Multi-Manager Fund Class F | 4.0 | 4.3 |
| Fidelity Series Inflation-Protected Bond Index Fund Class F | 3.8 | 3.8 |
| Strategic Advisers Income Opportunities Fund of Funds Class F | 2.8 | 3.0 |
| 94.5 | 94.9 |
Asset Allocation (% of fund's net assets)
| Period end | ||
| Domestic Equity Funds | 17.4% | |
| International Equity Funds | 10.4% | |
| Bond Funds | 45.6% | |
| Short-Term Funds | 26.6% | |

| Six months ago | ||
| Domestic Equity Funds | 18.5% | |
| International Equity Funds | 9.0% | |
| Bond Funds | 47.0% | |
| Short-Term Funds | 25.5% | |

Domestic Equity Funds category includes Fidelity Series Commodity Strategy Fund which invests in commodity-related investments.
Fidelity® Multi-Manager Income Fund
Investments September 30, 2016 (Unaudited)
Showing Percentage of Net Assets
| Domestic Equity Funds - 17.4% | |||
| Shares | Value | ||
| Fidelity Series Commodity Strategy Fund Class F (a)(b) | 4,060 | $21,720 | |
| Strategic Advisers Core Multi-Manager Fund Class F (b) | 5,396 | 64,369 | |
| Strategic Advisers Growth Multi-Manager Fund Class F (b) | 4,125 | 53,997 | |
| Strategic Advisers Small-Mid Cap Multi-Manager Fund Class F (b) | 2,998 | 32,441 | |
| Strategic Advisers Value Multi-Manager Fund Class F (b) | 4,721 | 64,302 | |
| TOTAL DOMESTIC EQUITY FUNDS | |||
| (Cost $246,156) | 236,829 | ||
| International Equity Funds - 10.4% | |||
| Strategic Advisers Emerging Markets Fund of Funds Class F (b) | 7,061 | 66,300 | |
| Strategic Advisers International Multi-Manager Fund Class F (b) | 6,467 | 74,502 | |
| TOTAL INTERNATIONAL EQUITY FUNDS | |||
| (Cost $137,740) | 140,802 | ||
| Bond Funds - 45.6% | |||
| Fidelity Series Emerging Markets Debt Fund Class F (b) | 879 | 9,103 | |
| Fidelity Series Floating Rate High Income Fund Class F (b) | 370 | 3,490 | |
| Fidelity Series Inflation-Protected Bond Index Fund Class F (b) | 5,189 | 52,309 | |
| Fidelity Series Real Estate Income Fund Class F (b) | 596 | 6,687 | |
| Strategic Advisers Core Income Multi-Manager Fund Class F (b) | 50,521 | 511,276 | |
| Strategic Advisers Income Opportunities Fund of Funds Class F (b) | 3,906 | 38,670 | |
| TOTAL BOND FUNDS | |||
| (Cost $607,755) | 621,535 | ||
| Short-Term Funds - 26.6% | |||
| Fidelity Investments Money Market Government Portfolio Institutional Class 0.31% (b)(c) | 235,885 | 235,885 | |
| Fidelity Series Short-Term Credit Fund Class F (b) | 12,650 | 126,881 | |
| TOTAL SHORT-TERM FUNDS | |||
| (Cost $362,256) | 362,766 | ||
| TOTAL INVESTMENT PORTFOLIO - 100.0% | |||
| (Cost $1,353,907) | 1,361,932 | ||
| NET OTHER ASSETS (LIABILITIES) - 0.0% | (76) | ||
| NET ASSETS - 100% | $1,361,856 |
Legend
(a) Non-income producing
(b) Affiliated Fund
(c) The rate quoted is the annualized seven-day yield of the fund at period end.
Affiliated Underlying Funds
Information regarding the Fund's fiscal year to date purchases and sales of the affiliated Underlying Funds and income earned by the Fund from investments in affiliated Underlying Funds is as follows:
| Affiliate | Value, beginning of period | Purchases | Sales Proceeds | Dividend Income | Value, end of period |
| Fidelity Investments Money Market Government Portfolio Institutional Class 0.31% | $170,557 | $90,317 | $24,990 | $306 | $235,885 |
| Fidelity Series Commodity Strategy Fund Class F | 12,821 | 14,372 | 6,680 | -- | 21,720 |
| Fidelity Series Emerging Markets Debt Fund Class F | 6,498 | 2,801 | 891 | 222 | 9,103 |
| Fidelity Series Floating Rate High Income Fund Class F | 2,578 | 1,144 | 371 | 70 | 3,490 |
| Fidelity Series Inflation-Protected Bond Index Fund Class F | 39,172 | 18,045 | 5,891 | 54 | 52,309 |
| Fidelity Series Real Estate Income Fund Class F | 4,962 | 2,445 | 872 | 166 | 6,687 |
| Fidelity Series Short-Term Credit Fund Class F | 92,426 | 47,441 | 13,456 | 598 | 126,881 |
| Strategic Advisers Core Income Multi-Manager Fund Class F | 400,970 | 165,481 | 66,981 | 5,448 | 511,276 |
| Strategic Advisers Core Multi-Manager Fund Class F | 53,445 | 22,583 | 11,831 | 209 | 64,369 |
| Strategic Advisers Emerging Markets Fund of Funds Class F | 45,826 | 20,553 | 6,610 | -- | 66,300 |
| Strategic Advisers Growth Multi-Manager Fund Class F | 44,598 | 18,811 | 9,714 | 159 | 53,997 |
| Strategic Advisers Income Opportunities Fund of Funds Class F | 31,145 | 9,454 | 4,209 | 968 | 38,670 |
| Strategic Advisers International Multi-Manager Fund Class F | 46,760 | 32,424 | 8,007 | -- | 74,502 |
| Strategic Advisers Small-Mid Cap Multi-Manager Fund Class F | 26,768 | 9,375 | 6,518 | -- | 32,441 |
| Strategic Advisers Value Multi-Manager Fund Class F | 53,390 | 21,251 | 11,567 | 443 | 64,302 |
| Total | $1,031,916 | $476,497 | $178,588 | $8,643 | $1,361,932 |
Investment Valuation
All investments are categorized as Level 1 under the Fair Value Hierarchy. The inputs or methodology used for valuing securities may not be an indication of the risk associated with investing in those securities. For more information on valuation inputs please refer to the Investment Valuation section in the accompanying Notes to Financial Statements.
See accompanying notes which are an integral part of the financial statements.
Fidelity® Multi-Manager Income Fund
Financial Statements
Statement of Assets and Liabilities
| September 30, 2016 (Unaudited) | ||
| Assets | ||
| Investment in securities, at value (cost $1,353,907) — See accompanying schedule | $1,361,932 | |
| Receivable for investments sold | 56,567 | |
| Receivable for fund shares sold | 2,669 | |
| Total assets | 1,421,168 | |
| Liabilities | ||
| Payable for fund shares redeemed | $59,233 | |
| Distribution and service plan fees payable | 22 | |
| Other affiliated payables | 57 | |
| Total liabilities | 59,312 | |
| Net Assets | $1,361,856 | |
| Net Assets consist of: | ||
| Paid in capital | $1,360,055 | |
| Undistributed net investment income | 1,462 | |
| Accumulated undistributed net realized gain (loss) on investments | (7,686) | |
| Net unrealized appreciation (depreciation) on investments | 8,025 | |
| Net Assets | $1,361,856 | |
| Multi-Manager Income: | ||
| Net Asset Value, offering price and redemption price per share ($1,153,778 ÷ 112,507 shares) | $10.26 | |
| Class L: | ||
| Net Asset Value, offering price and redemption price per share ($104,408 ÷ 10,180 shares) | $10.26 | |
| Class N: | ||
| Net Asset Value, offering price and redemption price per share ($103,670 ÷ 10,114 shares) | $10.25 |
See accompanying notes which are an integral part of the financial statements.
Statement of Operations
| Six months ended September 30, 2016 (Unaudited) | ||
| Investment Income | ||
| Income distributions from underlying funds | $8,643 | |
| Expenses | ||
| Transfer agent fees | $322 | |
| Distribution and service plan fees | 127 | |
| Independent trustees' fees and expenses | 3 | |
| Total expenses | 452 | |
| Net investment income (loss) | 8,191 | |
| Realized and Unrealized Gain (Loss) | ||
| Realized gain (loss) on sale of underlying fund shares | (821) | |
| Capital gain distributions from underlying funds | 7,877 | |
| Total net realized gain (loss) | 7,056 | |
| Change in net unrealized appreciation (depreciation) on underlying funds | 32,927 | |
| Net gain (loss) | 39,983 | |
| Net increase (decrease) in net assets resulting from operations | $48,174 |
See accompanying notes which are an integral part of the financial statements.
Statement of Changes in Net Assets
| Six months ended September 30, 2016 (Unaudited) | Year ended March 31, 2016 | |
| Increase (Decrease) in Net Assets | ||
| Operations | ||
| Net investment income (loss) | $8,191 | $18,510 |
| Net realized gain (loss) | 7,056 | (5,422) |
| Change in net unrealized appreciation (depreciation) | 32,927 | (25,916) |
| Net increase (decrease) in net assets resulting from operations | 48,174 | (12,828) |
| Distributions to shareholders from net investment income | (7,610) | (18,299) |
| Distributions to shareholders from net realized gain | – | (21,320) |
| Total distributions | (7,610) | (39,619) |
| Share transactions - net increase (decrease) | 289,436 | (48,542) |
| Total increase (decrease) in net assets | 330,000 | (100,989) |
| Net Assets | ||
| Beginning of period | 1,031,856 | 1,132,845 |
| End of period | $1,361,856 | $1,031,856 |
| Other Information | ||
| Undistributed net investment income end of period | $1,462 | $881 |
See accompanying notes which are an integral part of the financial statements.
Financial Highlights — Fidelity Multi-Manager Income Fund
| Six months ended (Unaudited) September 30, | Years ended March 31, | ||||
| 2016 | 2016 | 2015 | 2014 | 2013 A | |
| Selected Per–Share Data | |||||
| Net asset value, beginning of period | $9.91 | $10.33 | $10.29 | $10.14 | $10.00 |
| Income from Investment Operations | |||||
| Net investment income (loss)B | .07 | .17 | .18 | .14 | .04 |
| Net realized and unrealized gain (loss) | .34 | (.24) | .22 | .24 | .13 |
| Total from investment operations | .41 | (.07) | .40 | .38 | .17 |
| Distributions from net investment income | (.06) | (.16) | (.19) | (.12) | (.03) |
| Distributions from net realized gain | – | (.19) | (.18) | (.11) | – |
| Total distributions | (.06) | (.35) | (.36)C | (.23) | (.03) |
| Net asset value, end of period | $10.26 | $9.91 | $10.33 | $10.29 | $10.14 |
| Total ReturnD,E | 4.18% | (.65)% | 3.98% | 3.79% | 1.71% |
| Ratios to Average Net AssetsF,G | |||||
| Expenses before reductions | .05%H | .05% | .05% | .06% | .15%H |
| Expenses net of fee waivers, if any | .05%H | .05% | .05% | .06% | .06%H |
| Expenses net of all reductions | .05%H | .05% | .05% | .06% | .06%H |
| Net investment income (loss) | 1.36%H | 1.66% | 1.77% | 1.43% | 1.52%H |
| Supplemental Data | |||||
| Net assets, end of period (000 omitted) | $1,154 | $822 | $921 | $702 | $102 |
| Portfolio turnover rateF | 29%H | 44% | 23% | 40% | 0%I |
A For the period December 20, 2012 (commencement of operations) to March 31, 2013.
B Calculated based on average shares outstanding during the period.
C Total distributions of $.36 per share is comprised of distributions from net investment income of $.186 and distributions from net realized gain of $.177 per share.
D Total returns for periods of less than one year are not annualized.
E Total returns would have been lower if certain expenses had not been reduced during the applicable periods shown.
F Amounts do not include the activity of the Underlying Funds.
G Expense ratios reflect operating expenses of the class. Expenses before reductions do not reflect amounts reimbursed by the investment adviser or reductions from expense offset arrangements and do not represent the amount paid by the class during periods when reimbursements or reductions occur. Expense ratios before reductions for start-up periods may not be representative of longer-term operating periods. Expenses net of fee waivers reflect expenses after reimbursement by the investment adviser but prior to reductions from expense offset arrangements. Expenses net of all reductions represent the net expenses paid by the class but do not include expenses of the underlying funds in which the Fund invests.
H Annualized
I Amount not annualized.
See accompanying notes which are an integral part of the financial statements.
Financial Highlights — Fidelity Multi-Manager Income Fund Class L
| Six months ended (Unaudited) September 30, | Years ended March 31, | |||
| 2016 | 2016 | 2015 | 2014 A | |
| Selected Per–Share Data | ||||
| Net asset value, beginning of period | $9.92 | $10.33 | $10.29 | $10.19 |
| Income from Investment Operations | ||||
| Net investment income (loss)B | .07 | .17 | .18 | .05 |
| Net realized and unrealized gain (loss) | .33 | (.23) | .22 | .15 |
| Total from investment operations | .40 | (.06) | .40 | .20 |
| Distributions from net investment income | (.06) | (.16) | (.19) | (.04) |
| Distributions from net realized gain | – | (.19) | (.18) | (.06) |
| Total distributions | (.06) | (.35) | (.36)C | (.10) |
| Net asset value, end of period | $10.26 | $9.92 | $10.33 | $10.29 |
| Total ReturnD | 4.08% | (.57)% | 3.97% | 2.00% |
| Ratios to Average Net AssetsE,F | ||||
| Expenses before reductions | .05%G | .05% | .06% | .06%G |
| Expenses net of fee waivers, if any | .05%G | .05% | .06% | .06%G |
| Expenses net of all reductions | .05%G | .05% | .06% | .06%G |
| Net investment income (loss) | 1.36%G | 1.66% | 1.77% | 1.62%G |
| Supplemental Data | ||||
| Net assets, end of period (000 omitted) | $104 | $105 | $106 | $102 |
| Portfolio turnover rateE | 29%G | 44% | 23% | 40% |
A For the period December 4, 2013 (commencement of sale of shares) to March 31, 2014.
B Calculated based on average shares outstanding during the period.
C Total distributions of $.36 per share is comprised of distributions from net investment income of $.185 and distributions from net realized gain of $.177 per share.
D Total returns for periods of less than one year are not annualized.
E Amounts do not include the activity of the Underlying Funds.
F Expense ratios reflect operating expenses of the class. Expenses before reductions do not reflect amounts reimbursed by the investment adviser or reductions from expense offset arrangements and do not represent the amount paid by the class during periods when reimbursements or reductions occur. Expenses net of fee waivers reflect expenses after reimbursement by the investment adviser but prior to reductions from expense offset arrangements. Expenses net of all reductions represent the net expenses paid by the class but do not include expenses of the underlying funds in which the Fund invests.
G Annualized
See accompanying notes which are an integral part of the financial statements.
Financial Highlights — Fidelity Multi-Manager Income Fund Class N
| Six months ended (Unaudited) September 30, | Years ended March 31, | |||
| 2016 | 2016 | 2015 | 2014 A | |
| Selected Per–Share Data | ||||
| Net asset value, beginning of period | $9.91 | $10.33 | $10.29 | $10.19 |
| Income from Investment Operations | ||||
| Net investment income (loss)B | .06 | .14 | .16 | .04 |
| Net realized and unrealized gain (loss) | .33 | (.23) | .22 | .16 |
| Total from investment operations | .39 | (.09) | .38 | .20 |
| Distributions from net investment income | (.05) | (.14) | (.16) | (.04) |
| Distributions from net realized gain | – | (.19) | (.18) | (.06) |
| Total distributions | (.05) | (.33) | (.34) | (.10) |
| Net asset value, end of period | $10.25 | $9.91 | $10.33 | $10.29 |
| Total ReturnC | 3.96% | (.90)% | 3.71% | 1.94% |
| Ratios to Average Net AssetsD,E | ||||
| Expenses before reductions | .30%F | .30% | .31% | .32%F |
| Expenses net of fee waivers, if any | .30%F | .30% | .31% | .32%F |
| Expenses net of all reductions | .30%F | .30% | .31% | .32%F |
| Net investment income (loss) | 1.11%F | 1.41% | 1.52% | 1.36%F |
| Supplemental Data | ||||
| Net assets, end of period (000 omitted) | $104 | $105 | $106 | $102 |
| Portfolio turnover rateD | 29%F | 44% | 23% | 40% |
A For the period December 4, 2013 (commencement of sale of shares) to March 31, 2014.
B Calculated based on average shares outstanding during the period.
C Total returns for periods of less than one year are not annualized.
D Amounts do not include the activity of the Underlying Funds.
E Expense ratios reflect operating expenses of the class. Expenses before reductions do not reflect amounts reimbursed by the investment adviser or reductions from expense offset arrangements and do not represent the amount paid by the class during periods when reimbursements or reductions occur. Expenses net of fee waivers reflect expenses after reimbursement by the investment adviser but prior to reductions from expense offset arrangements. Expenses net of all reductions represent the net expenses paid by the class but do not include expenses of the underlying funds in which the Fund invests.
F Annualized
See accompanying notes which are an integral part of the financial statements.
Fidelity® Multi-Manager 2005 Fund
Investment Summary (Unaudited)
The information in the following tables is based on the direct investments of the Fund.Top Holdings as of September 30, 2016
| % of fund's net assets | % of fund's net assets 6 months ago | |
| Strategic Advisers Core Income Multi-Manager Fund Class F | 33.3 | 34.5 |
| Fidelity Investments Money Market Government Portfolio Institutional Class 0.31% | 12.6 | 11.4 |
| Strategic Advisers International Multi-Manager Fund Class F | 8.2 | 7.5 |
| Strategic Advisers Core Multi-Manager Fund Class F | 7.2 | 7.8 |
| Strategic Advisers Value Multi-Manager Fund Class F | 7.2 | 7.8 |
| Fidelity Series Short-Term Credit Fund Class F | 6.7 | 6.1 |
| Strategic Advisers Growth Multi-Manager Fund Class F | 6.1 | 6.5 |
| Strategic Advisers Emerging Markets Fund of Funds Class F | 5.9 | 5.5 |
| Strategic Advisers Small-Mid Cap Multi-Manager Fund Class F | 3.6 | 3.9 |
| Fidelity Series Inflation-Protected Bond Index Fund Class F | 3.3 | 3.3 |
| 94.1 | 94.3 |
Asset Allocation (% of fund's net assets)
| Period end | ||
| Domestic Equity Funds | 25.6% | |
| International Equity Funds | 14.1% | |
| Bond Funds | 41.0% | |
| Short-Term Funds | 19.3% | |

| Six months ago | ||
| Domestic Equity Funds | 27.3% | |
| International Equity Funds | 13.0% | |
| Bond Funds | 42.2% | |
| Short-Term Funds | 17.5% | |

Domestic Equity Funds category includes Fidelity Series Commodity Strategy Fund which invests in commodity-related investments.
Fidelity® Multi-Manager 2005 Fund
Investments September 30, 2016 (Unaudited)
Showing Percentage of Net Assets
| Domestic Equity Funds - 25.6% | |||
| Shares | Value | ||
| Fidelity Series Commodity Strategy Fund Class F (a)(b) | 956 | $5,117 | |
| Strategic Advisers Core Multi-Manager Fund Class F (b) | 2,035 | 24,280 | |
| Strategic Advisers Growth Multi-Manager Fund Class F (b) | 1,556 | 20,366 | |
| Strategic Advisers Small-Mid Cap Multi-Manager Fund Class F (b) | 1,131 | 12,239 | |
| Strategic Advisers Value Multi-Manager Fund Class F (b) | 1,781 | 24,256 | |
| TOTAL DOMESTIC EQUITY FUNDS | |||
| (Cost $88,281) | 86,258 | ||
| International Equity Funds - 14.1% | |||
| Strategic Advisers Emerging Markets Fund of Funds Class F (b) | 2,134 | 20,039 | |
| Strategic Advisers International Multi-Manager Fund Class F (b) | 2,395 | 27,596 | |
| TOTAL INTERNATIONAL EQUITY FUNDS | |||
| (Cost $47,495) | 47,635 | ||
| Bond Funds - 41.0% | |||
| Fidelity Series Emerging Markets Debt Fund Class F (b) | 222 | 2,302 | |
| Fidelity Series Floating Rate High Income Fund Class F (b) | 91 | 855 | |
| Fidelity Series Inflation-Protected Bond Index Fund Class F (b) | 1,123 | 11,319 | |
| Fidelity Series Real Estate Income Fund Class F (b) | 149 | 1,674 | |
| Strategic Advisers Core Income Multi-Manager Fund Class F (b) | 11,104 | 112,375 | |
| Strategic Advisers Income Opportunities Fund of Funds Class F (b) | 1,015 | 10,045 | |
| TOTAL BOND FUNDS | |||
| (Cost $135,501) | 138,570 | ||
| Short-Term Funds - 19.3% | |||
| Fidelity Investments Money Market Government Portfolio Institutional Class 0.31% (b)(c) | 42,405 | 42,405 | |
| Fidelity Series Short-Term Credit Fund Class F (b) | 2,264 | 22,707 | |
| TOTAL SHORT-TERM FUNDS | |||
| (Cost $65,024) | 65,112 | ||
| TOTAL INVESTMENT PORTFOLIO - 100.0% | |||
| (Cost $336,301) | 337,575 | ||
| NET OTHER ASSETS (LIABILITIES) - 0.0% | (36) | ||
| NET ASSETS - 100% | $337,539 |
Legend
(a) Non-income producing
(b) Affiliated Fund
(c) The rate quoted is the annualized seven-day yield of the fund at period end.
Affiliated Underlying Funds
Information regarding the Fund's fiscal year to date purchases and sales of the affiliated Underlying Funds and income earned by the Fund from investments in affiliated Underlying Funds is as follows:
| Affiliate | Value, beginning of period | Purchases | Sales Proceeds | Dividend Income | Value, end of period |
| Fidelity Investments Money Market Government Portfolio Institutional Class 0.31% | $39,271 | $5,744 | $2,611 | $60 | $42,405 |
| Fidelity Series Commodity Strategy Fund Class F | 4,349 | 787 | 336 | -- | 5,117 |
| Fidelity Series Emerging Markets Debt Fund Class F | 2,184 | 70 | 145 | 62 | 2,302 |
| Fidelity Series Floating Rate High Income Fund Class F | 850 | 26 | 61 | 19 | 855 |
| Fidelity Series Inflation-Protected Bond Index Fund Class F | 11,468 | 480 | 844 | 13 | 11,319 |
| Fidelity Series Real Estate Income Fund Class F | 1,668 | 112 | 156 | 42 | 1,674 |
| Fidelity Series Short-Term Credit Fund Class F | 21,047 | 3,055 | 1,478 | 116 | 22,707 |
| Strategic Advisers Core Income Multi-Manager Fund Class F | 118,898 | 1,958 | 11,336 | 1,342 | 112,375 |
| Strategic Advisers Core Multi-Manager Fund Class F | 26,954 | 1,511 | 4,395 | 85 | 24,280 |
| Strategic Advisers Emerging Markets Fund of Funds Class F | 19,015 | 287 | 1,299 | -- | 20,039 |
| Strategic Advisers Growth Multi-Manager Fund Class F | 22,492 | 1,364 | 3,677 | 63 | 20,366 |
| Strategic Advisers Income Opportunities Fund of Funds Class F | 10,370 | 304 | 1,302 | 289 | 10,045 |
| Strategic Advisers International Multi-Manager Fund Class F | 25,864 | 2,925 | 2,600 | -- | 27,596 |
| Strategic Advisers Small-Mid Cap Multi-Manager Fund Class F | 13,500 | 73 | 2,544 | -- | 12,239 |
| Strategic Advisers Value Multi-Manager Fund Class F | 26,926 | 1,079 | 4,406 | 180 | 24,256 |
| Total | $344,856 | $19,775 | $37,190 | $2,271 | $337,575 |
Investment Valuation
All investments are categorized as Level 1 under the Fair Value Hierarchy. The inputs or methodology used for valuing securities may not be an indication of the risk associated with investing in those securities. For more information on valuation inputs please refer to the Investment Valuation section in the accompanying Notes to Financial Statements.
See accompanying notes which are an integral part of the financial statements.
Fidelity® Multi-Manager 2005 Fund
Financial Statements
Statement of Assets and Liabilities
| September 30, 2016 (Unaudited) | ||
| Assets | ||
| Investment in securities, at value (cost $336,301) — See accompanying schedule | $337,575 | |
| Receivable for investments sold | 6,568 | |
| Total assets | 344,143 | |
| Liabilities | ||
| Payable for fund shares redeemed | $6,569 | |
| Distribution and service plan fees payable | 22 | |
| Other affiliated payables | 13 | |
| Total liabilities | 6,604 | |
| Net Assets | $337,539 | |
| Net Assets consist of: | ||
| Paid in capital | $337,635 | |
| Undistributed net investment income | 1,944 | |
| Accumulated undistributed net realized gain (loss) on investments | (3,314) | |
| Net unrealized appreciation (depreciation) on investments | 1,274 | |
| Net Assets | $337,539 | |
| Multi-Manager 2005: | ||
| Net Asset Value, offering price and redemption price per share ($126,853 ÷ 12,174 shares) | $10.42 | |
| Class L: | ||
| Net Asset Value, offering price and redemption price per share ($105,713 ÷ 10,155 shares) | $10.41 | |
| Class N: | ||
| Net Asset Value, offering price and redemption price per share ($104,973 ÷ 10,096 shares) | $10.40 |
See accompanying notes which are an integral part of the financial statements.
Statement of Operations
| Six months ended September 30, 2016 (Unaudited) | ||
| Investment Income | ||
| Income distributions from underlying funds | $2,271 | |
| Expenses | ||
| Transfer agent fees | $130 | |
| Distribution and service plan fees | 129 | |
| Independent trustees' fees and expenses | 1 | |
| Total expenses | 260 | |
| Net investment income (loss) | 2,011 | |
| Realized and Unrealized Gain (Loss) | ||
| Realized gain (loss) on sale of underlying fund shares | (1,618) | |
| Capital gain distributions from underlying funds | 3,178 | |
| Total net realized gain (loss) | 1,560 | |
| Change in net unrealized appreciation (depreciation) on underlying funds | 11,752 | |
| Net gain (loss) | 13,312 | |
| Net increase (decrease) in net assets resulting from operations | $15,323 |
See accompanying notes which are an integral part of the financial statements.
Statement of Changes in Net Assets
| Six months ended September 30, 2016 (Unaudited) | Year ended March 31, 2016 | |
| Increase (Decrease) in Net Assets | ||
| Operations | ||
| Net investment income (loss) | $2,011 | $5,519 |
| Net realized gain (loss) | 1,560 | (698) |
| Change in net unrealized appreciation (depreciation) | 11,752 | (10,838) |
| Net increase (decrease) in net assets resulting from operations | 15,323 | (6,017) |
| Distributions to shareholders from net investment income | (886) | (5,516) |
| Distributions to shareholders from net realized gain | – | (10,129) |
| Total distributions | (886) | (15,645) |
| Share transactions - net increase (decrease) | (21,718) | 31,453 |
| Total increase (decrease) in net assets | (7,281) | 9,791 |
| Net Assets | ||
| Beginning of period | 344,820 | 335,029 |
| End of period | $337,539 | $344,820 |
| Other Information | ||
| Undistributed net investment income end of period | $1,944 | $819 |
See accompanying notes which are an integral part of the financial statements.
Financial Highlights — Fidelity Multi-Manager 2005 Fund
| Six months ended (Unaudited) September 30, | Years ended March 31, | ||||
| 2016 | 2016 | 2015 | 2014 | 2013 A | |
| Selected Per–Share Data | |||||
| Net asset value, beginning of period | $9.98 | $10.58 | $10.65 | $10.27 | $10.00 |
| Income from Investment Operations | |||||
| Net investment income (loss)B | .07 | .16 | .19 | .14 | .05 |
| Net realized and unrealized gain (loss) | .40 | (.30) | .31 | .49 | .22 |
| Total from investment operations | .47 | (.14) | .50 | .63 | .27 |
| Distributions from net investment income | (.03) | (.16) | (.19) | (.10) | – |
| Distributions from net realized gain | – | (.30) | (.39) | (.15) | – |
| Total distributions | (.03) | (.46) | (.57)C | (.25) | – |
| Net asset value, end of period | $10.42 | $9.98 | $10.58 | $10.65 | $10.27 |
| Total ReturnD,E | 4.71% | (1.34)% | 4.83% | 6.18% | 2.70% |
| Ratios to Average Net AssetsF,G | |||||
| Expenses before reductions | .07%H | .06% | .05% | .06% | .15%H |
| Expenses net of fee waivers, if any | .07%H | .06% | .05% | .06% | .06%H |
| Expenses net of all reductions | .07%H | .06% | .05% | .06% | .06%H |
| Net investment income (loss) | 1.28%H | 1.63% | 1.76% | 1.32% | 1.63%H |
| Supplemental Data | |||||
| Net assets, end of period (000 omitted) | $127 | $133 | $120 | $115 | $103 |
| Portfolio turnover rateF | 12%H | 48% | 17% | 44% | 1%I |
A For the period December 20, 2012 (commencement of operations) to March 31, 2013.
B Calculated based on average shares outstanding during the period.
C Total distributions of $.57 per share is comprised of distributions from net investment income of $.186 and distributions from net realized gain of $.385 per share.
D Total returns for periods of less than one year are not annualized.
E Total returns would have been lower if certain expenses had not been reduced during the applicable periods shown.
F Amounts do not include the activity of the Underlying Funds.
G Expense ratios reflect operating expenses of the class. Expenses before reductions do not reflect amounts reimbursed by the investment adviser or reductions from expense offset arrangements and do not represent the amount paid by the class during periods when reimbursements or reductions occur. Expense ratios before reductions for start-up periods may not be representative of longer-term operating periods. Expenses net of fee waivers reflect expenses after reimbursement by the investment adviser but prior to reductions from expense offset arrangements. Expenses net of all reductions represent the net expenses paid by the class but do not include expenses of the underlying funds in which the Fund invests.
H Annualized
I Amount not annualized.
See accompanying notes which are an integral part of the financial statements.
Financial Highlights — Fidelity Multi-Manager 2005 Fund Class L
| Six months ended (Unaudited) September 30, | Years ended March 31, | |||
| 2016 | 2016 | 2015 | 2014 A | |
| Selected Per–Share Data | ||||
| Net asset value, beginning of period | $9.97 | $10.57 | $10.64 | $10.51 |
| Income from Investment Operations | ||||
| Net investment income (loss)B | .06 | .16 | .18 | .06 |
| Net realized and unrealized gain (loss) | .41 | (.30) | .32 | .22 |
| Total from investment operations | .47 | (.14) | .50 | .28 |
| Distributions from net investment income | (.03) | (.16) | (.18) | (.06) |
| Distributions from net realized gain | – | (.30) | (.39) | (.09) |
| Total distributions | (.03) | (.46) | (.57) | (.15) |
| Net asset value, end of period | $10.41 | $9.97 | $10.57 | $10.64 |
| Total ReturnC,D | 4.72% | (1.39)% | 4.79% | 2.64% |
| Ratios to Average Net AssetsE,F | ||||
| Expenses before reductions | .09%G | .09% | .10% | .07%G |
| Expenses net of fee waivers, if any | .09%G | .09% | .10% | .07%G |
| Expenses net of all reductions | .09%G | .09% | .10% | .07%G |
| Net investment income (loss) | 1.26%G | 1.59% | 1.71% | 1.90%G |
| Supplemental Data | ||||
| Net assets, end of period (000 omitted) | $106 | $106 | $108 | $103 |
| Portfolio turnover rateE | 12%G | 48% | 17% | 44% |
A For the period December 4, 2013 (commencement of sale of shares) to March 31, 2014.
B Calculated based on average shares outstanding during the period.
C Total returns for periods of less than one year are not annualized.
D Total returns would have been lower if certain expenses had not been reduced during the applicable periods shown.
E Amounts do not include the activity of the Underlying Funds.
F Expense ratios reflect operating expenses of the class. Expenses before reductions do not reflect amounts reimbursed by the investment adviser or reductions from expense offset arrangements and do not represent the amount paid by the class during periods when reimbursements or reductions occur. Expenses net of fee waivers reflect expenses after reimbursement by the investment adviser but prior to reductions from expense offset arrangements. Expenses net of all reductions represent the net expenses paid by the class but do not include expenses of the underlying funds in which the Fund invests.
G Annualized
See accompanying notes which are an integral part of the financial statements.
Financial Highlights — Fidelity Multi-Manager 2005 Fund Class N
| Six months ended (Unaudited) September 30, | Years ended March 31, | |||
| 2016 | 2016 | 2015 | 2014 A | |
| Selected Per–Share Data | ||||
| Net asset value, beginning of period | $9.96 | $10.56 | $10.63 | $10.51 |
| Income from Investment Operations | ||||
| Net investment income (loss)B | .05 | .14 | .16 | .05 |
| Net realized and unrealized gain (loss) | .41 | (.31) | .31 | .21 |
| Total from investment operations | .46 | (.17) | .47 | .26 |
| Distributions from net investment income | (.02) | (.13) | (.16) | (.06) |
| Distributions from net realized gain | – | (.30) | (.39) | (.09) |
| Total distributions | (.02) | (.43) | (.54)C | (.14)D |
| Net asset value, end of period | $10.40 | $9.96 | $10.56 | $10.63 |
| Total ReturnE,F | 4.65% | (1.64)% | 4.53% | 2.52% |
| Ratios to Average Net AssetsG,H | ||||
| Expenses before reductions | .33%I | .34% | .35% | .33%I |
| Expenses net of fee waivers, if any | .33%I | .34% | .35% | .33%I |
| Expenses net of all reductions | .33%I | .34% | .35% | .33%I |
| Net investment income (loss) | 1.01%I | 1.34% | 1.46% | 1.65%I |
| Supplemental Data | ||||
| Net assets, end of period (000 omitted) | $105 | $105 | $107 | $103 |
| Portfolio turnover rateG | 12%I | 48% | 17% | 44% |
A For the period December 4, 2013 (commencement of sale of shares) to March 31, 2014.
B Calculated based on average shares outstanding during the period.
C Total distributions of $.54 per share is comprised of distributions from net investment income of $.155 and distributions from net realized gain of $.385 per share.
D Total distributions of $.14 per share is comprised of distributions from net investment income of $.055 and distributions from net realized gain of $.088 per share.
E Total returns for periods of less than one year are not annualized.
F Total returns would have been lower if certain expenses had not been reduced during the applicable periods shown.
G Amounts do not include the activity of the Underlying Funds.
H Expense ratios reflect operating expenses of the class. Expenses before reductions do not reflect amounts reimbursed by the investment adviser or reductions from expense offset arrangements and do not represent the amount paid by the class during periods when reimbursements or reductions occur. Expenses net of fee waivers reflect expenses after reimbursement by the investment adviser but prior to reductions from expense offset arrangements. Expenses net of all reductions represent the net expenses paid by the class but do not include expenses of the underlying funds in which the Fund invests.
I Annualized
See accompanying notes which are an integral part of the financial statements.
Fidelity® Multi-Manager 2010 Fund
Investment Summary (Unaudited)
The information in the following tables is based on the direct investments of the Fund.Top Holdings as of September 30, 2016
| % of fund's net assets | % of fund's net assets 6 months ago | |
| Strategic Advisers Core Income Multi-Manager Fund Class F | 29.8 | 31.4 |
| Strategic Advisers International Multi-Manager Fund Class F | 10.2 | 9.6 |
| Fidelity Investments Money Market Government Portfolio Institutional Class 0.31% | 9.4 | 7.8 |
| Strategic Advisers Core Multi-Manager Fund Class F | 9.0 | 9.7 |
| Strategic Advisers Value Multi-Manager Fund Class F | 9.0 | 9.7 |
| Strategic Advisers Growth Multi-Manager Fund Class F | 7.6 | 8.1 |
| Strategic Advisers Emerging Markets Fund of Funds Class F | 6.9 | 6.3 |
| Fidelity Series Short-Term Credit Fund Class F | 5.0 | 4.3 |
| Strategic Advisers Small-Mid Cap Multi-Manager Fund Class F | 4.5 | 4.8 |
| Strategic Advisers Income Opportunities Fund of Funds Class F | 2.8 | 3.0 |
| 94.2 | 94.7 |
Asset Allocation (% of fund's net assets)
| Period end | ||
| Domestic Equity Funds | 31.7% | |
| International Equity Funds | 17.1% | |
| Bond Funds | 36.8% | |
| Short-Term Funds | 14.4% | |

| Six months ago | ||
| Domestic Equity Funds | 33.5% | |
| International Equity Funds | 15.9% | |
| Bond Funds | 38.5% | |
| Short-Term Funds | 12.1% | |

Domestic Equity Funds category includes Fidelity Series Commodity Strategy Fund which invests in commodity-related investments.
Fidelity® Multi-Manager 2010 Fund
Investments September 30, 2016 (Unaudited)
Showing Percentage of Net Assets
| Domestic Equity Funds - 31.7% | |||
| Shares | Value | ||
| Fidelity Series Commodity Strategy Fund Class F (a)(b) | 2,026 | $10,840 | |
| Strategic Advisers Core Multi-Manager Fund Class F (b) | 5,254 | 62,680 | |
| Strategic Advisers Growth Multi-Manager Fund Class F (b) | 4,017 | 52,588 | |
| Strategic Advisers Small-Mid Cap Multi-Manager Fund Class F (b) | 2,921 | 31,609 | |
| Strategic Advisers Value Multi-Manager Fund Class F (b) | 4,598 | 62,627 | |
| TOTAL DOMESTIC EQUITY FUNDS | |||
| (Cost $226,216) | 220,344 | ||
| International Equity Funds - 17.1% | |||
| Strategic Advisers Emerging Markets Fund of Funds Class F (b) | 5,067 | 47,583 | |
| Strategic Advisers International Multi-Manager Fund Class F (b) | 6,150 | 70,851 | |
| TOTAL INTERNATIONAL EQUITY FUNDS | |||
| (Cost $117,138) | 118,434 | ||
| Bond Funds - 36.8% | |||
| Fidelity Series Emerging Markets Debt Fund Class F (b) | 457 | 4,735 | |
| Fidelity Series Floating Rate High Income Fund Class F (b) | 187 | 1,762 | |
| Fidelity Series Inflation-Protected Bond Index Fund Class F (b) | 1,866 | 18,814 | |
| Fidelity Series Real Estate Income Fund Class F (b) | 306 | 3,430 | |
| Strategic Advisers Core Income Multi-Manager Fund Class F (b) | 20,466 | 207,116 | |
| Strategic Advisers Income Opportunities Fund of Funds Class F (b) | 1,970 | 19,502 | |
| TOTAL BOND FUNDS | |||
| (Cost $249,679) | 255,359 | ||
| Short-Term Funds - 14.4% | |||
| Fidelity Investments Money Market Government Portfolio Institutional Class 0.31% (b)(c) | 65,014 | 65,014 | |
| Fidelity Series Short-Term Credit Fund Class F (b) | 3,469 | 34,798 | |
| TOTAL SHORT-TERM FUNDS | |||
| (Cost $99,670) | 99,812 | ||
| TOTAL INVESTMENT PORTFOLIO - 100.0% | |||
| (Cost $692,703) | 693,949 | ||
| NET OTHER ASSETS (LIABILITIES) - 0.0% | (49) | ||
| NET ASSETS - 100% | $693,900 |
Legend
(a) Non-income producing
(b) Affiliated Fund
(c) The rate quoted is the annualized seven-day yield of the fund at period end.
Affiliated Underlying Funds
Information regarding the Fund's fiscal year to date purchases and sales of the affiliated Underlying Funds and income earned by the Fund from investments in affiliated Underlying Funds is as follows:
| Affiliate | Value, beginning of period | Purchases | Sales Proceeds | Dividend Income | Value, end of period |
| Fidelity Investments Money Market Government Portfolio Institutional Class 0.31% | $61,062 | $25,726 | $21,774 | $94 | $65,014 |
| Fidelity Series Commodity Strategy Fund Class F | 9,775 | 4,866 | 4,678 | -- | 10,840 |
| Fidelity Series Emerging Markets Debt Fund Class F | 4,958 | 928 | 1,564 | 135 | 4,735 |
| Fidelity Series Floating Rate High Income Fund Class F | 1,952 | 372 | 651 | 41 | 1,762 |
| Fidelity Series Inflation-Protected Bond Index Fund Class F | 21,280 | 4,406 | 7,242 | 23 | 18,814 |
| Fidelity Series Real Estate Income Fund Class F | 3,787 | 850 | 1,319 | 90 | 3,430 |
| Fidelity Series Short-Term Credit Fund Class F | 33,200 | 13,362 | 11,898 | 184 | 34,798 |
| Strategic Advisers Core Income Multi-Manager Fund Class F | 246,174 | 41,499 | 86,074 | 2,621 | 207,116 |
| Strategic Advisers Core Multi-Manager Fund Class F | 75,753 | 15,525 | 28,854 | 231 | 62,680 |
| Strategic Advisers Emerging Markets Fund of Funds Class F | 49,602 | 9,163 | 15,914 | -- | 47,583 |
| Strategic Advisers Growth Multi-Manager Fund Class F | 63,213 | 13,590 | 24,484 | 174 | 52,588 |
| Strategic Advisers Income Opportunities Fund of Funds Class F | 23,422 | 1,984 | 7,263 | 582 | 19,502 |
| Strategic Advisers International Multi-Manager Fund Class F | 75,106 | 19,607 | 27,430 | -- | 70,851 |
| Strategic Advisers Small-Mid Cap Multi-Manager Fund Class F | 37,941 | 5,793 | 15,143 | -- | 31,609 |
| Strategic Advisers Value Multi-Manager Fund Class F | 75,674 | 14,277 | 28,743 | 489 | 62,627 |
| Total | $782,899 | $171,948 | $283,031 | $4,664 | $693,949 |
Investment Valuation
All investments are categorized as Level 1 under the Fair Value Hierarchy. The inputs or methodology used for valuing securities may not be an indication of the risk associated with investing in those securities. For more information on valuation inputs please refer to the Investment Valuation section in the accompanying Notes to Financial Statements.
See accompanying notes which are an integral part of the financial statements.
Fidelity® Multi-Manager 2010 Fund
Financial Statements
Statement of Assets and Liabilities
| September 30, 2016 (Unaudited) | ||
| Assets | ||
| Investment in securities, at value (cost $692,703) — See accompanying schedule | $693,949 | |
| Receivable for investments sold | 26,635 | |
| Total assets | 720,584 | |
| Liabilities | ||
| Payable for fund shares redeemed | $26,635 | |
| Distribution and service plan fees payable | 22 | |
| Other affiliated payables | 27 | |
| Total liabilities | 26,684 | |
| Net Assets | $693,900 | |
| Net Assets consist of: | ||
| Paid in capital | $703,015 | |
| Undistributed net investment income | 4,223 | |
| Accumulated undistributed net realized gain (loss) on investments | (14,584) | |
| Net unrealized appreciation (depreciation) on investments | 1,246 | |
| Net Assets | $693,900 | |
| Multi-Manager 2010: | ||
| Net Asset Value, offering price and redemption price per share ($481,328 ÷ 45,491 shares) | $10.58 | |
| Class L: | ||
| Net Asset Value, offering price and redemption price per share ($106,663 ÷ 10,077 shares) | $10.58 | |
| Class N: | ||
| Net Asset Value, offering price and redemption price per share ($105,909 ÷ 10,019 shares) | $10.57 |
See accompanying notes which are an integral part of the financial statements.
Statement of Operations
| Six months ended September 30, 2016 (Unaudited) | ||
| Investment Income | ||
| Income distributions from underlying funds | $4,664 | |
| Expenses | ||
| Transfer agent fees | $181 | |
| Distribution and service plan fees | 129 | |
| Independent trustees' fees and expenses | 2 | |
| Total expenses | 312 | |
| Net investment income (loss) | 4,352 | |
| Realized and Unrealized Gain (Loss) | ||
| Realized gain (loss) on sale of underlying fund shares | (16,590) | |
| Capital gain distributions from underlying funds | 8,634 | |
| Total net realized gain (loss) | (7,956) | |
| Change in net unrealized appreciation (depreciation) on underlying funds | 38,719 | |
| Net gain (loss) | 30,763 | |
| Net increase (decrease) in net assets resulting from operations | $35,115 |
See accompanying notes which are an integral part of the financial statements.
Statement of Changes in Net Assets
| Six months ended September 30, 2016 (Unaudited) | Year ended March 31, 2016 | |
| Increase (Decrease) in Net Assets | ||
| Operations | ||
| Net investment income (loss) | $4,352 | $12,003 |
| Net realized gain (loss) | (7,956) | 8,334 |
| Change in net unrealized appreciation (depreciation) | 38,719 | (35,995) |
| Net increase (decrease) in net assets resulting from operations | 35,115 | (15,658) |
| Distributions to shareholders from net investment income | (1,623) | (12,026) |
| Distributions to shareholders from net realized gain | (5,351) | (26,838) |
| Total distributions | (6,974) | (38,864) |
| Share transactions - net increase (decrease) | (117,090) | 70,458 |
| Total increase (decrease) in net assets | (88,949) | 15,936 |
| Net Assets | ||
| Beginning of period | 782,849 | 766,913 |
| End of period | $693,900 | $782,849 |
| Other Information | ||
| Undistributed net investment income end of period | $4,223 | $1,494 |
See accompanying notes which are an integral part of the financial statements.
Financial Highlights — Fidelity Multi-Manager 2010 Fund
| Six months ended (Unaudited) September 30, | Years ended March 31, | ||||
| 2016 | 2016 | 2015 | 2014 | 2013 A | |
| Selected Per–Share Data | |||||
| Net asset value, beginning of period | $10.14 | $10.87 | $10.87 | $10.35 | $10.00 |
| Income from Investment Operations | |||||
| Net investment income (loss)B | .06 | .16 | .19 | .15 | .05 |
| Net realized and unrealized gain (loss) | .47 | (.35) | .37 | .67 | .30 |
| Total from investment operations | .53 | (.19) | .56 | .82 | .35 |
| Distributions from net investment income | (.02) | (.17) | (.17) | (.12) | – |
| Distributions from net realized gain | (.07) | (.37) | (.40) | (.18) | – |
| Total distributions | (.09) | (.54) | (.56)C | (.30) | – |
| Net asset value, end of period | $10.58 | $10.14 | $10.87 | $10.87 | $10.35 |
| Total ReturnD,E | 5.29% | (1.85)% | 5.31% | 8.00% | 3.50% |
| Ratios to Average Net AssetsF,G | |||||
| Expenses before reductions | .05%H | .05% | .05% | .06% | .17%H |
| Expenses net of fee waivers, if any | .05%H | .05% | .05% | .06% | .06%H |
| Expenses net of all reductions | .05%H | .05% | .05% | .06% | .06%H |
| Net investment income (loss) | 1.23%H | 1.58% | 1.73% | 1.45% | 1.87%H |
| Supplemental Data | |||||
| Net assets, end of period (000 omitted) | $481 | $571 | $550 | $277 | $104 |
| Portfolio turnover rateF | 47%H | 32% | 15% | 24% | 1%I |
A For the period December 20, 2012 (commencement of operations) to March 31, 2013.
B Calculated based on average shares outstanding during the period.
C Total distributions of $.56 per share is comprised of distributions from net investment income of $.167 and distributions from net realized gain of $.397 per share.
D Total returns for periods of less than one year are not annualized.
E Total returns would have been lower if certain expenses had not been reduced during the applicable periods shown.
F Amounts do not include the activity of the Underlying Funds.
G Expense ratios reflect operating expenses of the class. Expenses before reductions do not reflect amounts reimbursed by the investment adviser or reductions from expense offset arrangements and do not represent the amount paid by the class during periods when reimbursements or reductions occur. Expense ratios before reductions for start-up periods may not be representative of longer-term operating periods. Expenses net of fee waivers reflect expenses after reimbursement by the investment adviser but prior to reductions from expense offset arrangements. Expenses net of all reductions represent the net expenses paid by the class but do not include expenses of the underlying funds in which the Fund invests.
H Annualized
I Amount not annualized.
See accompanying notes which are an integral part of the financial statements.
Financial Highlights — Fidelity Multi-Manager 2010 Fund Class L
| Six months ended (Unaudited) September 30, | Years ended March 31, | |||
| 2016 | 2016 | 2015 | 2014 A | |
| Selected Per–Share Data | ||||
| Net asset value, beginning of period | $10.15 | $10.88 | $10.87 | $10.73 |
| Income from Investment Operations | ||||
| Net investment income (loss)B | .06 | .16 | .19 | .07 |
| Net realized and unrealized gain (loss) | .46 | (.35) | .38 | .25 |
| Total from investment operations | .52 | (.19) | .57 | .32 |
| Distributions from net investment income | (.02) | (.16) | (.16) | (.07) |
| Distributions from net realized gain | (.07) | (.37) | (.40) | (.11) |
| Total distributions | (.09) | (.54)C | (.56) | (.18) |
| Net asset value, end of period | $10.58 | $10.15 | $10.88 | $10.87 |
| Total ReturnD | 5.29% | (1.86)% | 5.37% | 2.97% |
| Ratios to Average Net AssetsE,F | ||||
| Expenses before reductions | .06%G | .06% | .07% | .07%G |
| Expenses net of fee waivers, if any | .06%G | .06% | .07% | .07%G |
| Expenses net of all reductions | .06%G | .06% | .07% | .07%G |
| Net investment income (loss) | 1.22%G | 1.56% | 1.71% | 1.96%G |
| Supplemental Data | ||||
| Net assets, end of period (000 omitted) | $107 | $106 | $108 | $103 |
| Portfolio turnover rateE | 47%G | 32% | 15% | 24% |
A For the period December 4, 2013 (commencement of sale of shares) to March 31, 2014.
B Calculated based on average shares outstanding during the period.
C Total distributions of $.54 per share is comprised of distributions from net investment income of $.164 and distributions from net realized gain of $.371 per share.
D Total returns for periods of less than one year are not annualized.
E Amounts do not include the activity of the Underlying Funds.
F Expense ratios reflect operating expenses of the class. Expenses before reductions do not reflect amounts reimbursed by the investment adviser or reductions from expense offset arrangements and do not represent the amount paid by the class during periods when reimbursements or reductions occur. Expenses net of fee waivers reflect expenses after reimbursement by the investment adviser but prior to reductions from expense offset arrangements. Expenses net of all reductions represent the net expenses paid by the class but do not include expenses of the underlying funds in which the Fund invests.
G Annualized
See accompanying notes which are an integral part of the financial statements.
Financial Highlights — Fidelity Multi-Manager 2010 Fund Class N
| Six months ended (Unaudited) September 30, | Years ended March 31, | |||
| 2016 | 2016 | 2015 | 2014 A | |
| Selected Per–Share Data | ||||
| Net asset value, beginning of period | $10.14 | $10.87 | $10.87 | $10.73 |
| Income from Investment Operations | ||||
| Net investment income (loss)B | .05 | .14 | .16 | .06 |
| Net realized and unrealized gain (loss) | .47 | (.36) | .37 | .25 |
| Total from investment operations | .52 | (.22) | .53 | .31 |
| Distributions from net investment income | (.02) | (.14) | (.14) | (.07) |
| Distributions from net realized gain | (.07) | (.37) | (.40) | (.11) |
| Total distributions | (.09) | (.51) | (.53)C | (.17)D |
| Net asset value, end of period | $10.57 | $10.14 | $10.87 | $10.87 |
| Total ReturnE | 5.13% | (2.11)% | 5.01% | 2.95% |
| Ratios to Average Net AssetsF,G | ||||
| Expenses before reductions | .31%H | .31% | .32% | .32%H |
| Expenses net of fee waivers, if any | .31%H | .31% | .32% | .32%H |
| Expenses net of all reductions | .31%H | .31% | .32% | .32%H |
| Net investment income (loss) | .97%H | 1.31% | 1.46% | 1.70%H |
| Supplemental Data | ||||
| Net assets, end of period (000 omitted) | $106 | $106 | $108 | $103 |
| Portfolio turnover rateF | 47%H | 32% | 15% | 24% |
A For the period December 4, 2013 (commencement of sale of shares) to March 31, 2014.
B Calculated based on average shares outstanding during the period.
C Total distributions of $.53 per share is comprised of distributions from net investment income of $.136 and distributions from net realized gain of $.397 per share.
D Total distributions of $.17 per share is comprised of distributions from net investment income of $.066 and distributions from net realized gain of $.108 per share.
E Total returns for periods of less than one year are not annualized.
F Amounts do not include the activity of the Underlying Funds.
G Expense ratios reflect operating expenses of the class. Expenses before reductions do not reflect amounts reimbursed by the investment adviser or reductions from expense offset arrangements and do not represent the amount paid by the class during periods when reimbursements or reductions occur. Expenses net of fee waivers reflect expenses after reimbursement by the investment adviser but prior to reductions from expense offset arrangements. Expenses net of all reductions represent the net expenses paid by the class but do not include expenses of the underlying funds in which the Fund invests.
H Annualized
See accompanying notes which are an integral part of the financial statements.
Fidelity® Multi-Manager 2015 Fund
Investment Summary (Unaudited)
The information in the following tables is based on the direct investments of the Fund.Top Holdings as of September 30, 2016
| % of fund's net assets | % of fund's net assets 6 months ago | |
| Strategic Advisers Core Income Multi-Manager Fund Class F | 26.2 | 28.5 |
| Strategic Advisers International Multi-Manager Fund Class F | 12.3 | 11.7 |
| Strategic Advisers Core Multi-Manager Fund Class F | 10.9 | 11.5 |
| Strategic Advisers Value Multi-Manager Fund Class F | 10.9 | 11.5 |
| Strategic Advisers Growth Multi-Manager Fund Class F | 9.1 | 9.6 |
| Strategic Advisers Emerging Markets Fund of Funds Class F | 7.4 | 6.9 |
| Fidelity Investments Money Market Government Portfolio Institutional Class 0.31% | 6.4 | 4.6 |
| Strategic Advisers Small-Mid Cap Multi-Manager Fund Class F | 5.5 | 5.7 |
| Fidelity Series Short-Term Credit Fund Class F | 3.4 | 2.5 |
| Strategic Advisers Income Opportunities Fund of Funds Class F | 3.0 | 3.0 |
| 95.1 | 95.5 |
Asset Allocation (% of fund's net assets)
| Period end | ||
| Domestic Equity Funds | 38.0% | |
| International Equity Funds | 19.7% | |
| Bond Funds | 32.5% | |
| Short-Term Funds | 9.8% | |

| Six months ago | ||
| Domestic Equity Funds | 39.6% | |
| International Equity Funds | 18.6% | |
| Bond Funds | 34.7% | |
| Short-Term Funds | 7.1% | |

Domestic Equity Funds category includes Fidelity Series Commodity Strategy Fund which invests in commodity-related investments.
Fidelity® Multi-Manager 2015 Fund
Investments September 30, 2016 (Unaudited)
Showing Percentage of Net Assets
| Domestic Equity Funds - 38.0% | |||
| Shares | Value | ||
| Fidelity Series Commodity Strategy Fund Class F (a)(b) | 4,644 | $24,844 | |
| Strategic Advisers Core Multi-Manager Fund Class F (b) | 14,465 | 172,572 | |
| Strategic Advisers Growth Multi-Manager Fund Class F (b) | 11,056 | 144,726 | |
| Strategic Advisers Small-Mid Cap Multi-Manager Fund Class F (b) | 8,031 | 86,898 | |
| Strategic Advisers Value Multi-Manager Fund Class F (b) | 12,658 | 172,405 | |
| TOTAL DOMESTIC EQUITY FUNDS | |||
| (Cost $633,540) | 601,445 | ||
| International Equity Funds - 19.7% | |||
| Strategic Advisers Emerging Markets Fund of Funds Class F (b) | 12,487 | 117,257 | |
| Strategic Advisers International Multi-Manager Fund Class F (b) | 16,874 | 194,390 | |
| TOTAL INTERNATIONAL EQUITY FUNDS | |||
| (Cost $321,103) | 311,647 | ||
| Bond Funds - 32.5% | |||
| Fidelity Series Emerging Markets Debt Fund Class F (b) | 1,044 | 10,821 | |
| Fidelity Series Floating Rate High Income Fund Class F (b) | 425 | 4,005 | |
| Fidelity Series Inflation-Protected Bond Index Fund Class F (b) | 2,975 | 29,984 | |
| Fidelity Series Real Estate Income Fund Class F (b) | 701 | 7,863 | |
| Strategic Advisers Core Income Multi-Manager Fund Class F (b) | 40,973 | 414,645 | |
| Strategic Advisers Income Opportunities Fund of Funds Class F (b) | 4,724 | 46,766 | |
| TOTAL BOND FUNDS | |||
| (Cost $503,035) | 514,084 | ||
| Short-Term Funds - 9.8% | |||
| Fidelity Investments Money Market Government Portfolio Institutional Class 0.31% (b)(c) | 100,804 | 100,804 | |
| Fidelity Series Short-Term Credit Fund Class F (b) | 5,369 | 53,851 | |
| TOTAL SHORT-TERM FUNDS | |||
| (Cost $154,474) | 154,655 | ||
| TOTAL INVESTMENT PORTFOLIO - 100.0% | |||
| (Cost $1,612,152) | 1,581,831 | ||
| NET OTHER ASSETS (LIABILITIES) - 0.0% | (125) | ||
| NET ASSETS - 100% | $1,581,706 |
Legend
(a) Non-income producing
(b) Affiliated Fund
(c) The rate quoted is the annualized seven-day yield of the fund at period end.
Affiliated Underlying Funds
Information regarding the Fund's fiscal year to date purchases and sales of the affiliated Underlying Funds and income earned by the Fund from investments in affiliated Underlying Funds is as follows:
| Affiliate | Value, beginning of period | Purchases | Sales Proceeds | Dividend Income | Value, end of period |
| Fidelity Investments Money Market Government Portfolio Institutional Class 0.31% | $79,055 | $35,385 | $13,636 | $132 | $100,804 |
| Fidelity Series Commodity Strategy Fund Class F | 21,585 | 5,394 | 3,710 | -- | 24,844 |
| Fidelity Series Emerging Markets Debt Fund Class F | 10,915 | 562 | 1,559 | 290 | 10,821 |
| Fidelity Series Floating Rate High Income Fund Class F | 4,267 | 201 | 655 | 88 | 4,005 |
| Fidelity Series Inflation-Protected Bond Index Fund Class F | 32,684 | 2,250 | 5,506 | 34 | 29,984 |
| Fidelity Series Real Estate Income Fund Class F | 8,341 | 702 | 1,418 | 194 | 7,863 |
| Fidelity Series Short-Term Credit Fund Class F | 42,482 | 18,525 | 7,343 | 257 | 53,851 |
| Strategic Advisers Core Income Multi-Manager Fund Class F | 487,943 | 18,565 | 102,398 | 4,924 | 414,645 |
| Strategic Advisers Core Multi-Manager Fund Class F | 197,019 | 14,455 | 40,240 | 569 | 172,572 |
| Strategic Advisers Emerging Markets Fund of Funds Class F | 118,496 | 5,521 | 17,794 | -- | 117,257 |
| Strategic Advisers Growth Multi-Manager Fund Class F | 164,402 | 13,596 | 34,394 | 430 | 144,726 |
| Strategic Advisers Income Opportunities Fund of Funds Class F | 50,996 | 2,224 | 9,534 | 1,327 | 46,766 |
| Strategic Advisers International Multi-Manager Fund Class F | 199,533 | 20,369 | 34,892 | -- | 194,390 |
| Strategic Advisers Small-Mid Cap Multi-Manager Fund Class F | 98,673 | 2,583 | 22,298 | -- | 86,898 |
| Strategic Advisers Value Multi-Manager Fund Class F | 196,814 | 11,562 | 40,234 | 1,205 | 172,405 |
| Total | $1,713,205 | $151,894 | $335,611 | $9,450 | $1,581,831 |
Investment Valuation
All investments are categorized as Level 1 under the Fair Value Hierarchy. The inputs or methodology used for valuing securities may not be an indication of the risk associated with investing in those securities. For more information on valuation inputs please refer to the Investment Valuation section in the accompanying Notes to Financial Statements.
See accompanying notes which are an integral part of the financial statements.
Fidelity® Multi-Manager 2015 Fund
Financial Statements
Statement of Assets and Liabilities
| September 30, 2016 (Unaudited) | ||
| Assets | ||
| Investment in securities, at value (cost $1,612,152) — See accompanying schedule | $1,581,831 | |
| Receivable for investments sold | 1,523 | |
| Receivable for fund shares sold | 342 | |
| Total assets | 1,583,696 | |
| Liabilities | ||
| Payable for investments purchased | $1,870 | |
| Distribution and service plan fees payable | 22 | |
| Other affiliated payables | 98 | |
| Total liabilities | 1,990 | |
| Net Assets | $1,581,706 | |
| Net Assets consist of: | ||
| Paid in capital | $1,619,760 | |
| Undistributed net investment income | 8,362 | |
| Accumulated undistributed net realized gain (loss) on investments | (16,095) | |
| Net unrealized appreciation (depreciation) on investments | (30,321) | |
| Net Assets | $1,581,706 | |
| Multi-Manager 2015: | ||
| Net Asset Value, offering price and redemption price per share ($1,367,783 ÷ 126,964 shares) | $10.77 | |
| Class L: | ||
| Net Asset Value, offering price and redemption price per share ($107,339 ÷ 9,959 shares) | $10.78 | |
| Class N: | ||
| Net Asset Value, offering price and redemption price per share ($106,584 ÷ 9,903 shares) | $10.76 |
See accompanying notes which are an integral part of the financial statements.
Statement of Operations
| Six months ended September 30, 2016 (Unaudited) | ||
| Investment Income | ||
| Income distributions from underlying funds | $9,450 | |
| Expenses | ||
| Transfer agent fees | $605 | |
| Distribution and service plan fees | 130 | |
| Independent trustees' fees and expenses | 4 | |
| Total expenses | 739 | |
| Net investment income (loss) | 8,711 | |
| Realized and Unrealized Gain (Loss) | ||
| Realized gain (loss) on sale of underlying fund shares | (24,600) | |
| Capital gain distributions from underlying funds | 21,266 | |
| Total net realized gain (loss) | (3,334) | |
| Change in net unrealized appreciation (depreciation) on underlying funds | 76,941 | |
| Net gain (loss) | 73,607 | |
| Net increase (decrease) in net assets resulting from operations | $82,318 |
See accompanying notes which are an integral part of the financial statements.
Statement of Changes in Net Assets
| Six months ended September 30, 2016 (Unaudited) | Year ended March 31, 2016 | |
| Increase (Decrease) in Net Assets | ||
| Operations | ||
| Net investment income (loss) | $8,711 | $28,236 |
| Net realized gain (loss) | (3,334) | 16,148 |
| Change in net unrealized appreciation (depreciation) | 76,941 | (100,177) |
| Net increase (decrease) in net assets resulting from operations | 82,318 | (55,793) |
| Distributions to shareholders from net investment income | (4,244) | (28,254) |
| Distributions to shareholders from net realized gain | (1,754) | (67,187) |
| Total distributions | (5,998) | (95,441) |
| Share transactions - net increase (decrease) | (207,687) | 53,122 |
| Total increase (decrease) in net assets | (131,367) | (98,112) |
| Net Assets | ||
| Beginning of period | 1,713,073 | 1,811,185 |
| End of period | $1,581,706 | $1,713,073 |
| Other Information | ||
| Undistributed net investment income end of period | $8,362 | $3,895 |
See accompanying notes which are an integral part of the financial statements.
Financial Highlights — Fidelity Multi-Manager 2015 Fund
| Six months ended (Unaudited) September 30, | Years ended March 31, | ||||
| 2016 | 2016 | 2015 | 2014 | 2013 A | |
| Selected Per–Share Data | |||||
| Net asset value, beginning of period | $10.23 | $11.04 | $10.97 | $10.36 | $10.00 |
| Income from Investment Operations | |||||
| Net investment income (loss)B | .06 | .16 | .19 | .15 | .05 |
| Net realized and unrealized gain (loss) | .52 | (.40) | .42 | .74 | .31 |
| Total from investment operations | .58 | (.24) | .61 | .89 | .36 |
| Distributions from net investment income | (.03) | (.17) | (.15) | (.12) | – |
| Distributions from net realized gain | (.01) | (.40) | (.39) | (.16) | – |
| Total distributions | (.04) | (.57) | (.54) | (.28) | – |
| Net asset value, end of period | $10.77 | $10.23 | $11.04 | $10.97 | $10.36 |
| Total ReturnC,D | 5.67% | (2.32)% | 5.70% | 8.68% | 3.60% |
| Ratios to Average Net AssetsE,F | |||||
| Expenses before reductions | .08%G | .08% | .09% | .10% | .21%G |
| Expenses net of fee waivers, if any | .08%G | .08% | .09% | .10% | .09%G |
| Expenses net of all reductions | .08%G | .08% | .09% | .10% | .09%G |
| Net investment income (loss) | 1.14%G | 1.53% | 1.73% | 1.44% | 1.88%G |
| Supplemental Data | |||||
| Net assets, end of period (000 omitted) | $1,368 | $1,500 | $1,593 | $654 | $104 |
| Portfolio turnover rateE | 19%G | 37% | 16% | 38% | 1%H |
A For the period December 20, 2012 (commencement of operations) to March 31, 2013.
B Calculated based on average shares outstanding during the period.
C Total returns for periods of less than one year are not annualized.
D Total returns would have been lower if certain expenses had not been reduced during the applicable periods shown.
E Amounts do not include the activity of the Underlying Funds.
F Expense ratios reflect operating expenses of the class. Expenses before reductions do not reflect amounts reimbursed by the investment adviser or reductions from expense offset arrangements and do not represent the amount paid by the class during periods when reimbursements or reductions occur. Expense ratios before reductions for start-up periods may not be representative of longer-term operating periods. Expenses net of fee waivers reflect expenses after reimbursement by the investment adviser but prior to reductions from expense offset arrangements. Expenses net of all reductions represent the net expenses paid by the class but do not include expenses of the underlying funds in which the Fund invests.
G Annualized
H Amount not annualized.
See accompanying notes which are an integral part of the financial statements.
Financial Highlights — Fidelity Multi-Manager 2015 Fund Class L
| Six months ended (Unaudited) September 30, | Years ended March 31, | |||
| 2016 | 2016 | 2015 | 2014 A | |
| Selected Per–Share Data | ||||
| Net asset value, beginning of period | $10.24 | $11.04 | $10.97 | $10.77 |
| Income from Investment Operations | ||||
| Net investment income (loss)B | .06 | .16 | .19 | .06 |
| Net realized and unrealized gain (loss) | .52 | (.40) | .42 | .30 |
| Total from investment operations | .58 | (.24) | .61 | .36 |
| Distributions from net investment income | (.03) | (.16) | (.15) | (.07) |
| Distributions from net realized gain | (.01) | (.40) | (.39) | (.09) |
| Total distributions | (.04) | (.56) | (.54) | (.16) |
| Net asset value, end of period | $10.78 | $10.24 | $11.04 | $10.97 |
| Total ReturnC,D | 5.67% | (2.24)% | 5.66% | 3.34% |
| Ratios to Average Net AssetsE,F | ||||
| Expenses before reductions | .08%G | .08% | .09% | .10%G |
| Expenses net of fee waivers, if any | .08%G | .08% | .09% | .10%G |
| Expenses net of all reductions | .08%G | .08% | .09% | .10%G |
| Net investment income (loss) | 1.13%G | 1.52% | 1.72% | 1.81%G |
| Supplemental Data | ||||
| Net assets, end of period (000 omitted) | $107 | $107 | $109 | $103 |
| Portfolio turnover rateE | 19%G | 37% | 16% | 38% |
A For the period December 4, 2013 (commencement of sale of shares) to March 31, 2014.
B Calculated based on average shares outstanding during the period.
C Total returns for periods of less than one year are not annualized.
D Total returns would have been lower if certain expenses had not been reduced during the applicable periods shown.
E Amounts do not include the activity of the Underlying Funds.
F Expense ratios reflect operating expenses of the class. Expenses before reductions do not reflect amounts reimbursed by the investment adviser or reductions from expense offset arrangements and do not represent the amount paid by the class during periods when reimbursements or reductions occur. Expenses net of fee waivers reflect expenses after reimbursement by the investment adviser but prior to reductions from expense offset arrangements. Expenses net of all reductions represent the net expenses paid by the class but do not include expenses of the underlying funds in which the Fund invests.
G Annualized
See accompanying notes which are an integral part of the financial statements.
Financial Highlights — Fidelity Multi-Manager 2015 Fund Class N
| Six months ended (Unaudited) September 30, | Years ended March 31, | |||
| 2016 | 2016 | 2015 | 2014 A | |
| Selected Per–Share Data | ||||
| Net asset value, beginning of period | $10.23 | $11.04 | $10.96 | $10.77 |
| Income from Investment Operations | ||||
| Net investment income (loss)B | .05 | .13 | .16 | .05 |
| Net realized and unrealized gain (loss) | .51 | (.40) | .43 | .30 |
| Total from investment operations | .56 | (.27) | .59 | .35 |
| Distributions from net investment income | (.02) | (.14) | (.12) | (.07) |
| Distributions from net realized gain | (.01) | (.40) | (.39) | (.09) |
| Total distributions | (.03) | (.54) | (.51) | (.16) |
| Net asset value, end of period | $10.76 | $10.23 | $11.04 | $10.96 |
| Total ReturnC,D | 5.51% | (2.57)% | 5.51% | 3.22% |
| Ratios to Average Net AssetsE,F | ||||
| Expenses before reductions | .33%G | .33% | .34% | .36%G |
| Expenses net of fee waivers, if any | .33%G | .33% | .34% | .35%G |
| Expenses net of all reductions | .33%G | .33% | .34% | .35%G |
| Net investment income (loss) | .88%G | 1.27% | 1.47% | 1.56%G |
| Supplemental Data | ||||
| Net assets, end of period (000 omitted) | $107 | $106 | $109 | $103 |
| Portfolio turnover rateE | 19%G | 37% | 16% | 38% |
A For the period December 4, 2013 (commencement of sale of shares) to March 31, 2014.
B Calculated based on average shares outstanding during the period.
C Total returns for periods of less than one year are not annualized.
D Total returns would have been lower if certain expenses had not been reduced during the applicable periods shown.
E Amounts do not include the activity of the Underlying Funds.
F Expense ratios reflect operating expenses of the class. Expenses before reductions do not reflect amounts reimbursed by the investment adviser or reductions from expense offset arrangements and do not represent the amount paid by the class during periods when reimbursements or reductions occur. Expenses net of fee waivers reflect expenses after reimbursement by the investment adviser but prior to reductions from expense offset arrangements. Expenses net of all reductions represent the net expenses paid by the class but do not include expenses of the underlying funds in which the Fund invests.
G Annualized
See accompanying notes which are an integral part of the financial statements.
Fidelity® Multi-Manager 2020 Fund
Investment Summary (Unaudited)
The information in the following tables is based on the direct investments of the Fund.Top Holdings as of September 30, 2016
| % of fund's net assets | % of fund's net assets 6 months ago | |
| Strategic Advisers Core Income Multi-Manager Fund Class F | 23.9 | 24.9 |
| Strategic Advisers International Multi-Manager Fund Class F | 13.6 | 13.0 |
| Strategic Advisers Core Multi-Manager Fund Class F | 12.1 | 12.8 |
| Strategic Advisers Value Multi-Manager Fund Class F | 12.1 | 12.8 |
| Strategic Advisers Growth Multi-Manager Fund Class F | 10.2 | 10.6 |
| Strategic Advisers Emerging Markets Fund of Funds Class F | 7.9 | 7.4 |
| Strategic Advisers Small-Mid Cap Multi-Manager Fund Class F | 6.1 | 6.4 |
| Fidelity Investments Money Market Government Portfolio Institutional Class 0.31% | 4.6 | 3.5 |
| Strategic Advisers Income Opportunities Fund of Funds Class F | 2.9 | 3.0 |
| Fidelity Series Short-Term Credit Fund Class F | 2.5 | 1.9 |
| 95.9 | 96.3 |
Asset Allocation (% of fund's net assets)
| Period end | ||
| Domestic Equity Funds | 42.1% | |
| International Equity Funds | 21.5% | |
| Bond Funds | 29.3% | |
| Short-Term Funds | 7.1% | |

| Six months ago | ||
| Domestic Equity Funds | 43.9% | |
| International Equity Funds | 20.4% | |
| Bond Funds | 30.3% | |
| Short-Term Funds | 5.4% | |

Domestic Equity Funds category includes Fidelity Series Commodity Strategy Fund which invests in commodity-related investments.
Fidelity® Multi-Manager 2020 Fund
Investments September 30, 2016 (Unaudited)
Showing Percentage of Net Assets
| Domestic Equity Funds - 42.1% | |||
| Shares | Value | ||
| Fidelity Series Commodity Strategy Fund Class F (a)(b) | 12,245 | $65,509 | |
| Strategic Advisers Core Multi-Manager Fund Class F (b) | 41,227 | 491,837 | |
| Strategic Advisers Growth Multi-Manager Fund Class F (b) | 31,514 | 412,519 | |
| Strategic Advisers Small-Mid Cap Multi-Manager Fund Class F (b) | 22,892 | 247,697 | |
| Strategic Advisers Value Multi-Manager Fund Class F (b) | 36,078 | 491,384 | |
| TOTAL DOMESTIC EQUITY FUNDS | |||
| (Cost $1,789,997) | 1,708,946 | ||
| International Equity Funds - 21.5% | |||
| Strategic Advisers Emerging Markets Fund of Funds Class F (b) | 33,894 | 318,266 | |
| Strategic Advisers International Multi-Manager Fund Class F (b) | 47,990 | 552,846 | |
| TOTAL INTERNATIONAL EQUITY FUNDS | |||
| (Cost $878,468) | 871,112 | ||
| Bond Funds - 29.3% | |||
| Fidelity Series Emerging Markets Debt Fund Class F (b) | 2,674 | 27,699 | |
| Fidelity Series Floating Rate High Income Fund Class F (b) | 1,091 | 10,278 | |
| Fidelity Series Inflation-Protected Bond Index Fund Class F (b) | 4,417 | 44,524 | |
| Fidelity Series Real Estate Income Fund Class F (b) | 1,773 | 19,888 | |
| Strategic Advisers Core Income Multi-Manager Fund Class F (b) | 95,825 | 969,743 | |
| Strategic Advisers Income Opportunities Fund of Funds Class F (b) | 11,864 | 117,457 | |
| TOTAL BOND FUNDS | |||
| (Cost $1,165,980) | 1,189,589 | ||
| Short-Term Funds - 7.1% | |||
| Fidelity Investments Money Market Government Portfolio Institutional Class 0.31% (b)(c) | 189,140 | 189,140 | |
| Fidelity Series Short-Term Credit Fund Class F (b) | 10,073 | 101,028 | |
| TOTAL SHORT-TERM FUNDS | |||
| (Cost $289,819) | 290,168 | ||
| TOTAL INVESTMENT PORTFOLIO - 100.0% | |||
| (Cost $4,124,264) | 4,059,815 | ||
| NET OTHER ASSETS (LIABILITIES) - 0.0% | (290) | ||
| NET ASSETS - 100% | $4,059,525 |
Legend
(a) Non-income producing
(b) Affiliated Fund
(c) The rate quoted is the annualized seven-day yield of the fund at period end.
Affiliated Underlying Funds
Information regarding the Fund's fiscal year to date purchases and sales of the affiliated Underlying Funds and income earned by the Fund from investments in affiliated Underlying Funds is as follows:
| Affiliate | Value, beginning of period | Purchases | Sales Proceeds | Dividend Income | Value, end of period |
| Fidelity Investments Money Market Government Portfolio Institutional Class 0.31% | $156,531 | $75,201 | $42,593 | $236 | $189,140 |
| Fidelity Series Commodity Strategy Fund Class F | 55,937 | 21,694 | 16,337 | -- | 65,509 |
| Fidelity Series Emerging Markets Debt Fund Class F | 28,062 | 3,905 | 6,554 | 739 | 27,699 |
| Fidelity Series Floating Rate High Income Fund Class F | 11,023 | 1,544 | 2,783 | 225 | 10,278 |
| Fidelity Series Inflation-Protected Bond Index Fund Class F | 47,618 | 8,574 | 12,479 | 50 | 44,524 |
| Fidelity Series Real Estate Income Fund Class F | 21,220 | 3,728 | 5,644 | 487 | 19,888 |
| Fidelity Series Short-Term Credit Fund Class F | 84,084 | 39,513 | 22,886 | 458 | 101,028 |
| Strategic Advisers Core Income Multi-Manager Fund Class F | 1,097,033 | 144,499 | 295,924 | 11,363 | 969,743 |
| Strategic Advisers Core Multi-Manager Fund Class F | 563,341 | 89,171 | 164,185 | 1,544 | 491,837 |
| Strategic Advisers Emerging Markets Fund of Funds Class F | 324,060 | 46,040 | 80,089 | -- | 318,266 |
| Strategic Advisers Growth Multi-Manager Fund Class F | 470,079 | 79,752 | 140,130 | 1,164 | 412,519 |
| Strategic Advisers Income Opportunities Fund of Funds Class F | 131,580 | 12,601 | 34,461 | 3,352 | 117,457 |
| Strategic Advisers International Multi-Manager Fund Class F | 573,764 | 109,243 | 156,057 | -- | 552,846 |
| Strategic Advisers Small-Mid Cap Multi-Manager Fund Class F | 282,137 | 32,023 | 88,020 | -- | 247,697 |
| Strategic Advisers Value Multi-Manager Fund Class F | 562,756 | 81,320 | 164,253 | 3,269 | 491,384 |
| Total | $4,409,225 | $748,808 | $1,232,395 | $22,887 | $4,059,815 |
Investment Valuation
All investments are categorized as Level 1 under the Fair Value Hierarchy. The inputs or methodology used for valuing securities may not be an indication of the risk associated with investing in those securities. For more information on valuation inputs please refer to the Investment Valuation section in the accompanying Notes to Financial Statements.
See accompanying notes which are an integral part of the financial statements.
Fidelity® Multi-Manager 2020 Fund
Financial Statements
Statement of Assets and Liabilities
| September 30, 2016 (Unaudited) | ||
| Assets | ||
| Investment in securities, at value (cost $4,124,264) — See accompanying schedule | $4,059,815 | |
| Receivable for investments sold | 7,118 | |
| Receivable for fund shares sold | 3,177 | |
| Total assets | 4,070,110 | |
| Liabilities | ||
| Payable for investments purchased | $4,512 | |
| Payable for fund shares redeemed | 5,788 | |
| Distribution and service plan fees payable | 22 | |
| Other affiliated payables | 263 | |
| Total liabilities | 10,585 | |
| Net Assets | $4,059,525 | |
| Net Assets consist of: | ||
| Paid in capital | $4,171,558 | |
| Undistributed net investment income | 20,454 | |
| Accumulated undistributed net realized gain (loss) on investments | (68,038) | |
| Net unrealized appreciation (depreciation) on investments | (64,449) | |
| Net Assets | $4,059,525 | |
| Multi-Manager 2020: | ||
| Net Asset Value, offering price and redemption price per share ($3,844,662 ÷ 357,086 shares) | $10.77 | |
| Class L: | ||
| Net Asset Value, offering price and redemption price per share ($107,812 ÷ 10,014 shares) | $10.77 | |
| Class N: | ||
| Net Asset Value, offering price and redemption price per share ($107,051 ÷ 9,958 shares) | $10.75 |
See accompanying notes which are an integral part of the financial statements.
Statement of Operations
| Six months ended September 30, 2016 (Unaudited) | ||
| Investment Income | ||
| Income distributions from underlying funds | $22,887 | |
| Expenses | ||
| Transfer agent fees | $1,566 | |
| Distribution and service plan fees | 130 | |
| Independent trustees' fees and expenses | 9 | |
| Total expenses | 1,705 | |
| Net investment income (loss) | 21,182 | |
| Realized and Unrealized Gain (Loss) | ||
| Realized gain (loss) on sale of underlying fund shares | (88,109) | |
| Capital gain distributions from underlying funds | 57,692 | |
| Total net realized gain (loss) | (30,417) | |
| Change in net unrealized appreciation (depreciation) on underlying funds | 222,285 | |
| Net gain (loss) | 191,868 | |
| Net increase (decrease) in net assets resulting from operations | $213,050 |
See accompanying notes which are an integral part of the financial statements.
Statement of Changes in Net Assets
| Six months ended September 30, 2016 (Unaudited) | Year ended March 31, 2016 | |
| Increase (Decrease) in Net Assets | ||
| Operations | ||
| Net investment income (loss) | $21,182 | $62,846 |
| Net realized gain (loss) | (30,417) | 87,058 |
| Change in net unrealized appreciation (depreciation) | 222,285 | (271,767) |
| Net increase (decrease) in net assets resulting from operations | 213,050 | (121,863) |
| Distributions to shareholders from net investment income | (8,782) | (60,710) |
| Distributions to shareholders from net realized gain | (36,629) | (163,441) |
| Total distributions | (45,411) | (224,151) |
| Share transactions - net increase (decrease) | (517,044) | 1,358,231 |
| Total increase (decrease) in net assets | (349,405) | 1,012,217 |
| Net Assets | ||
| Beginning of period | 4,408,930 | 3,396,713 |
| End of period | $4,059,525 | $4,408,930 |
| Other Information | ||
| Undistributed net investment income end of period | $20,454 | $8,054 |
See accompanying notes which are an integral part of the financial statements.
Financial Highlights — Fidelity Multi-Manager 2020 Fund
| Six months ended (Unaudited) September 30, | Years ended March 31, | ||||
| 2016 | 2016 | 2015 | 2014 | 2013 A | |
| Selected Per–Share Data | |||||
| Net asset value, beginning of period | $10.27 | $11.15 | $11.12 | $10.40 | $10.00 |
| Income from Investment Operations | |||||
| Net investment income (loss)B | .06 | .16 | .19 | .15 | .06 |
| Net realized and unrealized gain (loss) | .55 | (.43) | .45 | .83 | .34 |
| Total from investment operations | .61 | (.27) | .64 | .98 | .40 |
| Distributions from net investment income | (.02) | (.15) | (.16) | (.12) | – |
| Distributions from net realized gain | (.09) | (.46) | (.45) | (.14) | – |
| Total distributions | (.11) | (.61) | (.61) | (.26) | – |
| Net asset value, end of period | $10.77 | $10.27 | $11.15 | $11.12 | $10.40 |
| Total ReturnC,D | 5.98% | (2.56)% | 5.91% | 9.50% | 4.00% |
| Ratios to Average Net AssetsE,F | |||||
| Expenses before reductions | .08%G | .08% | .08% | .10% | .21%G |
| Expenses net of fee waivers, if any | .08%G | .08% | .08% | .10% | .09%G |
| Expenses net of all reductions | .08%G | .08% | .08% | .10% | .09%G |
| Net investment income (loss) | 1.07%G | 1.51% | 1.71% | 1.41% | 1.97%G |
| Supplemental Data | |||||
| Net assets, end of period (000 omitted) | $3,845 | $4,196 | $3,178 | $1,527 | $104 |
| Portfolio turnover rateE | 37%G | 29% | 19% | 51% | 1%H |
A For the period December 20, 2012 (commencement of operations) to March 31, 2013.
B Calculated based on average shares outstanding during the period.
C Total returns for periods of less than one year are not annualized.
D Total returns would have been lower if certain expenses had not been reduced during the applicable periods shown.
E Amounts do not include the activity of the Underlying Funds.
F Expense ratios reflect operating expenses of the class. Expenses before reductions do not reflect amounts reimbursed by the investment adviser or reductions from expense offset arrangements and do not represent the amount paid by the class during periods when reimbursements or reductions occur. Expense ratios before reductions for start-up periods may not be representative of longer-term operating periods. Expenses net of fee waivers reflect expenses after reimbursement by the investment adviser but prior to reductions from expense offset arrangements. Expenses net of all reductions represent the net expenses paid by the class but do not include expenses of the underlying funds in which the Fund invests.
G Annualized
H Amount not annualized.
See accompanying notes which are an integral part of the financial statements.
Financial Highlights — Fidelity Multi-Manager 2020 Fund Class L
| Six months ended (Unaudited) September 30, | Years ended March 31, | |||
| 2016 | 2016 | 2015 | 2014 A | |
| Selected Per–Share Data | ||||
| Net asset value, beginning of period | $10.27 | $11.15 | $11.11 | $10.89 |
| Income from Investment Operations | ||||
| Net investment income (loss)B | .06 | .16 | .19 | .06 |
| Net realized and unrealized gain (loss) | .55 | (.43) | .46 | .32 |
| Total from investment operations | .61 | (.27) | .65 | .38 |
| Distributions from net investment income | (.02) | (.15) | (.16) | (.08) |
| Distributions from net realized gain | (.09) | (.46) | (.45) | (.09) |
| Total distributions | (.11) | (.61) | (.61) | (.16)C |
| Net asset value, end of period | $10.77 | $10.27 | $11.15 | $11.11 |
| Total ReturnD | 5.98% | (2.58)% | 5.98% | 3.55% |
| Ratios to Average Net AssetsE,F | ||||
| Expenses before reductions | .08%G | .08% | .09% | .09%G |
| Expenses net of fee waivers, if any | .08%G | .08% | .09% | .09%G |
| Expenses net of all reductions | .08%G | .08% | .09% | .09%G |
| Net investment income (loss) | 1.08%G | 1.51% | 1.71% | 1.75%G |
| Supplemental Data | ||||
| Net assets, end of period (000 omitted) | $108 | $107 | $110 | $104 |
| Portfolio turnover rateE | 37%G | 29% | 19% | 51% |
A For the period December 4, 2013 (commencement of sale of shares) to March 31, 2014.
B Calculated based on average shares outstanding during the period.
C Total distributions of $.16 per share is comprised of distributions from net investment income of $.077 and distributions from net realized gain of $.087 per share.
D Total returns for periods of less than one year are not annualized.
E Amounts do not include the activity of the Underlying Funds.
F Expense ratios reflect operating expenses of the class. Expenses before reductions do not reflect amounts reimbursed by the investment adviser or reductions from expense offset arrangements and do not represent the amount paid by the class during periods when reimbursements or reductions occur. Expenses net of fee waivers reflect expenses after reimbursement by the investment adviser but prior to reductions from expense offset arrangements. Expenses net of all reductions represent the net expenses paid by the class but do not include expenses of the underlying funds in which the Fund invests.
G Annualized
See accompanying notes which are an integral part of the financial statements.
Financial Highlights — Fidelity Multi-Manager 2020 Fund Class N
| Six months ended (Unaudited) September 30, | Years ended March 31, | |||
| 2016 | 2016 | 2015 | 2014 A | |
| Selected Per–Share Data | ||||
| Net asset value, beginning of period | $10.26 | $11.14 | $11.11 | $10.89 |
| Income from Investment Operations | ||||
| Net investment income (loss)B | .04 | .13 | .16 | .05 |
| Net realized and unrealized gain (loss) | .55 | (.43) | .45 | .33 |
| Total from investment operations | .59 | (.30) | .61 | .38 |
| Distributions from net investment income | (.02) | (.12) | (.13) | (.08) |
| Distributions from net realized gain | (.09) | (.46) | (.45) | (.09) |
| Total distributions | (.10)C | (.58) | (.58) | (.16)D |
| Net asset value, end of period | $10.75 | $10.26 | $11.14 | $11.11 |
| Total ReturnE | 5.83% | (2.82)% | 5.63% | 3.53% |
| Ratios to Average Net AssetsF,G | ||||
| Expenses before reductions | .33%H | .33% | .34% | .35%H |
| Expenses net of fee waivers, if any | .33%H | .33% | .34% | .35%H |
| Expenses net of all reductions | .33%H | .33% | .34% | .35%H |
| Net investment income (loss) | .83%H | 1.26% | 1.46% | 1.50%H |
| Supplemental Data | ||||
| Net assets, end of period (000 omitted) | $107 | $106 | $109 | $103 |
| Portfolio turnover rateF | 37%H | 29% | 19% | 51% |
A For the period December 4, 2013 (commencement of sale of shares) to March 31, 2014.
B Calculated based on average shares outstanding during the period.
C Total distributions of $.10 per share is comprised of distributions from net investment income of $.015 and distributions from net realized gain of $.087 per share.
D Total distributions of $.16 per share is comprised of distributions from net investment income of $.075 and distributions from net realized gain of $.087 per share.
E Total returns for periods of less than one year are not annualized.
F Amounts do not include the activity of the Underlying Funds.
G Expense ratios reflect operating expenses of the class. Expenses before reductions do not reflect amounts reimbursed by the investment adviser or reductions from expense offset arrangements and do not represent the amount paid by the class during periods when reimbursements or reductions occur. Expenses net of fee waivers reflect expenses after reimbursement by the investment adviser but prior to reductions from expense offset arrangements. Expenses net of all reductions represent the net expenses paid by the class but do not include expenses of the underlying funds in which the Fund invests.
H Annualized
See accompanying notes which are an integral part of the financial statements.
Fidelity® Multi-Manager 2025 Fund
Investment Summary (Unaudited)
The information in the following tables is based on the direct investments of the Fund.Top Holdings as of September 30, 2016
| % of fund's net assets | % of fund's net assets 6 months ago | |
| Strategic Advisers Core Income Multi-Manager Fund Class F | 20.4 | 19.9 |
| Strategic Advisers International Multi-Manager Fund Class F | 15.0 | 14.6 |
| Strategic Advisers Core Multi-Manager Fund Class F | 13.4 | 14.2 |
| Strategic Advisers Value Multi-Manager Fund Class F | 13.4 | 14.2 |
| Strategic Advisers Growth Multi-Manager Fund Class F | 11.3 | 11.8 |
| Strategic Advisers Emerging Markets Fund of Funds Class F | 8.3 | 7.8 |
| Strategic Advisers Small-Mid Cap Multi-Manager Fund Class F | 6.7 | 7.1 |
| Fidelity Investments Money Market Government Portfolio Institutional Class 0.31% | 3.3 | 2.7 |
| Strategic Advisers Income Opportunities Fund of Funds Class F | 2.7 | 3.0 |
| Fidelity Series Commodity Strategy Fund Class F | 1.8 | 1.3 |
| 96.3 | 96.6 |
Asset Allocation (% of fund's net assets)
| Period end | ||
| Domestic Equity Funds | 46.6% | |
| International Equity Funds | 23.3% | |
| Bond Funds | 25.1% | |
| Short-Term Funds | 5.0% | |

| Six months ago | ||
| Domestic Equity Funds | 48.6% | |
| International Equity Funds | 22.4% | |
| Bond Funds | 24.8% | |
| Short-Term Funds | 4.2% | |

Domestic Equity Funds category includes Fidelity Series Commodity Strategy Fund which invests in commodity-related investments.
Fidelity® Multi-Manager 2025 Fund
Investments September 30, 2016 (Unaudited)
Showing Percentage of Net Assets
| Domestic Equity Funds - 46.6% | |||
| Shares | Value | ||
| Fidelity Series Commodity Strategy Fund Class F (a)(b) | 7,092 | $37,945 | |
| Strategic Advisers Core Multi-Manager Fund Class F (b) | 23,907 | 285,209 | |
| Strategic Advisers Growth Multi-Manager Fund Class F (b) | 18,265 | 239,093 | |
| Strategic Advisers Small-Mid Cap Multi-Manager Fund Class F (b) | 13,254 | 143,411 | |
| Strategic Advisers Value Multi-Manager Fund Class F (b) | 20,923 | 284,967 | |
| TOTAL DOMESTIC EQUITY FUNDS | |||
| (Cost $999,235) | 990,625 | ||
| International Equity Funds - 23.3% | |||
| Strategic Advisers Emerging Markets Fund of Funds Class F (b) | 18,804 | 176,571 | |
| Strategic Advisers International Multi-Manager Fund Class F (b) | 27,604 | 317,993 | |
| TOTAL INTERNATIONAL EQUITY FUNDS | |||
| (Cost $484,060) | 494,564 | ||
| Bond Funds - 25.1% | |||
| Fidelity Series Emerging Markets Debt Fund Class F (b) | 1,346 | 13,942 | |
| Fidelity Series Floating Rate High Income Fund Class F (b) | 570 | 5,372 | |
| Fidelity Series Inflation-Protected Bond Index Fund Class F (b) | 1,246 | 12,564 | |
| Fidelity Series Real Estate Income Fund Class F (b) | 923 | 10,357 | |
| Strategic Advisers Core Income Multi-Manager Fund Class F (b) | 42,857 | 433,713 | |
| Strategic Advisers Income Opportunities Fund of Funds Class F (b) | 5,779 | 57,217 | |
| TOTAL BOND FUNDS | |||
| (Cost $523,400) | 533,165 | ||
| Short-Term Funds - 5.0% | |||
| Fidelity Investments Money Market Government Portfolio Institutional Class 0.31% (b)(c) | 68,963 | 68,963 | |
| Fidelity Series Short-Term Credit Fund Class F (b) | 3,675 | 36,863 | |
| TOTAL SHORT-TERM FUNDS | |||
| (Cost $105,682) | 105,826 | ||
| TOTAL INVESTMENT PORTFOLIO - 100.0% | |||
| (Cost $2,112,377) | 2,124,180 | ||
| NET OTHER ASSETS (LIABILITIES) - 0.0% | (183) | ||
| NET ASSETS - 100% | $2,123,997 |
Legend
(a) Non-income producing
(b) Affiliated Fund
(c) The rate quoted is the annualized seven-day yield of the fund at period end.
Affiliated Underlying Funds
Information regarding the Fund's fiscal year to date purchases and sales of the affiliated Underlying Funds and income earned by the Fund from investments in affiliated Underlying Funds is as follows:
| Affiliate | Value, beginning of period | Purchases | Sales Proceeds | Dividend Income | Value, end of period |
| Fidelity Investments Money Market Government Portfolio Institutional Class 0.31% | $52,133 | $28,548 | $11,719 | $84 | $68,963 |
| Fidelity Series Commodity Strategy Fund Class F | 24,392 | 17,253 | 5,530 | -- | 37,945 |
| Fidelity Series Emerging Markets Debt Fund Class F | 11,879 | 3,314 | 2,344 | 345 | 13,942 |
| Fidelity Series Floating Rate High Income Fund Class F | 4,720 | 1,399 | 977 | 108 | 5,372 |
| Fidelity Series Inflation-Protected Bond Index Fund Class F | 9,701 | 4,755 | 2,090 | 12 | 12,564 |
| Fidelity Series Real Estate Income Fund Class F | 9,219 | 2,930 | 2,081 | 239 | 10,357 |
| Fidelity Series Short-Term Credit Fund Class F | 28,055 | 15,008 | 6,304 | 163 | 36,863 |
| Strategic Advisers Core Income Multi-Manager Fund Class F | 377,754 | 129,984 | 83,583 | 4,490 | 433,713 |
| Strategic Advisers Core Multi-Manager Fund Class F | 268,916 | 79,191 | 66,506 | 880 | 285,209 |
| Strategic Advisers Emerging Markets Fund of Funds Class F | 148,282 | 40,542 | 29,429 | -- | 176,571 |
| Strategic Advisers Growth Multi-Manager Fund Class F | 224,397 | 69,016 | 57,726 | 664 | 239,093 |
| Strategic Advisers Income Opportunities Fund of Funds Class F | 56,162 | 8,620 | 11,445 | 1,600 | 57,217 |
| Strategic Advisers International Multi-Manager Fund Class F | 276,773 | 85,204 | 60,235 | -- | 317,993 |
| Strategic Advisers Small-Mid Cap Multi-Manager Fund Class F | 134,681 | 32,606 | 37,479 | -- | 143,411 |
| Strategic Advisers Value Multi-Manager Fund Class F | 268,637 | 74,762 | 66,823 | 1,865 | 284,967 |
| Total | $1,895,701 | $593,132 | $444,271 | $10,450 | $2,124,180 |
Investment Valuation
All investments are categorized as Level 1 under the Fair Value Hierarchy. The inputs or methodology used for valuing securities may not be an indication of the risk associated with investing in those securities. For more information on valuation inputs please refer to the Investment Valuation section in the accompanying Notes to Financial Statements.
See accompanying notes which are an integral part of the financial statements.
Fidelity® Multi-Manager 2025 Fund
Financial Statements
Statement of Assets and Liabilities
| September 30, 2016 (Unaudited) | ||
| Assets | ||
| Investment in securities, at value (cost $2,112,377) — See accompanying schedule | $2,124,180 | |
| Receivable for fund shares sold | 174,084 | |
| Receivable from investment adviser for expense reductions | 13 | |
| Total assets | 2,298,277 | |
| Liabilities | ||
| Payable for investments purchased | $174,089 | |
| Distribution and service plan fees payable | 22 | |
| Other affiliated payables | 169 | |
| Total liabilities | 174,280 | |
| Net Assets | $2,123,997 | |
| Net Assets consist of: | ||
| Paid in capital | $2,109,893 | |
| Undistributed net investment income | 9,048 | |
| Accumulated undistributed net realized gain (loss) on investments | (6,747) | |
| Net unrealized appreciation (depreciation) on investments | 11,803 | |
| Net Assets | $2,123,997 | |
| Multi-Manager 2025: | ||
| Net Asset Value, offering price and redemption price per share ($1,907,871 ÷ 174,175 shares) | $10.95 | |
| Class L: | ||
| Net Asset Value, offering price and redemption price per share ($108,445 ÷ 9,889 shares) | $10.97 | |
| Class N: | ||
| Net Asset Value, offering price and redemption price per share ($107,681 ÷ 9,833 shares) | $10.95 |
See accompanying notes which are an integral part of the financial statements.
Statement of Operations
| Six months ended September 30, 2016 (Unaudited) | ||
| Investment Income | ||
| Income distributions from underlying funds | $10,450 | |
| Expenses | ||
| Transfer agent fees | $1,005 | |
| Distribution and service plan fees | 131 | |
| Independent trustees' fees and expenses | 4 | |
| Total expenses before reductions | 1,140 | |
| Expense reductions | (73) | 1,067 |
| Net investment income (loss) | 9,383 | |
| Realized and Unrealized Gain (Loss) | ||
| Realized gain (loss) on sale of underlying fund shares | (29,158) | |
| Capital gain distributions from underlying funds | 32,882 | |
| Total net realized gain (loss) | 3,724 | |
| Change in net unrealized appreciation (depreciation) on underlying funds | 108,777 | |
| Net gain (loss) | 112,501 | |
| Net increase (decrease) in net assets resulting from operations | $121,884 |
See accompanying notes which are an integral part of the financial statements.
Statement of Changes in Net Assets
| Six months ended September 30, 2016 (Unaudited) | Year ended March 31, 2016 | |
| Increase (Decrease) in Net Assets | ||
| Operations | ||
| Net investment income (loss) | $9,383 | $21,004 |
| Net realized gain (loss) | 3,724 | 36,619 |
| Change in net unrealized appreciation (depreciation) | 108,777 | (102,762) |
| Net increase (decrease) in net assets resulting from operations | 121,884 | (45,139) |
| Distributions to shareholders from net investment income | (3,057) | (19,664) |
| Distributions to shareholders from net realized gain | (16,961) | (64,890) |
| Total distributions | (20,018) | (84,554) |
| Share transactions - net increase (decrease) | 126,603 | 870,589 |
| Total increase (decrease) in net assets | 228,469 | 740,896 |
| Net Assets | ||
| Beginning of period | 1,895,528 | 1,154,632 |
| End of period | $2,123,997 | $1,895,528 |
| Other Information | ||
| Undistributed net investment income end of period | $9,048 | $2,722 |
See accompanying notes which are an integral part of the financial statements.
Financial Highlights — Fidelity Multi-Manager 2025 Fund
| Six months ended (Unaudited) September 30, | Years ended March 31, | ||||
| 2016 | 2016 | 2015 | 2014 | 2013 A | |
| Selected Per–Share Data | |||||
| Net asset value, beginning of period | $10.43 | $11.40 | $11.37 | $10.48 | $10.00 |
| Income from Investment Operations | |||||
| Net investment income (loss)B | .05 | .15 | .19 | .16 | .06 |
| Net realized and unrealized gain (loss) | .59 | (.48) | .51 | 1.06 | .42 |
| Total from investment operations | .64 | (.33) | .70 | 1.22 | .48 |
| Distributions from net investment income | (.02) | (.13) | (.15) | (.15) | – |
| Distributions from net realized gain | (.10) | (.51) | (.52) | (.18) | – |
| Total distributions | (.12) | (.64) | (.67) | (.33) | – |
| Net asset value, end of period | $10.95 | $10.43 | $11.40 | $11.37 | $10.48 |
| Total ReturnC,D | 6.17% | (3.05)% | 6.37% | 11.77% | 4.80% |
| Ratios to Average Net AssetsE,F | |||||
| Expenses before reductions | .11%G | .11% | .12% | .12% | .21%G |
| Expenses net of fee waivers, if any | .10%G | .10% | .10% | .10% | .09%G |
| Expenses net of all reductions | .10%G | .10% | .10% | .10% | .09%G |
| Net investment income (loss) | 1.00%G | 1.37% | 1.67% | 1.49% | 2.08%G |
| Supplemental Data | |||||
| Net assets, end of period (000 omitted) | $1,908 | $1,682 | $934 | $347 | $105 |
| Portfolio turnover rateE | 45%G | 17% | 21% | 88% | 1%H |
A For the period December 20, 2012 (commencement of operations) to March 31, 2013.
B Calculated based on average shares outstanding during the period.
C Total returns for periods of less than one year are not annualized.
D Total returns would have been lower if certain expenses had not been reduced during the applicable periods shown.
E Amounts do not include the activity of the Underlying Funds.
F Expense ratios reflect operating expenses of the class. Expenses before reductions do not reflect amounts reimbursed by the investment adviser or reductions from expense offset arrangements and do not represent the amount paid by the class during periods when reimbursements or reductions occur. Expense ratios before reductions for start-up periods may not be representative of longer-term operating periods. Expenses net of fee waivers reflect expenses after reimbursement by the investment adviser but prior to reductions from expense offset arrangements. Expenses net of all reductions represent the net expenses paid by the class but do not include expenses of the underlying funds in which the Fund invests.
G Annualized
H Amount not annualized.
See accompanying notes which are an integral part of the financial statements.
Financial Highlights — Fidelity Multi-Manager 2025 Fund Class L
| Six months ended (Unaudited) September 30, | Years ended March 31, | |||
| 2016 | 2016 | 2015 | 2014 A | |
| Selected Per–Share Data | ||||
| Net asset value, beginning of period | $10.44 | $11.41 | $11.37 | $11.14 |
| Income from Investment Operations | ||||
| Net investment income (loss)B | .05 | .15 | .19 | .08 |
| Net realized and unrealized gain (loss) | .60 | (.48) | .52 | .36 |
| Total from investment operations | .65 | (.33) | .71 | .44 |
| Distributions from net investment income | (.02) | (.13) | (.15) | (.09) |
| Distributions from net realized gain | (.10) | (.51) | (.52) | (.12) |
| Total distributions | (.12) | (.64) | (.67) | (.21) |
| Net asset value, end of period | $10.97 | $10.44 | $11.41 | $11.37 |
| Total ReturnC,D | 6.26% | (3.05)% | 6.41% | 3.96% |
| Ratios to Average Net AssetsE,F | ||||
| Expenses before reductions | .08%G | .09% | .11% | .11%G |
| Expenses net of fee waivers, if any | .08%G | .09% | .10% | .10%G |
| Expenses net of all reductions | .08%G | .09% | .10% | .10%G |
| Net investment income (loss) | 1.01%G | 1.38% | 1.67% | 2.19%G |
| Supplemental Data | ||||
| Net assets, end of period (000 omitted) | $108 | $107 | $111 | $104 |
| Portfolio turnover rateE | 45%G | 17% | 21% | 88% |
A For the period December 4, 2013 (commencement of sale of shares) to March 31, 2014.
B Calculated based on average shares outstanding during the period.
C Total returns for periods of less than one year are not annualized.
D Total returns would have been lower if certain expenses had not been reduced during the applicable periods shown.
E Amounts do not include the activity of the Underlying Funds.
F Expense ratios reflect operating expenses of the class. Expenses before reductions do not reflect amounts reimbursed by the investment adviser or reductions from expense offset arrangements and do not represent the amount paid by the class during periods when reimbursements or reductions occur. Expenses net of fee waivers reflect expenses after reimbursement by the investment adviser but prior to reductions from expense offset arrangements. Expenses net of all reductions represent the net expenses paid by the class but do not include expenses of the underlying funds in which the Fund invests.
G Annualized
See accompanying notes which are an integral part of the financial statements.
Financial Highlights — Fidelity Multi-Manager 2025 Fund Class N
| Six months ended (Unaudited) September 30, | Years ended March 31, | |||
| 2016 | 2016 | 2015 | 2014 A | |
| Selected Per–Share Data | ||||
| Net asset value, beginning of period | $10.43 | $11.40 | $11.37 | $11.14 |
| Income from Investment Operations | ||||
| Net investment income (loss)B | .04 | .12�� | .16 | .07 |
| Net realized and unrealized gain (loss) | .59 | (.48) | .51 | .37 |
| Total from investment operations | .63 | (.36) | .67 | .44 |
| Distributions from net investment income | (.01) | (.10) | (.12) | (.09) |
| Distributions from net realized gain | (.10) | (.51) | (.52) | (.12) |
| Total distributions | (.11) | (.61) | (.64) | (.21) |
| Net asset value, end of period | $10.95 | $10.43 | $11.40 | $11.37 |
| Total ReturnC,D | 6.11% | (3.31)% | 6.07% | 3.94% |
| Ratios to Average Net AssetsE,F | ||||
| Expenses before reductions | .33%G | .34% | .36% | .37%G |
| Expenses net of fee waivers, if any | .33%G | .34% | .35% | .35%G |
| Expenses net of all reductions | .33%G | .34% | .35% | .35%G |
| Net investment income (loss) | .76%G | 1.13% | 1.42% | 1.94%G |
| Supplemental Data | ||||
| Net assets, end of period (000 omitted) | $108 | $107 | $110 | $104 |
| Portfolio turnover rateE | 45%G | 17% | 21% | 88% |
A For the period December 4, 2013 (commencement of sale of shares) to March 31, 2014.
B Calculated based on average shares outstanding during the period.
C Total returns for periods of less than one year are not annualized.
D Total returns would have been lower if certain expenses had not been reduced during the applicable periods shown.
E Amounts do not include the activity of the Underlying Funds.
F Expense ratios reflect operating expenses of the class. Expenses before reductions do not reflect amounts reimbursed by the investment adviser or reductions from expense offset arrangements and do not represent the amount paid by the class during periods when reimbursements or reductions occur. Expenses net of fee waivers reflect expenses after reimbursement by the investment adviser but prior to reductions from expense offset arrangements. Expenses net of all reductions represent the net expenses paid by the class but do not include expenses of the underlying funds in which the Fund invests.
G Annualized
See accompanying notes which are an integral part of the financial statements.
Fidelity® Multi-Manager 2030 Fund
Investment Summary (Unaudited)
The information in the following tables is based on the direct investments of the Fund.Top Holdings as of September 30, 2016
| % of fund's net assets | % of fund's net assets 6 months ago | |
| Strategic Advisers International Multi-Manager Fund Class F | 18.3 | 18.0 |
| Strategic Advisers Core Multi-Manager Fund Class F | 16.6 | 17.2 |
| Strategic Advisers Value Multi-Manager Fund Class F | 16.5 | 17.2 |
| Strategic Advisers Growth Multi-Manager Fund Class F | 13.9 | 14.4 |
| Strategic Advisers Core Income Multi-Manager Fund Class F | 10.6 | 9.6 |
| Strategic Advisers Emerging Markets Fund of Funds Class F | 9.4 | 8.8 |
| Strategic Advisers Small-Mid Cap Multi-Manager Fund Class F | 8.3 | 8.6 |
| Strategic Advisers Income Opportunities Fund of Funds Class F | 2.8 | 3.0 |
| Fidelity Series Commodity Strategy Fund Class F | 1.6 | 1.3 |
| Fidelity Series Emerging Markets Debt Fund Class F | 0.7 | 0.6 |
| 98.7 | 98.7 |
Asset Allocation (% of fund's net assets)
| Period end | ||
| Domestic Equity Funds | 56.9% | |
| International Equity Funds | 27.7% | |
| Bond Funds | 15.4% | |

| Six months ago | ||
| Domestic Equity Funds | 58.7% | |
| International Equity Funds | 26.8% | |
| Bond Funds | 14.4% | |
| Short-Term Funds | 0.1% | |

Domestic Equity Funds category includes Fidelity Series Commodity Strategy Fund which invests in commodity-related investments.
Fidelity® Multi-Manager 2030 Fund
Investments September 30, 2016 (Unaudited)
Showing Percentage of Net Assets
| Domestic Equity Funds - 56.9% | |||
| Shares | Value | ||
| Fidelity Series Commodity Strategy Fund Class F (a)(b) | 5,244 | $28,054 | |
| Strategic Advisers Core Multi-Manager Fund Class F (b) | 24,208 | 288,803 | |
| Strategic Advisers Growth Multi-Manager Fund Class F (b) | 18,510 | 242,295 | |
| Strategic Advisers Small-Mid Cap Multi-Manager Fund Class F (b) | 13,446 | 145,487 | |
| Strategic Advisers Value Multi-Manager Fund Class F (b) | 21,184 | 288,520 | |
| TOTAL DOMESTIC EQUITY FUNDS | |||
| (Cost $1,005,250) | 993,159 | ||
| International Equity Funds - 27.7% | |||
| Strategic Advisers Emerging Markets Fund of Funds Class F (b) | 17,457 | 163,925 | |
| Strategic Advisers International Multi-Manager Fund Class F (b) | 27,818 | 320,463 | |
| TOTAL INTERNATIONAL EQUITY FUNDS | |||
| (Cost $483,701) | 484,388 | ||
| Bond Funds - 15.4% | |||
| Fidelity Series Emerging Markets Debt Fund Class F (b) | 1,102 | 11,422 | |
| Fidelity Series Floating Rate High Income Fund Class F (b) | 463 | 4,358 | |
| Fidelity Series Inflation-Protected Bond Index Fund Class F (b) | 1,031 | 10,391 | |
| Fidelity Series Real Estate Income Fund Class F (b) | 752 | 8,435 | |
| Strategic Advisers Core Income Multi-Manager Fund Class F (b) | 18,316 | 185,354 | |
| Strategic Advisers Income Opportunities Fund of Funds Class F (b) | 4,885 | 48,361 | |
| TOTAL BOND FUNDS | |||
| (Cost $263,817) | 268,321 | ||
| Short-Term Funds - 0.0% | |||
| Fidelity Investments Money Market Government Portfolio Institutional Class 0.31% (b)(c) | 558 | 558 | |
| Fidelity Series Short-Term Credit Fund Class F (b) | 30 | 300 | |
| TOTAL SHORT-TERM FUNDS | |||
| (Cost $857) | 858 | ||
| TOTAL INVESTMENT PORTFOLIO - 100.0% | |||
| (Cost $1,753,625) | 1,746,726 | ||
| NET OTHER ASSETS (LIABILITIES) - 0.0% | (157) | ||
| NET ASSETS - 100% | $1,746,569 |
Legend
(a) Non-income producing
(b) Affiliated Fund
(c) The rate quoted is the annualized seven-day yield of the fund at period end.
Affiliated Underlying Funds
Information regarding the Fund's fiscal year to date purchases and sales of the affiliated Underlying Funds and income earned by the Fund from investments in affiliated Underlying Funds is as follows:
| Affiliate | Value, beginning of period | Purchases | Sales Proceeds | Dividend Income | Value, end of period |
| Fidelity Investments Money Market Government Portfolio Institutional Class 0.31% | $479 | $137 | $58 | $-- | $558 |
| Fidelity Series Commodity Strategy Fund Class F | 18,828 | 14,321 | 6,660 | -- | 28,054 |
| Fidelity Series Emerging Markets Debt Fund Class F | 9,206 | 2,292 | 987 | 290 | 11,422 |
| Fidelity Series Floating Rate High Income Fund Class F | 3,660 | 925 | 411 | 91 | 4,358 |
| Fidelity Series Inflation-Protected Bond Index Fund Class F | 7,578 | 3,704 | 1,072 | 10 | 10,391 |
| Fidelity Series Real Estate Income Fund Class F | 7,102 | 2,099 | 988 | 210 | 8,435 |
| Fidelity Series Short-Term Credit Fund Class F | 255 | 90 | 46 | 2 | 300 |
| Strategic Advisers Core Income Multi-Manager Fund Class F | 141,028 | 57,116 | 16,854 | 1,875 | 185,354 |
| Strategic Advisers Core Multi-Manager Fund Class F | 253,389 | 68,322 | 34,230 | 937 | 288,803 |
| Strategic Advisers Emerging Markets Fund of Funds Class F | 129,851 | 32,064 | 14,473 | -- | 163,925 |
| Strategic Advisers Growth Multi-Manager Fund Class F | 211,438 | 58,821 | 29,819 | 707 | 242,295 |
| Strategic Advisers Income Opportunities Fund of Funds Class F | 43,810 | 6,259 | 4,702 | 1,280 | 48,361 |
| Strategic Advisers International Multi-Manager Fund Class F | 264,490 | 75,285 | 34,636 | -- | 320,463 |
| Strategic Advisers Small-Mid Cap Multi-Manager Fund Class F | 126,904 | 25,683 | 19,844 | -- | 145,487 |
| Strategic Advisers Value Multi-Manager Fund Class F | 253,127 | 62,625 | 33,368 | 1,983 | 288,520 |
| Total | $1,471,145 | $409,743 | $198,148 | $7,385 | $1,746,726 |
Investment Valuation
All investments are categorized as Level 1 under the Fair Value Hierarchy. The inputs or methodology used for valuing securities may not be an indication of the risk associated with investing in those securities. For more information on valuation inputs please refer to the Investment Valuation section in the accompanying Notes to Financial Statements.
See accompanying notes which are an integral part of the financial statements.
Fidelity® Multi-Manager 2030 Fund
Financial Statements
Statement of Assets and Liabilities
| September 30, 2016 (Unaudited) | ||
| Assets | ||
| Investment in securities, at value (cost $1,753,625) — See accompanying schedule | $1,746,726 | |
| Receivable for investments sold | 3,995 | |
| Receivable for fund shares sold | 4,438 | |
| Receivable from investment adviser for expense reductions | 23 | |
| Total assets | 1,755,182 | |
| Liabilities | ||
| Payable for investments purchased | $8,432 | |
| Distribution and service plan fees payable | 22 | |
| Other affiliated payables | 159 | |
| Total liabilities | 8,613 | |
| Net Assets | $1,746,569 | |
| Net Assets consist of: | ||
| Paid in capital | $1,751,683 | |
| Undistributed net investment income | 6,235 | |
| Accumulated undistributed net realized gain (loss) on investments | (4,450) | |
| Net unrealized appreciation (depreciation) on investments | (6,899) | |
| Net Assets | $1,746,569 | |
| Multi-Manager 2030: | ||
| Net Asset Value, offering price and redemption price per share ($1,529,558 ÷ 141,989 shares) | $10.77 | |
| Class L: | ||
| Net Asset Value, offering price and redemption price per share ($108,890 ÷ 10,111 shares) | $10.77 | |
| Class N: | ||
| Net Asset Value, offering price and redemption price per share ($108,121 ÷ 10,055 shares) | $10.75 |
See accompanying notes which are an integral part of the financial statements.
Statement of Operations
| Six months ended September 30, 2016 (Unaudited) | ||
| Investment Income | ||
| Income distributions from underlying funds | $7,385 | |
| Expenses | ||
| Transfer agent fees | $917 | |
| Distribution and service plan fees | 131 | |
| Independent trustees' fees and expenses | 3 | |
| Total expenses before reductions | 1,051 | |
| Expense reductions | (121) | 930 |
| Net investment income (loss) | 6,455 | |
| Realized and Unrealized Gain (Loss) | ||
| Realized gain (loss) on sale of underlying fund shares | (9,583) | |
| Capital gain distributions from underlying funds | 34,963 | |
| Total net realized gain (loss) | 25,380 | |
| Change in net unrealized appreciation (depreciation) on underlying funds | 73,570 | |
| Net gain (loss) | 98,950 | |
| Net increase (decrease) in net assets resulting from operations | $105,405 |
See accompanying notes which are an integral part of the financial statements.
Statement of Changes in Net Assets
| Six months ended September 30, 2016 (Unaudited) | Year ended March 31, 2016 | |
| Increase (Decrease) in Net Assets | ||
| Operations | ||
| Net investment income (loss) | $6,455 | $15,279 |
| Net realized gain (loss) | 25,380 | 9,998 |
| Change in net unrealized appreciation (depreciation) | 73,570 | (59,522) |
| Net increase (decrease) in net assets resulting from operations | 105,405 | (34,245) |
| Distributions to shareholders from net investment income | (1,210) | (14,250) |
| Distributions to shareholders from net realized gain | – | (83,657) |
| Total distributions | (1,210) | (97,907) |
| Share transactions - net increase (decrease) | 171,357 | 179,577 |
| Total increase (decrease) in net assets | 275,552 | 47,425 |
| Net Assets | ||
| Beginning of period | 1,471,017 | 1,423,592 |
| End of period | $1,746,569 | $1,471,017 |
| Other Information | ||
| Undistributed net investment income end of period | $6,235 | $990 |
See accompanying notes which are an integral part of the financial statements.
Financial Highlights — Fidelity Multi-Manager 2030 Fund
| Six months ended (Unaudited) September 30, | Years ended March 31, | ||||
| 2016 | 2016 | 2015 | 2014 | 2013 A | |
| Selected Per–Share Data | |||||
| Net asset value, beginning of period | $10.09 | $11.31 | $11.52 | $10.50 | $10.00 |
| Income from Investment Operations | |||||
| Net investment income (loss)B | .04 | .11 | .15 | .19 | .06 |
| Net realized and unrealized gain (loss) | .65 | (.52) | .59 | 1.14 | .44 |
| Total from investment operations | .69 | (.41) | .74 | 1.33 | .50 |
| Distributions from net investment income | (.01) | (.12) | (.16) | (.14) | – |
| Distributions from net realized gain | – | (.68) | (.79) | (.17) | – |
| Total distributions | (.01) | (.81)C | (.95) | (.31) | – |
| Net asset value, end of period | $10.77 | $10.09 | $11.31 | $11.52 | $10.50 |
| Total ReturnD,E | 6.83% | (3.92)% | 6.71% | 12.76% | 5.00% |
| Ratios to Average Net AssetsF,G | |||||
| Expenses before reductions | .12%H | .12% | .11% | .13% | .21%H |
| Expenses net of fee waivers, if any | .10%H | .10% | .10% | .10% | .09%H |
| Expenses net of all reductions | .10%H | .10% | .10% | .10% | .09%H |
| Net investment income (loss) | .81%H | 1.08% | 1.34% | 1.74% | 2.14%H |
| Supplemental Data | |||||
| Net assets, end of period (000 omitted) | $1,530 | $1,257 | $1,201 | $801 | $105 |
| Portfolio turnover rateF | 25%H | 54% | 27% | 63% | 1%I |
A For the period December 20, 2012 (commencement of operations) to March 31, 2013.
B Calculated based on average shares outstanding during the period.
C Total distributions of $.81 per share is comprised of distributions from net investment income of $.122 and distributions from net realized gain of $.684 per share.
D Total returns for periods of less than one year are not annualized.
E Total returns would have been lower if certain expenses had not been reduced during the applicable periods shown.
F Amounts do not include the activity of the Underlying Funds.
G Expense ratios reflect operating expenses of the class. Expenses before reductions do not reflect amounts reimbursed by the investment adviser or reductions from expense offset arrangements and do not represent the amount paid by the class during periods when reimbursements or reductions occur. Expense ratios before reductions for start-up periods may not be representative of longer-term operating periods. Expenses net of fee waivers reflect expenses after reimbursement by the investment adviser but prior to reductions from expense offset arrangements. Expenses net of all reductions represent the net expenses paid by the class but do not include expenses of the underlying funds in which the Fund invests.
H Annualized
I Amount not annualized.
See accompanying notes which are an integral part of the financial statements.
Financial Highlights — Fidelity Multi-Manager 2030 Fund Class L
| Six months ended (Unaudited) September 30, | Years ended March 31, | |||
| 2016 | 2016 | 2015 | 2014 A | |
| Selected Per–Share Data�� | ||||
| Net asset value, beginning of period | $10.09 | $11.31 | $11.51 | $11.22 |
| Income from Investment Operations | ||||
| Net investment income (loss)B | .04 | .11 | .15 | .08 |
| Net realized and unrealized gain (loss) | .65 | (.52) | .60 | .40 |
| Total from investment operations | .69 | (.41) | .75 | .48 |
| Distributions from net investment income | (.01) | (.12) | (.16) | (.08) |
| Distributions from net realized gain | – | (.68) | (.79) | (.11) |
| Total distributions | (.01) | (.81)C | (.95) | (.19) |
| Net asset value, end of period | $10.77 | $10.09 | $11.31 | $11.51 |
| Total ReturnD,E | 6.83% | (3.90)% | 6.80% | 4.32% |
| Ratios to Average Net AssetsF,G | ||||
| Expenses before reductions | .09%H | .10% | .11% | .11%H |
| Expenses net of fee waivers, if any | .09%H | .10% | .10% | .10%H |
| Expenses net of all reductions | .09%H | .10% | .10% | .10%H |
| Net investment income (loss) | .82%H | 1.08% | 1.34% | 2.25%H |
| Supplemental Data | ||||
| Net assets, end of period (000 omitted) | $109 | $107 | $111 | $104 |
| Portfolio turnover rateF | 25%H | 54% | 27% | 63% |
A For the period December 4, 2013 (commencement of sale of shares) to March 31, 2014.
B Calculated based on average shares outstanding during the period.
C Total distributions of $.81 per share is comprised of distributions from net investment income of $.124 and distributions from net realized gain of $.684 per share.
D Total returns for periods of less than one year are not annualized.
E Total returns would have been lower if certain expenses had not been reduced during the applicable periods shown.
F Amounts do not include the activity of the Underlying Funds.
G Expense ratios reflect operating expenses of the class. Expenses before reductions do not reflect amounts reimbursed by the investment adviser or reductions from expense offset arrangements and do not represent the amount paid by the class during periods when reimbursements or reductions occur. Expenses net of fee waivers reflect expenses after reimbursement by the investment adviser but prior to reductions from expense offset arrangements. Expenses net of all reductions represent the net expenses paid by the class but do not include expenses of the underlying funds in which the Fund invests.
H Annualized
See accompanying notes which are an integral part of the financial statements.
Financial Highlights — Fidelity Multi-Manager 2030 Fund Class N
| Six months ended (Unaudited) September 30, | Years ended March 31, | |||
| 2016 | 2016 | 2015 | 2014 A | |
| Selected Per–Share Data | ||||
| Net asset value, beginning of period | $10.08 | $11.30 | $11.51 | $11.22 |
| Income from Investment Operations | ||||
| Net investment income (loss)B | .03 | .09 | .13 | .07 |
| Net realized and unrealized gain (loss) | .64 | (.53) | .58 | .41 |
| Total from investment operations | .67 | (.44) | .71 | .48 |
| Distributions from net investment income | –C | (.10) | (.13) | (.08) |
| Distributions from net realized gain | – | (.68) | (.79) | (.11) |
| Total distributions | –C | (.78) | (.92) | (.19) |
| Net asset value, end of period | $10.75 | $10.08 | $11.30 | $11.51 |
| Total ReturnD,E | 6.68% | (4.12)% | 6.44% | 4.30% |
| Ratios to Average Net AssetsF,G | ||||
| Expenses before reductions | .34%H | .35% | .36% | .37%H |
| Expenses net of fee waivers, if any | .34%H | .35% | .35% | .35%H |
| Expenses net of all reductions | .34%H | .35% | .35% | .35%H |
| Net investment income (loss) | .57%H | .83% | 1.09% | 2.00%H |
| Supplemental Data | ||||
| Net assets, end of period (000 omitted) | $108 | $106 | $111 | $104 |
| Portfolio turnover rateF | 25%H | 54% | 27% | 63% |
A For the period December 4, 2013 (commencement of sale of shares) to March 31, 2014.
B Calculated based on average shares outstanding during the period.
C Amount represents less than $.005 per share.
D Total returns for periods of less than one year are not annualized.
E Total returns would have been lower if certain expenses had not been reduced during the applicable periods shown.
F Amounts do not include the activity of the Underlying Funds.
G Expense ratios reflect operating expenses of the class. Expenses before reductions do not reflect amounts reimbursed by the investment adviser or reductions from expense offset arrangements and do not represent the amount paid by the class during periods when reimbursements or reductions occur. Expenses net of fee waivers reflect expenses after reimbursement by the investment adviser but prior to reductions from expense offset arrangements. Expenses net of all reductions represent the net expenses paid by the class but do not include expenses of the underlying funds in which the Fund invests.
H Annualized
See accompanying notes which are an integral part of the financial statements.
Fidelity® Multi-Manager 2035 Fund
Investment Summary (Unaudited)
The information in the following tables is based on the direct investments of the Fund.Top Holdings as of September 30, 2016
| % of fund's net assets | % of fund's net assets 6 months ago | |
| Strategic Advisers International Multi-Manager Fund Class F | 20.7 | 20.1 |
| Strategic Advisers Core Multi-Manager Fund Class F | 18.6 | 19.1 |
| Strategic Advisers Value Multi-Manager Fund Class F | 18.6 | 19.1 |
| Strategic Advisers Growth Multi-Manager Fund Class F | 15.7 | 16.0 |
| Strategic Advisers Emerging Markets Fund of Funds Class F | 10.0 | 9.4 |
| Strategic Advisers Small-Mid Cap Multi-Manager Fund Class F | 9.4 | 9.6 |
| Strategic Advisers Income Opportunities Fund of Funds Class F | 2.8 | 2.9 |
| Fidelity Series Commodity Strategy Fund Class F | 1.7 | 1.3 |
| Fidelity Series Emerging Markets Debt Fund Class F | 0.7 | 0.6 |
| Fidelity Series Inflation-Protected Bond Index Fund Class F | 0.6 | 0.5 |
| 98.8 | 98.6 |
Asset Allocation (% of fund's net assets)
| Period end | ||
| Domestic Equity Funds | 64.0% | |
| International Equity Funds | 30.7% | |
| Bond Funds | 5.3% | |

| Six months ago | ||
| Domestic Equity Funds | 65.1% | |
| International Equity Funds | 29.5% | |
| Bond Funds | 5.3% | |
| Short-Term Funds | 0.1% | |

Domestic Equity Funds category includes Fidelity Series Commodity Strategy Fund which invests in commodity-related investments.
Fidelity® Multi-Manager 2035 Fund
Investments September 30, 2016 (Unaudited)
Showing Percentage of Net Assets
| Domestic Equity Funds - 64.0% | |||
| Shares | Value | ||
| Fidelity Series Commodity Strategy Fund Class F (a)(b) | 5,939 | $31,772 | |
| Strategic Advisers Core Multi-Manager Fund Class F (b) | 29,300 | 349,551 | |
| Strategic Advisers Growth Multi-Manager Fund Class F (b) | 22,412 | 293,368 | |
| Strategic Advisers Small-Mid Cap Multi-Manager Fund Class F (b) | 16,271 | 176,056 | |
| Strategic Advisers Value Multi-Manager Fund Class F (b) | 25,650 | 349,352 | |
| TOTAL DOMESTIC EQUITY FUNDS | |||
| (Cost $1,223,360) | 1,200,099 | ||
| International Equity Funds - 30.7% | |||
| Strategic Advisers Emerging Markets Fund of Funds Class F (b) | 19,973 | 187,548 | |
| Strategic Advisers International Multi-Manager Fund Class F (b) | 33,714 | 388,378 | |
| TOTAL INTERNATIONAL EQUITY FUNDS | |||
| (Cost $569,967) | 575,926 | ||
| Bond Funds - 5.3% | |||
| Fidelity Series Emerging Markets Debt Fund Class F (b) | 1,198 | 12,410 | |
| Fidelity Series Floating Rate High Income Fund Class F (b) | 497 | 4,681 | |
| Fidelity Series Inflation-Protected Bond Index Fund Class F (b) | 1,106 | 11,151 | |
| Fidelity Series Real Estate Income Fund Class F (b) | 816 | 9,159 | |
| Strategic Advisers Core Income Multi-Manager Fund Class F (b) | 900 | 9,112 | |
| Strategic Advisers Income Opportunities Fund of Funds Class F (b) | 5,349 | 52,954 | |
| TOTAL BOND FUNDS | |||
| (Cost $98,984) | 99,467 | ||
| Short-Term Funds - 0.0% | |||
| Fidelity Investments Money Market Government Portfolio Institutional Class 0.31% (b)(c) | 598 | 598 | |
| Fidelity Series Short-Term Credit Fund Class F (b) | 32 | 323 | |
| TOTAL SHORT-TERM FUNDS | |||
| (Cost $920) | 921 | ||
| TOTAL INVESTMENT PORTFOLIO - 100.0% | |||
| (Cost $1,893,231) | 1,876,413 | ||
| NET OTHER ASSETS (LIABILITIES) - 0.0% | (164) | ||
| NET ASSETS - 100% | $1,876,249 |
Legend
(a) Non-income producing
(b) Affiliated Fund
(c) The rate quoted is the annualized seven-day yield of the fund at period end.
Affiliated Underlying Funds
Information regarding the Fund's fiscal year to date purchases and sales of the affiliated Underlying Funds and income earned by the Fund from investments in affiliated Underlying Funds is as follows:
| Affiliate | Value, beginning of period | Purchases | Sales Proceeds | Dividend Income | Value, end of period |
| Fidelity Investments Money Market Government Portfolio Institutional Class 0.31% | $574 | $136 | $111 | $-- | $598 |
| Fidelity Series Commodity Strategy Fund Class F | 23,073 | 11,840 | 4,980 | -- | 31,772 |
| Fidelity Series Emerging Markets Debt Fund Class F | 11,299 | 2,129 | 2,040 | 328 | 12,410 |
| Fidelity Series Floating Rate High Income Fund Class F | 4,467 | 851 | 850 | 101 | 4,681 |
| Fidelity Series Inflation-Protected Bond Index Fund Class F | 9,257 | 3,698 | 2,001 | 11 | 11,151 |
| Fidelity Series Real Estate Income Fund Class F | 8,740 | 1,984 | 1,828 | 230 | 9,159 |
| Fidelity Series Short-Term Credit Fund Class F | 287 | 108 | 73 | 2 | 323 |
| Strategic Advisers Core Income Multi-Manager Fund Class F | 8,995 | 3,222 | 3,338 | 102 | 9,112 |
| Strategic Advisers Core Multi-Manager Fund Class F | 343,740 | 70,059 | 67,266 | 1,084 | 349,551 |
| Strategic Advisers Emerging Markets Fund of Funds Class F | 168,959 | 32,634 | 32,211 | -- | 187,548 |
| Strategic Advisers Growth Multi-Manager Fund Class F | 286,826 | 60,653 | 56,948 | 818 | 293,368 |
| Strategic Advisers Income Opportunities Fund of Funds Class F | 52,943 | 6,615 | 10,002 | 1,465 | 52,954 |
| Strategic Advisers International Multi-Manager Fund Class F | 361,510 | 81,299 | 72,152 | -- | 388,378 |
| Strategic Advisers Small-Mid Cap Multi-Manager Fund Class F | 172,149 | 24,182 | 36,071 | -- | 176,056 |
| Strategic Advisers Value Multi-Manager Fund Class F | 343,389 | 62,367 | 64,935 | 2,293 | 349,352 |
| Total | $1,796,208 | $361,777 | $354,806 | $6,434 | $1,876,413 |
Investment Valuation
All investments are categorized as Level 1 under the Fair Value Hierarchy. The inputs or methodology used for valuing securities may not be an indication of the risk associated with investing in those securities. For more information on valuation inputs please refer to the Investment Valuation section in the accompanying Notes to Financial Statements.
See accompanying notes which are an integral part of the financial statements.
Fidelity® Multi-Manager 2035 Fund
Financial Statements
Statement of Assets and Liabilities
| September 30, 2016 (Unaudited) | ||
| Assets | ||
| Investment in securities, at value (cost $1,893,231) — See accompanying schedule | $1,876,413 | |
| Receivable for investments sold | 2,010 | |
| Receivable for fund shares sold | 12,362 | |
| Receivable from investment adviser for expense reductions | 77 | |
| Total assets | 1,890,862 | |
| Liabilities | ||
| Payable for investments purchased | $14,371 | |
| Distribution and service plan fees payable | 22 | |
| Other affiliated payables | 220 | |
| Total liabilities | 14,613 | |
| Net Assets | $1,876,249 | |
| Net Assets consist of: | ||
| Paid in capital | $1,885,231 | |
| Undistributed net investment income | 5,472 | |
| Accumulated undistributed net realized gain (loss) on investments | 2,364 | |
| Net unrealized appreciation (depreciation) on investments | (16,818) | |
| Net Assets | $1,876,249 | |
| Multi-Manager 2035: | ||
| Net Asset Value, offering price and redemption price per share ($1,659,137 ÷ 150,503 shares) | $11.02 | |
| Class L: | ||
| Net Asset Value, offering price and redemption price per share ($108,939 ÷ 9,880 shares) | $11.03 | |
| Class N: | ||
| Net Asset Value, offering price and redemption price per share ($108,173 ÷ 9,829 shares) | $11.01 |
See accompanying notes which are an integral part of the financial statements.
Statement of Operations
| Six months ended September 30, 2016 (Unaudited) | ||
| Investment Income | ||
| Income distributions from underlying funds | $6,434 | |
| Expenses | ||
| Transfer agent fees | $1,320 | |
| Distribution and service plan fees | 131 | |
| Independent trustees' fees and expenses | 4 | |
| Total expenses before reductions | 1,455 | |
| Expense reductions | (426) | 1,029 |
| Net investment income (loss) | 5,405 | |
| Realized and Unrealized Gain (Loss) | ||
| Realized gain (loss) on sale of underlying fund shares | (22,426) | |
| Capital gain distributions from underlying funds | 40,431 | |
| Total net realized gain (loss) | 18,005 | |
| Change in net unrealized appreciation (depreciation) on underlying funds | 95,658 | |
| Net gain (loss) | 113,663 | |
| Net increase (decrease) in net assets resulting from operations | $119,068 |
See accompanying notes which are an integral part of the financial statements.
Statement of Changes in Net Assets
| Six months ended September 30, 2016 (Unaudited) | Year ended March 31, 2016 | |
| Increase (Decrease) in Net Assets | ||
| Operations | ||
| Net investment income (loss) | $5,405 | $14,634 |
| Net realized gain (loss) | 18,005 | 42,042 |
| Change in net unrealized appreciation (depreciation) | 95,658 | (101,836) |
| Net increase (decrease) in net assets resulting from operations | 119,068 | (45,160) |
| Distributions to shareholders from net investment income | (476) | (14,091) |
| Distributions to shareholders from net realized gain | (22,028) | (77,195) |
| Total distributions | (22,504) | (91,286) |
| Share transactions - net increase (decrease) | (16,373) | 736,362 |
| Total increase (decrease) in net assets | 80,191 | 599,916 |
| Net Assets | ||
| Beginning of period | 1,796,058 | 1,196,142 |
| End of period | $1,876,249 | $1,796,058 |
| Other Information | ||
| Undistributed net investment income end of period | $5,472 | $543 |
See accompanying notes which are an integral part of the financial statements.
Financial Highlights — Fidelity Multi-Manager 2035 Fund
| Six months ended (Unaudited) September 30, | Years ended March 31, | ||||
| 2016 | 2016 | 2015 | 2014 | 2013 A | |
| Selected Per–Share Data | |||||
| Net asset value, beginning of period | $10.42 | $11.65 | $11.75 | $10.56 | $10.00 |
| Income from Investment Operations | |||||
| Net investment income (loss)B | .03 | .11 | .15 | .15 | .05 |
| Net realized and unrealized gain (loss) | .70 | (.59) | .64 | 1.36 | .51 |
| Total from investment operations | .73 | (.48) | .79 | 1.51 | .56 |
| Distributions from net investment income | –C | (.10) | (.15) | (.14) | – |
| Distributions from net realized gain | (.13) | (.64) | (.75) | (.18) | – |
| Total distributions | (.13) | (.75)D | (.89)E | (.32) | – |
| Net asset value, end of period | $11.02 | $10.42 | $11.65 | $11.75 | $10.56 |
| Total ReturnF,G | 7.14% | (4.45)% | 6.95% | 14.45% | 5.60% |
| Ratios to Average Net AssetsH,I | |||||
| Expenses before reductions | .15%J | .16% | .18% | .17% | .20%J |
| Expenses net of fee waivers, if any | .10%J | .10% | .10% | .10% | .10%J |
| Expenses net of all reductions | .10%J | .10% | .10% | .10% | .10%J |
| Net investment income (loss) | .61%J | 1.07% | 1.25% | 1.36% | 1.84%J |
| Supplemental Data | |||||
| Net assets, end of period (000 omitted) | $1,659 | $1,583 | $973 | $412 | $127 |
| Portfolio turnover rateI | 39%J | 18% | 11% | 32% | 1%K |
A For the period December 20, 2012 (commencement of operations) to March 31, 2013.
B Calculated based on average shares outstanding during the period.
C Amount represents less than $.005 per share.
D Total distributions of $.75 per share is comprised of distributions from net investment income of $.103 and distributions from net realized gain of $.643 per share.
E Total distributions of $.89 per share is comprised of distributions from net investment income of $.145 and distributions from net realized gain of $.745 per share.
F Total returns for periods of less than one year are not annualized.
G Total returns would have been lower if certain expenses had not been reduced during the applicable periods shown.
H Expense ratios reflect operating expenses of the class. Expenses before reductions do not reflect amounts reimbursed by the investment adviser or reductions from expense offset arrangements and do not represent the amount paid by the class during periods when reimbursements or reductions occur. Expense ratios before reductions for start-up periods may not be representative of longer-term operating periods. Expenses net of fee waivers reflect expenses after reimbursement by the investment adviser but prior to reductions from expense offset arrangements. Expenses net of all reductions represent the net expenses paid by the class but do not include expenses of the underlying funds in which the Fund invests.
I Amounts do not include the activity of the Underlying Funds.
J Annualized
K Amount not annualized.
See accompanying notes which are an integral part of the financial statements.
Financial Highlights — Fidelity Multi-Manager 2035 Fund Class L
| Six months ended (Unaudited) September 30, | Years ended March 31, | |||
| 2016 | 2016 | 2015 | 2014 A | |
| Selected Per–Share Data | ||||
| Net asset value, beginning of period | $10.43 | $11.65 | $11.75 | $11.47 |
| Income from Investment Operations | ||||
| Net investment income (loss)B | .03 | .12 | .15 | .08 |
| Net realized and unrealized gain (loss) | .70 | (.59) | .64 | .43 |
| Total from investment operations | .73 | (.47) | .79 | .51 |
| Distributions from net investment income | –C | (.10) | (.14) | (.09) |
| Distributions from net realized gain | (.13) | (.64) | (.75) | (.14) |
| Total distributions | (.13) | (.75)D | (.89) | (.23) |
| Net asset value, end of period | $11.03 | $10.43 | $11.65 | $11.75 |
| Total ReturnE,F | 7.14% | (4.36)% | 6.94% | 4.50% |
| Ratios to Average Net AssetsG,H | ||||
| Expenses before reductions | .10%I | .10% | .12% | .12%I |
| Expenses net of fee waivers, if any | .10%I | .10% | .10% | .10%I |
| Expenses net of all reductions | .10%I | .10% | .10% | .10%I |
| Net investment income (loss) | .62%I | 1.07% | 1.25% | 2.08%I |
| Supplemental Data | ||||
| Net assets, end of period (000 omitted) | $109 | $107 | $112 | $105 |
| Portfolio turnover rateH | 39%I | 18% | 11% | 32% |
A For the period December 4, 2013 (commencement of sale of shares) to March 31, 2014.
B Calculated based on average shares outstanding during the period.
C Amount represents less than $.005 per share.
D Total distributions of $.75 per share is comprised of distributions from net investment income of $.102 and distributions from net realized gain of $.643 per share.
E Total returns for periods of less than one year are not annualized.
F Total returns would have been lower if certain expenses had not been reduced during the applicable periods shown.
G Expense ratios reflect operating expenses of the class. Expenses before reductions do not reflect amounts reimbursed by the investment adviser or reductions from expense offset arrangements and do not represent the amount paid by the class during periods when reimbursements or reductions occur. Expenses net of fee waivers reflect expenses after reimbursement by the investment adviser but prior to reductions from expense offset arrangements. Expenses net of all reductions represent the net expenses paid by the class but do not include expenses of the underlying funds in which the Fund invests.
H Amounts do not include the activity of the Underlying Funds.
I Annualized
See accompanying notes which are an integral part of the financial statements.
Financial Highlights — Fidelity Multi-Manager 2035 Fund Class N
| Six months ended (Unaudited) September 30, | Years ended March 31, | |||
| 2016 | 2016 | 2015 | 2014 A | |
| Selected Per–Share Data | ||||
| Net asset value, beginning of period | $10.41 | $11.64 | $11.75 | $11.47 |
| Income from Investment Operations | ||||
| Net investment income (loss)B | .02 | .09 | .12 | .07 |
| Net realized and unrealized gain (loss) | .71 | (.60) | .63 | .44 |
| Total from investment operations | .73 | (.51) | .75 | .51 |
| Distributions from net investment income | – | (.08) | (.11) | (.09) |
| Distributions from net realized gain | (.13) | (.64) | (.75) | (.14) |
| Total distributions | (.13) | (.72) | (.86) | (.23) |
| Net asset value, end of period | $11.01 | $10.41 | $11.64 | $11.75 |
| Total ReturnC,D | 6.99% | (4.65)% | 6.58% | 4.48% |
| Ratios to Average Net AssetsE,F | ||||
| Expenses before reductions | .35%G | .35% | .37% | .38%G |
| Expenses net of fee waivers, if any | .35%G | .35% | .35% | .35%G |
| Expenses net of all reductions | .35%G | .35% | .35% | .35%G |
| Net investment income (loss) | .37%G | .81% | 1.00% | 1.83%G |
| Supplemental Data | ||||
| Net assets, end of period (000 omitted) | $108 | $106 | $111 | $104 |
| Portfolio turnover rateF | 39%G | 18% | 11% | 32% |
A For the period December 4, 2013 (commencement of sale of shares) to March 31, 2014.
B Calculated based on average shares outstanding during the period.
C Total returns for periods of less than one year are not annualized.
D Total returns would have been lower if certain expenses had not been reduced during the applicable periods shown.
E Expense ratios reflect operating expenses of the class. Expenses before reductions do not reflect amounts reimbursed by the investment adviser or reductions from expense offset arrangements and do not represent the amount paid by the class during periods when reimbursements or reductions occur. Expenses net of fee waivers reflect expenses after reimbursement by the investment adviser but prior to reductions from expense offset arrangements. Expenses net of all reductions represent the net expenses paid by the class but do not include expenses of the underlying funds in which the Fund invests.
F Amounts do not include the activity of the Underlying Funds.
G Annualized
See accompanying notes which are an integral part of the financial statements.
Fidelity® Multi-Manager 2040 Fund
Investment Summary (Unaudited)
The information in the following tables is based on the direct investments of the Fund.Top Holdings as of September 30, 2016
| % of fund's net assets | % of fund's net assets 6 months ago | |
| Strategic Advisers International Multi-Manager Fund Class F | 20.7 | 20.2 |
| Strategic Advisers Core Multi-Manager Fund Class F | 18.6 | 19.0 |
| Strategic Advisers Value Multi-Manager Fund Class F | 18.6 | 19.1 |
| Strategic Advisers Growth Multi-Manager Fund Class F | 15.7 | 15.9 |
| Strategic Advisers Emerging Markets Fund of Funds Class F | 10.0 | 9.4 |
| Strategic Advisers Small-Mid Cap Multi-Manager Fund Class F | 9.4 | 9.8 |
| Strategic Advisers Income Opportunities Fund of Funds Class F | 2.8 | 2.9 |
| Fidelity Series Commodity Strategy Fund Class F | 1.7 | 1.3 |
| Fidelity Series Emerging Markets Debt Fund Class F | 0.7 | 0.6 |
| Fidelity Series Inflation-Protected Bond Index Fund Class F | 0.6 | 0.5 |
| 98.8 | 98.7 |
Asset Allocation (% of fund's net assets)
| Period end | ||
| Domestic Equity Funds | 64.0% | |
| International Equity Funds | 30.7% | |
| Bond Funds | 5.3% | |

| Six months ago | ||
| Domestic Equity Funds | 65.1% | |
| International Equity Funds | 29.6% | |
| Bond Funds | 5.3% | |

Domestic Equity Funds category includes Fidelity Series Commodity Strategy Fund which invests in commodity-related investments.
Fidelity® Multi-Manager 2040 Fund
Investments September 30, 2016 (Unaudited)
Showing Percentage of Net Assets
| Domestic Equity Funds - 64.0% | |||
| Shares | Value | ||
| Fidelity Series Commodity Strategy Fund Class F (a)(b) | 3,200 | $17,120 | |
| Strategic Advisers Core Multi-Manager Fund Class F (b) | 15,738 | 187,760 | |
| Strategic Advisers Growth Multi-Manager Fund Class F (b) | 12,047 | 157,700 | |
| Strategic Advisers Small-Mid Cap Multi-Manager Fund Class F (b) | 8,747 | 94,638 | |
| Strategic Advisers Value Multi-Manager Fund Class F (b) | 13,782 | 187,707 | |
| TOTAL DOMESTIC EQUITY FUNDS | |||
| (Cost $667,601) | 644,925 | ||
| International Equity Funds - 30.7% | |||
| Strategic Advisers Emerging Markets Fund of Funds Class F (b) | 10,740 | 100,846 | |
| Strategic Advisers International Multi-Manager Fund Class F (b) | 18,112 | 208,645 | |
| TOTAL INTERNATIONAL EQUITY FUNDS | |||
| (Cost $311,419) | 309,491 | ||
| Bond Funds - 5.3% | |||
| Fidelity Series Emerging Markets Debt Fund Class F (b) | 653 | 6,763 | |
| Fidelity Series Floating Rate High Income Fund Class F (b) | 267 | 2,518 | |
| Fidelity Series Inflation-Protected Bond Index Fund Class F (b) | 594 | 5,989 | |
| Fidelity Series Real Estate Income Fund Class F (b) | 442 | 4,965 | |
| Strategic Advisers Core Income Multi-Manager Fund Class F (b) | 488 | 4,943 | |
| Strategic Advisers Income Opportunities Fund of Funds Class F (b) | 2,835 | 28,065 | |
| TOTAL BOND FUNDS | |||
| (Cost $53,786) | 53,243 | ||
| Short-Term Funds - 0.0% | |||
| Fidelity Investments Money Market Government Portfolio Institutional Class 0.31% (b)(c) | 322 | 322 | |
| Fidelity Series Short-Term Credit Fund Class F (b) | 17 | 172 | |
| TOTAL SHORT-TERM FUNDS | |||
| (Cost $494) | 494 | ||
| TOTAL INVESTMENT PORTFOLIO - 100.0% | |||
| (Cost $1,033,300) | 1,008,153 | ||
| NET OTHER ASSETS (LIABILITIES) - 0.0% | (101) | ||
| NET ASSETS - 100% | $1,008,052 |
Legend
(a) Non-income producing
(b) Affiliated Fund
(c) The rate quoted is the annualized seven-day yield of the fund at period end.
Affiliated Underlying Funds
Information regarding the Fund's fiscal year to date purchases and sales of the affiliated Underlying Funds and income earned by the Fund from investments in affiliated Underlying Funds is as follows:
| Affiliate | Value, beginning of period | Purchases | Sales Proceeds | Dividend Income | Value, end of period |
| Fidelity Investments Money Market Government Portfolio Institutional Class 0.31% | $301 | $93 | $72 | $-- | $322 |
| Fidelity Series Commodity Strategy Fund Class F | 12,113 | 6,998 | 2,945 | -- | 17,120 |
| Fidelity Series Emerging Markets Debt Fund Class F | 6,035 | 1,529 | 1,342 | 176 | 6,763 |
| Fidelity Series Floating Rate High Income Fund Class F | 2,346 | 617 | 559 | 54 | 2,518 |
| Fidelity Series Inflation-Protected Bond Index Fund Class F | 4,913 | 2,391 | 1,414 | 6 | 5,989 |
| Fidelity Series Real Estate Income Fund Class F | 4,636 | 1,377 | 1,179 | 124 | 4,965 |
| Fidelity Series Short-Term Credit Fund Class F | 151 | 69 | 48 | 1 | 172 |
| Strategic Advisers Core Income Multi-Manager Fund Class F | 4,724 | 1,969 | 1,866 | 54 | 4,943 |
| Strategic Advisers Core Multi-Manager Fund Class F | 179,585 | 52,420 | 45,239 | 593 | 187,760 |
| Strategic Advisers Emerging Markets Fund of Funds Class F | 88,703 | 23,966 | 21,325 | -- | 100,846 |
| Strategic Advisers Growth Multi-Manager Fund Class F | 149,643 | 44,688 | 37,787 | 447 | 157,700 |
| Strategic Advisers Income Opportunities Fund of Funds Class F | 27,408 | 5,168 | 6,259 | 758 | 28,065 |
| Strategic Advisers International Multi-Manager Fund Class F | 190,064 | 57,231 | 48,487 | -- | 208,645 |
| Strategic Advisers Small-Mid Cap Multi-Manager Fund Class F | 92,320 | 19,500 | 25,344 | -- | 94,638 |
| Strategic Advisers Value Multi-Manager Fund Class F | 180,338 | 46,525 | 43,223 | 1,253 | 187,707 |
| Total | $943,280 | $264,541 | $237,089 | $3,466 | $1,008,153 |
Investment Valuation
All investments are categorized as Level 1 under the Fair Value Hierarchy. The inputs or methodology used for valuing securities may not be an indication of the risk associated with investing in those securities. For more information on valuation inputs please refer to the Investment Valuation section in the accompanying Notes to Financial Statements.
See accompanying notes which are an integral part of the financial statements.
Fidelity® Multi-Manager 2040 Fund
Financial Statements
Statement of Assets and Liabilities
| September 30, 2016 (Unaudited) | ||
| Assets | ||
| Investment in securities, at value (cost $1,033,300) — See accompanying schedule | $1,008,153 | |
| Receivable for investments sold | 30,345 | |
| Receivable for fund shares sold | 12,156 | |
| Receivable from investment adviser for expense reductions | 84 | |
| Total assets | 1,050,738 | |
| Liabilities | ||
| Payable to custodian bank | $1 | |
| Payable for investments purchased | 1,891 | |
| Payable for fund shares redeemed | 40,612 | |
| Distribution and service plan fees payable | 22 | |
| Other affiliated payables | 160 | |
| Total liabilities | 42,686 | |
| Net Assets | $1,008,052 | |
| Net Assets consist of: | ||
| Paid in capital | $1,033,521 | |
| Undistributed net investment income | 2,858 | |
| Accumulated undistributed net realized gain (loss) on investments | (3,180) | |
| Net unrealized appreciation (depreciation) on investments | (25,147) | |
| Net Assets | $1,008,052 | |
| Multi-Manager 2040: | ||
| Net Asset Value, offering price and redemption price per share ($790,936 ÷ 72,214 shares) | $10.95 | |
| Class L: | ||
| Net Asset Value, offering price and redemption price per share ($108,941 ÷ 9,946 shares) | $10.95 | |
| Class N: | ||
| Net Asset Value, offering price and redemption price per share ($108,175 ÷ 9,896 shares) | $10.93 |
See accompanying notes which are an integral part of the financial statements.
Statement of Operations
| Six months ended September 30, 2016 (Unaudited) | ||
| Investment Income | ||
| Income distributions from underlying funds | $3,466 | |
| Expenses | ||
| Transfer agent fees | $932 | |
| Distribution and service plan fees | 131 | |
| Independent trustees' fees and expenses | 2 | |
| Total expenses before reductions | 1,065 | |
| Expense reductions | (457) | 608 |
| Net investment income (loss) | 2,858 | |
| Realized and Unrealized Gain (Loss) | ||
| Realized gain (loss) on sale of underlying fund shares | (11,676) | |
| Capital gain distributions from underlying funds | 22,107 | |
| Total net realized gain (loss) | 10,431 | |
| Change in net unrealized appreciation (depreciation) on underlying funds | 49,095 | |
| Net gain (loss) | 59,526 | |
| Net increase (decrease) in net assets resulting from operations | $62,384 |
See accompanying notes which are an integral part of the financial statements.
Statement of Changes in Net Assets
| Six months ended September 30, 2016 (Unaudited) | Year ended March 31, 2016 | |
| Increase (Decrease) in Net Assets | ||
| Operations | ||
| Net investment income (loss) | $2,858 | $8,704 |
| Net realized gain (loss) | 10,431 | 24,573 |
| Change in net unrealized appreciation (depreciation) | 49,095 | (70,157) |
| Net increase (decrease) in net assets resulting from operations | 62,384 | (36,880) |
| Distributions to shareholders from net investment income | – | (8,470) |
| Distributions to shareholders from net realized gain | (13,224) | (52,618) |
| Total distributions | (13,224) | (61,088) |
| Share transactions - net increase (decrease) | 15,706 | 273,688 |
| Total increase (decrease) in net assets | 64,866 | 175,720 |
| Net Assets | ||
| Beginning of period | 943,186 | 767,466 |
| End of period | $1,008,052 | $943,186 |
| Other Information | ||
| Undistributed net investment income end of period | $2,858 | $– |
See accompanying notes which are an integral part of the financial statements.
Financial Highlights — Fidelity Multi-Manager 2040 Fund
| Six months ended (Unaudited) September 30, | Years ended March 31, | ||||
| 2016 | 2016 | 2015 | 2014 | 2013 A | |
| Selected Per–Share Data | |||||
| Net asset value, beginning of period | $10.37 | $11.65 | $11.80 | $10.57 | $10.00 |
| Income from Investment Operations | |||||
| Net investment income (loss)B | .03 | .11 | .15 | .15 | .06 |
| Net realized and unrealized gain (loss) | .70 | (.58) | .63 | 1.39 | .51 |
| Total from investment operations | .73 | (.47) | .78 | 1.54 | .57 |
| Distributions from net investment income | – | (.10) | (.15) | (.14) | – |
| Distributions from net realized gain | (.15) | (.71) | (.77) | (.17) | – |
| Total distributions | (.15) | (.81) | (.93)C | (.31) | – |
| Net asset value, end of period | $10.95 | $10.37 | $11.65 | $11.80 | $10.57 |
| Total ReturnD,E | 7.11% | (4.35)% | 6.81% | 14.75% | 5.70% |
| Ratios to Average Net AssetsF,G | |||||
| Expenses before reductions | .22%H | .21% | .23% | .21% | .21%H |
| Expenses net of fee waivers, if any | .10%H | .10% | .10% | .10% | .10%H |
| Expenses net of all reductions | .10%H | .10% | .10% | .10% | .10%H |
| Net investment income (loss) | .63%H | 1.06% | 1.28% | 1.32% | 2.04%H |
| Supplemental Data | |||||
| Net assets, end of period (000 omitted) | $791 | $730 | $544 | $307 | $106 |
| Portfolio turnover rateG | 49%H | 18% | 24% | 54% | 1%I |
A For the period December 20, 2012 (commencement of operations) to March 31, 2013.
B Calculated based on average shares outstanding during the period.
C Total distributions of $.93 per share is comprised of distributions from net investment income of $.154 and distributions from net realized gain of $.772 per share.
D Total returns for periods of less than one year are not annualized.
E Total returns would have been lower if certain expenses had not been reduced during the applicable periods shown.
F Expense ratios reflect operating expenses of the class. Expenses before reductions do not reflect amounts reimbursed by the investment adviser or reductions from expense offset arrangements and do not represent the amount paid by the class during periods when reimbursements or reductions occur. Expense ratios before reductions for start-up periods may not be representative of longer-term operating periods. Expenses net of fee waivers reflect expenses after reimbursement by the investment adviser but prior to reductions from expense offset arrangements. Expenses net of all reductions represent the net expenses paid by the class but do not include expenses of the underlying funds in which the Fund invests.
G Amounts do not include the activity of the Underlying Funds.
H Annualized
I Amount not annualized.
See accompanying notes which are an integral part of the financial statements.
Financial Highlights — Fidelity Multi-Manager 2040 Fund Class L
| Six months ended (Unaudited) September 30, | Years ended March 31, | |||
| 2016 | 2016 | 2015 | 2014 A | |
| Selected Per–Share Data | ||||
| Net asset value, beginning of period | $10.37 | $11.65 | $11.79 | $11.49 |
| Income from Investment Operations | ||||
| Net investment income (loss)B | .03 | .11 | .15 | .07 |
| Net realized and unrealized gain (loss) | .70 | (.58) | .63 | .44 |
| Total from investment operations | .73 | (.47) | .78 | .51 |
| Distributions from net investment income | – | (.10) | (.15) | (.09) |
| Distributions from net realized gain | (.15) | (.71) | (.77) | (.13) |
| Total distributions | (.15) | (.81) | (.92) | (.21)C |
| Net asset value, end of period | $10.95 | $10.37 | $11.65 | $11.79 |
| Total ReturnD,E | 7.11% | (4.36)% | 6.87% | 4.50% |
| Ratios to Average Net AssetsF,G | ||||
| Expenses before reductions | .10%H | .11% | .13% | .12%H |
| Expenses net of fee waivers, if any | .10%H | .10% | .10% | .10%H |
| Expenses net of all reductions | .10%H | .10% | .10% | .10%H |
| Net investment income (loss) | .63%H | 1.06% | 1.28% | 2.03%H |
| Supplemental Data | ||||
| Net assets, end of period (000 omitted) | $109 | $107 | $112 | $105 |
| Portfolio turnover rateG | 49%H | 18% | 24% | 54% |
A For the period December 4, 2013 (commencement of sale of shares) to March 31, 2014.
B Calculated based on average shares outstanding during the period.
C Total distributions of $.21 per share is comprised of distributions from net investment income of $.088 and distributions from net realized gain of $.126 per share.
D Total returns for periods of less than one year are not annualized.
E Total returns would have been lower if certain expenses had not been reduced during the applicable periods shown.
F Expense ratios reflect operating expenses of the class. Expenses before reductions do not reflect amounts reimbursed by the investment adviser or reductions from expense offset arrangements and do not represent the amount paid by the class during periods when reimbursements or reductions occur. Expenses net of fee waivers reflect expenses after reimbursement by the investment adviser but prior to reductions from expense offset arrangements. Expenses net of all reductions represent the net expenses paid by the class but do not include expenses of the underlying funds in which the Fund invests.
G Amounts do not include the activity of the Underlying Funds.
H Annualized
See accompanying notes which are an integral part of the financial statements.
Financial Highlights — Fidelity Multi-Manager 2040 Fund Class N
| Six months ended (Unaudited) September 30, | Years ended March 31, | |||
| 2016 | 2016 | 2015 | 2014 A | |
| Selected Per–Share Data | ||||
| Net asset value, beginning of period | $10.36 | $11.64 | $11.79 | $11.49 |
| Income from Investment Operations | ||||
| Net investment income (loss)B | .02 | .09 | .12 | .07 |
| Net realized and unrealized gain (loss) | .70 | (.59) | .62 | .44 |
| Total from investment operations | .72 | (.50) | .74 | .51 |
| Distributions from net investment income | – | (.08) | (.12) | (.09) |
| Distributions from net realized gain | (.15) | (.70) | (.77) | (.13) |
| Total distributions | (.15) | (.78) | (.89) | (.21)C |
| Net asset value, end of period | $10.93 | $10.36 | $11.64 | $11.79 |
| Total ReturnD,E | 7.02% | (4.60)% | 6.53% | 4.49% |
| Ratios to Average Net AssetsF,G | ||||
| Expenses before reductions | .36%H | .36% | .38% | .38%H |
| Expenses net of fee waivers, if any | .35%H | .35% | .35% | .35%H |
| Expenses net of all reductions | .35%H | .35% | .35% | .35%H |
| Net investment income (loss) | .38%H | .81% | 1.03% | 1.79%H |
| Supplemental Data | ||||
| Net assets, end of period (000 omitted) | $108 | $106 | $111 | $104 |
| Portfolio turnover rateG | 49%H | 18% | 24% | 54% |
A For the period December 4, 2013 (commencement of sale of shares) to March 31, 2014.
B Calculated based on average shares outstanding during the period.
C Total distributions of $.21 per share is comprised of distributions from net investment income of $.086 and distributions from net realized gain of $.126 per share.
D Total returns for periods of less than one year are not annualized.
E Total returns would have been lower if certain expenses had not been reduced during the applicable periods shown.
F Expense ratios reflect operating expenses of the class. Expenses before reductions do not reflect amounts reimbursed by the investment adviser or reductions from expense offset arrangements and do not represent the amount paid by the class during periods when reimbursements or reductions occur. Expenses net of fee waivers reflect expenses after reimbursement by the investment adviser but prior to reductions from expense offset arrangements. Expenses net of all reductions represent the net expenses paid by the class but do not include expenses of the underlying funds in which the Fund invests.
G Amounts do not include the activity of the Underlying Funds.
H Annualized
See accompanying notes which are an integral part of the financial statements.
Fidelity® Multi-Manager 2045 Fund
Investment Summary (Unaudited)
The information in the following tables is based on the direct investments of the Fund.Top Holdings as of September 30, 2016
| % of fund's net assets | % of fund's net assets 6 months ago | |
| Strategic Advisers International Multi-Manager Fund Class F | 20.7 | 20.2 |
| Strategic Advisers Core Multi-Manager Fund Class F | 18.6 | 19.1 |
| Strategic Advisers Value Multi-Manager Fund Class F | 18.6 | 19.1 |
| Strategic Advisers Growth Multi-Manager Fund Class F | 15.7 | 16.0 |
| Strategic Advisers Emerging Markets Fund of Funds Class F | 10.0 | 9.4 |
| Strategic Advisers Small-Mid Cap Multi-Manager Fund Class F | 9.4 | 9.6 |
| Strategic Advisers Income Opportunities Fund of Funds Class F | 2.8 | 2.9 |
| Fidelity Series Commodity Strategy Fund Class F | 1.7 | 1.3 |
| Fidelity Series Emerging Markets Debt Fund Class F | 0.7 | 0.6 |
| Fidelity Series Inflation-Protected Bond Index Fund Class F | 0.6 | 0.5 |
| 98.8 | 98.7 |
Asset Allocation (% of fund's net assets)
| Period end | ||
| Domestic Equity Funds | 64.0% | |
| International Equity Funds | 30.7% | |
| Bond Funds | 5.3% | |

| Six months ago | ||
| Domestic Equity Funds | 65.1% | |
| International Equity Funds | 29.6% | |
| Bond Funds | 5.3% | |

Domestic Equity Funds category includes Fidelity Series Commodity Strategy Fund which invests in commodity-related investments.
Fidelity® Multi-Manager 2045 Fund
Investments September 30, 2016 (Unaudited)
Showing Percentage of Net Assets
| Domestic Equity Funds - 64.0% | |||
| Shares | Value | ||
| Fidelity Series Commodity Strategy Fund Class F (a)(b) | 5,599 | $29,956 | |
| Strategic Advisers Core Multi-Manager Fund Class F (b) | 27,362 | 326,424 | |
| Strategic Advisers Growth Multi-Manager Fund Class F (b) | 20,927 | 273,931 | |
| Strategic Advisers Small-Mid Cap Multi-Manager Fund Class F (b) | 15,195 | 164,405 | |
| Strategic Advisers Value Multi-Manager Fund Class F (b) | 23,951 | 326,217 | |
| TOTAL DOMESTIC EQUITY FUNDS | |||
| (Cost $1,157,224) | 1,120,933 | ||
| International Equity Funds - 30.7% | |||
| Strategic Advisers Emerging Markets Fund of Funds Class F (b) | 18,683 | 175,437 | |
| Strategic Advisers International Multi-Manager Fund Class F (b) | 31,499 | 362,874 | |
| TOTAL INTERNATIONAL EQUITY FUNDS | |||
| (Cost $540,972) | 538,311 | ||
| Bond Funds - 5.3% | |||
| Fidelity Series Emerging Markets Debt Fund Class F (b) | 1,125 | 11,658 | |
| Fidelity Series Floating Rate High Income Fund Class F (b) | 464 | 4,367 | |
| Fidelity Series Inflation-Protected Bond Index Fund Class F (b) | 1,047 | 10,549 | |
| Fidelity Series Real Estate Income Fund Class F (b) | 767 | 8,602 | |
| Strategic Advisers Core Income Multi-Manager Fund Class F (b) | 868 | 8,785 | |
| Strategic Advisers Income Opportunities Fund of Funds Class F (b) | 4,924 | 48,749 | |
| TOTAL BOND FUNDS | |||
| (Cost $92,953) | 92,710 | ||
| Short-Term Funds - 0.0% | |||
| Fidelity Investments Money Market Government Portfolio Institutional Class 0.31% (b)(c) | 571 | 571 | |
| Fidelity Series Short-Term Credit Fund Class F (b) | 31 | 308 | |
| TOTAL SHORT-TERM FUNDS | |||
| (Cost $877) | 879 | ||
| TOTAL INVESTMENT PORTFOLIO - 100.0% | |||
| (Cost $1,792,026) | 1,752,833 | ||
| NET OTHER ASSETS (LIABILITIES) - 0.0% | (155) | ||
| NET ASSETS - 100% | $1,752,678 |
Legend
(a) Non-income producing
(b) Affiliated Fund
(c) The rate quoted is the annualized seven-day yield of the fund at period end.
Affiliated Underlying Funds
Information regarding the Fund's fiscal year to date purchases and sales of the affiliated Underlying Funds and income earned by the Fund from investments in affiliated Underlying Funds is as follows:
| Affiliate | Value, beginning of period | Purchases | Sales Proceeds | Dividend Income | Value, end of period |
| Fidelity Investments Money Market Government Portfolio Institutional Class 0.31% | $471 | $170 | $70 | $-- | $571 |
| Fidelity Series Commodity Strategy Fund Class F | 18,893 | 13,012 | 3,524 | -- | 29,956 |
| Fidelity Series Emerging Markets Debt Fund Class F | 9,450 | 2,667 | 1,354 | 291 | 11,658 |
| Fidelity Series Floating Rate High Income Fund Class F | 3,669 | 1,079 | 564 | 89 | 4,367 |
| Fidelity Series Inflation-Protected Bond Index Fund Class F | 7,681 | 4,067 | 1,370 | 10 | 10,549 |
| Fidelity Series Real Estate Income Fund Class F | 7,270 | 2,388 | 1,276 | 207 | 8,602 |
| Fidelity Series Short-Term Credit Fund Class F | 237 | 116 | 46 | 1 | 308 |
| Strategic Advisers Core Income Multi-Manager Fund Class F | 7,386 | 3,868 | 2,666 | 89 | 8,785 |
| Strategic Advisers Core Multi-Manager Fund Class F | 282,279 | 91,304 | 49,306 | 973 | 326,424 |
| Strategic Advisers Emerging Markets Fund of Funds Class F | 138,627 | 39,623 | 19,372 | -- | 175,437 |
| Strategic Advisers Growth Multi-Manager Fund Class F | 235,538 | 78,026 | 41,998 | 735 | 273,931 |
| Strategic Advisers Income Opportunities Fund of Funds Class F | 42,627 | 9,541 | 6,263 | 1,236 | 48,749 |
| Strategic Advisers International Multi-Manager Fund Class F | 297,517 | 92,660 | 44,311 | -- | 362,874 |
| Strategic Advisers Small-Mid Cap Multi-Manager Fund Class F | 141,368 | 35,637 | 26,491 | -- | 164,405 |
| Strategic Advisers Value Multi-Manager Fund Class F | 281,995 | 83,409 | 46,363 | 2,063 | 326,217 |
| Total | $1,475,008 | $457,567 | $244,974 | $5,694 | $1,752,833 |
Investment Valuation
All investments are categorized as Level 1 under the Fair Value Hierarchy. The inputs or methodology used for valuing securities may not be an indication of the risk associated with investing in those securities. For more information on valuation inputs please refer to the Investment Valuation section in the accompanying Notes to Financial Statements.
See accompanying notes which are an integral part of the financial statements.
Fidelity® Multi-Manager 2045 Fund
Financial Statements
Statement of Assets and Liabilities
| September 30, 2016 (Unaudited) | ||
| Assets | ||
| Investment in securities, at value (cost $1,792,026) — See accompanying schedule | $1,752,833 | |
| Receivable for investments sold | 1,392 | |
| Receivable for fund shares sold | 13,384 | |
| Receivable from investment adviser for expense reductions | 116 | |
| Total assets | 1,767,725 | |
| Liabilities | ||
| Payable for investments purchased | $14,781 | |
| Distribution and service plan fees payable | 22 | |
| Other affiliated payables | 244 | |
| Total liabilities | 15,047 | |
| Net Assets | $1,752,678 | |
| Net Assets consist of: | ||
| Paid in capital | $1,786,690 | |
| Undistributed net investment income | 4,772 | |
| Accumulated undistributed net realized gain (loss) on investments | 409 | |
| Net unrealized appreciation (depreciation) on investments | (39,193) | |
| Net Assets | $1,752,678 | |
| Multi-Manager 2045: | ||
| Net Asset Value, offering price and redemption price per share ($1,535,600 ÷ 137,509 shares) | $11.17 | |
| Class L: | ||
| Net Asset Value, offering price and redemption price per share ($108,920 ÷ 9,752 shares) | $11.17 | |
| Class N: | ||
| Net Asset Value, offering price and redemption price per share ($108,158 ÷ 9,700 shares) | $11.15 |
See accompanying notes which are an integral part of the financial statements.
Statement of Operations
| Six months ended September 30, 2016 (Unaudited) | ||
| Investment Income | ||
| Income distributions from underlying funds | $5,694 | |
| Expenses | ||
| Transfer agent fees | $1,421 | |
| Distribution and service plan fees | 131 | |
| Independent trustees' fees and expenses | 3 | |
| Total expenses before reductions | 1,555 | |
| Expense reductions | (633) | 922 |
| Net investment income (loss) | 4,772 | |
| Realized and Unrealized Gain (Loss) | ||
| Realized gain (loss) on sale of underlying fund shares | 312 | |
| Capital gain distributions from underlying funds | 36,340 | |
| Total net realized gain (loss) | 36,652 | |
| Change in net unrealized appreciation (depreciation) on underlying funds | 64,919 | |
| Net gain (loss) | 101,571 | |
| Net increase (decrease) in net assets resulting from operations | $106,343 |
See accompanying notes which are an integral part of the financial statements.
Statement of Changes in Net Assets
| Six months ended September 30, 2016 (Unaudited) | Year ended March 31, 2016 | |
| Increase (Decrease) in Net Assets | ||
| Operations | ||
| Net investment income (loss) | $4,772 | $14,454 |
| Net realized gain (loss) | 36,652 | 18,047 |
| Change in net unrealized appreciation (depreciation) | 64,919 | (93,334) |
| Net increase (decrease) in net assets resulting from operations | 106,343 | (60,833) |
| Distributions to shareholders from net investment income | – | (14,640) |
| Distributions to shareholders from net realized gain | (18,309) | (69,085) |
| Total distributions | (18,309) | (83,725) |
| Share transactions - net increase (decrease) | 189,780 | 452,162 |
| Total increase (decrease) in net assets | 277,814 | 307,604 |
| Net Assets | ||
| Beginning of period | 1,474,864 | 1,167,260 |
| End of period | $1,752,678 | $1,474,864 |
| Other Information | ||
| Undistributed net investment income end of period | $4,772 | $– |
See accompanying notes which are an integral part of the financial statements.
Financial Highlights — Fidelity Multi-Manager 2045 Fund
| Six months ended (Unaudited) September 30, | Years ended March 31, | ||||
| 2016 | 2016 | 2015 | 2014 | 2013 A | |
| Selected Per–Share Data | |||||
| Net asset value, beginning of period | $10.55 | $11.73 | $11.83 | $10.59 | $10.00 |
| Income from Investment Operations | |||||
| Net investment income (loss)B | .03 | .12 | .15 | .15 | .06 |
| Net realized and unrealized gain (loss) | .72 | (.61) | .64 | 1.42 | .53 |
| Total from investment operations | .75 | (.49) | .79 | 1.57 | .59 |
| Distributions from net investment income | – | (.11) | (.15) | (.15) | – |
| Distributions from net realized gain | (.13) | (.59) | (.74) | (.19) | – |
| Total distributions | (.13) | (.69)C | (.89) | (.33)D | – |
| Net asset value, end of period | $11.17 | $10.55 | $11.73 | $11.83 | $10.59 |
| Total ReturnE,F | 7.20% | (4.40)% | 6.88% | 15.00% | 5.90% |
| Ratios to Average Net AssetsG,H | |||||
| Expenses before reductions | .19%I | .20% | .25% | .25% | .21%I |
| Expenses net of fee waivers, if any | .10%I | .10% | .10% | .10% | .10%I |
| Expenses net of all reductions | .10%I | .10% | .10% | .10% | .10%I |
| Net investment income (loss) | .62%I | 1.09% | 1.23% | 1.34% | 2.05%I |
| Supplemental Data | |||||
| Net assets, end of period (000 omitted) | $1,536 | $1,262 | $944 | $331 | $106 |
| Portfolio turnover rateG | 31%I | 23% | 16% | 38% | 1%J |
A For the period December 20, 2012 (commencement of operations) to March 31, 2013.
B Calculated based on average shares outstanding during the period.
C Total distributions of $.69 per share is comprised of distributions from net investment income of $.107 and distributions from net realized gain of $.587 per share.
D Total distributions of $.33 per share is comprised of distributions from net investment income of $.146 and distributions from net realized gain of $.187 per share.
E Total returns for periods of less than one year are not annualized.
F Total returns would have been lower if certain expenses had not been reduced during the applicable periods shown.
G Amounts do not include the activity of the Underlying Funds.
H Expense ratios reflect operating expenses of the class. Expenses before reductions do not reflect amounts reimbursed by the investment adviser or reductions from expense offset arrangements and do not represent the amount paid by the class during periods when reimbursements or reductions occur. Expense ratios before reductions for start-up periods may not be representative of longer-term operating periods. Expenses net of fee waivers reflect expenses after reimbursement by the investment adviser but prior to reductions from expense offset arrangements. Expenses net of all reductions represent the net expenses paid by the class but do not include expenses of the underlying funds in which the Fund invests.
I Annualized
J Amount not annualized.
See accompanying notes which are an integral part of the financial statements.
Financial Highlights — Fidelity Multi-Manager 2045 Fund Class L
| Six months ended (Unaudited) September 30, | Years ended March 31, | |||
| 2016 | 2016 | 2015 | 2014 A | |
| Selected Per–Share Data | ||||
| Net asset value, beginning of period | $10.56 | $11.73 | $11.83 | $11.54 |
| Income from Investment Operations | ||||
| Net investment income (loss)B | .03 | .12 | .15 | .07 |
| Net realized and unrealized gain (loss) | .71 | (.60) | .63 | .45 |
| Total from investment operations | .74 | (.48) | .78 | .52 |
| Distributions from net investment income | – | (.11) | (.14) | (.09) |
| Distributions from net realized gain | (.13) | (.59) | (.74) | (.14) |
| Total distributions | (.13) | (.69)C | (.88) | (.23) |
| Net asset value, end of period | $11.17 | $10.56 | $11.73 | $11.83 |
| Total ReturnD,E | 7.10% | (4.33)% | 6.85% | 4.51% |
| Ratios to Average Net AssetsF,G | ||||
| Expenses before reductions | .10%H | .10% | .12% | .12%H |
| Expenses net of fee waivers, if any | .10%H | .10% | .10% | .10%H |
| Expenses net of all reductions | .10%H | .10% | .10% | .10%H |
| Net investment income (loss) | .62%H | 1.09% | 1.23% | 1.94%H |
| Supplemental Data | ||||
| Net assets, end of period (000 omitted) | $109 | $107 | $112 | $105 |
| Portfolio turnover rateF | 31%H | 23% | 16% | 38% |
A For the period December 4, 2013 (commencement of sale of shares) to March 31, 2014.
B Calculated based on average shares outstanding during the period.
C Total distributions of $.69 per share is comprised of distributions from net investment income of $.105 and distributions from net realized gain of $.587 per share.
D Total returns for periods of less than one year are not annualized.
E Total returns would have been lower if certain expenses had not been reduced during the applicable periods shown.
F Amounts do not include the activity of the Underlying Funds.
G Expense ratios reflect operating expenses of the class. Expenses before reductions do not reflect amounts reimbursed by the investment adviser or reductions from expense offset arrangements and do not represent the amount paid by the class during periods when reimbursements or reductions occur. Expenses net of fee waivers reflect expenses after reimbursement by the investment adviser but prior to reductions from expense offset arrangements. Expenses net of all reductions represent the net expenses paid by the class but do not include expenses of the underlying funds in which the Fund invests.
H Annualized
See accompanying notes which are an integral part of the financial statements.
Financial Highlights — Fidelity Multi-Manager 2045 Fund Class N
| Six months ended (Unaudited) September 30, | Years ended March 31, | |||
| 2016 | 2016 | 2015 | 2014 A | |
| Selected Per–Share Data | ||||
| Net asset value, beginning of period | $10.55 | $11.73 | $11.82 | $11.54 |
| Income from Investment Operations | ||||
| Net investment income (loss)B | .02 | .09 | .12 | .06 |
| Net realized and unrealized gain (loss) | .71 | (.60) | .65 | .45 |
| Total from investment operations | .73 | (.51) | .77 | .51 |
| Distributions from net investment income | – | (.08) | (.12) | (.09) |
| Distributions from net realized gain | (.13) | (.58) | (.74) | (.14) |
| Total distributions | (.13) | (.67)C | (.86) | (.23) |
| Net asset value, end of period | $11.15 | $10.55 | $11.73 | $11.82 |
| Total ReturnD,E | 6.98% | (4.65)% | 6.68% | 4.41% |
| Ratios to Average Net AssetsF,G | ||||
| Expenses before reductions | .35%H | .35% | .37% | .38%H |
| Expenses net of fee waivers, if any | .35%H | .35% | .35% | .35%H |
| Expenses net of all reductions | .35%H | .35% | .35% | .35%H |
| Net investment income (loss) | .37%H | .84% | .98% | 1.70%H |
| Supplemental Data | ||||
| Net assets, end of period (000 omitted) | $108 | $106 | $111 | $104 |
| Portfolio turnover rateF | 31%H | 23% | 16% | 38% |
A For the period December 4, 2013 (commencement of sale of shares) to March 31, 2014.
B Calculated based on average shares outstanding during the period.
C Total distributions of $.67 per share is comprised of distributions from net investment income of $.084 and distributions from net realized gain of $.581 per share.
D Total returns for periods of less than one year are not annualized.
E Total returns would have been lower if certain expenses had not been reduced during the applicable periods shown.
F Amounts do not include the activity of the Underlying Funds.
G Expense ratios reflect operating expenses of the class. Expenses before reductions do not reflect amounts reimbursed by the investment adviser or reductions from expense offset arrangements and do not represent the amount paid by the class during periods when reimbursements or reductions occur. Expenses net of fee waivers reflect expenses after reimbursement by the investment adviser but prior to reductions from expense offset arrangements. Expenses net of all reductions represent the net expenses paid by the class but do not include expenses of the underlying funds in which the Fund invests.
H Annualized
See accompanying notes which are an integral part of the financial statements.
Fidelity® Multi-Manager 2050 Fund
Investment Summary (Unaudited)
The information in the following tables is based on the direct investments of the Fund.Top Holdings as of September 30, 2016
| % of fund's net assets | % of fund's net assets 6 months ago | |
| Strategic Advisers International Multi-Manager Fund Class F | 20.7 | 20.2 |
| Strategic Advisers Core Multi-Manager Fund Class F | 18.6 | 19.1 |
| Strategic Advisers Value Multi-Manager Fund Class F | 18.6 | 19.1 |
| Strategic Advisers Growth Multi-Manager Fund Class F | 15.7 | 16.0 |
| Strategic Advisers Emerging Markets Fund of Funds Class F | 10.0 | 9.4 |
| Strategic Advisers Small-Mid Cap Multi-Manager Fund Class F | 9.4 | 9.6 |
| Strategic Advisers Income Opportunities Fund of Funds Class F | 2.8 | 2.9 |
| Fidelity Series Commodity Strategy Fund Class F | 1.7 | 1.3 |
| Fidelity Series Emerging Markets Debt Fund Class F | 0.7 | 0.6 |
| Fidelity Series Inflation-Protected Bond Index Fund Class F | 0.6 | 0.5 |
| 98.8 | 98.7 |
Asset Allocation (% of fund's net assets)
| Period end | ||
| Domestic Equity Funds | 64.0% | |
| International Equity Funds | 30.7% | |
| Bond Funds | 5.3% | |

| Six months ago | ||
| Domestic Equity Funds | 65.1% | |
| International Equity Funds | 29.6% | |
| Bond Funds | 5.3% | |

Domestic Equity Funds category includes Fidelity Series Commodity Strategy Fund which invests in commodity-related investments.
Fidelity® Multi-Manager 2050 Fund
Investments September 30, 2016 (Unaudited)
Showing Percentage of Net Assets
| Domestic Equity Funds - 64.0% | |||
| Shares | Value | ||
| Fidelity Series Commodity Strategy Fund Class F (a)(b) | 4,538 | $24,278 | |
| Strategic Advisers Core Multi-Manager Fund Class F (b) | 22,383 | 267,023 | |
| Strategic Advisers Growth Multi-Manager Fund Class F (b) | 17,135 | 224,295 | |
| Strategic Advisers Small-Mid Cap Multi-Manager Fund Class F (b) | 12,445 | 134,653 | |
| Strategic Advisers Value Multi-Manager Fund Class F (b) | 19,601 | 266,972 | |
| TOTAL DOMESTIC EQUITY FUNDS | |||
| (Cost $941,210) | 917,221 | ||
| International Equity Funds - 30.7% | |||
| Strategic Advisers Emerging Markets Fund of Funds Class F (b) | 15,280 | 143,477 | |
| Strategic Advisers International Multi-Manager Fund Class F (b) | 25,757 | 296,717 | |
| TOTAL INTERNATIONAL EQUITY FUNDS | |||
| (Cost $439,904) | 440,194 | ||
| Bond Funds - 5.3% | |||
| Fidelity Series Emerging Markets Debt Fund Class F (b) | 922 | 9,554 | |
| Fidelity Series Floating Rate High Income Fund Class F (b) | 379 | 3,572 | |
| Fidelity Series Inflation-Protected Bond Index Fund Class F (b) | 845 | 8,520 | |
| Fidelity Series Real Estate Income Fund Class F (b) | 626 | 7,019 | |
| Strategic Advisers Core Income Multi-Manager Fund Class F (b) | 688 | 6,960 | |
| Strategic Advisers Income Opportunities Fund of Funds Class F (b) | 4,038 | 39,975 | |
| TOTAL BOND FUNDS | |||
| (Cost $76,221) | 75,600 | ||
| Short-Term Funds - 0.0% | |||
| Fidelity Investments Money Market Government Portfolio Institutional Class 0.31% (b)(c) | 456 | 456 | |
| Fidelity Series Short-Term Credit Fund Class F (b) | 25 | 248 | |
| TOTAL SHORT-TERM FUNDS | |||
| (Cost $702) | 704 | ||
| TOTAL INVESTMENT PORTFOLIO - 100.0% | |||
| (Cost $1,458,037) | 1,433,719 | ||
| NET OTHER ASSETS (LIABILITIES) - 0.0% | (131) | ||
| NET ASSETS - 100% | $1,433,588 |
Legend
(a) Non-income producing
(b) Affiliated Fund
(c) The rate quoted is the annualized seven-day yield of the fund at period end.
Affiliated Underlying Funds
Information regarding the Fund's fiscal year to date purchases and sales of the affiliated Underlying Funds and income earned by the Fund from investments in affiliated Underlying Funds is as follows:
| Affiliate | Value, beginning of period | Purchases | Sales Proceeds | Dividend Income | Value, end of period |
| Fidelity Investments Money Market Government Portfolio Institutional Class 0.31% | $431 | $123 | $98 | $-- | $456 |
| Fidelity Series Commodity Strategy Fund Class F | 17,336 | 9,337 | 3,709 | -- | 24,278 |
| Fidelity Series Emerging Markets Debt Fund Class F | 8,585 | 1,959 | 1,767 | 253 | 9,554 |
| Fidelity Series Floating Rate High Income Fund Class F | 3,358 | 788 | 736 | 77 | 3,572 |
| Fidelity Series Inflation-Protected Bond Index Fund Class F | 6,986 | 3,250 | 1,865 | 9 | 8,520 |
| Fidelity Series Real Estate Income Fund Class F | 6,605 | 1,789 | 1,568 | 179 | 7,019 |
| Fidelity Series Short-Term Credit Fund Class F | 219 | 88 | 61 | 1 | 248 |
| Strategic Advisers Core Income Multi-Manager Fund Class F | 6,761 | 2,554 | 2,527 | 78 | 6,960 |
| Strategic Advisers Core Multi-Manager Fund Class F | 258,069 | 66,323 | 59,102 | 871 | 267,023 |
| Strategic Advisers Emerging Markets Fund of Funds Class F | 126,946 | 30,439 | 28,167 | -- | 143,477 |
| Strategic Advisers Growth Multi-Manager Fund Class F | 215,609 | 56,205 | 49,508 | 657 | 224,295 |
| Strategic Advisers Income Opportunities Fund of Funds Class F | 39,163 | 6,607 | 8,348 | 1,099 | 39,975 |
| Strategic Advisers International Multi-Manager Fund Class F | 272,269 | 74,504 | 64,295 | -- | 296,717 |
| Strategic Advisers Small-Mid Cap Multi-Manager Fund Class F | 129,729 | 23,762 | 31,102 | -- | 134,653 |
| Strategic Advisers Value Multi-Manager Fund Class F | 258,133 | 58,832 | 56,186 | 1,845 | 266,972 |
| Total | $1,350,199 | $336,560 | $309,039 | $5,069 | $1,433,719 |
Investment Valuation
All investments are categorized as Level 1 under the Fair Value Hierarchy. The inputs or methodology used for valuing securities may not be an indication of the risk associated with investing in those securities. For more information on valuation inputs please refer to the Investment Valuation section in the accompanying Notes to Financial Statements.
See accompanying notes which are an integral part of the financial statements.
Fidelity® Multi-Manager 2050 Fund
Financial Statements
Statement of Assets and Liabilities
| September 30, 2016 (Unaudited) | ||
| Assets | ||
| Investment in securities, at value (cost $1,458,037) — See accompanying schedule | $1,433,719 | |
| Receivable for investments sold | 49,658 | |
| Receivable for fund shares sold | 16,028 | |
| Receivable from investment adviser for expense reductions | 111 | |
| Total assets | 1,499,516 | |
| Liabilities | ||
| Payable for investments purchased | $2,441 | |
| Payable for fund shares redeemed | 63,245 | |
| Distribution and service plan fees payable | 22 | |
| Other affiliated payables | 220 | |
| Total liabilities | 65,928 | |
| Net Assets | $1,433,588 | |
| Net Assets consist of: | ||
| Paid in capital | $1,454,386 | |
| Undistributed net investment income | 4,199 | |
| Accumulated undistributed net realized gain (loss) on investments | (679) | |
| Net unrealized appreciation (depreciation) on investments | (24,318) | |
| Net Assets | $1,433,588 | |
| Multi-Manager 2050: | ||
| Net Asset Value, offering price and redemption price per share ($1,216,540 ÷ 111,108 shares) | $10.95 | |
| Class L: | ||
| Net Asset Value, offering price and redemption price per share ($108,907 ÷ 9,944 shares) | $10.95 | |
| Class N: | ||
| Net Asset Value, offering price and redemption price per share ($108,141 ÷ 9,892 shares) | $10.93 |
See accompanying notes which are an integral part of the financial statements.
Statement of Operations
| Six months ended September 30, 2016 (Unaudited) | ||
| Investment Income | ||
| Income distributions from underlying funds | $5,069 | |
| Expenses | ||
| Transfer agent fees | $1,288 | |
| Distribution and service plan fees | 131 | |
| Independent trustees' fees and expenses | 3 | |
| Total expenses before reductions | 1,422 | |
| Expense reductions | (601) | 821 |
| Net investment income (loss) | 4,248 | |
| Realized and Unrealized Gain (Loss) | ||
| Realized gain (loss) on sale of underlying fund shares | (13,599) | |
| Capital gain distributions from underlying funds | 32,510 | |
| Total net realized gain (loss) | 18,911 | |
| Change in net unrealized appreciation (depreciation) on underlying funds | 69,596 | |
| Net gain (loss) | 88,507 | |
| Net increase (decrease) in net assets resulting from operations | $92,755 |
See accompanying notes which are an integral part of the financial statements.
Statement of Changes in Net Assets
| Six months ended September 30, 2016 (Unaudited) | Year ended March 31, 2016 | |
| Increase (Decrease) in Net Assets | ||
| Operations | ||
| Net investment income (loss) | $4,248 | $12,305 |
| Net realized gain (loss) | 18,911 | 31,574 |
| Change in net unrealized appreciation (depreciation) | 69,596 | (85,853) |
| Net increase (decrease) in net assets resulting from operations | 92,755 | (41,974) |
| Distributions to shareholders from net investment income | (336) | (12,018) |
| Distributions to shareholders from net realized gain | (18,095) | (76,953) |
| Total distributions | (18,431) | (88,971) |
| Share transactions - net increase (decrease) | 9,185 | 302,445 |
| Total increase (decrease) in net assets | 83,509 | 171,500 |
| Net Assets | ||
| Beginning of period | 1,350,079 | 1,178,579 |
| End of period | $1,433,588 | $1,350,079 |
| Other Information | ||
| Undistributed net investment income end of period | $4,199 | $287 |
See accompanying notes which are an integral part of the financial statements.
Financial Highlights — Fidelity Multi-Manager 2050 Fund
| Six months ended (Unaudited) September 30, | Years ended March 31, | ||||
| 2016 | 2016 | 2015 | 2014 | 2013 A | |
| Selected Per–Share Data | |||||
| Net asset value, beginning of period | $10.37 | $11.67 | $11.85 | $10.60 | $10.00 |
| Income from Investment Operations | |||||
| Net investment income (loss)B | .03 | .11 | .15 | .16 | .06 |
| Net realized and unrealized gain (loss) | .70 | (.58) | .63 | 1.43 | .54 |
| Total from investment operations | .73 | (.47) | .78 | 1.59 | .60 |
| Distributions from net investment income | –C | (.11) | (.16) | (.15) | – |
| Distributions from net realized gain | (.15) | (.72) | (.81) | (.19) | – |
| Total distributions | (.15) | (.83) | (.96)D | (.34) | – |
| Net asset value, end of period | $10.95 | $10.37 | $11.67 | $11.85 | $10.60 |
| Total ReturnE,F | 7.13% | (4.38)% | 6.85% | 15.13% | 6.00% |
| Ratios to Average Net AssetsG,H | |||||
| Expenses before reductions | .20%I | .22% | .20% | .20% | .21%I |
| Expenses net of fee waivers, if any | .10%I | .10% | .10% | .10% | .10%I |
| Expenses net of all reductions | .10%I | .10% | .10% | .10% | .10%I |
| Net investment income (loss) | .64%I | 1.06% | 1.28% | 1.38% | 2.04%I |
| Supplemental Data | |||||
| Net assets, end of period (000 omitted) | $1,217 | $1,137 | $956 | $611 | $106 |
| Portfolio turnover rateG | 45%I | 31% | 15% | 21% | 1%J |
A For the period December 20, 2012 (commencement of operations) to March 31, 2013.
B Calculated based on average shares outstanding during the period.
C Amount represents less than $.005 per share.
D Total distributions of $.96 per share is comprised of distributions from net investment income of $.156 and distributions from net realized gain of $.806 per share.
E Total returns for periods of less than one year are not annualized.
F Total returns would have been lower if certain expenses had not been reduced during the applicable periods shown.
G Amounts do not include the activity of the Underlying Funds.
H Expense ratios reflect operating expenses of the class. Expenses before reductions do not reflect amounts reimbursed by the investment adviser or reductions from expense offset arrangements and do not represent the amount paid by the class during periods when reimbursements or reductions occur. Expense ratios before reductions for start-up periods may not be representative of longer-term operating periods. Expenses net of fee waivers reflect expenses after reimbursement by the investment adviser but prior to reductions from expense offset arrangements. Expenses net of all reductions represent the net expenses paid by the class but do not include expenses of the underlying funds in which the Fund invests.
I Annualized
J Amount not annualized.
See accompanying notes which are an integral part of the financial statements.
Financial Highlights — Fidelity Multi-Manager 2050 Fund Class L
| Six months ended (Unaudited) September 30, | Years ended March 31, | |||
| 2016 | 2016 | 2015 | 2014 A | |
| Selected Per–Share Data | ||||
| Net asset value, beginning of period | $10.37 | $11.67 | $11.85 | $11.56 |
| Income from Investment Operations | ||||
| Net investment income (loss)B | .03 | .11 | .15 | .07 |
| Net realized and unrealized gain (loss) | .70 | (.58) | .63 | .45 |
| Total from investment operations | .73 | (.47) | .78 | .52 |
| Distributions from net investment income | –C | (.11) | (.16) | (.09) |
| Distributions from net realized gain | (.15) | (.72) | (.81) | (.15) |
| Total distributions | (.15) | (.83) | (.96)D | (.23)E |
| Net asset value, end of period | $10.95 | $10.37 | $11.67 | $11.85 |
| Total ReturnF,G | 7.12% | (4.39)% | 6.84% | 4.54% |
| Ratios to Average Net AssetsH,I | ||||
| Expenses before reductions | .10%J | .11% | .11% | .11%J |
| Expenses net of fee waivers, if any | .10%J | .10% | .10% | .10%J |
| Expenses net of all reductions | .10%J | .10% | .10% | .10%J |
| Net investment income (loss) | .63%J | 1.05% | 1.28% | 1.99%J |
| Supplemental Data | ||||
| Net assets, end of period (000 omitted) | $109 | $107 | $112 | $105 |
| Portfolio turnover rateH | 45%J | 31% | 15% | 21% |
A For the period December 4, 2013 (commencement of sale of shares) to March 31, 2014.
B Calculated based on average shares outstanding during the period.
C Amount represents less than $.005 per share.
D Total distributions of $.96 per share is comprised of distributions from net investment income of $.156 and distributions from net realized gain of $.806 per share.
E Total distributions of $.23 per share is comprised of distributions from net investment income of $.086 and distributions from net realized gain of $.145 per share.
F Total returns for periods of less than one year are not annualized.
G Total returns would have been lower if certain expenses had not been reduced during the applicable periods shown.
H Amounts do not include the activity of the Underlying Funds.
I Expense ratios reflect operating expenses of the class. Expenses before reductions do not reflect amounts reimbursed by the investment adviser or reductions from expense offset arrangements and do not represent the amount paid by the class during periods when reimbursements or reductions occur. Expenses net of fee waivers reflect expenses after reimbursement by the investment adviser but prior to reductions from expense offset arrangements. Expenses net of all reductions represent the net expenses paid by the class but do not include expenses of the underlying funds in which the Fund invests.
J Annualized
See accompanying notes which are an integral part of the financial statements.
Financial Highlights — Fidelity Multi-Manager 2050 Fund Class N
| Six months ended (Unaudited) September 30, | Years ended March 31, | |||
| 2016 | 2016 | 2015 | 2014 A | |
| Selected Per–Share Data | ||||
| Net asset value, beginning of period | $10.36 | $11.66 | $11.84 | $11.56 |
| Income from Investment Operations | ||||
| Net investment income (loss)B | .02 | .09 | .12 | .06 |
| Net realized and unrealized gain (loss) | .69 | (.59) | .63 | .45 |
| Total from investment operations | .71 | (.50) | .75 | .51 |
| Distributions from net investment income | – | (.09) | (.13)�� | (.08) |
| Distributions from net realized gain | (.14) | (.71) | (.81) | (.15) |
| Total distributions | (.14) | (.80) | (.93)C | (.23) |
| Net asset value, end of period | $10.93 | $10.36 | $11.66 | $11.84 |
| Total ReturnD,E | 6.99% | (4.62)% | 6.57% | 4.43% |
| Ratios to Average Net AssetsF,G | ||||
| Expenses before reductions | .35%H | .36% | .36% | .37%H |
| Expenses net of fee waivers, if any | .35%H | .35% | .35% | .35%H |
| Expenses net of all reductions | .35%H | .35% | .35% | .35%H |
| Net investment income (loss) | .38%H | .80% | 1.03% | 1.74%H |
| Supplemental Data | ||||
| Net assets, end of period (000 omitted) | $108 | $106 | $111 | $104 |
| Portfolio turnover rateF | 45%H | 31% | 15% | 21% |
A For the period December 4, 2013 (commencement of sale of shares) to March 31, 2014.
B Calculated based on average shares outstanding during the period.
C Total distributions of $.93 per share is comprised of distributions from net investment income of $.125 and distributions from net realized gain of $.806 per share.
D Total returns for periods of less than one year are not annualized.
E Total returns would have been lower if certain expenses had not been reduced during the applicable periods shown.
F Amounts do not include the activity of the Underlying Funds.
G Expense ratios reflect operating expenses of the class. Expenses before reductions do not reflect amounts reimbursed by the investment adviser or reductions from expense offset arrangements and do not represent the amount paid by the class during periods when reimbursements or reductions occur. Expenses net of fee waivers reflect expenses after reimbursement by the investment adviser but prior to reductions from expense offset arrangements. Expenses net of all reductions represent the net expenses paid by the class but do not include expenses of the underlying funds in which the Fund invests.
H Annualized
See accompanying notes which are an integral part of the financial statements.
Fidelity® Multi-Manager 2055 Fund
Investment Summary (Unaudited)
The information in the following tables is based on the direct investments of the Fund.Top Holdings as of September 30, 2016
| % of fund's net assets | % of fund's net assets 6 months ago | |
| Strategic Advisers International Multi-Manager Fund Class F | 20.7 | 20.2 |
| Strategic Advisers Core Multi-Manager Fund Class F | 18.6 | 19.1 |
| Strategic Advisers Value Multi-Manager Fund Class F | 18.6 | 19.1 |
| Strategic Advisers Growth Multi-Manager Fund Class F | 15.6 | 16.0 |
| Strategic Advisers Emerging Markets Fund of Funds Class F | 10.0 | 9.4 |
| Strategic Advisers Small-Mid Cap Multi-Manager Fund Class F | 9.4 | 9.6 |
| Strategic Advisers Income Opportunities Fund of Funds Class F | 2.8 | 2.9 |
| Fidelity Series Commodity Strategy Fund Class F | 1.7 | 1.3 |
| Fidelity Series Emerging Markets Debt Fund Class F | 0.7 | 0.6 |
| Fidelity Series Inflation-Protected Bond Index Fund Class F | 0.6 | 0.5 |
| 98.7 | 98.7 |
Asset Allocation (% of fund's net assets)
| Period end | ||
| Domestic Equity Funds | 63.9% | |
| International Equity Funds | 30.7% | |
| Bond Funds | 5.3% | |
| Short-Term Funds | 0.1% | |

| Six months ago | ||
| Domestic Equity Funds | 65.1% | |
| International Equity Funds | 29.6% | |
| Bond Funds | 5.3% | |

Domestic Equity Funds category includes Fidelity Series Commodity Strategy Fund which invests in commodity-related investments.
Fidelity® Multi-Manager 2055 Fund
Investments September 30, 2016 (Unaudited)
Showing Percentage of Net Assets
| Domestic Equity Funds - 63.9% | |||
| Shares | Value | ||
| Fidelity Series Commodity Strategy Fund Class F (a)(b) | 4,590 | $24,556 | |
| Strategic Advisers Core Multi-Manager Fund Class F (b) | 22,702 | 270,830 | |
| Strategic Advisers Growth Multi-Manager Fund Class F (b) | 17,368 | 227,348 | |
| Strategic Advisers Small-Mid Cap Multi-Manager Fund Class F (b) | 12,611 | 136,447 | |
| Strategic Advisers Value Multi-Manager Fund Class F (b) | 19,872 | 270,656 | |
| TOTAL DOMESTIC EQUITY FUNDS | |||
| (Cost $962,197) | 929,837 | ||
| International Equity Funds - 30.7% | |||
| Strategic Advisers Emerging Markets Fund of Funds Class F (b) | 15,466 | 145,223 | |
| Strategic Advisers International Multi-Manager Fund Class F (b) | 26,124 | 300,952 | |
| TOTAL INTERNATIONAL EQUITY FUNDS | |||
| (Cost $448,854) | 446,175 | ||
| Bond Funds - 5.3% | |||
| Fidelity Series Emerging Markets Debt Fund Class F (b) | 942 | 9,762 | |
| Fidelity Series Floating Rate High Income Fund Class F (b) | 385 | 3,627 | |
| Fidelity Series Inflation-Protected Bond Index Fund Class F (b) | 857 | 8,639 | |
| Fidelity Series Real Estate Income Fund Class F (b) | 635 | 7,129 | |
| Strategic Advisers Core Income Multi-Manager Fund Class F (b) | 691 | 6,991 | |
| Strategic Advisers Income Opportunities Fund of Funds Class F (b) | 4,173 | 41,313 | |
| TOTAL BOND FUNDS | |||
| (Cost $78,255) | 77,461 | ||
| Short-Term Funds - 0.1% | |||
| Fidelity Investments Money Market Government Portfolio Institutional Class 0.31% (b)(c) | 465 | 465 | |
| Fidelity Series Short-Term Credit Fund Class F (b) | 25 | 249 | |
| TOTAL SHORT-TERM FUNDS | |||
| (Cost $713) | 714 | ||
| TOTAL INVESTMENT PORTFOLIO - 100.0% | |||
| (Cost $1,490,019) | 1,454,187 | ||
| NET OTHER ASSETS (LIABILITIES) - 0.0% | (136) | ||
| NET ASSETS - 100% | $1,454,051 |
Legend
(a) Non-income producing
(b) Affiliated Fund
(c) The rate quoted is the annualized seven-day yield of the fund at period end.
Affiliated Underlying Funds
Information regarding the Fund's fiscal year to date purchases and sales of the affiliated Underlying Funds and income earned by the Fund from investments in affiliated Underlying Funds is as follows:
| Affiliate | Value, beginning of period | Purchases | Sales Proceeds | Dividend Income | Value, end of period |
| Fidelity Investments Money Market Government Portfolio Institutional Class 0.31% | $439 | $128 | $103 | $-- | $465 |
| Fidelity Series Commodity Strategy Fund Class F | 17,731 | 9,389 | 3,869 | -- | 24,556 |
| Fidelity Series Emerging Markets Debt Fund Class F | 8,817 | 2,102 | 1,930 | 252 | 9,762 |
| Fidelity Series Floating Rate High Income Fund Class F | 3,424 | 847 | 805 | 76 | 3,627 |
| Fidelity Series Inflation-Protected Bond Index Fund Class F | 7,044 | 3,297 | 1,850 | 8 | 8,639 |
| Fidelity Series Real Estate Income Fund Class F | 6,737 | 1,898 | 1,695 | 176 | 7,129 |
| Fidelity Series Short-Term Credit Fund Class F | 211 | 106 | 69 | 1 | 249 |
| Strategic Advisers Core Income Multi-Manager Fund Class F | 6,894 | 2,536 | 2,609 | 76 | 6,991 |
| Strategic Advisers Core Multi-Manager Fund Class F | 263,072 | 70,116 | 64,019 | 846 | 270,830 |
| Strategic Advisers Emerging Markets Fund of Funds Class F | 129,496 | 32,151 | 30,266 | -- | 145,223 |
| Strategic Advisers Growth Multi-Manager Fund Class F | 219,840 | 59,672 | 54,091 | 638 | 227,348 |
| Strategic Advisers Income Opportunities Fund of Funds Class F | 39,820 | 8,287 | 9,326 | 1,097 | 41,313 |
| Strategic Advisers International Multi-Manager Fund Class F | 277,647 | 79,082 | 69,619 | -- | 300,952 |
| Strategic Advisers Small-Mid Cap Multi-Manager Fund Class F | 132,336 | 26,082 | 33,791 | -- | 136,447 |
| Strategic Advisers Value Multi-Manager Fund Class F | 263,199 | 63,221 | 61,654 | 1,793 | 270,656 |
| Total | $1,376,707 | $358,914 | $335,696 | $4,963 | $1,454,187 |
Investment Valuation
All investments are categorized as Level 1 under the Fair Value Hierarchy. The inputs or methodology used for valuing securities may not be an indication of the risk associated with investing in those securities. For more information on valuation inputs please refer to the Investment Valuation section in the accompanying Notes to Financial Statements.
See accompanying notes which are an integral part of the financial statements.
Fidelity® Multi-Manager 2055 Fund
Financial Statements
Statement of Assets and Liabilities
| September 30, 2016 (Unaudited) | ||
| Assets | ||
| Investment in securities, at value (cost $1,490,019) — See accompanying schedule | $1,454,187 | |
| Receivable for investments sold | 48,778 | |
| Receivable for fund shares sold | 16,903 | |
| Receivable from investment adviser for expense reductions | 146 | |
| Total assets | 1,520,014 | |
| Liabilities | ||
| Payable for investments purchased | $2,624 | |
| Payable for fund shares redeemed | 63,063 | |
| Distribution and service plan fees payable | 22 | |
| Other affiliated payables | 254 | |
| Total liabilities | 65,963 | |
| Net Assets | $1,454,051 | |
| Net Assets consist of: | ||
| Paid in capital | $1,488,856 | |
| Undistributed net investment income | 4,151 | |
| Accumulated undistributed net realized gain (loss) on investments | (3,124) | |
| Net unrealized appreciation (depreciation) on investments | (35,832) | |
| Net Assets | $1,454,051 | |
| Multi-Manager 2055: | ||
| Net Asset Value, offering price and redemption price per share ($1,237,043 ÷ 110,895 shares) | $11.16 | |
| Class L: | ||
| Net Asset Value, offering price and redemption price per share ($108,885 ÷ 9,759 shares) | $11.16 | |
| Class N: | ||
| Net Asset Value, offering price and redemption price per share ($108,123 ÷ 9,715 shares) | $11.13 |
See accompanying notes which are an integral part of the financial statements.
Statement of Operations
| Six months ended September 30, 2016 (Unaudited) | ||
| Investment Income | ||
| Income distributions from underlying funds | $4,963 | |
| Expenses | ||
| Transfer agent fees | $1,497 | |
| Distribution and service plan fees | 131 | |
| Independent trustees' fees and expenses | 3 | |
| Total expenses before reductions | 1,631 | |
| Expense reductions | (819) | 812 |
| Net investment income (loss) | 4,151 | |
| Realized and Unrealized Gain (Loss) | ||
| Realized gain (loss) on sale of underlying fund shares | (23,011) | |
| Capital gain distributions from underlying funds | 31,584 | |
| Total net realized gain (loss) | 8,573 | |
| Change in net unrealized appreciation (depreciation) on underlying funds | 77,270 | |
| Net gain (loss) | 85,843 | |
| Net increase (decrease) in net assets resulting from operations | $89,994 |
See accompanying notes which are an integral part of the financial statements.
Statement of Changes in Net Assets
| Six months ended September 30, 2016 (Unaudited) | Year ended March 31, 2016 | |
| Increase (Decrease) in Net Assets | ||
| Operations | ||
| Net investment income (loss) | $4,151 | $12,241 |
| Net realized gain (loss) | 8,573 | 38,291 |
| Change in net unrealized appreciation (depreciation) | 77,270 | (97,832) |
| Net increase (decrease) in net assets resulting from operations | 89,994 | (47,300) |
| Distributions to shareholders from net investment income | – | (11,755) |
| Distributions to shareholders from net realized gain | (18,897) | (69,001) |
| Total distributions | (18,897) | (80,756) |
| Share transactions - net increase (decrease) | 6,374 | 425,655 |
| Total increase (decrease) in net assets | 77,471 | 297,599 |
| Net Assets | ||
| Beginning of period | 1,376,580 | 1,078,981 |
| End of period | $1,454,051 | $1,376,580 |
| Other Information | ||
| Undistributed net investment income end of period | $4,151 | $– |
See accompanying notes which are an integral part of the financial statements.
Financial Highlights — Fidelity Multi-Manager 2055 Fund
| Six months ended (Unaudited) September 30, | Years ended March 31, | ||||
| 2016 | 2016 | 2015 | 2014 | 2013 A | |
| Selected Per–Share Data | |||||
| Net asset value, beginning of period | $10.57 | $11.84 | $11.95 | $10.62 | $10.00 |
| Income from Investment Operations | |||||
| Net investment income (loss)B | .03 | .11 | .15 | .15 | .06 |
| Net realized and unrealized gain (loss) | .72 | (.59) | .64 | 1.50 | .56 |
| Total from investment operations | .75 | (.48) | .79 | 1.65 | .62 |
| Distributions from net investment income | – | (.10) | (.15) | (.14) | – |
| Distributions from net realized gain | (.16) | (.68) | (.75) | (.18) | – |
| Total distributions | (.16) | (.79)C | (.90) | (.32) | – |
| Net asset value, end of period | $11.16 | $10.57 | $11.84 | $11.95 | $10.62 |
| Total ReturnD,E | 7.17% | (4.38)% | 6.83% | 15.67% | 6.20% |
| Ratios to Average Net AssetsF,G | |||||
| Expenses before reductions | .24%H | .25% | .26% | .24% | .21%H |
| Expenses net of fee waivers, if any | .10%H | .10% | .10% | .10% | .10%H |
| Expenses net of all reductions | .10%H | .10% | .10% | .10% | .10%H |
| Net investment income (loss) | .63%H | 1.05% | 1.26% | 1.34% | 1.98%H |
| Supplemental Data | |||||
| Net assets, end of period (000 omitted) | $1,237 | $1,164 | $856 | $357 | $106 |
| Portfolio turnover rateG | 49%H | 15% | 11% | 19% | 1%I |
A For the period December 20, 2012 (commencement of operations) to March 31, 2013.
B Calculated based on average shares outstanding during the period.
C Total distributions of $.79 per share is comprised of distributions from net investment income of $.104 and distributions from net realized gain of $.683 per share.
D Total returns for periods of less than one year are not annualized.
E Total returns would have been lower if certain expenses had not been reduced during the applicable periods shown.
F Expense ratios reflect operating expenses of the class. Expenses before reductions do not reflect amounts reimbursed by the investment adviser or reductions from expense offset arrangements and do not represent the amount paid by the class during periods when reimbursements or reductions occur. Expense ratios before reductions for start-up periods may not be representative of longer-term operating periods. Expenses net of fee waivers reflect expenses after reimbursement by the investment adviser but prior to reductions from expense offset arrangements. Expenses net of all reductions represent the net expenses paid by the class but do not include expenses of the underlying funds in which the Fund invests.
G Amounts do not include the activity of the Underlying Funds.
H Annualized
I Amount not annualized.
See accompanying notes which are an integral part of the financial statements.
Financial Highlights — Fidelity Multi-Manager 2055 Fund Class L
| Six months ended (Unaudited) September 30, | Years ended March 31, | |||
| 2016 | 2016 | 2015 | 2014 A | |
| Selected Per–Share Data | ||||
| Net asset value, beginning of period | $10.57 | $11.84 | $11.95 | $11.64 |
| Income from Investment Operations | ||||
| Net investment income (loss)B | .03 | .12 | .15 | .07 |
| Net realized and unrealized gain (loss) | .72 | (.60) | .64 | .46 |
| Total from investment operations | .75 | (.48) | .79 | .53 |
| Distributions from net investment income | – | (.10) | (.15) | (.08) |
| Distributions from net realized gain | (.16) | (.68) | (.75) | (.14) |
| Total distributions | (.16) | (.79)C | (.90) | (.22) |
| Net asset value, end of period | $11.16 | $10.57 | $11.84 | $11.95 |
| Total ReturnD,E | 7.17% | (4.39)% | 6.81% | 4.54% |
| Ratios to Average Net AssetsF,G | ||||
| Expenses before reductions | .10%H | .11% | .12% | .12%H |
| Expenses net of fee waivers, if any | .10%H | .10% | .10% | .10%H |
| Expenses net of all reductions | .10%H | .10% | .10% | .10%H |
| Net investment income (loss) | .63%H | 1.05% | 1.26% | 1.96%H |
| Supplemental Data | ||||
| Net assets, end of period (000 omitted) | $109 | $107 | $112 | $105 |
| Portfolio turnover rateG | 49%H | 15% | 11% | 19% |
A For the period December 4, 2013 (commencement of sale of shares) to March 31, 2014.
B Calculated based on average shares outstanding during the period.
C Total distributions of $.79 per share is comprised of distributions from net investment income of $.103 and distributions from net realized gain of $.683 per share.
D Total returns for periods of less than one year are not annualized.
E Total returns would have been lower if certain expenses had not been reduced during the applicable periods shown.
F Expense ratios reflect operating expenses of the class. Expenses before reductions do not reflect amounts reimbursed by the investment adviser or reductions from expense offset arrangements and do not represent the amount paid by the class during periods when reimbursements or reductions occur. Expenses net of fee waivers reflect expenses after reimbursement by the investment adviser but prior to reductions from expense offset arrangements. Expenses net of all reductions represent the net expenses paid by the class but do not include expenses of the underlying funds in which the Fund invests.
G Amounts do not include the activity of the Underlying Funds.
H Annualized
See accompanying notes which are an integral part of the financial statements.
Financial Highlights — Fidelity Multi-Manager 2055 Fund Class N
| Six months ended (Unaudited) September 30, | Years ended March 31, | |||
| 2016 | 2016 | 2015 | 2014 A | |
| Selected Per–Share Data | ||||
| Net asset value, beginning of period | $10.56 | $11.83 | $11.94 | $11.64 |
| Income from Investment Operations | ||||
| Net investment income (loss)B | .02 | .09 | .12 | .06 |
| Net realized and unrealized gain (loss) | .71 | (.59) | .64 | .45 |
| Total from investment operations | .73 | (.50) | .76 | .51 |
| Distributions from net investment income | – | (.08) | (.12) | (.08) |
| Distributions from net realized gain | (.16) | (.68) | (.75) | (.14) |
| Total distributions | (.16) | (.77)C | (.87) | (.21)D |
| Net asset value, end of period | $11.13 | $10.56 | $11.83 | $11.94 |
| Total ReturnE,F | 6.99% | (4.57)% | 6.54% | 4.44% |
| Ratios to Average Net AssetsG,H | ||||
| Expenses before reductions | .35%I | .36% | .37% | .38%I |
| Expenses net of fee waivers, if any | .35%I | .35% | .35% | .35%I |
| Expenses net of all reductions | .35%I | .35% | .35% | .35%I |
| Net investment income (loss) | .38%I | .80% | 1.01% | 1.71%I |
| Supplemental Data | ||||
| Net assets, end of period (000 omitted) | $108 | $106 | $111 | $104 |
| Portfolio turnover rateH | 49%I | 15% | 11% | 19% |
A For the period December 4, 2013 (commencement of sale of shares) to March 31, 2014.
B Calculated based on average shares outstanding during the period.
C Total distributions of $.77 per share is comprised of distributions from net investment income of $.082 and distributions from net realized gain of $.683 per share.
D Total distributions of $.21 per share is comprised of distributions from net investment income of $.076 and distributions from net realized gain of $.137 per share.
E Total returns for periods of less than one year are not annualized.
F Total returns would have been lower if certain expenses had not been reduced during the applicable periods shown.
G Expense ratios reflect operating expenses of the class. Expenses before reductions do not reflect amounts reimbursed by the investment adviser or reductions from expense offset arrangements and do not represent the amount paid by the class during periods when reimbursements or reductions occur. Expenses net of fee waivers reflect expenses after reimbursement by the investment adviser but prior to reductions from expense offset arrangements. Expenses net of all reductions represent the net expenses paid by the class but do not include expenses of the underlying funds in which the Fund invests.
H Amounts do not include the activity of the Underlying Funds.
I Annualized
See accompanying notes which are an integral part of the financial statements.
Fidelity® Multi-Manager 2060 Fund
Investment Summary (Unaudited)
The information in the following tables is based on the direct investments of the Fund.Top Holdings as of September 30, 2016
| % of fund's net assets | % of fund's net assets 6 months ago | |
| Strategic Advisers International Multi-Manager Fund Class F | 20.7 | 20.1 |
| Strategic Advisers Core Multi-Manager Fund Class F | 18.6 | 19.1 |
| Strategic Advisers Value Multi-Manager Fund Class F | 18.6 | 19.1 |
| Strategic Advisers Growth Multi-Manager Fund Class F | 15.6 | 16.0 |
| Strategic Advisers Emerging Markets Fund of Funds Class F | 10.0 | 9.4 |
| Strategic Advisers Small-Mid Cap Multi-Manager Fund Class F | 9.4 | 9.6 |
| Strategic Advisers Income Opportunities Fund of Funds Class F | 2.8 | 3.0 |
| Fidelity Series Commodity Strategy Fund Class F | 1.7 | 1.3 |
| Fidelity Series Emerging Markets Debt Fund Class F | 0.7 | 0.6 |
| Fidelity Series Inflation-Protected Bond Index Fund Class F | 0.6 | 0.5 |
| 98.7 | 98.7 |
Asset Allocation (% of fund's net assets)
| Period end | ||
| Domestic Equity Funds | 63.9% | |
| International Equity Funds | 30.7% | |
| Bond Funds | 5.3% | |
| Short-Term Funds | 0.1% | |

| Six months ago | ||
| Domestic Equity Funds | 65.1% | |
| International Equity Funds | 29.5% | |
| Bond Funds | 5.4% | |

Domestic Equity Funds category includes Fidelity Series Commodity Strategy Fund which invests in commodity-related investments.
Fidelity® Multi-Manager 2060 Fund
Investments September 30, 2016 (Unaudited)
Showing Percentage of Net Assets
| Domestic Equity Funds - 63.9% | |||
| Shares | Value | ||
| Fidelity Series Commodity Strategy Fund Class F (a)(b) | 1,705 | $9,121 | |
| Strategic Advisers Core Multi-Manager Fund Class F (b) | 8,334 | 99,427 | |
| Strategic Advisers Growth Multi-Manager Fund Class F (b) | 6,376 | 83,466 | |
| Strategic Advisers Small-Mid Cap Multi-Manager Fund Class F (b) | 4,629 | 50,084 | |
| Strategic Advisers Value Multi-Manager Fund Class F (b) | 7,296 | 99,373 | |
| TOTAL DOMESTIC EQUITY FUNDS | |||
| (Cost $351,071) | 341,471 | ||
| International Equity Funds - 30.7% | |||
| Strategic Advisers Emerging Markets Fund of Funds Class F (b) | 5,673 | 53,268 | |
| Strategic Advisers International Multi-Manager Fund Class F (b) | 9,594 | 110,522 | |
| TOTAL INTERNATIONAL EQUITY FUNDS | |||
| (Cost $166,031) | 163,790 | ||
| Bond Funds - 5.3% | |||
| Fidelity Series Emerging Markets Debt Fund Class F (b) | 340 | 3,520 | |
| Fidelity Series Floating Rate High Income Fund Class F (b) | 141 | 1,329 | |
| Fidelity Series Inflation-Protected Bond Index Fund Class F (b) | 318 | 3,208 | |
| Fidelity Series Real Estate Income Fund Class F (b) | 233 | 2,610 | |
| Strategic Advisers Core Income Multi-Manager Fund Class F (b) | 264 | 2,670 | |
| Strategic Advisers Income Opportunities Fund of Funds Class F (b) | 1,532 | 15,163 | |
| TOTAL BOND FUNDS | |||
| (Cost $28,756) | 28,500 | ||
| Short-Term Funds - 0.1% | |||
| Fidelity Investments Money Market Government Portfolio Institutional Class 0.31% (b)(c) | 171 | 171 | |
| Fidelity Series Short-Term Credit Fund Class F (b) | 9 | 91 | |
| TOTAL SHORT-TERM FUNDS | |||
| (Cost $262) | 262 | ||
| TOTAL INVESTMENT PORTFOLIO - 100.0% | |||
| (Cost $546,120) | 534,023 | ||
| NET OTHER ASSETS (LIABILITIES) - 0.0% | (13) | ||
| NET ASSETS - 100% | $534,010 |
Legend
(a) Non-income producing
(b) Affiliated Fund
(c) The rate quoted is the annualized seven-day yield of the fund at period end.
Affiliated Underlying Funds
Information regarding the Fund's fiscal year to date purchases and sales of the affiliated Underlying Funds and income earned by the Fund from investments in affiliated Underlying Funds is as follows:
| Affiliate | Value, beginning of period | Purchases | Sales Proceeds | Dividend Income | Value, end of period |
| Fidelity Investments Money Market Government Portfolio Institutional Class 0.31% | $157 | $36 | $22 | $-- | $171 |
| Fidelity Series Commodity Strategy Fund Class F | 6,272 | 3,168 | 793 | -- | 9,121 |
| Fidelity Series Emerging Markets Debt Fund Class F | 3,094 | 534 | 397 | 93 | 3,520 |
| Fidelity Series Floating Rate High Income Fund Class F | 1,221 | 213 | 166 | 29 | 1,329 |
| Fidelity Series Inflation-Protected Bond Index Fund Class F | 2,541 | 1,030 | 418 | 3 | 3,208 |
| Fidelity Series Real Estate Income Fund Class F | 2,403 | 512 | 379 | 66 | 2,610 |
| Fidelity Series Short-Term Credit Fund Class F | 78 | 27 | 14 | -- | 91 |
| Strategic Advisers Core Income Multi-Manager Fund Class F | 2,459 | 902 | 755 | 29 | 2,670 |
| Strategic Advisers Core Multi-Manager Fund Class F | 93,978 | 18,636 | 13,867 | 329 | 99,427 |
| Strategic Advisers Emerging Markets Fund of Funds Class F | 46,146 | 8,015 | 6,331 | -- | 53,268 |
| Strategic Advisers Growth Multi-Manager Fund Class F | 78,419 | 16,278 | 11,986 | 247 | 83,466 |
| Strategic Advisers Income Opportunities Fund of Funds Class F | 14,594 | 1,945 | 2,370 | 428 | 15,163 |
| Strategic Advisers International Multi-Manager Fund Class F | 98,771 | 21,158 | 14,970 | -- | 110,522 |
| Strategic Advisers Small-Mid Cap Multi-Manager Fund Class F | 47,067 | 6,246 | 7,863 | -- | 50,084 |
| Strategic Advisers Value Multi-Manager Fund Class F | 93,886 | 16,304 | 13,219 | 695 | 99,373 |
| Total | $491,086 | $95,004 | $73,550 | $1,919 | $534,023 |
Investment Valuation
All investments are categorized as Level 1 under the Fair Value Hierarchy. The inputs or methodology used for valuing securities may not be an indication of the risk associated with investing in those securities. For more information on valuation inputs please refer to the Investment Valuation section in the accompanying Notes to Financial Statements.
See accompanying notes which are an integral part of the financial statements.
Fidelity® Multi-Manager 2060 Fund
Financial Statements
Statement of Assets and Liabilities
| September 30, 2016 (Unaudited) | ||
| Assets | ||
| Investment in securities, at value (cost $546,120) — See accompanying schedule | $534,023 | |
| Cash | 66 | |
| Receivable for investments sold | 13,987 | |
| Receivable for fund shares sold | 4,268 | |
| Receivable from investment adviser for expense reductions | 31 | |
| Total assets | 552,375 | |
| Liabilities | ||
| Payable for investments purchased | $1,032 | |
| Payable for fund shares redeemed | 17,243 | |
| Distribution and service plan fees payable | 21 | |
| Other affiliated payables | 69 | |
| Total liabilities | 18,365 | |
| Net Assets | $534,010 | |
| Net Assets consist of: | ||
| Paid in capital | $537,040 | |
| Undistributed net investment income | 1,539 | |
| Accumulated undistributed net realized gain (loss) on investments | 7,528 | |
| Net unrealized appreciation (depreciation) on investments | (12,097) | |
| Net Assets | $534,010 | |
| Multi-Manager 2060: | ||
| Net Asset Value, offering price and redemption price per share ($329,595 ÷ 33,795 shares) | $9.75 | |
| Class L: | ||
| Net Asset Value, offering price and redemption price per share ($102,484 ÷ 10,505 shares) | $9.76 | |
| Class N: | ||
| Net Asset Value, offering price and redemption price per share ($101,931 ÷ 10,473 shares) | $9.73 |
See accompanying notes which are an integral part of the financial statements.
Statement of Operations
| Six months ended September 30, 2016 (Unaudited) | ||
| Investment Income | ||
| Income distributions from underlying funds | $1,919 | |
| Expenses | ||
| Transfer agent fees | $423 | |
| Distribution and service plan fees | 123 | |
| Independent trustees' fees and expenses | 1 | |
| Total expenses before reductions | 547 | |
| Expense reductions | (167) | 380 |
| Net investment income (loss) | 1,539 | |
| Realized and Unrealized Gain (Loss) | ||
| Realized gain (loss) on sale of underlying fund shares | (3,050) | |
| Capital gain distributions from underlying funds | 12,246 | |
| Total net realized gain (loss) | 9,196 | |
| Change in net unrealized appreciation (depreciation) on underlying funds | 24,605 | |
| Net gain (loss) | 33,801 | |
| Net increase (decrease) in net assets resulting from operations | $35,340 |
See accompanying notes which are an integral part of the financial statements.
Statement of Changes in Net Assets
| Six months ended September 30, 2016 (Unaudited) | Year ended March 31, 2016 | |
| Increase (Decrease) in Net Assets | ||
| Operations | ||
| Net investment income (loss) | $1,539 | $4,003 |
| Net realized gain (loss) | 9,196 | 14,202 |
| Change in net unrealized appreciation (depreciation) | 24,605 | (33,708) |
| Net increase (decrease) in net assets resulting from operations | 35,340 | (15,503) |
| Distributions to shareholders from net investment income | – | (3,886) |
| Distributions to shareholders from net realized gain | (6,755) | (22,886) |
| Total distributions | (6,755) | (26,772) |
| Share transactions - net increase (decrease) | 14,419 | 185,709 |
| Total increase (decrease) in net assets | 43,004 | 143,434 |
| Net Assets | ||
| Beginning of period | 491,006 | 347,572 |
| End of period | $534,010 | $491,006 |
| Other Information | ||
| Undistributed net investment income end of period | $1,539 | $– |
See accompanying notes which are an integral part of the financial statements.
Financial Highlights — Fidelity Multi-Manager 2060 Fund
| Six months ended (Unaudited) September 30, | Years ended March 31, | ||
| 2016 | 2016 | 2015 A | |
| Selected Per–Share Data | |||
| Net asset value, beginning of period | $9.23 | $10.33 | $10.00 |
| Income from Investment Operations | |||
| Net investment income (loss)B | .03 | .10 | .08 |
| Net realized and unrealized gain (loss) | .62 | (.52) | .42 |
| Total from investment operations | .65 | (.42) | .50 |
| Distributions from net investment income | – | (.09) | (.08) |
| Distributions from net realized gain | (.13) | (.60) | (.09) |
| Total distributions | (.13) | (.68)C | (.17) |
| Net asset value, end of period | $9.75 | $9.23 | $10.33 |
| Total ReturnD,E | 7.15% | (4.37)% | 5.02% |
| Ratios to Average Net AssetsF,G | |||
| Expenses before reductions | .19%H | .20% | .15%H |
| Expenses net of fee waivers, if any | .10%H | .10% | .10%H |
| Expenses net of all reductions | .10%H | .10% | .10%H |
| Net investment income (loss) | .65%H | 1.07% | 1.14%H |
| Supplemental Data | |||
| Net assets, end of period (000 omitted) | $330 | $290 | $138 |
| Portfolio turnover rateG | 28%H | 8% | 13%H |
A For the period August 5, 2014 (commencement of operations) to March 31, 2015.
B Calculated based on average shares outstanding during the period.
C Total distributions of $.68 per share is comprised of distributions from net investment income of $.086 and distributions from net realized gain of $.596 per share.
D Total returns for periods of less than one year are not annualized.
E Total returns would have been lower if certain expenses had not been reduced during the applicable periods shown.
F Expense ratios reflect operating expenses of the class. Expenses before reductions do not reflect amounts reimbursed by the investment adviser or reductions from expense offset arrangements and do not represent the amount paid by the class during periods when reimbursements or reductions occur. Expense ratios before reductions for start-up periods may not be representative of longer-term operating periods. Expenses net of fee waivers reflect expenses after reimbursement by the investment adviser but prior to reductions from expense offset arrangements. Expenses net of all reductions represent the net expenses paid by the class but do not include expenses of the underlying funds in which the Fund invests.
G Amounts do not include the activity of the Underlying Funds.
H Annualized
See accompanying notes which are an integral part of the financial statements.
Financial Highlights — Fidelity Multi-Manager 2060 Fund Class L
| Six months ended (Unaudited) September 30, | Years ended March 31, | ||
| 2016 | 2016 | 2015 A | |
| Selected Per–Share Data | |||
| Net asset value, beginning of period | $9.24 | $10.34 | $10.00 |
| Income from Investment Operations | |||
| Net investment income (loss)B | .03 | .10 | .08 |
| Net realized and unrealized gain (loss) | .62 | (.52) | .43 |
| Total from investment operations | .65 | (.42) | .51 |
| Distributions from net investment income | – | (.08) | (.08) |
| Distributions from net realized gain | (.13) | (.60) | (.09) |
| Total distributions | (.13) | (.68) | (.17) |
| Net asset value, end of period | $9.76 | $9.24 | $10.34 |
| Total ReturnC,D | 7.14% | (4.38)% | 5.12% |
| Ratios to Average Net AssetsE,F | |||
| Expenses before reductions | .12%G | .14% | .14%G |
| Expenses net of fee waivers, if any | .10%G | .10% | .10%G |
| Expenses net of all reductions | .10%G | .10% | .10%G |
| Net investment income (loss) | .65%G | 1.08% | 1.13%G |
| Supplemental Data | |||
| Net assets, end of period (000 omitted) | $102 | $100 | $105 |
| Portfolio turnover rateF | 28%G | 8% | 13%G |
A For the period August 5, 2014 (commencement of operations) to March 31, 2015.
B Calculated based on average shares outstanding during the period.
C Total returns for periods of less than one year are not annualized.
D Total returns would have been lower if certain expenses had not been reduced during the applicable periods shown.
E Expense ratios reflect operating expenses of the class. Expenses before reductions do not reflect amounts reimbursed by the investment adviser or reductions from expense offset arrangements and do not represent the amount paid by the class during periods when reimbursements or reductions occur. Expenses net of fee waivers reflect expenses after reimbursement by the investment adviser but prior to reductions from expense offset arrangements. Expenses net of all reductions represent the net expenses paid by the class but do not include expenses of the underlying funds in which the Fund invests.
F Amounts do not include the activity of the Underlying Funds.
G Annualized
See accompanying notes which are an integral part of the financial statements.
Financial Highlights — Fidelity Multi-Manager 2060 Fund Class N
| Six months ended (Unaudited) September 30, | Years ended March 31, | ||
| 2016 | 2016 | 2015 A | |
| Selected Per–Share Data | |||
| Net asset value, beginning of period | $9.23 | $10.33 | $10.00 |
| Income from Investment Operations | |||
| Net investment income (loss)B | .02 | .08 | .06 |
| Net realized and unrealized gain (loss) | .61 | (.52) | .43 |
| Total from investment operations | .63 | (.44) | .49 |
| Distributions from net investment income | – | (.07) | (.07) |
| Distributions from net realized gain | (.13) | (.60) | (.09) |
| Total distributions | (.13) | (.66)C | (.16) |
| Net asset value, end of period | $9.73 | $9.23 | $10.33 |
| Total ReturnD,E | 6.93% | (4.57)% | 4.91% |
| Ratios to Average Net AssetsF,G | |||
| Expenses before reductions | .37%H | .39% | .38%H |
| Expenses net of fee waivers, if any | .35%H | .35% | .35%H |
| Expenses net of all reductions | .35%H | .35% | .35%H |
| Net investment income (loss) | .40%H | .82% | .89%H |
| Supplemental Data | |||
| Net assets, end of period (000 omitted) | $102 | $100 | $105 |
| Portfolio turnover rateG | 28%H | 8% | 13%H |
A For the period August 5, 2014 (commencement of operations) to March 31, 2015.
B Calculated based on average shares outstanding during the period.
C Total distributions of $.66 per share is comprised of distributions from net investment income of $.065 and distributions from net realized gain of $.596 per share.
D Total returns for periods of less than one year are not annualized.
E Total returns would have been lower if certain expenses had not been reduced during the applicable periods shown.
F Expense ratios reflect operating expenses of the class. Expenses before reductions do not reflect amounts reimbursed by the investment adviser or reductions from expense offset arrangements and do not represent the amount paid by the class during periods when reimbursements or reductions occur. Expenses net of fee waivers reflect expenses after reimbursement by the investment adviser but prior to reductions from expense offset arrangements. Expenses net of all reductions represent the net expenses paid by the class but do not include expenses of the underlying funds in which the Fund invests.
G Amounts do not include the activity of the Underlying Funds.
H Annualized
See accompanying notes which are an integral part of the financial statements.
Notes to Financial Statements (Unaudited)
For the period ended September 30, 2016
1. Organization.
Fidelity Multi-Manager Income Fund, Fidelity Multi-Manager 2005 Fund, Fidelity Multi-Manager 2010 Fund, Fidelity Multi-Manager 2015 Fund, Fidelity Multi-Manager 2020 Fund, Fidelity Multi-Manager 2025 Fund, Fidelity Multi-Manager 2030 Fund, Fidelity Multi-Manager 2035 Fund, Fidelity Multi-Manager 2040 Fund, Fidelity Multi-Manager 2045 Fund, Fidelity Multi-Manager 2050 Fund, Fidelity Multi-Manager 2055 Fund and Fidelity Multi-Manager 2060 Fund (the Funds) (formerly Strategic Advisers Multi-Manager Target Date Funds) are funds of Fidelity Boylston Street Trust (the Trust). The Trust is registered under the Investment Company Act of 1940, as amended (the 1940 Act), as an open-end management investment company organized as a Delaware statutory trust. Each Fund is authorized to issue an unlimited number of shares. The Funds invest primarily in affiliated and may also invest in unaffiliated mutual funds (the Underlying Funds). The Funds are available only to certain employer-sponsored retirement plans and certain Fidelity brokerage or mutual fund accounts. Each Fund offers Multi-Manager, Class L and Class N shares, each of which has equal rights as to assets and voting privileges. Each class has exclusive voting rights with respect to matters that affect that class.
2. Significant Accounting Policies.
The financial statements have been prepared in conformity with accounting principles generally accepted in the United States of America (GAAP), which require management to make certain estimates and assumptions at the date of the financial statements. Actual results could differ from those estimates. Subsequent events, if any, through the date that the financial statements were issued have been evaluated in the preparation of the financial statements. The following summarizes the significant accounting policies of the Funds:
Investment Valuation. Investments are valued as of 4:00 p.m. Eastern time on the last calendar day of the period. Each Fund categorizes the inputs to valuation techniques used to value its investments into a disclosure hierarchy consisting of three levels as shown below:
- Level 1 – quoted prices in active markets for identical investments
- Level 2 – other significant observable inputs (including quoted prices for similar investments, interest rates, prepayment speeds, etc.)
- Level 3 – unobservable inputs (including the Fund's own assumptions based on the best information available)
Valuation techniques used to value each Fund's investments by major category are as follows. Investments in the Underlying Funds are valued at their closing net asset value (NAV) each business day and are categorized as Level 1 in the hierarchy.
Investment Transactions and Income. For financial reporting purposes, the Funds' investment holdings and NAV include trades executed through the end of the last business day of the period. The NAV per share for processing shareholder transactions is calculated as of the close of business of the New York Stock Exchange (NYSE), normally 4:00 p.m. Eastern time and includes trades executed through the end of the prior business day. Gains and losses on securities sold are determined on the basis of identified cost. Income and capital gain distributions from the Underlying Funds, if any, are recorded on the ex-dividend date.
Class Allocations and Expenses. Investment income, realized and unrealized capital gains and losses, common expenses of each Fund, and certain fund-level expense reductions, if any, are allocated daily on a pro-rata basis to each class based on the relative net assets of each class to the total net assets of each Fund. Each class differs with respect to transfer agent and distribution and service plan fees incurred. Certain expense reductions may also differ by class. For the reporting period, the allocated portion of income and expenses to each class as a percent of its average net assets may vary due to the timing of recording these transactions in relation to fluctuating net assets of the classes. Expenses directly attributable to a fund are charged to that fund. Expenses attributable to more than one fund are allocated among the respective funds on the basis of relative net assets or other appropriate methods. Expenses included in the accompanying financial statements reflect the expenses of each Fund and do not include any expenses associated with the Underlying Funds. Although not included in each Fund's expenses, each Fund indirectly bears its proportionate share of the Underlying Funds' expenses through the impact of these expenses on each Underlying Fund's NAV. Expense estimates are accrued in the period to which they relate and adjustments are made when actual amounts are known.
Income Tax Information and Distributions to Shareholders. Each year, each Fund intends to qualify as a regulated investment company under Subchapter M of the Internal Revenue Code, including distributing substantially all of its taxable income and realized gains. As a result, no provision for U.S. Federal income taxes is required. Each Fund files a U.S. federal tax return, in addition to state and local tax returns as required. Each Fund's federal income tax returns are subject to examination by the Internal Revenue Service (IRS) for a period of three fiscal years after they are filed. State and local tax returns may be subject to examination for an additional fiscal year depending on the jurisdiction.
Distributions are declared and recorded on the ex-dividend date. Income dividends and capital gain distributions are declared separately for each class. Income and capital gain distributions are determined in accordance with income tax regulations, which may differ from GAAP.
Capital accounts within the financial statements are adjusted for permanent book-tax differences. These adjustments have no impact on net assets or the results of operations. Capital accounts are not adjusted for temporary book-tax differences which will reverse in a subsequent period.
Book-tax differences are primarily due to the short-term gain distributions from the Underlying Funds, losses deferred due to wash sales and excise tax regulations.
The federal tax cost of investment securities and unrealized appreciation (depreciation) as of period end were as follows for each Fund:
| Tax cost | Gross unrealized appreciation | Gross unrealized depreciation | Net unrealized appreciation (depreciation) on securities | |
| Fidelity Multi-Manager Income Fund | $1,358,211 | $24,161 | $(20,440) | $3,721 |
| Fidelity Multi-Manager 2005 Fund | 338,470 | 7,848 | (8,743) | (895) |
| Fidelity Multi-Manager 2010 Fund | 695,403 | 16,144 | (17,598) | (1,454) |
| Fidelity Multi-Manager 2015 Fund | 1,619,775 | 24,957 | (62,901) | (37,944) |
| Fidelity Multi-Manager 2020 Fund | 4,152,037 | 65,573 | (157,795) | (92,222) |
| Fidelity Multi-Manager 2025 Fund | 2,134,462 | 43,572 | (53,854) | (10,282) |
| Fidelity Multi-Manager 2030 Fund | 1,768,899 | 48,010 | (70,183) | (22,173) |
| Fidelity Multi-Manager 2035 Fund | 1,922,585 | 48,362 | (94,534) | (46,172) |
| Fidelity Multi-Manager 2040 Fund | 1,043,078 | 19,730 | (54,655) | (34,925) |
| Fidelity Multi-Manager 2045 Fund | 1,827,247 | 23,766 | (98,180) | (74,414) |
| Fidelity Multi-Manager 2050 Fund | 1,481,440 | 26,412 | (74,133) | (47,721) |
| Fidelity Multi-Manager 2055 Fund | 1,503,070 | 28,378 | (77,261) | (48,883) |
| Fidelity Multi-Manager 2060 Fund | 548,374 | 8,917 | (23,268) | (14,351) |
Certain of the Funds elected to defer to the next fiscal year capital losses recognized during the period November 1, 2015 to March 31, 2016. Loss deferrals were as follows:
| Capital losses | |
| Fidelity Multi-Manager Income Fund | $(5,515) |
| Fidelity Multi-Manager 2005 Fund | (1,356) |
| Fidelity Multi-Manager 2020 Fund | (6,580) |
| Fidelity Multi-Manager 2025 Fund | (475) |
| Fidelity Multi-Manager 2030 Fund | (11,853) |
3. Purchases and Redemptions of Underlying Fund Shares.
Purchases and redemptions of the Underlying Fund shares, are noted in the table below.
| Purchases ($) | Redemptions ($) | |
| Fidelity Multi-Manager Income Fund | 476,497 | 178,588 |
| Fidelity Multi-Manager 2005 Fund | 19,775 | 37,190 |
| Fidelity Multi-Manager 2010 Fund | 171,948 | 283,031 |
| Fidelity Multi-Manager 2015 Fund | 151,894 | 335,611 |
| Fidelity Multi-Manager 2020 Fund | 748,808 | 1,232,395 |
| Fidelity Multi-Manager 2025 Fund | 593,132 | 444,271 |
| Fidelity Multi-Manager 2030 Fund | 409,743 | 198,148 |
| Fidelity Multi-Manager 2035 Fund | 361,777 | 354,806 |
| Fidelity Multi-Manager 2040 Fund | 264,541 | 237,089 |
| Fidelity Multi-Manager 2045 Fund | 457,567 | 244,974 |
| Fidelity Multi-Manager 2050 Fund | 336,560 | 309,039 |
| Fidelity Multi-Manager 2055 Fund | 358,914 | 335,696 |
| Fidelity Multi-Manager 2060 Fund | 95,004 | 73,550 |
4. Fees and Other Transactions with Affiliates.
Management Fee. FMR Co., Inc. (the investment adviser), an affiliate of Fidelity Management & Research Company (FMR) provides the Funds with investment management related services. The Funds do not pay any fees for these services.
Other Transactions. The investment adviser has entered into an administration agreement with FMR under which FMR provides management and administrative services (other than investment advisory services) necessary for the operation of each Fund. Pursuant to this agreement, FMR pays all expenses of each Fund, excluding distribution and service fees, transfer agent fees, compensation of the independent Trustees and certain other expenses such as interest expense. FMR also contracts with other Fidelity companies to perform the services necessary for the operation of each Fund. The Funds do not pay any fees for these services.
Distribution and Service Plan Fees. In accordance with Rule 12b-1 of the 1940 Act, each Fund has adopted separate Distribution and Service Plans for each class of shares. Each Fund's Class N pays Fidelity Distributors Corporation (FDC), an affiliate of the investment adviser, a Service Fee based on an annual percentage of Class N's average net assets. In addition, FDC may pay financial intermediaries for selling shares of the Funds and providing shareholder support services. For the period, the Service Fee rate, total service fees and amounts retained by FDC were as follows:
| Service Fee | Total Fees | Retained by FDC | |
| Fidelity Multi-Manager Income Fund | |||
| Class N | .25% | $ 127 | $ 127 |
| Fidelity Multi-Manager 2005 Fund | |||
| Class N | .25% | $ 129 | $ 129 |
| Fidelity Multi-Manager 2010 Fund | |||
| Class N | .25% | $ 129 | $ 129 |
| Fidelity Multi-Manager 2015 Fund | |||
| Class N | .25% | $ 130 | $ 130 |
| Fidelity Multi-Manager 2020 Fund | |||
| Class N | .25% | $ 130 | $ 130 |
| Fidelity Multi-Manager 2025 Fund | |||
| Class N | .25% | $ 131 | $ 130 |
| Fidelity Multi-Manager 2030 Fund | |||
| Class N | .25% | $ 131 | $ 131 |
| Fidelity Multi-Manager 2035 Fund | |||
| Class N | .25% | $ 131 | $131 |
| Fidelity Multi-Manager 2040 Fund | |||
| Class N | .25% | $ 131 | $131 |
| Fidelity Multi-Manager 2045 Fund | |||
| Class N | .25% | $ 131 | $131 |
| Fidelity Multi-Manager 2050 Fund | |||
| Class N | .25% | $ 131 | $131 |
| Fidelity Multi-Manager 2055 Fund | |||
| Class N | .25% | $ 131 | $131 |
| Fidelity Multi-Manager 2060 Fund | |||
| Class N | .25% | $ 123 | $ 123 |
Transfer Agent Fees. Fidelity Investments Institutional Operations Company, Inc., (FIIOC), an affiliate of the investment adviser, is the transfer, dividend disbursing and shareholder servicing agent for each class of the Funds. FIIOC receives account fees and asset-based fees that vary according to the account size and type of account of the shareholders of the respective classes of each Fund. FIIOC pays for typesetting, printing and mailing of shareholder reports, except proxy statements. For the period, transfer agent fees for each class were as follows:
| Amount | % of Class-Level Average Net Assets(a) | |
| Fidelity Multi-Manager Income Fund | ||
| Multi-Manager Income | $ 270 | .05 |
| Class L | 26 | .05 |
| Class N | 26 | .05 |
| $322 | ||
| Fidelity Multi-Manager 2005 Fund | ||
| Multi-Manager 2005 | $ 43 | .07 |
| Class L | 44 | .08 |
| Class N | 43 | .08 |
| $130 | ||
| Fidelity Multi-Manager 2010 Fund | ||
| Multi-Manager 2010 | $121 | .05 |
| Class L | 30 | .06 |
| Class N | 30 | .06 |
| $181 | ||
| Fidelity Multi-Manager 2015 Fund | ||
| Multi-Manager 2015 | $521 | .08 |
| Class L | 42 | .08 |
| Class N | 42 | .08 |
| $605 | ||
| Fidelity Multi-Manager 2020 Fund | ||
| Multi-Manager 2020 | $1,486 | .08 |
| Class L | 40 | .08 |
| Class N | 40 | .08 |
| $1,566 | ||
| Fidelity Multi-Manager 2025 Fund | ||
| Multi-Manager 2025 | $917 | .11 |
| Class L | 44 | .08 |
| Class N | 44 | .08 |
| $1,005 | ||
| Fidelity Multi-Manager 2030 Fund | ||
| Multi-Manager 2030 | $820 | .12 |
| Class L | 49 | .09 |
| Class N | 48 | .09 |
| $917 | ||
| Fidelity Multi-Manager 2035 Fund | ||
| Multi-Manager 2035 | $1,218 | .15 |
| Class L | 51 | .10 |
| Class N | 51 | .10 |
| $1,320 | ||
| Fidelity Multi-Manager 2040 Fund | ||
| Multi-Manager 2040 | $822 | .22 |
| Class L | 55 | .10 |
| Class N | 55 | .11 |
| $932 | ||
| Fidelity Multi-Manager 2045 Fund | ||
| Multi-Manager 2045 | $1,317 | .19 |
| Class L | 52 | .10 |
| Class N | 52 | .10 |
| $1,421 | ||
| Fidelity Multi-Manager 2050 Fund | ||
| Multi-Manager 2050 | $1,182 | .20 |
| Class L | 53 | .10 |
| Class N | 53 | .10 |
| $1,288 | ||
| Fidelity Multi-Manager 2055 Fund | ||
| Multi-Manager 2055 | $1,392 | .24 |
| Class L | 53 | .10 |
| Class N | 52 | .10 |
| $1,497 | ||
| Fidelity Multi-Manager 2060 Fund | ||
| Multi-Manager 2060 | $304 | .24 |
| Class L | 60 | .10 |
| Class N | 59 | .10 |
| $423 |
(a) Annualized
5. Expense Reductions.
The investment adviser contractually agreed to reimburse funds to the extent annual operating expenses exceeded certain levels of average net assets as noted in the table below. This reimbursement will remain in place through May 31, 2017. Some expenses, for example interest expense, are excluded from this reimbursement.
The following classes of each applicable Fund were in reimbursement during the period:
| Expense Limitations | Reimbursement | |
| Fidelity Multi-Manager 2025 Fund | ||
| Multi-Manager 2025 | .10% | $73 |
| Class L | .10% | – |
| Class N | .35% | – |
| Fidelity Multi-Manager 2030 Fund | ||
| Multi-Manager 2030 | .10% | $121 |
| Class L | .10% | – |
| Class N | .35% | – |
| Fidelity Multi-Manager 2035 Fund | ||
| Multi-Manager 2035 | .10% | $426 |
| Class L | .10% | – |
| Class N | .35% | – |
| Fidelity Multi-Manager 2040 Fund | ||
| Multi-Manager 2040 | .10% | $451 |
| Class L | .10% | 3 |
| Class N | .35% | 3 |
| Fidelity Multi-Manager 2045 Fund | ||
| Multi-Manager 2045 | .10% | $633 |
| Class L | .10% | – |
| Class N | .35% | – |
| Fidelity Multi-Manager 2050 Fund | ||
| Multi-Manager 2050 | .10% | $601 |
| Class L | .10% | – |
| Class N | .35% | – |
| Fidelity Multi-Manager 2055 Fund | ||
| Multi-Manager 2055 | .10% | $819 |
| Class L | .10% | – |
| Class N | .35% | – |
| Fidelity Multi-Manager 2060 Fund | ||
| Multi-Manager 2060 | .10% | $146 |
| Class L | .10% | 11 |
| Class N | .35% | 10 |
6. Distributions to Shareholders.
Distributions to shareholders of each class were as follows:
| Six months ended September 30, 2016 | Year ended March 31, 2016 | |
| Fidelity Multi-Manager Income Fund | ||
| From net investment income | ||
| Multi-Manager Income | $6,457 | $15,176 |
| Class L | 639 | 1,685 |
| Class N | 514 | 1,438 |
| Total | $7,610 | $18,299 |
| From net realized gain | ||
| Multi-Manager Income | $– | $17,414 |
| Class L | – | 1,957 |
| Class N | – | 1,949 |
| Total | $– | $21,320 |
| Fidelity Multi-Manager 2005 Fund | ||
| From net investment income | ||
| Multi-Manager 2005 | $370 | $2,539 |
| Class L | 294 | 1,625 |
| Class N | 222 | 1,352 |
| Total | $886 | $5,516 |
| From net realized gain | ||
| Multi-Manager 2005 | $– | $3,986 |
| Class L | – | 3,076 |
| Class N | – | 3,067 |
| Total | $– | $10,129 |
| Fidelity Multi-Manager 2010 Fund | ||
| From net investment income | ||
| Multi-Manager 2010 | $1,244 | $8,965 |
| Class L | 220 | 1,670 |
| Class N | 159 | 1,391 |
| Total | $1,623 | $12,026 |
| From net realized gain | ||
| Multi-Manager 2010 | $3,957 | $19,386 |
| Class L | 699 | 3,731 |
| Class N | 695 | 3,721 |
| Total | $5,351 | $26,838 |
| Fidelity Multi-Manager 2015 Fund | ||
| From net investment income | ||
| Multi-Manager 2015 | $3,769 | $25,199 |
| Class L | 268 | 1,661 |
| Class N | 207 | 1,394 |
| Total | $4,244 | $28,254 |
| From net realized gain | ||
| Multi-Manager 2015 | $1,536 | $59,222 |
| Class L | 109 | 3,988 |
| Class N | 109 | 3,977 |
| Total | $1,754 | $67,187 |
| Fidelity Multi-Manager 2020 Fund | ||
| From net investment income | ||
| Multi-Manager 2020 | $8,426 | $58,011 |
| Class L | 208 | 1,482 |
| Class N | 148 | 1,217 |
| Total | $8,782 | $60,710 |
| From net realized gain | ||
| Multi-Manager 2020 | $34,909 | $154,346 |
| Class L | 862 | 4,554 |
| Class N | 858 | 4,541 |
| Total | $36,629 | $163,441 |
| Fidelity Multi-Manager 2025 Fund | ||
| From net investment income | ||
| Multi-Manager 2025 | $2,764 | $17,411 |
| Class L | 176 | 1,267 |
| Class N | 117 | 986 |
| Total | $3,057 | $19,664 |
| From net realized gain | ||
| Multi-Manager 2025 | $15,050 | $54,834 |
| Class L | 958 | 5,035 |
| Class N | 953 | 5,021 |
| Total | $16,961 | $64,890 |
| Fidelity Multi-Manager 2030 Fund | ||
| From net investment income | ||
| Multi-Manager 2030 | $1,089 | $11,967 |
| Class L | 91 | 1,265 |
| Class N | 30 | 1,018 |
| Total | $1,210 | $14,250 |
| From net realized gain | ||
| Multi-Manager 2030 | $– | $70,000 |
| Class L | – | 6,838 |
| Class N | – | 6,819 |
| Total | $– | $83,657 |
| Fidelity Multi-Manager 2035 Fund | ||
| From net investment income | ||
| Multi-Manager 2035 | $447 | $12,275 |
| Class L | 29 | 1,013 |
| Class N | – | 803 |
| Total | $476 | $14,091 |
| From net realized gain | ||
| Multi-Manager 2035 | $19,507 | $64,720 |
| Class L | 1,278 | 6,246 |
| Class N | 1,243 | 6,229 |
| Total | $22,028 | $77,195 |
| Fidelity Multi-Manager 2040 Fund | ||
| From net investment income | ||
| Multi-Manager 2040 | $– | $6,618 |
| Class L | – | 1,027 |
| Class N | – | 825 |
| Total | $– | $8,470 |
| From net realized gain | ||
| Multi-Manager 2040 | $10,369 | $38,980 |
| Class L | 1,431 | 6,862 |
| Class N | 1,424 | 6,776 |
| Total | $13,224 | $52,618 |
| Fidelity Multi-Manager 2045 Fund | ||
| From net investment income | ||
| Multi-Manager 2045 | $– | $12,787 |
| Class L | – | 1,031 |
| Class N | – | 822 |
| Total | $– | $14,640 |
| From net realized gain | ||
| Multi-Manager 2045 | $15,840 | $57,849 |
| Class L | 1,252 | 5,654 |
| Class N | 1,217 | 5,582 |
| Total | $18,309 | $69,085 |
| Fidelity Multi-Manager 2050 Fund | ||
| From net investment income | ||
| Multi-Manager 2050 | $316 | $10,018 |
| Class L | 20 | 1,106 |
| Class N | – | 894 |
| Total | $336 | $12,018 |
| From net realized gain | ||
| Multi-Manager 2050 | $15,279 | $63,137 |
| Class L | 1,421 | 6,937 |
| Class N | 1,395 | 6,879 |
| Total | $18,095 | $76,953 |
| Fidelity Multi-Manager 2055 Fund | ||
| From net investment income | ||
| Multi-Manager 2055 | $– | $9,947 |
| Class L | $– | $1,008 |
| Class N | – | 800 |
| Total | $– | $11,755 |
| From net realized gain | ||
| Multi-Manager 2055 | $15,904 | $55,964 |
| Class L | 1,500 | 6,527 |
| Class N | 1,493 | 6,510 |
| Total | $18,897 | $69,001 |
| Fidelity Multi-Manager 2060 Fund | ||
| From net investment income | ||
| Multi-Manager 2060 | $– | $2,311 |
| Class L | – | 888 |
| Class N | – | 687 |
| Total | $– | $3,886 |
| From net realized gain | ||
| Multi-Manager 2060 | $4,067 | $10,623 |
| Class L | 1,346 | 6,135 |
| Class N | 1,342 | 6,128 |
| Total | $6,755 | $22,886 |
7. Share Transactions.
Share transactions for each class were as follows and may contain automatic conversions between classes or exchanges between affiliated funds:
| Shares | Shares | Dollars | Dollars | |
| Six months ended September 30, 2016 | Year ended March 31, 2016 | Six months ended September 30, 2016 | Year ended March 31, 2016 | |
| Fidelity Multi-Manager Income Fund | ||||
| Multi-Manager Income | ||||
| Shares sold | 43,013 | 11,399 | $433,162 | $113,683 |
| Reinvestment of distributions | 639 | 3,251 | 6,457 | 32,590 |
| Shares redeemed | (14,019) | (20,904) | (141,214) | (201,844) |
| Net increase (decrease) | 29,633 | (6,254) | $298,405 | $(55,571) |
| Class L | ||||
| Reinvestment of distributions | 63 | 363 | $639 | $3,642 |
| Shares redeemed | (513) | – | (5,075) | – |
| Net increase (decrease) | (450) | 363 | $(4,436) | $3,642 |
| Class N | ||||
| Reinvestment of distributions | 51 | 338 | $514 | $3,387 |
| Shares redeemed | (511) | – | (5,047) | – |
| Net increase (decrease) | (460) | 338 | $(4,533) | $3,387 |
| Fidelity Multi-Manager 2005 Fund | ||||
| Multi-Manager 2005 | ||||
| Shares sold | 107 | 9,150 | $1,092 | $93,793 |
| Reinvestment of distributions | 37 | 645 | 370 | 6,525 |
| Shares redeemed | (1,331) | (7,808) | (13,545) | (77,985) |
| Net increase (decrease) | (1,187) | 1,987 | $(12,083) | $22,333 |
| Class L | ||||
| Reinvestment of distributions | 29 | 463 | $294 | $4,701 |
| Shares redeemed | (513) | – | (5,090) | – |
| Net increase (decrease) | (484) | 463 | $(4,796) | $4,701 |
| Class N | ||||
| Reinvestment of distributions | 22 | 435 | $222 | $4,419 |
| Shares redeemed | (510) | – | (5,061) | – |
| Net increase (decrease) | (488) | 435 | $(4,839) | $4,419 |
| Fidelity Multi-Manager 2010 Fund | ||||
| Multi-Manager 2010 | ||||
| Shares sold | 12,723 | 10,422 | $130,381 | $110,816 |
| Reinvestment of distributions | 516 | 2,726 | 5,201 | 28,351 |
| Shares redeemed | (23,991) | (7,541) | (244,278) | (79,222) |
| Net increase (decrease) | (10,752) | 5,607 | $(108,696) | $59,945 |
| Class L | ||||
| Reinvestment of distributions | 91 | 519 | $919 | $5,401 |
| Shares redeemed | (505) | – | (5,098) | – |
| Net increase (decrease) | (414) | 519 | $(4,179) | $5,401 |
| Class N | ||||
| Reinvestment of distributions | 85 | 491 | $854 | $5,112 |
| Shares redeemed | (503) | – | (5,069) | – |
| Net increase (decrease) | (418) | 491 | $(4,215) | $5,112 |
| Fidelity Multi-Manager 2015 Fund | ||||
| Multi-Manager 2015 | ||||
| Shares sold | 4,231 | 32,066 | $45,337 | $343,602 |
| Reinvestment of distributions | 520 | 7,990 | 5,305 | 84,421 |
| Shares redeemed | (24,386) | (37,772) | (248,852) | (385,921) |
| Net increase (decrease) | (19,635) | 2,284 | $(198,210) | $42,102 |
| Class L | ||||
| Reinvestment of distributions | 37 | 534 | $377 | $5,649 |
| Shares redeemed | (502) | – | (5,099) | – |
| Net increase (decrease) | (465) | 534 | $(4,722) | $5,649 |
| Class N | ||||
| Reinvestment of distributions | 31 | 507 | $316 | $5,371 |
| Shares redeemed | (500) | – | (5,071) | – |
| Net increase (decrease) | (469) | 507 | $(4,755) | $5,371 |
| Fidelity Multi-Manager 2020 Fund | ||||
| Multi-Manager 2020 | ||||
| Shares sold | 42,021 | 156,312 | $446,947 | $1,694,454 |
| Reinvestment of distributions | 4,265 | 20,068 | 43,335 | 212,357 |
| Shares redeemed | (97,800) | (52,653) | (999,230) | (560,374) |
| Net increase (decrease) | (51,514) | 123,727 | $(508,948) | $1,346,437 |
| Class L | ||||
| Reinvestment of distributions | 105 | 567 | $1,070 | $6,036 |
| Shares redeemed | (501) | – | (5,100) | – |
| Net increase (decrease) | (396) | 567 | $(4,030) | $6,036 |
| Class N | ||||
| Reinvestment of distributions | 99 | 541 | $1,006 | $5,758 |
| Shares redeemed | (499) | – | (5,072) | – |
| Net increase (decrease) | (400) | 541 | $(4,066) | $5,758 |
| Fidelity Multi-Manager 2025 Fund | ||||
| Multi-Manager 2025 | ||||
| Shares sold | 51,928 | 76,777 | $549,421 | $829,793 |
| Reinvestment of distributions | 1,730 | 6,677 | 17,814 | 72,245 |
| Shares redeemed | (40,739) | (4,097) | (432,643) | (43,758) |
| Net increase (decrease) | 12,919 | 79,357 | $134,592 | $858,280 |
| Class L | ||||
| Reinvestment of distributions | 110 | 577 | $1,134 | $6,302 |
| Shares redeemed | (494) | – | (5,111) | – |
| Net increase (decrease) | (384) | 577 | $(3,977) | $6,302 |
| Class N | ||||
| Reinvestment of distributions | 104 | 550 | $1,070 | $6,007 |
| Shares redeemed | (492) | – | (5,082) | – |
| Net increase (decrease) | (388) | 550 | $(4,012) | $6,007 |
| Fidelity Multi-Manager 2030 Fund | ||||
| Multi-Manager 2030 | ||||
| Shares sold | 32,461 | 74,942 | $335,644 | $775,264 |
| Reinvestment of distributions | 108 | 7,670 | 1,089 | 81,967 |
| Shares redeemed | (15,177) | (64,261) | (155,350) | (693,594) |
| Net increase (decrease) | 17,392 | 18,351 | $181,383 | $163,637 |
| Class L | ||||
| Reinvestment of distributions | 9 | 761 | $91 | $8,103 |
| Shares redeemed | (510) | – | (5,088) | – |
| Net increase (decrease) | (501) | 761 | $(4,997) | $8,103 |
| Class N | ||||
| Reinvestment of distributions | 3 | 735 | $30 | $7,837 |
| Shares redeemed | (508) | – | (5,059) | – |
| Net increase (decrease) | (505) | 735 | $(5,029) | $7,837 |
| Fidelity Multi-Manager 2035 Fund | ||||
| Multi-Manager 2035 | ||||
| Shares sold | 28,527 | 77,261 | $303,861 | $824,537 |
| Reinvestment of distributions | 1,949 | 6,983 | 19,954 | 76,995 |
| Shares redeemed | (31,822) | (15,936) | (332,630) | (179,461) |
| Net increase (decrease) | (1,346) | 68,308 | $(8,815) | $722,071 |
| Class L | ||||
| Reinvestment of distributions | 128 | 654 | $1,307 | $7,259 |
| Shares redeemed | (493) | – | (5,068) | – |
| Net increase (decrease) | (365) | 654 | $(3,761) | $7,259 |
| Class N | ||||
| Reinvestment of distributions | 121 | 633 | $1,243 | $7,032 |
| Shares redeemed | (491) | – | (5,040) | – |
| Net increase (decrease) | (370) | 633 | $(3,797) | $7,032 |
| Fidelity Multi-Manager 2040 Fund | ||||
| Multi-Manager 2040 | ||||
| Shares sold | 22,120 | 30,701 | $236,268 | $332,212 |
| Reinvestment of distributions | 1,019 | 4,142 | 10,369 | 45,598 |
| Shares redeemed | (21,332) | (11,151) | (223,678) | (119,612) |
| Net increase (decrease) | 1,807 | 23,692 | $22,959 | $258,198 |
| Class L | ||||
| Reinvestment of distributions | 141 | 713 | $1,431 | $7,889 |
| Shares redeemed | (495) | – | (5,068) | – |
| Net increase (decrease) | (354) | 713 | $(3,637) | $7,889 |
| Class N | ||||
| Reinvestment of distributions | 140 | 687 | $1,424 | $7,601 |
| Shares redeemed | (493) | – | (5,040) | – |
| Net increase (decrease) | (353) | 687 | $(3,616) | $7,601 |
| Fidelity Multi-Manager 2045 Fund | ||||
| Multi-Manager 2045 | ||||
| Shares sold | 41,129 | 58,212 | $445,050 | $630,540 |
| Reinvestment of distributions | 1,526 | 6,357 | 15,840 | 70,636 |
| Shares redeemed | (24,698) | (25,485) | (263,472) | (262,103) |
| Net increase (decrease) | 17,957 | 39,084 | $197,418 | $439,073 |
| Class L | ||||
| Reinvestment of distributions | 121 | 597 | $1,252 | $6,685 |
| Shares redeemed | (487) | – | $(5,068) | $– |
| Net increase (decrease) | (366) | 597 | $(3,816) | $6,685 |
| Class N | ||||
| Reinvestment of distributions | 117 | 572 | $1,217 | $6,404 |
| Shares redeemed | (485) | – | (5,039) | – |
| Net increase (decrease) | (368) | 572 | $(3,822) | $6,404 |
| Fidelity Multi-Manager 2050 Fund | ||||
| Multi-Manager 2050 | ||||
| Shares sold | 31,743 | 52,504 | $338,461 | $560,155 |
| Reinvestment of distributions | 1,533 | 6,608 | 15,595 | 73,155 |
| Shares redeemed | (31,820) | (31,341) | (337,601) | (346,681) |
| Net increase (decrease) | 1,456 | 27,771 | $16,455 | $286,629 |
| Class L | ||||
| Reinvestment of distributions | 142 | 727 | $1,441 | $8,043 |
| Shares redeemed | (495) | – | (5,067) | – |
| Net increase (decrease) | (353) | 727 | $(3,626) | $8,043 |
| Class N | ||||
| Reinvestment of distributions | 137 | 702 | $1,395 | $7,773 |
| Shares redeemed | (493) | – | (5,039) | – |
| Net increase (decrease) | (356) | 702 | $(3,644) | $7,773 |
| Fidelity Multi-Manager 2055 Fund | ||||
| Multi-Manager 2055 | ||||
| Shares sold | 30,541 | 45,428 | $331,521 | $496,282 |
| Reinvestment of distributions | 1,534 | 5,889 | 15,904 | 65,911 |
| Shares redeemed | (31,280) | (13,518) | (333,941) | (151,383) |
| Net increase (decrease) | 795 | 37,799 | $13,484 | $410,810 |
| Class L | ||||
| Reinvestment of distributions | 145 | 670 | $1,500 | $7,535 |
| Shares redeemed | (486) | – | (5,066) | – |
| Net increase (decrease) | (341) | 670 | $(3,566) | $7,535 |
| Class N | ||||
| Reinvestment of distributions | 144 | 649 | $1,493 | $7,310 |
| Shares redeemed | (484) | – | (5,037) | – |
| Net increase (decrease) | (340) | 649 | $(3,544) | $7,310 |
| Fidelity Multi-Manager 2060 Fund | ||||
| Multi-Manager 2060 | ||||
| Shares sold | 7,859 | 17,277 | $74,206 | $163,354 |
| Reinvestment of distributions | 449 | 1,332 | 4,067 | 12,934 |
| Shares redeemed | (5,971) | (464) | (57,026) | (4,417) |
| Net increase (decrease) | 2,337 | 18,145 | $21,247 | $171,871 |
| Class L | ||||
| Reinvestment of distributions | 148 | 713 | $1,346 | $7,023 |
| Shares redeemed | (523) | – | (4,767) | – |
| Net increase (decrease) | (375) | 713 | $(3,421) | $7,023 |
| Class N | ||||
| Reinvestment of distributions | 148 | 691 | $1,342 | $6,815 |
| Shares redeemed | (522) | – | (4,749) | – |
| Net increase (decrease) | (374) | 691 | $(3,407) | $6,815 |
8. Other.
The Funds' organizational documents provide former and current trustees and officers with a limited indemnification against liabilities arising in connection with the performance of their duties to the Funds. In the normal course of business, the Funds may also enter into contracts that provide general indemnifications. The Funds' maximum exposure under these arrangements is unknown as this would be dependent on future claims that may be made against the Funds. The risk of material loss from such claims is considered remote.
At the end of the period, the investment adviser or its affiliates were owners of record of more than 10% of the outstanding shares of the following Funds:
| Affiliated | |
| Fidelity Multi-Manager Income Fund | 16% |
| Fidelity Multi-Manager 2005 Fund | 93% |
| Fidelity Multi-Manager 2010 Fund | 40% |
| Fidelity Multi-Manager 2015 Fund | 16% |
| Fidelity Multi-Manager 2025 Fund | 12% |
| Fidelity Multi-Manager 2030 Fund | 16% |
| Fidelity Multi-Manager 2035 Fund | 14% |
| Fidelity Multi-Manager 2040 Fund | 27% |
| Fidelity Multi-Manager 2045 Fund | 16% |
| Fidelity Multi-Manager 2050 Fund | 16% |
| Fidelity Multi-Manager 2055 Fund | 16% |
| Fidelity Multi-Manager 2060 Fund | 53% |
Shareholder Expense Example
As a shareholder of a Fund, you incur two types of costs: (1) transaction costs, and (2) ongoing costs, including distribution and/or service (12b-1) fees and other Fund expenses. This Example is intended to help you understand your ongoing costs (in dollars) of investing in the Funds and to compare these costs with the ongoing costs of investing in other mutual funds.
The Example is based on an investment of $1,000 invested at the beginning of the period and held for the entire period (April 1, 2016 to September 30, 2016).
Actual Expenses
The first line of the accompanying table for each class of each fund provides information about actual account values and actual expenses. You may use the information in this line, together with the amount you invested, to estimate the expenses that you paid over the period. Simply divide your account value by $1,000.00 (for example, an $8,600 account value divided by $1,000.00 = 8.6), then multiply the result by the number in the first line for a class of the fund under the heading entitled "Expenses Paid During Period" to estimate the expenses you paid on your account during this period. A small balance maintenance fee of $12.00 that is charged once a year may apply for certain accounts with a value of less than $2,000. This fee is not included in the table below. If it was, the estimate of expenses you paid during the period would be higher, and your ending account value lower, by this amount. In addition, each Fund, as a shareholder in underlying funds, will indirectly bear its pro-rata share of the fees and expenses incurred by the underlying funds. These fees and expenses are not included in each Fund's annualized expense ratio used to calculate the expense estimates in the table below.
Hypothetical Example for Comparison Purposes
The second line of the accompanying table for each class of each fund provides information about hypothetical account values and hypothetical expenses based on a Class' actual expense ratio and an assumed rate of return of 5% per year before expenses, which is not the Class' actual return. The hypothetical account values and expenses may not be used to estimate the actual ending account balance or expenses you paid for the period. You may use this information to compare the ongoing costs of investing in the Fund and other funds. To do so, compare this 5% hypothetical example with the 5% hypothetical examples that appear in the shareholder reports of the other funds. A small balance maintenance fee of $12.00 that is charged once a year may apply for certain accounts with a value of less than $2,000. This fee is not included in the table below. If it was, the estimate of expenses you paid during the period would be higher, and your ending account value lower, by this amount. In addition, each Fund, as a shareholder in underlying funds, will indirectly bear its pro-rata share of the fees and expenses incurred by the underlying funds. These fees and expenses are not included in each Fund's annualized expense ratio used to calculate the expense estimates in the table below.
Please note that the expenses shown in the table are meant to highlight your ongoing costs only and do not reflect any transaction costs. Therefore, the second line of the table is useful in comparing ongoing costs only, and will not help you determine the relative total costs of owning different funds.
| Annualized Expense Ratio-A | Beginning Account Value April 1, 2016 | Ending Account Value September 30, 2016 | Expenses Paid During Period-B April 1, 2016 to September 30, 2016 | |
| Fidelity Multi-Manager Income Fund | ||||
| Multi-Manager Income | .05% | |||
| Actual | $1,000.00 | $1,041.80 | $.26 | |
| Hypothetical-C | $1,000.00 | $1,024.82 | $.25 | |
| Class L | .05% | |||
| Actual | $1,000.00 | $1,040.80 | $.26 | |
| Hypothetical-C | $1,000.00 | $1,024.82 | $.25 | |
| Class N | .30% | |||
| Actual | $1,000.00 | $1,039.60 | $1.53 | |
| Hypothetical-C | $1,000.00 | $1,023.56 | $1.52 | |
| Fidelity Multi-Manager 2005 Fund | ||||
| Multi-Manager 2005 | .07% | |||
| Actual | $1,000.00 | $1,047.10 | $.36 | |
| Hypothetical-C | $1,000.00 | $1,024.72 | $.36 | |
| Class L | .09% | |||
| Actual | $1,000.00 | $1,047.20 | $.46 | |
| Hypothetical-C | $1,000.00 | $1,024.62 | $.46 | |
| Class N | .33% | |||
| Actual | $1,000.00 | $1,046.50 | $1.69 | |
| Hypothetical-C | $1,000.00 | $1,023.41 | $1.67 | |
| Fidelity Multi-Manager 2010 Fund | ||||
| Multi-Manager 2010 | .05% | |||
| Actual | $1,000.00 | $1,052.90 | $.26 | |
| Hypothetical-C | $1,000.00 | $1,024.82 | $.25 | |
| Class L | .06% | |||
| Actual | $1,000.00 | $1,052.90 | $.31 | |
| Hypothetical-C | $1,000.00 | $1,024.77 | $.30 | |
| Class N | .31% | |||
| Actual | $1,000.00 | $1,051.30 | $1.59 | |
| Hypothetical-C | $1,000.00 | $1,023.51 | $1.57 | |
| Fidelity Multi-Manager 2015 Fund | ||||
| Multi-Manager 2015 | .08% | |||
| Actual | $1,000.00 | $1,056.70 | $.41 | |
| Hypothetical-C | $1,000.00 | $1,024.67 | $.41 | |
| Class L | .08% | |||
| Actual | $1,000.00 | $1,056.70 | $.41 | |
| Hypothetical-C | $1,000.00 | $1,024.67 | $.41 | |
| Class N | .33% | |||
| Actual | $1,000.00 | $1,055.10 | $1.70 | |
| Hypothetical-C | $1,000.00 | $1,023.41 | $1.67 | |
| Fidelity Multi-Manager 2020 Fund | ||||
| Multi-Manager 2020 | .08% | |||
| Actual | $1,000.00 | $1,059.80 | $.41 | |
| Hypothetical-C | $1,000.00 | $1,024.67 | $.41 | |
| Class L | .08% | |||
| Actual | $1,000.00 | $1,059.80 | $.41 | |
| Hypothetical-C | $1,000.00 | $1,024.67 | $.41 | |
| Class N | .33% | |||
| Actual | $1,000.00 | $1,058.30 | $1.70 | |
| Hypothetical-C | $1,000.00 | $1,023.41 | $1.67 | |
| Fidelity Multi-Manager 2025 Fund | ||||
| Multi-Manager 2025 | .10% | |||
| Actual | $1,000.00 | $1,061.70 | $.52 | |
| Hypothetical-C | $1,000.00 | $1,024.57 | $.51 | |
| Class L | .08% | |||
| Actual | $1,000.00 | $1,062.60 | $.41 | |
| Hypothetical-C | $1,000.00 | $1,024.67 | $.41 | |
| Class N | .33% | |||
| Actual | $1,000.00 | $1,061.10 | $1.71 | |
| Hypothetical-C | $1,000.00 | $1,023.41 | $1.67 | |
| Fidelity Multi-Manager 2030 Fund | ||||
| Multi-Manager 2030 | .10% | |||
| Actual | $1,000.00 | $1,068.30 | $.52 | |
| Hypothetical-C | $1,000.00 | $1,024.57 | $.51 | |
| Class L | .09% | |||
| Actual | $1,000.00 | $1,068.30 | $.47 | |
| Hypothetical-C | $1,000.00 | $1,024.62 | $.46 | |
| Class N | .34% | |||
| Actual | $1,000.00 | $1,066.80 | $1.76 | |
| Hypothetical-C | $1,000.00 | $1,023.36 | $1.72 | |
| Fidelity Multi-Manager 2035 Fund | ||||
| Multi-Manager 2035 | .10% | |||
| Actual | $1,000.00 | $1,071.40 | $.52 | |
| Hypothetical-C | $1,000.00 | $1,024.57 | $.51 | |
| Class L | .10% | |||
| Actual | $1,000.00 | $1,071.40 | $.52 | |
| Hypothetical-C | $1,000.00 | $1,024.57 | $.51 | |
| Class N | .35% | |||
| Actual | $1,000.00 | $1,069.90 | $1.82 | |
| Hypothetical-C | $1,000.00 | $1,023.31 | $1.78 | |
| Fidelity Multi-Manager 2040 Fund | ||||
| Multi-Manager 2040 | .10% | |||
| Actual | $1,000.00 | $1,071.10 | $.52 | |
| Hypothetical-C | $1,000.00 | $1,024.57 | $.51 | |
| Class L | .10% | |||
| Actual | $1,000.00 | $1,071.10 | $.52 | |
| Hypothetical-C | $1,000.00 | $1,024.57 | $.51 | |
| Class N | .35% | |||
| Actual | $1,000.00 | $1,070.20 | $1.82 | |
| Hypothetical-C | $1,000.00 | $1,023.31 | $1.78 | |
| Fidelity Multi-Manager 2045 Fund | ||||
| Multi-Manager 2045 | .10% | |||
| Actual | $1,000.00 | $1,072.00 | $.52 | |
| Hypothetical-C | $1,000.00 | $1,024.57 | $.51 | |
| Class L | .10% | |||
| Actual | $1,000.00 | $1,071.00 | $.52 | |
| Hypothetical-C | $1,000.00 | $1,024.57 | $.51 | |
| Class N | .35% | |||
| Actual | $1,000.00 | $1,069.80 | $1.82 | |
| Hypothetical-C | $1,000.00 | $1,023.31 | $1.78 | |
| Fidelity Multi-Manager 2050 Fund | ||||
| Multi-Manager 2050 | .10% | |||
| Actual | $1,000.00 | $1,071.30 | $.52 | |
| Hypothetical-C | $1,000.00 | $1,024.57 | $.51 | |
| Class L | .10% | |||
| Actual | $1,000.00 | $1,071.20 | $.52 | |
| Hypothetical-C | $1,000.00 | $1,024.57 | $.51 | |
| Class N | .35% | |||
| Actual | $1,000.00 | $1,069.90 | $1.82 | |
| Hypothetical-C | $1,000.00 | $1,023.31 | $1.78 | |
| Fidelity Multi-Manager 2055 Fund | ||||
| Multi-Manager 2055 | .10% | |||
| Actual | $1,000.00 | $1,071.70 | $.52 | |
| Hypothetical-C | $1,000.00 | $1,024.57 | $.51 | |
| Class L | .10% | |||
| Actual | $1,000.00 | $1,071.70 | $.52 | |
| Hypothetical-C | $1,000.00 | $1,024.57 | $.51 | |
| Class N | .35% | |||
| Actual | $1,000.00 | $1,069.90 | $1.82 | |
| Hypothetical-C | $1,000.00 | $1,023.31 | $1.78 | |
| Fidelity Multi-Manager 2060 Fund | ||||
| Multi-Manager 2060 | .10% | |||
| Actual | $1,000.00 | $1,071.50 | $.52 | |
| Hypothetical-C | $1,000.00 | $1,024.57 | $.51 | |
| Class L | .10% | |||
| Actual | $1,000.00 | $1,071.40 | $.52 | |
| Hypothetical-C | $1,000.00 | $1,024.57 | $.51 | |
| Class N | .35% | |||
| Actual | $1,000.00 | $1,069.30 | $1.82 | |
| Hypothetical-C | $1,000.00 | $1,023.31 | $1.78 |
A Annualized expense ratio reflects expenses net of applicable fee waivers.
B Expenses are equal to each Class' annualized expense ratio, multiplied by the average account value over the period, multiplied by 183/ 365 (to reflect the one-half year period). The fees and expenses of the underlying Fidelity Funds in which each Fund invests are not included in each Fund's annualized expense ratio.
C 5% return per year before expenses
Board Approval of Investment Advisory Contracts and Management Fees
Fidelity Multi-Manager Target Date Funds (formerly Strategic Advisers Multi-Manager Target Date Funds)
Each year, the Board of Trustees, including the Independent Trustees (together, the Board), votes on the renewal of the management contract (the Advisory Contract) with FMR Co., Inc. (FMRC), an affiliate of Fidelity Management & Research Company (FMR), and the administration agreement between FMRC and FMR for each fund. The Board, assisted by the advice of fund counsel and Independent Trustees' counsel, requests and considers a broad range of information relevant to the renewal of the Advisory Contracts and administration agreements throughout the year.
The Board meets regularly and, at each of its meetings, covers an extensive agenda of topics and materials and considers factors that are relevant to its annual consideration of the renewal of each fund's Advisory Contract and administration agreement, including the services and support provided to each fund and its shareholders. The Board has established four standing committees (Committees) — Operations, Audit, Fair Valuation, and Governance and Nominating — each composed of and chaired by Independent Trustees with varying backgrounds, to which the Board has assigned specific subject matter responsibilities in order to enhance effective decision-making by the Board. The Operations Committee, of which all of the Independent Trustees are members, meets regularly throughout the year and considers, among other matters, information specifically related to the annual consideration of the renewal of each fund's Advisory Contract and administration agreement. The Board, acting directly and through its Committees, requests and receives information concerning the annual consideration of the renewal of each fund's Advisory Contract and administration agreement. The Board also meets as needed to consider matters specifically related to the Board's annual consideration of the renewal of the Advisory Contracts and administration agreements. Members of the Board may also meet with trustees of other Fidelity funds through ad hoc joint committees to discuss certain matters relevant to all of the Fidelity funds.
At its September 2016 meeting, the Board unanimously determined to renew each fund's Advisory Contract and administration agreement. In reaching its determination, the Board considered all factors it believed relevant and reached a determination, with the assistance of fund counsel and Independent Trustees' counsel and through the exercise of its business judgment, that the renewal of the Advisory Contract was in the best interests of each fund and its shareholders and that the fact that no fees are payable under the Advisory Contracts was fair and reasonable. The Board's decision to renew the Advisory Contracts was not based on any single factor, but rather was based on a comprehensive consideration of all the information provided to the Board at its meetings throughout the year. In reaching its determination, the Board was aware that shareholders of each fund have a broad range of investment choices available to them, including a wide choice among funds offered by Fidelity's competitors, and that each fund's shareholders, who have the opportunity to review and weigh the disclosure provided by the fund in its prospectus and other public disclosures, have chosen to invest in that fund, which is part of the Fidelity family of funds.
Nature, Extent, and Quality of Services Provided. The Board considered Fidelity's staffing as it relates to the funds, including the backgrounds of investment personnel of FMRC, and also considered the funds' investment objectives, strategies, and related investment philosophies. The Independent Trustees also had discussions with senior management of Fidelity's investment operations and investment groups with responsibility for the underlying Fidelity funds in which each fund invests. The Board considered the structure of the investment personnel compensation program and whether this structure provides appropriate incentives to act in the best interests of each fund. Additionally, the Board considered the portfolio managers' investments, if any, in the funds that they manage.Resources Dedicated to Investment Management and Support Services. The Board reviewed the general qualifications and capabilities of Fidelity's investment staff, including its size, education, experience, and resources, as well as Fidelity's approach to recruiting, managing, and compensating investment personnel. The Board noted that Fidelity has continued to increase the resources devoted to non-U.S. offices, including expansion of Fidelity's global investment organization. The Board also noted that Fidelity's analysts have extensive resources, tools and capabilities that allow them to conduct sophisticated quantitative and fundamental analysis, as well as credit analysis of issuers, counterparties and guarantors. Further, the Board considered that Fidelity's investment professionals have sufficient access to global information and data so as to provide competitive investment results over time, and that those professionals also have access to sophisticated tools that permit them to assess portfolio construction and risk and performance attribution characteristics continuously, as well as to transmit new information and research conclusions rapidly around the world. Additionally, in its deliberations, the Board considered Fidelity's risk management, compliance, and technology and operations capabilities and resources, which are integral parts of the investment management process.Shareholder and Administrative Services. The Board considered (i) the nature, extent, quality, and cost of advisory, administrative, and shareholder services performed by Fidelity under the Advisory Contract and under separate agreements covering administration, transfer agency, and pricing and bookkeeping services for each fund; (ii) the nature and extent of the supervision of third party service providers, principally custodians, subcustodians, and pricing vendors; and (iii) the resources devoted to, and the record of compliance with, each fund's compliance policies and procedures.The Board noted that the growth of fund assets over time across the complex allows Fidelity to reinvest in the development of services designed to enhance the value or convenience of the Fidelity funds as investment vehicles. These services include 24-hour access to account information and market information through telephone representatives and over the Internet, investor education materials and asset allocation tools, and the expanded availability of Fidelity Investor Centers.Investment in a Large Fund Family. The Board considered the benefits to shareholders of investing in a Fidelity fund, including the benefits of investing in a fund that is part of a large family of funds offering a variety of investment disciplines and providing a large variety of mutual fund investor services. The Board noted that Fidelity had taken, or had made recommendations that resulted in the Fidelity funds taking, a number of actions over the previous year that benefited particular funds, including: (i) continuing to dedicate additional resources to investment research and to the support of the senior management team that oversees asset management; (ii) continuing efforts to enhance Fidelity's global research capabilities; (iii) launching new funds and making other enhancements to meet client needs; (iv) broadening eligibility requirements for certain lower-priced share classes of, and streamlining the fee structure for, certain existing equity index funds; (v) lowering expense caps for certain existing funds and classes to reduce expenses paid by shareholders; (vi) eliminating redemption fees for certain variable insurance product funds and classes; (vii) continuing to launch dedicated lower cost underlying funds to meet portfolio construction needs related to expanding underlying fund options for Fidelity funds of funds, specifically for the Freedom Fund product lines; (viii) launching a lower cost share class for use by the Freedom Index Fund product line; (ix) rationalizing product lines and gaining increased efficiencies through fund mergers and share class consolidations; (x) continuing to develop, acquire and implement systems and technology to improve services to the funds and shareholders, strengthen information security, and increase efficiency; (xi) implementing investment enhancements to further strengthen Fidelity's target date product line to increase investors' probability of success in achieving their goals; (xii) accelerating the conversion of all remaining Class B shares to Class A shares, which have a lower expense structure; and (xiii) implementing changes to Fidelity's money market fund product line in response to recent regulatory reforms.Investment Performance. The Board considered whether each fund has operated in accordance with its investment objective, as well as its record of compliance with its investment restrictions and its performance history.The Board took into account discussions with representatives of the investment adviser about fund investment performance that occur at Board meetings throughout the year. In this regard the Board noted that as part of regularly scheduled fund reviews and other reports to the Board on fund performance, the Board considers annualized return information for each fund for different time periods, measured against one or more securities market indices, including a customized blended index representative of the fund's asset classes (each a "benchmark index") and a peer group of funds with similar objectives ("peer group"), if any. In its evaluation of fund investment performance at meetings throughout the year, the Board gave particular attention to information indicating underperformance of certain Fidelity funds for specific time periods and discussed with the investment adviser the reasons for such underperformance.In addition to reviewing absolute and relative fund performance, the Independent Trustees periodically consider the appropriateness of fund performance metrics in evaluating the results achieved. In general, the Independent Trustees believe that fund performance should be evaluated based on gross performance (before fees and expenses, including acquired fund fees and expenses, but after transaction costs, if any) compared to appropriate benchmark indices, over appropriate time periods that may include full market cycles, and on net performance (after fees and expenses, including acquired fund fees and expenses) compared to peer groups, as applicable, over the same periods, taking into account relevant factors including the following: general market conditions; the extent to which particular underlying funds affected performance; and fund cash flows and other factors. Depending on the circumstances, the Independent Trustees may be satisfied with a fund's performance notwithstanding that it lags its benchmark index or peer group for certain periods.The Independent Trustees recognize that shareholders evaluate performance on a net basis over their own holding periods, for which one-, three-, and five-year periods are often used as a proxy. For this reason, the performance information reviewed by the Board also included net cumulative calendar year total return information for each fund and an appropriate benchmark index for the most recent one- and three-year periods (for the most recent one-year period for Fidelity Multi-Manager 2060 Fund).Based on its review, the Board concluded that the nature, extent, and quality of services provided to each fund under the Advisory Contracts should continue to benefit the shareholders of each fund.Competitiveness of Management Fee and Total Expense Ratio. The Board noted that the funds do not pay FMRC a management fee for investment advisory services, and that each fund bears indirectly the fees and expenses, including the management fees, paid by the underlying Fidelity funds in which it invests. The Board considered each fund's management fee and total expense ratio compared to "mapped groups" of competitive funds and classes created for the purpose of facilitating the Trustees' competitive analysis of management fees and total expenses. Fidelity creates "mapped groups" by combining similar Lipper investment objective categories that have comparable investment mandates. Combining Lipper investment objective categories aids the Board's management fee and total expense ratio comparisons by broadening the competitive group used for comparison.Management Fee. The Board considered two proprietary management fee comparisons for the 12-month (or shorter) periods shown in basis points (BP) in the charts below. The group of Lipper funds used by the Board for management fee comparisons is referred to below as the "Total Mapped Group." The Total Mapped Group comparison focuses on a fund's standing in terms of gross management fees before expense reimbursements or caps relative to the total universe of funds with comparable investment mandates, regardless of whether their management fee structures also are comparable. Funds with comparable investment mandates offer exposure to similar types of securities. Funds with comparable management fee structures have similar management fee contractual arrangements (e.g., flat rate charged for advisory services, all-inclusive fee rate, etc.). "TMG %" represents the percentage of funds in the Total Mapped Group that had management fees that were lower than a fund's. For example, a hypothetical TMG % of 20% would mean that 80% of the funds in the Total Mapped Group had higher, and 20% had lower, management fees than a fund. The funds' actual TMG %s and the number of funds in the Total Mapped Group are in the charts below. The Board also noted that over the past few years, Fidelity has been developing and refining the competitive methodology for the funds to provide a more meaningful competitive comparison. As a result, beginning with the 2014 competitive results, instead of including all funds in one competitive mapped group that includes all funds-of-funds, Fidelity introduced three new Total Mapped Groups that consist of target retirement funds, grouped according to target retirement dates. The Board noted that Fidelity believes that the new Total Mapped Groups provide more meaningful competitive comparisons for the funds because they include target date funds, regardless of whether the fund is a fund of funds, and reflect, among other things, that active target date funds with a higher percentage of assets invested in equities tend to have higher expenses. The "Asset-Size Peer Group" (ASPG) comparison focuses on a fund's standing relative to a subset of non-Fidelity funds within the Total Mapped Group that are similar in size and management fee structure. For example, if a fund is in the first quartile of the ASPG, the fund's management fee ranks in the least expensive or lowest 25% of funds in the ASPG. The ASPG represents at least 15% of the funds in the Total Mapped Group with comparable asset size and management fee structures, subject to a minimum of 50 funds (or all funds in the Total Mapped Group if fewer than 50). Additional information, such as the ASPG quartile in which a fund's management fee rate ranked, is also included in the charts and considered by the Board.Fidelity Multi-Manager 2005 Fund
Fidelity Multi-Manager 2010 Fund
Fidelity Multi-Manager 2015 Fund
Fidelity Multi-Manager 2020 Fund
Fidelity Multi-Manager 2025 Fund
Fidelity Multi-Manager 2030 Fund
Fidelity Multi-Manager 2035 Fund
Fidelity Multi-Manager 2040 Fund
Fidelity Multi-Manager 2045 Fund
Fidelity Multi-Manager 2050 Fund
Fidelity Multi-Manager 2055 Fund
Fidelity Multi-Manager 2060 Fund
Fidelity Multi-Manager Income Fund
![]()
OLF-L-OLF-N-SANN-1116
1.9584953.102
Item 2.
Code of Ethics
Not applicable.
Item 3.
Audit Committee Financial Expert
Not applicable.
Item 4.
Principal Accountant Fees and Services
Not applicable.
Item 5.
Audit Committee of Listed Registrants
Not applicable.
Item 6.
Investments
(a)
Not applicable.
(b)
Not applicable
Item 7.
Disclosure of Proxy Voting Policies and Procedures for Closed-End Management Investment Companies
Not applicable.
Item 8.
Portfolio Managers of Closed-End Management Investment Companies
Not applicable.
Item 9.
Purchase of Equity Securities by Closed-End Management Investment Company and Affiliated Purchasers
Not applicable.
Item 10.
Submission of Matters to a Vote of Security Holders
There were no material changes to the procedures by which shareholders may recommend nominees to the Fidelity Boylston Street Trust’s Board of Trustees.
Item 11.
Controls and Procedures
(a)(i) The President and Treasurer and the Chief Financial Officer have concluded that the Fidelity Boylston Street Trust’s (the “Trust”) disclosure controls and procedures (as defined in Rule 30a-3(c) under the Investment Company Act) provide reasonable
assurances that material information relating to the Trust is made known to them by the appropriate persons, based on their evaluation of these controls and procedures as of a date within 90 days of the filing date of this report.
(a)(ii) There was no change in the Trust’s internal control over financial reporting (as defined in Rule 30a-3(d) under the Investment Company Act) that occurred during the second fiscal quarter of the period covered by this report that has materially affected, or is reasonably likely to materially affect, the Trust’s internal control over financial reporting.
Item 12.
Exhibits
(a) | (1) | Not applicable. |
(a) | (2) | Certification pursuant to Rule 30a-2(a) under the Investment Company Act of 1940 (17 CFR 270.30a-2(a)) is filed and attached hereto as Exhibit 99.CERT. |
(a) | (3) | Not applicable. |
(b) | Certification pursuant to Rule 30a-2(b) under the Investment Company Act of 1940 (17 CFR 270.30a-2(b)) is furnished and attached hereto as Exhibit 99.906CERT. |
SIGNATURES
Pursuant to the requirements of the Securities Exchange Act of 1934 and the Investment Company Act of 1940, the registrant has duly caused this report to be signed on its behalf by the undersigned, thereunto duly authorized.
Fidelity Boylston Street Trust
By: | /s/Stephanie J. Dorsey |
Stephanie J. Dorsey | |
President and Treasurer | |
Date: | December 5, 2016 |
Pursuant to the requirements of the Securities Exchange Act of 1934 and the Investment Company Act of 1940, this report has been signed below by the following persons on behalf of the registrant and in the capacities and on the dates indicated.
By: | /s/Stephanie J. Dorsey |
Stephanie J. Dorsey | |
President and Treasurer | |
Date: | December 5, 2016 |
By: | /s/Howard J. Galligan III |
Howard J. Galligan III | |
Chief Financial Officer | |
Date: | December 5, 2016 |