UNITED STATES
SECURITIES AND EXCHANGE COMMISSION
WASHINGTON, DC 20549
FORM 10-K
(Mark One)
| x | ANNUAL REPORT PURSUANT TO SECTION 13 OR 15(d) OF THE SECURITIES EXCHANGE ACT OF 1934 |
For the fiscal year endedDecember 31, 2011
OR
| ¨ | TRANSITION REPORT PURSUANT TO SECTION 13 OR 15(d) OF THE SECURITIES EXCHANGE ACT OF 1934 |
For the transition period from to
Commission file number0-133872
Susquehanna Bancshares, Inc.
(Exact Name of Registrant as Specified in Its Charter)
| | |
| Pennsylvania | | 23-2201716 |
(State or Other Jurisdiction of Incorporation or Organization) | | (I.R.S. Employer Identification No.) |
| 26 North Cedar St., Lititz, Pennsylvania | | 17543 |
| (Address of Principal Executive Offices) | | (Zip Code) |
Registrant’s telephone number, including area code(717) 626-4721
Securities registered pursuant to Section 12(b) of the Act:
| | |
Title of Each Class | | Name of Each Exchange on Which Registered |
| common stock, par value $2.00 per share | | The Nasdaq Stock Market, LLC |
Susquehanna Capital I Capital Stock (and the Guarantee by Susquehanna Bancshares, Inc. with respect thereto) | | New York Stock Exchange |
Securities registered pursuant to Section 12(g) of the Act: None
Indicate by check mark if the registrant is a well-known seasoned issuer, as defined in Rule 405 of the Securities Act. Yes þ No ¨
Indicate by check mark if the registrant is not required to file reports pursuant to Section 13 or 15(d) of the Act. Yes ¨ No þ
Indicate by check mark whether the registrant: (1) has filed all reports required to be filed by Section 13 or 15(d) of the Securities Exchange Act of 1934 during the preceding 12 months (or for such shorter period that the registrant was required to file such reports), and (2) has been subject to such filing requirements for the past 90 days. Yes þ No ¨
Indicate by check mark whether the registrant has submitted electronically and posted on its corporate Web site, if any, every Interactive Data File required to be submitted and posted pursuant to Rule 405 of Regulation S-T (§ 232.405 of this chapter) during the preceding 12 months (or for such shorter period that the registrant was required to submit and post such files). Yes þ No ¨
Indicate by check mark if disclosure of delinquent filers pursuant to Item 405 of Regulation S-K is not contained herein, and will not be contained, to the best of registrant’s knowledge, in definitive proxy or information statements incorporated by reference in Part III of this Form 10-K or any amendment to this Form 10-K. þ
Indicate by check mark whether the registrant is a large accelerated filer, an accelerated filer, a non-accelerated filer or a smaller reporting company. See definition of “accelerated filer,” “large accelerated filer” and “smaller reporting company” in Rule 12b-2 of the Exchange Act: (Check one):
Large Accelerated Filer þ Accelerated Filer ¨ Non-Accelerated Filer ¨ Smaller Reporting Company ¨
Indicate by check mark whether the registrant is a shell company (as defined in Rule 12b-2 of the Exchange Act). Yes ¨ No þ
The aggregate market value of voting stock held by non-affiliates of the registrant was approximately $1,026,553,720 as of June 30, 2011, based upon the closing price quoted on the Nasdaq Global Select Market for such date. Shares of common stock held by each executive officer and director have been excluded in that such persons may under certain circumstances be deemed to be affiliates. This determination of executive officer or affiliate status is not necessarily a conclusive determination for other purposes. The number of shares issued and outstanding of the registrant’s common stock as of February 17, 2012, was 156,951,675.
DOCUMENTS INCORPORATED BY REFERENCE
Portions of the registrant’s definitive Joint Proxy Statement/Prospectus to be delivered to shareholders in connection with the Annual Meeting of Shareholders to be held May 4, 2012 are incorporated by reference into Part III of this Annual Report.
SUSQUEHANNA BANCSHARES, INC.
TABLE OF CONTENTS
Unless the context otherwise requires, the terms “Susquehanna,” “we,” “us,” and “our” refer to Susquehanna Bancshares, Inc. and its subsidiaries.
PART I
Item 1. Business
General
Susquehanna Bancshares, Inc. is a financial holding company that provides a wide range of retail and commercial banking and financial services through our subsidiaries in the mid-Atlantic region. In addition to a commercial bank, we operate a trust and investment company, an asset management company (which provides investment advisory, asset management, brokerage and retirement planning services), a property and casualty insurance brokerage company and a vehicle leasing company. As of December 31, 2011, we had total assets of approximately $15.0 billion, consolidated net loans and leases of $10.3 billion, deposits of $10.3 billion, and shareholders’ equity of $2.2 billion.
Susquehanna was incorporated in Pennsylvania in 1982. Our executive offices are located at 26 North Cedar Street, Lititz, Pennsylvania 17543. Our telephone number is (717) 626-4721, and our web site address iswww.susquehanna.net. Our stock is traded on the Nasdaq Global Select Market under the symbol SUSQ. We make available free of charge, through the Investor Relations section of our web site, our Annual Reports on Form 10-K, Quarterly Reports on Form 10-Q, current reports on Form 8-K, and all amendments to those reports, as soon as reasonably practicable after such material is electronically filed with or furnished to the Securities and Exchange Commission. We include our web site address in this Annual Report on Form 10-K only as a textual reference and do not intend it to be an active link to our web site.
The following table sets forth information, for the year ended December 31, 2011, regarding our bank subsidiary and each of our non-bank subsidiaries that had annual revenues in excess of $5.0 million:
(Dollars in thousands)
| | | | | | | | |
Subsidiary | | Assets | | | Percent
of Total | |
Bank Subsidiary: | | | | | | | | |
Susquehanna Bank(1) | | $ | 14,741,257 | | | | 98.4 | % |
Non-Bank Subsidiaries: | | | | | | | | |
Susquehanna Trust & Investment Company | | | 9,721 | | | | 0.1 | |
Valley Forge Asset Management Corp. | | | 37,677 | | | | 0.2 | |
Stratton Management Company | | | 74,221 | | | | 0.5 | |
Boston Service Company, Inc.
(t/a Hann Financial Service Corp.) | | | 90,588 | | | | 0.6 | |
The Addis Group, LLC | | | 57,081 | | | | 0.4 | |
Consolidation adjustments and other non-bank subsidiaries | | | (35,756 | ) | | | (0.2 | ) |
| | | | | | | | |
TOTAL | | $ | 14,974,789 | | | | 100.0 | % |
| | | | | | | | |
| (1) | Excludes Susquehanna Trust & Investment Company, a wholly-owned subsidiary of Susquehanna Bank. |
We manage our businesses using a long-term perspective, with financial objectives that emphasize loan quality, balance sheet liquidity, and earnings stability. Consistent with this approach, we emphasize a low-risk loan portfolio derived from our local markets. In addition, we focus on avoiding a concentration of any portion of our business upon a single customer or limited group of customers or a substantial portion of our loans or
2
investments concentrated within a single industry or a group of related industries. Our net charge-offs over the past five years have averaged 0.92% of total average loans and leases.
As of December 31, 2011, our total loans and leases (net of unearned income) in dollars and by percentage were as follows:
| | | | | | | | |
| | | (Dollars in thousands) | |
Commercial, financial and agricultural | | $ | 1,871,027 | | | | 17.9 | % |
Real estate - construction | | | 829,221 | | | | 7.9 | |
Real estate secured - residential | | | 3,212,562 | | | | 30.8 | |
Real estate secured - commercial | | | 3,136,887 | | | | 30.0 | |
Consumer | | | 722,329 | | | | 6.9 | |
Leases | | | 675,904 | | | | 6.5 | |
| | | | | | | | |
Total loans and leases | | $ | 10,447,930 | | | | 100.0 | % |
| | | | | | | | |
As of December 31, 2011, core deposits funded 71.2% of our lending and investing activities.
Products and Services
Our Bank Subsidiary. Our commercial bank subsidiary, Susquehanna Bank, is a Pennsylvania state-chartered bank that operated 240 banking offices as of December 31, 2011. It provides a wide range of retail banking services, including checking, savings and club accounts, check cards, debit cards, money market accounts, certificates of deposit, individual retirement accounts, home equity lines of credit, residential mortgage loans, home improvement loans, automobile loans, personal loans, and internet banking services. It also provides a wide range of commercial banking services, including business checking accounts, cash management services, money market accounts, land acquisition and development loans, commercial loans, floor plan, equipment and working capital lines of credit, small business loans, and internet banking services. We provide our bank subsidiary guidance in the areas of credit policy and administration, risk assessment, investment advisory administration, strategic planning, investment portfolio management, asset liability management, liquidity management and other financial, administrative and control services.
Our Non-bank Subsidiaries. Our non-bank subsidiaries offer a variety of financial services to complement our core banking operations, broaden our customer base, and diversify our revenue sources. The Addis Group, LLC provides commercial, property and casualty insurance, and risk management programs for medium and large sized companies. Susquehanna Trust & Investment Company, a subsidiary of Susquehanna Bank, provides traditional trust and custodial services, and acts as administrator, executor, guardian, and managing agent for individuals, businesses and non-profit entities. Valley Forge Asset Management Corp. offers investment advisory, asset management and brokerage services for institutional and high net worth individual clients, and retirement planning services. Stratton Management Company provides equity management of assets for institutions, pensions, endowments and high net worth individuals. Boston Service Company, Inc. (t/a Hann Financial Service Corp.) provides comprehensive consumer vehicle financing services.
Market Areas
Our Bank Subsidiary. In 2011, Susquehanna Bank’s operations were divided into the following regional divisions:
| | • | | The PA Division included 109 banking offices operating primarily in the central Pennsylvania market area, including Adams, Berks, Bucks, Chester, Cumberland, Dauphin, Lancaster, Luzerne, Lycoming, Northumberland, Schuylkill, Snyder, Union, and York counties. |
| | • | | The MD Division included 60 banking offices operating primarily in the market areas of Maryland and southwestern central Pennsylvania, including Allegany, Anne Arundel, Baltimore, Carroll, Garrett, |
3
| | Harford, Howard, Washington, and Worcester counties and the City of Baltimore in Maryland, Berkeley County in West Virginia and Bedford and Franklin counties in Pennsylvania. |
| | • | | The DV Division included 71 banking offices operating primarily in the suburban Philadelphia, Pennsylvania and southern New Jersey market areas, including Philadelphia, Berks, Bucks, Chester, Delaware, Lehigh, Montgomery, and Northampton counties in Pennsylvania and Atlantic, Burlington, Camden, Cumberland, and Gloucester counties in New Jersey. |
Our Non-bank Subsidiaries. Susquehanna Trust & Investment Company and Valley Forge Asset Management Corp. operate primarily in the same market areas as Susquehanna Bank. The Addis Group, LLC operates primarily in southeastern Pennsylvania, southern New Jersey, and northern Delaware. Boston Service Company, Inc. (t/a Hann Financial Service Corp.) operates primarily in New Jersey, eastern Pennsylvania, and southeastern New York. Stratton Management Company operates throughout the continental United States.
Like the rest of the nation, the market areas that we serve are presently experiencing sluggish economic growth. A variety of factors (e.g., any substantial rise in inflation or unemployment rates, decrease in consumer confidence, natural disasters, war, or political instability) may further affect both our markets and the national market. We will continue our emphasis on managing our funding costs and lending rates to maintain profitability effectively. In addition, we will continue to seek relationships that can generate fee income that is not directly tied to lending relationships. We anticipate that this approach will help mitigate profit fluctuations that are caused by movements in interest rates, business and consumer loan cycles, and local economic factors.
Our Long-Term Strategy
We manage our business for sustained long-term growth and profitability. Our primary strategies are internal growth through expansion of our customer base in existing markets and external growth through acquisitions in selected markets. We focus on leveraging customer relationships through the cross-selling of a comprehensive range of financial services and products by a highly trained and motivated employee sales force. Our long-term strategic plan to enhance shareholder value has three main components: growing our business profitably through the specific methods mentioned above; building enduring relationships through sales and service; and focusing on risk management. Integrated into our strategic plan under these components are various company-wide initiatives we believe are important to achieving our plan, including rewards, teamwork, training, communications technology and organizational structure.
Mergers and Acquisitions
Abington Bancorp, Inc. On October 1, 2011, we completed our acquisition of Abington Bancorp, Inc. (“Abington”) in a merger of Abington with and into Susquehanna. Abington shareholders received 1.32 shares of Susquehanna common stock for each share of Abington common stock they held immediately prior to completion of the merger. The transaction had a total value of $150.8 million compared to a fair value of net assets acquired of $189.9 million. Upon completion of the merger, Robert W. White, Chairman, President and Chief Executive Officer of Abington, was appointed to the Susquehanna board and joined the leadership team of Susquehanna Bank’s DV Division. The location of Abington’s bank branches provide a natural extension of Susquehanna Bank’s network in the greater Philadelphia area.
Tower Bancorp, Inc. On June 20, 2011, we entered into an agreement and plan of merger with Tower Bancorp, Inc. (“Tower”), which was subsequently amended on September 28, 2011 and pursuant to which Tower was to merge with and into Susquehanna. The transaction, with an approximate total value of $389 million, was completed on February 17, 2012. Under the terms of the agreement, Tower shareholders had the option of receiving either 3.4696 shares of Susquehanna common stock or $28.00 in cash for each share of Tower common stock they held, with $88 million of the aggregate consideration paid in cash. We expect the transaction will enhance Susquehanna’s already strong presence in central and southeastern Pennsylvania and will significantly
4
increase our market share in the Pennsylvania counties of Chester, Dauphin and Franklin. Additionally, the merger gave Susquehanna Bank a branch presence in the Pennsylvania counties of Lebanon, Fulton and Centre.
Future Acquisitions.We routinely evaluate possible future acquisitions of other banks, and may also seek to enter businesses closely related to banking or that are financial in nature, or to acquire existing companies already engaged in such activities, including investment advisory services and insurance brokerage services. Any acquisition by us may require notice to or approval of the Board of Governors of the Federal Reserve System, the Pennsylvania Department of Banking, other regulatory agencies and, in some instances, our shareholders. While any such acquisition may occur in any market area, the four major growth corridors that we are currently focused on are as follows:
| | • | | the Lancaster/York/Baltimore corridor, comprising Lancaster and York counties in Pennsylvania, the City of Baltimore, and Baltimore, Harford, Howard, Carroll, and Anne Arundel counties in Maryland; |
| | • | | the Greater Delaware Valley corridor, comprising Chester, Montgomery, Delaware, and Bucks counties in Pennsylvania, the City of Philadelphia, and Gloucester, Camden, Burlington, and Mercer counties in New Jersey; |
| | • | | the Interstate 81 corridor, comprising Franklin, Cumberland, and Adams counties in Pennsylvania, Washington and Frederick counties in Maryland, and Berkeley and Jefferson counties in West Virginia; and |
| | • | | market areas that would fill gaps in the markets currently served by our bank subsidiary. |
We currently have no formal commitments with respect to the acquisition of any entities, although discussions with prospects occur on a regular and continuing basis.
Employees
As of December 31, 2011, we had 2,926 full-time and 196 part-time employees.
Competition
Financial holding companies and their subsidiaries compete with many institutions for deposits, loans, trust services and other banking-related and financial services. We are subject to competition from less heavily regulated entities such as brokerage firms, money market funds, credit unions, consumer finance and credit card companies, and other financial services companies.
The Gramm-Leach-Bliley Act (the “GLB Act”) has liberalized many of the regulatory restrictions previously imposed on us, including our subsidiaries. Further legislative proposals are pending or may be introduced which could further affect the financial services industry. It is not possible to assess whether any of such proposals will be enacted, and if enacted, what effect such proposals would have on our competitive positions in our marketplace.
As a result of state and federal legislation enacted over the past 20 years, consolidation in the industry has continued at a rapid pace. Further, as a result of the relaxation of laws and regulations pertaining to branch banking in the state, and the opportunity to engage in interstate banking, consolidation within the banking industry has had a significant effect on us and our markets. At present, we compete throughout our market areas with numerous super-regional institutions that have significantly greater resources and assets.
5
Supervision and Regulation
General. We are a financial holding company registered with the Board of Governors of the Federal Reserve System (the “Federal Reserve Board”) and are subject to regulation under the Bank Holding Company Act of 1956, as amended. The Bank Holding Company Act requires prior approval of an acquisition of all or substantially all of the assets of a bank or of ownership or control of voting shares of any bank if the share acquisition would give us more than 5% of the voting shares of any bank or bank holding company. It also imposes restrictions, summarized below, on the assets or voting shares of non-banking companies that we may acquire.
Susquehanna Bank is also subject to regulation and supervision. It is a Pennsylvania state-chartered bank and trust company subject to regulation and periodic examination by the Pennsylvania Department of Banking and the Federal Reserve Board. Due to the bank’s asset size, the bank will also be examined by, and subject to the enforcement authority of, the Bureau of Consumer Financial Protection (the “CFPB”) as to its compliance with consumer financial laws and regulations.
Susquehanna Trust & Investment Company is a Pennsylvania non-depository trust company subject to regulation and periodic examination by the Pennsylvania Department of Banking and the Federal Reserve Board. All of our subsidiaries are subject to examination by the Federal Reserve Board even if not otherwise regulated by the Federal Reserve Board. As a result of the Dodd-Frank Wall Street Reform and Consumer Protection Act (the “Dodd-Frank Act”), which became law on July 21, 2010 and is described below, there will be additional regulatory oversight and supervision of the holding company and its subsidiaries.
Consistent with the requirements of the Bank Holding Company Act, our only lines of business in 2011 consisted of providing our customers with banking, trust and other financial products and services. These included commercial banking through Susquehanna Bank, trust and related services through Susquehanna Trust & Investment Company, consumer vehicle financing through Boston Service Company, Inc. (t/a Hann Financial Service Corp.), investment advisory, asset management, retirement plan consulting and brokerage services through Valley Forge Asset Management Corp. and Stratton Management Company, and property and casualty insurance brokerage services through The Addis Group, LLC. Of these activities, banking activities accounted for 92% of our gross revenues in 2011 and 92% of our gross revenues in 2010.
Regulations governing our bank subsidiary restrict extensions of credit by the bank to Susquehanna and, with some exceptions, the other Susquehanna affiliates. For these purposes, extensions of credit include loans and advances to and guarantees and letters of credit on behalf of Susquehanna and such affiliates. These regulations also restrict investments by our bank subsidiary in the stock or other securities of Susquehanna and the covered affiliates, as well as the acceptance of such stock or other securities as collateral for loans to any borrower, whether or not related to Susquehanna.
Our bank subsidiary is subject to comprehensive federal and state regulations dealing with a wide variety of subjects, including reserve requirements, loan limitations, restrictions as to interest rates on loans and deposits, restrictions as to dividend payments, requirements governing the establishment of branches, and numerous other aspects of its operations. These regulations generally have been adopted to protect depositors and creditors rather than shareholders.
In response to the recent financial crisis, the United States Congress and government (particularly the U.S. Department of the Treasury (the “U.S. Treasury”), the Federal Reserve Board and the Federal Deposit Insurance Corporation (the “FDIC”)) have taken numerous steps to stabilize the financial markets and to provide additional regulatory oversight of financial institutions.
The Dodd-Frank Act is expected to significantly change the regulation of financial institutions and the financial services industry. The Dodd-Frank Act includes, and the regulations being developed thereunder will
6
include, provisions affecting large and small financial institutions alike, including several provisions that will affect how community banks and bank holding companies will be regulated in the future.
Dodd-Frank Act. The Dodd-Frank Act, among other things, imposes new capital requirements on bank holding companies; changes the base for FDIC insurance assessments to a bank’s average consolidated total assets minus average tangible equity, rather than upon its deposit base; permanently raises the current standard deposit insurance limit to $250,000; extends unlimited insurance for noninterest-bearing transaction accounts through 2012: and expands the FDIC’s authority to raise insurance premiums. The legislation also calls for the FDIC to raise its ratio of reserves to deposits from 1.15% to 1.35% for deposit insurance purposes by September 30, 2020 and to “offset the effect” of increased assessments on insured depository institutions with assets of less than $10 billion.
The Dodd-Frank Act also limits interchange fees payable on debit card transactions, establishes the Consumer Financial Protection Board (“CFPB”) as an independent entity within the Federal Reserve, which will have broad rulemaking, supervisory and enforcement authority over consumer financial products and services, including deposit products, residential mortgages, home-equity loans and credit cards, and contains provisions on mortgage-related matters such as steering incentives, and determinations as to a borrower’s ability to repay and prepayment penalties. The CFPB has primary examination and enforcement authority over Susquehanna Bank and other banks with over $10 billion in assets as to consumer financial products, effective July 21, 2011. In July 2011, the CFPB advised us and other subject banks of the agency’s approach to supervision and regulation. This approach will be guided toward protecting consumers and compliance with Federal consumer financial protection laws.
The Dodd-Frank Act also includes provisions that affect corporate governance and executive compensation at all publicly-traded companies and allows financial institutions to pay interest on business checking accounts. The legislation also restricts proprietary trading, places restrictions on the owning or sponsoring of hedge and private equity funds, and regulates the derivatives activities of banks and their affiliates. The Dodd-Frank Act establishes the Financial Stability Oversight Council, to identify threats to the financial stability of the U.S., promote market discipline, and respond to emerging threats to the stability of the U.S. financial system.
The Collins Amendment of the Dodd-Frank Act, among other things, eliminates certain trust preferred securities from tier 1 capital. Preferred securities issued under the U.S. Treasury’s Troubled Asset Relief Program (“TARP”) are exempted from this treatment. In the case of certain trust preferred securities issued prior to May 19, 2010 by bank holding companies with total consolidated assets of $15 billion or more as of December 31, 2009, these “regulatory capital deductions” are to be phased in incrementally over a period of three years beginning on January 1, 2013. This provision also requires the federal banking agencies to establish minimum leverage and risk-based capital requirements that will apply to both insured banks and their holding companies. Regulations implementing the Collins Amendment became effective on July 28, 2011 and set as a floor for the capital requirements of Susquehanna and Susquehanna Bank a minimum capital requirement computed using the Federal Reserve’s risk-based capital rules. Additional rulemaking to implement the Collins Amendment is expected.
Future legislation. Additional consumer protection laws such as the Credit Card Accountability Responsibility and Disclosure Act of 2009, have recently been enacted and the Federal Reserve has adopted numerous new regulations addressing banks’ credit card, overdraft and mortgage lending practices. Additional consumer protection legislation and regulatory activity is anticipated in the near future.
Internationally, both the Basel Committee on Banking Supervision and the Financial Stability Board (established in April 2009 by the Group of Twenty (“G-20”) Finance Ministers and Central Bank Governors to take action to strengthen regulation and supervision of the financial system with greater international consistency, cooperation and transparency) have committed to raise capital standards and liquidity buffers within the banking system (“Basel III”). On September 12, 2010, the Group of Governors and Heads of Supervision
7
agreed to the calibration and phase-in of the Basel III minimum capital requirements (raising the minimum Tier 1 equity ratio to 6.0%, with full implementation by January 2015) and introducing a capital conservation buffer of common equity of an additional 2.5% with implementation by January 2019. The U.S. federal banking agencies have yet to propose regulations for implementing Basel III. On September 28, 2011, the Basel Committee announced plans to consider adjustments to the first liquidity change to be imposed under Basel III, which change would take effect on January 1, 2015. The liquidity coverage ratio being considered would require banks to maintain an adequate level of unencumbered high-quality liquid assets sufficient to meet liquidity needs for a 30 calendar day time horizon.
Such proposals and legislation, if finally adopted, would change banking laws and our operating environment and that of our subsidiaries in ways that could be substantial and unpredictable. We cannot determine whether such proposals and legislation will be adopted, or the ultimate effect that such proposals and legislation, if enacted, or regulations issued to implement the same, would have upon our financial condition or results of operations.
Additional Activities. Susquehanna is a “financial holding company” (an “FHC”) under the GLB Act. As an FHC, we are permitted to engage, directly or through subsidiaries, in a wide variety of activities which are financial in nature or are incidental or complementary to a financial activity, in addition to all of the activities otherwise allowed to us. The additional activities permitted to us as an FHC (if we so determine to conduct them) include, among others, insurance and securities underwriting, merchant banking activities, issuing and selling annuities and securitized interests in financial assets, and engaging domestically in activities that bank holding companies previously have been permitted to engage in only overseas. All of these listed activities can be conducted, through an acquisition or on a start-up basis, generally without prior Federal Reserve Board approval and with only notice to the Federal Reserve Board afterward. Merchant banking activities will be substantially curtailed by the Volcker Rule provisions in the Dodd-Frank Act which become effective July 21, 2012.
The GLB Act also generally permits well-capitalized national banks and, if state law permits, well-capitalized state chartered banks, to form or acquire financial subsidiaries to engage in most of these same activities, with the exception of certain specified activities (insurance underwriting, for example) which must be conducted only at the level of the holding company or a non-bank subsidiary of the holding company. State chartered banks in Pennsylvania are generally allowed to engage (with proper regulatory authorization) in activities that are permitted to national banks.
As an FHC, Susquehanna is generally subject to the same regulation as other bank holding companies, including the reporting, examination, supervision and consolidated capital requirements of the Federal Reserve Board. To preserve our FHC status, we must remain well-capitalized and well-managed and ensure that Susquehanna Bank remains well-capitalized and well-managed for regulatory purposes and earns “satisfactory” or better ratings on its periodic Community Reinvestment Act (“CRA”) examinations. An FHC ceasing to meet these standards is subject to a variety of restrictions, depending on the circumstances.
If the Federal Reserve Board determines that we or any of the FHC’s subsidiary depository institutions are either not well-capitalized or not well-managed, we or the subsidiary must notify the FHC. Until compliance is restored, the Federal Reserve Board has broad discretion to impose appropriate limitations on the FHC’s activities. If compliance is not restored within 180 days, the Board may ultimately require the FHC to divest its depository institutions or in the alternative, to discontinue or divest any activities that are permitted only to non-FHC bank holding companies.
If the Federal Reserve Board determines that the FHC or its subsidiaries do not satisfy the CRA requirements, the potential restrictions are different. In that case, until all the subsidiary institutions are restored to at least “satisfactory” CRA rating status, the FHC may not engage, directly or through a subsidiary, in any of the additional activities permissible under the GLB Act nor make additional acquisitions of companies engaged
8
in the additional activities. However, completed acquisitions and additional activities and affiliations previously begun are left undisturbed, as the GLB Act does not require divestiture for this type of situation.
Capital Adequacy. Under the risk-based capital requirements presently applicable to them, bank holding companies must maintain a ratio of total capital to risk-weighted assets (including the asset equivalent of certain off-balance sheet activities such as acceptances and letters of credit) of not less than 8% (10% in order to be considered “well-capitalized”). At least 4% out of the total capital (6% to be well-capitalized) must be composed of common stock, related surplus, retained earnings, qualifying perpetual preferred stock and minority interests in the equity accounts of certain consolidated subsidiaries, after deducting goodwill and certain other intangibles (“tier 1 capital”). The remainder of total capital (“tier 2 capital”) may consist of certain perpetual debt securities, mandatory convertible debt securities, hybrid capital instruments and limited amounts of subordinated debt, qualifying preferred stock, allowance for loan and lease losses, allowance for credit losses on off-balance-sheet credit exposures, and unrealized gains on equity securities.
At December 31, 2011, our tier 1 capital and total capital (i.e., tier 1 plus tier 2) ratios were 13.7% and 15.4%, respectively.
The Federal Reserve Board has also established minimum leverage ratio guidelines for bank holding companies. These guidelines mandate a minimum leverage ratio of tier 1 capital to adjusted quarterly average total assets less certain amounts (“leverage amounts”) equal to 3% for bank holding companies meeting certain criteria (including those having the highest regulatory rating). All other banking organizations are generally required to maintain a leverage ratio of at least 3% plus an additional cushion of at least 100 basis points and in some cases more. The Federal Reserve Board’s guidelines also provide that bank holding companies experiencing internal growth or making acquisitions are expected to maintain capital positions substantially above the minimum supervisory levels without significant reliance on intangible assets. Furthermore, the guidelines indicate that the Federal Reserve Board will continue to consider a “tangible tier 1 leverage ratio” (i.e., after deducting all intangibles) in evaluating proposals for expansion or new activities. The Federal Reserve Board has not advised us of any specific minimum leverage ratio applicable to us. At December 31, 2011, our leverage ratio was 10.7%.
Susquehanna Bank is subject to similar capital standards promulgated by the Federal Reserve Board. The Federal Reserve Board has not advised the bank of any specific minimum leverage ratios applicable to it.
Prompt Corrective Action. The Federal Deposit Insurance Corporation Improvement Act of 1991, or FDICIA, requires the federal regulators to take prompt corrective action against any undercapitalized institution. FDICIA establishes five capital categories: well-capitalized, adequately capitalized, undercapitalized, significantly undercapitalized, and critically undercapitalized. Well-capitalized institutions significantly exceed the required minimum level for each relevant capital measure. Adequately capitalized institutions include depository institutions that meet but do not significantly exceed the required minimum level for each relevant capital measure. Undercapitalized institutions consist of those that fail to meet the required minimum level for one or more relevant capital measures. Significantly undercapitalized characterizes depository institutions with capital levels significantly below the minimum requirements for any relevant capital measure. Critically undercapitalized refers to depository institutions with minimal capital and at serious risk for government seizure.
Under certain circumstances, a well-capitalized, adequately capitalized or undercapitalized institution may be treated as if the institution were in the next lower capital category. A depository institution is generally prohibited from making capital distributions, including paying dividends, or paying management fees to a holding company if the institution would thereafter be undercapitalized. Institutions that are adequately capitalized but not well-capitalized cannot accept, renew or roll over brokered deposits except with a waiver from the FDIC and are subject to restrictions on the interest rates that can be paid on such deposits. Undercapitalized institutions may not accept, renew or roll over brokered deposits.
9
The federal bank regulatory agencies are permitted or, in certain cases, required to take certain actions with respect to institutions falling within one of the three undercapitalized categories. Depending on the level of an institution’s capital, the agency’s corrective powers include, among other things:
| | • | | prohibiting the payment of principal and interest on subordinated debt; |
| | • | | prohibiting the holding company from making distributions without prior regulatory approval; |
| | • | | placing limits on asset growth and restrictions on activities; |
| | • | | placing additional restrictions on transactions with affiliates; |
| | • | | restricting the interest rate the institution may pay on deposits; |
| | • | | prohibiting the institution from accepting deposits from correspondent banks; and |
| | • | | in the most severe cases, appointing a conservator or receiver for the institution. |
A banking institution that is undercapitalized is required to submit a capital restoration plan, and such a plan will not be accepted unless, among other things, the banking institution’s holding company guarantees the plan up to a certain specified amount. Any such guarantee from a depository institution’s holding company is entitled to a priority of payment in bankruptcy. As of December 31, 2011, Susquehanna Bank exceeded the required capital ratios for classification as “well capitalized.”
Federal Deposit Insurance.The increases in deposit insurance described above under “Supervision and Regulation,” the FDIC’s expanded authority to increase insurance premiums, as well as the recent increase in the number of bank failures, is expected to result in an increase in deposit insurance assessments for all banks, including Susquehanna Bank. The FDIC, absent extraordinary circumstances, is required by law to return the insurance reserve ratio to a 1.15 percent ratio no later than the end of 2013. Following seven quarters of decline, the Deposit Insurance Fund became positive in the second quarter of 2011, with reported balances of $3.9 billion at June 30, 2011. Citing extraordinary circumstances, the FDIC has extended the time within which the reserve ratio must be restored to 1.15 from five to eight years.
If the FDIC is appointed conservator or receiver of a bank upon the bank’s insolvency or the occurrence of other events, the FDIC may sell some, part or all of a bank’s assets and liabilities to another bank or repudiate or disaffirm most types of contracts to which the bank was a party if the FDIC believes such contract is burdensome. In resolving the estate of a failed bank, the FDIC as receiver will first satisfy its own administrative expenses, and the claims of holders of U.S. deposit liabilities also have priority over those of other general unsecured creditors.
Source of Strength Doctrine. Under new provisions in the Dodd-Frank Act, as well as Federal Reserve Board policy and regulation, a bank holding company must serve as a source of financial and managerial strength to each of its subsidiary banks and is expected to stand prepared to commit resources to support each of them. Consistent with this, the Federal Reserve Board has stated that, as a matter of prudent banking, a bank holding company should generally not maintain a given rate of cash dividends unless its net income available to common shareholders has been sufficient to fully fund the dividends and the prospective rate of earnings retention appears to be consistent with the organization’s capital needs, asset quality, and overall financial condition.
USA Patriot Act of 2001. A major focus of governmental policy applicable to financial institutions in recent years has been the effort to combat money laundering and terrorism financing. The USA Patriot Act of 2001 (“Patriot Act”) was enacted to strengthen the ability of the U.S. law enforcement and intelligence communities to achieve this goal. The Patriot Act requires financial institutions, including our banking and broker-dealer subsidiaries, to assist in the prevention, detection and prosecution of money laundering and the financing of terrorism. The Patriot Act established standards to be followed by institutions in verifying client identification when accounts are opened and provides rules to promote cooperation among financial institutions, regulators and law enforcement organizations in identifying parties that may be involved in terrorism or money laundering.
10
Regulation of Non-bank Subsidiaries. In addition to Susquehanna Trust & Investment Company, we have other primary non-bank subsidiaries whose activities subject them to licensing and regulation. Boston ServiceCompany, Inc. (t/a Hann Financial Service Corp.) is organized under the laws of New Jersey. It is regulated by Connecticut as a motor vehicle leasing company, by Delaware as a finance or small loan agency and a motor vehicle lessor, and by New Jersey and Pennsylvania as a sales finance company. Valley Forge AssetManagement Corp. is organized under the laws of Pennsylvania. It is registered with the Securities and Exchange Commission (the “SEC”) as an investment advisor and broker dealer and is a member of the Financial Industry Regulatory Authority (“FINRA”). It is licensed to do business as a broker dealer in 28 states and as an investment advisor in 26 states. In addition, VFAM also carries an insurance license with 5 states. Stratton Management Company is registered as an investment advisor with the SEC and makes Notice filings with 17 states in which the firm has clients. The Addis Group, LLC is organized under the laws of Pennsylvania. It islicensed with the Pennsylvania Insurance Commissioner and the insurance commissioners of 47 other states. As a result of changes contained in the Dodd-Frank Act, the Federal Reserve may examine any subsidiary of a bank holding company.
Privacy. Title V of the GLB Act is intended to increase the level of privacy protection afforded to customers of financial institutions, including customers of the securities and insurance affiliates of such institutions, partly in recognition of the increased cross-marketing opportunities created by the GLB Act’s elimination of many of the boundaries previously separating various segments of the financial services industry. Among other things, these provisions require institutions to have in place administrative, technical, and physical safeguards to ensure the security and confidentiality of customer records and information, to protect against anticipated threats or hazards to the security or integrity of such records, and to protect against unauthorized access to or use of such records that could result in substantial harm or inconvenience to a customer. The GLB Act also requires institutions to furnish consumers at the outset of the relationship and annually thereafter written disclosures concerning the institution’s privacy policies.
National Monetary Policy. In addition to being affected by general economic conditions, the earnings and growth of Susquehanna and our subsidiaries are affected by the policies of the Federal Reserve Board. An important function of the Federal Reserve Board is to regulate the money supply and credit conditions. Among the instruments used by the Federal Reserve Board to implement these objectives are open market operations in U.S. Government securities, adjustments of the discount rate, and changes in reserve requirements against bank deposits. These instruments are used in varying combinations to influence overall economic growth and the distribution of credit, bank loans, investments, and deposits. Their use also affects interest rates charged on loans or paid on deposits.
The monetary policies and regulations of the Federal Reserve Board have had a significant effect on the operating results of commercial banks in the past and are expected to continue to do so in the future. The effects of such policies upon our future business, earnings, and growth cannot be predicted.
11
Executive Officers of the Registrant
As of December 31, 2011, the executive officers of Susquehanna, their ages and their positions with Susquehanna, are set forth in the following table:
| | | | | | |
Name | | Age | | | Title |
William J. Reuter | | | 62 | �� | | Chairman of the Board and Chief Executive Officer |
Eddie L. Dunklebarger | | | 57 | | | Vice Chairman and President |
Gregory A. Duncan | | | 56 | | | Executive Vice President and Chief Operating Officer |
Drew K. Hostetter | | | 57 | | | Executive Vice President, Treasurer and Chief Financial Officer |
Edward Balderston, Jr. | | | 64 | | | Executive Vice President and Chief Administrative Officer (1) |
Michael M. Quick | | | 63 | | | Executive Vice President and Chief Corporate Credit Officer |
James G. Pierné | | | 60 | | | Executive Vice President (1) |
Bernard A. Francis, Jr. | | | 61 | | | Senior Vice President and Group Executive |
Rodney A. Lefever | | | 45 | | | Senior Vice President and Chief Technology and Operations Officer |
Lisa M. Cavage | | | 47 | | | Senior Vice President, Secretary and Counsel |
Edward J. Wydock | | | 55 | | | Senior Vice President and Chief Risk Officer |
Joseph R. Lizza | | | 53 | | | Senior Vice President |
Michael E. Hough | | | 47 | | | Senior Vice President |
John H. Montgomery | | | 49 | | | Senior Vice President |
| (1) | Mr. Balderston and Mr. Pierné retired from their respective positions effective December 31, 2011. |
William J. Reuter has been a Director of Susquehanna since 1999 and became Chairman of the Board in May 2002. He has been Chief Executive Officer since May 2001, and served as President from January 2000 until June 2008. For the past five years he has been Chairman of the Board of our subsidiaries Susquehanna Bank and Valley Forge Asset Management Corp., and he has been a Director of Boston Service Company, Inc. (t/a Hann Financial Service Corp.) and The Addis Group, LLC. He has been a Director of Stratton Management Company and Semper Trust Company since May 2008.
Eddie L. Dunklebarger has been a Director of Susquehanna since November 2007 (when Susquehanna acquired Community Banks, Inc.), and has been President and Vice Chairman of the Board since January 2011. From June 2008 until his appointment to President and Vice Chairman in January 2011, he served and Susquehanna’s President and Chief Operating Officer. From November 2007 until he was named President and Chief Operating Officer, he was Vice Chairman of the Board and an Executive Vice President. He is also Vice Chairman and a Director of our subsidiary, Susquehanna Bank, and was previously Susquehanna Bank’s President and Chief Executive Officer. From 1998 to 2007, he served in various roles at Community, including being its Chairman of the Board, President and Chief Executive Officer. He also served from 1999 to 2007 as President and Chief Executive Officer of Community’s subsidiary bank.
Gregory A. Duncan was appointed Executive Vice President and Chief Operating Officer in January 2011. From September 2009 to August 2010, he served as Executive Vice President and Chief Operating Officer of First Interstate Bancsystem, Inc. and served as its Chief Banking Officer from May 2008 to September 2009. In addition, Mr. Duncan also served as a director of First Interstate Bank from June 2008 to August 2010 and was a director of First Western Bank and The First Western Bank Sturgis from June 2008 until the two banks were merged into First Interstate Bank in September 2009. Prior to joining First Interstate Bancsystem, Inc. in May 2008, Mr. Duncan served as President and Chief Executive Officer of Susquehanna Bank PA since October 2005 and Executive Vice President of Susquehanna since January 2000. From May 2001 until May 2007, he also served as Chief Operating Officer of Susquehanna. Prior to those appointments, Mr. Duncan served in various executive positions within Susquehanna or its subsidiaries since 1987.
Drew K. Hostetter was appointed Executive Vice President in May 2001 and has been Treasurer and Chief Financial Officer since 1998. He has also been Chairman of our subsidiary, Hann Financial Service Corp., since February 2004.
12
Edward Balderston, Jr. was appointed Executive Vice President and Chief Administrative Officer in June 2004. From May 2001 until his appointment as Executive Vice President and Chief Administrative Officer, he was Senior Vice President and Group Executive. Mr. Balderston retired as of December 31, 2011.
Michael M. Quick was appointed Executive Vice President and Chief Corporate Credit Officer in July 2007. Prior to such time, commencing in June 2004, he served in several capacities, including Executive Vice President and Group Executive and Senior Vice President and Group Executive. From June 2006 until October 2008, he was Chairman of Susquehanna Bank DV (including its predecessor Susquehanna Patriot Bank). From March 1998 through June 2006, he continuously held numerous executive positions with predecessor banks of Susquehanna Bank DV, including as Chairman, Chief Executive Officer and President.
James G. Pierné was appointed Executive Vice President and Group Executive in May 2007. From May 2001 until his appointment as Executive Vice President and Group Executive, he held executive positions including Senior Vice President and Group Executive. He was appointed President and Chief Executive Officer of Susquehanna Bank in April 2009. From 1993 through April 2009, he continuously held various executive positions with predecessor banks of Susquehanna Bank, including Senior Vice President, Executive Vice President, Managing Director – Retail Banking Services/Marketing, and Chairman, President and Chief Executive Officer. He has also been a Director of Susquehanna Bank since May 2009. Mr. Pierné retired as of December 31, 2011.
Bernard A. Francis, Jr. was appointed Senior Vice President and Group Executive in May 2005. From June 2004 until his appointment as Senior Vice President and Group Executive, he was Vice President. He has also been President and Chief Executive Officer of Valley Forge Asset Management Corp. since March 2000, Chief Investment Officer of Susquehanna Trust & Investment Company since November 2001, Chairman of the Board of Stratton Management Company since April 2008, Chairman of the Board of Semper Trust Company since April 2008 and a Director of Stratton Funds, Inc. since April 2008.
Rodney A. Lefever was appointed Senior Vice President and Chief Technology and Operations Officer in May 2010. From April 2001 until his appointment as Senior Vice President and Chief Technology and Operations Officer, he served as Senior Vice President and Chief Technology Officer. From March 1995 until he joined Susquehanna in 2001, he held various executive positions at other companies, including serving as Director, Earthlink Everywhere, Earthlink, Inc., as the President of New Business Development, OneMain.com Inc. and as the President of D&E Supernet (and its predecessors).
Lisa M. Cavage was appointed Senior Vice President in May 2005. From May 2001 until her appointment as Senior Vice President, she was Vice President. She has been Counsel to Susquehanna since March 1998.
Edward J. Wydock was appointed Senior Vice President and Chief Risk Officer in May 2007. From May 2002 until his appointment as Senior Vice President and Chief Risk Officer, he served as Vice President and Chief Audit Executive. Prior to joining Susquehanna, he served as Director of Internal Audit and Risk Consulting Services with PricewaterhouseCoopers LLP from March 1997 to May 2002.
Joseph R. Lizza was appointed Senior Vice President and Group Executive in April 2007. He was appointed President of the DV Division of Susquehanna Bank in May 2009. Prior to such time, commencing in February 2000, he continuously served in various executive positions at Susquehanna Bank and its predecessor banks, including Senior Executive Vice President – Risk Management, Managing Director – DV Division, and President and Chief Executive Officer.
Michael E. Hough was appointed Senior Vice President in June 2008. He was appointed President of the MD Division of Susquehanna Bank in May 2009. Prior to such time, commencing in 2003, he served continuously in various executive positions at Susquehanna Bank and its predecessor banks, including Executive
13
Vice President, Senior Executive Vice President, Managing Director – Maryland Division, and President and Chief Operating Officer.
John H. Montgomery was appointed Senior Vice President in June 2008. He was appointed President of the PA Division of Susquehanna Bank in December 2010. From May 2009 until his appointment as President of the PA Division of Susquehanna Bank, he was Managing Director – Commercial Division of Susquehanna Bank. Prior to such time, commencing in September 2005, he served continuously in various executive positions with Susquehanna Bank and its predecessor banks, including, Senior Executive Vice President of Susquehanna Bank PA’s Business Banking and Agricultural Banking division, Senior Vice President and Regional Executive, and Managing Director – Pennsylvania Division. From November 1996 until he joined Susquehanna in September 2005, he served various positions with Community Banks and its predecessors, most recently as Senior Vice President and Regional President.
There are no family relationships among the executive officers of Susquehanna. The executive officers are elected or appointed by the Board of Directors of Susquehanna and serve until the appointment or election and qualification of their successor or their earlier death, resignation or removal. There are no arrangements or understandings between any of them and any other person pursuant to which any of them was selected an officer of Susquehanna.
Item 1A. Risk Factors
Recent Market, Legislative and Regulatory Events
Difficult conditions in the capital markets and the economy generally may materially adversely affect our business and results of operations, and we do not expect these conditions to significantly improve in the near future.
Our results of operations are materially affected by conditions in the capital markets and the economy generally, which in recent years have produced downward pressure on stock prices of, and credit availability to, certain companies without regard to those companies’ underlying financial strength.
Concerns over unemployment, energy costs, the availability and cost of credit, the U.S. mortgage market, a depressed U.S. real estate market and geopolitical issues such as sovereign-debt defaults and euro-zone political uncertainty have contributed to increased volatility and diminished expectations for the economy and the capital and credit markets in the near term. As a result, the market for fixed income instruments has experienced decreased liquidity, increased price volatility, credit downgrade events, and increased probability of default. Securities that are less liquid are more difficult to value and may be hard to dispose of. Domestic and international equity markets have also experienced periods of heightened volatility and turmoil, with issuers (such as our company) that have exposure to the real estate, mortgage, automobile and credit markets particularly affected. These events and other market disturbances may have an adverse effect on us, in part because we have a large investment portfolio and also because we are dependent upon customer behavior. Our revenues are susceptible to decline in such circumstances, and our profit margins could erode. In addition, in the event of extreme and prolonged market events, such as the global credit crisis, we could incur significant losses. Even in the absence of a market downturn, we are exposed to substantial risk of loss due to market volatility.
Factors such as consumer spending, business investment, government spending, the volatility and strength of the capital markets, and inflation all affect the business and economic environment and, ultimately, the profitability of our business. In an economic downturn characterized by higher unemployment, lower family income, lower corporate earnings, lower business investment and lower consumer spending, the demand for our financial products could be adversely affected. Adverse changes in the economy could affect earnings negatively and could have a material adverse effect on our business, results of operations and financial condition. The economic slowdown has resulted in legislative and regulatory actions including the enactment of the Dodd-Frank
14
Act that will further impact our business. In addition, we cannot predict whether there will be additional legislative or regulatory actions, when such actions may occur or what impact, if any, such actions could have on our business, results of operations and financial condition.
The soundness of other financial institutions could adversely affect us.
Our ability to engage in funding transactions could be adversely affected by the actions and failure of other financial institutions. Financial services institutions are interrelated as a result of trading, clearing, counterparty, or other relationships. We have exposure to many different industries and counterparties, and we routinely execute transactions with counterparties in the financial services industry, including brokers and dealers, commercial banks, investment banks, mutual and hedge funds, and other institutional clients. As a result, defaults by, or even questions or rumors about, one or more financial services institutions, or the financial services industry generally, have led to market-wide liquidity problems and could lead to losses or defaults by us or other institutions. Many of these transactions expose us to credit risk in the event of default of our counterparty or client. In addition, our credit risk may be exacerbated when the collateral held by us cannot be realized upon or is liquidated at prices not sufficient to recover the full amount of the loan or derivative exposure due us. Losses related to these credit risks could materially and adversely affect our results of operations or earnings.
We may be required to pay significantly higher Federal Deposit Insurance Corporation premiums in the future.
Following the recent financial crisis, higher levels of bank failures have dramatically increased resolution costs of the FDIC and depleted the Deposit Insurance Fund (“DIF”). In addition, the FDIC now insures deposit accounts up to $250,000 per customer (up from $100,000), and non-interest bearing transactional accounts are fully insured (unlimited coverage) through December 2012. These programs placed additional stress on the DIF.
The Dodd-Frank Act broadened the base for FDIC deposit insurance assessments. Assessments are now based on the average consolidated total assets less tangible equity capital of a financial institution, rather than deposits. The Dodd-Frank Act also permanently increases the maximum amount of deposit insurance to $250,000 per account and non-interest bearing transaction accounts have unlimited deposit insurance through December 31, 2012. The legislation also increases the required minimum reserve ratio for the DIF, from 1.15% to 1.35% of insured deposits, removes the statutory cap for the reserve ratio, leaving the FDIC with discretion to set this cap going forward, and directs the FDIC to offset the effects of increased assessments on depository institutions with less than $10 billion in assets. Recent FDIC regulations revise the risk-based assessment system for all large insured depository institutions (generally institutions with at least $10 billion in total assets, such as Susquehanna Bank). Under the regulations, the FDIC uses a scorecard method to calculate assessment rates for all such institutions.
We are generally unable to control the amount of premiums that we are required to pay for FDIC insurance. If there are additional bank or financial institution failures, we may be required to pay even higher FDIC premiums than the recently increased levels. Additionally, the FDIC may make material changes to the calculation of the prepaid assessment from the current proposal. Any future changes in the calculation or assessment of FDIC insurance premiums may have a material adverse effect on our results of operations, financial condition and our ability to continue to pay dividends on our common shares at the current rate or at all.
Recent legislative and regulatory initiatives to support the financial services industry have been coupled with numerous restrictions and requirements that could detrimentally affect our business and require us to raise additional capital.
As a publicly traded company, we are subject to various requirements and restrictions under the Dodd-Frank Act, regardless of our participation in federal programs. See “Supervision and Regulation” above. The Dodd-Frank Act requires publicly traded companies to give stockholders a non-binding vote on executive
15
compensation and so-called “golden parachute” payments, authorizes the SEC to promulgate rules permitting stockholders to nominate candidates using a company’s proxy materials and requires that listed companies implement and disclose “clawback” policies for recovery of incentive compensation paid to executive officers in connection with accounting restatements. In addition, the Dodd-Frank Act also authorizes and directs various agencies to promulgate new rules and regulations, the impact of which we cannot predict with any certainty. The legislation also directs the Federal Reserve Board to promulgate rules prohibiting excessive compensation paid to bank holding company executives, regardless of whether the company is publicly traded or not.
In addition, the new, yet to be written implementing rules and regulations of the Dodd-Frank Act, as well as any proposals for new legislation that are introduced in the U.S. Congress, could further substantially increase regulation of the financial services industry and impose restrictions on the ability of firms within the industry to conduct business consistent with historical practices, including aspects such as compensation, interest rates, new and inconsistent consumer protection regulations and mortgage regulation, among others. Federal and state regulatory agencies also frequently adopt changes to their regulations or change the manner in which existing regulations are applied. We cannot predict the substance or impact of pending, future and certain newly-enacted legislation or regulation, or the application thereof. Compliance with such current and potential regulation and scrutiny may significantly increase our costs, impede the efficiency of our internal business processes, require us to increase our regulatory capital, require us to invest significant management attention and resources and limit our ability to pursue business opportunities in an efficient manner.
The provisions of the Dodd-Frank Act restricting bank interchange fees, and any rules promulgated thereunder, may negatively impact our revenues and earnings.
On June 28, 2011, the Federal Reserve Board approved a final debit card interchange rule that would cap an issuer’s base fee at 21 cents per transaction and allow an additional 5 basis-point charge per transaction to help cover fraud losses. The Federal Reserve Board issued an interim final rule that also allows a fraud-prevention adjustment of 1 cent per transaction conditioned upon an issuer adopting effective fraud prevention policies and procedures. The Federal Reserve Board also adopted requirements that issuers include two unaffiliated networks for routing debit transactions. Compliance for most types of debit cards is required by April 1, 2012. The effective date for the pricing restrictions is October 1, 2011. The new pricing restriction is expected to impact banks by up to an approximate 45% reduction of revenue related to these transactions. We expect that the debit card interchange rule will reduce our interchange fee revenue similar with these expectations.
Negative developments in the financial industry and the credit markets may subject us to additional regulation.
As a result of recent global financial instability, the potential exists for new federal or state laws and regulations regarding lending and funding practices and liquidity standards to be promulgated, and bank regulatory agencies are expected to be active in responding to concerns and trends identified in examinations, including the expected issuance of many formal enforcement orders. Negative developments in the financial industry and the domestic and international credit markets, and the impact of new legislation in response to those developments, may negatively impact our operations by restricting our business operations, including our ability to originate or sell loans, and may adversely impact our financial performance.
Our growth may require us to raise additional capital in the future, but that capital may not be available when it is needed.
We are required by regulatory authorities to maintain adequate levels of capital to support our operations. The Dodd-Frank Act sets a statutory floor for risk-based and leverage capital standards. See “Supervision and Regulation” above. We anticipate that our current capital levels will satisfy our regulatory requirements for the foreseeable future. We may at some point, however, need to raise additional capital to support our continued growth. Our ability to raise additional capital will depend, in part, on conditions in the capital markets at that
16
time, which are outside our control, and on our financial performance. Accordingly, we may be unable to raise additional capital, if and when needed, on terms acceptable to us, or at all. If we cannot raise additional capital when needed, our ability to further expand our operations through internal growth and acquisitions could be materially impaired. In addition, if we decide to raise additional equity capital, our shareholders’ interests in us could be diluted.
Continued economic weakness, especially affecting our geographic market areas, could reduce our customer base, our level of deposits and demand for financial products, such as loans.
Our success significantly depends upon the growth in population, income levels, deposits and housing starts in our geographic markets. If the communities in which we operate do not grow, or if prevailing economic conditions locally or nationally are unfavorable, our business may suffer. Unlike many larger institutions, we are not able to spread the risks of unfavorable local economic conditions across a large number of diversified economies and geographic locations. A prolonged economic downturn could, therefore, result in losses that could materially and adversely affect our business. A further weakening of the economic environment could also lead to a decline in our operations, and could result in a decline in the implied fair value of goodwill. If the fair value of goodwill is less than the carrying value, we many recognize an other-than-temporary impairment charge.
Business and Industry Risks
We may not be able to continue to grow our business, which may adversely impact our results of operations.
Our total assets have grown from approximately $13.1 billion at December 31, 2007, to $15.0 billion at December 31, 2011. Our business strategy calls for continued expansion. Our ability to continue to grow depends, in part, upon our ability to open new branch locations, successfully attract deposits, identify favorable loan and investment opportunities, and acquire other bank and non-bank entities. In the event that we do not continue to grow, our results of operations could be adversely impacted.
Our ability to grow successfully will depend on whether we can continue to fund this growth while maintaining cost controls and asset quality, as well as on factors beyond our control, such as national and regional economic conditions and interest rate trends. If we are not able to control costs and maintain asset quality, such growth could adversely impact our earnings and financial condition.
Geographic concentration in one market may unfavorably impact our operations.
Substantially all of our business is with customers located within Pennsylvania, Maryland, and New Jersey, and our operations are heavily concentrated in the Mid-Atlantic region. As a result of this geographic concentration, our results depend largely on economic conditions in these and surrounding areas. Deterioration in economic conditions in this market could:
| | • | | increase loan delinquencies; |
| | • | | increase problem assets and foreclosures; |
| | • | | increase claims and lawsuits; |
| | • | | decrease the demand for our products and services; and |
| | • | | decrease the value of collateral for loans, especially real estate, in turn reducing customers’ borrowing power, the value of assets associated with nonperforming loans and collateral coverage. |
Generally, we make loans to small to mid-sized businesses whose success depends on the regional economy. These businesses generally have fewer financial resources in terms of capital or borrowing capacity than larger entities. Adverse economic and business conditions in our market area could reduce our growth rate, affect our
17
borrowers’ ability to repay their loans and, consequently, adversely affect our financial condition and performance. For example, we place substantial reliance on real estate as collateral for our loan portfolio. A sharp downturn in real estate values in our market area could leave many of our loans inadequately collateralized. If we are required to liquidate the collateral securing a loan to satisfy the debt during a period of reduced real estate values, our earnings could be adversely affected.
The inability to hire or retain key personnel could adversely affect our business.
Susquehanna and its subsidiaries face intense competition with various other financial institutions, as well as from non-bank providers of financial services, such as credit unions, brokerage firms, insurance agencies, consumer finance companies and government organizations, for the attraction and retention of key personnel, specifically those who generate and maintain our customer relationships and serve in other key operation positions in the areas of finance, credit oversight and administration, and wealth management. These competitors may offer greater compensation and benefits, which could result in the loss of potential and/or existing substantial customer relationships and may adversely affect our ability to compete effectively.
Our exposure to credit risk, because we focus on commercial lending, could adversely affect our earnings and financial condition.
There are certain risks inherent in making loans. These risks include interest rate changes over the time period in which loans may be repaid, risks resulting from changes in the economy, risks inherent in dealing with borrowers and, in the case of a loan backed by collateral, risks resulting from uncertainties about the future value of the collateral.
Commercial loans, including commercial real estate, are generally viewed as having a higher credit risk than residential real estate or consumer loans because they usually involve larger loan balances to a single borrower and are more susceptible to a risk of default during an economic downturn. Our consolidated commercial lending operations include commercial, financial and agricultural lending, real estate construction lending, and commercial mortgage lending, which comprised 17.9%, 7.9% and 30.0% of our total loan portfolio, respectively, as of December 31, 2011. Construction financing typically involves a higher degree of credit risk than commercial mortgage lending. Risk of loss on a construction loan depends largely on the accuracy of the initial estimate of the property’s value at completion of construction compared to the estimated cost (including interest) of construction. If the estimated property value proves to be inaccurate, the loan may be inadequately collateralized.
Because our loan portfolio contains a significant number of commercial real estate, commercial and industrial loans, and construction loans, the deterioration of these loans may cause a significant increase in nonperforming loans. An increase in nonperforming loans could cause an increase in loan charge-offs and a corresponding increase in the provision for loan losses, which could adversely impact our financial condition and results of operations.
If our allowance for loan and lease losses is not sufficient to cover actual loan and lease losses, our earnings would decrease.
In an attempt to mitigate any loan and lease losses that we may incur, we maintain an allowance for loan and lease losses based on, among other things, national and regional economic conditions, historical loss experience, and delinquency trends. However, we cannot predict loan and lease losses with certainty, and we cannot assure you that charge-offs in future periods will not exceed the allowance for loan and lease losses. If charge-offs exceed our allowance, our earnings would decrease. In addition, regulatory agencies, as an integral part of their examination process, review our allowance for loan and lease losses and may require additions to the allowance based on their judgment about information available to them at the time of their examination. Factors that require an increase in our allowance for loan and lease losses, such as a prolonged economic downturn or continued
18
weakening in general economic conditions such as inflation, recession, unemployment or other factors beyond our control, could reduce our earnings.
Susquehanna Bank could be required to repurchase mortgage loans or indemnify mortgage loan purchasers due to breaches of representations and warranties, borrower fraud, or certain borrower defaults, which could have a material adverse impact our liquidity, results of operations and financial condition.
Susquehanna Bank will be the successor to Graystone Tower Bank and its predecessor, the First National Trust Bank of Chester County (“FNBCC”). FNBCC operated a significant amount of mortgage banking activities through its American Home Bank Division (“AHB Division”). When FNBCC or Graystone Tower Bank sold mortgage loans through this division, they were required to make customary representations and warranties to purchasers about the mortgage loans and the manner in which they were originated. The whole loan sale agreements assumed by Susquehanna Bank through the Tower Merger require it to repurchase or substitute mortgage loans in the event there was a breach of any of these representations or warranties. In addition, Susquehanna Bank may be required to repurchase mortgage loans as a result of borrower fraud or in the event of early payment default of the borrower on a mortgage loan. Likewise, Susquehanna Bank is required to repurchase or substitute mortgage loans if it breaches a representation or warranty that was previously made in connection with a securitization. Although Susquehanna Bank may have remedies available against the originating broker or correspondent in these situations, those remedies may not be as broad as the remedies available to a purchaser of mortgage loans against Susquehanna Bank, and Susquehanna Bank faces further risk that the originating broker or correspondent may not have the financial capacity to perform remedies that otherwise may be available to it. Therefore, if a purchaser enforces its remedies, Susquehanna Bank may not be able to recover its losses from the originating broker or correspondent. If repurchase and indemnity demands increase significantly, our liquidity, results of operations and financial condition may be adversely affected.
Changes in interest rates may adversely affect our earnings and financial condition.
Our net income depends primarily upon our net interest income. Net interest income is income that remains after deducting, from total income generated by earning assets, the interest expense attributable to the acquisition of the funds required to support earning assets. Income from earning assets includes income from loans, investment securities and short-term investments. The amount of interest income is dependent on many factors including the volume of earning assets, the general level of interest rates, the dynamics of the change in interest rates, and the levels of nonperforming loans. The cost of funds varies with the amount of funds necessary to support earning assets, the rates paid to attract and hold deposits, rates paid on borrowed funds and the levels of non-interest-bearing demand deposits and equity capital.
Different types of assets and liabilities may react differently, and at different times, to changes in market interest rates. We expect that we will periodically experience “gaps” in the interest rate sensitivities of our assets and liabilities. That means either our interest-bearing liabilities will be more sensitive to changes in market interest rates than our interest-earning assets, or vice versa. When interest-bearing liabilities mature or reprice more quickly than interest-earning assets, an increase in market rates of interest could reduce our net interest income. Likewise, when interest-earning assets mature or reprice more quickly than interest-bearing liabilities, falling interest rates could reduce our net interest income. We are unable to predict changes in market interest rates, which are affected by many factors beyond our control, including inflation, recession, unemployment, money supply, domestic and international events, and changes in the United States and other financial markets.
We attempt to manage risk from changes in market interest rates, in part, by controlling the mix of interest- rate-sensitive assets and interest-rate-sensitive liabilities. However, interest-rate risk management techniques are not exact. A rapid increase or decrease in interest rates could adversely affect our results of operations and financial performance.
19
Competition from other financial institutions in originating loans, attracting deposits and providing various financial services may adversely affect our profitability.
Our banking subsidiary faces substantial competition in originating loans, both commercial and consumer. This competition comes principally from other banks, savings institutions, mortgage banking companies, and other lenders. Many of our competitors enjoy advantages, including greater financial resources and higher lending limits, a wider geographic presence, more accessible branch office locations, the ability to offer a wider array of services or more favorable pricing alternatives, as well as lower origination and operating costs. This competition could reduce our net income by decreasing the number and size of loans that our banking subsidiary originates and the interest rates it may charge on these loans.
In attracting business and consumer deposits, our bank subsidiary faces substantial competition from other insured depository institutions such as banks, savings institutions and credit unions, as well as institutions offering uninsured investment alternatives, including money market funds. Many of our competitors enjoy advantages, including greater financial resources, more aggressive marketing campaigns and better brand recognition and more branch locations. These competitors may offer higher interest rates than we do, which could decrease the deposits that we attract or require us to increase our rates to retain existing deposits or attract new deposits. Increased deposit competition could adversely affect our ability to generate the funds necessary for lending operations. As a result, we may need to seek other sources of funds that may be more expensive to obtain and could increase our cost of funds.
Our banking and non-banking subsidiaries also compete with non-bank providers of financial services, such as brokerage firms, consumer finance companies, credit unions, insurance companies and governmental organizations which may offer more favorable terms. Some of our non-bank competitors are not subject to the same extensive regulations that govern our banking operations. As a result, such non-bank competitors may have advantages over our banking and non-banking subsidiaries in providing certain products and services. This competition may reduce or limit our margins on banking and non-banking services, reduce our market share, and adversely affect our earnings and financial condition.
We continually encounter technological change, and we may have fewer resources than our competitors to continue to invest in technological improvements, which could reduce our ability to effectively compete.
The financial services industry is undergoing rapid technological changes with frequent introduction of new technology-driven products and services. In addition to better serving customers, the effective use of technology increases efficiency and enables financial service institutions to reduce costs. Our future success will depend, in part, upon our ability to address the needs of our customers by using technology to provide products and services to enhance customer convenience, as well as to create additional efficiencies in our operations. Many of our competitors have substantially greater resources to invest in technological improvements. There can be no assurance that we will be able to effectively implement new technology-driven products and services, which could reduce our ability to effectively compete.
Unauthorized disclosure of sensitive or confidential client or customer information, whether through a breach of our computer systems or otherwise, could severely harm our business.
As part of our business we collect, process, and retain sensitive and confidential client and customer information in both paper and electronic form. We have taken reasonable and prudent security measures to prevent the loss of this information, including steps to detect and deter cyber-related crimes intended to electronically infiltrate our network, capture sensitive client and customer information, deny service to customers via our website, and harm our electronic processing capability. Despite the security measures we have in place, our facilities and systems, and those of our third-party service providers, may be vulnerable to security breaches, acts of vandalism, computer viruses or compromises, misplaced or lost data, programming and/or human errors,
20
or other similar events. Any security breach involving the misappropriation, loss or other unauthorized disclosure of confidential customer information, whether by us or by our vendors, could severely damage our reputation, expose us to the risks of litigation and liability, disrupt our operations and have a material adverse effect on our business.
We have been and will likely continue to be involved in a variety of litigation arising out of our business.
From time to time, we may be involved in a variety of litigation, claims or legal action arising out of our business. For instance, as a result of our acquisition of Abington Bancorp, Inc. (“Abington”) in October 2011, we became responsible for defending against a lawsuit filed against Abington by one of its vendors in May 2011. The vendor provided data processing services that Abington used to manage the data reflecting the status of, and transactions in, its customers’ accounts. Abington contracted with the vendor in 2009 to license a different data processing system from the vendor. When the vendor was unable to implement the new system successfully, Abington terminated the contract. The vendor has asserted claims against Abington arising from Abington’s termination of the contract, and it seeks approximately $5.8 million in damages.
Our insurance may not cover all claims that may be asserted against us, including the claim by Abington’s vendor or others. Any claims asserted, regardless of merit or eventual outcome, may harm our reputation and may cause us to incur significant expense. Substantial legal liability could materially adversely affect our business, financial condition or results of operations. In addition, we may not be able to obtain appropriate types or levels of insurance in the future, nor may we be able to obtain adequate replacement policies with acceptable terms, if at all.
Government regulation significantly affects our business.
The banking industry is heavily regulated, and such regulations are intended primarily for the protection of depositors and the federal deposit insurance funds, not shareholders. As a financial holding company, we are subject to regulation by the Federal Reserve Board. Our bank subsidiary, as of December 31, 2011, is also regulated by the Federal Reserve Board and is subject to regulation by the Pennsylvania Department of Banking and recently, the Consumer Financial Protection Bureau as to consumer financial services and products. These regulations affect lending practices, capital structure, investment practices, dividend policy, and growth. In addition, we have non-bank operating subsidiaries from which we derive income. Several of these non-bank subsidiaries engage in providing investment management and insurance brokerage services, industries which are also heavily regulated on both a state and federal level. In addition, newly enacted and amended laws, regulations, and regulatory practices affecting the financial service industry may result in higher capital requirements, higher insurance premiums and limit the manner in which we may conduct our business. Such changes may adversely affect us, including our ability to offer new products and services, obtain financing, attract deposits, make loans and leases and achieve satisfactory spreads, and may also result in the imposition of additional costs on us. As a public company, we are also subject to the corporate governance standards set forth in the Sarbanes-Oxley Act of 2002, as well as any applicable rules or regulations promulgated by the SEC and The NASDAQ Stock Market, LLC. Complying with these existing and any newly enacted standards, rules and regulations may impose administrative costs and burdens on us.
The Pennsylvania business corporation law and various anti-takeover provisions under our articles of incorporation could impede the takeover of the company.
Various Pennsylvania laws affecting business corporations may have the effect of discouraging offers to acquire Susquehanna, even if the acquisition would be advantageous to shareholders. In addition, we have various anti-takeover measures in place under our articles of incorporation. Any one or more of these measures may impede the takeover of Susquehanna without the approval of our board of directors and may prevent our shareholders from taking part in a transaction in which they could realize a premium over the current market price of our common stock.
21
Acquisitions may place additional burdens on our business and dilute our shareholders’ value.
We have recently completed acquisitions of Abington Bancorp, Inc. and Tower Bancorp, Inc. and we regularly evaluate merger and acquisition opportunities related to possible transactions with other financial institutions. As a result, negotiations may take place and future mergers or acquisitions involving cash, debt, or equity securities may occur at any time. We seek merger or acquisition partners that are culturally similar, have experienced management, and possess either significant market presence or have potential for improved profitability through financial management, economies of scale, or expanded services. However, it is possible that unexpected transaction costs such as taxes, fees or professional expenses or unexpected future operating expenses such as unanticipated costs to integrate the two businesses, increased personnel costs or increased taxes, as well as other types of unanticipated adverse developments, could have a material adverse effect on our results of operations and financial condition following a merger or acquisition. In addition, if actual costs are materially different than expected costs, such a merger or acquisition could have a significant dilutive effect on our earnings per share.
Item 1B. Unresolved Staff Comments
Not applicable.
Item 2. Properties
We reimburse our subsidiaries for space and services utilized. We also lease office space located at 13511 Label Lane, Hagerstown, Maryland, for our loan servicing center.
As of December 31, 2011, our bank subsidiary operated 240 branches and 27 free-standing automated teller machines. It owned 117 of the branches and leased the remaining 123. Fourteen (14) additional locations were owned or leased by Susquehanna Bank to facilitate operations and expansion. We believe that the properties currently owned and leased by our subsidiaries are adequate for present levels of operation.
As of December 31, 2011, the offices (including executive offices) of our bank subsidiary were as follows:
| | | | | | |
Subsidiary | | Location of Executive Office | | Executive Office
Owned/Leased | | Location of Offices (including executive office) |
| Susquehanna Bank | | 1570 Manheim Pike Lancaster, Pennsylvania | | Owned | | 240 banking offices in Adams, Bedford, Berks, Bucks, Chester, Cumberland, Dauphin, Delaware, Franklin, Lancaster, Lehigh, Luzerne, Lycoming, Montgomery, Northampton, Northumberland, Philadelphia, Schuylkill, Snyder, Union and York counties, Pennsylvania; Baltimore City, Allegany, Anne Arundel, Baltimore, Carroll, Garrett, Harford, Howard, Washington and Worcester counties, Maryland; Atlantic, Burlington, Camden, Cumberland and Gloucester counties, New Jersey; and Berkeley County, West Virginia |
22
As of December 31, 2011, the offices (including executive offices) of our non-bank subsidiaries were as follows:
| | | | | | |
Subsidiary | | Location of Executive Office | | Executive Office Owned/Leased | | Location of Offices (including executive office) |
| | | |
| Susquehanna Trust & Investment Company | | 1570 Manheim Pike Lancaster, Pennsylvania | | Leased | | 6 offices in Lancaster, Lycoming, Northumberland, Schuylkill and York counties, Pennsylvania; and Washington and Baltimore counties, Maryland |
| | | |
| Boston Service Company, Inc., t/a Hann Financial Service Corp. | | One Centre Drive Jamesburg, New Jersey | | Leased | | 2 offices located in Gloucester and Middlesex counties, New Jersey |
| | | |
| Valley Forge Asset Management Corp. | | 150 South Warner Road King of Prussia, Pennsylvania | | Leased | | 3 offices located in Lancaster and Montgomery counties, Pennsylvania, and New Castle County, Delaware |
| | | |
| The Addis Group, LLC | | 2500 Renaissance Boulevard King of Prussia, Pennsylvania | | Leased | | 1 office located in Montgomery County, Pennsylvania |
| | | |
| Stratton Management Company | | 610 West Germantown Pike Plymouth Meeting, Pennsylvania | | Leased | | 1 office located in Montgomery County, Pennsylvania |
Item 3. Legal Proceedings.
Susquehanna and its subsidiaries are engaged in lines of business that are heavily regulated and involve a large volume of financial transactions with numerous customers through offices in Pennsylvania, Maryland, New Jersey and West Virginia. Although we have developed policies and procedures to minimize the impact of legal noncompliance and other disputes, litigation presents an ongoing risk.
Overdraft Litigation
On July 29, 2011, Susquehanna Bank was named as a defendant in a purported class action lawsuit filed by two New Jersey customers of the bank in the United States District Court of Maryland. The suit challenges the manner in which checking account overdraft fees were charged and the policies related to the posting order of debit card and other checking account transactions. The suit makes claim under New Jersey’s consumer fraud act and under the common law for breach of contract, breach of the covenant of good faith and fair dealing, unconscionability, conversion and unjust enrichment. The case was transferred for pretrial proceedings to pending multi-district litigation in the U.S. District Court for the Southern District of Florida. No class has been certified and, at this stage of the lawsuit, it is not yet possible for us to estimate potential loss, if any. Although it is not possible to predict the ultimate resolution or financial liability with respect to this litigation, management, after consultation with legal counsel, currently does not anticipate that the aggregate liability, if any, arising out of this proceeding will have a material adverse effect on our financial position, or cash flows; although, at the present time, management is not in a position to determine whether such proceeding will have a material adverse effect on our results of operations in any future quarterly reporting period.
23
Lehman Litigation
In September 2010, Lehman Brothers Special Financing, Inc. (“LBSF”) filed suit in the United States Bankruptcy court for the Southern District of New York against certain indenture trustees, certain special-purpose entities (issuers) and a class of noteholders and trust certificate holders who received distributions from the trustees, including Susquehanna, to recover funds that were allegedly improperly paid to the noteholders in forty-seven separate collateralized debt obligation transactions (“CDO”). In June 2007, two of our affiliates each purchased $5.0 million in AAA rated Class A Notes of a CDO offered by Lehman Brothers, Inc. Concurrently with the issuance of the notes, the issuer entered into a credit swap with LBSF. Lehman Brothers Holdings, Inc. (“LBHI”) guaranteed LBSF’s obligations to the issuer under the credit swap. When LBHI filed for bankruptcy in September 2008, an Event of Default under the indenture occurred, and the trustee declared the notes to be immediately due and payable. Susquehanna was repaid its principal on the notes in September 2008. This legal proceeding is in its early stages of discovery; thus it is not yet possible for us to estimate potential loss, if any. Although it is not possible to predict the ultimate resolution or financial liability with respect to this litigation, management, after consultation with legal counsel, currently does not anticipate that the aggregate liability, if any, arising out of this proceeding will have a material adverse effect on our financial position, or cash flows; although, at the present time, management is not in a position to determine whether such proceeding will have a material adverse effect on our results of operations in any future quarterly reporting period.
Shareholder Litigation Related to the Merger with Abington
On March 17, 2011, a putative class action lawsuit was filed in the Court of Common Pleas, Montgomery County, Pennsylvania, against the directors of Abington and Susquehanna,RSD Capital vs. Robert W. White, et al., C.A. No. 2011-06590. The lawsuit in Montgomery County alleged that the named Abington directors, in approving the Abington merger agreement, tortuously interfered with a contractual relationship between Abington and its shareholders and interfered with a prospective economic advantage of the Abington shareholders. The complaint also purported to allege that Susquehanna also tortuously interfered with the same contract and alleged prospective economic advantage. Plaintiffs in the Montgomery County lawsuit, among other things, requested an unspecified amount of monetary damages as well as a temporary restraining order with respect to consummation of the Abington merger. The defendants filed Preliminary Objections seeking the dismissal of the complaint. On April 13, 2011, the court sustained defendants’ Preliminary Objections to the complaint, and entered an order dismissing the action against all defendants with prejudice.
On March 25, 2011, a putative class action lawsuit was filed by separate plaintiffs in the Court of Common Pleas, Philadelphia County, Pennsylvania, against Abington, Abington’s directors (other than Jack J. Sandoski) and Susquehanna,Exum, et al. vs. Robert W. White et al., C.A. No. 110302814. The lawsuit, which was also brought as a shareholders’ derivative suit on behalf of Abington, alleged, among other things, that the Abington board of directors breached its fiduciary duties in connection with its approval of the Abington merger agreement , that the disclosure provided in the joint proxy statement/prospectus of Susquehanna and Abington, dated March 18, 2011 and included in the registration statement on Form S-4 filed by Susquehanna with the SEC (File No. 333-172626), failed to provide required material information necessary for Abington’s shareholders to make a fully informed decision concerning the Abington merger agreement and the transactions contemplated thereby and that Susquehanna aided and abetted the Abington board of directors in breaching its fiduciary duties. The plaintiffs in the Philadelphia County requested, among other things, an unspecified amount of monetary damages and injunctive relief.
On April 12, 2011, the Plaintiffs in the Philadelphia County lawsuit filed a Stipulation of Dismissal to dismiss Susquehanna from the action. On April 25, 2011, solely to avoid the costs, risks and uncertainties inherent in litigation and without admitting any of the allegations in the complaint, Abington and the other named defendants entered into a Memorandum of Understanding with the plaintiffs in the Philadelphia County lawsuit. Susquehanna and the plaintiffs agreed to settle the lawsuit subject to court approval. On October 24, 2011, the court issued an order in which it granted final approval of the settlement, awarded $250,000 in attorney’s fees and expenses to the plaintiffs, and dismissed the plaintiffs’ claim with prejudice.
24
Shareholder Litigation Related to the Merger with Tower
On July 1, 2011, a verified shareholder derivative complaint was filed in the Court of Common Pleas of Dauphin County, Pennsylvania, against Tower, the members of its board of directors, and Susquehanna. The complaint in the lawsuit,Stephen Bushansky vs. Andrew S. Samuel, et. Al., C.A. No. 2011-cv-6519 (EQ) (the “Tower State Court”), asserts that the members of Tower’s board of directors (“Individual Defendants”) breached their fiduciary duties by causing Tower to enter into the Tower merger and further asserts that Susquehanna aided and abetted those alleged breaches of duties. The complaint seeks, among other relief, an order declaring that the Individual Defendants breached their fiduciary duties, awarding damages on behalf of Tower for the alleged breaches of fiduciary duties by the Individual Defendants (including punitive and actual damages, plaintiffs’ counsel fees and experts’ fees) and enjoining the Tower merger and the use of any defensive measures under the Tower merger agreement or rescinding the Tower merger (if consummated). On July 21, 2011, Mr. Bushansky served a written demand (the “Bushansky Demand”) on Tower’s board of directors alleging that the transaction was unfair, that the Individual Defendants breached their fiduciary duties and requesting that the Individual Defendants terminate the transaction as structured.
On July 8, 2011, a purported shareholder of Tower, James T. Duffey, served a written demand (the “Duffey Demand”) on Tower’s board of directors requesting that the board remedy its alleged failure to engage in an independent and fair process surrounding the Tower merger and requesting formation of a special committee to renegotiate the terms of the Tower merger.
On July 25, 2011, a purported shareholder of Tower, Edgar L. Johnston, Jr., served a written demand (“Johnston Demand”) on Tower’s board of directors requesting that the board remedy its alleged failure to engage in an independent and fair process surrounding the Tower merger.
On September 26, 2011, a class action and derivative complaint was filed in the United States District Court for the Middle District of Pennsylvania against Tower and the members of its board of directors. The complaint in the lawsuit,Edgar L. Johnston, Jr. vs. Andrew S. Samuel, et al., Case No. 11-1777, asserts that the members of Tower’s board of directors (“Individual Defendants”) breached their fiduciary duties by causing Tower to enter into the Tower merger and further assets that Susquehanna aided and abetted those alleged breaches of fiduciary duties (the “Tower Federal Action”). The lawsuit also alleged that the disclosure provided in the joint proxy statement/prospectus of Susquehanna and Tower (the “Tower Joint Proxy/Prospectus”) included in the registration statement on Form S-4 filed by Susquehanna with the SEC (File No. 333-176367), failed to provide required material information necessary for Tower’s shareholders to make a fully informed decision concerning the Tower merger in violation of Section 14(a) of the Exchange Act. The complaint seeks, among other relief, an order declaring that the Individual Defendants breached their fiduciary duties and that the Tower Joint Proxy/Prospectus is materially misleading in violation of the Exchange Act, accounting for and awarding damages on behalf of Tower for the alleged breaches of fiduciary duties by the Individual Defendants (including punitive and actual damages, plaintiff’s counsel fees and experts’ fees) and enjoining or rescinding the Tower merger (if consummated).
On September 28, 2011, solely to avoid the costs, risks and uncertainties inherent in litigation and without admitting any of the allegations in the complaint, Susquehanna, Tower and the other named defendants entered into a Memorandum of Understanding (the “MOU”). Under the terms of the MOU, Tower, the other named defendants and Susquehanna and all plaintiffs agreed to settle the Tower Federal Action, Tower State Action, the Bushansky Demand and the Duffey Demand, subject to court approval. If the court approves the settlement contemplated in the memorandum, the lawsuits will be dismissed with prejudice. In connection with the settlement, plaintiffs intend to seek an award of attorneys’ fees and expenses not to exceed $332,500 subject to court approval, and Tower and Susquehanna have agreed not to oppose plaintiffs’ application. The amount of the fee award to class counsel will ultimately be determined by the court. This payment will not affect the amount of merger consideration to be paid in the Tower merger. If the settlement is finally approved by the court, it is anticipated that it will resolve and release all claims in all actions that were or could have been brought
25
challenging any aspect of the Tower merger or merger agreement, and any disclosure made in connection therewith. There can be no assurance that the parties will ultimately enter into a stipulation of settlement or that the court will approve the settlement even if the parties were to enter into such stipulation. In such event, the proposed settlement as contemplated by the MOU may be terminated.
Other Legal Proceedings
From time to time, Susquehanna receives subpoenas and other requests for information from various federal and state governmental and regulatory authorities in connection with certain industry-wide, company-specific or other investigations or proceedings. Susquehanna’s policy is to fully cooperative with such inquiries. Susquehanna and certain of its subsidiaries have been named as defendants in various legal actions arising out of the normal course of business, including claims against entities to which Susquehanna is a successor as a result of business combinations. In the opinion of management, the ultimate resolution of these lawsuits should not have a material adverse effect on Susquehanna’s business, consolidated financial position or results of operations. It is possible, however, that future developments could result in an unfavorable ultimate outcome for or resolution of any one or more of the lawsuits in which Susquehanna or its subsidiaries are defendants, which may be material to Susquehanna’s results of operations for a particular quarterly reporting period. Litigation is inherently uncertain, and management cannot make assurances that Susquehanna will prevail in any of these actions, nor can management reasonably estimate the amount of damages that Susquehanna might incur.
Item 4. Mine Safety Disclosure.
Not applicable
26
PART II
Item 5. Market for Susquehanna’s Common Equity, Related Shareholder Matters and Issuer Purchases of Equity Securities
Market Information. Our common stock is listed for quotation on the Nasdaq Global Select Market under the symbol “SUSQ”. Set forth below are the quarterly high and low sales prices of our common stock as reported on the Nasdaq Global Select Market for the years 2011 and 2010, and cash dividends paid. The table represents prices between dealers and does not include retail markups, markdowns, or commissions, and does not necessarily represent actual transactions.
| | | | | | | | | | | | | | |
Year | | Period | | Cash
Dividends
Paid | | | Price Range Per
Share | |
| | | | Low | | | High | |
2011 | | 1st Quarter | | $ | 0.01 | | | $ | 8.63 | | | $ | 10.43 | |
| | 2nd Quarter | | | 0.02 | | | | 7.50 | | | | 9.89 | |
| | 3rd Quarter | | | 0.02 | | | | 5.25 | | | | 8.21 | |
| | 4th Quarter | | | 0.03 | | | | 5.20 | | | | 8.51 | |
| | | | |
2010 | | 1st Quarter | | $ | 0.01 | | | $ | 5.85 | | | $ | 9.82 | |
| | 2nd Quarter | | | 0.01 | | | | 7.59 | | | | 12.03 | |
| | 3rd Quarter | | | 0.01 | | | | 7.70 | | | | 9.44 | |
| | 4th Quarter | | | 0.01 | | | | 7.38 | | | | 10.20 | |
As of February 17, 2012, there were 12,674 record holders of Susquehanna common stock.
Dividend Policy. Dividends paid to our shareholders are provided from dividends paid to us by our subsidiaries. Our ability to pay dividends is largely dependent upon the receipt of dividends from Susquehanna Bank. Both federal and state laws impose restrictions on the ability of Susquehanna Bank to pay dividends. These include the Pennsylvania Banking Code of 1965, the Federal Reserve Act and the applicable regulations under such laws. In addition, the net capital rules of the SEC under the Securities Exchange Act of 1934 limit the ability of Valley Forge Asset Management Corp. and Stratton Management Company to pay dividends to us. In addition to the specific restrictions summarized below, the banking and securities regulatory agencies also have broad authority to prohibit otherwise permitted dividends proposed to be made by an institution regulated by them if the agency determines that their distribution would constitute an unsafe or unsound practice.
The Federal Reserve Board has issued policy statements which provide that, as a general matter, insured banks and bank holding companies should pay dividends only out of current operating earnings.
For state-chartered banks which are members of the Federal Reserve System, the approval of the Federal Reserve Board is required for the payment of dividends by the bank subsidiary in any calendar year if the total of all dividends declared by the bank in that calendar year, including the proposed dividend, exceeds the current year’s net income combined with the retained net income for the two preceding calendar years. “Retained net income” for any period means the net income for the period less any common or preferred stock dividends declared in that period. Moreover, no dividends may be paid by such bank in excess of its undivided profits account.
Dividends by a Pennsylvania state-chartered bank payable in cash or property other than shares may be paid only out of accumulated net earnings and are restricted by the requirement that the bank set aside to a surplus fund each year at least 10% of its net earnings until the bank’s surplus equals the amount of its capital (a requirement presently satisfied in the case of Susquehanna Bank). Furthermore, a Pennsylvania bank may not pay such a dividend if the payment would result in a reduction of the surplus account of the bank.
27
Stock Performance Graph. The following graph compares for fiscal years 2006 through 2011 the yearly change in the cumulative total return to holders of our common stock with the cumulative total return of the Nasdaq Composite Index, a broad market in which we participate, and the SNL Mid-Atlantic Bank Index, an index comprised of banks and related holding companies operating in the Mid-Atlantic region. The graph depicts the total return on an investment of $100 based on both stock price appreciation and reinvestment of dividends for Susquehanna, the companies represented by the Nasdaq Index, and the SNL Mid-Atlantic Bank Index.
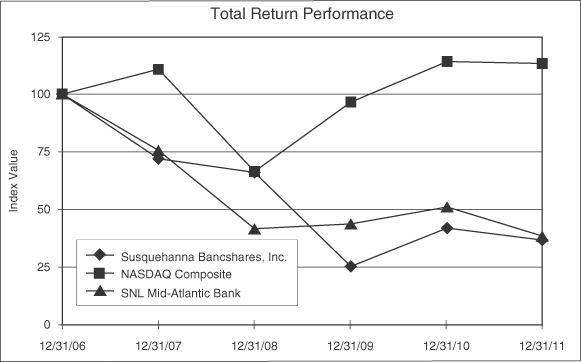
| | | | | | | | | | | | | | | | | | | | | | | | |
| | | Period Ending | |
Index | | 12/31/06 | | | 12/31/07 | | | 12/31/08 | | | 12/31/09 | | | 12/31/10 | | | 12/31/11 | |
Susquehanna Bancshares, Inc. | | | 100.00 | | | | 71.96 | | | | 66.02 | | | | 25.43 | | | | 41.99 | | | | 36.71 | |
NASDAQ Composite | | | 100.00 | | | | 110.66 | | | | 66.42 | | | | 96.54 | | | | 114.06 | | | | 113.16 | |
SNL Mid-Atlantic Bank | | | 100.00 | | | | 75.62 | | | | 41.66 | | | | 43.85 | | | | 51.16 | | | | 38.43 | |
Source : SNL Financial LC, Charlottesville, VA© 2012
28
Item 6. Selected Financial Data
Susquehanna Bancshares, Inc. & Subsidiaries
| | | | | | | | | | | | | | | | | | | | |
Years ended December 31, | | 2011 (1) | | | 2010 | | | 2009 | | | 2008 | | | 2007 (2) | |
| | | ( Amounts in thousands, except per share data) | |
Interest income | | $ | 594,768 | | | $ | 613,695 | | | $ | 643,824 | | | $ | 697,070 | | | $ | 526,157 | |
Interest expense | | | 161,618 | | | | 187,189 | | | | 235,008 | | | | 298,768 | | | | 250,254 | |
Net interest income | | | 433,150 | | | | 426,506 | | | | 408,816 | | | | 398,302 | | | | 275,903 | |
Provision for loan and lease losses | | | 110,000 | | | | 163,000 | | | | 188,000 | | | | 63,831 | | | | 21,844 | |
Noninterest income | | | 182,668 | | | | 152,148 | | | | 163,699 | | | | 142,309 | | | | 120,659 | |
Noninterest expenses | | | 460,180 | | | | 382,650 | | | | 382,472 | | | | 367,201 | | | | 276,955 | |
Income before taxes | | | 45,638 | | | | 33,004 | | | | 2,043 | | | | 109,579 | | | | 97,763 | |
Net income | | | 54,905 | | | | 31,847 | | | | 12,675 | | | | 82,606 | | | | 69,093 | |
Preferred stock dividends and accretion | | | — | | | | 15,572 | | | | 16,659 | | | | 792 | | | | 0 | |
Net income (loss) applicable to common shareholders | | | 54,905 | | | | 16,275 | | | | (3,984 | ) | | | 81,814 | | | | 69,093 | |
Cash dividends declared on common stock | | | 11,212 | | | | 4,757 | | | | 31,898 | | | | 89,462 | | | | 52,686 | |
| | | | | |
Per Common Share Amounts | | | | | | | | | | | | | | | | | | | | |
Net income: | | | | | | | | | | | | | | | | | | | | |
Basic | | $ | 0.40 | | | $ | 0.13 | | | $ | (0.05 | ) | | $ | 0.95 | | | $ | 1.23 | |
Diluted | | | 0.40 | | | | 0.13 | | | | (0.05 | ) | | | 0.95 | | | | 1.23 | |
Cash dividends declared on common stock | | | 0.08 | | | | 0.04 | | | | 0.37 | | | | 1.04 | | | | 1.01 | |
Dividend payout ratio | | | 20.4 | % | | | 29.2 | % | | | n/m | (3) | | | 109.3 | % | | | 76.3 | |
| | | | | |
Financial Ratios | | | | | | | | | | | | | | | | | | | | |
Return on average total assets | | | 0.38 | % | | | 0.23 | % | | | 0.09 | % | | | 0.62 | % | | | 0.78 | |
Return on average shareholders’ equity | | | 2.67 | | | | 1.53 | | | | 0.65 | | | | 4.80 | | | | 6.66 | |
Return on average tangible shareholders’ equity (4) | | | 6.01 | | | | 3.69 | | | | 2.19 | | | | 13.35 | | | | 11.56 | |
Average equity to average assets | | | 14.31 | | | | 15.00 | | | | 14.31 | | | | 12.92 | | | | 11.66 | |
Net interest margin | | | 3.60 | | | | 3.67 | | | | 3.58 | | | | 3.62 | | | | 3.67 | |
Efficiency ratio | | | 66.83 | | | | 64.62 | | | | 65.28 | | | | 66.46 | | | | 69.10 | |
| | | | | |
Capital Ratios | | | | | | | | | | | | | | | | | | | | |
Leverage | | | 10.73 | % | | | 10.27 | % | | | 9.73 | % | | | 9.92 | % | | | 10.24 | |
Tier 1 risk-based capital | | | 13.65 | | | | 12.65 | | | | 11.17 | | | | 11.17 | | | | 9.23 | |
Total risk-based capital | | | 15.41 | | | | 14.72 | | | | 13.48 | | | | 13.52 | | | | 11.31 | |
| | | | | |
Credit Quality | | | | | | | | | | | | | | | | | | | | |
Net charge-offs/Average loans and leases | | | 1.16 | % | | | 1.46 | % | | | 1.32 | % | | | 0.42 | % | | | 0.25 | |
Nonperforming assets/Loans and leases plus foreclosed real estate | | | 1.88 | | | | 2.23 | | | | 2.48 | | | | 1.20 | | | | 0.78 | |
ALLL/Nonaccrual loans and leases | | | 120 | | | | 97 | | | | 79 | | | | 108 | | | | 156 | |
ALLL/Total loans and leases | | | 1.80 | | | | 1.99 | | | | 1.75 | | | | 1.18 | | | | 1.01 | |
| | | | | |
Year-End Balances | | | | | | | | | | | | | | | | | | | | |
Total assets | | $ | 14,974,789 | | | $ | 13,954,085 | | | $ | 13,689,262 | | | $ | 13,682,988 | | | $ | 13,077,994 | |
Investment securities | | | 2,431,515 | | | | 2,417,611 | | | | 1,875,267 | | | | 1,879,891 | | | | 2,063,952 | |
Loans and leases, net of unearned income | | | 10,447,930 | | | | 9,633,197 | | | | 9,827,279 | | | | 9,653,873 | | | | 8,751,590 | |
Deposits | | | 10,290,472 | | | | 9,191,207 | | | | 8,974,363 | | | | 9,066,493 | | | | 8,945,119 | |
Total borrowings | | | 2,083,673 | | | | 2,371,161 | | | | 2,512,894 | | | | 2,428,085 | | | | 2,131,156 | |
Shareholders' equity | | | 2,189,628 | | | | 1,984,802 | | | | 1,981,081 | | | | 1,945,918 | | | | 1,729,014 | |
| | | | | |
Selected Share Data | | | | | | | | | | | | | | | | | | | | |
Common shares outstanding (period end) | | | 156,867 | | | | 129,966 | | | | 86,474 | | | | 86,174 | | | | 85,935 | |
Average common shares outstanding: | | | | | | | | | | | | | | | | | | | | |
Basic | | | 136,509 | | | | 121,031 | | | | 86,257 | | | | 85,987 | | | | 56,297 | |
Diluted | | | 136,876 | | | | 121,069 | | | | 86,257 | | | | 86,037 | | | | 56,366 | |
Common shareholders of record | | | 12,747 | | | | 11,301 | | | | 11,668 | | | | 12,035 | | | | 11,144 | |
At December 31: | | | | | | | | | | | | | | | | | | | | |
Book value per common share | | $ | 13.96 | | | $ | 15.27 | | | $ | 19.53 | | | $ | 19.21 | | | $ | 20.12 | |
Tangible book value per common share | | | 7.28 | | | | 7.18 | | | | 7.25 | | | | 6.77 | | | | 8.44 | |
Market price per common share | | | 8.38 | | | | 9.68 | | | | 5.89 | | | | 15.91 | | | | 18.44 | |
| (1) | On October 1, 2011, we completed our acquisition of Abington Bancorp, Inc. All transactions since the acquisition date are included in our consolidated financial statements. |
| (2) | On November 16, 2007, we completed our acquisition of Community Banks, Inc. All transactions since the acquisition date are included in our consolidated financial statements. |
29
| (4) | Supplemental Reporting of Non-GAAP-based Financial Measures |
Return on average tangible equity is a non-GAAP-based financial measure calculated using non-GAAP amounts. The most directly comparable measure is return on average shareholder equity, which is
calculated using GAAP-based amounts. We calculate return on average tangible equity by excluding the balance of intangible assets and their related amortization expense from our calculation of return on average shareholder equity. Management uses the return on average tangible equity in order to review our core operating results. This is consistent with the treatment by bank regulatory agencies which excludes goodwill and other intangible assets from the calculation of risk-based capital ratios. A reconciliation of return on average shareholder equity to return on average tangible equity is set forth below.
| (5) | 2011 adjusted for net realized gain on acquisition, merger related expenses, and loss on extinguishment of debt. |
| | | | | | | | | | | | | | | | | | | | |
| | | 2011 | | | 2010 | | | 2009 | | | 2008 | | | 2007 | |
Return on average shareholder equity (GAAP basis) | | | 2.67 | % | | | 1.53 | % | | | 0.65 | % | | | 4.80 | % | | | 6.66 | % |
Effect of excluding average intangible assets and related amortization | | | 3.34 | | | | 2.16 | | | | 1.54 | | | | 8.55 | | | | 4.90 | |
Return on average tangible equity | | | 6.01 | | | | 3.69 | | | | 2.19 | | | | 13.35 | | | | 11.56 | |
Item 7. Management’s Discussion and Analysis of Financial Condition and Results of Operations
The following pages of this report present management’s discussion and analysis of the consolidated financial condition and results of operations of Susquehanna Bancshares, Inc. and its subsidiaries.
Certain statements in this document may be considered to be “forward-looking statements” as that term is defined in the U.S. Private Securities Litigation Reform Act of 1995, such as statements that include the words “expect,” “estimate,” “project,” “anticipate,” “should,” “intend,” “probability,” “risk,” “target,” “objective” and similar expressions or variations on such expressions. In particular, this document includes forward-looking statements relating, but not limited to, general economic conditions; the impact of new regulations on our business; our potential exposures to various types of market risks, such as interest rate risk and credit risk; whether our allowance for loan and lease losses is adequate to meet probable loan and lease losses; our ability to achieve loan growth; our ability to maintain sufficient liquidity; our ability to manage credit quality; and our ability to achieve our 2011 financial goals. Such statements are subject to certain risks and uncertainties. For example, certain of the market risk disclosures are dependent on choices about essential model characteristics and assumptions and are subject to various limitations. By their nature, certain of the market-risk disclosures are only estimates and could be materially different from what actually occurs in the future. As a result, actual income gains and losses could materially differ from those that have been estimated. Other factors that could cause actual results to differ materially from those estimated by the forward-looking statements contained in this document include, but are not limited to:
| | • | | adverse changes in our loan and lease portfolios and the resulting credit-risk-related losses and expenses; |
| | • | | adverse changes in regional real estate values; |
| | • | | interest rate fluctuations which could increase our cost of funds or decrease our yield on earning assets and therefore reduce our net interest income; |
| | • | | decreases in our loan and lease quality and origination volume; |
| | • | | the adequacy of loss reserves; |
| | • | | impairment of goodwill or other assets; |
30
| | • | | the loss of certain key officers, which could adversely impact our business; |
| | • | | continued relationships with major customers; |
| | • | | the ability to continue to grow our business internally and through acquisition and successful integration of bank and non-bank entities while controlling our costs; |
| | • | | adverse national and regional economic and business conditions; |
| | • | | compliance with laws and regulatory requirements of federal and state agencies; |
| | • | | competition from other financial institutions in originating loans, attracting deposits, and providing various financial services that may affect our profitability; |
| | • | | the ability to hedge certain risks economically; |
| | • | | our ability to effectively implement technology driven products and services; |
| | • | | changes in consumer confidence, spending and savings habits relative to the bank and non-bank financial services we provide; |
| | • | | changes in legal or regulatory requirements or the results of regulatory examinations that could adversely impact our business and financial condition and restrict growth; |
| | • | | the impact of federal laws and related rules and regulations on our business operations and competitiveness; |
| | • | | the effects of and changes in trade, monetary and fiscal policies, and laws, including interest rate policies of the Federal Reserve Board; |
| | • | | the effects of and changes in the rate of FDIC premiums; |
| | • | | costs associated with the integration of Abington and Tower; and |
| | • | | our success in managing the risks involved in the foregoing. |
We encourage readers of this report to understand forward-looking statements to be strategic objectives rather than absolute targets of future performance. Forward-looking statements speak only as of the date they are made. We do not intend to update publicly any forward-looking statements to reflect circumstances or events that occur after the date the forward-looking statements are made or to reflect the occurrence of unanticipated events except as required by law.
The following discussion and analysis, the purpose of which is to provide investors and others with information that we believe to be necessary for an understanding of our financial condition, changes in financial condition, and results of operations, should be read in conjunction with the financial statements, notes, and other information contained in this document.
The following information refers to the parent company and its wholly owned subsidiaries: Boston Service Company, Inc. (t/a Hann Financial Service Corporation) (“Hann”), Susquehanna Bank and subsidiaries, Valley Forge Asset Management Corp. (“VFAM”), Stratton Management Company and subsidiary (“Stratton”), and The Addis Group, LLC (“Addis”).
Critical Accounting Estimates
Susquehanna’s consolidated financial statements are prepared in accordance with accounting principles generally accepted in the United States of America (U.S. GAAP) and conform to general practices within the banking industry. Application of these principles involves complex judgments and estimates by management that have a material impact on the carrying value of certain assets and liabilities. The judgments and estimates that we used are based on historical experiences and other factors, which are believed to be reasonable under the circumstances. Because of the nature of
31
the judgments and estimates that we have made, actual results could differ from these judgments and estimates, which could have a material impact on the carrying values of assets and liabilities and the results of our operations.
Our most significant accounting estimates are presented in“Note 1. Summary of Significant AccountingPolicies” to the consolidated financial statements appearing in Part II,Item 8. Furthermore, we believe that the determination of the allowance for loan and lease losses, the evaluation of goodwill, the analysis of certain debt securities to determine if an-other-than-temporary impairment exists, and the determination of the fair value of certain financial instruments to be the accounting areas that require the most subjective and complex judgments.
The allowance for loan and lease losses represents management’s estimate of probable incurred credit losses inherent in the loan and lease portfolio as of the balance sheet date. Determining the amount of the allowance for loan and lease losses is considered a complex accounting estimate because it requires significant judgment and the use of estimates related to the amount and timing of expected future cash flows on impaired loans, estimated losses on pools of homogeneous loans based on historical loss experience, and consideration of current economic trends and conditions, all of which may be susceptible to significant change. The loan and lease portfolio also represents the largest asset type on the consolidated balance sheet. For additional information about our process for determining the allowance for loan and lease losses, refer to“Provision and Allowance for Loan and Lease Losses”presented inPART II, Item 7, Management’s Discussion and Analysis of Financial Condition and Results of Operations,Results of Operations.
Goodwill is evaluated for impairment on an annual basis and more often if situations or the economic environment warrant it. In performing these evaluations, management makes critical estimates to determine the fair value of its reporting units. Such estimates include assumptions used in determining cash flows and evaluation of appropriate market multiples. For additional information about goodwill, refer to“Note 8. Goodwill and Other Intangibles”to the consolidated financial statements appearing in Part II,Item 8.
Certain debt securities that are in unrealized loss positions are analyzed to determine if they are other-than- temporarily impaired. This analysis consists of calculating expected cash flows, taking into consideration credit default and severity rates, prepayments, deferrals, waterfall structure, covenants relating to the securities, and appropriate discount rates. Furthermore, if a security is found to be other than temporarily impaired, additional analysis is required to determine the portion of the loss attributable to credit quality. For additional information about other-than-temporary impairment of debt securities, refer to“Note 4. Investment Securities”to the consolidated financial statements appearing in Part II,Item 8.
Fair value is the price that would be received to sell an asset or paid to transfer a liability in an orderly transaction between market participants at the measurement dates. Observable inputs reflect the assumptions market participants would use in pricing the asset or liability based on market data obtained from sources independent of the reporting entity. Unobservable inputs reflect the reporting entity’s own assumptions about the assumptions market participants would use in pricing the asset or liability developed based on the best information available in the circumstances. As defined in U.S. GAAP, Level 1 inputs are quoted prices (unadjusted) in active markets for identical assets or liabilities that the entity has the ability to access at the measurement date. Level 2 inputs are other than quoted prices included within Level 1 that are observable for the asset or liability, either directly or indirectly. Level 3 inputs are unobservable inputs for the asset or liability. For additional information about our financial assets and financial liabilities carried at fair value, refer to“Note 24. Fair Value Disclosures”to the consolidated financial statements appearing in Part II,Item 8.
Any material effect on the consolidated financial statements related to these complex accounting areas is also discussed within the body of this document.
32
Executive Overview
Net income applicable to common shareholders for the year ended December 31, 2011 was $54.9 million, an increase of $38.6 million when compared to net income applicable to common shareholders for the year ended December 31, 2010.
The following table compares our 2011 financial targets to actual results:
| | | | | | | | |
| | | Target | | | Actual | |
Net interest margin | | | 3.60 | % | | | 3.60 | % |
Loan growth | | | 4.0 | % | | | 8.5 | % |
Deposit growth | | | 4.0 | % | | | 12.0 | % |
Noninterest income growth | | | -1.0 | % | | | -5.7 | % |
Non interest expense growth | | | 0.0 | % | | | 3.3 | % |
Effective tax rate | | | 24.0 | % | | | -20.0 | % |
| (1) | The targets and actual results do not include any one-time merger related items or any purchase accounting adjustments associated with the merger, and one-time loss on extinguishment of debt. |
During 2011 our concentrated efforts on reducing interest expense by increasing our core deposits and reducing our reliability on higher rate time deposits were effective. During 2011, core deposits increased $1.1 billion, or 18.9%. Excluding the Abington transaction, core deposits increased $628.2 million, or 10.9%. Time deposits increased just 0.2%, or $8.1 million. Excluding the Abington transaction, time deposits decreased $386.2 million or 11.3%. These changes reduced our cost of deposits by 33 basis points in 2011.
Total loans increased $814.7 million, or 8.5%. Loans acquired in the Abington transaction totaled $630.3 million. We continued to intentionally reduce our exposure in the Real Estate – Construction portfolio during 2011. If we exclude the intentional reduction, our loan balances increased $303.3 million, or 3.5%.
We saw improvement in the credit quality of our loan portfolios in 2011. Net charge-offs declined to 1.16% of average loans and leases in 2011, from 1.46% in 2010. Non-performing assets as a percentage of loans and leases plus foreclosed real estate was 1.88% at December 31, 2011 compared to 2.23% at December 31, 2010. As a result, we decreased our provision for loan and lease losses to $110.0 million for 2011 from $163.0 million in 2010.
At December 31, 2011, our capital ratios exceeded regulatory requirements for a well-capitalized institution, with all ratios improving from December 31, 2010 levels.
Given the current economic climate and real estate trends, we believe that 2012 will be better than 2011, but still challenging. With that in mind, our financial targets for 2012, including Tower, are as follows:
| | | | |
| | | Target | |
Net interest margin (FTE) | | | 3.75 | % |
Loan growth | | | 25.0 | % |
Deposit growth | | | 27.0 | % |
Noninterest income growth | | | -11.0 | % |
Noninterest expense growth | | | -5.0 | % |
Effective tax rate | | | 29.0 | % |
The growth percentages included in these financial targets are based upon 2011 reported numbers and not core numbers. These percentages do not include any one-time merger related costs in 2012, or any purchase accounting adjustments associated with the Tower merger.
33
We continue to closely monitor, and act upon, the new regulatory changes resulting from the Dodd-Frank Wall Street Reform and Consumer Protection Act. We have already seen a negative effect on interchange fees that banks earn on debit and credit card transactions. There may be additional regulations that could result in decreased revenues and increased costs.
Acquisition of Abington Bancorp, Inc.
On October 1, 2011, we completed the acquisition of Abington Bancorp, Inc. (“Abington”), a Pennsylvania corporation with headquarters in Jenkintown, Pennsylvania, with approximately $1.2 billion of assets, through a merger of Abington with and into Susquehanna. In connection with the Abington merger, Abington’s wholly-owned banking subsidiary, Abington Bank, was merged into Susquehanna’s wholly-owned banking subsidiary Susquehanna Bank, with Susquehanna Bank being the surviving institution. The location of Abington’s bank branches provide a natural extension of Susquehanna Bank’s network in the greater Philadelphia area. The acquisition was accounted for under the purchase method and was considered immaterial.
Subsequent Events
Acquisition of Tower Bancorp, Inc.
On February 17, 2012, we completed the acquisition of Tower Bancorp, Inc. (“Tower”), a Pennsylvania chartered bank holding company based in Harrisburg, Pennsylvania with approximately $2.5 billion of assets, through a merger of Tower with and into Susquehanna. In connection with the Tower merger, Tower’s wholly-owned banking subsidiary, Graystone Tower Bank, was merged into Susquehanna’s wholly-owned banking subsidiary Susquehanna Bank, with Susquehanna Bank being the surviving institution. The acquisition of Tower enhances Susquehanna’s footprint in Pennsylvania and Maryland. The acquisition was accounted for under the purchase method, and was considered immaterial.
Summary of 2011 Compared to 2010
Results of Operations
Net income applicable to common shareholders for the year ended December 31, 2011 was $54.9 million, an increase of $38.6 million when compared to net income applicable to common shareholders of $16.3 million in 2010. The provision for loan and lease losses decreased 32.5%, to $110.0 million for 2011, from $163.0 million for 2010. Net interest income increased 1.6%, to $433.2 million for 2011, from $426.5 million in 2010. Noninterest income, excluding the net realized gain on acquisition, decreased 5.6% to $143.6 million for 2011, from $152.1 million for 2010, and noninterest expenses, excluding the loss on extinguishment of debt and merger-related expenses, for 2011 were $395.2 million, an increase of 3.3% over 2010 when noninterest expenses were $382.7 million.
Additional information is as follows:
| | | | | | | | |
| | | Twelve Months
Ended
December 31, | |
| | | 2011 | | | 2010 | |
Diluted Earnings per Common Share | | $ | 0.40 | | | $ | 0.13 | |
Return on Average Assets | | | 0.38 | % | | | 0.23 | % |
Return on Average Equity | | | 2.67 | % | | | 1.53 | % |
Return on Average Tangible Equity (1) | | | 6.01 | % | | | 3.69 | % |
Efficiency Ratio | | | 66.83 | % | | | 64.62 | % |
Net Interest Margin | | | 3.60 | % | | | 3.67 | % |
34
The following discussion details the factors that contributed to these results.
| (1) | Supplemental Reporting of Non-GAAP-based Financial Measures |
Return on average tangible equity is a non-GAAP-based financial measure calculated using non-GAAP amounts. The most directly comparable measure is return on average equity, which is calculated using GAAP-based amounts. We calculate return on average tangible equity by excluding the balance of intangible assets and their related amortization expense from our calculation of return on average equity. Management uses the return on average tangible equity in order to review our core operating results. Management believes that this is a better measure of our performance. In addition, this is consistent with the treatment by bank regulatory agencies, which excludes goodwill and other intangible assets from the calculation of risk-based capital ratios. A reconciliation of return on average equity to return on average tangible equity is set forth below.
| | | | | | | | |
| | | 2011 | | | 2010 | |
Return on average equity (GAAP basis) | | | 2.67 | % | | | 1.53 | % |
Effect of excluding average intangible assets and related amortization | | | 3.34 | | | | 2.16 | |
Return on average tangible equity | | | 6.01 | | | | 3.69 | |
Net Interest Income - Taxable Equivalent Basis
Our major source of operating revenues is net interest income, which increased to $433.2 million in 2011, as compared to $426.5 million in 2010. Net interest income as a percentage of net interest income plus other income (excluding the net realized gain on acquisition) was 75% for the twelve months ended December 31, 2011, 74% for the twelve months ended December 31, 2010, and 71% for the twelve months ended December 31, 2009.
Net interest income is the income that remains after deducting, from total income generated by earning assets, the interest expense attributable to the acquisition of the funds required to support earning assets. Income from earning assets includes income from loans, investment securities, and short-term investments. The amount of interest income is dependent upon many factors including the volume of earning assets, the general level of interest rates, the dynamics of the change in interest rates, and the levels of non-performing loans. The cost of funds varies with the amount of funds necessary to support earning assets, the rates paid to attract and hold deposits, the rates paid on borrowed funds, and the levels of noninterest-bearing demand deposits and equity capital.
Table 1 presents average balances, taxable equivalent interest income and expense, and yields earned or paid on these assets and liabilities. For purposes of calculating taxable equivalent interest income, tax-exempt interest has been adjusted using a marginal tax rate of 35% in order to equate the yield to that of taxable interest rates. Table 2 illustrates the changes in net interest income caused by changes in average volume, rates, and yields.
The $7.8 million increase in our taxable equivalent net interest income in 2011, as compared to 2010, primarily was the result of a $441.7 million increase in our average earning asset volumes, offset by a seven basis point decline in our net interest margin as interest rates continued to decline in 2011, which negatively affected our asset-sensitive balance sheet. The increase in average earning assets was primarily due to the increase in the investment portfolio as average loan growth was minimal.
Variances do occur in the net interest margin, as an exact repricing of assets and liabilities is not feasible. A further explanation of the impact of asset and liability repricing is found in the section entitled“Market Risks—Interest Rate Risk.”
35
Table 1 - Distribution of Assets, Liabilities and Shareholders’ Equity
Interest Rates and Interest Differential—Tax Equivalent Basis
| | | | | | | | | | | | | | | | | | | | | | | | | | | | | | | | | | | | |
| | | 2011 | | | 2010 | | | 2009 | |
| | | Average
Balance | | | Interest | | | Rate (%) | | | Average
Balance | | | Interest | | | Rate (% ) | | | Average
Balance | | | Interest | | | Rate (% ) | |
| | | (Dollars in thousands) | |
Assets | | | | | | | | | | | | | | | | | | | | | | | | | | | | | | | | | | | | |
Short-term investments | | $ | 98,424 | | | $ | 108 | | | | 0.11 | | | $ | 105,497 | | | $ | 182 | | | | 0.17 | | | $ | 104,531 | | | $ | 597 | | | | 0.57 | |
Investment securities: | | | | | | | | | | | | | | | | | | | | | | | | | | | | | | | | | | | | |
Taxable | | | 2,129,908 | | | | 61,845 | | | | 2.90 | | | | 1,720,263 | | | | 59,817 | | | | 3.48 | | | | 1,520,832 | | | | 74,244 | | | | 4.88 | |
Tax-advantaged | | | 399,554 | | | | 24,355 | | | | 6.10 | | | | 364,651 | | | | 23,073 | | | | 6.33 | | | | 347,538 | | | | 22,985 | | | | 6.61 | |
| | | | | | | | | | | | | | | | | | | | | | | | | | | | | | | | | | | | |
Total investment securities | | | 2,529,462 | | | | 86,200 | | | | 3.41 | | | | 2,084,914 | | | | 82,890 | | | | 3.98 | | | | 1,868,370 | | | | 97,229 | | | | 5.20 | |
| | | | | | | | | | | | | | | | | | | | | | | | | | | | | | | | | | | | |
Loans and leases, (net): | | | | | | | | | | | | | | | | | | | | | | | | | | | | | | | | | | | | |
Taxable | | | 9,492,521 | | | | 505,607 | | | | 5.33 | | | | 9,545,296 | | | | 528,570 | | | | 5.54 | | | | 9,583,567 | | | | 544,117 | | | | 5.68 | |
Tax-advantaged | | | 311,342 | | | | 17,503 | | | | 5.62 | | | | 254,377 | | | | 15,583 | | | | 6.13 | | | | 226,306 | | | | 15,272 | | | | 6.75 | |
| | | | | | | | | | | | | | | | | | | | | | | | | | | | | | | | | | | | |
Total loans and leases | | | 9,803,863 | | | | 523,110 | | | | 5.34 | | | | 9,799,673 | | | | 544,153 | | | | 5.55 | | | | 9,809,873 | | | | 559,389 | | | | 5.70 | |
| | | | | | | | | | | | | | | | | | | | | | | | | | | | | | | | | | | | |
Total interest-earning assets | | | 12,431,749 | | | | 609,418 | | | | 4.90 | | | | 11,990,084 | | | | 627,225 | | | | 5.23 | | | | 11,782,774 | | | | 657,215 | | | | 5.58 | |
| | | | | | | | | | | | | | | | | | | | | | | | | | | | | | | | | | | | |
Allowance for loan and lease losses | | | (194,746 | ) | | | | | | | | | | | (184,304 | ) | | | | | | | | | | | (145,163 | ) | | | | | | | | |
Other noninterest-earning assets | | | 2,125,775 | | | | | | | | | | | | 2,094,105 | | | | | | | | | | | | 2,051,947 | | | | | | | | | |
| | | | | | | | | | | | | | | | | | | | | | | | | | | | | | | | | | | | |
Total assets | | $ | 14,362,778 | | | | | | | | | | | $ | 13,899,885 | | | | | | | | | | | $ | 13,689,558 | | | | | | | | | |
| | | | | | | | | | | | | | | | | | | | | | | | | | | | | | | | | | | | |
Liabilities | | | | | | | | | | | | | | | | | | | | | | | | | | | | | | | | | | | | |
Deposits: | | | | | | | | | | | | | | | | | | | | | | | | | | | | | | | | | | | | |
Interest-bearing demand | | $ | 3,884,182 | | | $ | 21,323 | | | | 0.55 | | | $ | 3,481,728 | | | $ | 22,279 | | | | 0.64 | | | $ | 2,882,949 | | | $ | 22,124 | | | | 0.77 | |
Savings | | | 815,066 | | | | 1,161 | | | | 0.14 | | | | 766,210 | | | | 1,173 | | | | 0.15 | | | | 731,787 | | | | 1,690 | | | | 0.23 | |
Time | | | 3,482,801 | | | | 54,294 | | | | 1.56 | | | | 3,628,219 | | | | 80,511 | | | | 2.22 | | | | 4,187,549 | | | | 136,481 | | | | 3.26 | |
Short-term borrowings | | | 658,477 | | | | 8,133 | | | | 1.24 | | | | 627,704 | | | | 4,156 | | | | 0.66 | | | | 976,975 | | | | 4,267 | | | | 0.44 | |
FHLB borrowings | | | 1,123,801 | | | | 42,024 | | | | 3.74 | | | | 1,056,128 | | | | 43,552 | | | | 4.12 | | | | 1,033,536 | | | | 40,119 | | | | 3.88 | |
Long-term debt | | | 684,065 | | | | 34,683 | | | | 5.07 | | | | 713,101 | | | | 35,518 | | | | 4.98 | | | | 448,245 | | | | 30,327 | | | | 6.77 | |
| | | | | | | | | | | | | | | | | | | | | | | | | | | | | | | | | | | | |
Total interest-bearing liabilities | | | 10,648,392 | | | | 161,618 | | | | 1.52 | | | | 10,273,090 | | | | 187,189 | | | | 1.82 | | | | 10,261,041 | | | | 235,008 | | | | 2.29 | |
| | | | | | | | | | | | | | | | | | | | | | | | | | | | | | | | | | | | |
Demand deposits | | | 1,413,077 | | | | | | | | | | | | 1,309,516 | | | | | | | | | | | | 1,222,365 | | | | | | | | | |
Other liabilities | | | 245,592 | | | | | | | | | | | | 232,439 | | | | | | | | | | | | 247,599 | | | | | | | | | |
| | | | | | | | | | | | | | | | | | | | | | | | | | | | | | | | | | | | |
Total liabilities | | | 12,307,061 | | | | | | | | | | | | 11,815,045 | | | | | | | | | | | | 11,731,005 | | | | | | | | | |
Equity | | | 2,055,717 | | | | | | | | | | | | 2,084,840 | | | | | | | | | | | | 1,958,553 | | | | | | | | | |
| | | | | | | | | | | | | | | | | | | | | | | | | | | | | | | | | | | | |
Total liabilities & shareholders’ equity | | $ | 14,362,778 | | | | | | | | | | | $ | 13,899,885 | | | | | | | | | | | $ | 13,689,558 | | | | | | | | | |
| | | | | | | | | | | | | | | | | | | | | | | | | | | | | | | | | | | | |
Net interest income / yield on average earning assets | | | | | | $ | 447,800 | | | | 3.60 | | | | | | | $ | 440,036 | | | | 3.67 | | | | | | | $ | 422,207 | | | | 3.58 | |
| | | | | | | | | | | | | | | | | | | | | | | | | | | | | | | | | | | | |
Additional Information
| • | | Average loan balances include nonaccrual loans. |
| • | | Tax-advantaged income has been adjusted to a tax-equivalent basis using a marginal rate of 35%. |
| • | | For presentation in this table, balances and the corresponding average rates for investment securities are based upon historical cost, adjusted for amortization of premiums and accretion of discounts. |
36
Table 2 - Changes in Net Interest Income - Tax Equivalent Basis
| | | | | | | | | | | | | | | | | | | | | | | | |
| | | 2011 Versus 2010
Increase (Decrease)
Due to Change in | | | 2010 Versus 2009
Increase (Decrease)
Due to Change in | |
| | | Average
Volume | | | Average
Rate | | | Total | | | Average
Volume | | | Average
Rate | | | Total | |
| | | (Dollars in thousands) | |
Interest Income | | | | | | | | | | | | | | | | | | | | | | | | |
Other short-term investments | | $ | (11 | ) | | $ | (63 | ) | | $ | (74 | ) | | $ | 6 | | | $ | (421 | ) | | $ | (415 | ) |
Investment securities: | | | | | | | | | | | | | | | | | | | | | | | | |
Taxable | | | 12,856 | | | | (10,829 | ) | | | 2,027 | | | | 8,859 | | | | (23,285 | ) | | | (14,426 | ) |
Tax-advantaged | | | 2,150 | | | | (867 | ) | | | 1,283 | | | | 1,106 | | | | (1,019 | ) | | | 87 | |
| | | | | | | | | | | | | | | | | | | | | | | | |
Total investment securities | | | 15,006 | | | | (11,696 | ) | | | 3,310 | | | | 9,965 | | | | (24,304 | ) | | | (14,339 | ) |
Loans (net of unearned income): | | | | | | | | | | | | | | | | | | | | | | | | |
Taxable | | | (2,908 | ) | | | (20,055 | ) | | | (22,963 | ) | | | (2,165 | ) | | | (13,382 | ) | | | (15,547 | ) |
Tax-advantaged | | | 3,279 | | | | (1,359 | ) | | | 1,920 | | | | 1,794 | | | | (1,483 | ) | | | 311 | |
| | | | | | | | | | | | | | | | | | | | | | | | |
Total loans | | | 371 | | | | (21,414 | ) | | | (21,043 | ) | | | (371 | ) | | | (14,865 | ) | | | (15,236 | ) |
| | | | | | | | | | | | | | | | | | | | | | | | |
Total interest-earning assets | | $ | 15,366 | | | $ | (33,173 | ) | | $ | (17,807 | ) | | $ | 9,600 | | | $ | (39,590 | ) | | $ | (29,990 | ) |
| | | | | | | | | | | | | | | | | | | | | | | | |
Interest Expense | | | | | | | | | | | | | | | | | | | | | | | | |
Deposits: | | | | | | | | | | | | | | | | | | | | | | | | |
Interest-bearing demand | | $ | 2,411 | | | $ | (3,367 | ) | | $ | (956 | ) | | $ | 4,171 | | | $ | (4,016 | ) | | $ | 155 | |
Savings | | | 73 | | | | (85 | ) | | | (12 | ) | | | 76 | | | | (593 | ) | | | (517 | ) |
Time | | | (3,113 | ) | | | (23,104 | ) | | | (26,217 | ) | | | (16,512 | ) | | | (39,458 | ) | | | (55,970 | ) |
Short-term borrowings | | | 213 | | | | 3,764 | | | | 3,977 | | | | (1,847 | ) | | | 1,736 | | | | (111 | ) |
FHLB borrowings | | | 2,685 | | | | (4,213 | ) | | | (1,528 | ) | | | 891 | | | | 2,542 | | | | 3,433 | |
Long-term debt | | | (1,464 | ) | | | 629 | | | | (835 | ) | | | 14,651 | | | | (9,460 | ) | | | 5,191 | |
| | | | | | | | | | | | | | | | | | | | | | | | |
Total interest-bearing liabilities | | | 805 | | | | (26,376 | ) | | | (25,571 | ) | | | 1,430 | | | | (49,249 | ) | | | (47,819 | ) |
| | | | | | | | | | | | | | | | | | | | | | | | |
Net Interest Income | | $ | 14,561 | | | $ | (6,797 | ) | | $ | 7,764 | | | $ | 8,170 | | | $ | 9,659 | | | $ | 17,829 | |
| | | | | | | | | | | | | | | | | | | | | | | | |
Additional Information
| | • | | Changes that are due in part to volume and in part to rate are allocated in proportion to their relationship to the amounts of changes attributed directly to volume and rate. |
Provision and Allowance for Loan and Lease Losses
The provision for loan and lease losses is the expense necessary to maintain the allowance for loan and lease losses as of the balance sheet date at a level appropriate to absorb management’s estimate of probable incurred losses inherent in the loan and lease portfolio. Our provision for loan and lease losses is based upon management’s quarterly review of the loan portfolio. The purpose of the review is to assess loan quality, identify impaired loans and leases, analyze delinquencies, ascertain loan and lease growth, evaluate potential charge-offs and recoveries, and assess general economic conditions in the markets we serve.
Commercial loans and commercial real estate loans of $0.5 million or greater are internally risk rated, using a standard rating system, by our loan officers and periodically reviewed by loan review personnel. Consumer loans, residential real estate loans, and leases are generally analyzed in the aggregate as they are of relatively small dollar size and homogeneous in nature.
37
Under our methodology for calculating the allowance for loan and lease losses, loss rates for the last three years on a rolling quarter-to-quarter basis, weighted towards the more recent periods, are determined for: (a) commercial credits (including agriculture, commercial, commercial real estate, land acquisition, development and construction); and (b) consumer credits (including residential real estate, consumer direct, consumer indirect, consumer revolving, and leases). After determining the loss rates, management adjusts these rates for certain considerations, such as trends in delinquency and other economic factors, and then applies the adjusted loss rates to loan balances of these portfolio segments.
In addition to using loss rates, secured commercial non-accrual loans of $0.5 million or greater are reviewed for impairment. Those loans that have specific loss allocations are identified and included in the reserve allocation. Risk-rated loans that are not reviewed for impairment are segregated into homogeneous pools with loss allocation rates that reflect the severity of risk. Loss rates are adjusted by applying other factors to the calculations. These factors include adjustments for current economic trends and other external factors, delinquency and risk trends, credit concentrations, credit administration policy, migration analysis, and other special allocations for unusual events or changes in products and volume.
This methodology provides an in-depth analysis of the bank’s portfolio and reflects the probable inherent losses within it. Reserve allocations are then reviewed and consolidated. This process is performed on a quarterly basis, including a risk-rate review of commercial credit relationships.
It is our policy not to renegotiate the terms of a commercial loan simply because of a delinquency status. However, we will use our Troubled Debt Restructuring Program to work with delinquent borrowers when the delinquency is temporary. A commercial loan is transferred to non-accrual status if it is not well-secured and in the process of collection, and is considered delinquent in payment if either principal or interest is past due ninety days or more. Interest income received on impaired commercial loans in 2011 and 2010, was $6.7 million in each year. Interest income that would have been recorded on these loans under the original terms in 2011 and 2010 was $15.7 million and $16.2 million, respectively. At December 31, 2011, we had no binding outstanding commitments to advance additional funds with respect to these impaired loans.
Consumer loans are typically charged-off when they are 120 days past due unless they are secured by real estate. Loans secured by real estate are evaluated on the basis of collateral value. Loans that are well-secured may continue to accrue interest, while other loans are charged down to net realizable value and placed on non-accrual depending upon their loan-to-value ratio.
Consumer loans are typically charged-off when they are 120 days past due unless they are secured by real estate. Loans secured by real estate are evaluated on the basis of collateral value. Loans that are well-secured may continue to accrue interest, while other loans are charged down to net realizable value and placed on non-accrual depending upon their loan-to-value ratio.
Although we, like many other financial institutions, continued to experience a challenging operating environment, throughout 2011, we also continued to experience some signs of stabilization. As a result, we decreased our provision for loan and lease losses in accordance with our assessment process, which took into consideration a $40.4 million decrease in nonaccrual loans and leases since December 31, 2010, as noted in Table 10. The provision for loan and lease losses was $110.0 million for the year ended December 31, 2011 and $163.0 million for the year ended December 31, 2010. The allowance for loan and lease losses at December 31, 2011 was 1.80% of period-end loans and leases, or $188.1 million, and 1.99% of period-end loans and leases, or $191.8 million, at December 31, 2010. Loans of $630.3 million were acquired as part of the Abington transaction. These loans were acquired at their fair value, with both specific and general credit write-downs taken. This method allows for loan and lease balances to increase on Susquehanna’s balance sheet without recording an additional allowance for loan and lease losses, thus contributing to the decline in the allowance for loan and lease losses to period-end loans and leases ratio. Subsequent to the acquisition, these loans will be subject to Susquehanna’s credit policies.
38
Table 3 - Provision and Allowance for Loan and Lease Losses
| | | | | | | | | | | | | | | | | | | | |
| | | 2011 | | | 2010 | | | 2009 | | | 2008 | | | 2007 | |
| | | (Dollars in thousands) | |
Allowance for loan and lease losses, January 1 | | $ | 191,834 | | | $ | 172,368 | | | $ | 113,749 | | | $ | 88,569 | | | $ | 62,643 | |
Allowance acquired in business combination | | | 0 | | | | 0 | | | | 0 | | | | 0 | | | | 19,119 | |
Additions to provision for loan and lease losses charged to operations | | | 110,000 | | | | 163,000 | | | | 188,000 | | | | 63,831 | | | | 21,844 | |
Loans and leases charged-off during the year: | | | | | | | | | | | | | | | | | | | | |
Commercial, financial, and agricultural | | | (25,552 | ) | | | (22,604 | ) | | | (33,887 | ) | | | (17,433 | ) | | | (4,758 | ) |
Real estate - construction | | | (36,585 | ) | | | (65,709 | ) | | | (65,906 | ) | | | (8,885 | ) | | | (1,949 | ) |
Real estate secured - residential | | | (18,663 | ) | | | (18,562 | ) | | | (7,441 | ) | | | (3,883 | ) | | | (1,829 | ) |
Real estate secured - commercial | | | (45,213 | ) | | | (43,086 | ) | | | (20,593 | ) | | | (2,154 | ) | | | (3,200 | ) |
Consumer | | | (3,922 | ) | | | (3,464 | ) | | | (3,641 | ) | | | (8,075 | ) | | | (3,790 | ) |
Leases | | | (5,310 | ) | | | (8,710 | ) | | | (11,873 | ) | | | (4,800 | ) | | | (3,659 | ) |
| | | | | | | | | | | | | | | | | | | | |
Total charge-offs | | | (135,245 | ) | | | (162,135 | ) | | | (143,341 | ) | | | (45,230 | ) | | | (19,185 | ) |
| | | | | | | | | | | | | | | | | | | | |
Recoveries of loans and leases previously charged-off: | | | | | | | | | | | | | | | | | | | | |
Commercial, financial, and agricultural | | | 5,835 | | | | 4,478 | | | | 4,779 | | | | 1,625 | | | | 536 | |
Real estate - construction | | | 7,106 | | | | 6,974 | | | | 1,306 | | | | 5 | | | | 10 | |
Real estate secured - residential | | | 1,916 | | | | 923 | | | | 286 | | | | 226 | | | | 406 | |
Real estate secured - commercial | | | 3,795 | | | | 3,744 | | | | 5,685 | | | | 145 | | | | 426 | |
Consumer | | | 1,371 | | | | 1,254 | | | | 1,120 | | | | 3,626 | | | | 1,792 | |
Leases | | | 1,488 | | | | 1,228 | | | | 784 | | | | 952 | | | | 978 | |
| | | | | | | | | | | | | | | | | | | | |
Total recoveries | | | 21,511 | | | | 18,601 | | | | 13,960 | | | | 6,579 | | | | 4,148 | |
| | | | | | | | | | | | | | | | | | | | |
Net charge-offs | | | (113,734 | ) | | | (143,534 | ) | | | (129,381 | ) | | | (38,651 | ) | | | (15,037 | ) |
| | | | | | | | | | | | | | | | | | | | |
Allowance for loan and lease losses, December 31 | | $ | 188,100 | | | $ | 191,834 | | | $ | 172,368 | | | $ | 113,749 | | | $ | 88,569 | |
| | | | | | | | | | | | | | | | | | | | |
Average loans and leases outstanding | | $ | 9,803,863 | | | $ | 9,799,673 | | | $ | 9,809,873 | | | $ | 9,169,996 | | | $ | 5,979,878 | |
Period-end loans and leases | | | 10,447,930 | | | | 9,633,197 | | | | 9,827,279 | | | | 9,653,873 | | | | 8,751,590 | |
Net charge-offs as a percentage of average loans and leases | | | 1.16 | % | | | 1.46 | % | | | 1.32 | % | | | 0.42 | % | | | 0.25 | % |
Allowance as a percentage of period-end loans and leases | | | 1.80 | % | | | 1.99 | % | | | 1.75 | % | | | 1.18 | % | | | 1.01 | % |
Determining the level of the allowance for probable loan and lease losses at any given point in time is difficult, particularly during uncertain economic periods. We must make estimates using assumptions and information that is often subjective and changing rapidly. The review of the loan and lease portfolios is a continuing process in light of a changing economy and the dynamics of the banking and regulatory environment. In our opinion, the allowance for loan and lease losses is adequate to meet probable incurred loan and lease losses at December 31, 2011. There can be no assurance, however, that we will not sustain losses in future periods that could be greater than the size of the allowance at December 31, 2011. The allowance for loan and lease losses as a percentage of non-accrual loans and leases (coverage ratio) increased to 120% at December 31, 2011, from 97% at December 31, 2010. Loans of $630.3 million were acquired as part of the Abington transaction. These loans were acquired at their fair value, with both specific and general credit write-downs taken. This method allows for loan and lease balances to increase on Susquehanna’s balance sheet without recording an additional allowance for loan and lease losses, thus reducing the increase in the coverage ratio.
Should the economic climate deteriorate further, borrowers may experience increasing difficulty in meeting their payment obligations, and the level of non-performing loans and assets, charge-offs, and delinquencies could rise and require further increases in the provision. In addition, regulatory authorities, as an integral part of their examinations, periodically review the level of the allowance for loan and lease losses and may require additions to the allowance based upon their judgments about information available to them at the time of examination.
39
Noninterest Income
Noninterest income, as a percentage of net interest income plus noninterest income (excluding the net realized gain on acquisition), was 30%, 26%, and 29% for 2011, 2010, and 2009, respectively. For 2011, the ratio is 25% when the net realized gain on acquisition is excluded from the noninterest income component.
Noninterest income, excluding the net realized gain on acquisition, decreased $8.6 million, or 5.7%, in 2011, as compared to 2010. This net decrease was primarily the result of the following:
| | • | | Decreasedservice charges on deposit accounts of $2.7 million; |
| | • | | Increasedvehicle origination and servicing fees of $1.0 million; |
| | • | | Increasedcommissions on property and casualty insurance sales of $2.0 million; |
| | • | | Increasenet gain on the sale of loans and leases of $1.8 million; |
| | • | | Decreasednet realized gain on securities(excluding other-than-temporary impairment) of $9.0 million; |
| | • | | Decreasedother income of $1.3 million. |
Service charges on deposit accounts. The 8.0% decrease primarily was the result of changes in customers’ behavior regarding overdrafts, and changes in government regulations regarding overdraft fees.
Vehicle origination and servicing fees.The 15.2% increase primarily was due to increased vehicle leasing volume.
Commissions on property and casualty insurance sales.The 8.4% increase was the result of increased volume at Addis, as well as higher premium rates from their carriers.
Net gain on the sale of loans and leases.The 16.8% increase primarily was the result of increased gains on the sale of Small Business Administration loans.
Net realized gain on securities.During 2011, we realized net gains of $3.9 million on the sale of securities with an aggregate book value of $428.2 million. During 2010, we realized net gains of $13.4 million on the sale and call of securities with an aggregate book value of $356.1 million.
Other.The 23.2% net decrease primarily was the result of $1.0 million of sales and use tax refunds in 2010, a one-time $1.2 million of Visa revenues in 2010, a $1.5 million decline in cash surrender value income on insurance policies in 2011, and, a $2.4 million increase in gain on sale of other real estate.
Noninterest Expenses
Total noninterest expenses for the year ended December 31, 2011 were $395.2 million, excluding prepayment penalty and merger related expenses, an increase of $12.5 million, or 3.3%, from the year ended December 31, 2010 when total noninterest expenses were $382.7 million. Components within this category increased or decreased as follows:
| | • | | Increasedsalaries and employee benefits of $17.4 million; |
| | • | | Increased occupancy of $1.4 million; |
| | • | | Decreased furniture and equipment of $1.1 million; |
| | • | | Decreasedadvertising of $1.1 million; and |
| | • | | Decreased vehicle lease disposalof $4.0 million. |
40
Salaries and employee benefits.The 9.1% increase primarily can be attributed to annual merit increases, a reduction in open positions, and the Abington acquisition on October 1, 2011.
Occupancy.The 4.0% increase is primarily due to the fourth quarter 2011 acquisition of Abington.
Furniture and equipment.The 7.7% decrease is the result of decreased depreciation.
Advertising. The 9.0% decrease is the result of a lower budget in 2011.
Vehicle lease disposal. The 27.2% decrease primarily was the result of lower residual value expense and fewer cars being returned to Hann after maturity of the lease.
Income Taxes
Our effective tax rates for 2011 and 2010 were (20.3%) and 3.5%, respectively.
The decrease in our rate in 2011 was primarily due to the effect of the non-taxable bargain purchase accounting from the Abington acquisition. With the exception of the bargain purchase accounting, items impacting the effective tax rate in 2011, including tax-advantaged investment and loan income, were comparable to 2010. For additional information about our income taxes, refer to“Note12. Income Taxes” to the consolidated financial statements appearing in Part II,Item 8.
Financial Condition
Summary of 2011 Compared to 2010
Total assets at December 31, 2011, were $15.0 billion, an increase of 7.3% when compared to total assets of $14.0 billion at December 31, 2010. Loans and leases, increased to $10.4 billion at December 31, 2011, from $9.6 billion at December 31, 2010. Total deposits increased to $10.3 billion at December 31, 2011, from $9.2 billion at December 31, 2010. These increases were primarily due to the acquisition of Abington in fourth quarter 2011.
Equity capital at December 31, 2011 was $2.2 billion, an increase of $0.2 billion from December 31, 2010 when equity capital was also $2.0 billion. The acquisition of Abington resulted in 26.7 million common shares issued, and a net increase in equity of $150.8 million. As a result, book value per common share was $13.96 at December 31, 2011 and $15.27 at December 31, 2010. Tangible book value per common share was $7.28 at December 31, 2011 and $7.18 at December 31, 2010. For additional information concerning the changes in equity capital, refer to the “Consolidated Statements of Changes in Shareholders’ Equity” in Part II,Item 8.
Fair Value Measurements and The Fair Value Option for Financial Assets and Financial Liabilities
At December 31, 2011, Susquehanna had made no elections to use fair value as an alternative measurement for selected financial assets and financial liabilities not previously carried at fair value. In addition, non-financial assets and non-financial liabilities have not been measured at fair value because we have made the determination that the impact on our financial statements would be minimal. For additional information about our financial assets and financial liabilities carried at fair value, refer to“Note 24. Fair Value Disclosures” to the consolidated financial statements appearing in Part II,Item 8.
Investment Securities
Available-for-sale securities increased $14.2 million at December 31, 2011 as compared to December 31, 2010. This increase resulted from the Abington acquisition.
41
At December 31, 2011, we held no securities of any one issuer (other than securities of U.S. Government agencies and corporations, which, by regulation, may be excluded from this disclosure) where the aggregate book value exceeded 10% of shareholders’ equity.
Table 4 - Carrying Value of Investment Securities (1)
| | | | | | | | | | | | | | | | | | | | | | | | |
Year ended December 31, | | 2011 | | | 2010 | | | 2009 | |
| | | Available-
for-Sale | | | Held-to-
Maturity | | | Available-
for-Sale | | | Held-to-
Maturity | | | Available-
for-Sale | | | Held-to-
Maturity | |
| | | (Dollars in thousands) | |
U.S. Government agencies | | $ | 148,484 | | | $ | 0 | | | $ | 268,175 | | | $ | 0 | | | $ | 371,019 | | | $ | 0 | |
State and municipal | | | 401,978 | | | | 3,838 | | | | 396,660 | | | | 4,108 | | | | 353,419 | | | | 4,371 | |
Mortgage-backed | | | | | | | | | | | | | | | | | | | | | | | | |
Agency residential mortgage-backed | | | 1,531,403 | | | | | | | | 1,323,569 | | | | | | | | 680,182 | | | | | |
Non-agency residential mortgage-backed | | | 69,071 | | | | | | | | 116,811 | | | | | | | | 135,465 | | | | | |
Commercial mortgage-backed | | | 56,820 | | | | | | | | 104,842 | | | | | | | | 165,025 | | | | | |
Other debt obligations | | | 0 | | | | 4,570 | | | | 0 | | | | 4,560 | | | | 0 | | | | 4,550 | |
Synthetic collateralized debt obligations | | | 0 | | | | | | | | 0 | | | | | | | | 1,331 | | | | | |
Other structured financial products | | | 13,293 | | | | | | | | 12,503 | | | | | | | | 15,319 | | | | | |
Other debt securities | | | 51,136 | | | | | | | | 41,000 | | | | | | | | 0 | | | | | |
Equity securities of the Federal Home Loan Bank | | | 77,593 | | | | | | | | 71,065 | | | | | | | | 74,342 | | | | | |
Equity securities of the Federal Reserve Bank | | | 50,225 | | | | | | | | 50,225 | | | | | | | | 45,725 | | | | | |
Other equity securities | | | 23,104 | | | | | | | | 24,093 | | | | | | | | 24,519 | | | | | |
| | | | | | | | | | | | | | | | | | | | | | | | |
Total investment securities | | $ | 2,423,107 | | | $ | 8,408 | | | $ | 2,408,943 | | | $ | 8,668 | | | $ | 1,866,346 | | | $ | 8,921 | |
| | | | | | | | | | | | | | | | | | | | | | | | |
42
Table 5 - Maturities of Investment Securities
| | | | | | | | | | | | | | | | | | | | |
At December 31, 2011 | | Within 1
Year | | | After 1 Year
but Within
5 Years | | | After 5 Years
but Within
10 Years | | | After 10
Years | | | Total | |
| | | (Dollars in thousands) | |
Available-for-Sale | | | | | | | | | | | | | | | | | | | | |
U.S. Government agencies | | | | | | | | | | | | | | | | | | | | |
Fair value | | $ | 3,233 | | | $ | 142,902 | | | $ | 2,349 | | | $ | 0 | | | $ | 148,484 | |
Amortized cost | | | 3,138 | | | | 141,105 | | | | 2,337 | | | | 0 | | | | 146,580 | |
Yield | | | 4.18 | % | | | 1.99 | % | | | 3.06 | % | | | 0.00 | % | | | 2.05 | % |
State and municipal securities | | | | | | | | | | | | | | | | | | | | |
Fair value | | $ | 6,588 | | | $ | 15,646 | | | $ | 37,939 | | | $ | 341,805 | | | $ | 401,978 | |
Amortized cost | | | 6,457 | | | | 15,154 | | | | 35,921 | | | | 319,287 | | | | 376,819 | |
Yield (TE) | | | 8.22 | % | | | 3.77 | % | | | 5.35 | % | | | 5.92 | % | | | 5.82 | % |
Agency residential mortgage-backed securities | | | | | | | | | | | | | | | | | | | | |
Fair value | | $ | 0 | | | $ | 8,974 | | | $ | 553,571 | | | $ | 968,858 | | | $ | 1,531,403 | |
Amortized cost | | | 0 | | | | 8,486 | | | | 548,492 | | | | 946,857 | | | | 1,503,835 | |
Yield | | | 0.00 | % | | | 3.82 | % | | | 2.06 | % | | | 2.55 | % | | | 2.38 | % |
Non-agency residential mortgage-backed securities | | | | | | | | | | | | | | | | | | | | |
Fair value | | $ | 0 | | | $ | 0 | | | $ | 60 | | | $ | 69,011 | | | $ | 69,071 | |
Amortized cost | | | 0 | | | | 0 | | | | 62 | | | | 79,163 | | | | 79,225 | |
Yield | | | 0.00 | % | | | 0.00 | % | | | 4.14 | % | | | 5.20 | % | | | 5.20 | % |
Commercial mortgage-backed securities | | | | | | | | | | | | | | | | | | | | |
Fair value | | $ | 0 | | | $ | 0 | | | $ | 16,016 | | | $ | 40,804 | | | $ | 56,820 | |
Amortized cost | | | 0 | | | | 0 | | | | 15,574 | | | | 39,399 | | | | 54,973 | |
Yield | | | 0.00 | % | | | 0.00 | % | | | 5.92 | % | | | 5.89 | % | | | 5.90 | % |
Other structured financial products | | | | | | | | | | | | | | | | | | | | |
Fair value | | $ | 0 | | | $ | 0 | | | $ | 0 | | | $ | 13,293 | | | $ | 13,293 | |
Amortized cost | | | 0 | | | | 0 | | | | 0 | | | | 24,831 | | | | 24,831 | |
Yield | | | 0 | | | | 0 | | | | 0 | | | | 1.20 | % | | | 1.20 | % |
Other debt securities | | | | | | | | | | | | | | | | | | | | |
Fair value | | $ | 0 | | | $ | 5,090 | | | $ | 0 | | | $ | 46,046 | | | $ | 51,136 | |
Amortized cost | | | 0 | | | | 4,994 | | | | 0 | | | | 49,182 | | | | 54,176 | |
Yield | | | 0 | | | | 0 | | | | 0 | | | | 5.89 | % | | | 5.60 | % |
Equity securities | | | | | | | | | | | | | | | | | | | | |
Fair value | | $ | 0 | | | $ | 0 | | | $ | 0 | | | $ | 150,922 | | | $ | 150,922 | |
Amortized cost | | | 0 | | | | 0 | | | | 0 | | | | 150,357 | | | | 150,357 | |
Yield | | | 0 | | | | 0 | | | | 0 | | | | 2.42 | % | | | 2.42 | % |
| | | | | |
Held-to-Maturity | | | | | | | | | | | | | | | | | | | | |
State and municipal | | | | | | | | | | | | | | | | | | | | |
Fair value | | $ | 0 | | | $ | 0 | | | $ | 0 | | | $ | 3,838 | | | $ | 3,838 | |
Amortized cost | | | 0 | | | | 0 | | | | 0 | | | | 3,838 | | | | 3,838 | |
Yield | | | 0 | | | | 0 | | | | 0 | | | | 2.99 | % | | | 2.99 | % |
Other | | | | | | | | | | | | | | | | | | | | |
Fair value | | $ | 0 | | | $ | 0 | | | $ | 0 | | | $ | 4,570 | | | $ | 4,570 | |
Amortized cost | | | 0 | | | | 0 | | | | 0 | | | | 4,570 | | | | 4,570 | |
Yield | | | 0 | | | | 0 | | | | 0 | | | | 6.20 | % | | | 6.36 | % |
| | | | | |
Total Securities | | | | | | | | | | | | | | | | | | | | |
| | | | | |
Fair value | | $ | 9,821 | | | $ | 172,612 | | | $ | 609,935 | | | $ | 1,488,225 | | | $ | 2,431,515 | |
Amortized cost | | | 9,595 | | | | 169,739 | | | | 602,386 | | | | 1,467,127 | | | | 2,399,204 | |
Yield | | | 6.90 | % | | | 2.26 | % | | | 2.36 | % | | | 3.62 | % | | | 3.14 | % |
Additional Information
| | • | | Weighted-average yields are based on amortized cost. For presentation in this table, yields on tax-exempt securities have been calculated on a tax-equivalent basis. |
| | • | | Information presented in this table regarding mortgage-backed securities is based on final maturities. |
43
For additional information about our investment securities portfolio, refer to“Note 4. Investment Securities” and “Note 24. Fair Value Disclosures” to the consolidated financial statements appearing in Part II,Item 8.
Loans and Leases
The economy within Susquehanna’s footprint, as did the national economy, continued to remain sluggish in 2011, as businesses were hesitant to commit to new borrowings until the ramifications of the global economic concerns, and concerns over potential new regulations become clearer. Loans and leases, net of unearned income, increased 8.5%, from $9.6 billion at December 31, 2010, to $10.4 billion at December 31, 2011. Excluding the loans acquired in the Abington transaction, loans and leases increased 1.9%. Commercial, financial, and agricultural loans increased $54.5 million ($43.1 million excluding Abington), net of charge-offs of $25.5 million. Real estate construction loans, which we consider to be higher-risk loans, declined by $48.0 million ($118.9 million excluding Abington), net of charge-offs of $36.6 million. This 13.6% decrease in real estate construction loans was primarily due to our continuing plan to decrease that portfolio, thereby reducing our exposure in a segment that has been particularly stressed during this recession. For additional information about our real estate construction portfolio, refer to the discussion under“Risk Assets” presented inPART II, Item 7, Management’s Discussion and Analysis of Financial Condition and Results of Operations,Financial Condition. Consumer loans, however, increased by $119.2 million ($118.9 million excluding Abington) since December 31, 2010, and loans secured by residential real estate also increased by $545.9 million ($97.0 million excluding Abington), during the same period.
Table 6 presents loans outstanding, by type of loan, in our portfolio for the past five years. Our bank subsidiary historically has reported a significant amount of loans secured by real estate. Many of these loans have real estate collateral taken as additional security not related to the acquisition of the real estate pledged. Open-ended home equity loans totaled $1.1 billion at December 31, 2011. Senior liens on 1-4 family residential properties totaled $1.7 billion at December 31, 2011, and much of the $2.9 billion in loans secured by non-farm, non-residential properties represented collateralization of operating lines of credit or term loans that finance equipment, inventory, or receivables. Loans secured by farmland totaled $196.0 million, while loans secured by multi-family residential properties totaled $218.9 million at December 31, 2011.
Table 6 - Loan and Lease Portfolio
| | | | | | | | | | | | | | | | | | | | | | | | | | | | | | | | | | | | | | | | |
At December 31, | | 2011 | | | 2010 | | | 2009 | | | 2008 | | | 2007 | |
| | | Amount | | | % of
Loans to
Total
Loans and
Leases | | | Amount | | | % of
Loans to
Total
Loans and
Leases | | | Amount | | | % of
Loans to
Total
Loans and
Leases | | | Amount | | | % of
Loans to
Total
Loans and
Leases | | | Amount | | | % of
Loans to
Total
Loans and
Leases | |
| | | (Dollars in thousands) | |
Commercial, financial, and agricultural | | | $1,871,027 | | | | 17.9 | % | | | $1,816,519 | | | | 18.9 | % | | | $2,050,110 | | | | 21.0 | % | | | $2,063,942 | | | | 21.4 | % | | | $1,781,981 | | | | 20.4 | % |
Real estate: | | | | | | | | | | | | | | | | | | | | | | | | | | | | | | | | | | | | | | | | |
construction | | | 829,221 | | | | 7.9 | | | | 877,223 | | | | 9.1 | | | | 1,114,709 | | | | 11.3 | | | | 1,313,647 | | | | 13.6 | | | | 1,292,953 | | | | 14.8 | |
residential | | | 3,212,562 | | | | 30.8 | | | | 2,666,692 | | | | 27.7 | | | | 2,369,380 | | | | 24.1 | | | | 2,298,709 | | | | 23.8 | | | | 2,151,923 | | | | 24.6 | |
commercial | | | 3,136,887 | | | | 30.0 | | | | 2,998,176 | | | | 31.0 | | | | 3,060,331 | | | | 31.1 | | | | 2,875,502 | | | | 29.8 | | | | 2,661,841 | | | | 30.3 | |
Consumer | | | 722,329 | | | | 6.9 | | | | 603,084 | | | | 6.3 | | | | 482,266 | | | | 4.9 | | | | 419,371 | | | | 4.3 | | | | 411,159 | | | | 4.7 | |
Leases | | | 675,904 | | | | 6.5 | | | | 671,503 | | | | 7.0 | | | | 750,483 | | | | 7.6 | | | | 682,702 | | | | 7.1 | | | | 451,733 | | | | 5.2 | |
| | | | | | | | | | | | | | | | | | | | | | | | | | | | | | | | | | | | | | | | |
Total | | | $10,447,930 | | | | 100.0 | % | | | $9,633,197 | | | | 100.0 | % | | | $9,827,279 | | | | 100.0 | % | | | $9,653,873 | | | | 100.0 | % | | | $8,751,590 | | | | 100.0 | % |
| | | | | | | | | | | | | | | | | | | | | | | | | | | | | | | | | | | | | | | | |
44
Table 7 presents the maturity of commercial, financial, and agricultural loans, as well as real estate –construction loans. Table 8 presents the allocation of the allowance for loan and lease losses by type of loan.
Table 7 - Loan Maturity and Interest Sensitivity
| | | | | | | | | | | | | | | | |
At December 31, 2011 | | Under One
Year | | | One to Five
Years | | | Over Five
Years | | | Total | |
| | | (Dollars in thousands) | |
Maturity | | | | | | | | | | | | |
Commercial, financial, and agricultural | | $ | 643,151 | | | $ | 873,858 | | | $ | 354,018 | | | $ | 1,871,027 | |
Real estate - construction | | | 404,902 | | | | 323,535 | | | | 100,784 | | | | 829,221 | |
| | | | | | | | | | | | | | | | |
| | $ | 1,048,053 | | | $ | 1,197,393 | | | $ | 454,802 | | | $ | 2,700,248 | |
| | | | | | | | | | | | | | | | |
Rate sensitivity of loans with maturities greater than 1 year | | | | | | | | | | | | |
Variable rate | | | | | | $ | 641,216 | | | $ | 361,342 | | | | | |
Fixed rate | | | | | | | 556,177 | | | | 93,460 | | | | | |
| | | | | | | | | | | | | | | | |
| | | | | | $ | 1,197,393 | | | $ | 454,802 | | | | | |
| | | | | | | | | | | | | | | | |
Table 8 - Allocation of Allowance for Loan and Lease Losses
| | | | | | | | | | | | | | | | | | | | |
At December 31, | | 2011 | | | 2010 | | | 2009 | | | 2008 | | | 2007 | |
| | | (Dollars in thousands) | |
Commercial, financial, and agricultural | | $ | 30,086 | | | $ | 31,608 | | | $ | 27,350 | | | $ | 22,599 | | | $ | 23,970 | |
Real estate - construction | | | 36,868 | | | | 50,250 | | | | 54,305 | | | | 31,734 | | | | 20,552 | |
Real estate secured - residential | | | 28,839 | | | | 28,321 | | | | 22,815 | | | | 16,189 | | | | 12,125 | |
Real estate secured - commercial | | | 77,672 | | | | 69,623 | | | | 56,623 | | | | 33,765 | | | | 23,320 | |
Consumer | | | 3,263 | | | | 2,805 | | | | 3,090 | | | | 3,253 | | | | 4,778 | |
Leases | | | 10,561 | | | | 8,643 | | | | 7,958 | | | | 5,868 | | | | 4,203 | |
Overdrafts | | | 35 | | | | 36 | | | | 37 | | | | 34 | | | | 57 | |
Loans in process | | | 742 | | | | 513 | | | | 121 | | | | 285 | | | | 0 | |
Unallocated | | | 35 | | | | 35 | | | | 69 | | | | 22 | | | | (436 | ) |
| | | | | | | | | | | | | | | | | | | | |
Total | | $ | 188,100 | | | $ | 191,834 | | | $ | 172,368 | | | $ | 113,749 | | | $ | 88,569 | |
| | | | | | | | | | | | | | | | | | | | |
Reserve for unfunded commitments (1) | | $ | 975 | | | $ | 975 | | | $ | 975 | | | $ | 975 | | | $ | 675 | |
| | | | | | | | | | | | | | | | | | | | |
| (1) | Included in Other liabilities. |
Substantially all of our loans and leases are to enterprises and individuals in our market area. As shown in Table 9, there is no concentration of loans to borrowers in any one industry, or related industries, which exceeds 10% of total loans at December 31, 2011.
45
Table 9 - Loan Concentrations
| | | | | | | | | | | | | | | | | | | | | | | | |
| At December 31, 2011 | | Permanent | | | Construction | | | All Other | | | Total
Amount | | | % of
Nonaccrual in
Each Category | | | % of Total
Loans and
Leases Outstanding | |
| | | | | | | | | (Dollars in thousands) | | | | | | | |
Real estate - residential | | $ | 578,522 | | | $ | 34,654 | | | $ | 29,345 | | | $ | 642,522 | | | | 3.94 | % | | | 6.15 | % |
Retail real estate | | $ | 411,759 | | | $ | 5,394 | | | $ | 2,018 | | | $ | 419,171 | | | | 1.36 | % | | | 4.01 | % |
Lessors of professional offices | | $ | 325,603 | | | $ | 9,537 | | | $ | 2,338 | | | $ | 337,478 | | | | 2.05 | % | | | 3.23 | % |
Residential construction | | $ | 109,232 | | | $ | 199,998 | | | $ | 24,062 | | | $ | 333,292 | | | | 6.76 | % | | | 3.19 | % |
Land development (site work) construction | | $ | 64,081 | | | $ | 226,896 | | | $ | 34,886 | | | $ | 325,863 | | | | 4.16 | % | | | 3.12 | % |
Motor vehicles | | $ | 272,758 | | | $ | 277 | | | $ | 43,795 | | | $ | 316,830 | | | | 0.76 | % | | | 3.03 | % |
Manufacturing | | $ | 100,409 | | | $ | 1,144 | | | $ | 163,209 | | | $ | 264,762 | | | | 0.68 | % | | | 2.53 | % |
Elderly/child care services | | $ | 84,899 | | | $ | 49,421 | | | $ | 109,507 | | | $ | 243,827 | | | | 0.00 | % | | | 2.33 | % |
Agricultural | | $ | 193,701 | | | $ | 3,983 | | | $ | 35,080 | | | $ | 232,764 | | | | 4.47 | % | | | 2.23 | % |
Hotels/motels | | $ | 204,245 | | | $ | 12,007 | | | $ | 2,062 | | | $ | 218,314 | | | | 0.33 | % | | | 2.09 | % |
Medical services | | $ | 72,287 | | | $ | 624 | | | $ | 142,992 | | | $ | 215,903 | | | | 1.46 | % | | | 2.07 | % |
Commercial construction | | $ | 104,050 | | | $ | 83,407 | | | $ | 24,252 | | | $ | 211,709 | | | | 0.85 | % | | | 2.03 | % |
Warehouses | | $ | 183,656 | | | $ | 2,257 | | | $ | 480 | | | $ | 186,393 | | | | 0.07 | % | | | 1.78 | % |
Wholesalers | | $ | 45,331 | | | $ | 6,405 | | | $ | 120,733 | | | $ | 172,469 | | | | 0.54 | % | | | 1.65 | % |
Retail consumer goods | | $ | 92,309 | | | $ | 144 | | | $ | 55,803 | | | $ | 148,256 | | | | 1.95 | % | | | 1.42 | % |
Public services | | $ | 54,872 | | | $ | 4,467 | | | $ | 87,360 | | | $ | 146,699 | | | | 0.44 | % | | | 1.40 | % |
Contractors | | $ | 61,873 | | | $ | 3,015 | | | $ | 72,545 | | | $ | 137,433 | | | | 4.27 | % | | | 1.32 | % |
Restaurants/bars | | $ | 90,430 | | | $ | 1,179 | | | $ | 13,405 | | | $ | 105,014 | | | | 4.88 | % | | | 1.01 | % |
Recreation | | $ | 64,574 | | | $ | 5,560 | | | $ | 14,530 | | | $ | 84,664 | | | | 0.45 | % | | | 0.81 | % |
Transportation | | $ | 9,785 | | | $ | 382 | | | $ | 63,002 | | | $ | 73,169 | | | | 1.55 | % | | | 0.70 | % |
Industrial | | $ | 5,163 | | | $ | 25,000 | | | $ | 37,644 | | | $ | 67,807 | | | | 0.00 | % | | | 0.65 | % |
Real estate services | | $ | 56,185 | | | $ | 1,381 | | | $ | 7,332 | | | $ | 64,898 | | | | 0.41 | % | | | 0.62 | % |
Insurance Services | | $ | 12,638 | | | $ | 17 | | | $ | 37,589 | | | $ | 50,244 | | | | 3.23 | % | | | 0.48 | % |
For additional information about loans and leases, refer to “Note 5. Loans and Leases” to the consolidated financial statements appearing in Part II,Item 8.
Risk Assets
Non-performing assets consist of nonaccrual loans and leases and foreclosed real estate. Loans, other than consumer loans, are placed on nonaccrual status when principal or interest is past due ninety days or more, or if in the opinion of management, full collection is doubtful. Foreclosed real estate is property acquired through foreclosure or other means and is recorded at the lower of the loan’s carrying value or the fair market value of the related real estate collateral at the transfer date less estimated selling costs.
Troubled debt restructurings are loans for which we, for legal or economic reasons related to a debtor’s financial difficulties, have granted a concession to the debtor that we otherwise would not have considered. Concessions that result in the categorization of a loan as a troubled debt restructuring include:
| | • | | Reduction (absolute or contingent) of the stated interest rate; |
| | • | | Extension of the maturity date or dates at a stated interest rate lower than the current market rate for new debt with similar risk; |
| | • | | Reduction (absolute or contingent) of the face amount or maturity amount of the debt as stated in the instrument or other agreement; or |
46
| | • | | Reduction (absolute or contingent) of accrued interest. |
Loans contractually past due ninety days and still accruing interest are those loans that are well secured and in the process of collection.
Table 10 is a presentation of the five-year history of risk assets.
Table 10 - Risk Assets
| | | | | | | | | | | | | | | | | | | | |
At December 31, | | 2011 | | | 2010 | | | 2009 | | | 2008 | | | 2007 | |
| | | | | | (Dollars in thousands) | | | | |
Non-performing assets: | | | | | | | | | | | | | | | | | | | | |
Nonaccrual loans and leases: | | | | | | | | | | | | | | | | | | | | |
Commercial, financial, and agricultural | | $ | 14,385 | | | $ | 20,012 | | | $ | 20,282 | | | $ | 13,882 | | | $ | 2,799 | |
Real estate - construction | | | 37,727 | | | | 57,779 | | | | 97,717 | | | | 49,774 | | | | 20,998 | |
Real estate secured - residential | | | 41,922 | | | | 50,973 | | | | 37,254 | | | | 18,271 | | | | 11,755 | |
Real estate secured - commercial | | | 61,497 | | | | 65,313 | | | | 59,181 | | | | 22,477 | | | | 18,261 | |
Consumer | | | — | | | | 1 | | | | 27 | | | | 844 | | | | 397 | |
Leases | | | 947 | | | | 2,817 | | | | 5,093 | | | | 65 | | | | 2,531 | |
| | | | | | | | | | | | | | | | | | | | |
Total nonaccrual loans and leases | | | 156,478 | | | | 196,895 | | | | 219,554 | | | | 105,313 | | | | 56,741 | |
Foreclosed real estate | | | 41,050 | | | | 18,489 | | | | 24,292 | | | | 10,313 | | | | 11,927 | |
| | | | | | | | | | | | | | | | | | | | |
Total non-performing assets | | $ | 197,528 | | | $ | 215,384 | | | $ | 243,846 | | | $ | 115,626 | | | $ | 68,668 | |
| | | | | | | | | | | | | | | | | | | | |
Total non-performing assets as a percentage of period-end loans and leases and foreclosed real estate | | | 1.88 | % | | | 2.23 | % | | | 2.48 | % | | | 1.20 | % | | | 0.78 | % |
Allowance for loan and lease losses as a percentage of nonaccrual loans and leases | | | 120 | % | | | 97 | % | | | 79 | % | | | 108 | % | | | 156 | % |
Loans contractually past due 90 days and still accruing | | $ | 10,077 | | | $ | 20,588 | | | $ | 14,820 | | | $ | 22,316 | | | $ | 12,199 | |
Troubled debt restructurings | | | 72,852 | | | | 114,566 | | | | 58,244 | | | | 2,566 | | | | 2,582 | |
Nonaccrual loans and leases decreased from $196.9 million at December 31, 2010, to $156.5 million at December 31, 2011. The net decrease was primarily the result of the resolution of many real estate – construction credits during 2011. As a result, total nonperforming assets as a percentage of period-end loans and leases plus foreclosed real estate decreased from 2.23% at December 31, 2010 to 1.88% at December 31, 2011.
Real Estate - Construction
At December 31, 2011, real estate – construction loans comprised only 7.9% of our total loan and lease portfolio but accounted for 24.1% of total nonaccrual loans and leases, 19.6% of our allowance for loan and lease losses, and for the year ended December 31, 2011, this loan type accounted for 25.9% of total net charge-offs . As a result, we consider these real-estate construction loans to be higher-risk loans. To mitigate the risk of continued significant losses with regard to this portfolio, we have tightened the advance ratios for raw land, from 65% to 60% of appraised value or cost, whichever is less; for land approved/unimproved, from 70% to 65%; for land approved/improved, from 75% to 70%; and for construction of houses, apartments, or commercial buildings, from 75% to 70%.
Additional information about our real estate – construction loan portfolio is presented in Tables 11, 12, and 13. Categories within these tables are defined as follows:
| | • | | Construction loans - loans used to fund vertical construction for residential and non-residential structures; |
47
| | • | | Land development loans - loans secured by land for which the approvals for site improvements have been obtained, the site improvements are in progress, or the site improvements have been completed; and |
| | • | | Raw land - loans secured by land for which there are neither approvals nor site improvements. |
Table 11 - Construction, Land Development, and Other Land Loans - Portfolio Status
| | | | | | | | | | | | | | | | | | | | | | | | | | | | | | | | |
| | | | | | | | | | | | Past Due | | | | | | | | | | | | | |
Category | | Balance at
December 31,
2011 | | | % of Total
Construction | | | Past Due
30-89
Days | | | 90 Days
and Still
Accruing | | | Nonaccrual | | | Other
Internally
Monitored (1) | | | Net
Charge-offs (2) | | | Reserve (3) | |
| | | | | | | | | | | | (Dollars is thousands) | | | | | | | | | | |
1-4 Family: | | | | | | | | | | | | | | | | | | | | | | | | | | | | | | | | |
Construction | | $ | 202,284 | | | | 24.4 | % | | | 0.3 | % | | | 0.0 | % | | | 10.2 | % | | | 23.7 | % | | | 6.4 | % | | | 4.4 | % |
Land development | | | 178,114 | | | | 21.5 | | | | 0.0 | | | | 0.0 | | | | 0.3 | | | | 17.4 | | | | 0.5 | | | | 5.1 | |
Raw land | | | 5,521 | | | | 0.7 | | | | 0.0 | | | | 0.0 | | | | 0.0 | | | | 35.6 | | | | 44.9 | | | | 3.1 | |
| | | | | | | | | | | | | | | | | | | | | | | | | | | | | | | | |
| | | 385,919 | | | | 46.5 | | | | 0.1 | | | | 0.0 | | | | 5.5 | | | | 21.0 | | | | 4.8 | | | | 4.7 | |
| | | | | | | | | | | | | | | | | | | | | | | | | | | | | | | | |
All Other: | | | | | | | | | | | | | | | | | | | | | | | | | | | | | | | | |
Construction: | | | | | | | | | | | | | | | | | | | | | | | | | | | | | | | | |
Investor | | | 167,317 | | | | 20.2 | | | | 0.0 | | | | 0.0 | | | | 1.4 | | | | 9.4 | | | | 3.2 | | | | 4.0 | |
Owner-occupied | | | 61,911 | | | | 7.5 | | | | 0.4 | | | | 0.0 | | | | 0.0 | | | | 0.0 | | | | 0.0 | | | | 5.0 | |
Land development: | | | | | | | | | | | | | | | | | | | | | | | | | | | | | | | | |
Investor | | | 177,125 | | | | 21.4 | | | | 0.0 | | | | 0.0 | | | | 8.0 | | | | 29.5 | | | | 0.3 | | | | 4.0 | |
Owner-occupied | | | 9,843 | | | | 1.2 | | | | 0.0 | | | | 0.0 | | | | 0.0 | | | | 7.2 | | | | 0.1 | | | | 5.0 | |
Raw land: | | | | | | | | | | | | | | | | | | | | | | | | | | | | | | | | |
Investor | | | 26,278 | | | | 3.2 | | | | 0.0 | | | | 0.0 | | | | 0.0 | | | | 19.2 | | | | 14.1 | | | | 5.2 | |
Owner-occupied | | | 828 | | | | 0.1 | | | | 0.0 | | | | 0.0 | | | | 0.0 | | | | 0.0 | | | | 0.0 | | | | 0.2 | |
| | | | | | | | | | | | | | | | | | | | | | | | | | | | | | | | |
| | | 443,302 | | | | 53.5 | | | | 0.1 | | | | 0.0 | | | | 3.7 | | | | 16.6 | | | | 2.3 | | | | 4.2 | |
| | | | | | | | | | | | | | | | | | | | | | | | | | | | | | | | |
Total | | $ | 829,221 | | | | 100.0 | | | | 0.1 | | | | 0.0 | | | | 4.6 | | | | 18.6 | | | | 3.5 | | | | 4.5 | |
| | | | | | | | | | | | | | | | | | | | | | | | | | | | | | | | |
| (1) | Represents loans with initial signs of some financial weakness and potential problem loans that are on our internally monitored loan list, excluding nonaccrual and past-due loans reflected in the prior three columns. |
| (2) | Represents the amount of net charge-offs in each category for the last twelve months divided by the category loan balance at December 31, 2010 plus the net charge-offs. |
| (3) | Represents the amount of the allowance for loan and lease losses allocated to this category divided by the category loan balance at December 31, 2010. |
48
Table 12 - Construction, Land Development, and Other Land Loans - Collateral Locations
| | | | | | | | | | | | | | | | | | | | |
| | | Balance at
December 31, 2011 | | | Geographical Location by % | |
Category | | | Maryland | | | New Jersey | | | Pennsylvania | | | Other | |
| | | | | | (Dollars in thousands) | | | | | | | |
1-4 Family: | | | | | | | | | | | | | | | | | | | | |
Construction | | $ | 202,284 | | | | 43.0 | % | | | 2.9 | % | | | 51.9 | % | | | 2.3 | % |
Land development | | | 178,114 | | | | 48.1 | | | | 4.6 | | | | 36.1 | | | | 11.3 | |
Raw land | | | 5,521 | | | | 0.2 | | | | 3.4 | | | | 96.4 | | | | 0.0 | |
| | | | | | | | | | | | | | | | | | | | |
| | | 385,919 | | | | 44.7 | | | | 3.7 | | | | 45.2 | | | | 6.4 | |
| | | | | | | | | | | | | | | | | | | | |
All Other: | | | | | | | | | | | | | | | | | | | | |
Construction: | | | | | | | | | | | | | | | | | | | | |
Investor | | | 167,317 | | | | 24.5 | | | | 4.1 | | | | 65.8 | | | | 5.7 | |
Owner-occupied | | | 61,911 | | | | 23.9 | | | | 38.6 | | | | 34.9 | | | | 2.5 | |
Land development: | | | | | | | | | | | | | | | | | | | | |
Investor | | | 177,125 | | | | 18.4 | | | | 4.7 | | | | 56.7 | | | | 20.3 | |
Owner-occupied | | | 9,843 | | | | 57.1 | | | | 0.0 | | | | 42.9 | | | | 0.0 | |
Raw land: | | | | | | | | | | | | | | | | | | | | |
Investor | | | 26,278 | | | | 36.8 | | | | 1.2 | | | | 58.5 | | | | 3.6 | |
Owner-occupied | | | 828 | | | | 47.8 | | | | 0.0 | | | | 52.2 | | | | 0.0 | |
| | | | | | | | | | | | | | | | | | | | |
| | | 443,302 | | | | 23.5 | | | | 8.9 | | | | 56.9 | | | | 10.8 | |
| | | | | | | | | | | | | | | | | | | | |
Total | | $ | 829,221 | | | | 33.3 | | | | 6.5 | | | | 51.5 | | | | 8.8 | |
| | | | | | | | | | | | | | | | | | | | |
Table 13 - Construction, Land Development, and Other Land Loans - Portfolio Characteristics
| | | | | | | | | | | | |
| | | | | | Global Debt | | | | |
| | | Balance at | | | Coverage Ratio | | | Average Loan to | |
Category | | December 31, 2011 | | | Less than 1.1 Times (1) | | | Value (current) | |
| | | | | | (Dollars in thousands) | | | | |
1-4 Family: | | | | | | | | | | | | |
Construction | | $ | 202,284 | | | | 24.9 | % | | | 75.4 | % |
Land development | | | 178,114 | | | | 10.3 | | | | 68.9 | |
Raw land | | | 5,521 | | | | — | | | | 62.5 | |
| | | | | | | | | | | | |
| | | 385,919 | | | | 17.3 | | | | 72.9 | |
| | | | | | | | | | | | |
All Other: | | | | | | | | | | | | |
Construction: | | | | | | | | | | | | |
Investor | | | 167,317 | | | | 8.0 | | | | 72.7 | |
Owner-occupied | | | 61,911 | | | | 2.0 | | | | 58.7 | |
Land development: | | | | | | | | | | | | |
Investor | | | 177,125 | | | | 30.1 | | | | 77.1 | |
Owner-occupied | | | 9,843 | | | | 30.1 | | | | 57.6 | |
Raw land: | | | | | | | | | | | | |
Investor | | | 26,278 | | | | 15.5 | | | | 68.9 | |
Owner-occupied | | | 828 | | | | — | | | | 85.7 | |
| | | | | | | | | | | | |
| | | 443,302 | | | | 18.0 | | | | 72.5 | |
| | | | | | | | | | | | |
| | $ | 829,221 | | | | 17.7 | | | | 72.7 | |
| | | | | | | | | | | | |
| (1) | Global debt coverage ratio is calculated by analyzing the combined cash flows of the borrower, its related entities, and the guarantors (if any). The final global cash flow is divided by the global debt service for the same entities to determine the coverage ratio. |
49
We conduct quarterly portfolio reviews of real estate – construction loan relationships in excess of $0.75 million in order to identify potential problem loans. For those loan relationships under $0.75 million, the evaluation of risk is based upon delinquency. Included in this review is a comparison of absorption numbers (units leased or sold), market conditions, and performance to original projections. Lenders prepare cash flow projections for the loan being reviewed and all of the construction projects that the borrower may have financed with other lending institutions. An analysis of these cash flow projections determines whether the borrowing entity’s liquidity is sufficient to complete not only the project being financed by us but any other projects in the borrower’s portfolio, as well. The liquidity of any guarantors (the secondary source for continuance of the project) is also reviewed during this process to determine if it will support any extension of the project due to slower than expected absorption.
Loans designated as potential problem loans in the real estate – construction loan portfolio are reviewed quarterly by our loan review department (“Loan Review”) and executive management. This review consists of an analysis of the project’s historical results; the project’s projected results over the next four quarters; current financial information of the borrower and any guarantors; and a fifteen-month rolling cash flow of the projects financed by us and other lending institutions. In these meetings, we determine which loans are to be placed on nonaccrual and any downgrades or upgrades in ratings.
All potential problem real estate – construction loans are tested quarterly for impairment. The loan must meet the following criteria or it will be considered impaired:
| | • | | The debt coverage ratio (“DCR”) of the borrower must be at least 1.10X for the project. DCR is defined as annualized cash flow available for debt service divided by annual debt service. |
| | • | | If the DCR of the borrower is less than 1.10X, then the ratio of global cash flow of the borrower plus the guarantor divided by annual debt service (“GCF”) must be greater than 1.10X. |
| | • | | If the DCR and the GCF are not greater than 1.10X, then a fifteen-month rolling cash flow projection must show that the borrower/guarantor will achieve a 1.10X DCR within six months. This projection must be verified and supported by contracts or leases. |
Potential problem loans are generally assigned to our special-asset group or work-out department. While the loans are assigned to these areas:
| | • | | These groups work under the same process that was used to determine that the loan was impaired (as described above) to monitor the collectability of these loans. |
| | • | | Collateral is appraised by outside vendors. Appraisals are generally kept current (no more than one-year old). |
| | • | | Work-out plans are established with loan benchmarks that, if achieved, will result in our upgrading the loan. If it is not feasible to upgrade the loan, we will develop a plan to exit the loan through non-bank financing, sale of assets, or an orderly liquidation. |
We use independent third-party appraisal firms to determine the value of collateral. Real estate – construction collateral is generally valued on an annual basis, or in the event of deterioration in geographic areas of our foot print (as demonstrated by analytics from regional and national publications), on an as-needed basis. For ongoing real estate construction projects, we use independent inspectors to verify the progress of construction. Other collateral-based loans, such as loans secured by receivables and/or inventory, are generally valued on an annual basis using balance sheet information and field examinations performed by independent auditors.
We also review the liquidity of any guarantors (the secondary source for continuance of the project) to determine if their liquidity will support any extension of the project due to slower than expected absorption. If the result of any of the determinations set forth above is negative, we consider the loan to be impaired, and it is included in our evaluation of the allowance for loan and lease losses. If a loan is determined to be impaired, the
50
net realizable value of the underlying collateral is calculated by using a current appraisal, and any short fall is charged off. All partially charged-off loans become part of the calculation for the loan and lease loss reserve.
Although our impairment and charge-off analyses take into consideration the guarantor’s demonstrated ability and willingness to service the debt, we do not carry any impaired loans at values in excess of the current appraisal due to the loan having a guarantor. Our evaluation of guarantors includes examining their financial wherewithal and their reputation and willingness to work with their lenders. Since the beginning of the global economic slowdown in 2007, we have consistently assessed the probability for completion of a project by determining the guarantor’s liquidity and the cash flow generated by the project based upon current absorption.
We believe that we are well-equipped to evaluate the guarantors of loans. More than half of our commercial real estate borrowers have been our customers for over ten years and in the market for at least fifteen years. Most of our employee lenders have been lenders within their specific markets for fifteen or more years, and those whose experience is less than that time period are supervised by people who have the experience. Therefore, we have a strong historical perspective as to how borrowers performed in the last major recession of 1988 to 1993. For those borrowers/guarantors that do not have history dating back to the last major recession, third-party credit checks are used to determine their history and, when appropriate, how they have performed when real estate projects have not gone as expected.
Guarantors are required to provide us with copies of annual financial statements and tax returns, including all schedules. These financial statements and tax returns are analyzed using variables such as total debt obligation including contingent liabilities (an analysis of those contingent liabilities, the ability to service third-party debt, and whether the cash that is left will support our loan), and a review of financial statements to determine living expenses. These results are part of a fifteen-month rolling projection of the borrower’s and the guarantor’s cash flow. With respect to a potential problem loan, the rolling fifteen-month cash flow projection requires verification of all cash or liquid investments each quarter. In addition, we require that these statements are generally current to within one year.
Charge-offs are taken in the quarter that we determine that the loan is impaired. We exercise our rights under the full extent of the law to pursue all assets of the borrower and guarantors.
Troubled Debt Restructurings (“TDRs”)
Troubled debt restructurings have decreased significantly from $114.6 million at December 31, 2010 to $72.9 million at December 31, 2011. We consider all restructured loans to be impaired. Additional charge-offs subsequent to the restructuring during the years ended December 31, 2011 and 2010, totaled $19.6 million and $0, respectively.
A borrower with a restructured loan must maintain a 1.10X DCR as a stand-alone entity or a 1.10X GCF together with its guarantor. If the borrower fails to maintain that ratio or cannot recover to a 1.10X DCR or GCF within a six-month period, the restructured loan will be returned to nonaccrual status. Also, if a borrower is over ninety days past due, the restructured loan will be returned to nonaccrual status. Loans that have been restructured but have not recovered to a 1.10X DCR or GCF will remain on nonaccrual even when a forbearance agreement has been executed. When the borrower achieves a DCR or GCF of 1.10X or greater, the loan will be returned to restructured accruing status so long as the loan is current as to the restructured terms.
At the time a loan is restructured, we consider the following factors to determine whether the loan should accrue interest:
| | • | | Whether there is six months of payment history under the current terms; |
| | • | | Whether the loan is current under the restructured terms; and |
| | • | | Whether we expect the loan to continue to perform under the restructured terms with a DCR or GCF of 1.10X. |
51
We also review the financial performance of the borrower over the past year to be reasonably assured of repayment and performance according to the modified terms. This review consists of an analysis of the borrower’s historical results; the borrower’s projected results over the next four quarters; current financial information of the borrower and any guarantors; and a fifteen-month rolling cash flow of the borrower. All troubled debt restructurings are reviewed quarterly to determine the amount of any impairment.
In situations where the restructuring results in an interest-only period (greater than three months but not longer than fourteen months), our analysis of the borrower’s historical cash flow must conclude that the borrower can make the interest-only payments. Furthermore, the fifteen-month rolling projections must demonstrate that the borrower will achieve cash flow levels that will support a return to payments of principal and interest at a market rate within the timeframe prescribed in the forbearance agreement.
At the time of restructuring, the amount of the loan for which we are not reasonably assured of repayment is charged-off, but not forgiven. We have not had any additional charge-offs for any portion of the loans (after the initial charge-offs were taken at the time of the restructuring) for any of our troubled debt restructurings that accrue interest at the time the loans are restructured.
A borrower with a restructured loan must make six consecutive monthly payments at the restructured level and be current as to both interest and principal to be on accrual status. Furthermore, for a loan to be no longer considered restructured, it must cross over a calendar year-end and be at a market rate of interest.
Impaired Loans
Of the $177.7 million of impaired loans (nonaccrual, non-consumer relationships greater than $0.5 million plus accruing restructured loans) at December 31, 2011, $85.6 million, or 48.2%, had no related reserve. The determination that no related reserve for these collateral-dependent loans was required was based on the net realizable value of the underlying collateral.
Every impaired loan has a net realizable value (“NRV”) that is based on a recent appraisal (generally less than one year) of the collateral. That NRV is calculated by the loan officer, reviewed by Loan Review and finally reviewed by our credit risk department to insure that the calculation is correct. If the NRV is greater than the loan amount, then no impairment loss exists. If the NRV is less than the loan amount, the shortfall is rectified by a specific reserve for a period of ninety days to allow time for the borrower to pledge additional collateral. If the borrower fails to pledge additional collateral, a charge-off will occur. In certain circumstances, however, a direct charge-off may be taken at the time that the NRV calculation reveals a shortfall.
As part of our loan quality department meetings and loan work out meetings, these loans are reviewed quarterly to ensure that appraisals are kept current. If, based on general economic and geographic information from outside sources, we believe that the value of collateral is decreasing, we will obtain a new appraisal and make adjustments accordingly.
Charge-offs only are taken based on the fair market value of the underlying collateral, as determined from a current appraisal. All partially charged-off loans remain on nonaccrual status until they are brought current as to both principal and interest and have six months of payment history.
All impaired loans have an independent third-party appraisal to determine the fair value of the underlying collateral. Once we have identified further deterioration of an impaired loan, we obtain an updated appraisal. Prior to receiving the updated appraisal, we will establish a specific reserve for that estimated deterioration, based upon our assessment of market conditions. Once the updated appraisal is received, the book value of the loan is adjusted to its fair value as determined by the appraisal.
52
Loans that are determined to be impaired are written down to their current value, based upon a current appraisal at the time of impairment. No additional value is assigned to any guarantee with regard to this appraisal. We exercise our rights under the full extent of the law to pursue all assets of the borrower and guarantors.
Potential Problem Loans
Potential problem loans consist of loans that are performing under contract but for which potential credit problems have caused us to place them on our internally monitored loan list. The decrease in potential problem loans, which are not included in Table 10, can be attributed to a stabilization of the difficult economic conditions. Continuing difficulties in the economy and the accompanying impact on these borrowers, as well as future events, such as regulatory examination assessments, may result in these loans and others not currently so identified being classified as non-performing assets in the future.
Table 14 - Potential Problem Loans by Loan Category
| | | | | | | | | | | | |
| | | December 31, | | | December 31, | | | December 31, | |
| | | 2011 | | | 2010 | | | 2009 | |
| | | (Dollars in thousands) | |
Commercial, financial, and agricultural | | $ | 49,316 | | | $ | 59,793 | | | $ | 54,552 | |
Real estate - construction | | | 57,796 | | | | 68,204 | | | | 59,957 | |
Real estate secured - residential | | | 9,490 | | | | 15,972 | | | | 18,878 | |
Real estate secured - commercial | | | 157,208 | | | | 173,827 | | | | 172,793 | |
| | | | | | | | | | | | |
Total potential problem loans | | $ | 273,810 | | | $ | 317,796 | | | $ | 306,180 | |
| | | | | | | | | | | | |
Loans with principal and/or interest delinquent ninety days or more and still accruing interest totaled $10.1 million at December 31, 2011, a decrease of $10.5 million, from $20.6 million at December 31, 2010. Continued difficulties in the economy may adversely affect certain other borrowers and may cause additional loans to become past due beyond ninety days or to be placed on non-accrual status because of the uncertainty of receiving full payment of either principal or interest on these loans.
For additional information about the credit quality of loans and leases, refer to“Note 5. Loans and Leases” to the consolidated financial statements appearing in Part II,Item 8.
In light of the on-going current economic situation, we continue to undertake the following additional measures to recognize and resolve troubled credits:
| | • | | We review all credit relationships in the categories of Commercial Real Estate, Commercial Construction — Real Estate, and Residential Real Estate with aggregate exposure of $5.0 million and loans of $2.5 million are reviewed once a year to determine the borrower’s ability to meet the terms and conditions of the loan agreements. This review includes a stress test for an increase of 1.0% in interest rates; |
| | • | | We hold credit quality meetings during the second month of each quarter to review all criticized and classified loans. This includes reviewing global cash flows and stress testing for an increase of 1.0% in interest rates; |
| | • | | We complete a fifteen-month rolling projection of potential non-accrual loans, charge-offs, foreclosed assets, loans ninety days past due and still accruing, total delinquencies, troubled debt restructurings, specific reserves, and recoveries over $0.5 million during the third month of every quarter. These projections are reviewed and discussed by executive management; |
| | • | | We hold monthly meetings with our work-out officers to review their portfolios and strategy to either upgrade or exit particular credit relationships; |
53
| | • | | We have instituted an ongoing review in our Consumer Lending area of all home equity line of credit loans to determine which property values and FICO scores have been negatively affected; and |
| | • | | We are in the process of implementing risk-based pricing to reflect the cost of loans progressing through our risk-rating system. |
We believe that 2012 will be better than 2011, but still a challenging year, with the effects of the recession continuing to affect the commercial and industrial, commercial real estate, and consumer credit segments. However, we also believe that we have the proper monitoring systems in place to recognize issues in an appropriate time frame and to minimize the effect on our earnings.
Goodwill and Other Identifiable Intangible Assets
We test goodwill for impairment on an annual basis, or more often if events or circumstances indicate that there may be an impairment. This test, which requires significant judgment and analysis, involves discounted cash flows and market-price multiples of non-distressed financial institutions.
We performed our annual goodwill impairment tests in the second quarter of 2011, and determined that the fair value of each of our reporting units exceeded its book value, and there was no goodwill impairment. However, at September 30, 2011, having taken into consideration current market conditions, we decided that it would be prudent to perform interim goodwill impairment tests for our bank reporting unit and our wealth management reporting unit. We determined, as of September 30, 2011, that there was no goodwill impairment, as the fair value of each reporting unit exceeded its book value.
Based upon our analyses at December 31, 2011, the fair value of the bank reporting unit exceeded its carrying value by 16.0%, the fair value of the wealth management reporting unit exceeded its carrying value by 59.7%, and the fair value of the property and casualty insurance reporting unit exceeded its carrying value by 48.4%. As a result of this analysis, we have determined that there is no goodwill impairment. We will continue to monitor and evaluate the carrying value of goodwill for possible future impairment as conditions warrant.
For additional information about goodwill, refer to “Note 8. “Goodwill and Other Intangible Assets” to the consolidated financial statements appearing in Part II,Item 8.
Deposits
Our deposit base is consumer-oriented, consisting of time deposits, primarily certificates of deposit with various terms, interest-bearing demand accounts, savings accounts, and demand deposits. Average deposit balances by type and the associated average rate paid are summarized in Table 15.
Table 15 - Average Deposit Balances
| | | | | | | | | | | | | | | | | | | | | | | | |
Year ended December 31, | | 2011 | | | 2010 | | | 2009 | |
| | | Average | | | Average | | | Average | | | Average | | | Average | | | Average | |
| | | Balance | | | Rate Paid | | | Balance | | | Rate Paid | | | Balance | | | Rate Paid | |
| | | | | | | | | (Dollars in thousands) | | | | | | | |
Demand deposits | | $ | 1,413,077 | | | | 0.00 | % | | $ | 1,309,516 | | | | 0.00 | % | | $ | 1,222,365 | | | | 0.00 | % |
Interest-bearing demand deposits | | | 3,884,182 | | | | 0.55 | | | | 3,481,728 | | | | 0.64 | | | | 2,882,949 | | | | 0.77 | |
Savings deposits | | | 815,066 | | | | 0.14 | | | | 766,210 | | | | 0.15 | | | | 731,787 | | | | 0.23 | |
Time deposits | | | 3,482,601 | | | | 1.56 | | | | 3,628,219 | | | | 2.22 | | | | 4,187,549 | | | | 3.26 | |
| | | | | | | | | | | | | | | | | | | | | | | | |
Total | | $ | 9,594,926 | | | | | | | $ | 9,185,673 | | | | | | | $ | 9,024,650 | | | | | |
| | | | | | | | | | | | | | | | | | | | | | | | |
Total deposits increased $1.1 billion, or 12.0%, from December 31, 2010 to December 31, 2011. Time deposits decreased 0.2% while our core deposits, which consist of noninterest-bearing demand deposits, interest-
54
bearing demand deposits, and savings deposits increased 18.9%. These changes, in part, reflect the results of our continuing strategy to improve our mix of deposits by allowing high-cost, single-service certificates of deposit to run off.
We do not rely upon time deposits of $0.1 million or more as a principal source of funds, as they represent 12.2% of total deposits. Table 16 presents a breakdown by maturity of time deposits of $0.1 million or more as of December 31, 2011.
Table 16 - Deposit Maturity at December 31, 2011
| | | | |
(Dollars in thousands) | | | |
Three months or less | | $ | 259,286 | |
Over three months through six months | | | 187,167 | |
Over six months through twelve months | | | 307,765 | |
Over twelve months | | | 500,964 | |
| | | | |
Total | | $ | 1,255,182 | |
| | | | |
Borrowings
Federal Home Loan Bank Borrowings (“FHLB”)
Short-term FHLB borrowings increased $600.0 million from December 31, 2010 to December 31, 2011, while long-term FHLB borrowings decreased $730.6 million from December 31, 2010 to December 31, 2011 as a result of a balance sheet restructuring during the fourth quarter of 2011. We experienced a $50.0 million prepayment penalty as a result of prepaying $679.0 million of fixed rate FHLB borrowings with an average weighted cost of 4.27%, however, we expect to offset this penalty within two years through decreased interest expense on FHLB borrowings. This prepayment was funded by reducing federal funds sold by $114.0 million, selling $148.0 million of investment securities with an average yield of 0.8% at an after-tax loss of $200,000 and borrowing short-term $450.0 million. The $450.0 million of short-term borrowings were hedged by purchasing forward starting interest rate swaps of $252.0 million and caps of $198.0 million with the starting date of the caps being December 14, 2012 and the starting dates of the swaps being between June 19, 2013 and December 16, 2013.
11% Junior Subordinated Deferrable Interest Debentures, Series II
On March 16, 2010, Susquehanna Capital II, a Delaware statutory trust, sold to the public $50.0 million aggregate principal amount of 11% Cumulative Trust Preferred Securities, Series II and used the proceeds from those sales to fund its purchase of $50.0 million of 11% Junior Subordinated Deferrable Interest Debentures, Series II issued by Susquehanna. The subordinated debentures are unsecured and rank equally in right of payment with our existing series of junior subordinated debt securities. Interest on the subordinated debentures is payable semi-annually in arrears on each March 23 and September 23, beginning September 23, 2010, unless we defer payment. We may elect to redeem any or all of the subordinated debentures at any time on or after March 23, 2015. The maturity date of the subordinated debentures is March 23, 2040.
For additional information about borrowings, refer to“Note 10. Borrowings” to the consolidated financial statements appearing in Part II,Item 8.
Contractual Obligations and Commercial Commitments
Table 17 presents certain of our contractual obligations and commercial commitments at December 31, 2010 and their expected year of payment or expiration.
55
|
| Table 17 - Contractual Obligations and Commercial Commitments at December 31, 2011 |
| | | | | | | | | | | | | | | | | | | | |
| | | Payments Due by Period | |
| | | | | | Less than | | | | | | | | | | |
| | | Total | | | 1 Year | | | 1 - 3 Years | | | 4 - 5 Years | | | Over 5 Years | |
| | | (Dollars in thousands) | |
Certificates of deposit | | $ | 3,412,464 | | | $ | 1,893,858 | | | $ | 1,201,704 | | | $ | 250,147 | | | $ | 66,755 | |
FHLB borrowings | | | 971,020 | | | | 905,743 | | | | 28,907 | | | | 28,074 | | | | 8,296 | |
Long-term debt | | | 499,347 | | | | 75,000 | | | | 75,000 | | | | — | | | | 349,347 | |
Operating leases | | | 145,245 | | | | 17,607 | | | | 32,092 | | | | 27,389 | | | | 68,157 | |
Residual value guaranty fees | | | 9,000 | | | | 3,000 | | | | 6,000 | | | | 0 | | | | 0 | |
|
| Other Commercial Commitments |
| | | | | | | | | | | | | | | | | | | | |
| | | Commitment Expiration by Period | |
| | | | | | Less than | | | | | | | | | | |
| | | Total | | | 1 Year | | | 1 - 3 Years | | | 4 - 5 Years | | | Over 5 Years | |
| | | (Dollars in thousands) | |
Stand-by letters of credit | | $ | 294,368 | | | $ | 203,047 | | | $ | 90,593 | | | $ | 84 | | | $ | 644 | |
Commercial commitments | | | 785,987 | | | | 630,240 | | | | 129,074 | | | | 18,153 | | | | 8,520 | |
Real estate commitments | | | 205,036 | | | | 135,675 | | | | 62,152 | | | | 5,778 | | | | 1,431 | |
Shareholders’ Equity
Common Stock
On January 19, 2011, Susquehanna repurchased the warrant that was issued to the U.S. Treasury on December 12, 2008 in conjunction with our participation in the TARP Capital Purchase Program. The warrant entitled the U.S. Treasury to purchase up to 3.0 million shares of Susquehanna’s common stock at a price of $14.86 per share. We paid $5.3 million to the Treasury to repurchase the warrant. The repurchase of the warrant concluded Susquehanna’s participation in the Capital Purchase Program.
On October 1, 2011, Susquehanna completed its acquisition of Abington Bancorp, Inc., issuing 26.7 million shares of common stock, par value $2.00, in connection with the transaction. The Abington acquisition increased total shareholders’ equity by $150.8 million.
Capital Adequacy
The maintenance of a strong capital base at the parent company level as well as at the bank level is an important aspect of our philosophy. We and the bank have leverage and risk-weighted ratios well in excess of regulatory minimums, and each entity is considered “well capitalized” under regulatory guidelines.
In September 2010, the Basel Committee on Banking Supervision released revisions to recommended capital requirements, which are referred to as Basel III. Our capital ratios are well in excess of these new requirements. These new ratio requirements are still considered preliminary, and there is a prolonged implementation time frame. We will monitor any proposed clarifications of these benchmarks.
For additional information related to our risk-based capital ratios, see“Note 16. Capital Adequacy” to the consolidated financial statements appearing in Part II,Item 8. Market Risks.
56
The types of market risk exposures generally faced by banking entities include:
| | • | | equity market price risk; |
| | • | | foreign currency risk; and |
Due to the nature of our operations, foreign currency and commodity price risk are not significant to us.
Equity Market Price Risk
Equity market price risk is the risk related to market fluctuations of equity prices in the securities markets. While we do not have significant risk in our investment portfolio, market price fluctuations may affect fee income generated through our asset management operations. Generally, our fee structure is based on the market value of assets being managed at specific time frames. If market values decline, our fee income may also decline.
Liquidity Risk
The maintenance of adequate liquidity — the ability to meet the cash requirements of our customers and other financial commitments — is a fundamental aspect of our asset/liability management strategy. Our policy of diversifying our funding sources — purchased funds, repurchase agreements, and deposit accounts — allows us to avoid undue concentration in any single financial market and also to avoid heavy funding requirements within short periods of time. At December 31, 2011, our bank subsidiary had approximately $715.4 million available under a collateralized line of credit with the Federal Home Loan Bank of Pittsburgh; and $1.3 billion more would have been available provided that additional collateral had been pledged. In addition, at December 31, 2011, we had unused federal funds lines of $987.0 million and aggregate brokered certificates of deposits of only $165.5 million.
In addition, we have pledged certain auto leases, certain auto loans, certain commercial finance leases, and certain investment securities to obtain collateralized borrowing availability at the Federal Reserve’s Discount Window. At December 31, 2011, we had unused collateralized availability of $983.9 million.
Liquidity, however, is not entirely dependent on increasing our liability balances. Liquidity is also evaluated by taking into consideration maturing or readily marketable assets. Unrestricted short-term investments totaled $55.8 million at December 31, 2011, and represented additional sources of liquidity.
Management believes these sources of liquidity are sufficient to support our banking operations.
Interest Rate Risk
The management of interest rate risk focuses on controlling the risk to net interest income and the associated net interest margin as the result of changing market rates and spreads. Interest rate sensitivity is the matching or mismatching of the repricing and rate structure of the interest-bearing assets and liabilities. Our goal is to control risk exposure to changing rates within management’s accepted guidelines to maintain an acceptable level of risk exposure in support of consistent earnings.
We employ a variety of methods to monitor interest rate risk. These methods include basic gap analysis, which points to directional exposure; routine rate shocks simulation; and evaluation of the change in economic value of equity. Board directed guidelines have been adopted for both the rate shock simulations and economic
57
value of equity exposure limits. By dividing the assets and liabilities into three groups—fixed rate, floating rate, and those which reprice only at our discretion—strategies are developed to control the exposure to interest rate fluctuations.
Our interest rate risk using the static gap analysis is presented in Table 18. This method reports the difference between interest-rate sensitive assets and liabilities at a specific point in time. Management uses the static gap methodology to identify our directional interest-rate risk. Table 18 also illustrates our estimated interest-rate sensitivity (periodic and cumulative) gap positions as calculated as of December 31, 2011 and 2010. These estimates include anticipated prepayments on commercial and residential loans, and mortgage-backed securities, in addition to certain repricing assumptions relative to our core deposits. Traditionally, an institution with more assets repricing than liabilities over a given time frame is considered asset sensitive, and one with more liabilities repricing than assets is considered liability sensitive. An asset sensitive institution will generally benefit from rising rates, and a liability sensitive institution will generally benefit from declining rates. Static gap analysis is widely accepted because of its simplicity in identifying interest rate risk exposure; but it ignores market spread adjustments, the changing mix of the balance sheet, planned balance sheet management strategies, and the change in prepayment assumptions.
58
Table 18 - Balance Sheet Gap Analysis
| | | | | | | | | | | | | | | | | | | | |
| | | 1-3 | | | 3-12 | | | 1-3 | | | Over 3 | | | | |
At December 31, 2011 | | months | | | months | | | years | | | years | | | Total | |
| | | (Dollars in thousands) | |
Assets | | | | | | | | | | | | | | | | | | | | |
Short-term investments | | $ | 121,686 | | | $ | 0 | | | $ | 0 | | | $ | 0 | | | $ | 121,686 | |
Investments | | | 327,137 | | | | 250,851 | | | | 542,415 | | | | 1,311,111 | | | | 2,431,514 | |
Loans and leases, net of unearned income | | | 4,549,859 | | | | 1,474,462 | | | | 2,299,960 | | | | 1,957,757 | | | | 10,282,038 | |
| | | | | | | | | | | | | | | | | | | | |
Total | | $ | 4,998,682 | | | $ | 1,725,313 | | | $ | 2,842,375 | | | $ | 3,268,868 | | | $ | 12,835,238 | |
| | | | | | | | | | | | | | | | | | | | |
Liabilities | | | | | | | | | | | | | | | | | | | | |
Interest-bearing demand | | $ | 1,775,794 | | | $ | 887,898 | | | $ | 1,331,846 | | | $ | 443,949 | | | $ | 4,439,487 | |
Savings | | | 347,484 | | | | 173,742 | | | | 260,613 | | | | 86,871 | | | | 868,710 | |
Time | | | 335,518 | | | | 800,141 | | | | 824,150 | | | | 191,330 | | | | 2,151,139 | |
Time in denominations of $100 or more | | | 258,700 | | | | 491,264 | | | | 371,996 | | | | 125,560 | | | | 1,247,520 | |
Total borrowings | | | 1,846,195 | | | | 87,669 | | | | 29,001 | | | | 274,567 | | | | 2,237,432 | |
| | | | | | | | | | | | | | | | | | | | |
Total | | $ | 4,563,691 | | | $ | 2,440,714 | | | $ | 2,817,606 | | | $ | 1,122,277 | | | $ | 10,944,288 | |
| | | | | | | | | | | | | | | | | | | | |
Impact of other assets, other liabilities, capital, and noninterest-bearing deposits: | | $ | (21,836 | ) | | $ | 117,205 | | | $ | (81,375 | ) | | $ | (1,904,944 | ) | | | | |
Interest Sensitivity Gap: | | | | | | | | | | | | | | | | | | | | |
Periodic | | $ | 413,155 | | | $ | (598,196 | ) | | $ | (56,606 | ) | | $ | 241,648 | | | | | |
Cumulative | | | | | | | (185,041 | ) | | | (241,647 | ) | | | 1 | | | | | |
Cumulative gap as a percentage of total assets | | | 3 | % | | | -1 | % | | | -2 | % | | | 0 | % | | | | |
| | | | | | | | | | | | | | | | | | | | |
| | | 1-3 | | | 3-12 | | | 1-3 | | | Over 3 | | | | |
At December 31, 2010 | | months | | | months | | | years | | | years | | | Total | |
| | | (Dollars in thousands) | |
Assets | | | | | | | | | | | | | | | | | | | | |
Short-term investments | | $ | 93,948 | | | $ | 0 | | | $ | 0 | | | $ | 0 | | | $ | 93,948 | |
Investments | | | 219,119 | | | | 79,328 | | | | 242,085 | | | | 1,877,079 | | | | 2,417,611 | |
Loans and leases, net of unearned income | | | 4,331,861 | | | | 1,416,432 | | | | 2,094,900 | | | | 1,593,108 | | | | 9,436,301 | |
| | | | | | | | | | | | | | | | | | | | |
Total | | $ | 4,644,928 | | | $ | 1,495,760 | | | $ | 2,336,985 | | | $ | 3,470,187 | | | $ | 11,947,860 | |
| | | | | | | | | | | | | | | | | | | | |
Liabilities | | | | | | | | | | | | | | | | | | | | |
Interest-bearing demand | | $ | 1,458,686 | | | $ | 729,343 | | | $ | 1,094,014 | | | $ | 364,671 | | | $ | 3,646,714 | |
Savings | | | 307,141 | | | | 153,570 | | | | 230,356 | | | | 76,785 | | | | 767,852 | |
Time | | | 448,222 | | | | 831,852 | | | | 756,080 | | | | 132,349 | | | | 2,168,503 | |
Time in denominations of $100 or more | | | 443,774 | | | | 416,166 | | | | 313,311 | | | | 62,652 | | | | 1,235,903 | |
Total borrowings | | | 1,856,262 | | | | 53,473 | | | | 356,474 | | | | 311,990 | | | | 2,578,199 | |
| | | | | | | | | | | | | | | | | | | | |
Total | | $ | 4,514,085 | | | $ | 2,184,404 | | | $ | 2,750,235 | | | $ | 948,447 | | | $ | 10,397,171 | |
| | | | | | | | | | | | | | | | | | | | |
Impact of other assets, other liabilities, capital, and noninterest-bearing deposits: | | $ | 507,948 | | | $ | (69,046 | ) | | $ | (410,940 | ) | | $ | (1,578,652 | ) | | | | |
Interest Sensitivity Gap: | | | | | | | | | | | | | | | | | | | | |
Periodic | | $ | 638,791 | | | $ | (757,690 | ) | | $ | (824,190 | ) | | $ | 943,089 | | | | | |
Cumulative | | | | | | | (118,899 | ) | | | (943,089 | ) | | | 0 | | | | | |
Cumulative gap as a percentage of total assets | | | 5 | % | | | -1 | % | | | -7 | % | | | 0 | % | | | | |
In addition to static gap reports comparing the sensitivity of interest-earning assets and interest-bearing liabilities to changes in interest rates, we also utilize simulation analysis that measures our exposure to interest rate risk. The financial simulation model calculates the income effect and the economic value of assets, liabilities and equity at current and forecasted interest rates, and at hypothetical higher and lower interest rates at one percent intervals. The income effect and economic value of defined categories of financial instruments is calculated by the model using estimated cash flows based on embedded options, prepayments, early withdrawals, and weighted average contractual rates and terms. For economic value calculations, the model also considers discount rates for similar financial instruments. The economic values of longer-term fixed-rate financial
59
instruments are generally more sensitive to changes in interest rates. Adjustable-rate and variable-rate financial instruments largely reflect only a change in economic value representing the difference between the contractual and discounted rates until the next contractual interest rate repricing date, unless subject to rate caps and floors.
A portion of our loan portfolio consists of commercial and residential mortgage loans containing embedded options, which permit the borrower to repay the principal balance of the loan prior to maturity (“prepayments”) without penalty. A loan’s susceptibility for prepayment is dependent upon a number of factors, including the current interest rate versus the contractual interest rate of the loan, the financial ability of the borrower to refinance, the economic benefit and the availability of refinancing at attractive terms in addition to general changes in customers’ needs. Refinancing may also depend upon economic and other factors in specific geographic areas that affect the sales and price levels of residential property. In a changing interest rate environment, prepayments may increase or decrease depending on the current relative levels and expectations of future short-term and long-term interest rates.
Changes in market rates and general economic conditions impact our organization’s mortgage-backed security portfolio. This will have an associated change on our sensitivity position in changing economic times. Savings and checking deposits generally may be withdrawn upon the customer’s request without prior notice. A continuing relationship with customers resulting in future deposits and withdrawals is generally predictable, resulting in a dependable source of funds. Time deposits generally have early withdrawal penalties, while term FHLB borrowings and subordinated notes have prepayment penalties, which discourage customer withdrawal of time deposits and prepayment of FHLB borrowings and subordinated notes prior to maturity.
Our floating-rate loan portfolio is primarily indexed to national interest rate indices. The portfolio is funded by interest-bearing liabilities which are determined by other indices, primarily deposits and FHLB borrowings. A changing interest rate environment may result in different levels of changes to the different indices resulting in disproportionate changes in the value of, and the net earnings generated from, such financial instruments. Basis risk is the result of this inconsistent change in the indices, with historical relationships not always being a good indicator.
Tables 19 and 20 reflect the estimated income effect and economic value of assets, liabilities, and equity calculated using certain assumptions we determined as of December 31, 2011, and 2010, at then current interest rates and at hypothetical higher interest rates (given the state of current interest rates, hypothetical lower interest rates are meaningless) in 1% and 2% increments. As noted in Table 19, the economic value of equity at risk as of December 31, 2010, is -5%, at an interest rate change of positive 2%. As noted in Table 20, net interest income at risk as of December 31, 2010, is 2%, at an interest rate change of positive 2%.
60
Table 19 - Balance Sheet Shock Analysis
| | | | | | | | | | | | |
| | | Base | | | | | | | |
| | | Present | | | | | | | |
At December 31, 2011 | | Value | | | +1% | | | +2% | |
Assets | | | | | | | | | | | | |
Cash and due from banks | | $ | 277,528 | | | $ | 277,528 | | | $ | 277,528 | |
Short-term investments | | | 121,685 | | | | 121,681 | | | | 121,678 | |
Investment securities: | | | | | | | | | | | | |
Held-to-maturity | | | 8,427 | | | | 8,407 | | | | 8,387 | |
Available-for-sale | | | 2,445,575 | | | | 2,378,523 | | | | 2,284,728 | |
Loans and leases, net of unearned income | | | 10,344,966 | | | | 10,169,652 | | | | 10,021,187 | |
Other assets | | | 1,884,230 | | | | 1,884,230 | | | | 1,884,230 | |
| | | | | | | | | | | | |
Total assets | | $ | 15,082,411 | | | $ | 14,840,021 | | | $ | 14,597,738 | |
| | | | | | | | | | | | |
Liabilities | | | | | | | | | | | | |
Deposits: | | | | | | | | | | | | |
Non-interest bearing | | $ | 1,569,811 | | | $ | 1,569,811 | | | $ | 1,569,811 | |
Interest-bearing | | | 8,383,787 | | | | 8,129,103 | | | | 7,895,408 | |
Total borrowings | | | 2,476,440 | | | | 2,365,965 | | | | 2,287,228 | |
Other liabilities | | | 253,637 | | | | 253,637 | | | | 253,637 | |
| | | | | | | | | | | | |
Total liabilities | | | 12,683,675 | | | | 12,318,516 | | | | 12,006,084 | |
Total economic equity | | | 2,398,736 | | | | 2,521,505 | | | | 2,591,654 | |
| | | | | | | | | | | | |
Total liabilities and equity | | $ | 15,082,411 | | | $ | 14,840,021 | | | $ | 14,597,738 | |
| | | | | | | | | | | | |
Economic equity ratio | | | 16 | % | | | 17 | % | | | 18 | % |
Value at risk | | $ | 0 | | | $ | 122,769 | | | $ | 192,918 | |
% Value at risk | | | 0 | % | | | 5 | % | | | 8 | % |
| | | | | | | | | | | | |
| | | Base | | | | | | | |
| | | Present | | | | | | | |
At December 31, 2010 | | Value | | | 1% | | | 2% | |
Assets | | | | | | | | | | | | |
Cash and due from banks | | $ | 200,646 | | | $ | 200,646 | | | $ | 200,646 | |
Short-term investments | | | 93,947 | | | | 93,946 | | | | 93,944 | |
Investment securities: | | | | | | | | | | | | |
Held-to-maturity | | | 8,668 | | | | 8,435 | | | | 8,221 | |
Available-for-sale | | | 2,408,943 | | | | 2,319,507 | | | | 2,219,455 | |
Loans and leases, net of unearned income | | | 9,492,108 | | | | 9,325,284 | | | | 9,182,462 | |
Other assets | | | 1,800,512 | | | | 1,800,512 | | | | 1,800,512 | |
| | | | | | | | | | | | |
Total assets | | $ | 14,004,824 | | | $ | 13,748,330 | | | $ | 13,505,240 | |
| | | | | | | | | | | | |
Liabilities | | | | | | | | | | | | |
Deposits: | | | | | | | | | | | | |
Non-interest bearing | | $ | 1,372,235 | | | $ | 1,372,235 | | | $ | 1,372,235 | |
Interest-bearing | | | 7,893,707 | | | | 7,845,847 | | | | 7,801,457 | |
Total borrowings | | | 3,316,601 | | | | 3,125,948 | | | | 2,971,513 | |
Other liabilities | | | 193,209 | | | | 193,209 | | | | 193,209 | |
| | | | | | | | | | | | |
Total liabilities | | | 12,775,752 | | | | 12,537,239 | | | | 12,338,414 | |
Total economic equity | | | 1,229,072 | | | | 1,211,091 | | | | 1,166,826 | |
| | | | | | | | | | | | |
Total liabilities and equity | | $ | 14,004,824 | | | $ | 13,748,330 | | | $ | 13,505,240 | |
| | | | | | | | | | | | |
Economic equity ratio | | | 9 | % | | | 9 | % | | | 9 | % |
Value at risk | | $ | 0 | | | $ | (17,981 | ) | | $ | (62,246 | ) |
% Value at risk | | | 0 | % | | | -1 | % | | | -5 | %
|
61
|
Table 20 - Net Interest Income Shock Analysis |
| | | | | | | | | | | | |
| | | Base | | | | | | | |
At December 31, 2011 | | Scenario | | | +1% | | | +2% | |
Interest income: | | | | | | | | | | | | |
Short-term investments | | $ | 374 | | | $ | 2,495 | | | $ | 4,686 | |
Investments | | | 86,724 | | | | 90,421 | | | | 93,826 | |
Loans and leases | | | 529,385 | | | | 574,248 | | | | 625,564 | |
| | | | | | | | | | | | |
Total interest income | | | 616,483 | | | | 667,164 | | | | 724,076 | |
| | | | | | | | | | | | |
Interest expense: | | | | | | | | | | | | |
Interest-bearing demand and savings | | | 23,592 | | | | 38,730 | | | | 54,226 | |
Time | | | 43,133 | | | | 48,870 | | | | 55,310 | |
Total borrowings | | | 61,708 | | | | 74,354 | | | | 86,970 | |
| | | | | | | | | | | | |
Total interest expense | | | 128,433 | | | | 161,954 | | | | 196,506 | |
| | | | | | | | | | | | |
Net interest income | | $ | 488,050 | | | $ | 505,210 | | | $ | 527,570 | |
| | | | | | | | | | | | |
Net interest income at risk | | $ | 0 | | | $ | 17,160 | | | $ | 39,520 | |
% Net interest income at risk | | | 0 | % | | | 4 | % | | | 8 | % |
| | | | | | | | | | | | |
| | | Base | | | | | | | |
At December 31, 2010 | | Scenario | | | 1% | | | 2% | |
Interest income: | | | | | | | | | | | | |
Short-term investments | | $ | 265 | | | $ | 1,945 | | | $ | 3,633 | |
Investments | | | 96,233 | | | | 97,415 | | | | 98,535 | |
Loans and leases | | | 533,157 | | | | 572,414 | | | | 618,022 | |
| | | | | | | | | | | | |
Total interest income | | | 629,655 | | | | 671,774 | | | | 720,190 | |
| | | | | | | | | | | | |
Interest expense: | | | | | | | | | | | | |
Interest-bearing demand and savings | | | 16,446 | | | | 35,590 | | | | 55,154 | |
Time | | | 61,794 | | | | 70,161 | | | | 78,527 | |
Total borrowings | | | 87,047 | | | | 100,545 | | | | 114,031 | |
| | | | | | | | | | | | |
Total interest expense | | | 165,287 | | | | 206,296 | | | | 247,712 | |
| | | | | | | | | | | | |
Net interest income | | $ | 464,368 | | | $ | 465,478 | | | $ | 472,478 | |
| | | | | | | | | | | | |
Net interest income at risk | | $ | 0 | | | $ | 1,110 | | | $ | 8,110 | |
% Net interest income at risk | | | 0 | % | | | 0 | % | | | 2 | % |
Derivative Financial Instruments and Hedging Activities
Our interest rate risk management strategy involves hedging the repricing characteristics of certain assets and liabilities so as to mitigate adverse effects on our net interest margin and cash flows from changes in interest rates. While we do not participate in speculative derivatives trading, we consider it prudent to use certain derivative instruments to add stability to our interest income and expense, to modify the duration of specific assets and liabilities, and to manage our exposure to interest rate movements.
Additionally, we execute derivative instruments in the form of interest rate swaps with commercial banking customers to facilitate their respective risk management strategies. Those derivatives are immediately hedged by offsetting derivative contracts, such that we minimize our net risk exposure resulting from such transactions. We do not use credit default swaps in our investment or hedging operations.
For additional information about our derivative financial instruments, refer to“Note 23. Derivative Financial Instruments”and“Note 24. Fair Value Disclosures” to the consolidated financial statements appearing in Part II,Item 8.
62
Vehicle Leasing Residual Value Risk
In an effort to manage the vehicle residual value risk arising from the auto leasing business of Hann and our affiliate bank, Hann and the bank have entered into arrangements with Auto Lenders Liquidation Center, Inc. (“Auto Lenders”) pursuant to which Hann or the bank, as applicable, effectively transferred to Auto Lenders all residual value risk of its respective auto lease portfolio, and all residual value risk on any new leases originated over the term of the applicable agreement. Auto Lenders, which was formed in 1990, is a used-vehicle remarketer with four retail locations in New Jersey and has access to various wholesale facilities throughout the country. Under these arrangements, Auto Lenders agrees to purchase the beneficial interest in all vehicles returned by the obligors at the scheduled expiration of the related leases for a purchase price equal to the stated residual value of such vehicles. Stated residual values of new leases are set in accordance with the standards approved in advance by Auto Lenders. Under a servicing agreement with Auto Lenders, Hann also agrees to make monthly guaranty payments to Auto Lenders based upon a negotiated schedule covering a three-year period. At the end of each year, the servicing agreement may be renewed by the mutual agreement of the parties for an additional one-year term, beyond the current three-year term, subject to renegotiation of the payments for the additional year. During the renewal process, we periodically obtain competitive quotes from third parties to determine the best remarketing and/or residual guarantee alternatives for Hann and our bank subsidiary.
Recently Adopted or Issued Accounting Guidance
For information about the impact that recently adopted or issued accounting guidance will have on our financial statements, refer to “Note 1. Accounting Policies” to the financial statements appearing in Part II,Item 8.
Summary of 2010 Compared to 2009
Results of Operations
Results of operations for the year ended December 31, 2010 include the following pre-tax transactions:
| | • | | a $9.5 million net gain on securities transactions |
Results of operations for the year ended December 31, 2009 include the following pre-tax transactions:
| | • | | a $6.2 million FDIC special assessment; |
| | • | | a $2.9 million consolidation charge; |
| | • | | a $10.7 million net gain on securities transactions; and |
| | • | | a $6.9 million net gain on the sale of our Central Atlantic Merchant Services accounts. |
Net income applicable to common shareholders for the year ended December 31, 2010 was $16.3 million, an increase of $20.3 million when compared to a net loss applicable to common shareholders of $4.0 million in 2009. The provision for loan and lease losses decreased 13.3%, to $163.0 million for 2010, from $188.0 million for 2009. Net interest income increased 4.3%, to $426.5 million for 2010, from $408.8 million in 2009. Noninterest income decreased 7.1% to $152.1 million for 2010, from $163.7 million for 2009, and noninterest expenses for 2010 were $382.7 million, relatively unchanged from 2009 when noninterest expenses were $382.5 million.
63
Additional information is as follows:
| | | | | | | | |
| | | Twelve Months Ended | |
| | | December 31, | |
| | | 2010 | | | 2009 | |
Diluted Earnings per Common Share | | $ | 0.13 | | | $ | (0.05 | ) |
Return on Average Assets | | | 0.23 | % | | | 0.09 | % |
Return on Average Equity | | | 1.53 | % | | | 0.65 | % |
Return on Average Tangible Equity (1) | | | 3.69 | % | | | 2.19 | % |
Efficiency Ratio | | | 64.62 | % | | | 65.28 | % |
Net Interest Margin | | | 3.67 | % | | | 3.58 | % |
The following discussion details the factors that contributed to these results.
| (2) | Supplemental Reporting of Non-GAAP-based Financial Measures |
Return on average tangible equity is a non-GAAP-based financial measure calculated using non-GAAP amounts. The most directly comparable measure is return on average equity, which is calculated using GAAP-based amounts. We calculate return on average tangible equity by excluding the balance of intangible assets and their related amortization expense from our calculation of return on average equity. Management uses the return on average tangible equity in order to review our core operating results. Management believes that this is a better measure of our performance. In addition, this is consistent with the treatment by bank regulatory agencies, which excludes goodwill and other intangible assets from the calculation of risk-based capital ratios. A reconciliation of return on average equity to return on average tangible equity is set forth below.
| | | | | | | | |
| | | 2010 | | | 2009 | |
Return on average equity (GAAP basis) | | | 1.53 | % | | | 0.65 | % |
Effect of excluding average intangible assets and related amortization | | | 2.16 | | | | 1.54 | |
Return on average tangible equity | | | 3.69 | | | | 2.19 | |
Net Interest Income - Taxable Equivalent Basis
Our major source of operating revenues is net interest income, which increased to $426.5 million in 2010, as compared to $408.8 million in 2009. Net interest income as a percentage of net interest income plus other income was 74% for the twelve months ended December 31, 2010, 71% for the twelve months ended December 31, 2009, and 74% for the twelve months ended December 31, 2008.
The $17.7 million increase in our net interest income in 2010, as compared to 2009, primarily was the result of an increase in our net interest margin of nine basis points, from 3.58% to 3.67%. The increase in our margin primarily was caused by a decrease in our time-deposit costs of one hundred four basis points from 3.26% to 2.22%, as a significant portion of those accounts repriced in 2010.
Provision and Allowance for Loan and Lease Losses
Although we continued to experience a challenging operating environment throughout 2010, we saw some signs of stabilization. As a result, we decreased our provision for loan and lease losses in accordance with our assessment process, which took into consideration a $22.7 million decrease in nonaccrual loans and leases since December 31, 2009, as noted in Table 10. The provision for loan and lease losses was $163.0 million for the year ended December 31, 2010 and $188.0 million for the year ended December 31, 2009. The allowance for loan and lease losses at December 31, 2010 was 1.99% of period-end loans and leases, or $191.8 million, and 1.75% of period-end loans and leases, or $172.4 million, at December 31, 2009.
64
Noninterest Income
Noninterest income, as a percentage of net interest income plus noninterest income, was 26%, 29%, and 26% for 2010, 2009, and 2008, respectively.
Noninterest income decreased $11.6 million, or 7.1%, in 2010, as compared to 2009. This net decrease was primarily the result of the following:
| | • | | Decreasedservice charges on deposit accounts of $2.8 million; |
| | • | | Increasedasset management fees of $2.6 million; |
| | • | | Decreasedother commissions and fees of $3.7 million |
| | • | | Increasednet realized gain on securities(excluding other-than-temporary impairment) of $1.6 million; |
| | • | | Increasedother-than-temporary impairment of securities related to credit losses of $2.7 million; and |
| | • | | Decreasedother income of $5.3 million. |
Service charges on deposit accounts. The 7.6% decrease primarily was the result of changes in customers’ behavior regarding overdrafts.
Asset management fees.The 9.9% increase primarily was due to the recovery in the stock market, resulting in higher management fees.
Other commissions and fees.The 13.1% decrease primarily is the result of the elimination of noninterest income relating to interest-only strips as a result of the consolidation of two variable interest entities on January 1, 2010.
Net realized gain on securities.During 2010, we realized net gains of $13.4 million on the sale and call of securities with an aggregate book value of $356.1 million. During 2009, we realized net gains of $11.8 million on the sale of securities with an aggregate book value of $200.8 million.
Other-than-temporary impairment of securities related to credit losses.During 2010, we recognized $3.9 million of other-than-temporary impairment losses related to two synthetic collateralized debt obligations, one non-agency mortgage-backed security, and various financial institution equity securities. During 2009, we recognized $1.1 million of other-than-temporary impairment losses related to the two synthetic collateralized debt obligations.
Other.The 48.8% net decrease primarily was the result of a $6.9 million gain realized on the sale of our Central Atlantic Merchant Services accounts in March 2009, and a $0.9 million one-time contract-signing bonus in 2010.
Noninterest Expenses
Total noninterest expenses for the year ended December 31, 2010 were $382.7 million, relatively unchanged from the year ended December 31, 2009 when total noninterest expenses were $382.5 million. However, certain components within this category increased or decreased as follows:
| | • | | Increasedadvertising and marketing of $3.5 million; |
| | • | | DecreasedFDIC insurance of $7.5 million; and |
| | • | | Increased legal feesof $3.6 million. |
Advertising and marketing. The 39.2% increase primarily was the result of a higher budget for 2010 as compared to 2009.
65
FDIC insurance.The decrease in FDIC insurance expense primarily was the result of a $6.2 million special assessment incurred in May 2009, as determined by the FDIC.
Legal fees.The 70.5% increase in legal fees primarily was the result of credit issues.
Income Taxes
Our effective tax rates for 2010 and 2009 were 3.5% and (520.6%), respectively.
The increase in our rate in 2010 was due to the significant increase in pretax book income in 2010 relative to 2009. With the exception of pretax book income, items impacting the effective rate in 2010, including tax-advantaged investment and loan income, were comparable to 2009.
Financial Condition
Total assets at December 31, 2010, were $14.0 billion, an increase of 1.9% when compared to total assets of $13.7 billion at December 31, 2009. Loans and leases, decreased to $9.6 billion at December 31, 2010, from $9.8 billion at December 31, 2009. Total deposits increased to $9.2 billion at December 31, 2010, from $9.0 billion at December 31, 2009.
Equity capital at December 31, 2010 was $2.0 billion, relatively unchanged from December 31, 2009 when equity capital was also $2.0 billion. The components of shareholders’ equity, however, changed due to the issuance of 43.1million common shares in March 2010 and the redemption of the $300.0 million of preferred stock held by the U. S. Treasury also in 2010. As a result, book value per common share was $15.27 at December 31, 2010 and $19.53 at December 31, 2009.
Fair Value Measurements and The Fair Value Option for Financial Assets and Financial Liabilities
At December 31, 2010, Susquehanna had made no elections to use fair value as an alternative measurement for selected financial assets and financial liabilities not previously carried at fair value. In addition, non-financial assets and non-financial liabilities have not been measured at fair value because we have made the determination that the impact on our financial statements would be minimal.
Investment Securities
Available-for-sale securities increased $542.6 million at December 31, 2010, compared to December 31, 2009. As a result of the decrease in total loan balances and the increase in total deposit balances, we used the excess funds to purchase available-for-sale securities.
At December 31, 2010, we held no securities of any one issuer (other than securities of U.S. Government agencies and corporations, which, by regulation, may be excluded from this disclosure) where the aggregate book value exceeded 10% of shareholders’ equity.
Loans and Leases
As a result of the adoption of new accounting guidance relating to variable interest entities, we, as the primary beneficiary of two securitization trusts, were required to consolidate the trusts as of January 1, 2010. At December 31, 2010, the aggregate balance of the loans held by the trusts that can be used only to settle obligations of the trusts was $215.4 million. In addition, during the first quarter of 2010, we concluded that, due to recent changes in accounting guidance and market conditions, it was highly unlikely that the home equity line of credit loans held for sale would be sold and securitized. Therefore, on March 31, 2010, we transferred $434.9 million of home equity line of credit loans held for sale to held for investment.
66
Throughout 2010, the difficulties and uncertainty within the economy continued to affect demand for loans among credit-worthy borrowers. Many businesses in our markets have been proceeding cautiously and have learned to do more with less. As a result, loans and leases, net of unearned income and excluding the loans of the securitization trusts discussed above, decreased 4.2%, from $9.8 billion at December 31, 2009, to $9.4 billion at December 31, 2010. Commercial, financial, and agricultural loans declined by $233.6 million (including charge-offs of $22.6 million), while real estate construction loans, which we consider to be higher-risk loans, declined by $237.5 million (including charge-offs of $65.7 million). This 21.3% decrease in real estate construction loans was primarily due to our continuing plan to decrease that portfolio, thereby reducing our exposure in a segment that has been particularly stressed during this recession. Consumer loans, however, increased by $120.8 million since December 31, 2009, and loans secured by residential real estate (excluding the loans of the securitizations trusts) also increased, by $81.9 million, during the same period.
Risk Assets
Nonaccrual loans and leases decreased from $219.6 million at December 31, 2009, to $196.9 million at December 31, 2010. The net decrease was primarily the result of the resolution of many real estate – construction credits during 2010. As a result, total nonperforming assets as a percentage of period-end loans and leases plus foreclosed real estate decreased from 2.48% at December 31, 2009 to 2.23% at December 31, 2010.
Real Estate - Construction
At December 31, 2010, real estate – construction loans comprised only 9.1% of our total loan and lease portfolio but accounted for 29.3% of total nonaccrual loans and leases, 26.2% of our allowance for loan and lease losses; and for the year ended December 31, 2010, this loan type accounted for 40.9% of total net charge-offs . As a result, we consider these real-estate construction loans to be higher-risk loans. To mitigate the risk of continued significant losses with regard to this portfolio, we have tightened the advance ratios for raw land, from 65% to 60% of appraised value or cost, whichever is less; for land approved/unimproved, from 70% to 65%; for land approved/improved, from 75% to 70%; and for construction of houses, apartments, or commercial buildings, from 75% to 70%.
Troubled Debt Restructurings (“TDRs”)
Troubled debt restructurings have increased significantly from $58.2 million at December 31, 2009 to $114.6 million at December 31, 2010. We consider all restructured loans to be impaired. None of our TDRs have required additional charge-offs subsequent to the restructuring during the years ended December 31, 2010 and 2009.
Impaired Loans
Of the $246.9 million of impaired loans (nonaccrual, non-consumer relationships greater than $0.5 million plus accruing restructured loans) at December 31, 2010, $112.7 million, or 45.7%, had no related reserve. The determination that no related reserve for these collateral-dependent loans was required was based on the net realizable value of the underlying collateral.
Potential Problem Loans
Loans with principal and/or interest delinquent ninety days or more and still accruing interest totaled $20.6 million at December 31, 2010, an increase of $5.8 million, from $14.8 million at December 31, 2009. Continued difficulties in the economy may adversely affect certain other borrowers and may cause additional loans to become past due beyond ninety days or to be placed on non-accrual status because of the uncertainty of receiving full payment of either principal or interest on these loans.
67
Goodwill and Other Identifiable Intangible Assets
We performed our annual goodwill impairment tests in the second quarter of 2010, and determined that the fair value of each of our reporting units exceeded its book value, and there was no goodwill impairment. However, at December 31, 2010, having taken into consideration current market conditions, we decided that it would be prudent to perform interim goodwill impairment tests for our bank reporting unit and our wealth management reporting unit.
Based upon our analyses at December 31, 2010, the fair value of the bank reporting unit exceeded its carrying value by 10.4%, and the fair value of the wealth management reporting unit exceeded its carrying value by 55.7%. We will continue to monitor and evaluate the carrying value of goodwill for possible future impairment as conditions warrant.
Deposits
Total deposits increased $216.8 million, or 2.4%, from December 31, 2009 to December 31, 2010. Time deposits decreased 8.2% while our core deposits, which consist of noninterest-bearing demand deposits, interest-bearing demand deposits, and savings deposits increased 9.9%. These changes, in part, reflect the results of our continuing strategy to improve our mix of deposits by allowing high-cost, single-service certificates of deposit to run off.
We do not rely upon time deposits of $0.1 million or more as a principal source of funds, as they represent 13.4% of total deposits. Table 16 presents a breakdown by maturity of time deposits of $0.1 million or more as of December 31, 2010.
Borrowings
Long-term Federal Home Loan Bank (“FHLB”) Borrowings
Long-term FHLB borrowings decreased $122.2 from December 31, 2009 to December 31, 2010 as a result of the repayment of maturing loans.
11% Junior Subordinated Deferrable Interest Debentures, Series II
On March 16, 2010, Susquehanna Capital II, a Delaware statutory trust, sold to the public $50.0 million aggregate principal amount of 11% Cumulative Trust Preferred Securities, Series II and used the proceeds from those sales to fund its purchase of $50.0 million of 11% Junior Subordinated Deferrable Interest Debentures, Series II issued by Susquehanna. The subordinated debentures are unsecured and rank equally in right of payment with our existing series of junior subordinated debt securities. Interest on the subordinated debentures is payable semi-annually in arrears on each March 23 and September 23, beginning September 23, 2010, unless we defer payment. We may elect to redeem any or all of the subordinated debentures at any time on or after March 23, 2015. The maturity date of the subordinated debentures is March 23, 2040.
Capital Adequacy
We and the bank had leverage and risk-weighted ratios well in excess of regulatory minimums, and each entity was considered “well capitalized” under regulatory guidelines.
Item 7A. Quantitative and Qualitative Disclosures About Market Risk
The discussion concerning the effects of liquidity risk and interest rate risk on us is set forth under “Management’s Discussion and Analysis of Financial Condition and Results of Operations – Market Risks” in Item 7 hereof under the section entitled “Market Risk.”
68
Item 8. Financial Statements and Supplementary Data
The following consolidated financial statements of Susquehanna are submitted herewith:
| | | | |
| | | Page | |
Reference | | | | |
Consolidated Balance Sheets at December 31, 2010 and 2009 | | | 68 | |
Consolidated Statements of Income for the years ended December 31, 2010, 2009, and 2008 | | | 69 | |
Consolidated Statements of Cash Flows for the years ended December 31, 2010, 2009, and 2008 | | | 70 | |
Consolidated Statements of Changes in Shareholders’ Equity for the years ended December 31, 2010, 2009, and 2008 | | | 72 | |
Notes to Consolidated Financial Statements | | | 73 | |
Management’s Responsibility for Financial Statements and Report on Internal Control over Financial Reporting | | | 127 | |
Report of Independent Registered Public Accounting Firm | | | 128 | |
69
SUSQUEHANNA BANCSHARES, INC. AND SUBSIDIARIES
Consolidated Balance Sheets
| | | | | | | | |
Years ended December 31, | | 2011 | | | 2010 | |
| | | (in thousands, except share data) | |
Assets | | | | | | | | |
Cash and due from banks | | $ | 276,384 | | | $ | 200,646 | |
Unrestricted short-term investments | | | 55,761 | | | | 52,252 | |
| | | | | | | | |
Cash and cash equivalents | | | 332,145 | | | | 252,898 | |
Interest-bearing deposits held by consolidated variable interest entities that can be used only to settle obligations of the consolidated variable interest entities | | | 5,015 | | | | 7,260 | |
Restricted short-term investments | | | 60,910 | | | | 34,435 | |
Securities available for sale | | | 2,423,107 | | | | 2,408,943 | |
Securities held to maturity | | | 8,408 | | | | 8,668 | |
Loans and leases, net of unearned income | | | 10,257,161 | | | | 9,417,801 | |
Loans held by consolidated variable interest entities that can be used only to settle obligations of the consolidated variable interest entities | | | 190,769 | | | | 215,396 | |
Less: Allowance for loan and lease losses | | | 188,100 | | | | 191,834 | |
| | | | | | | | |
Net loans and leases | | | 10,259,830 | | | | 9,441,363 | |
| | | | | | | | |
Premises and equipment, net | | | 168,382 | | | | 165,557 | |
Other real estate and foreclosed assets | | | 41,716 | | | | 19,962 | |
Accrued income receivable | | | 36,820 | | | | 36,121 | |
Bank-owned life insurance | | | 405,296 | | | | 359,579 | |
Goodwill | | | 1,018,031 | | | | 1,018,031 | |
Intangible assets with finite lives | | | 29,081 | | | | 34,076 | |
Other assets | | | 186,048 | | | | 167,192 | |
| | | | | | | | |
Total Assets | | $ | 14,974,789 | | | $ | 13,954,085 | |
| | | | | | | | |
Liabilities and Shareholders’ Equity | | | | | | | | |
Deposits: | | | | | | | | |
Noninterest-bearing | | $ | 1,569,811 | | | $ | 1,372,235 | |
Interest-bearing | | | 8,720,661 | | | | 7,818,972 | |
| | | | | | | | |
Total deposits | | | 10,290,472 | | | | 9,191,207 | |
Federal Home Loan Bank short-term borrowings | | | 900,000 | | | | 300,000 | |
Other short-term borrowings | | | 613,306 | | | | 770,623 | |
Federal Home Loan Bank long-term borrowings | | | 71,020 | | | | 801,620 | |
Other long-term debt | | | 250,474 | | | | 176,038 | |
Junior subordinated debentures | | | 248,873 | | | | 322,880 | |
Long-term debt of consolidated variable interest entities for which creditors do not have recourse to Susquehanna's general credit | | | 157,379 | | | | 207,036 | |
Accrued interest, taxes, and expenses payable | | | 50,670 | | | | 46,449 | |
Deferred taxes | | | 25,827 | | | | 33,729 | |
Other liabilities | | | 177,140 | | | | 119,701 | |
| | | | | | | | |
Total Liabilities | | | 12,785,161 | | | | 11,969,283 | |
| | | | | | | | |
Commitments and contingencies (Notes 14 and 15) | | | | | | | | |
Shareholders' equity: | | | | | | | | |
Common stock, $2.00 par value, 400,000,000 shares authorized; Issued: | | | | | | | | |
157,067,887 at December 31, 2011and 129,965,635 at December 31, 2010 | | | 314,136 | | | | 259,931 | |
Treasury stock, at cost.200,748 at December 31, 2011and 0 at | | | | | | | | |
December 31, 2010 | | | (1,263 | ) | | | 0 | |
Additional paid-in capital | | | 1,397,152 | | | | 1,301,042 | |
Retained earnings | | | 525,657 | | | | 481,964 | |
Accumulated other comprehensive loss, net of taxes of$25,863and $32,526 | | | (46,054 | ) | | | (58,135 | ) |
| | | | | | | | |
Total Shareholders’ Equity | | | 2,189,628 | | | | 1,984,802 | |
| | | | | | | | |
Total Liabilities and Shareholders’ Equity | | $ | 14,974,789 | | | $ | 13,954,085 | |
| | | | | | | | |
The accompanying notes are an integral part of these consolidated financial statements.
70
SUSQUEHANNA BANCSHARES, INC. AND SUBSIDIARIES
Consolidated Statements of Income
| | | | | | | | | | | | |
Years ended December 31, | | 2011 | | | 2010 | | | 2009 | |
| | | (in thousands, except per share data) | |
Interest Income: | | | | | | | | | | | | |
Loans and leases, including fees | | $ | 516,984 | | | $ | 538,699 | | | $ | 554,043 | |
Securities: | | | | | | | | | | | | |
Taxable | | | 57,846 | | | | 55,835 | | | | 70,319 | |
Tax-exempt | | | 15,831 | | | | 14,997 | | | | 14,940 | |
Dividends | | | 3,999 | | | | 3,982 | | | | 3,925 | |
Short-term investments | | | 108 | | | | 182 | | | | 597 | |
| | | | | | | | | | | | |
Total interest income | | | 594,768 | | | | 613,695 | | | | 643,824 | |
| | | | | | | | | | | | |
Interest Expense: | | | | | | | | | | | | |
Deposits: | | | | | | | | | | | | |
Interest-bearing demand and savings | | | 22,492 | | | | 23,452 | | | | 23,814 | |
Time | | | 54,286 | | | | 80,511 | | | | 136,481 | |
Federal Home Loan Bank short-term borrowings | | | 11,376 | | | | 3,101 | | | | 6 | |
Other short-term borrowings | | | 8,133 | | | | 4,156 | | | | 4,267 | |
Federal Home Loan Bank long-term borrowings | | | 30,648 | | | | 40,451 | | | | 40,113 | |
Other long-term debt | | | 34,683 | | | | 35,518 | | | | 30,327 | |
| | | | | | | | | | | | |
Total interest expense | | | 161,618 | | | | 187,189 | | | | 235,008 | |
| | | | | | | | | | | | |
Net interest income | | | 433,150 | | | | 426,506 | | | | 408,816 | |
Provision for loan and lease losses | | | 110,000 | | | | 163,000 | | | | 188,000 | |
| | | | | | | | | | | | |
Net interest income, after provision for loan and lease losses | | | 323,150 | | | | 263,506 | | | | 220,816 | |
| | | | | | | | | | | | |
Noninterest Income: | | | | | | | | | | | | |
Service charges on deposit accounts | | | 31,728 | | | | 34,467 | | | | 37,288 | |
Vehicle origination and servicing fees | | | 7,862 | | | | 6,826 | | | | 6,500 | |
Asset management fees | | | 28,153 | | | | 28,362 | | | | 25,797 | |
Income from fiduciary-related activities | | | 7,333 | | | | 7,259 | | | | 7,156 | |
Commissions on brokerage, life insurance, and annuity sales | | | 8,202 | | | | 7,567 | | | | 8,132 | |
Commissions on property and casualty insurance sales | | | 14,047 | | | | 12,030 | | | | 12,555 | |
Other commissions and fees | | | 23,728 | | | | 24,661 | | | | 28,370 | |
Income from bank-owned life insurance | | | 4,931 | | | | 4,965 | | | | 5,428 | |
Net gain on sale of loans and leases | | | 12,747 | | | | 10,918 | | | | 10,923 | |
Net realized gain on acquisition | | | 39,143 | | | | 0 | | | | 0 | |
Net realized gain on sales of securities | | | 3,878 | | | | 13,408 | | | | 11,802 | |
Total other-than-temporary impairment, net of recoveries | | | (6,392 | ) | | | (4,843 | ) | | | (1,149 | ) |
Portion of loss recognized in other comprehensive income (before taxes) | | | 3,028 | | | | 952 | | | | 0 | |
| | | | | | | | | | | | |
Net impairment losses recognized in earnings | | | (3,364 | ) | | | (3,891 | ) | | | (1,149 | ) |
Other | | | 4,280 | | | | 5,576 | | | | 10,897 | |
| | | | | | | | | | | | |
Total noninterest income | | | 182,668 | | | | 152,148 | | | | 163,699 | |
| | | | | | | | | | | | |
Noninterest Expenses: | | | | | | | | | | | | |
Salaries and employee benefits | | | 209,235 | | | | 191,806 | | | | 191,628 | |
Occupancy | | | 37,446 | | | | 35,997 | | | | 35,292 | |
Furniture and equipment | | | 12,596 | | | | 13,647 | | | | 14,669 | |
Advertising and marketing | | | 11,470 | | | | 12,606 | | | | 9,058 | |
FDIC insurance | | | 16,602 | | | | 16,763 | | | | 24,214 | |
Legal fees | | | 9,302 | | | | 8,786 | | | | 5,154 | |
Amortization of intangible assets | | | 8,705 | | | | 9,438 | | | | 10,531 | |
Vehicle lease disposal | | | 10,584 | | | | 14,543 | | | | 13,917 | |
Merger related | | | 14,991 | | | | 0 | | | | 0 | |
Loss on extinguishment of debt | | | 50,020 | | | | 0 | | | | 0 | |
Other | | | 79,229 | | | | 79,064 | | | | 78,009 | |
| | | | | | | | | | | | |
Total noninterest expenses | | | 460,180 | | | | 382,650 | | | | 382,472 | |
| | | | | | | | | | | | |
Income before income taxes | | | 45,638 | | | | 33,004 | | | | 2,043 | |
Provision for (benefit from) income taxes | | | (9,267 | ) | | | 1,157 | | | | (10,632 | ) |
| | | | | | | | | | | | |
Net Income | | | 54,905 | | | | 31,847 | | | | 12,675 | |
Preferred stock dividends and accretion | | | — | | | | 15,572 | | | | 16,659 | |
| | | | | | | | | | | | |
Net Income (Loss) Applicable to Common Shareholders | | $ | 54,905 | | | $ | 16,275 | | | $ | (3,984 | ) |
| | | | | | | | | | | | |
Earnings per common share: | | | | | | | | | | | | |
Basic | | $ | 0.40 | | | $ | 0.13 | | | $ | (0.05 | ) |
Diluted | | $ | 0.40 | | | $ | 0.13 | | | $ | (0.05 | ) |
Cash dividends per common share | | $ | 0.08 | | | $ | 0.04 | | | $ | 0.37 | |
Average common shares outstanding: | | | | | | | | | | | | |
Basic | | | 136,509 | | | | 121,031 | | | | 86,257 | |
Diluted | | | 136,876 | | | | 121,069 | | | | 86,257 | |
71
The accompanying notes are an integral part of these consolidated financial statements.
72
SUSQUEHANNA BANCSHARES, INC. AND SUBSIDIARIES
Consolidated Statements of Cash Flows
| | | | | | | | | | | | |
Years ended December 31, | | 2011 | | | 2010 | | | 2009 | |
| | | | | | (in thousands) | | | | |
Cash Flows from Operating Activities: | | | | | | | | | | | | |
Net income | | $ | 54,905 | | | $ | 31,847 | | | $ | 12,675 | |
Adjustments to reconcile net income to net cash provided by operating activities: | | | | | | | | | | | | |
Depreciation, amortization, and accretion | | | 37,388 | | | | 30,856 | | | | 23,632 | |
Provision for loan and lease losses | | | 110,000 | | | | 163,000 | | | | 188,000 | |
Realized gain on available-for-sale securities, net | | | (514 | ) | | | (9,517 | ) | | | (10,653 | ) |
Deferred income taxes | | | (14,639 | ) | | | (28,691 | ) | | | (35,044 | ) |
Gain on sale of loans and leases | | | (12,747 | ) | | | (10,918 | ) | | | (10,923 | ) |
Loss (gain) on sale of foreclosed assets | | | (1,105 | ) | | | 1,216 | | | | (146 | ) |
Gain on sale of branch | | | 0 | | | | 0 | | | | (402 | ) |
Gain on acquisition | | | (39,143 | ) | | | 0 | | | | 0 | |
Mortgage loans originated for sale | | | (335,248 | ) | | | (389,519 | ) | | | (351,600 | ) |
Proceeds from sale of mortgage loans originated for sale | | | 326,136 | | | | 396,161 | | | | 355,627 | |
Loans and leases originated/acquired for sale, net of payments received | | | 0 | | | | 0 | | | | (187,884 | ) |
Payments received on loans and leases transferred from held for sale to held for investment, net of advances on home equity lines of credit | | | 14,861 | | | | 155,926 | | | | 96,682 | |
Increase in cash surrender value of bank-owned life insurance | | | (3,591 | ) | | | (4,206 | ) | | | (4,700 | ) |
Contribution to defined benefit pension plan | | | 0 | | | | 0 | | | | (20,000 | ) |
Decrease in accrued interest receivable | | | 2,880 | | | | 672 | | | | 4,359 | |
Increase (decrease) in accrued interest payable | | | (9,192 | ) | | | 1,576 | | | | (9,924 | ) |
(Decrease) increase in accrued expenses and taxes payable | | | (6,572 | ) | | | (2,851 | ) | | | 2,486 | |
Other, net | | | 26,513 | | | | 17,466 | | | | 1,520 | |
| | | | | | | | | | | | |
Net cash provided by operating activities | | | 149,932 | | | | 353,018 | | | | 53,705 | |
| | | | | | | | | | | | |
Cash Flows from Investing Activities: | | | | | | | | | | | | |
Net (increase) decrease in restricted short-term investments | | | (12,332 | ) | | | (34,004 | ) | | | 60 | |
Activity in available-for-sale securities: | | | | | | | | | | | | |
Sales | | | 339,312 | | | | 350,655 | | | | 212,633 | |
Maturities, repayments, and calls | | | 686,923 | | | | 813,319 | | | | 431,639 | |
Purchases | | | (671,982 | ) | | | (1,716,081 | ) | | | (538,630 | ) |
Net decrease (increase) in loans and leases | | | (334,429 | ) | | | 118,783 | | | | (213,885 | ) |
Cash flows received from retained interests | | | 0 | | | | 0 | | | | 20,234 | |
Purchase of bank-owned life insurance | | | (5,161 | ) | | | (10,947 | ) | | | 0 | |
Proceeds from bank-owned life insurance | | | 7,088 | | | | 10,947 | | | | 3,098 | |
Proceeds from sale of foreclosed assets | | | 32,405 | | | | 33,709 | | | | 21,215 | |
Acquisitions, net of subsequent divestitures | | | 99,250 | | | | 0 | | | | 0 | |
Additions to premises and equipment, net | | | (9,400 | ) | | | (15,233 | ) | | | (7,183 | ) |
| | | | | | | | | | | | |
Net cash provided by (used in) investing activities | | | 131,674 | | | | (448,852 | ) | | | (70,819 | ) |
| | | | | | | | | | | | |
Cash Flows from Financing Activities: | | | | | | | | | | | | |
Net increase (decrease) in deposits | | | 241,934 | | | | 216,844 | | | | (78,318 | ) |
Sale of branch deposits | | | 0 | | | | 0 | | | | (13,410 | ) |
Net (decrease) increase in other short-term borrowings | | | (179,521 | ) | | | (270,080 | ) | | | 130,484 | |
Net increase (decrease) in short-term FHLB borrowings | | | 600,000 | | | | 200,000 | | | | 100,000 | |
Proceeds from long-term FHLB borrowings | | | 5,000 | | | | 150,000 | | | | 0 | |
Repayment of long-term FHLB borrowings | | | (809,362 | ) | | | (270,192 | ) | | | (143,924 | ) |
Proceeds from issuance of long-term debt | | | — | | | | 47,749 | | | | 0 | |
Repayment of long-term debt | | | (49,665 | ) | | | (32,912 | ) | | | (234 | ) |
Proceeds from issuance of preferred stock | | | 0 | | | | 0 | | | | 0 | |
73
SUSQUEHANNA BANCSHARES, INC. AND SUBSIDIARIES
Consolidated Statements of Cash Flows (continued)
| | | | | | | | | | | | |
Years ended December 31, | | 2011 | | | 2010 | | | 2009 | |
| | | | | | (in thousands) | | | | |
Proceeds from issuance of common stock | | | 6,596 | | | | 330,721 | | | | 2,648 | |
Redemption of preferred stock | | | 0 | | | | (300,000 | ) | | | 0 | |
Purchase of treasury stock | | | (860 | ) | | | 0 | | | | 0 | |
Redemption of warrant | | | (5,269 | ) | | | 0 | | | | 0 | |
Cash dividends paid | | | (11,212 | ) | | | (14,604 | ) | |
| (45,773
| )
|
| | | | | | | | | | | | |
Net cash provided by (used in) financing activities | | | (202,359 | ) | | | 57,526 | | | | (48,527 | ) |
| | | | | | | | | | | | |
Net change in cash and cash equivalents | | | 79,247 | | | | (38,308 | ) | | | (65,641 | ) |
Cash and cash equivalents at January 1 | | | 252,898 | | | | 291,206 | | | | 356,847 | |
| | | | | | | | | | | | |
Cash and cash equivalents at December 31 | | $ | 332,145 | | | $ | 252,898 | | | $ | 291,206 | |
| | | | | | | | | | | | |
Supplemental Disclosure of Cash Flow Information | | | | | | | | | | | | |
Cash paid for interest on deposits and borrowings | | $ | 170,810 | | | $ | 185,576 | | | $ | 244,933 | |
Income tax payments | | | 1,371 | | | | 40,004 | | | | 1,241 | |
Supplemental Schedule of Noncash Activities | | | | | | | | | | | | |
Interest-bearing deposits held by consolidated variable interest entities that can be used only to settle obligations of the consolidated variable interest entities at January 1, 2010 | | $ | 0 | | | $ | 7,537 | | | $ | 0 | |
Loans held by consolidated variable interest entities that can be used only to settle obligations of the consolidated variable interest entities at January 1, 2010 | | | 0 | | | | 248,333 | | | | 0 | |
Real estate acquired in settlement of loans | | | 62,327 | | | | 29,895 | | | | 41,672 | |
Long-term debt of consolidated variable interest entities for which creditors do not have recourse to Susquehanna’s general credit at January 1, 2010 | | | 0 | | | | 239,936 | | | | 0 | |
Accretion of preferred stock discount | | | 0 | | | | 7,641 | | | | 1,659 | |
Home equity line of credit loans transferred from held for sale to held for investment | | | 0 | | | | 434,897 | | | | 0 | |
Leases acquired in clean-up calls | | | 0 | | | | 0 | | | | 25,852 | |
Cumulative-effect adjustment to retained earnings relating to the consolidation of variable interest entities | | | 0 | | | | (5,805 | ) | | | 0 | |
Adjustment to accumulated other comprehensive income relating to the consolidation of variable interest entities | | | 0 | | | | (6,922 | ) | | | 0 | |
The accompanying notes are an integral part of these consolidated financial statements.
74
SUSQUEHANNA BANCSHARES, INC. AND SUBSIDIARIES
Consolidated Statements of Changes in Shareholders’ Equity
| | | | | | | | | | | | | | | | | | | | | | | | | | | | | | | | |
| | | | | | | | | | | | | | | | | | | | | Accumulated | | | | |
| | | | | | Shares of | | | | | | | | | Additional | | | | | | Other | | | | |
| | | Preferred | | | Common | | | Common | | | Treasury | | | Paid-in | | | Retained | | | Comprehensive | | | | |
Years Ended December 31, 2011, 2010, and 2009 | | Stock | | | Stock | | | Stock | | | Stock | | | Capital | | | Earnings | | | Income (Loss) | | | Total | |
| | | (in thousands, except share data) | |
Balance, January 1, 2009 | | $ | 290,700 | | | | 86,174,285 | | | $ | 172,349 | | | $ | 0 | | | $ | 1,055,255 | | | $ | 512,924 | | | $ | (85,310 | ) | | $ | 1,945,918 | |
| | | | | | | | | | | | | | | | | | | | | | | | | | | | | | | | |
Comprehensive income: | | | | | | | | | | | | | | | | | | | | | | | | | | | | | | | | |
Net income | | | | | | | | | | | | | | | | | | | | | | | 12,675 | | | | | | | | 12,675 | |
Change in unrealized gain on securities available for sale, net of taxes and reclassification adjustment of $37,704 | | | | | | | | | | | | | | | | | | | | | | | | | | | 57,162 | | | | 57,162 | |
Change in unrealized gain on recorded interests in securitized assets, net of taxes of $1,354 | | | | | | | | | | | | | | | | | | | | | | | | | | | 2,515 | | | | 2,515 | |
Change in unrealized gain on cash flow hedges, net of taxes of $821 | | | | | | | | | | | | | | | | | | | | | | | | | | | 4,925 | | | | 4,925 | |
Adjustment to postretirement benefit obligations, net of taxes $2,758 | | | | | | | | | | | | | | | | | | | | | | | | | | | 1,011 | | | | 1,011 | |
| | | | | | | | | | | | | | | | | | | | | | | | | | | | | | | | |
Total comprehensive income | | | | | | | | | | | | | | | | | | | | | | | | | | | | | | | 78,288 | |
| | | | | | | | | | | | | | | | | | | | | | | | | | | | | | | | |
Accretion of discount on preferred stock | | | 1,659 | | | | | | | | | | | | | | | | | | | | (1,659 | ) | | | | | | | 0 | |
Issurance of common stock and share-based awards under employee benefit plans | | | | | | | 299,327 | | | | 598 | | | | | | | | 2,050 | | | | | | | | | | | | 2,648 | |
Cash dividends paid on preferred stock | | | | | | | | | | | | | | | | | | | | | | | (13,875 | ) | | | | | | | (13,875 | ) |
Cash dividends declared ($0.37 per share) | | | | | | | | | | | | | | | | | | | | | | | (31,898 | ) | | | | | | | (31,898 | ) |
| | | | | | | | | | | | | | | | | | | | | | | | | | | | | | | | |
Balance, December 31, 2009 | | | 292,359 | | | | 86,473,612 | | | | 172,947 | | | | 0 | | | | 1,057,305 | | | | 478,167 | | | | (19,697 | ) | | | 1,981,081 | |
| | | | | | | | | | | | | | | | | | | | | | | | | | | | | | | | |
Cumulative-effect adjustment resulting from the consolidation of variable interest entities | | | | | | | | | | | | | | | | | | | | | | | (5,805 | ) | | | (6,922 | ) | | | (12,727 | ) |
| | | | | | | | | | | | | | | | | | | | | | | | | | | | | | | | |
Comprehensive income: | | | | | | | | | | | | | | | | | | | | | | | | | | | | | | | | |
Net income | | | | | | | | | | | | | | | | | | | | | | | 31,847 | | | | | | | | 31,847 | |
Change in unrealized gain on securities available for sale, net of taxes and reclassification adjustment of $9,566 | | | | | | | | | | | | | | | | | | | | | | | | | | | (5,854 | ) | | | (5,854 | ) |
Non-credit related unrealized loss on other-than-temporarily impaired debt securities, net of taxes of $349 | | | | | | | | | | | | | | | | | | | | | | | | | | | (603 | ) | | | (603 | ) |
Change in unrealized loss on cash flow hedges, net of taxes of $12,396 | | | | | | | | | | | | | | | | | | | | | | | | | | | (23,447 | ) | | | (23,447 | ) |
Adjustment to postretirement benefit obligations, net of taxes $3,416 | | | | | | | | | | | | | | | | | | | | | | | | | | | (1,612 | ) | | | (1,612 | ) |
| | | | | | | | | | | | | | | | | | | | | | | | | | | | | | | | |
Total comprehensive income | | | | | | | | | | | | | | | | | | | | | | | | | | | | | | | 331 | |
| | | | | | | | | | | | | | | | | | | | | | | | | | | | | | | | |
Issuance of common stock | | | | | | | 43,125,000 | | | | 86,250 | | | | | | | | 241,090 | | | | | | | | | | | | 327,340 | |
Redemption of preferred stock | | | (300,000 | ) | | | | | | | | | | | | | | | | | | | | | | | | | | | (300,000 | ) |
Accretion of discount on preferred stock | | | 7,641 | | | | | | | | | | | | | | | | | | | | (7,641 | ) | | | | | | | 0 | |
Issurance of common stock and share-based awards under employee benefit plans | | | | | | | 367,023 | | | | 734 | | | | | | | | 2,647 | | | | | | | | | | | | 3,381 | |
Cash dividends paid on preferred stock | | | | | | | | | | | | | | | | | | | | | | | (9,847 | ) | | | | | | | (9,847 | ) |
Cash dividends declared ($0.04 per share) | | | | | | | | | | | | | | | | | | | | | | | (4,757 | ) | | | | | | | (4,757 | ) |
| | | | | | | | | | | | | | | | | | | | | | | | | | | | | | | | |
Balance, December 31, 2010 | | | 0 | | | | 129,965,635 | | | | 259,931 | | | | 0 | | | | 1,301,042 | | | | 481,964 | | | | (58,135 | ) | | | 1,984,802 | |
| | | | | | | | | | | | | | | | | | | | | | | | | | | | | | | | |
Comprehensive income: | | | | | | | | | | | | | | | | | | | | | | | | | | | | | | | | |
Net income | | | | | | | | | | | | | | | | | | | | | | | 54,905 | | | | | | | | 54,905 | |
Change in unrealized gain on securities available for sale, net of taxes and reclassification adjustment of $326 | | | | | | | | | | | | | | | | | | | | | | | | | | | 35,862 | | | | 35,862 | |
Non-credit related unrealized loss on other-than-temporarily impaired debt securities, net of taxes of $1,110 | | | | | | | | | | | | | | | | | | | | | | | | | | | (1,918 | ) | | | (1,918 | ) |
Change in unrealized loss on cash flow hedges, net of taxes of $8,254 | | | | | | | | | | | | | | | | | | | | | | | | | | | (14,267 | ) | | | (14,267 | ) |
Adjustment to postretirement benefit obligations, net of taxes $4,090 | | | | | | | | | | | | | | | | | | | | | | | | | | | (7,596 | ) | | | (7,596 | ) |
| | | | | | | | | | | | | | | | | | | | | | | | | | | | | | | | |
Total comprehensive income | | | | | | | | | | | | | | | | | | | | | | | | | | | | | | | 66,986 | |
| | | | | | | | | | | | | | | | | | | | | | | | | | | | | | | | |
Treasury stock purchased | | | | | | | | | | | | | | | (860 | ) | | | | | | | | | | | | | | | (860 | ) |
Redemption of warrant | | | | | | | | | | | | | | | | | | | (5,269 | ) | | | | | | | | | | | (5,269 | ) |
Issuance of common stock in Abington Bancorp, Inc. acquisition | | | | | | | 26,723,143 | | | | 53,446 | | | | (403 | ) | | | 97,770 | | | | | | | | | | | | 150,813 | |
Issurance of common stock and share-based awards under employee benefit plans | | | | | | | 379,109 | | | | 759 | | | | | | | | 3,609 | | | | | | | | | | | | 4,368 | |
Cash dividends declared ($0.08 per share) | | | | | | | | | | | | | | | | | | | | | | | (11,212 | ) | | | | | | | (11,212 | ) |
| | | | | | | | | | | | | | | | | | | | | | | | | | | | | | | | |
Balance, December 31, 2011 | | $ | 0 | | | | 157,067,887 | | | $ | 314,136 | | | ($ | 1,263 | ) | | $ | 1,397,152 | | | $ | 525,657 | | | $ | (46,054 | ) | | $ | 2,189,628 | |
| | | | | | | | | | | | | | | | | | | | | | | | | | | | | | | | |
75
The accompanying notes are an integral part of these consolidated financial statements.
76
Notes to Consolidated Financial Statements
Years Ended December 31, 2011, 2010, and 2009
(Amounts in thousands, except as noted and per share data)
1. Summary of Significant Accounting Policies
The accounting and reporting policies of Susquehanna Bancshares, Inc. and subsidiaries (collectively “Susquehanna”) conform to accounting principles generally accepted in the United States of America (U.S. GAAP) and to general practices in the banking industry. The more significant policies follow:
Principles of Consolidation. The accompanying consolidated financial statements include the accounts of the parent company and its wholly owned subsidiaries: Boston Service Company, Inc. (t/a Hann Financial Service Corporation) (“Hann”), Susquehanna Bank and subsidiaries, Valley Forge Asset Management Corp. and subsidiary (“VFAM”), The Addis Group, LLC (“Addis”), Stratton Management Company and subsidiary (“Stratton”), and two variable interest entities where Susquehanna is the primary beneficiary (first consolidated in 2010) as of and for the years ended December 31, 2011, 2010, and 2009. All significant intercompany balances and transactions have been eliminated in consolidation.
Reclassifications.Certain prior year amounts have been reclassified to conform to current period classifications. The reclassifications had no effect on gross revenues, gross expenses, net income, or the net change in cash and cash equivalents and are not material to previously issued financial statements.
Nature of Operations. Susquehanna is a financial holding company that operates a commercial bank with 221 branches and non-bank subsidiaries that provide leasing; trust and related services; consumer vehicle financing; investment advisory, asset management, and brokerage services; and property and casualty insurance brokerage services. Susquehanna’s primary source of revenue is derived from loans to customers, who are predominately small and middle-market businesses and middle-income individuals.
Use of Estimates.The preparation of financial statements in conformity with U.S.GAAP requires management to make estimates and assumptions that affect the reported amounts of assets and liabilities as of the date of the balance sheet and reported amounts of revenues and expenses during the reporting period. Actual results could differ significantly from those estimates. Material estimates that are particularly susceptible to significant change in the near term relate to the determination of the allowance for loan and lease losses, the fair value of investment securities, derivatives, and goodwill.
Significant Concentrations of Credit Risk.Substantially all of Susquehanna’s loans and leases are to enterprises and individuals in its market area. There is no concentration of loans to borrowers in any one industry or related industries that exceeds 10% of total loans.
Cash and Cash Equivalents. Cash and cash equivalents include cash, balances due from banks, and unrestricted short-term investments. Unrestricted short-term investments consist of interest-bearing deposits in other banks, federal funds sold, commercial paper, and money market funds with an original maturity of three months or less.
Securities Sold Under Agreements to Repurchase.Securities sold under agreements to repurchase are classified as secured short-term borrowings and are recorded at the amount of cash received in connection with the transaction. The securities pledged to secure the repurchase agreements remain in the available-for-sale securities portfolio, and total $389.3 million and $406.8 million at December 31, 2011 and 2010, respectively.
Securities. Susquehanna classifies debt and equity securities as either held to maturity or available for sale, depending on management’s intention on the date of purchase. Susquehanna did not have any securities classified as trading at December 31, 2011 or 2010. Debt securities that management has the intent and ability to
77
hold to maturity are classified as held to maturity and carried at amortized cost. All other securities are classified as available for sale and reported at fair value.
Changes in unrealized gains and losses, net of related deferred taxes, for available-for-sale securities are recorded in accumulated other comprehensive income. The credit component of an other-than-temporary impairment is recorded in noninterest income, and the non-credit component is recorded in accumulated other comprehensive income in the period in which the impairment is recognized. Realized gains and losses on securities are recognized using the specific identification method and are included in noninterest income.
Securities classified as available for sale include investments that management intends to use as part of its asset/liability management strategy. Those securities that have long-term unrealized gains, for which fair value is greater than cost, may be sold in response to changes in interest rates, resultant prepayment risk, and other factors. Susquehanna does not have the intent to sell any of its available-for-sale securities that are in an unrealized-loss position, and it is more likely than not that Susquehanna will not be required to sell these securities before recovery of its amortized cost basis.
Securities classified as held to maturity include private placement securities obtained from debt offerings.
Loans and Leases. Loans that management has the intent and ability to hold for the foreseeable future, or until maturity or pay-off, generally are stated at their outstanding unpaid principal balances, net of any deferred fees or costs on originated loans or unamortized premiums or discounts on purchased loans. Direct financing leases are carried at the aggregate of lease payments plus estimated residual value of the leased property, less unearned income.
Interest income on loans and leases is computed using the effective interest method. Loan and lease origination fees and certain direct loan and lease origination costs are deferred, and the net amount is recognized as an adjustment to the yield on the related loans over the contractual life of the loans.
Nonaccrual loans are those loans for which the accrual of interest has ceased and all previously accrued-but-not-collected interest is reversed. Loans other than consumer loans are placed on nonaccrual status when principal or interest is past due ninety days or more and the loan is not well-collateralized and in the process of collection or immediately, if, in the opinion of management, full collection is doubtful. Susquehanna does not accrue interest on impaired loans. While a loan is considered impaired or on nonaccrual status, subsequent cash interest payments received are applied to the outstanding principal balance or recorded as interest income, depending upon management’s assessment of the ultimate collectability of principal and interest. In any case, the deferral or non-recognition of interest does not constitute forgiveness of the borrower’s obligation. Consumer loans are recorded in accordance with the Uniform Retail Classification regulation adopted by the FDIC. Generally, the regulation requires that consumer loans be charged off to the allowance for loan losses when they become 120-days or more past due.
Troubled debt restructurings are loans for which Susquehanna, for legal or economic reasons related to a debtor’s financial difficulties, has granted a concession to the debtor that it otherwise would not have considered. Concessions that result in the categorization of a loan as a troubled debt restructuring include:
| | • | | Reduction (absolute or contingent) of the stated interest rate |
| | • | | Extension of the maturity date or dates at a stated interest rate lower than the current market rate for new debt with similar risk |
| | • | | Reduction (absolute or contingent) of the face amount or maturity amount of the debt as stated in the instrument or other agreement or |
| | • | | Reduction (absolute or contingent) of accrued interest |
Susquehanna considers a loan to be impaired, based upon current information and events, if it is probable that Susquehanna will be unable to collect payments of principal or interest according to the contractual terms of
78
the loan agreement. Adversely risk-rated loans that are not evaluated for impairment on an individual basis are grouped in homogeneous pools based on severity of risk. Larger homogeneous groups of small-balance loans, such as residential mortgages and installment loans are collectively evaluated for impairment. Non-accrual commercial loans greater than $0.5 million are evaluated for impairment on an individual basis. An insignificant delay or shortfall in the amounts of payments, when considered independently of other factors, would not cause a loan to be rendered impaired. Insignificant delays or shortfalls may include, depending on specific facts and circumstances, those that are associated with temporary operational downturns or seasonal delays.
Management performs quarterly reviews of Susquehanna’s loan portfolio to identify impaired loans. The measurement of impaired loans is based upon the present value of expected future cash flows discounted at the historical effective interest rate, except that all collateral-dependent loans are measured for impairment based on the net realizable value of the collateral.
Loans continue to be classified as impaired until they are brought fully current, and the continued collection of scheduled interest and principal is considered probable. When an impaired loan or portion of an impaired loan is determined to be uncollectible, the portion deemed uncollectible is charged against the related allowance. Subsequent recoveries, if any, are credited to the allowance.
Acquired Loans.Acquired loans are initially recorded at their acquisition date fair values. The carryover of allowance for loan losses is prohibited as any credit losses in the loans are included in the determination of the fair value of the loans at the acquisition date. Fair values for acquired loans are based on a discounted cash flow methodology that involves assumptions and judgments as to credit risk, default rates, loss severity, collateral values, discount rates, payment speeds, prepayment risk, and liquidity risk.
Acquired loans that have evidence of deterioration in credit quality since origination and for which it is probable, at acquisition, that Susquehanna will be unable to collect all contractually required payments are specifically identified and analyzed. The excess of cash flows expected at acquisition over the estimated fair value is referred to as the accretable discount and is recognized into interest income over the remaining life of the loan. The difference between contractually required payments at acquisition and the cash flows expected to be collected at acquisition is referred to as the non-accretable discount. The non-accretable discount represents estimated future credit losses expected to be incurred over the life of the loan. Subsequent decreases to the expected cash flows require Susquehanna to evaluate the need for an allowance for loan losses on these loans. Subsequent improvements in expected cash flows result in the reversal of a corresponding amount of the non-accretable discount which Susquehanna then reclassifies as an accretable discount that is recognized into interest income over the remaining life of the loan using the interest method. Susquehanna’s evaluation of the amount of future cash flows that it expects to collect is performed in a similar manner as that used to determine its allowance for loan losses. Charge-offs of the principal amount on acquired loans would be first applied to the non-accretable discount.
Subsequent to the purchase date of acquired loans that are not deemed impaired at acquisition, the methods used to estimate the required allowance for loan losses for acquired loans is the same as originated loans.
Acquired loans that met the criteria for non-accrual of interest prior to acquisition may be considered performing upon acquisition, regardless of whether the customer is contractually delinquent, if Susquehanna can reasonably estimate the timing and amount of the expected cash flows on such loans and if Susquehanna expects to fully collect the new carrying value of the loans. As such, Susquehanna may no longer consider the loan to be non-accrual or non-performing and may accrue interest on these loans, including the impact of any accretable discount.
For acquired loans that are not deemed impaired at acquisition, credit discounts representing the principal losses expected over the life of the loan are a component of the initial fair value and amortized over the life of the
79
asset. Subsequent to the purchase date, the methods used to estimate the required allowance for loan losses for these loans is similar to originated loans.
Allowance for Loan and Lease Losses. The allowance for loan and lease losses is established, as losses are estimated to have occurred, through a provision for loan and lease losses charged to earnings. Loan and lease losses are charged against the allowance when management believes the uncollectibility of a loan balance is confirmed. Recoveries on previously charged-off loans and leases are credited to the allowance.
The allowance for loan and lease losses is evaluated on a quarterly basis by management and is based upon management’s periodic review of the collectability of the loans and leases in light of historical experience, the nature and volume of the loan portfolio, adverse situations that may affect the borrower’s ability to repay, estimated value of any underlying collateral, and prevailing economic conditions. This evaluation is subjective, as it requires estimates that are susceptible to revision as more information becomes available.
Off-Balance-Sheet Credit-Related Financial Instruments.In the ordinary course of business, Susquehanna enters into commitments to extend credit, including commitments under commercial letters of credit and standby letters of credit. Such financial instruments are recorded when they are funded or otherwise required to be recognized as derivative financial instruments.
Derivative Financial Instruments. All derivatives are recorded on the consolidated balance sheet at fair value. The accounting for changes in the fair value of derivatives depends on whether Susquehanna has elected to designate a derivative in a hedging relationship and apply hedge accounting and whether the hedging relationship has satisfied the criteria necessary to apply hedge accounting. Derivatives designated and qualifying as a hedge of the exposure to changes in the fair value of an asset, liability, or firm commitment attributable to a particular risk, such as interest rate risk, are considered fair value hedges. Derivatives designated and qualifying as a hedge of the exposure to variability in expected future cash flows, or other types of forecasted transactions, are considered cash flow hedges. Hedge accounting generally provides for the matching of the timing of gain or loss recognition on the hedging instrument with the recognition of the changes in the fair value of the hedged asset or liability that are attributable to the hedged risk in a fair value hedge or the earnings effect of the hedged forecasted transactions in a cash flow hedge. Susquehanna may enter into derivative contracts that are intended to economically hedge certain of its risks, even though hedge accounting does not apply or it elects not to apply hedge accounting.
Changes in the fair value of derivatives designated as fair value hedges are recorded in earnings, together and in the same income statement line item with changes in the fair value of the related hedged item. Changes in the fair value of derivatives designated as cash flow hedges are recorded in accumulated other comprehensive income and are reclassified into the line item in the income statement in which the hedged item is recorded and in the same period in which the hedged item affects earnings. Hedge ineffectiveness and gains and losses on the excluded component of a derivative in assessing hedge effectiveness are recorded in earnings.
Foreclosed Assets. Other real estate property acquired through foreclosure or other means is initially recorded at the fair value of the related real estate collateral at the transfer date less estimated selling costs, and subsequently at the lower of its carrying value or fair value less estimated cost to sell through a valuation reserve. Costs to maintain other real estate are expensed as incurred.
Premises and Equipment. Land is carried at cost. Buildings, land improvements, leasehold improvements, and furniture and equipment are stated at cost less accumulated depreciation and amortization. Depreciation is computed primarily by the straight-line method over the estimated useful lives of the assets. Leasehold improvements are amortized over the shorter of the lease term or ten to twenty years. Maintenance and normal repairs are charged to operations as incurred, while additions and improvements to buildings and furniture and equipment are capitalized. Gains or losses on disposition of assets are reflected in earnings.
80
Long-lived assets are evaluated for impairment by management on an on-going basis. Impairment may occur whenever events or changes in circumstances indicate that the carrying amount of an asset may not be recoverable.
Goodwill and Other Intangible Assets. Goodwill is calculated as the purchase premium, if any, after adjusting for the fair value of net assets acquired in purchase transactions. Goodwill is not amortized but is reviewed for potential impairment on at least an annual basis. Susquehanna tests for impairment between annual tests if an event occurs or circumstances change that would more likely than not reduce the fair value of a reporting unit. At December 31, 2011, 2010, and 2009, there was no impairment.
Core deposit and other intangible assets acquired in acquisitions are identified and amortized over their estimated useful lives.
Preferred Stock and Warrant.On December 12, 2008, Susquehanna sold $300.0 million of Fixed Rate Cumulative Perpetual Preferred Stock, Series A, no par value per share (“Preferred Stock”) to the U.S. Treasury. Susquehanna also issued to the U.S. Treasury a warrant to purchase approximately 3,028 shares of its common stock. On April 21, 2010, Susquehanna redeemed $200.0 million of the preferred stock, and on December 21, 2010, Susquehanna redeemed the remaining $100.0 million of preferred stock. On January 19, 2011, Susquehanna repurchased the warrant for $5.3 million.
Segment Reporting. Public companies are required to report financial and descriptive information about their reportable operating segments. Based on the guidance provided, Susquehanna has determined that its only reportable segment is Community Banking, and all services offered by Susquehanna relate to Community Banking.
Accumulated Other Comprehensive Income. Susquehanna records unrealized gains and losses on available-for-sale securities, unrealized gains and losses on cash flow hedges, and unrecognized actuarial gains and losses, transition obligation and prior service costs on pensions and other postretirement benefit plans in accumulated other comprehensive income, net of taxes. Unrealized gains and losses on available-for-sale securities are reclassified into earnings as the gains or losses are realized upon sale of the securities. The credit component of unrealized losses on available-for-sale securities that are determined to be other-than-temporarily impaired are reclassified into earnings at the time the determination is made. Unrealized gains or losses on cash flow hedges are reclassified into earnings when the hedged transaction affects earnings.
Securitizations and Variable Interest Entities (VIEs). In 2005 and 2006, Susquehanna entered into term securitization transactions in which it sold portfolios of home equity loans to securitization trusts. Both of the securitization trusts are variable interest entities. Susquehanna performed an analysis to determine whether it has a controlling financial interest in these entities, and thus, as the primary beneficiary, would be required to consolidate the entities. An enterprise is deemed to have a controlling financial interest in a VIE if it has both of the following characteristics: (a) the power to direct the activities of a VIE that most significantly impact the entity’s economic performance, and (b) the obligation to absorb losses of the entity that could potentially be significant to the VIE or the right to receive benefits from the entity that could potentially be significant to the VIE. Susquehanna retained servicing responsibilities and interests in the VIEs. Susquehanna receives servicing fees and rights to cash flows remaining after the investors have received the return for which they contracted. Susquehanna, as servicer, has the ability to manage the entities’ assets that become delinquent to improve the economic performance of the entities. Therefore, Susquehanna meets the “power criterion.” In addition, through its ownership of the entities’ equity certificates, and the right to receive servicing fees, Susquehanna has the right to receive potentially significant benefits. Therefore, Susquehanna meets the “losses/benefits criterion.” Since Susquehanna meets both criteria, it is the primary beneficiary of the VIEs and is required to consolidate them.
Susquehanna acts as servicer for securitized home equity loans and has recorded servicing assets based on the present value of estimated future net servicing income. At December 31, 2011, these servicing assets totaled
81
$0.5 million and were reported in other assets. Susquehanna’s servicing rights are amortized into noninterest income in proportion to, and over the period of, the estimated future net servicing income of the underlying financial assets. Furthermore, Susquehanna assesses servicing assets for impairment or increased obligation based on fair value at each reporting date.
Income Taxes. Deferred income taxes reflect the temporary tax consequences on future years of differences between the financial statement and tax bases of assets and liabilities using enacted tax rates in effect for the year in which the difference is expected to reverse.
Earnings per Common Share. Basic earnings per share represents income available to common shareholders divided by the weighted-average number of common shares outstanding during the period. Diluted earnings per share includes additional common shares that would have been outstanding if dilutive potential common shares had been issued, as well as any adjustment to income that would result from the assumed issuance. Potential common shares relate to outstanding stock options, restricted stock, and warrants and are determined using the treasury stock method.
Recently Adopted Accounting Guidance
In September 2011, the Financial Accounting Standards Board (“FASB”) issued Accounting Standards Update (“ASU”) 2011-08, Intangibles – Goodwill and Other (Topic 350) –Testing Goodwill for Impairment. This ASU allows entities an option to first assess qualitative factors to determine whether it is necessary to perform the two-step quantitative goodwill impairment test. Under that option, an entity no longer would be required to calculate the fair value of a reporting unit unless the entity determines, based on that qualitative assessment, that it is more likely than not that its fair value is less than its carrying amount.
In April 2011, FASB issued ASU 2011-02, Receivables (Topic 310) –A Creditor’s Determination of Whether a Restructuring Is a Troubled Debt Restructuring. This ASU clarifies which loan modifications constitute troubled debt restructurings for purposes of recording an impairment loss and for disclosure of troubled debt restructurings. This guidance was effective for interim and annual periods beginning on or after June 15, 2011, and applies retrospectively to restructurings occurring on or after the beginning of the fiscal year of adoption. In addition, ASU 2011-02 requires that an entity disclose the information required by ASU 2010-20, Receivables (Topic 310) – Disclosures about the Credit Quality of Financing Receivables and the Allowance for Credit Losses, which was previously deferred by ASU 2011-01. Adoption of this guidance has not had a material impact on results of operations or financial condition.
In December 2010, FASB issued ASU 2010-29, Business Combinations (Topic 805) –Disclosure of Supplementary Pro Forma Information for Business Combinations, a consensus of the FASB Emerging Issues Task Force. The amendments in this ASU specify that if a public entity presents comparative financial statements, the entity should disclose revenue and earnings of the combined entity as though the business combination(s) that occurred during the current year had occurred as of the beginning of the comparable prior annual reporting period only. The amendments in this ASU also expand the supplemental pro forma disclosures under Topic 805 to include a description of the nature and amount of material, nonrecurring pro forma adjustments directly attributable to the business combination included in the reported pro forma revenue and earnings. This ASU was effective prospectively for business combinations for which the acquisition date was on or after the beginning of the first annual reporting period beginning on or after December 15, 2010. Adoption of this guidance has not had a material impact on results of operations or financial condition.
In July 2010, FASB issued ASU 2010-20, Receivables (Topic 310) –Disclosures about the Credit Quality of Financing Receivables and the Allowance for Credit Losses. This ASU requires companies to provide more information in their disclosures about the credit quality of their financing receivables and the credit reserves held against them. The additional disclosures required for financing receivables include: aging of past due receivables, credit quality indicators, and modifications of financing receivables. Under the update, a company needs to
82
disaggregate new and existing disclosures based on how it develops its allowance for credit losses and how it manages credit exposures. The amendments that require disclosures as of the end of a reporting period were effective for periods ending on or after December 15, 2010. The amendments that require disclosures about activity that occurs during a reporting period were effective for periods beginning on or after December 15, 2010. Adoption of this guidance has not had a material impact on results of operations or financial condition.
In January 2010, FASB issued ASU 2010-06, Fair Value Measurements and Disclosures (Topic 820)—Improving Disclosures about Fair Value Measurements. This ASU provides amendments to Subtopic 820-10 that require new disclosures as follows: a reporting entity should disclose separately the amounts of significant transfers in and out of Level 1 and Level 2 fair value measurements and describe the reasons for the transfers. This ASU also provides amendments that clarify existing disclosures relating to the level of disaggregation and inputs and valuation techniques. This ASU was effective for interim and annual reporting periods that began after December 15, 2009, except for the disclosures about purchases, sales, issuances, and settlements in the roll forward of activity in Level 3 fair value measurements. Those disclosures were effective for fiscal years beginning after December 15, 2010, and for interim periods within those fiscal years. Adoption of this ASU has not had a material impact on results of operations or financial condition.
Recently Issued Accounting Guidance
In December 2011, FASB issued ASU 2011-12, Comprehensive Income (Topic 220) –Deferral of the Effective Date for Amendments to the Presentation of Reclassification of Items Out of Accumulated Other Comprehensive Incomein Update No. 2011-05.This update temporarily delays the new requirement to present components of reclassifications of other comprehensive income on the face of the income statement. Companies would still be required to adopt the other requirements contained in the new standard on comprehensive income. Without this delay, those presentation requirements would have been effective for fiscal years, and interim periods within those years, beginning after December 15, 2011. Adoption of this guidance is not expected to have a material impact on results of operations or financial condition.
In June 2011, FASB issued ASU 2011-05, Comprehensive Income (Topic 220) –Presentation of Comprehensive Income.This ASU requires an entity that reports items of other comprehensive income to present the total of comprehensive income, the components of net income, and the components of other comprehensive income either in a single continuous statement of comprehensive income or in two separate but consecutive statements. The option in current GAAP that permits the presentation of other comprehensive income in the statement of changes in equity has been eliminated. This guidance is to be applied retrospectively and is effective for fiscal years, and interim periods within those years, beginning after December 15, 2011. Early adoption is permitted. Adoption of this guidance is not expected to have a material impact on results of operations or financial condition.
In May 2011, FASB issued ASU 2011-04, Fair Value Measurement (Topic 820)—Amendments to Achieve Common Fair Value Measurement and Disclosure Requirements in U.S. GAAP and IFRSs. This ASU does not extend the use of fair value accounting, but provides guidance on how it should be applied where its use is already required or permitted. This guidance is to be applied prospectively and is effective during interim and annual periods beginning after December 15, 2011. Early application is not permitted. Adoption of this guidance is not expected to have a material impact on results of operations or financial condition.
In April 2011, FASB issued ASU 2011-03, Transfer and Servicing (Topic 860) –Reconsideration of Effective Control for Repurchase Agreements.This ASU removes from the assessment of effective control (1) the criterion requiring the transferor to have the ability to repurchase or redeem the financial assets on substantially the agreed terms, even in the event of default by the transferee, and (2) the collateral maintenance implementation guidance related to that criterion. This guidance is effective for the first interim or annual period beginning on or after December 15, 2011. The guidance should be applied prospectively to transactions or modifications of existing transactions that occur on or after the effective date. Early adoption is not permitted. Adoption of this guidance is not expected to have a material impact on results of operations or financial condition.
83
2. Acquisitions
Abington Bancorp, Inc.
On October 1, 2011, Susquehanna acquired all of the outstanding common stock of Abington Bancorp, Inc. (“Abington”), headquartered in Jenkintown, Pennsylvania, in a stock-for-stock transaction in which Abington was merged with and into Susquehanna. Abington operated 20 offices in Pennsylvania at the date of acquisition. The results of operations acquired in the Abington transaction have been included in Susquehanna’s financial results since the acquisition date, October 1, 2011. Abington shareholders received 1.32 shares of Susquehanna stock in exchange for each outstanding share of Abington common stock, resulting in Susquehanna issuing a total of 26,723,143 common shares.
The Abington transaction has been accounted for using the acquisition method of accounting and, accordingly, assets acquired, liabilities assumed and consideration transferred were recorded at estimated fair value on the acquisition date. Assets acquired totaled approximately $1,165,974, including $630,335 of loans and leases (including approximately $98,859 of commercial real estate loans, $11,400 of commercial loans and leases, and $448,825 of residential real estate loans). Liabilities assumed aggregated $976,014, including $857,331 of deposits. The transaction added $150,813 to the Susquehanna shareholders’ equity. There was no goodwill recorded as a result of the transaction; however, a non-taxable gain of $39,143 was recognized, which resulted from the drop in Susquehanna’s stock price from when the merger transaction was announced to when the merger was consummated on October 1, 2011. The drop in the stock price resulted in less common equity recorded than anticipated, but was offset dollar for dollar by a greater amount of retained earnings resulting from the bargain purchase gain. The consideration transferred for Abington’s common equity and the amounts of acquired identifiable assets and liabilities assumed as of the acquisition date were as follows:
| | | | |
Purchase price: | | | | |
Value of: | | | | |
Common shares issued and options assumed | | $ | 150,813 | |
Cash | | | 4 | |
| | | | |
Total purchase price | | | 150,817 | |
| | | | |
| |
Identifiable assets: | | | | |
Cash and due from banks | | | 99,254 | |
Unrestricted short-term investments | | | 11,898 | |
Securities available for sale | | | 329,536 | |
Loans and leases | | | 630,335 | |
Intangible assets | | | 2,860 | |
Other assets | | | 92,091 | |
| | | | |
Total identifiable assets | | | 1,165,974 | |
| | | | |
| |
Liabilities: | | | | |
Deposits | | | 857,331 | |
Short-term borrowings | | | 22,204 | |
Long-term borrowings | | | 76,018 | |
Other liabilities | | | 20,461 | |
| | | | |
Total liabilities | | | 976,014 | |
| | | | |
| |
Net gain resulting from acquisition | | $ | 39,143 | |
| | | | |
In many cases, determining the fair value of the acquired assets and assumed liabilities required Susquehanna to estimate cash flows expected to result from those assets and liabilities and to discount those cash flows at
84
appropriate rates of interest. The most significant of these determinations related to the valuation of acquired loans.
The following is a summary of the loans acquired in the Abington acquisition:
| | | | | | | | | | | | |
| | | | | | Acquired | | | | |
| | | Acquired | | | Non- | | | Total | |
| | | Impaired | | | Impaired | | | Acquired | |
| | | Loans | | | Loans | | | Loans | |
Contractually required principal and interest at acquisition | | $ | 71,711 | | | $ | 666,164 | | | $ | 737,875 | |
Contractual cash flows not expected to be collected | | | (23,254 | ) | | | (6,014 | ) | | | (29,268 | ) |
| | | | | | | | | | | | |
Expected cash flows at acquisition | | | 48,457 | | | | 660,150 | | | | 708,607 | |
Interest component of expected cash flows | | | (5,800 | ) | | | (72,472 | ) | | | (78,272 | ) |
| | | | | | | | | | | | |
Basis in acquired loans at acquisition - estimated fair value | | $ | 42,657 | | | $ | 587,678 | | | $ | 630,335 | |
| | | | | | | | | | | | |
The core deposit intangible of $2,133 is being amortized over an estimated useful life of approximately 10 years.
The fair value of checking, savings and money market deposit accounts acquired from Abington were assumed to approximate the carrying value as these accounts have no stated maturity and are payable on demand. Certificate of deposit accounts were valued as the present value of the certificates expected contractual payments discounted at market rates for similar certificates.
In connection with the Abington acquisition, Susquehanna incurred merger-related expenses related to personnel, occupancy and equipment, and other costs of integrating and conforming acquired operations with and into Susquehanna. Those expenses consisted largely of professional services; conversion of systems and/or integration of operations; costs related to termination of existing contractual arrangements of Abington to purchase various services; initial marketing and promotion expenses designed to introduce Susquehanna to its new customers; travel costs; and printing, postage, supplies, and other costs of completing the transaction and commencing operations in new markets and offices. A summary of merger-related expenses included in the consolidated statement of income follows:
| | | | | | | | | | | | |
| | | Abington | | | Tower | | | Total | |
Salaries and employee benefits | | $ | 525 | | | $ | 4,076 | | | $ | 4,601 | |
Consulting | | | 2,955 | | | | 430 | | | | 3,385 | |
Legal | | | 1,645 | | | | 1,290 | | | | 2,935 | |
Branch writeoffs | | | 1,561 | | | | 0 | | | | 1,561 | |
Net occupancy and equipment | | | 1,198 | | | | 0 | | | | 1,198 | |
All other | | | 1,264 | | | | 47 | | | | 1,311 | |
| | | | | | | | | | | | |
| | $ | 9,148 | | | $ | 5,843 | | | $ | 14,991 | |
| | | | | | | | | | | | |
85
3. Unrestricted Short-term Investments
| | | | | | | | | | | | | | | | |
| | | 2011 | | | 2010 | |
| | | Book | | | | | | Book | | | | |
| | | Value | | | Rates | | | Value | | | Rates | |
Interest-bearing deposits in other banks | | $ | 10,934 | | | | 0.53 | % | | $ | 23,315 | | | | 0.36 | % |
Money market funds | | | 40,045 | | | | 0.00 | | | | 20,539 | | | | 0.02 | |
Mutual funds | | | 4,782 | | | | 0.01 | | | | 8,398 | | | | 0.04 | |
| | | | | | | | | | | | | | | | |
Total | | $ | 55,761 | | | | | | | $ | 52,252 | | | | | |
| | | | | | | | | | | | | | | | |
4. Investment Securities
| | | | | | | | | | | | | | | | |
| | | | | | Gross | | | Gross | | | | |
| | | Amortized | | | Unrealized | | | Unrealized | | | Fair | |
| | | Cost | | | Gains | | | Losses | | | Value | |
| At December 31, 2011 | | | | | | | | | | | | | | | | |
Available-for-Sale: | | | | | | | | | | | | | | | | |
U.S. Government agencies | | $ | 146,580 | | | $ | 1,906 | | | $ | 1 | | | $ | 148,485 | |
Obligations of states and political subdivisions | | | 376,819 | | | | 25,235 | | | | 75 | | | | 401,979 | |
Agency residential mortgage-backed securities | | | 1,503,835 | | | | 28,177 | | | | 608 | | | | 1,531,404 | |
Non-agency residential mortgage-backed securities | | | 79,225 | | | | 0 | | | | 10,154 | | | | 69,071 | |
Commercial mortgage-backed securities | | | 54,973 | | | | 1,846 | | | | 0 | | | | 56,819 | |
Other structured financial products | | | 24,831 | | | | 0 | | | | 11,538 | | | | 13,293 | |
Other debt securities | | | 54,176 | | | | 670 | | | | 3,711 | | | | 51,135 | |
Equity securities of the Federal Home Loan Bank | | | 77,593 | | | | 0 | | | | 0 | | | | 77,593 | |
Equity securities of the Federal Reserve Bank | | | 50,225 | | | | 0 | | | | 0 | | | | 50,225 | |
Other equity securities | | | 22,539 | | | | 791 | | | | 227 | | | | 23,103 | |
| | | | | | | | | | | | | | | | |
Total available-for-sale securities | | $ | 2,390,796 | | | $ | 58,625 | | | $ | 26,314 | | | $ | 2,423,107 | |
| | | | | | | | | | | | | | | | |
Held-to-Maturity: | | | | | | | | | | | | | | | | |
Other | | $ | 4,570 | | | $ | 0 | | | $ | 0 | | | $ | 4,570 | |
State and municipal | | | 3,838 | | | | 0 | | | | 0 | | | | 3,838 | |
| | | | | | | | | | | | | | | | |
Total held-to-maturity securities | | $ | 8,408 | | | $ | 0 | | | $ | 0 | | | $ | 8,408 | |
| | | | | | | | | | | | | | | | |
86
| | | | | | | | | | | | | | | | |
| | | | | | Gross | | | Gross | | | | |
| | | Amortized | | | Unrealized | | �� | Unrealized | | | Fair | |
| | | Cost | | | Gains | | | Losses | | | Value | |
At December 31, 2010 | | | | | | | | | | | | | | | | |
Available-for-Sale: | | | | | | | | | | | | | | | | |
U.S. Government agencies | | $ | 268,828 | | | $ | 2,230 | | | $ | 2,883 | | | $ | 268,175 | |
Obligations of states and political subdivisions | | | 397,777 | | | | 4,869 | | | | 5,986 | | | | 396,660 | |
Agency residential mortgage-backed securities | | | 1,321,771 | | | | 19,671 | | | | 17,873 | | | | 1,323,569 | |
Non-agency residential mortgage-backed securities | | | 129,206 | | | | 32 | | | | 12,427 | | | | 116,811 | |
Commercial mortgage-backed securities | | | 99,501 | | | | 5,341 | | | | 0 | | | | 104,842 | |
Other structured financial products | | | 24,680 | | | | 0 | | | | 12,177 | | | | 12,503 | |
Other debt securities | | | 41,842 | | | | 88 | | | | 930 | | | | 41,000 | |
Equity securities of the Federal Home Loan Bank | | | 71,065 | | | | 0 | | | | 0 | | | | 71,065 | |
Equity securities of the Federal Reserve Bank | | | 50,225 | | | | 0 | | | | 0 | | | | 50,225 | |
Other equity securities | | | 24,689 | | | | 251 | | | | 847 | | | | 24,093 | |
| | | | | | | | | | | | | | | | |
Total available-for-sale securities | | $ | 2,429,584 | | | $ | 32,482 | | | $ | 53,123 | | | $ | 2,408,943 | |
| | | | | | | | | | | | | | | | |
Held-to-Maturity: | | | | | | | | | | | | | | | | |
Other | | $ | 4,560 | | | $ | 0 | | | $ | 0 | | | $ | 4,560 | |
State and municipal | | | 4,108 | | | | 0 | | | | 0 | | | | 4,108 | |
| | | | | | | | | | | | | | | | |
Total held-to-maturity securities | | $ | 8,668 | | | $ | 0 | | | $ | 0 | | | $ | 8,668 | |
| | | | | | | | | | | | | | | | |
At December 31, 2011 and December 31, 2010, investment securities with carrying values of $1,673,419 and $1,561,964, respectively, were pledged to secure public funds and for other purposes as required by law.
The amortized cost and fair value of U.S. Government agencies, obligations of states and political subdivisions, synthetic collateralized debt obligations, other structured financial products, other debt securities, and residential and commercial mortgage-backed securities, at December 31, 2011, by contractual maturity, are shown below. Actual maturities will differ from contractual maturities because borrowers may have the right to call or prepay obligations with or without call or prepayment penalties.
| | | | | | | | |
| | | Amortized | | | Fair | |
| | | Cost | | | Value | |
At December 31, 2011 | | | | | | | | |
Securities available for sale: | | | | | | | | |
Within one year | | $ | 9,595 | | | $ | 9,821 | |
After one year but within five years | | | 169,739 | | | | 172,613 | |
After five years but within ten years | | | 602,385 | | | | 609,935 | |
After ten years | | | 1,458,719 | | | | 1,479,816 | |
| | | | | | | | |
Total available-for-sale securities | | $ | 2,240,439 | | | $ | 2,272,185 | |
| | | | | | | | |
Securities held to maturity: | | | | | | | | |
Within one year | | $ | 0 | | | $ | 0 | |
After one year but within five years | | | 0 | | | | 0 | |
After five years but within ten years | | | 0 | | | | 0 | |
After ten years | | | 8,408 | | | | 8,408 | |
| | | | | | | | |
Total held-to-maturity securities | | $ | 8,408 | | | $ | 8,408 | |
| | | | | | | | |
87
Gross realized gains and gross realized losses on investment securities transactions are summarized below. These gains and losses were recognized using the specific identification method and were included in noninterest income.
| | | | | | | | | | | | |
| | | Available-for-sale Securities | |
| | | For the Year Ended
December 31, | |
| | | 2011 | | | 2010 | | | 2009 | |
Gross gains | | $ | 9,089 | | | $ | 13,998 | | | $ | 12,055 | |
Gross losses | | | (5,211 | ) | | | (590 | ) | | | (253 | ) |
Other-than-temporary impairment | | | (3,364 | ) | | | (3,891 | ) | | | (1,149 | ) |
| | | | | | | | | | | | |
Net gains | | $ | 514 | | | $ | 9,517 | | | $ | 10,653 | |
| | | | | | | | | | | | |
The following table presents Susquehanna’s investments’ gross unrealized losses and the corresponding fair values by investment category and length of time that the securities have been in a continuous unrealized loss position, at December 31, 2011 and December 31, 2010.
| | | | | | | | | | | | | | | | | | | | | | | | |
December 31, 2011 | | Less than 12 Months | | | 12 Months or More | | | Total | |
| | | Fair | | | Unrealized | | | Fair | | | Unrealized | | | Fair | | | Unrealized | |
| | | Value | | | Losses | | | Value | | | Losses | | | Value | | | Losses | |
U.S. Government agencies | | $ | 0 | | | $ | 0 | | | $ | 6,500 | | | $ | 1 | | | $ | 6,500 | | | $ | 1 | |
Obligations of states and political subdivisions | | | 0 | | | | — | | | | 925 | | | | 75 | | | | 925 | | | | 75 | |
Agency residential mortgage-backed securities | | | 126,645 | | | | 608 | | | | 0 | | | | 0 | | | | 126,645 | | | | 608 | |
Non-agency residential mortgage-backed
securities | | | 6,187 | | | | 563 | | | | 62,884 | | | | 9,591 | | | | 69,071 | | | | 10,154 | |
Other structured financial products | | | 0 | | | | 0 | | | | 13,293 | | | | 11,538 | | | | 13,293 | | | | 11,538 | |
Other debt securities | | | 21,237 | | | | 2,988 | | | | 10,102 | | | | 723 | | | | 31,339 | | | | 3,711 | |
Other equity securities | | | 16 | | | | 1 | | | | 921 | | | | 225 | | | | 937 | | | | 227 | |
| | | | | | | | | | | | | | | | | | | | | | | | |
| | $ | 154,085 | | | $ | 4,160 | | | $ | 94,625 | | | $ | 22,153 | | | $ | 248,710 | | | $ | 26,314 | |
| | | | | | | | | | | | | | | | | | | | | | | | |
| | | | | | | | | | | | | | | | | | | | | | | | |
December 31, 2010 | | Less than 12 Months | | | 12 Months or More | | | Total | |
| | | Fair | | | Unrealized | | | Fair | | | Unrealized | | | Fair | | | Unrealized | |
| | | Value | | | Losses | | | Value | | | Losses | | | Value | | | Losses | |
U. S. Government agencies | | $ | 114,618 | | | $ | 2,883 | | | $ | 0 | | | $ | 0 | | | $ | 114,618 | | | $ | 2,883 | |
Obligations of states and political subdivisions | | | 147,732 | | | | 5,483 | | | | 6,215 | | | | 503 | | | | 153,947 | | | | 5,986 | |
Agency residential mortgage-backed securities | | | 642,864 | | | | 17,873 | | | | 0 | | | | 0 | | | | 642,864 | | | | 17,873 | |
Non-agency residential mortgage-backed securities | | | 5,664 | | | | 124 | | | | 109,272 | | | | 12,303 | | | | 114,936 | | | | 12,427 | |
Other structured financial products | | | 0 | | | | 0 | | | | 12,503 | | | | 12,177 | | | | 12,503 | | | | 12,177 | |
Other debt securities | | | 15,120 | | | | 630 | | | | 1,480 | | | | 300 | | | | 16,600 | | | | 930 | |
Other equity securities | | | 666 | | | | 210 | | | | 2,103 | | | | 637 | | | | 2,769 | | | | 847 | |
| | | | | | | | | | | | | | | | | | | | | | | | |
| | $ | 926,664 | | | $ | 27,203 | | | $ | 131,573 | | | $ | 25,920 | | | $ | 1,058,237 | | | $ | 53,123 | |
| | | | | | | | | | | | | | | | | | | | | | | | |
Non-agency residential mortgage-backed securitiesAt December 31, 2011 Susquehanna held 13 securities, each of which had unrealized losses. Seven of those securities were rated below investment grade. None of Susquehanna’s non-agency residential mortgage-backed securities were backed by loans identified as subprime or Alt-A collateral. Management has analyzed the collateral underlying these securities with respect to defaults, loan to collateral value ratios, current levels of subordination, and geographic concentrations and
88
concluded that four of these securities are other-than-temporarily impaired. Susquehanna recorded other-than-temporary impairment losses as presented in the following table.
Credit Losses on Non-agency Residential Mortgage-backed Securities for which a Portion of an
Other-than-temporary Impairment was Recognized in Other Comprehensive Income
| | | | | | | | |
| | | 2011 | | | 2010 | |
Balance - beginning of period | | $ | 1,737 | | | $ | 0 | |
Additions: | | | | | | | | |
Amount related to credit losses for which an other-than-temporary impairment was not previously recognized | | | 2,791 | | | | 1,737 | |
Additional amount related to credit losses for which an other-than-temporary impairment was previously recognized | | | 527 | | | | 0 | |
| | | | | | | | |
Balance - end of period | | $ | 5,055 | | | $ | 1,737 | |
| | | | | | | | |
Susquehanna estimated the portion of loss attributable to credit using a discounted cash flow model. Susquehanna, in conjunction with a third-party financial advisory firm, estimated the expected cash flows of the underlying collateral using internal credit risk, interest rate risk, and prepayment risk models that incorporated management’s best estimate of current key assumptions, such as default rates, loss severity, and prepayment rates. Assumptions used can vary widely from loan to loan and are influenced by such factors as loan interest rate, geographical location of the borrower, borrower characteristics, and collateral type. The distribution of underlying cash flows is determined in accordance with the security’s terms. Expected principal and interest cash flows on an other-than-temporarily impaired debt security are discounted using the effective yield of that debt security.
Based on the expected cash flows derived from the model, Susquehanna expects to recover the unrealized loss in accumulated other comprehensive income ($2,521 at December 31, 2011). Significant assumptions used in the valuation of this other-than-temporarily impaired security were as follows:
| | | | |
| | | Weighted-average (%) | |
As of December 31, | | 2011 | |
Conditional repayment rate (1) | | | 10.3 | % |
Loss severity (2) | | | 46.6 | % |
Conditional default rate (3) | | | 6.4 | % |
| (1) | Conditional repayment rate represents a rate equal to the proportion of principal balance paid off voluntarily over a certain period of time on an annualized basis. |
| (2) | Loss severity rates are projected by considering collateral characteristics such as current loan-to-value, original creditworthiness of borrowers (FICO score) and geographic concentration. |
| (3) | Conditional default rate is an annualized rate of default on a group of mortgages, and represents the percentage of outstanding principal balances in the pool that are in default, which typically equates to the home being past 60 days, 90 days, or possibly already in the foreclosure process. |
Other structured financial products. Susquehanna’s structured financial products investments are comprised of four pooled trust preferred securities which have an unrealized loss of $11,538. All of these securities are below investment grade but are of the more senior tranche of the specific issue. Susquehanna has contracted with a third party financial advisory firm (“third party firm”) to assist in its other-than-temporary impairment (“OTTI”) analysis of its structured financial products investments. Management has assisted with the development of, and reviews and comments on the results of, this valuation methodology, and believes that the valuation analysis and methodology reasonably supports the value and projected performance of the specific trust
89
preferred securities. Management believes this valuation methodology presents an appropriate approach in the determination of other-than-temporary impairment charges in accordance with GAAP.
The third party firm uses a proprietary methodology to determine the other-than-temporary impairment of Susquehanna’s pooled trust preferred securities. Using publicly available financial information, the third party firm’s valuation analysis compares the present value of the expected base cash flows with the amortized cost basis of the trust preferred securities to determine whether Susquehanna expects to receive the entire amortized cost basis of such securities. To make this comparison, the third party firm evaluates two scenarios consisting of three phases each. The two scenarios are: (1) the first dollar loss scenario, and, (2) the expected or forecasted scenario. The three phases associated with each scenario are production of cash flows, application of the cash flows to the percent owned, and assessment of OTTI.
To determine expected cash flows, the valuation analysis considers credit default rates, call options and deferrals, waterfall structure, and covenants relating to the trust preferred securities. The third party firm determines short-term default risk using ratios, including the Texas rating, that relate to the issuers capitalization, asset quality, profitability, and liquidity. To determine longer term default probabilities, the third party firm uses an internal scoring approach that relies on key historical financial performance ratios. Management believes that future cash flows for these securities can be reasonably developed and supported. In addition, the trust indenture documentation and the trustee reports for each specific trust preferred security issuance provides information regarding, deferral rights, call options, various triggers, including over-collateralization triggers, and waterfall structure, which management believes is essential in determining projected base cash flows.
If an issuer is in default at the assessment date, a recovery rate specific to the issuer is incorporated into the expected cash flows with a twenty-four month lag in timing of receipt of those expected cash flows. The third party firm calculates a terminal default rate based upon certain key financial ratios of the active issuers in the security to all FDIC insured bank institutions. The active issuers are summarized by creating a weighted average based on issue size, then divided into categories based upon their status of deferral and whether or not the third party firm has assigned a default assumption to the issuer. To ensure an accurate comparison, the third party firm calculates the standard deviation across the issuers for each ratio and removes any issuer that falls more than three standard deviations above or below the average for that ratio. No recovery is incorporated into the expected cash flows for any issuers that exceed the terminal default rate. For issuers currently making interest payments and for those currently deferring interest payments, Susquehanna makes an estimate using publicly available financial information as to the likelihood and timing of any default, after which the estimated cash flow reflects a recovery rate specific to the issuer. Issuers that are currently deferring interest payments and not expected to default are assumed to continue to defer interest payments for twenty quarters, the full contractually permitted deferral, from the period of initial deferral.
In considering the amount and timing of expected cash flows on the pooled trust preferred securities, management considers the right of the issuers of the securities underlying the pooled trust preferred securities to call those collateral securities. Management assesses any projected exercise of the call option, incorporating changes in economic and market conditions and the impact of any change in timing of expected cash flows in the measurement of fair value and other-than-temporary impairment. As of December 31, 2011, management determined that the likelihood is remote that any call option will be exercised.
The discount rate applied to the projected cash flows for the specific class is calculated using a spread to the current swap curve. The swap curve gives a market participant perspective of the term structure of interest rates and on credit spreads. The determination of the discount rate used in Susquehanna’s valuation is based upon the referenced swap curve plus an additional credit spread based upon the credit rating of the class. Lower rated classes would have a wider implied credit spread. These multiple discount rates are then applied to the estimated cash flows in determining the estimated value.
90
The present value of the expected cash flows for Susquehanna’s specific class and subordinate classes, as well as additional information about the pooled trust preferred securities, is included in the following table.
| | | | | | | | | | | | | | | | |
As of December 31, 2011 | | Pooled
Trust #1 | | | Pooled
Trust #2 | | | Pooled
Trust #3 | | | Pooled
Trust #4 | |
| Class | | B | | | B | | | B | | | A2L | |
Class face value | | $ | 35,000 | | | $ | 58,163 | | | $ | 87,709 | | | $ | 45,500 | |
Book value | | $ | 3,000 | | | $ | 7,071 | | | $ | 8,010 | | | $ | 6,750 | |
Fair value | | | 1,756 | | | | 3,821 | | | | 4,267 | | | | 3,449 | |
| | | | | | | | | | | | | | | | |
Unrealized loss | | $ | (1,244 | ) | | $ | (3,250 | ) | | $ | (3,743 | ) | | $ | (3,301 | ) |
| | | | | | | | | | | | | | | | |
Present value of expected cash flows for class noted above and all subordinated classes (1) | | $ | 146,039 | | | $ | 159,884 | | | $ | 269,458 | | | $ | 140,863 | |
Lowest credit rating assigned | | | CCC- | | | | Caa3 | | | | Ca | | | | Ca | |
Original collateral | | $ | 623,984 | | | $ | 501,470 | | | $ | 700,535 | | | $ | 487,680 | |
Performing collateral | | | 363,728 | | | | 320,750 | | | | 503,181 | | | | 320,600 | |
Actual defaults | | | 10,000 | | | | 46,580 | | | | 44,000 | | | | 74,500 | |
Actual deferrals | | | 97,400 | | | | 105,140 | | | | 102,900 | | | | 69,580 | |
Projected future defaults | | | 71,064 | | | | 76,396 | | | | 112,935 | | | | 47,281 | |
Actual defaults as a % of original collateral | | | 1.6 | % | | | 9.3 | % | | | 6.3 | % | | | 15.3 | % |
Actual deferrals as a % of original collateral (2) | | | 15.6 | | | | 21.0 | | | | 14.7 | | | | 14.3 | |
| | | | | | | | | | | | | | | | |
Actual defaults and deferrals as a % of original collateral | | | 17.2 | % | | | 30.3 | % | | | 21.0 | % | | | 29.6 | % |
| | | | | | | | | | | | | | | | |
Projected future defaults as a % of original collateral (3) | | | 11.4 | % | | | 15.2 | % | | | 16.1 | % | | | 9.7 | % |
Actual institutions deferring and defaulted as a % of total institutions | | | 17.9 | | | | 35.7 | | | | 27.5 | | | | 36.2 | |
Projected future defaults as a % of performing collateral plus deferrals | | | 15.4 | | | | 17.9 | | | | 18.6 | | | | 12.1 | |
| (1) | Susquehanna determines whether it expects to recover the entire amortized cost basis by comparing the present value of the expected cash flows to be collected with the amortized cost basis, using documented assumptions. The present value of the expected cash flows for Susquehanna’s specific class and all subordinate classes is listed above. As of December 31, 2011, the present value of the current estimated cash flows is equal to or greater than the face amount of the specific class for all trust preferred securities and consequently, there is no other-than-temporary impairment. |
| (2) | Includes current interest deferrals for the quarter for those institutions deferring as of the date of the assessment of the other-than-temporary impairment. Current deferrals are assumed to continue for twenty quarters, the full contractually permitted deferral period, if the institutions are not projected to default prior to that time. |
| (3) | Includes those institutions that are performing but are not projected to continue to perform and includes those institutions that are currently deferring interest that are projected to default, based upon third-party proprietary valuation methodology used to determine future defaults. Creditworthiness of each underlying issue in the collateralized debt obligation is determined using publicly available data. |
Susquehanna does not have the intent to sell any of its available-for-sale securities that are in an unrealized loss position, and it is more likely than not that Susquehanna will not be required to sell these securities before recovery of its amortized cost basis.
91
5. Loans and Leases
| | | | | | | | |
At December 31, | | 2011 | | | 2010 | |
Commercial, financial, and agricultural | | $ | 1,871,027 | | | $ | 1,816,519 | |
Real estate - construction | | | 829,221 | | | | 877,223 | |
Real estate secured - residential | | | 3,212,562 | | | | 2,666,692 | |
Real estate secured - commercial | | | 3,136,887 | | | | 2,998,176 | |
Consumer | | | 722,329 | | | | 603,084 | |
Leases | | | 675,904 | | | | 671,503 | |
| | | | | | | | |
Total loans and leases | | $ | 10,447,930 | | | $ | 9,633,197 | |
| | | | | | | | |
Nonaccrual loans and leases | | $ | 156,478 | | | $ | 196,895 | |
Loans and leases contractually past due 90 days and still accruing | | | 10,077 | | | | 20,588 | |
Troubled debt restructurings | | | 72,852 | | | | 114,566 | |
Unearned income | | | 162,849 | | | | 162,269 | |
Deferred origination costs | | | 13,857 | | | | 11,603 | |
All overdrawn deposit accounts, reclassified as loans and evaluated under management’s current model for collectibility | | | 3,390 | | | | 3,623 | |
Net Investment in Direct Financing Leases
| | | | | | | | |
At December 31, | | 2011 | | | 2010 | |
Minimum lease payments receivable | | $ | 489,574 | | | $ | 461,569 | |
Estimated residual value of leases | | | 255,152 | | | | 276,911 | |
Unearned income under lease contracts | | | (68,822 | ) | | | (66,977 | ) |
| | | | | | | | |
Total leases | | $ | 675,904 | | | $ | 671,503 | |
| | | | | | | | |
Allowance for Credit Losses and Recorded Investment in Financing Receivables
Twelve Months Ended December 31, 2011
| | | | | | | | | | | | | | | | | | | | | | | | | | | | | | | | |
| | | | | | | | | Real Estate | | | Real Estate | | | | | | | | | | | | | |
| | | | | | Real Estate - | | | Secured - | | | Secured - | | | | | | | | | | | | | |
| | | Commercial | | | Construction | | | Residential | | | Commercial | | | Consumer | | | Leases | | | Unallocated | | | Total | |
Allowance for credit losses: | | | | | | | | | | | | | | | | | | | | | | | | | | | | | | | | |
Balance at January 1, 2011 | | $ | 31,608 | | | $ | 50,250 | | | $ | 28,320 | | | $ | 70,137 | | | $ | 2,841 | | | $ | 8,643 | | | $ | 35 | | | $ | 191,834 | |
Charge-offs | | | (25,552 | ) | | | (36,585 | ) | | | (18,663 | ) | | | (45,213 | ) | | | (3,922 | ) | | | (5,310 | ) | | | 0 | | | | (135,245 | ) |
Recoveries | | | 5,835 | | | | 7,106 | | | | 1,916 | | | | 3,795 | | | | 1,371 | | | | 1,488 | | | | 0 | | | | 21,511 | |
Provision | | | 16,676 | | | | 16,097 | | | | 17,266 | | | | 49,695 | | | | 3,007 | | | | 5,740 | | | | 1,519 | | | | 110,000 | |
| | | | | | | | | | | | | | | | | | | | | | | | | | | | | | | | |
Balance at December 31, 2011 | | $ | 28,567 | | | $ | 36,868 | | | $ | 28,839 | | | $ | 78,414 | | | $ | 3,297 | | | $ | 10,561 | | | $ | 1,554 | | | $ | 188,100 | |
| | | | | | | | | | | | | | | | | | | | | | | | | | | | | | | | |
Balance at December 31, 2011: | | | | | | | | | | | | | | | | | | | | | | | | | | | | | | | | |
Individually evaluated for impairment | | $ | 3,421 | | | $ | 2,243 | | | $ | 2,807 | | | $ | 11,871 | | | $ | 654 | | | $ | 0 | | | | | | | $ | 20,996 | |
| | | | | | | | | | | | | | | | | | | | | | | | | | | | | | | | |
Collectively evaluated for impairment | | $ | 25,146 | | | $ | 34,625 | | | $ | 26,033 | | | $ | 66,543 | | | $ | 2,643 | | | $ | 10,561 | | | $ | 1,554 | | | $ | 167,104 | |
| | | | | | | | | | | | | | | | | | | | | | | | | | | | | | | | |
Financing receivables: | | | | | | | | | | | | | | | | | | | | | | | | | | | | | | | | |
Balance at December 31, 2011 | | $ | 1,871,027 | | | $ | 829,221 | | | $ | 3,212,562 | | | $ | 3,136,887 | | | $ | 722,329 | | | $ | 675,904 | | | | | | | $ | 10,447,930 | |
| | | | | | | | | | | | | | | | | | | | | | | | | | | | | | | | |
Balance at December 31, 2011: | | | | | | | | | | | | | | | | | | | | | | | | | | | | | | | | |
Individually evaluated for impairment | | $ | 13,491 | | | $ | 40,983 | | | $ | 33,767 | | | $ | 88,778 | | | $ | 658 | | | $ | 0 | | | | | | | $ | 177,677 | |
| | | | | | | | | | | | | | | | | | | | | | | | | | | | | | | | |
Collectively evaluated for impairment | | $ | 1,857,536 | | | $ | 788,238 | | | $ | 3,178,795 | | | $ | 3,048,109 | | | $ | 721,671 | | | $ | 675,904 | | | | | | | $ | 10,270,253 | |
| | | | | | | | | | | | | | | | | | | | | | | | | | | | | | | | |
92
The following tables present Susquehanna’s credit quality indicators by internally assigned grading and by payment activity for the years ended December 31, 2011 and 2010.
Credit Quality Indicators, at December 31, 2011
Commercial Credit Exposure
Credit-risk Profile by Internally Assigned Grade
| | | | | | | | | | | | |
| | | | | | | | | Real Estate - | |
| | | | | | Real Estate - | | | Secured - | |
| | | Commercial | | | Construction (1) | | | Commercial (2) | |
Grade: | | | | | | | | | | | | |
Pass (3) | | $ | 1,754,383 | | | $ | 561,536 | | | $ | 3,321,297 | |
Special mention (4) | | | 56,066 | | | | 97,252 | | | | 190,671 | |
Substandard (5) | | | 60,578 | | | | 94,755 | | | | 247,973 | |
| | | | | | | | | | | | |
Total | | $ | 1,871,027 | | | $ | 753,543 | | | $ | 3,759,941 | |
| | | | | | | | | | | | |
Other Credit Exposure
Credit-risk Profile based on Payment Activity
| | | | | | | | | | | | |
| | | Real Estate - | | | | | | | |
| | | Secured - | | | | | | | |
| | | Residential | | | Consumer | | | Leases | |
Performing | | $ | 2,632,475 | | | $ | 720,720 | | | $ | 674,510 | |
Nonperforming (6) | | | 32,712 | | | | 1,609 | | | | 1,394 | |
| | | | | | | | | | | | |
Total | | $ | 2,665,187 | | | $ | 722,329 | | | $ | 675,904 | |
| | | | | | | | | | | | |
Credit Quality Indicators, at December 31, 2010
Commercial Credit Exposure
Credit-risk Profile by Internally Assigned Grade
| | | | | | | | | | | | |
| | | | | | | | | Real Estate - | |
| | | | | | Real Estate - | | | Secured - | |
| | | Commercial | | | Construction (1) | | | Commercial (2) | |
Grade: | | | | | | | | | | | | |
Pass (3) | | $ | 1,677,506 | | | $ | 612,330 | | | $ | 3,134,762 | |
Special mention (4) | | | 59,988 | | | | 64,283 | | | | 201,833 | |
Substandard (5) | | | 79,025 | | | | 125,672 | | | | 280,287 | |
| | | | | | | | | | | | |
Total | | $ | 1,816,519 | | | $ | 802,285 | | | $ | 3,616,882 | |
| | | | | | | | | | | | |
Other Credit Exposure
Credit-risk Profile based on Payment Activity
93
| | | | | | | | | | | | |
| | | Real Estate - | | | | | | | |
| | | Secured - | | | | | | | |
| | | Residential | | | Consumer | | | Leases | |
Performing | | $ | 2,085,067 | | | $ | 600,627 | | | $ | 667,936 | |
Nonperforming (6) | | | 37,857 | | | | 2,457 | | | | 3,567 | |
| | | | | | | | | | | | |
Total | | $ | 2,122,924 | | | $ | 603,084 | | | $ | 671,503 | |
| | | | | | | | | | | | |
| (1) | Includes only construction loans granted to commercial customers. Construction loans for individuals are included in Real Estate - Secured - Residential, below. |
| (2) | Includes loans obtained for commercial purposes that are also secured by residential real estate. |
| (3) | Includes loans identified as having acceptable risk, which are loans for which the possibility of loss is considered unlikely. |
| (4) | Includes loans considered potentially weak; however, no loss of principal or interest is anticipated. |
| (5) | Includes loans that are inadequately protected by the current net-worth and paying capacity of the borrower or by the collateral pledged, if any. Loss of principal or interest is considered reasonably possible or likely. |
| (6) | Includes loans that are on non-accrual status or past due ninety days or more. |
The following tables detail the age analysis of Susquehanna’s past due financing receivables as of December 31, 2011 and 2010.
Age Analysis of Past Due Financing Receivables, as of December 31, 2011
Financing Receivables that are Accruing
| | | | | | | | | | | | | | | | | | | | | | | | |
| | | 30-59 Days
Past Due | | | 60-89 Days
Past Due | | | Greater than
90 Days | | | Total
Past Due | | | Current | | | Total
Financing
Receivables | |
Commercial | | $ | 7,843 | | | $ | 2,473 | | | $ | 778 | | | $ | 11,094 | | | $ | 1,845,548 | | | $ | 1,856,642 | |
Real estate - construction | | | 342 | | | | 416 | | | | 56 | | | | 814 | | | | 790,680 | | | | 791,494 | |
Real estate secured - residential | | | 21,330 | | | | 7,247 | | | | 6,303 | | | | 34,880 | | | | 3,135,760 | | | | 3,170,640 | |
Real estate secured - commercial | | | 4,011 | | | | 1,043 | | | | 884 | | | | 5,938 | | | | 3,069,452 | | | | 3,075,390 | |
Consumer | | | 7,688 | | | | 1,442 | | | | 1,609 | | | | 10,739 | | | | 711,590 | | | | 722,329 | |
Leases | | | 4,014 | | | | 867 | | | | 447 | | | | 5,328 | | | | 669,629 | | | | 674,957 | |
| | | | | | | | | | | | | | | | | | | | | | | | |
Total | | $ | 45,228 | | | $ | 13,488 | | | $ | 10,077 | | | $ | 68,793 | | | $ | 10,222,659 | | | $ | 10,291,452 | |
| | | | | | | | | | | | | | | | | | | | | | | | |
94
Financing Receivables that are Nonaccruing
| | | | | | | | | | | | | | | | | | | | | | | | |
| | | 30-59 Days
Past Due | | | 60-89 Days
Past Due | | | Greater than
90 Days | | | Total
Past Due | | | Current | | | Total
Financing
Receivables | |
Commercial | | $ | 454 | | | $ | 1,032 | | | $ | 6,319 | | | $ | 7,805 | | | $ | 6,580 | | | $ | 14,385 | |
Real estate - construction | | | 122 | | | | 7,443 | | | | 27,292 | | | | 34,857 | | | | 2,870 | | | | 37,727 | |
Real estate secured - residential | | | 2,569 | | | | 517 | | | | 27,603 | | | | 30,689 | | | | 11,233 | | | | 41,922 | |
Real estate secured - commercial | | | 2,946 | | | | 1,722 | | | | 32,020 | | | | 36,688 | | | | 24,809 | | | | 61,497 | |
Consumer | | | 0 | | | | 0 | | | | 0 | | | | 0 | | | | 0 | | | | 0 | |
Leases | | | 0 | | | | 59 | | | | 413 | | | | 472 | | | | 475 | | | | 947 | |
| | | | | | | | | | | | | | | | | | | | | | | | |
Total | | $ | 6,091 | | | $ | 10,773 | | | $ | 93,647 | | | $ | 110,511 | | | $ | 45,967 | | | $ | 156,478 | |
| | | | | | | | | | | | | | | | | | | | | | | | |
Age Analysis of Past Due Financing Receivables, as of December 31, 2010
Financing Receivables that are Accruing
| | | | | | | | | | | | | | | | | | | | | | | | |
| | | 30-59 Days
Past Due | | | 60-89 Days
Past Due | | | Greater than
90 Days | | | Total
Past Due | | | Current | | | Total
Financing
Receivables | |
Commercial | | $ | 12,808 | | | $ | 5,190 | | | $ | 947 | | | $ | 18,945 | | | $ | 1,777,562 | | | $ | 1,796,507 | |
Real estate - construction | | | 2,466 | | | | 2,845 | | | | 751 | | | | 6,062 | | | | 813,382 | | | | 819,444 | |
Real estate secured - residential | | | 18,466 | | | | 6,923 | | | | 12,724 | | | | 38,113 | | | | 2,577,606 | | | | 2,615,719 | |
Real estate secured - commercial | | | 12,324 | | | | 8,384 | | | | 2,961 | | | | 23,669 | | | | 2,909,194 | | | | 2,932,863 | |
Consumer | | | 6,385 | | | | 828 | | | | 2,455 | | | | 9,668 | | | | 593,415 | | | | 603,083 | |
Leases | | | 5,274 | | | | 3,126 | | | | 750 | | | | 9,150 | | | | 659,536 | | | | 668,686 | |
| | | | | | | | | | | | | | | | | | | | | | | | |
Total | | $ | 57,723 | | | $ | 27,296 | | | $ | 20,588 | | | $ | 105,607 | | | $ | 9,330,695 | | | $ | 9,436,302 | |
| | | | | | | | | | | | | | | | | | | | | | | | |
Financing Receivables that are Nonaccruing
| | | | | | | | | | | | | | | | | | | | | | | | |
| | | 30-59 Days
Past Due | | | 60-89 Days
Past Due | | | Greater than
90 Days | | | Total
Past Due | | | Current | | | Total
Financing
Receivables | |
Commercial | | $ | 1,392 | | | $ | 365 | | | $ | 14,227 | | | $ | 15,984 | | | $ | 4,028 | | | $ | 20,012 | |
Real estate - construction | | | 2,418 | | | | 2,513 | | | | 45,417 | | | | 50,348 | | | | 7,431 | | | | 57,779 | |
Real estate secured - residential | | | 2,196 | | | | 615 | | | | 36,479 | | | | 39,290 | | | | 11,683 | | | | 50,973 | |
Real estate secured - commercial | | | 8,812 | | | | 4,666 | | | | 38,947 | | | | 52,425 | | | | 12,888 | | | | 65,313 | |
Consumer | | | 0 | | | | 0 | | | | 0 | | | | 0 | | | | 1 | | | | 1 | |
Leases | | | 0 | | | | 178 | | | | 1,461 | | | | 1,639 | | | | 1,178 | | | | 2,817 | |
| | | | | | | | | | | | | | | | | | | | | | | | |
Total | | $ | 14,818 | | | $ | 8,337 | | | $ | 136,531 | | | $ | 159,686 | | | $ | 37,209 | | | $ | 196,895 | |
| | | | | | | | �� | | | | | | | | | | | | | | | | |
95
Impaired Loans, for the Year Ended December 31, 2011
| | | | | | | | | | | | | | | | | | | | |
| | | | | | | | | | | | Average | | | | |
| | | Unpaid | | | | | | | | | Unpaid | | | Interest | |
| | | Principal | | | Related | | | Related | | | Principal | | | Income | |
| | | Balance | | | Charge-offs | | | Allowance | | | Balance (2) | | | Recognized | |
Impaired loans without a related reserve: | | | | | | | | | | | | | | | | | | | | |
Commercial, financial, and agricultural | | $ | 6,621 | | | $ | 0 | | | | | | | $ | 11,159 | | | $ | 291 | |
Real estate - construction | | | 25,968 | | | | 26,833 | | | | | | | | 29,464 | | | | 761 | |
Real estate secured - residential | | | 17,540 | | | | 2,871 | | | | | | | | 16,473 | | | | 788 | |
Real estate secured - commercial | | | 35,490 | | | | 33,979 | | | | | | | | 41,612 | | | | 1,479 | |
Consumer | | | 0 | | | | 0 | | | | | | | | 37 | | | | 4 | |
| | | | | | | | | | | | | | | | | | | | |
Total impaired loans without a related reserve | | | 85,619 | (1) | | | 63,683 | | | | | | | | 98,745 | | | | 3,323 | |
| | | | | | | | | | | | | | | | | | | | |
Impaired loans with a related reserve: | | | | | | | | | | | | | | | | | | | | |
Commercial, financial, and agricultural | | | 6,870 | | | | 0 | | | $ | 3,421 | | | | 9,085 | | | | 239 | |
Real estate - construction | | | 15,015 | | | | 6,598 | | | | 2,243 | | | | 22,022 | | | | 307 | |
Real estate secured - residential | | | 16,227 | | | | 1,084 | | | | 2,807 | | | | 15,733 | | | | 558 | |
Real estate secured - commercial | | | 53,288 | | | | 19,194 | | | | 11,871 | | | | 59,222 | | | | 2,224 | |
Consumer | | | 658 | | | | 0 | | | | 654 | | | | 202 | | | | 8 | |
| | | | | | | | | | | | | | | | | | | | |
Total impaired loans with a related reserve | | | 92,058 | (2) | | | 26,876 | | | | 20,996 | | | | 106,264 | | | | 3,336 | |
| | | | | | | | | | | | | | | | | | | | |
Total impaired loans: | | | | | | | | | | | | | | | | | | | | |
Commercial, financial, and agricultural | | | 13,491 | | | | 0 | | | | 3,421 | | | | 20,244 | | | | 530 | |
Real estate - construction | | | 40,983 | | | | 33,431 | | | | 2,243 | | | | 51,486 | | | | 1,068 | |
Real estate secured - residential | | | 33,767 | | | | 3,955 | | | | 2,807 | | | | 32,206 | | | | 1,346 | |
Real estate secured - commercial | | | 88,778 | | | | 53,173 | | | | 11,871 | | | | 100,834 | | | | 3,703 | |
Consumer | | | 658 | | | | 0 | | | | 654 | | | | 239 | | | | 12 | |
| | | | | | | | | | | | | | | | | | | | |
Total impaired loans | | $ | 177,677 | | | $ | 90,559 | | | $ | 20,996 | | | $ | 205,009 | | | $ | 6,659 | |
| | | | | | | | | | | | | | | | | | | | |
| (1) | $48,234 of the $85,619 total impaired loans without a related reserve represents loans that had been written down to the fair value of the underlying collateral through direct charge-offs of $63,683. |
| (2) | Average unpaid principal balance is calculated based on daily balances. |
Modifications
As of December 31, 2011
Loans that were modified as troubled debt restructurings during the twelve month period ended December 31, 2011 for which there was a subsequent payment default are as follows.
| | | | | | | | | | | | |
| | | | | | Pre-Modification | | | Post-Modification | |
| | | Number of | | | Outstanding | | | Outstanding | |
| | | Loans | | | Recorded Investment | | | Recorded Investment | |
Troubled Debt Restructurings | | | | | | | | | | | | |
Commercial, financial, and agricultural | | | 2 | | | $ | 531 | | | $ | 485 | |
Real estate - construction | | | 4 | | | | 3,902 | | | | 3,902 | |
Real estate secured - residential | | | 53 | | | | 11,312 | | | | 11,158 | |
Real estate secured - commercial | | | 8 | | | | 8,729 | | | | 8,717 | |
Consumer | | | 4 | | | | 654 | | | | 570 | |
| | | | | | | | |
| | | Number of | | | | |
| | | Loans | | | Recorded Investment | |
Troubled Debt Restructurings that | | | | | | | | |
Subsequently Defaulted within 12 months after restructuring | | | | | | | | |
Commercial, financial, and agricultural | | | 4 | | | $ | 3,009 | |
Real estate - construction | | | 1 | | | | 298 | |
Real estate secured - residential | | | 5 | | | | 1,096 | |
Real estate secured - commercial | | | 8 | | | | 34,471 | |
Consumer | | | 1 | | | | 484 | |
96
Troubled debt restructurings are considered to be impaired loans and for purposes of establishing the allowance for credit losses are evaluated for impairment giving consideration to the impact of the restructured loan terms on the present value of the loan’s expected cash flows. Impairment of troubled debt restructurings that have subsequently defaulted may also be measured based on the loan’s observable market price or the fair value of collateral if the loan is collateral-dependent. Charge-offs may also be recognized on troubled debt restructurings that have subsequently defaulted. Loans that were modified as troubled debt restructurings during the twelve months periods ended December 31, 2011 and 2010 for which there was a subsequent payment default, were not material.
The changes in the accretable discount related to the credit impaired acquired loans are as follows:
| | | | |
Balance at December 31, 2010 | | $ | 0 | |
Abington acquisition | | | 5,800 | |
Accretion recognized, to date | | | (919 | ) |
Net reclassification from accretable to non-accretable | | | 0 | |
| | | | |
Balance at December 31, 2011 | | $ | 4,881 | |
| | | | |
6. Allowance for Loan and Lease Losses
| | | | | | | | | | | | |
| | | 2011 | | | 2010 | | | 2009 | |
Balance - January 1, | | $ | 191,834 | | | $ | 172,368 | | | $ | 113,749 | |
Provision charged to operating expense | | | 110,000 | | | | 163,000 | | | | 188,000 | |
Charge-offs | | | (135,245 | ) | | | (162,135 | ) | | | (143,341 | ) |
Recoveries | | | 21,511 | | | | 18,601 | | | | 13,960 | |
| | | | | | | | | | | | |
Net charge-offs | | | (113,734 | ) | | | (143,534 | ) | | | (129,381 | ) |
| | | | | | | | | | | | |
Balance - December 31, | | $ | 188,100 | | | $ | 191,834 | | | $ | 172,368 | |
| | | | | | | | | | | | |
7. Premises and Equipment
| | | | | | | | | | |
At December 31, | | 2011 | | | 2010 | | | Useful Life
(in years) |
Land | | $ | 29,651 | | | $ | 29,647 | | | |
Buildings | | | 122,507 | | | | 121,682 | | | 10 - 40 |
Furniture and equipment | | | 89,240 | | | | 91,918 | | | 3 - 5 |
Leasehold improvements | | | 42,187 | | | | 37,074 | | | 10 - 25 |
Land improvements | | | 3,633 | | | | 3,478 | | | 3 - 10 |
| | | | | | | | | | |
| | | 287,218 | | | | 283,799 | | | |
Less: accumulated depreciation and amortization | | | 118,836 | | | | 118,242 | | | |
| | | | | | | | | | |
| | $ | 168,382 | | | $ | 165,557 | | | |
| | | | | | | | | | |
| | | | | | | | | | | | |
| | | 2011 | | | 2010 | | | 2009 | |
Depreciation and amortization expense | | $ | 13,267 | | | $ | 13,732 | | | $ | 14,923 | |
97
All subsidiaries lease certain banking branches and equipment under operating leases that expire on various dates through 2030. Renewal options generally are available for periods up to ten years. Minimum future rental commitments under non-cancelable leases, as of December 31, 2011, were as follows:
| | | | |
| | | Operating
Leases | |
2012 | | $ | 17,607 | |
2013 | | | 16,800 | |
2014 | | | 15,292 | |
2015 | | | 13,921 | |
2016 | | | 13,468 | |
Subsequent years | | | 68,157 | |
| | | | |
| | $ | 145,245 | |
| | | | |
| | | | | | | | | | | | |
| | | 2011 | | | 2010 | | | 2009 | |
Rent expense | | $ | 15,639 | | | $ | 13,734 | | | $ | 13,621 | |
8. Goodwill and Other Intangibles
Amortizing Intangible Assets
| | | | | | | | | | | | | | | | |
| | | December 31, 2011 | | | December 31, 2010 | |
| | | Gross Carying
Amount | | | Accumulated
Amortization | | | Gross Carying
Amount | | | Accumulated
Amortization | |
Core deposit intangibles | | $ | 61,332 | | | $ | (40,520 | ) | | $ | 59,199 | | | $ | (33,762 | ) |
Customer lists | | | 17,477 | | | | (9,252 | ) | | | 15,900 | | | | (7,309 | ) |
Favorable lease adjustments | | | 393 | | | | (349 | ) | | | 393 | | | | (346 | ) |
| | | | | | | | | | | | | | | | |
Total amortizing intangible assets | | $ | 79,202 | | | $ | (50,121 | ) | | $ | 75,492 | | | $ | (41,417 | ) |
| | | | | | | | | | | | | | | | |
| | | | |
Aggregate Amortization Expense for the Year Ended December 31: | | | | |
2011 | | $ | 8,705 | |
Estimated Amortization Expense for the Year Ended December 31: | | | | |
2012 | | $ | 8,537 | |
2013 | | | 7,137 | |
2014 | | | 5,304 | |
2015 | | | 3,974 | |
2016 | | | 2,281 | |
Goodwill
There was no activity in the goodwill account during 2011.
Goodwill is allocated to Susquehanna’s reporting units at the date the goodwill is initially recorded. Once goodwill has been allocated to the reporting units, it generally no longer retains it identification with a particular acquisition, but instead becomes identified with the reporting unit as a whole. As a result, all of the fair value of each reporting unit is available to support the value of goodwill allocated to the unit. Goodwill impairment testing is performed at the reporting unit level, one level below the business segment.
The goodwill impairment analysis is done in two steps. The first step requires a comparison of the fair value of the individual reporting unit to its carrying value, including goodwill. If the fair value of the reporting unit is in excess of the carrying value, the related goodwill is considered not to be impaired and no further analysis is
98
necessary. If the carrying value of the reporting unit exceeds the fair value, there is an indication of potential impairment and a second step of testing is performed to measure the amount of impairment, if any, for the reporting unit.
Susquehanna assesses goodwill for impairment on an annual basis, or more often if events or circumstances indicate that goodwill may be impaired. This assessment requires significant judgment and analysis.
Susquehanna performed its annual goodwill impairment assessments in the second quarter of 2011 and determined that the fair value of each of its reporting units exceeded its book value, and that there was no goodwill impairment. However, taking into consideration qualitative indicators for testing goodwill for impairment and current market conditions, Susquehanna determined it would be appropriate to perform an interim assessment of its bank reporting unit’s goodwill at September 30, 2011. As a result of this interim assessment, Susquehanna determined that there was no goodwill impairment as each reporting unit’s fair value exceeded its carrying value.
Bank Reporting Unit
Goodwill assigned to the bank reporting unit at both December 31, 2011 and the annual assessment date, May 31, 2011, was $915,421. Fair value of the bank reporting unit was determined using a market approach, which uses prices and other relevant information reported for market transactions involving recent non-distressed sales of comparable financial institutions in Susquehanna’s market to value the bank reporting unit. Susquehanna considered two key ratios in measuring the fair value of the bank reporting unit: price to book and price to tangible book. The following table shows the ratios used at December 31, 2011 and May 31, 2011 and 2010.
| | | | | | | | | | | | |
| | | Interim | | | Annual | | | Annual | |
Ratio | | December 31, 2011 | | | May 31, 2011 | | | May 31, 2010 | |
Price to book | | | 1.36X | | | | 1.36X | | | | 1.41X | |
Price to tangible book | | | 1.60X | | | | 1.60X | | | | 1.60X | |
Fair value of the bank reporting unit exceeded carrying value by 16.0% at December 31, 2011, by 13.0% at May 31, 2011, and by 14.2% at May 31, 2010. Since the fair value of the reporting unit is in excess of the carrying value, the related goodwill is considered not to be impaired and the second step in the analysis is unnecessary.
Wealth Management Reporting Unit
Goodwill assigned to the wealth management reporting unit at both December 31, 2011 and the annual assessment date, May 31, 2011 was $82,746. Fair value of the wealth management reporting unit was determined utilizing the market approach and the income approach. The market approach measures the fair value of the reporting unit using transaction multiples reported for market transactions involving comparable wealth management business. The income approach measures the fair value of the reporting unit by converting the reporting unit’s future earnings over ten years, assuming a weighted increase in the reporting unit’s revenues and a weighted increase in the reporting unit’s expenses, to a single present amount, discounted. In keeping with market participant’s current valuations of wealth management institutions, Susquehanna predominantly uses the income approach. The following table shows the factors used in the income approach at May 31, 2011 and 2010.
| | | | | | | | |
| | | Annual | | | Annual | |
Factors | | May 31, 2011 | | | May 31, 2010 | |
Discount rate | | | 17.5 | % | | | 17.5 | % |
Weighted-average increase in revenues | | | 6.0 | % | | | 6.0 | % |
Weighted-average increase in expenses | | | 5.0 | % | | | 5.0 | % |
99
Fair value of the wealth management reporting unit exceeded carrying value by 59.7% at May 31, 2011 and by 53.6% at May 31, 2010. Since the fair value of the reporting unit is in excess of the carrying value, the related goodwill is considered not to be impaired and the second step in the analysis is unnecessary.
Property and Casualty Insurance Reporting Unit
Goodwill assigned to the property and casualty insurance reporting unit at both December 31, 2011 and the annual assessment date, May 31, 2011 was $17,177. Fair value of the property and casualty insurance reporting unit was determined using the market approach, which measures the fair value of the reporting unit using recent sales of comparable property and casualty insurance companies in Susquehanna’s market. Susquehanna uses two key ratios to measure the fair value of the property and casualty insurance reporting unit: average price to book and median price to earnings. The following table shows the ratios used at May 31, 2011 and 2010.
| | | | | | | | |
| | | Annual | | | Annual | |
Ratio | | May 31, 2011 | | | May 31, 2010 | |
Average price to book | | | 1.23X | | | | 1.06X | |
Median price to earnings | | | 13.8X | | | | 8.5X | |
Fair value of the property and casualty insurance reporting unit exceeded carrying value by 48.4% at May 31, 2011 and by 33.9% at May 31, 2010. Since the fair value of the reporting unit is in excess of the carrying value, the related goodwill is considered not to be impaired and the second step in the analysis is unnecessary.
9. Deposits
| | | | | | | | |
At December 31, | | 2011 | | | 2010 | |
Noninterest-bearing: | | | | | | | | |
Demand | | $ | 1,569,811 | | | $ | 1,372,235 | |
Interest-bearing: | | | | | | | | |
Interest-bearing demand | | | 4,439,488 | | | | 3,646,714 | |
Savings | | | 868,709 | | | | 767,852 | |
Time | | | 2,157,282 | | | | 2,168,503 | |
Time of $100 or more | | | 1,255,182 | | | | 1,235,903 | |
| | | | | | | | |
Total deposits | | $ | 10,290,472 | | | $ | 9,191,207 | |
| | | | | | | | |
10. Borrowings
Short-term Borrowings
Short-term borrowings and weighted-average interest rates at December 31 were as follows:
| | | | | | | | | | | | | | | | | | | | | | | | |
| | | 2011 | | | 2010 | | | 2009 | |
| | | Amount | | | Rate | | | Amount | | | Rate | | | Amount | | | Rate | |
Securities sold under repurchase agreements (1) | | $ | 292,616 | | | | 0.33 | % | | $ | 306,423 | | | | 0.46 | % | | $ | 333,803 | | | | 0.68 | % |
Federal funds purchased | | | 318,000 | | | | 0.20 | | | | 458,000 | | | | 0.25 | | | | 200,000 | | | | 0.19 | |
Treasury tax and loan notes | | | 0 | | | | 0.00 | | | | 6,200 | | | | 0.00 | | | | 6,900 | | | | 0.00 | |
Federal Reserve term auction facility (2) | | | 0 | | | | 0.00 | | | | 0 | | | | 0.00 | | | | 500,000 | | | | 0.25 | |
Swap Collateral | | | 2,690 | | | | 0.04 | | | | 0 | | | | 0.00 | | | | 0 | | | | 0.00 | |
| | | | | | | | | | | | | | | | | | | | | | | | |
Total short-term borrowings | | $ | 613,306 | | | | | | | $ | 770,623 | | | | | | | $ | 1,040,703 | | | | | |
| | | | | | | | | | | | | | | | | | | | | | | | |
100
| (1) | Securities sold under agreements to repurchase are classified as secured short-term borrowings and are recorded at the amount of cash received in connection with the transaction. The securities underlying the repurchase agreements remain in available-for-sale investment securities. |
| (2) | The final auction was held on March 8, 2010. |
At December 31, 2011, Susquehanna Bank had aggregate availability under federal funds lines totaling $987,000 and collateralized availability at the Federal Reserve’s Discount Window of $983,905.
Federal Home Loan Bank Borrowings
| | | | | | | | |
At December 31, | | 2011 | | | 2010 | |
Due 2011, .38% to 4.98% | | $ | 0 | | | $ | 415,190 | |
Due 2012, .14% to .25% | | | 900,000 | | | | 0 | |
Due 2012, 2.99% to 4.60% | | | 5,743 | | | | 221,061 | |
Due 2013, 2.05% to 5.94% | | | 17,940 | | | | 70,047 | |
Due 2014, 4.47% to 6.51% | | | 10,967 | | | | 161,077 | |
Due 2015, 3.65% to 5.22% | | | 28,074 | | | | 148,128 | |
Due 2016, 4.14% to 5.65% | | | 0 | | | | 56,253 | |
Due 2017 through 2026, 1.00% to 5.24% | | | 8,296 | | | | 29,864 | |
| | | | | | | | |
| | $ | 971,020 | | | $ | 1,101,620 | |
| | | | | | | | |
Susquehanna Bank is a member of the Federal Home Loan Bank of Pittsburgh and, as such, can take advantage of FHLB programs for overnight and term advances at published daily rates. Under the terms of a blanket collateral agreement, advances from the FHLB are collateralized by qualifying first mortgages. In addition, all of the bank’s stock in the FHLB is pledged as collateral for such debt. Advances available under this agreement are limited by available and qualifying collateral and the amount of FHLB stock held by the bank.
Under this program, Susquehanna’s banking subsidiary had line-of-credit availability of $2,270,072 and $2,739,071 at December 31, 2011 and 2010, respectively. Excluding purchase-accounting adjustments, $967,401 and $1,104,159 was outstanding at December 31, 2011 and 2010, respectively. At December 31, 2011, Susquehanna Bank could have borrowed an additional $715,381 based on qualifying collateral, and $1,282,899 more could have been borrowed provided that additional collateral would have been pledged. Such additional borrowings would have required the bank to increase its investment in FHLB stock by $27,369.
Long-term Debt and Junior Subordinated Debentures (1)
| | | | | | | | | | | | | | | | |
| | | 2011 | | | 2010 | |
| | | Amount | | | Rate | | | Amount | | | Rate | |
Subordinated notes due 2012 | | $ | 75,000 | | | | 6.05 | % | | $ | 75,000 | | | | 6.05 | % |
Subordinated notes due 2014 | | | 75,000 | | | | 2.11 | | | | 75,000 | | | | 2.11 | |
Subordinated note due 2018 | | | 25,000 | | | | 4.91 | (6) | | | 25,000 | | | | 4.91 | (6) |
Other | | | 1,030 | | | | n/m | (8) | | | 1,037 | | | | n/m | (8) |
Junior subordinated notes due 2027 | | | 16,521 | | | | 9.80 | (2) | | | 16,601 | | | | 9.80 | (2) |
Junior subordinated notes due 2032 | | | 5,785 | | | | 3.84 | (2) | | | 5,805 | | | | 3.92 | (2) |
Junior subordinated notes due 2036 (3) | | | 51,547 | | | | 6.39 | | | | 51,547 | | | | 6.39 | |
Junior subordinated notes due 2057 (4) | | | 125,010 | | | | 9.38 | | | | 125,000 | | | | 9.38 | |
Junior subordinated notes due 2033 (5) | | | 15,464 | | | | 3.64 | | | | 15,464 | | | | 3.64 | |
Junior subordinated notes due 2033 (5) | | | 15,464 | | | | 3.13 | | | | 15,464 | | | | 3.13 | |
Junior subordinated notes due 2036 (5) | | | 10,310 | | | | 3.14 | (2) | | | 10,264 | | | | 8.10 | (2) |
Junior subordinated notes due 2036 (5) | | | 9,576 | | | | 7.97 | (2) | | | 9,418 | | | | 7.92 | (2) |
Junior subordinated notes due 2037 (5) | | | 20,537 | | | | 8.09 | (2) | | | 20,215 | | | | 8.04 | (2) |
Junior subordinated notes due 2033 (5) | | | 3,093 | | | | 3.54 | | | | 3,093 | | | | 3.54 | |
Junior subordinated notes due 2040 (7) | | | 50,010 | | | | 11.00 | | | | 50,010 | | | | 11.00 | |
| | | | | | | | | | | | | | | | |
| | $ | 499,347 | | | | | | | $ | 498,918 | | | | | |
| | | | | | | | | | | | | | | | |
101
| (1) | The notes, except “Other,” require interest-only payments throughout their term with the entire principal balance paid at maturity. |
| (2) | Reflects the effect of purchase accounting adjustments. |
| (3) | On April 19, 2006, Susquehanna completed a private placement to an institutional investor of $50,000 of fixed/floating rate trust preferred securities through a newly formed Delaware trust affiliate, Susquehanna TP Trust 2006-1. The trust preferred securities mature in June 2036, are redeemable at Susquehanna’s option beginning after five years, and bear interest initially at a rate of 6.392% per annum through the interest payment date in June 2011 and, after the interest payment date in June 2011, at a rate per annum equal to the three-month LIBOR plus 1.33%. The proceeds from the sale of the trust preferred securities were used by the Trust to purchase Susquehanna’s fixed/floating rate junior subordinated notes. The net proceeds from the sale of the notes were used to finance the acquisition of Minotola National Bank. |
| (4) | On December 12, 2007, Susquehanna issued $125,000 of retail hybrid trust preferred notes through a newly form Delaware statutory trust, Susquehanna Capital I. The only assets of the issuer are Capital Efficient Notes (“CENts”) issued by Susquehanna. The notes mature in December 2057, are redeemable at Susquehanna’s option beginning after five years, and bear interest initially at a rate of 9.375% per annum through the interest payment date in December 2037 and, after the interest payment date in December 2037, at a rate per annum equal to the three-month LIBOR plus 5.455%. The proceeds from the sale of the CENts were used to replenish cash reserves used to pay for the cash portion of the Community Banks acquisition and for general corporate purposes. |
| (5) | As a result of the Community acquisition, Susquehanna assumed subordinated debentures with a fair value of $69,726 issued by Community to six statutory trusts. The trust preferred securities issued by the trusts are callable on dates specified in the individual indentures. The notes, as presented in this table, include purchase accounting adjustments. |
| (6) | On December 31, 2008, Susquehanna issued a $25,000 subordinated note to another financial institution. The note bears interest at the ninety-day LIBOR plus 4.5% and matures on December 31, 2018. |
| (7) | On March 16, 2010, Susquehanna Capital II, a Delaware statutory trust, sold to the public $50,000 aggregate principal amount of 11% Cumulative Trust Preferred Securities, Series II and used the proceeds from those sales to fund its purchase of $50,010 of 11% Junior Subordinated Deferrable Interest |
Debentures, Series II issued by Susquehanna. The subordinated debentures are unsecured and rank equally in right of payment with Susquehanna’s existing series of junior subordinated debt securities. Interest on the subordinated debentures is payable semi-annually in arrears on each March 23 and September 23,beginning September 23, 2010, unless Susquehanna defers payment. Susquehanna may elect to redeem any or all of the subordinated debentures at any time on or after March 23, 2015. The maturity date of the subordinated debentures is March 23, 2040.
11. Shareholders’ Equity
Repurchase of Warrant from the U.S. Treasury
On January 19, 2011, Susquehanna repurchased the warrant that was issued to the U.S. Treasury on December 12, 2008 in conjunction with our participation in the TARP Capital Purchase Program.
The warrant entitled the U.S. Treasury to purchase up to approximately 3,028 shares of Susquehanna’s common stock at a price of $14.86 per share. We paid $5.269 to the U.S. Treasury to repurchase the warrant. The repurchase of the warrant concluded Susquehanna’s participation in the U.S. Treasury’s Capital Purchase Program.
Preferred Stock
On December 12, 2008, Susquehanna sold $300,000 of Fixed Rate Cumulative Perpetual Preferred Stock, Series A, no par value per share to the U.S. Treasury. On April 21, 2010, Susquehanna redeemed $200,000 of the
102
preferred stock, and on December 21, 2010, Susquehanna redeemed the remaining $100,000 of preferred stock. As a result of the redemption, Susquehanna accelerated the accretion of the associated discount, which reduced net income applicable to common shareholders by $5,888 in 2010.
Common Stock
On March 15, 2010, Susquehanna completed an offering of 43,125 shares of its common stock, par value $2.00 per share, at a public offering price of $8.00 per share. Proceeds from the offering, net of underwriting discounts and commissions of $17,250 and expenses of $409, totaled $327,340.
Treasury Stock
Susquehanna’s stock option plan permits option grantees to meet certain of their tax obligations through sales of the shares of Susquehanna. During 2011, grantees elected to satisfy their income tax obligations with respect to the stock options by having Susquehanna repurchase shares up to an amount that does not exceed the minimum applicable rate for federal (including FICA), state and local tax liabilities. Shares are repurchased at market price by Susquehanna and recorded as treasury stock.
12. Income Taxes
The components of the provision for income taxes were as follows:
| | | | | | | | | | | | |
| | | 2011 | | | 2010 | | | 2009 | |
Current: | | | | | | | | | | | | |
Federal | | $ | (13,723 | ) | | $ | 33,468 | | | $ | 24,816 | |
State | | | 481 | | | | 1,880 | | | | (524 | ) |
| | | | | | | | | | | | |
Total current | | | (13,242 | ) | | | 35,348 | | | | 24,292 | |
| | | | | | | | | | | | |
Deferred: | | | | | | | | | | | | |
Federal | | | 4,408 | | | | (33,304 | ) | | | (34,901 | ) |
State | | | (433 | ) | | | (887 | ) | | | (23 | ) |
| | | | | | | | | | | | |
Total deferred | | | 3,975 | | | | (34,191 | ) | | | (34,924 | ) |
| | | | | | | | | | | | |
Total income tax expense (benefit) | | $ | (9,267 | ) | | $ | 1,157 | | | $ | (10,632 | ) |
| | | | | | | | | | | | |
The provision for income taxes differs from the amount derived from applying the statutory income tax rate to income before income taxes as follows:
| | | | | | | | | | | | | | | | | | | | | | | | |
| | | 2011 (1) | | | 2010 (1) | | | 2009 (1) | |
| | | Amount | | | Rate | | | Amount | | | Rate | | | Amount | | | Rate | |
Provision at statutory rates | | $ | 15,973 | | | | 35.00 | % | | $ | 11,552 | | | | 35.00 | % | | $ | 715 | | | | 35.00 | % |
Tax-advantaged income | | | (10,524 | ) | | | (23.06 | ) | | | (9,994 | ) | | | (30.28 | ) | | | (10,133 | ) | | | (496.14 | ) |
Bargain purchase accounting | | | (13,700 | ) | | | (30.02 | ) | | | 0 | | | | 0.00 | | | | 0 | | | | 0.00 | |
Other, net | | | (1,016 | ) | | | (2.23 | ) | | | (401 | ) | | | (1.21 | ) | | | (1,214 | ) | | | (59.42 | ) |
| | | | | | | | | | | | | | | | | | | | | | | | |
Total | | $ | (9,267 | ) | | | (20.31 | %) | | $ | 1,157 | | | | 3.51 | % | | $ | (10,632 | ) | | | (520.56 | %) |
| | | | | | | | | | | | | | | | | | | | | | | | |
| (1) | The differences from the statutory rates expressed as percentages vary significantly from year to year due to the fluctuation of pre-tax book income in 2011, 2010, and 2009, respectively. Additionally, the differences from the statutory rates vary between 2011 and 2010 due to the tax effect of the Abington bargain purchase accounting in 2011. |
103
Accounting for income taxes requires the recognition of deferred tax assets and liabilities for the expected future tax consequences of events that have been included in the financial statements or tax return. Under this method, deferred tax assets and liabilities are determined based on the difference between the financial statement and tax bases of assets and liabilities using enacted tax rates in effect for the year in which the differences are expected to reverse.
The components of the net deferred tax asset (liability) as of December 31 were as follows:
| | | | | | | | |
| | | 2011 | | | 2010 | |
Deferred tax assets: | | | | | | | | |
Reserve for loan losses | | $ | 82,985 | | | $ | 81,700 | |
Deferred compensation | | | 8,231 | | | | 6,484 | |
Nonaccrual loan interest | | | 5,099 | | | | 5,540 | |
Federal net operating losses | | | 4,868 | | | | 0 | |
State net operating losses | | | 13,259 | | | | 17,489 | |
State alternative minimum tax credit carryover | | | 300 | | | | 300 | |
Post-retirement benefits | | | 5,442 | | | | 4,965 | |
Unrealized (gains) and losses | | | 7,838 | | | | 18,591 | |
Underfunded status of defined benefit pension or other postretirement benefit plans | | | 18,025 | | | | 13,935 | |
Other assets | | | 10,137 | | | | 4,556 | |
| | | | | | | | |
Total deferred tax assets | | | 156,184 | | | | 153,560 | |
| | | | | | | | |
Deferred tax liabilities: | | | | | | | | |
Prepaid pension expense | | | (11,932 | ) | | | (13,380 | ) |
Amortization of market value purchase adjustments | | | (19,430 | ) | | | (14,420 | ) |
Deferred loan costs | | | (5,639 | ) | | | (4,886 | ) |
Premises and equipment | | | (4,008 | ) | | | (7,076 | ) |
Lease transaction adjustments, net | | | (130,143 | ) | | | (136,834 | ) |
Other liabilities | | | (3,485 | ) | | | (5,158 | ) |
| | | | | | | | |
Total deferred tax liabilities | | | (174,637 | ) | | | (181,754 | ) |
| | | | | | | | |
Net deferred liability before valuation allowance | | | (18,453 | ) | | | (28,194 | ) |
Valuation allowance | | | (1,030 | ) | | | (262 | ) |
| | | | | | | | |
Net deferred tax liabilities | | $ | (19,483 | ) | | $ | (28,456 | ) |
| | | | | | | | |
The deferred tax asset and deferred tax liability balances as of December 31were included in the following Consolidated Balance Sheet line items:
| | | | | | | | |
| | | 2011 | | | 2010 | |
Other assets | | $ | 6,344 | | | $ | 5,273 | |
Deferred taxes | | | (25,827 | ) | | | (33,729 | ) |
| | | | | | | | |
| | $ | (19,483 | ) | | $ | (28,456 | ) |
| | | | | | | | |
As of December 31, 2011, Susquehanna has federal net operating losses remaining of $13,908 which begin to expire in 2030. As a result of the Abington ownership changes in 2011, Section 382 of the Internal Revenue Code places an annual limitation on the amount of federal net operating loss (“NOL”) carryforwards which the Company may utilize. Additionally, Section 382 of the Internal Revenue Code limits the Company’s ability to utilize certain tax deductions due to the existence of a Net Unrealized Built-In Loss (“NUBIL”) at the time of the change in control. Consequently,$13,908 of the Company’s NOL carryforwards and the NUBIL acquired from the Abington acquisition are subject to annual limitations of $5,574.
104
As of December 31, 2011, Susquehanna has state net operating losses remaining of $641,304 which begin to expire in 2012. The valuation allowance relates to state net operating loss carryforwards and state tax credits for which realizability is uncertain. In assessing the realizability of the state net operating losses, management considers the scheduled reversal of deferred tax liabilities, projected future income and tax planning strategies.
The valuation allowance relates to state net operating loss carryforwards and state tax credits for which realizability is uncertain. In assessing the realizability of the state net operating losses, management considers the scheduled reversal of deferred tax liabilities, projected future income and tax planning strategies.
Uncertainty in Income Taxes
A reconciliation of the beginning and ending amount of unrecognized tax benefits is as follows:
| | | | |
Balance at January 1, 2009 | | $ | 2,240 | |
Increase based on tax positions related to the current year | | | 295 | |
Increase for tax positions of prior years | | | 0 | |
Decrease for tax positions of prior years | | | (34 | ) |
Decrease related to settlements with taxing authorities | | | 0 | |
Decrease related to expiration of statute of limitations | | | (381 | ) |
| | | | |
Balance at December 31, 2009 | | | 2,120 | |
Increase based on tax positions related to the current year | | | 462 | |
Increase for tax positions of prior years | | | 1,584 | |
Decrease for tax positions of prior years | | | 0 | |
Decrease related to settlements with taxing authorities | | | 0 | |
Decrease related to expiration of statute of limitations | | | (568 | ) |
| | | | |
Balance at December 31, 2010 | | | 3,598 | |
Increase based on tax positions related to the current year | | | 15 | |
Increase for tax positions of prior years | | | 0 | |
Decrease for tax positions of prior years | | | (259 | ) |
Decrease related to settlements with taxing authorities | | | 0 | |
Decrease related to expiration of statute of limitations | | | (1,311 | ) |
| | | | |
Balance at December 31, 2011 | | $ | 2,043 | |
| | | | |
Susquehanna has $2,043 of unrecognized tax benefits of which $1,534, if recognized, would affect the effective tax rate. Susquehanna does not anticipate a significant change to the total amount of unrecognized tax benefits within the next twelve months.
Susquehanna recognizes interest accrued and penalties related to unrecognized tax benefits in the income tax expense. During the twelve months ended December 31, 2011, 2010, and 2009, respectively, Susquehanna recognized ($240), ($11) and $129, respectively, in interest and penalties and had accrued $136, $376 and $387, respectively, for the payment of interest and penalties.
Susquehanna and its subsidiaries file income tax returns in the U.S. federal jurisdictions and various state jurisdictions. With few exceptions, Susquehanna is no longer subject to U.S. federal, state, and local examinations by tax authorities before 2007. As of December, 31, 2011, Susquehanna is under examination by the IRS and the authorities of certain states in which it has significant business operations.
105
13. Accumulated Other Comprehensive Loss
| | | | | | | | | | | | | | | | | | | | |
| | | Unrealized
Gains (Losses)
on Securities | | | Unrealized
Gains on
Recorded
Interests in
Securitized
Assets | | | Unrealized
Gains (Losses)
on Cash Flow
Hedges | | | Post-
retirement
Benefits | | | Accumulated
Other
Comprehensive
Loss | |
Balance at January 1, 2009 | | $ | (63,824 | ) | | $ | 4,406 | | | $ | (613 | ) | | $ | (25,279 | ) | | $ | (85,310 | ) |
Period change | | | 57,162 | | | | 2,515 | | | | 4,925 | | | | 1,011 | | | | 65,613 | |
| | | | | | | | | | | | | | | | | | | | |
Balance at December 31, 2009 | | | (6,662 | ) | | | 6,921 | | | | 4,312 | | | | (24,268 | ) | | | (19,697 | ) |
Period change | | | (6,457 | ) | | | (6,921 | ) | | | (23,447 | ) | | | (1,613 | ) | | | (38,438 | ) |
| | | | | | | | | | | | | | | | | | | | |
Balance at December 31, 2010 | | | (13,119 | ) | | | 0 | | | | (19,135 | ) | | | (25,881 | ) | | | (58,135 | ) |
Period change | | | 33,944 | | | | 0 | | | | (14,267 | ) | | | (7,596 | ) | | | 12,081 | |
| | | | | | | | | | | | | | | | | | | | |
Balance at December 31, 2011 | | $ | 20,825 | | | $ | 0 | | | $ | (33,402 | ) | | $ | (33,477 | ) | | $ | (46,054 | ) |
| | | | | | | | | | | | | | | | | | | | |
14. Financial Instruments with Off-balance-sheet Credit Risk
Susquehanna is part to financial instruments with off-balance-sheet risk in the normal course of business to meet the needs of its customers. These financial instruments include commitments to originate loans and standby letters of credit. The instruments involve, to varying degrees, elements of credit and interest-rate risk in excess of the amounts recognized in the consolidated financial statements. The contract or notional amount of those instruments reflects the extent of involvement Susquehanna has in particular classes of financial instruments. Susquehanna’s exposure to credit loss in the event of nonperformance by the other parties to the financial instruments for loan commitments and standby letters of credit is represented by the contractual amount of these instruments. Susquehanna uses the same credit policies for these instruments as it does for on-balance-sheet instruments.
Standby letters of credit are conditional commitments issued by Susquehanna to guarantee the performance by a customer to a third party. The credit risk involved in issuing letters of credit is essentially the same as that involved in extending loan facilities to customers.
Commitments to originate loans are agreements to lend to a customer provided there is no violation of any condition established by the contract. Commitments generally have fixed expiration dates or other termination clauses and may require payment of a fee. Since many of the commitments are expected to expire without being drawn upon, the total commitment does not necessarily represent future cash requirements. Susquehanna evaluates each customer’s credit worthiness on a case-by-case basis. The amount of collateral obtained, if deemed necessary by Susquehanna upon extension of credit, is based upon management’s credit evaluation of the borrower.
Financial instruments whose contractual amounts represent off-balance-sheet credit risk at December 31, 2011 and 2010 were as follows:
| | | | | | | | |
| | | 2011 | | | 2010 | |
Standby letters of credit | | $ | 296,134 | | | $ | 305,477 | |
Real estate commitments - commercial | | | 205,036 | | | | 256,339 | |
Real estate commitments - residential | | | 170,447 | | | | 152,753 | |
Unused portion of home equity lines held by VIEs | | | 92,883 | | | | 101,251 | |
Unused portion of home equity lines | | | 845,276 | | | | 737,778 | |
Other commitments | | | 32,603 | | | | 33,226 | |
All other commercial, financial, and agricultural commitments | | | 785,987 | | | | 734,879 | |
15. Contingent Liabilities
106
In September 2010, Lehman Brothers Special Financing Inc. (“LBSF”) filed suit in the United States Bankruptcy Court for the Southern District of New York against certain indenture trustees, certain special-purpose entities (issuers) and a class of noteholders and trust certificate holders who received distributions from the trustees, including Susquehanna, to recover funds that were allegedly improperly paid to the noteholders in forty-seven separate collateralized debt obligation transactions (“CDO”). In June 2007, two affiliates of Susquehanna each purchased $5,000 in AAA rated Class A Notes of a CDO offered by Lehman Brothers Inc. Concurrently with the issuance of the notes, the issuer entered into a credit swap with LBSF. Lehman Brothers Holdings Inc. (“LBHI”) guaranteed LBSF’s obligations to the issuer under the credit swap. When LBHI filed for bankruptcy in September 2008, an Event of Default under the indenture occurred, and the trustee declared the notes to be immediately due and payable. Susquehanna was repaid its principal on the notes in September 2008. This legal proceeding is in the early stages of discovery; thus it is not yet possible for Susquehanna to estimate potential loss, if any. Management, after consultation with legal counsel, currently does not anticipate that the aggregate liability, if any, arising out of this proceeding, will have a material adverse effect on Susquehanna’s financial position, or cash flows, although, at the present time, management is not in a position to determine whether such proceeding will have a material adverse effect on Susquehanna’s results of operations in any future quarterly reporting period.
16. Capital Adequacy
Risk-based capital ratios, based upon guidelines adopted by bank regulators in 1989, focus upon credit risk. Assets and certain off-balance-sheet items are segmented into one of four broad risk categories and weighted according to the relative percentage of credit risk assigned by the regulatory authorities. Off-balance-sheet instruments are converted into a balance sheet credit equivalent before being assigned to one of the four risk-weighted categories. To supplement the risk-based capital ratios, the regulators issued a minimum leverage ratio guideline (Tier 1 capital as a percentage of average assets less excludable intangibles).
Capital elements are segmented into two tiers. Tier 1 capital represents shareholders’ equity plus junior subordinated debentures reduced by excludable intangibles. Tier 2 capital represents certain allowable long-term subordinated debt, the portion of the allowance for loan and lease losses and the allowance for credit losses on off-balance sheet credit exposures equal to 1.25% of risk-adjusted assets, and 45% of the unrealized gain on equity securities. The sum of Tier 1 capital and Tier 2 capital is “total risk-based capital.”
The following table presents these capital ratios for Susquehanna on a consolidated basis. Susquehanna has leverage and risk-weighted ratios well in excess of regulatory minimums and is considered “well capitalized” under regulatory guidelines.
| | | | | | | | | | | | | | | | |
| | | At
December 31,
2011 | | | At
December 31,
2010 | | | Well-
capitalized
Threshold | | | Preliminary
Minimum
Basel III
Requirements | |
Tangible Common Ratio (1) | | | 8.50 | % | | | 7.56 | % | | | N/A | | | | N/A | |
Tier 1 Common Ratio | | | 10.76 | % | | | 9.58 | % | | | N/A | | | | 7.0 | % |
Leverage Ratio | | | 10.73 | % | | | 10.27 | % | | | 5.0 | % | | | 4.0 | % |
Tier 1 Capital Ratio | | | 13.65 | % | | | 12.65 | % | | | 6.0 | % | | | 8.5 | % |
Total Risk-based Capital Ratio | | | 15.41 | % | | | 14.72 | % | | | 10.0 | % | | | 10.5 | % |
| (1) | Includes deferred tax liability associated with intangibles of $40,700 for 2011 and $42,478 for 2010. |
17. Share-based Compensation
Susquehanna implemented an Equity Compensation Plan (“Compensation Plan”) in 1996 under which Susquehanna may have granted options to its employees and directors for up to 2,463 shares of common stock.
107
Under the Compensation Plan, the exercise price of each nonqualified option equaled the market price of Susquehanna’s stock on the date of grant, and an option’s maximum term was ten years.
Options were granted upon approval of the Board of Directors and typically vested one-third at the end of years three, four, and five. The exercise prices associated with the options ranged from $13.00 per share to $25.47 per share. This Compensation Plan expired in 2006.
In May 2005, Susquehanna’s shareholders approved the 2005 Equity Compensation Plan, as amended, (“the 2005 Plan”) and approved an amendment and restatement of the plan in May 2009. Subject to adjustments in certain circumstances, the 2005 Plan authorized up to 3,500 share of common stock for issuance. Incentives under the 2005 Plan consist of incentive stock options, non-qualified stock options, stock appreciation rights, restricted stock options, restricted stock grants, restricted stock unit grants, and dividend equivalents on restricted stock units. The exercise price of any incentive granted under the 2005 Plan is the fair market value of Susquehanna’s stock on the date that the incentive is granted. The exercise period for stock options may not exceed ten years, and the options typically vest one-third at the end of years three, four, and five. Restricted stock vests one-third at the end of years one, two, and three; while restricted stock units vest at the end of three years. The fair value of restricted stock and restricted stock units is the fair market value of Susquehanna’s stock on the date that the incentives are granted. The fair value of option award is estimated on the date of grant using the Black-Scholes-Merton model.
For the twelve months ended December 31, 2011, 2010, and 2009, share-based compensation expense totaling $3,139, $2,223, and $921, respectively, was included in salaries and employee benefits expense in the Consolidated Statements of Income. In addition, as of December 31, 2011, there was $1,378 of aggregate unrecognized compensation expense related to non-vested share-based compensation arrangements. That expense is expected to be recognized through 2016.
Stock Options
The following table presents the assumptions used to estimate the fair value of options granted in 2011, 2010, and 2009, and the resultant fair values. Expected volatilities are based upon the historical volatility of Susquehanna stock, using the monthly high stock price over the past ten years. The expected term is based upon historical exercise behavior of all employees and directors. The risk-free rate is based upon zero coupon treasury rates in effect on the grant date of the options.
| | | | | | | | | | | | |
| | | 2011 | | | 2010 | | | 2009 | |
Volatility | | | 37.09 | % | | | 32.50 | % | | | 24.74 | % |
Expected dividend yield | | | 4.00 | % | | | 4.00 | % | | | 6.50 | % |
Expected term (in years) | | | 7.0 | | | | 7.0 | | | | 7.0 | |
Risk-free rate | | | 2.96 | % | | | 2.39 | % | | | 2.46 | % |
Fair value | | $ | 2.60 | | | $ | 1.85 | | | $ | 0.8975 | |
Option Activity for the Year Ended December 31, 2011
| | | | | | | | | | | | | | | | |
| | | Options | | | Weighted-
average
Exercise
Price | | | Weighted-
average
Remaining
Contractual
Term | | | Aggregate
Intrinsic
Value | |
Outstanding at January 1, 2011 | | | 2,321 | | | $ | 21.34 | | | | | | | | | |
Acquired from Abington Bancorp, Inc. | | | 2,721 | | | | 6.42 | | | | | | | | | |
Granted | | | 253 | | | | 9.75 | | | | | | | | | |
Forfeited | | | (82 | ) | | | 18.29 | | | | | | | | | |
Expired | | | (133 | ) | | | 17.25 | | | | | | | | | |
Exercised | | | (70 | ) | | | 5.69 | | | | | | | | | |
| | | | | | | | | | | | | | | | |
Outstanding at December 31, 2011 | | | 5,010 | | | $ | 13.03 | | | | 5.0 | | | $ | 5,143 | |
| | | | | | | | | | | | | | | | |
Exercisable at December 31, 2011 | | | 4,076 | | | $ | 12.40 | | | | 4.6 | | | $ | 5,140 | |
108
| | | | | | | | | | | | |
| | | 2011 | | | 2010 | | | 2009 | |
Intrinsic value of options exercised | | $ | 398 | | | $ | 0 | | | $ | 0 | |
A summary of the status of Susquehanna’s non-vested options at December 31, 2011 and changes during the year ended December 31, 2011 is as follows:
| | | | | | | | |
| | | Shares | | | Weighted-
average
Grant-date
Fair Value | |
Nonvested at January 1, 2011 | | | 1,206 | | | $ | 2.84 | |
Granted | | | 248 | | | | 2.60 | |
Vested | | | (460 | ) | | | 3.47 | |
Forfeited | | | (60 | ) | | | 2.34 | |
| | | | | | | | |
Nonvested at December 31, 2011 | | | 934 | | | | 2.50 | |
| | | | | | | | |
Restricted Stock and Restricted Stock Units
A summary of activity related to restricted stock and restricted stock units for the year ended December 31, 2011 is as follows:
| | | | | | | | |
| | | Restricted
Stock and
Stock Units | | | Weighted-
average
Fair Value | |
Outstanding at January 1, 2011 | | | 327 | | | $ | 8.85 | |
Granted | | | 216 | | | | 9.47 | |
Forfeited | | | (6 | ) | | | 9.73 | |
Vested | | | (234 | ) | | | 8.49 | |
| | | | | | | | |
Outstanding at December 31, 2011 | | | 303 | | | $ | 9.55 | |
| | | | | | | | |
18. Benefit Plans
Pension Plan and Other Postretirement Benefits
Susquehanna maintains a single non-contributory defined benefit pension plan. The plan provides defined benefits based on years of service and final average salary. Effective June 30, 2009, certain benefits under the plan were frozen, as follows:
| • | | Employees who were hired before January 1, 2009 and who were age fifty or over or who had at least fifteen years of vesting service as of December 31, 2009, continued to participate in the plan after June 30, 2009 with no changes to the features of the plan. |
| • | | Employees who were hired before January 1, 2009 and who were not age fifty and who did not have fifteen years of vesting service were frozen from accruing future pay-based credits to their accounts within the plan after June 30, 2009. These employees continue to receive interest each year at a guaranteed minimum of 5.0%. Employees in this group also receive an automatic non-discretionary contribution to the Susquehanna 401(k) plan equal to 2.0% of eligible compensation. |
| • | | Employees who were hired on or after January 1, 2009 are not eligible to participate in the plan. However, eligible employees receive an automatic non-discretionary contribution to the Susquehanna 401(k) plan equal to 2.0% of eligible compensation. The automatic contribution to the 401(k) plan begins once these employees individually meet the eligibility requirements of the plan. |
Susquehanna also maintains a supplemental executive retirement plan (“SERP”) for selected participants.
109
This plan provides for benefits lost under the defined benefit pension plan due to provisions in the Internal Revenue Code that limit the compensation and benefits under a qualified retirement plan. In addition, Susquehanna offers life insurance and certain medical benefits to its retirees.
Obligations and Funded Status
| | | | | | | | | | | | | | | | | | | | | | | | |
| | | | | | | | | | | | | | | Other Postretirement | |
| | | Pension Benefits | | | SERP | | | Benefits | |
At December 31 | | 2011 | | | 2010 | | | 2011 | | | 2010 | | | 2011 | | | 2010 | |
Change in Benefit Obligation | | | | | | | | | | | | | | | | | | | | | | | | |
Benefit obligation at beginning of year | | $ | 127,124 | | | $ | 111,534 | | | $ | 5,450 | | | $ | 5,076 | | | $ | 14,429 | | | $ | 13,115 | |
Service cost | | | 4,222 | | | | 4,084 | | | | 98 | | | | 103 | | | | 744 | | | | 690 | |
Interest cost | | | 6,930 | | | | 6,406 | | | | 295 | | | | 280 | | | | 689 | | | | 808 | |
Plan participants' contributions | | | 0 | | | | 0 | | | | 0 | | | | 0 | | | | 341 | | | | 390 | |
Actuarial (gain) loss | | | 17,668 | | | | 9,203 | | | | 694 | | | | 145 | | | | 2,168 | | | | (1 | ) |
Curtailment | | | 0 | | | | 0 | | | | 84 | | | | 0 | | | | 453 | | | | 0 | |
Benefits paid | | | (4,268 | ) | | | (4,103 | ) | | | (198 | ) | | | (154 | ) | | | (665 | ) | | | (573 | ) |
| | | | | | | | | | | | | | | | | | | | | | | | |
Benefit obligation at end of year | | | 151,676 | | | | 127,124 | | | | 6,423 | | | | 5,450 | | | | 18,159 | | | | 14,429 | |
| | | | | | | | | | | | | | | | | | | | | | | | |
Change in Plan Assets | | | | | | | | | | | | | | | | | | | | | | | | |
Fair value of plan assets at beginning of year | | $ | 125,671 | | | $ | 116,783 | | | $ | 0 | | | $ | 0 | | | $ | 0 | | | $ | 0 | |
Actual return on plan assets | | | 15,962 | | | | 12,997 | | | | 0 | | | | 0 | | | | 0 | | | | 0 | |
Employer contributions | | | 0 | | | | 0 | | | | 198 | (1) | | | 153 | (1) | | | 324 | (1) | | | 183 | (1) |
Expenses | | | (4 | ) | | | (6 | ) | | | 0 | | | | 0 | | | | 0 | | | | 0 | |
Plan participants’ contributions | | | 0 | | | | 0 | | | | 0 | | | | 0 | | | | 341 | | | | 390 | |
Benefits paid | | | (4,268 | ) | | | (4,103 | ) | | | (198 | ) | | | (153 | ) | | | (665 | ) | | | (573 | ) |
| | | | | | | | | | | | | | | | | | | | | | | | |
Fair value of plan assets at end of year | | | 137,361 | | | | 125,671 | | | | 0 | | | | 0 | | | | 0 | | | | 0 | |
| | | | | | | | | | | | | | | | | | | | | | | | |
Funded Status at End of Year | | $ | (14,316 | ) | | $ | (1,453 | ) | | $ | (6,423 | ) | | $ | (5,450 | ) | | $ | (18,159 | ) | | $ | (14,429 | ) |
| | | | | | | | | | | | | | | | | | | | | | | | |
| (1) | Cash contributions made to providers, insurers, trusts, or participants for payment of claims. |
Amounts recognized on the consolidated balance sheets consist of the following:
| | | | | | | | | | | | | | | | | | | | | | | | |
| | | | | | | | | | | | | | | Other Postretirement | |
| | | Pension Benefits | | | SERP | | | Benefits | |
| | | 2011 | | | 2010 | | | 2011 | | | 2010 | | | 2011 | | | 2010 | |
Assets | | $ | 0 | | | $ | 0 | | | $ | 0 | | | $ | 0 | | | $ | 0 | | | $ | 0 | |
Liabilities | | | (14,316 | ) | | | (1,453 | ) | | | (6,423 | ) | | | (5,450 | ) | | | (18,159 | ) | | | (14,429 | ) |
| | | | | | | | | | | | | | | | | | | | | | | | |
Net asset/(liability) recognized | | $ | (14,316 | ) | | $ | (1,453 | ) | | $ | (6,423 | ) | | $ | (5,450 | ) | | $ | (18,159 | ) | | $ | (14,429 | ) |
| | | | | | | | | | | | | | | | | | | | | | | | |
Amounts recognized in accumulated other comprehensive income (net of taxes at 35%) consist of the following:
| | | | | | | | | | | | | | | | | | | | | | | | |
| | | Pension Benefits | | | SERP | | | Other Postretirement
Benefits | |
| | | 2011 | | | 2010 | | | 2011 | | | 2010 | | | 2011 | | | 2010 | |
Net actuarial loss | | $ | 29,877 | | | $ | 24,139 | | | $ | 1,375 | | | $ | 846 | | | $ | 1,770 | | | $ | 254 | |
Transition obligation | | | 0 | | | | 0 | | | | 0 | | | | 0 | | | | 79 | | | | 152 | |
Prior service cost | | | 78 | | | | 95 | | | | 119 | | | | 195 | | | | 443 | | | | 199 | |
| | | | | | | | | | | | | | | | | | | | | | | | |
| | $ | 29,955 | | | $ | 24,234 | | | $ | 1,494 | | | $ | 1,041 | | | $ | 2,292 | | | $ | 605 | |
| | | | | | | | | | | | | | | | | | | | | | | | |
110
The accumulated benefit obligation for the defined benefit pension plan was $145,740 and $121,708 at December 31, 2011 and 2010, respectively. The accumulated benefit obligation for the SERP was $5,222 and $4,977 at December 31, 2011 and 2010, respectively.
Components of Net Periodic Benefit Cost and Other Amounts Recognized in Other Comprehensive Income
Net Periodic Benefit Cost
| | | | | | | | | | | | | | | | | | | | | | | | |
| | | Pension Benefits | | | SERP | | | Other Postretirement
Benefits | |
| | | 2011 | | | 2010 | | | 2011 | | | 2010 | | | 2011 | | | 2010 | |
Service cost | | $ | 4,222 | | | $ | 4,084 | | | $ | 98 | | | $ | 103 | | | $ | 744 | | | $ | 690 | |
Interest cost | | | 6,930 | | | | 6,406 | | | | 295 | | | | 280 | | | | 689 | | | | 808 | |
Expected return on plan assets | | | (9,271 | ) | | | (9,764 | ) | | | 0 | | | | 0 | | | | 0 | | | | 0 | |
Amortization of prior service cost | | | 25 | | | | 25 | | | | 117 | | | | 118 | | | | 77 | | | | 65 | |
Amortization of transition obligation | | | 0 | | | | 0 | | | | 0 | | | | 0 | | | | 113 | | | | 113 | |
Amortization of net actuarial (gain) or loss | | | 2,155 | | | | 2,704 | | | | 123 | | | | 85 | | | | 0 | | | | 22 | |
Curtailment | | | 0 | | | | 0 | | | | 84 | | | | 0 | | | | 0 | | | | 0 | |
| | | | | | | | | | | | | | | | | | | | | | | | |
Net periodic postretirement benefit cost | | | 4,061 | | | | 3,455 | | | | 717 | | | | 586 | | | | 1,623 | | | | 1,698 | |
| | | | | | | | | | | | | | | | | | | | | | | | |
Other Changes in Plan Assets and Benefit Obligations
| | | | | | | | | | | | | | | | | | | | | | | | |
| | | Pension Benefits | | | SERP | | | Other Postretirement
Benefits | |
| | | 2011 | | | 2010 | | | 2011 | | | 2010 | | | 2011 | | | 2010 | |
Net actuarial loss (gain) for the period | | | 10,982 | | | | 5,976 | | | | 694 | | | | 145 | | | | 2,168 | | | | (1 | ) |
Amortization of net (loss) gain | | | (2,155 | ) | | | (2,704 | ) | | | (123 | ) | | | (85 | ) | | | 0 | | | | (22 | ) |
Amortization of prior service cost | | | (25 | ) | | | (25 | ) | | | (117 | ) | | | (118 | ) | | | (77 | ) | | | (65 | ) |
Recognition of prior service cost | | | 0 | | | | 0 | | | | 0 | | | | 0 | | | | 453 | | | | 0 | |
Adjustment relating to prior business acquisitions | | | 0 | | | | (462 | ) | | | 0 | | | | 0 | | | | 0 | | | | 0 | |
Amortization of transition obligation | | | 0 | | | | 0 | | | | 0 | | | | 0 | | | | (113 | ) | | | (113 | ) |
| | | | | | | | | | | | | | | | | | | | | | | | |
Total recognized in other comprehensive income | | | 8,802 | | | | 2,785 | | | | 454 | | | | (58 | ) | | | 2,431 | | | | (201 | ) |
| | | | | | | | | | | | | | | | | | | | | | | | |
Total recognized in net periodic benefit cost and other comprehensive income | | $ | 12,863 | | | $ | 6,240 | | | $ | 1,171 | | | $ | 527 | | | $ | 4,054 | | | $ | 1,497 | |
| | | | | | | | | | | | | | | | | | | | | | | | |
Expected Amortizations
The estimated net loss, prior service cost, and transition obligation (asset) for the plans that are expected to be amortized from accumulated other comprehensive income into net periodic benefit cost over the next fiscal year is as follows:
| | | | | | | | | | | | |
| | | Pension
Benefits | | | SERP | | | Other Post-
retirement
Benefits | |
Expected amortization of net loss | | $ | 3,216 | | | $ | 218 | | | $ | 55 | |
Expected amortization of prior service cost | | | 25 | | | | 110 | | | | 114 | |
Expected amortization of transition obligation | | | 0 | | | | 0 | | | | 113 | |
111
Additional Information
The weighted-average assumptions used in the actuarial computation of the plans’ benefit obligations were as follows:
| | | | | | | | | | | | | | | | | | | | | | | | |
| | | Pension Benefits | | | SERP | | | Other Postretirement
Benefits | |
| | | 2011 | | | 2010 | | | 2011 | | | 2010 | | | 2011 | | | 2010 | |
Discount rate | | | 4.75 | % | | | 5.50 | % | | | 4.75 | % | | | 5.50 | % | | | 4.50 | % | | | 5.25 | % |
Rate of compensation increase | | | 3.00 | % | | | 3.00 | % | | | 4.00 | % | | | 3.00 | % | | | 3.00 | % | | | 3.00 | % |
Assumed health care trend rates: | | | | | | | | | | | | | | | | | | | | | | | | |
Health care cost trend rate assumed for next year | | | | | | | | | | | | | | | | | | | 9.00 | % | | | 10.00 | % |
Ultimate health care trend rate | | | | | | | | | | | | | | | | | | | 5.00 | % | | | 5.00 | % |
Year that ultimate trend rate is attained | | | | | | | | | | | | | | | | | | | 2016 | | | | 2016 | |
The weighted-average assumptions used in the actuarial computation of the plans’ net periodic cost were as follows:
| | | | | | | | | | | | | | | | | | | | | | | | |
| | | Pension Benefits | | | SERP | | | Other Postretirement
Benefits | |
| | | 2011 | | | 2010 | | | 2011 | | | 2010 | | | 2011 | | | 2010 | |
Discount rate | | | 5.50 | % | | | 5.75 | % | | | 5.50 | % | | | 5.75 | % | | | 5.25 | % | | | 5.75 | % |
Expected return on plan assets | | | 7.50 | % | | | 8.50 | % | | �� | N/A | | | | N/A | | | | N/A | | | | N/A | |
Rate of compensation increase | | | 3.00 | % | | | 3.00 | % | | | 3.00 | % | | | 3.00 | % | | | 3.00 | % | | | 3.00 | % |
Assumed health care trend rates: | | | | | | | | | | | | | | | | | | | | | | | | |
Health care cost trend rate assumed for current year | | | | | | | | | | | | | | | | | | | 10.00 | % | | | 10.00 | % |
Ultimate health care trend rate | | | | | | | | | | | | | | | | | | | 5.00 | % | | | 5.00 | % |
Year that ultimate trend rate is attained | | | | | | | | | | | | | | | | | | | 2016 | | | | 2016 | |
The impact of one-percentage-point change in assumed health care cost trend rates is as follows:
| | | | | | | | |
| | | Increase | | | Decrease | |
Effect on service cost plus interest cost components of net periodic postretirement benefit cost | | $ | 38 | | | $ | (43 | ) |
Effect on accumulated benefit obligation as of December 31, 2011 | | | 679 | | | | (585 | ) |
Other accounting items that are required to be disclosed are as follows:
| | | | | | | | | | | | | | | | | | | | | | | | |
| | | Pension Benefits | | | SERP | | | Other Postretirement
Benefits | |
| | | 2011 | | | 2010 | | | 2011 | | | 2010 | | | 2011 | | | 2010 | |
Alternative amortization methods used: | | | | | | | | | | | | | | | | | | | | | | | | |
Prior service cost | | | Straight line | | | | Straight line | | | | Straight line | | | | Straight line | | | | Straight line | | | | Straight line | |
Unrecognized net actuarial loss | | | Straight line | | | | Straight line | | | | Straight line | | | | Straight line | | | | Straight line | | | | Straight line | |
Average future service (in years) | | | 11.73 | | | | 9.04 | | | | 6.55 | | | | 7.14 | | | | N/A | | | | N/A | |
Average future service to assumed retirement age (in years) | | | N/A | | | | N/A | | | | N/A | | | | N/A | | | | 7.64 | | | | 7.83 | |
Average future service to full benefit eligibility age (in years) | | | N/A | | | | N/A | | | | N/A | | | | N/A | | | | 11.86 | | | | 12.08 | |
Measurement date used | | | 12/31/2011 | | | | 12/31/2010 | | | | 12/31/2011 | | | | 12/31/2010 | | | | 12/31/2011 | | | | 12/31/2010 | |
The expected long-term rate of return was estimated using market benchmarks for equities and bonds applied to the defined pension benefit plan’s target asset allocation. The expected return on equities was computed using a valuation methodology which projected future returns based on current equity valuations while looking at historical returns, as well. Due to active management of the plan’s assets, the return on the equity
112
investment of the plan historically has exceeded general market returns. Management estimated the rate by which the plan’s assets would perform to the market in the future looking a historical performance and adjusting for changes in the asset allocations.
For the plan-year ending December 31, 2012, expected employer contributions to the pension plan, SERP, and other benefit plans are $0, $282, and $615, respectively, and expected employee contributions are $0, $0, and $328, respectively. The 2012 plan assumptions used to determine net periodic cost will be a discount rate of 4.75% and an expected long-term return on plan assets of 7.50%. The assumed discount rate was determined by matching Susquehanna’s projected pension payments to high quality Double-A bonds of similar duration. The payment projections used a seventy-five year payout projection.
The investment objective of the pension plan is to maximize total return while limiting the volatility in funded status by emphasizing growth at a reasonable price and owning fixed-income assets that correlate to the calculation of liabilities under the Pension Protection Act of 2006.
The plan’s equity portfolio consists primarily of large-cap stocks. Equity investments are diversified and sector-weighted. Industry growth prospects and economic sentiment are major considerations in the investment process, but risk reduction is achieved through diversification and active portfolio management. The plan has no holding of Susquehanna common stock.
The pension plan’s debt securities portfolio consists of bonds rate A or higher at the time of purchase. The current portfolio consists primarily of investment-grade bonds with a duration exceeding eleven years with additional holdings of U.S. Treasuries and agency securities, high-quality corporate, and money market investments. A credit analysis is conducted to ensure that the appropriate liquidity, industry diversification, safety, maximum yield, and minimum risk are achieved. Duration in excess of eleven years is sought for correlation with the determination of plan liabilities. While there is a concentration of assets in long-duration bonds, risk is mitigated by the high quality of the bonds and their correlation to the valuation of plan liabilities.
The target and actual allocations expressed as a percentage of the defined benefit pension plan’s assets are as follows:
| | | | | | | | | | | | |
| | | Target | | | Actual | |
For the year ended | | 2012 | | | 2011 | | | 2010 | |
Equity securities | | | 20-40 | % | | | 38 | % | | | 34 | % |
Debt securities | | | 60-80 | % | | | 60 | % | | | 64 | % |
Temporary cash and other investments | | | 0-10 | % | | | 2 | % | | | 2 | % |
| | | | | | | | | | | | |
Total | | | | | | | 100 | % | | | 100 | % |
| | | | | | | | | | | | |
Estimated aggregate future benefit payments for pension, SERP, and other benefits, which reflect expected future service, as appropriate, are as follows:
| | | | | | | | | | | | |
| | | Pension | | | SERP | | | Other
Benefits | |
2012 | | $ | 4,529 | | | $ | 282 | | | $ | 615 | |
2013 | | | 4,874 | | | | 374 | | | | 653 | |
2014 | | | 5,265 | | | | 450 | | | | 740 | |
2015 | | | 5,719 | | | | 458 | | | | 832 | |
2016 | | | 6,230 | | | | 459 | | | | 898 | |
Years 2017-2021 | | | 41,515 | | | | 2,515 | | | | 5,969 | |
Fair Value Measurement of Plan Assets
Fair value is the price that would be received to sell an asset or paid to transfer a liability in an orderly transaction between market participants at the measurement date. Observable inputs reflect the assumptions
113
market participants would use in pricing the asset or liability developed based upon market data obtained from sources independent of the reporting entity. Unobservable inputs reflect the reporting entity’s own assumptions about the assumptions market participants would use in pricing the asset or liability developed based upon the best information available in the circumstances. Level 1 inputs are quoted prices (unadjusted) in active markets for identical assets or liabilities that the entity has the ability to access at the measurement date. Level 2 inputs are inputs other than quoted prices included within Level 1 that are observable for the asset or liability, either directly or indirectly. Level 3 inputs are unobservable inputs for the asset or liability. The level in the hierarchy within which the fair value measurement in its entirety falls shall be determined based on the lowest level input that is significant to the fair value measurement.
The following is a description of the valuation methodologies used for assets measured at fair value. These methods may produce a fair value calculation that may not be indicative of net realizable value or reflective of future fair values. Furthermore, while Susquehanna believes that the valuation methods used to determine the fair value of its pension plan assets are appropriate and consistent with other market participants, the use of different methodologies or assumptions to determine the fair value of certain financial instruments could result in a different estimate of fair value at the reporting date.
Temporary Cash and Other Investments
For these short-term investments, the carrying values are a reasonable estimate of fair value.
Registered Investment Companies
The fair value of these investments is determined by reference to the funds’ underlying assets which are principally fixed-income securities. Shares held in registered investment companies traded on national securities exchanges are valued at net asset value.
Securities
Where quoted prices are available in an active market, securities are classified in Level 1 of the valuation hierarchy. Securities in Level 1 are exchange-traded equities. If quoted market prices are not available for specific securities, then fair values are provided by independent third-party valuations services. These valuations services estimate fair values using pricing models and other accepted valuation methodologies, such as quotes for similar securities and observable yield curves and spreads. Securities in Level 2 include U.S. Government agencies, municipal bonds, foreign bonds, and corporate bonds and notes. The plan has no securities classified in Level 3 of the valuation hierarchy.
Dividends and Interest Receivable
Dividends and interest receivable are classified, by default, in Level 3 of the valuation hierarchy.
The following tables summarized the fair values of the plan’s investments at December 31, 2011 and 2010.
| | | | | | | | | | | | | | | | |
| | | | | | Fair Value Measurements at
Reporting Date | |
Description | | 12/31/2011 | | | Level 1 | | | Level 2 | | | Level 3 | |
Registered investment companies | | $ | 83,732 | | | $ | 83,732 | | | $ | 0 | | | $ | 0 | |
U.S. Government agencies | | | 619 | | | | 0 | | | | 619 | | | | 0 | |
Municipal bonds | | | 610 | | | | 0 | | | | 610 | | | | 0 | |
Corporate bonds and notes | | | 3,273 | | | | 0 | | | | 3,273 | | | | 0 | |
Common stocks | | | 45,835 | | | | 45,835 | | | | 0 | | | | 0 | |
Dividends and interest receivable | | | 185 | | | | 0 | | | | 0 | | | | 185 | |
Temporary cash and other investments | | | 3,107 | | | | 3,107 | | | | 0 | | | | 0 | |
| | | | | | | | | | | | | | | | |
Total | | $ | 137,361 | | | $ | 132,674 | | | $ | 4,502 | | | $ | 185 | |
| | | | | | | | | | | | | | | | |
114
| | | | | | | | | | | | | | | | |
| | | | | | Fair Value Measurements at
Reporting Date | |
Description | | 12/31/2010 | | | Level 1 | | | Level 2 | | | Level 3 | |
Registered investment companies | | $ | 71,104 | | | $ | 71,104 | | | $ | 0 | | | $ | 0 | |
U.S. Government agencies | | | 2,392 | | | | 0 | | | | 2,392 | | | | 0 | |
Municipal bonds | | | 617 | | | | 0 | | | | 617 | | | | 0 | |
Corporate bonds and notes | | | 6,055 | | | | 0 | | | | 6,055 | | | | 0 | |
Common stocks | | | 42,826 | | | | 42,826 | | | | 0 | | | | 0 | |
Dividends and interest receivable | | | 187 | | | | 0 | | | | 0 | | | | 187 | |
Temporary cash and other investments | | | 2,490 | | | | 2,490 | | | | 0 | | | | 0 | |
| | | | | | | | | | | | | | | | |
Total | | $ | 125,671 | | | $ | 116,420 | | | $ | 9,064 | | | $ | 187 | |
| | | | | | | | | | | | | | | | |
401(k) Plan
Susquehanna maintains a 401(k) savings plan which allows employees to invest a percentage of their earnings, matched up to a certain amount specified by Susquehanna. In addition, in conjunction with the changes to Susquehanna’s pension plan, certain employees are to receive non-discretionary contributions to their 401(k) accounts.
Susquehanna’s match of employee contributions to the savings plan, which is included in salaries and benefits expense, totaled $4,785 in 2011, $4,588 in 2010, and $4,656 in 2009. Susquehanna’s non-discretionary contribution to the savings plan was $1,567 for 2011.
19. Earnings per Common Share (“EPS”)
Basic earnings per common share
| | | | | | | | | | | | |
| | | For the Year Ended December 31, | |
| | | 2011 | | | 2010 | | | 2009 | |
Net income (loss) applicable to common shareholders | | $ | 54,905 | | | $ | 16,275 | | | $ | (3,984 | ) |
Average common shares outstanding | | | 136,509 | | | | 121,031 | | | | 86,257 | |
Basic earnings per common share | | $ | 0.40 | | | $ | 0.13 | | | $ | (0.05 | ) |
Diluted earnings per common share
| | | | | | | | | | | | |
| | | For the Year Ended December 31, | |
| | | 2011 | | | 2010 | | | 2009 | |
Net income (loss) available to common shareholders | | $ | 54,905 | | | $ | 16,275 | | | $ | (3,984 | ) |
Average common shares outstanding | | | 136,509 | | | | 121,031 | | | | 86,257 | |
Dilutive potential common shares | | | 367 | | | | 38 | | | | 0 | |
| | | | | | | | | | | | |
Total diluted average common shares outstanding | | | 136,876 | | | | 121,069 | | | | 86,257 | |
| | | | | | | | | | | | |
Diluted earnings per common share | | $ | 0.40 | | | $ | 0.13 | | | $ | (0.05 | ) |
For the years ended December 31, 2011, 2010, and 2009, options to purchase 5,010, 2,321, and 2,484 shares, respectively, were outstanding but were not included in the computation of diluted EPS because the options’ common stock equivalents were antidilutive. For the years ended December 31, 2011, 2010, and 2009, warrants to purchase 3,028 shares, respectively, were outstanding but were not included in the computation of diluted EPS because the warrants’ common stock equivalents were antidilutive.
115
20. Related Party Transactions
Certain directors and named executive officers of Susquehanna and its affiliates, including their immediate families and companies in which they are principal owners (more than 10%), were indebted to the bank subsidiary. In the opinion of management, such loans are consistent with sound banking practices and are within applicable regulatory bank lending limitations and in compliance with applicable rules and regulations of the Securities and Exchange Commission. Susquehanna relies on the directors and named executive officers for the identification of their associates.
The activity of loans to such persons whose balances exceeded $120 is as follows:
| | | | | | | | | | | | |
| | | 2011 | | | 2010 | | | 2009 | |
Balance - January 1 | | $ | 45,595 | | | $ | 51,750 | | | $ | 33,202 | |
Additions | | | 2,566 | | | | 16,597 | | | | 68,166 | |
Deductions: | | | | | | | | | | | | |
Amounts collected | | | (13,665 | ) | | | (22,751 | ) | | | (39,962 | ) |
Other changes | | | (1,134 | ) | | | (1 | ) | | | (9,656 | ) |
| | | | | | | | | | | | |
Balance - December 31 | | $ | 33,362 | | | $ | 45,595 | | | $ | 51,750 | |
| | | | | | | | | | | | |
21. Regulatory Restrictions of Subsidiaries
Susquehanna is limited by regulatory provisions in the amount it can receive in dividends from its banking subsidiary. Accordingly, at December 31, 2011, $156,357 was available for dividend distribution to Susquehanna in 2012 from its banking subsidiary.
Included in cash and due from banks are balances required to be maintained by Susquehanna Bank on deposit with the Federal Reserve. The amounts of such reserves are based on percentages of certain deposit types and totaled $65,393 at December 31, 2011 and $29,109 at December 31, 2010.
Under current Federal Reserve regulations, Susquehanna Bank is limited in the amount it may lend to the parent company and its nonbank subsidiaries. Loans to a single affiliate may not exceed 10%, and loans to all affiliates may not exceed 20% of the bank’s capital stock, surplus, and undivided profits, plus the allowance for loan and lease losses. Loans from Susquehanna Bank to nonbank affiliates, including the parent company, are also required to be collateralized according to regulatory guidelines. At December 31, 2011, there were no loans from the bank to any nonbank affiliate, including the parent company.
Valley Forge Asset Management Corp. is required to maintain minimum net worth capital and is governed by the FINRA and the SEC. As of December 31, 2011, this subsidiary met its minimum regulatory capital requirement.
22. Securitizations and Variable Interest Entities (“VIEs”)
In 2005 and 2006, Susquehanna entered into term securitization transactions in which it sold portfolios of home equity loans to securitization trusts. Both of the securitization trusts are VIEs, and Susquehanna is the primary beneficiary of the VIEs. The VIEs were consolidated, and upon consolidation, Susquehanna removed retained interests of $23,705 and recorded interest-bearing deposits of $7,537, aggregate loans balances of $248,333, and long term-debt of $239,936 on January 1, 2010. In addition, Susquehanna recognized a cumulative-effect adjustment that reduced retained earnings by $5,805 and an adjustment that reduced accumulated other comprehensive income by $6,922. Susquehanna entered into these securitization transactions primarily to achieve low-cost funding for the growth of its loan and lease portfolios and to manage capital. The investors and the VIEs have no recourse to Susquehanna’s general credit for failure of debtors to pay when due.
116
2006 Transaction
In September 2006, Susquehanna securitized $349,403 of fixed-rate home mortgage loans and variable-rate line of credit loans. Susquehanna retained the right to service the loans and recorded a servicing asset of $2,334.
In this securitization, approximately 70.5% of the variable-rate loans as of the cut-off date included a feature that permits the obligor to convert all or a portion of the loan from a variable interest rate to a fixed interest rate. If the total principal balance of the converted loans is greater than 10% of the total outstanding balance of the portfolio, Susquehanna is required to purchase the converted loans in excess of the 10% threshold until the total principal balance of the loans purchased by Susquehanna is equal to 10% of the original principal balance of the loans. Based upon Susquehanna’s experience with this product, Susquehanna has concluded that the event requiring the purchase of converted loans of the VIE would be remote. The maximum dollar amount of this purchase obligation at the cut-off date was $11,140.
2005 Transaction
In December 2005, Susquehanna securitized $239,766 of home equity line of credit loans. Susquehanna retained the right to service the loans and recorded a servicing asset of $1,289.
In this securitization, approximately 35.4% of the loans as of the cut-off date included a feature that permits the obligor to convert all or a portion of the loan from a variable interest rate to a fixed interest rate. If the total principal balance of the converted loans is greater than 10% of the total outstanding balance of the portfolio, Susquehanna is required to purchase the converted loans in excess of the 10% threshold until the total principal balance of the loans purchased by Susquehanna is equal to 10% of the original principal balance of the loans. Based upon Susquehanna’s experience with this product, Susquehanna has concluded that the event requiring the purchase of converted loans of the VIE would be remote. The maximum dollar amount of this purchase obligation at the cut-off date was $23,980.
The following table presents quantitative information about delinquencies, net credit losses, and components of loan and lease sales serviced by Susquehanna, including securitization transactions.
| | | | | | | | | | | | | | | | | | | | | | | | |
| | | As of December 31 | | | For the Year
Ended December 31 | |
| | | Principal Balance | | | Risk Assets (1) | | | Net Credit Losses
(Recoveries) | |
| | | 2011 | | | 2010 | | | 2011 | | | 2010 | | | 2011 | | | 2010 | |
Loans and leases held in portfolio | | $ | 10,257,161 | | | $ | 9,417,801 | | | $ | 207,592 | | | $ | 235,972 | | | $ | 113,734 | | | $ | 143,534 | |
Home equity loans held by VIEs | | | 190,769 | | | | 215,396 | | | | 4,108 | | | | 5,511 | | | | 999 | | | | 782 | |
Leases serviced for others | | | 11 | | | | 2,548 | | | | 9 | | | | 11 | | | | 4 | | | | (8 | ) |
| | | | | | | | | | | | | | | | | | | | | | | | |
Total loans and leases serviced | | $ | 10,447,941 | | | $ | 9,635,745 | | | $ | 211,709 | | | $ | 241,494 | | | $ | 114,737 | | | $ | 144,308 | |
| | | | | | | | | | | | | | | | | | | | | | | | |
| (1) | Includes nonaccrual loans and leases, foreclosed real estate, and loans and leases past due 90 days and still accruing. |
Certain cash flows received from or conveyed to the VIEs associated with the securitizations are as follows:
| | | | | | | | | | | | |
| Automobile Leases | | Year Ended December 31 | |
| | | 2011 | | | 2010 | | | 2009 | |
Servicing fees received | | $ | 0 | | | $ | 0 | | | $ | 701 | |
Other cash flows received | | | 0 | | | | 0 | | | | 12,020 | |
| |
| Home Equity Loans | | Year Ended December 31 | |
| | | 2011 | | | 2010 | | | 2009 | |
Additional draws conveyed | | $ | 29,903 | | | $ | 33,499 | | | $ | 46,027 | |
Servicing fees received | | | 903 | | | | 1,009 | | | | 1,131 | |
Other cash flows received | | | 4,574 | | | | 5,935 | | | | 8,214 | |
117
23. Derivative Financial Instruments
Risk Management Objective of Using Derivatives
Susquehanna is exposed to certain risks arising from both its business operations and economic conditions. Susquehanna manages economic risk exposures, including interest rate, liquidity, and credit risk, primarily by managing the amount, sources, and duration of its assets and liabilities and through the use of derivative financial instruments. Susquehanna enters into derivative financial instruments to manage exposures that arise from business activities that result in the receipt or payment of future known and uncertain cash amounts, the value of which are impacted by changes in interest rates. Susquehanna’s derivative financial instruments are used to manage differences in the amount, timing, and duration of its known or expected cash payments principally those related to certain variable-rate liabilities.
Susquehanna offers qualifying commercial banking customers derivatives in connection with their risk management actions to transfer, modify or reduce their interest rate risks. Susquehanna actively manages the market risks from its exposure to those derivatives by entering into offsetting derivative transactions, controls focused on pricing and reporting of positions to senior managers to minimize its exposure resulting from such transactions.
Derivatives may expose Susquehanna to market, credit or liquidity risks in excess of the amounts recorded on the consolidated balance sheets. Market risk on a derivative is the exposure created by potential fluctuations in interest rates and other factors and is a function of the type of derivative, the tenor and terms of the agreement, and the underlying volatility. Credit risk is the exposure to loss in the event of nonperformance by the other party to the transaction where the value of any collateral held is not adequate to cover such losses. Liquidity risk is the potential exposure that arises when the size of the derivative position may not be able to be rapidly adjusted in periods of high volatility and financial stress at a reasonable cost.
All freestanding derivatives are recorded on the balance sheet at fair value.
Cash Flow Hedges of Interest Rate Risk
Susquehanna uses interest rate derivatives to manage its exposure to interest rate movements and add stability to interest income and expense. Susquehanna primarily uses interest rate swaps as part of its interest rate risk management strategy. For example, Susquehanna may issue variable rate long-term debt and then enter into a receive-variable pay-fixed-rate interest rate swap with the same payment timing and notional amount to convert the interest payments to a net variable-rate basis. As of December 31, 2011, Susquehanna had fourteen interest rate swaps with an aggregate notional amount of $1,162,947 that were designated as cash flow hedges of interest-rate risk.
Susquehanna applies hedge accounting to certain interest rate derivatives entered into for risk management purposes. However, Susquehanna does not seek to apply hedge accounting to all of the derivatives involved in Susquehanna’s risk management activities, such as the interest rate derivatives entered into to offset the derivatives offered to qualifying borrowers. To qualify for hedge accounting, a derivative must be highly effective at reducing the risk associated with the exposure being hedged. In addition, key aspects of achieving hedge accounting are documentation of hedging strategy and hedge effectiveness at the hedge inception and substantiating hedge effectiveness on an ongoing basis. A derivative must be highly effective in accomplishing the hedge objective of offsetting either changes in the fair value or cash flows of the hedged item for the risk being hedged. Any ineffectiveness in the hedge relationship is recognized in current earnings. The assessment of effectiveness excludes changes in the value of the hedged item that are unrelated to the risks being hedged. The effective portion of changes in the fair value of derivatives designated and that qualify as cash flow hedges is recorded in accumulated other comprehensive income and is subsequently reclassified into earnings in the period that the hedged transaction affects earnings.
118
Amounts recorded in accumulated other comprehensive income related to derivatives will be reclassified to interest expense as interest payments are made on Susquehanna’s variable-rate liabilities. During the next 12 months, Susquehanna estimates that $16,727 will be reclassified as an increase to interest expense.
Non-designated Derivatives
Derivatives not designated as hedges are used to manage Susquehanna’s exposure to interest rate movements and other identified risks but do not meet the strict requirements of hedge accounting. Changes in the fair value of derivatives not designated in hedging relationships are recognized directly in earnings.
Susquehanna offers qualifying commercial banking customers derivatives to enable such customers to transfer, modify or reduce their interest rate risks. The credit risk associated with derivatives entered into with these customers is essentially the same as that involved in extending loans and is subject to our normal credit policies. Susquehanna obtains collateral based upon its assessment of the customers’ credit quality. Susquehanna actively manages the market risks from its exposure to these derivatives by entering into offsetting derivative transactions, controls focused on pricing, and reporting of positions to senior managers to minimize its exposure resulting from such transactions.
At December 31, 2011, Susquehanna had 90 derivative transactions related to this program with an aggregate notional amount of $632,589. For the year ended December 31, 2011, Susquehanna recognized a net loss of $239 related to changes in fair value of the derivatives in this program.
Credit-risk-related Contingent Features
Susquehanna has agreements with certain of its derivative counterparties that contain the following provisions:
| | • | | if Susquehanna defaults on any of its indebtedness, including default where repayment of the indebtedness has not been accelerated by the lender, then Susquehanna could also be declared in default on its derivative obligations; |
| | • | | if Susquehanna fails to maintain its status as a well/adequately capitalized institution, then the counterparty could terminate the derivative positions, and Susquehanna would be required to settle its obligations under the agreements; |
| | • | | if Susquehanna fails to maintain a specified minimum leverage ratio, then Susquehanna could be declared in default on its derivative obligations; |
| | • | | if a specified event or condition occurs that materially changes Susquehanna’s creditworthiness in an adverse manner, it may be required to fully collateralize its obligations under the derivative instrument; and |
| | • | | if Susquehanna’s credit rating is reduced below investment grade, then a termination event would be deemed to have occurred and Susquehanna’s counterparty would have the right, but not the obligation, to terminate all transactions under the agreement. |
At December 31, 2011, the fair value of derivatives in a net liability position, which includes accrued interest and any credit valuation adjustments related to these agreements, was $51,550. At December 31, 2011, Susquehanna had minimum collateral posting thresholds with certain of its derivative counterparties and had posted cash collateral of $60,810. If Susquehanna had breached any of the above provisions at December 31, 2011, it would have been required to settle its obligations under the agreements at termination value and would have been required to pay any additional amounts due in excess of amounts previously posted as collateral with the respective counterparty.
119
| | | | | | | | | | | | |
| | | Fair Values of Derivative Instruments December 31, 2011 | |
| | | Asset Derivatives | | | Liability Derivatives | |
| | | Balance Sheet Location | | Fair Value | | | Balance Sheet Location | | Fair Value | |
Derivatives designated as hedging instruments | | | | | | | | | | | | |
Interest rate contracts | | Other assets | | $ | 3,693 | | | Other liabilities | | $ | 52,028 | |
Derivatives not designated as hedging instruments | | | | | | | | | | | | |
Interest rate contracts | | Other assets | | | 22,770 | | | Other liabilities | | | 21,133 | |
| | | | | | | | | | | | |
Total derivatives | | | | $ | 26,463 | | | | | $ | 73,161 | |
| | | | | | | | | | | | |
| | | | | | | | | | | | |
| | | Fair Values of Derivative Instruments December 31, 2010 | |
| | | Asset Derivatives | | | Liability Derivatives | |
| | | Balance Sheet Location | | Fair Value | | | Balance Sheet Location | | Fair Value | |
Derivatives designated as hedging instruments | | | | | | | | | | | | |
Interest rate contracts | | Other assets | | $ | 181 | | | Other liabilities | | $ | 31,793 | |
Derivatives not designated as hedging instruments | | | | | | | | | | | | |
Interest rate contracts | | Other assets | | | 17,167 | | | Other liabilities | | | 16,767 | |
| | | | | | | | | | | | |
Total derivatives | | | | $ | 17,348 | | | | | $ | 48,560 | |
| | | | | | | | | | | | |
The Effect of Derivative Instruments on Earnings
Year Ended December 31, 2011
| | | | | | | | | | | | | | | | | | |
Derivatives in cash flow hedging relationships | | Amount of Loss
Recognized
in OCI | | | Location of Loss
Reclassified from
Accumulated OCI
into Income | | Amount of Loss
Reclassified from
Accumulated OCI
into Income | | | Location of Gain
Recognized in
Income
(Ineffective
Portion) | | | Amount of Gain
Recognized in
Income
(Ineffective
Portion) | |
Interest rate contracts: | | | $(14,268) | | | Interest expense | | $ | (16,880 | ) | | | Other expense | | | $ | 509 | |
| | | | | |
Derivatives not designated as hedging instruments | | Location of Loss
Recognized in
Income on
Derivatives | | | Amount of Loss
Recognized in
Income on
Derivatives | | | | | | | | | |
Interest rate contracts: | | | Other income | | | $(70) | | | | | | | | | | | | |
| | | Other expense | | | (169) | | | | | | | | | | | | |
Year Ended December 31, 2010
| | | | | | | | | | | | | | | | | | |
Derivatives in cash flow hedging relationships | | Amount of Loss
Recognized
in OCI | | Location of Loss
Reclassified from
Accumulated OCI
into Income | | | Amount of Loss
Reclassified from
Accumulated OCI
into Income | | | Location of Loss
Recognized in
Income
(Ineffective
Portion) | | | Amount of Loss
Recognized in
Income
(Ineffective
Portion) | |
Interest rate contracts: | | $(23,447) | | | Interest expense | | | $ | (4,836 | ) | | | Other expense | | | $ | (938 | ) |
| | | | | |
Derivatives not designated as hedging instruments | | Location of Loss
Recognized in
Income on
Derivatives | | Amount of Loss
Recognized in
Income on
Derivatives | | | | | | | | | | |
Interest rate contracts: | | Other income | | $ | (99 | ) | | | | | | | | | | | | |
| | Other expense | | | 0 | | | | | | | | | | | | | |
120
24. Fair Value Disclosures
Fair value is defined as the price that would be received to sell an asset or paid to transfer a liability in an orderly transaction between market participants at the measurement dates. The accounting standard requires Susquehanna to maximize the use of observable inputs and minimize the use of unobservable inputs when measuring fair value. Observable inputs reflect the assumptions market participants would use in pricing the asset or liability developed based on market data obtained from sources independent of the reporting entity. Unobservable inputs reflect the reporting entity’s own assumptions about the assumptions market participants would use in pricing the asset or liability developed based on the best information available in the circumstances. Level 1 inputs are quoted prices (unadjusted) in active markets for identical assets or liabilities that the entity has the ability to access at the measurement date. Level 2 inputs are inputs other than quoted prices included within Level 1 that are observable for the asset or liability, either directly or indirectly. Level 3 inputs are unobservable inputs for the asset or liability. The level in the hierarchy within which the fair value measurement in its entirety falls is determined based on the lowest level input that is significant to the fair value measurement in its entirety.
The following is a description of Susquehanna’s valuation methodologies for assets and liabilities measured at fair value. These methods may produce a fair value measurement that may not be indicative of future fair values. Furthermore, while Susquehanna believes that its valuation methods are appropriate and consistent with other market participants, the use of different methodologies or assumptions to determine the fair value of certain financial instruments could result in a different estimate of fair value at the reporting date.
Securities
Where quoted prices are available in an active market, securities are classified in Level 1 of the valuation hierarchy. Securities in Level 1 are exchange-traded equities. If quoted market prices are not available for the specific security, then fair values are provided by third-party valuations service providers. These valuations service providers estimate fair values using pricing models and other acceptable valuation methodologies, such as quotes for similar securities and observable yield curves and spreads. As part of Susquehanna’s overall valuation process, management evaluates these methodologies to ensure that they result in representative of exit prices in Susquehanna’s principal markets. Securities in Level 2 include U.S. Government agencies, mortgage-backed securities, state and municipal securities, Federal Home Loan Bank stock, and Federal Reserve Bank stock. Securities in Level 3 include thinly traded bank stocks, collateralized debt obligations, trust preferred securities, and indexed-amortizing notes.
Derivatives
The fair values of interest rate swaps are determined using models that use readily observable market inputs and a market standard methodology applied to the contractual terms of the derivatives, including the period to maturity and interest rate indices. The methodology nets the discounted future fixed cash receipts (or payments) and the discounted expected variable cash payments (or receipts). The variable cash payments (or receipts) are based on an expectation of future interest rates derived from observable market interest rate curves. Susquehanna incorporates credit valuation adjustments to appropriately reflect both its own nonperformance risk and the respective counterparty’s nonperformance risk in the fair value measurements. In adjusting the fair value of its derivative contracts for the effect of nonperformance risk, Susquehanna has considered the impact of netting and any applicable credit enhancements, such as collateral postings and thresholds, mutual settlements, and guarantees.
Although Susquehanna has determined that the majority of the inputs used to value its derivatives fall within Level 2 of the fair value hierarchy, the credit valuation adjustments associated with its derivatives may utilize Level 3 inputs, such as estimates of current credit spreads to evaluate the likelihood of default by itself and its counterparties. However, as of December 31, 2010, Susquehanna has assessed the significance of the impact of the credit valuation adjustments on the overall valuation of its derivative positions and has determined that the
121
credit valuation adjustments are not significant to the overall valuation of its derivatives. As a result, Susquehanna has determined that its derivative valuations in their entirety are classified in Level 2 of the fair value hierarchy.
Assets and Liabilities Measured at Fair Value on a Recurring Basis
The following tables present the financial instruments carried at fair value at December 31, 2011 and December 31, 2010, on the consolidated balance sheets and by levels within the valuation hierarchy.
| | | | | | | | | | | | | | | | |
| | | December 31, 2011 | | | Fair Value Measurements at Reporting Date Using | |
Description | | | Quoted Prices in
Active Markets for
Identical Instruments
(Level 1) | | | Significant Other
Observable Inputs
(Level 2) | | | Significant
Unobservable Inputs
(Level 3) | |
Assets | | | | | | | | | | | | | | | | |
Available-for-sale securities: | | | | | | | | | | | | | | | | |
U.S. Government Agencies | | $ | 148,485 | | | $ | 0 | | | $ | 148,485 | | | $ | 0 | |
Obligations of states and political subdivisions | | | 401,979 | | | | | | | | 401,979 | | | | | |
Agency residential mortgage-backed securities | | | 1,531,404 | | | | | | | | 1,531,404 | | | | | |
Non-agency residential mortgage-backed securities | | | 69,071 | | | | | | | | 69,071 | | | | | |
Commercial mortgage-backed securities | | | 56,819 | | | | | | | | 56,819 | | | | | |
Other structured financial products | | | 13,293 | | | | | | | | 0 | | | | 13,293 | |
Other debt securities | | | 51,135 | | | | | | | | 51,135 | | | | | |
Equity securities of the FHLB | | | 77,593 | | | | | | | | 77,593 | | | | | |
Equity securities of the FRB | | | 50,225 | | | | | | | | 50,225 | | | | | |
Other equity securities | | | 23,103 | | | | 221 | | | | 19,452 | | | | 3,430 | |
Derivatives: (1) | | | | | | | | | | | | | | | | |
Designated as hedging instruments | | | 3,693 | | | | | | | | 3,693 | | | | | |
Not designated as hedging instruments | | | 22,770 | | | | | | | | 22,770 | | | | | |
| | | | | | | | | | | | | | | | |
Total | | $ | 2,449,570 | | | $ | 221 | | | $ | 2,432,626 | | | $ | 16,723 | |
| | | | | | | | | | | | | | | | |
Liabilities | | | | | | | | | | | | | | | | |
Derivatives: (2) | | | | | | | | | | | | | | | | |
Designated as hedging instruments | | $ | 52,028 | | | $ | 0 | | | $ | 52,028 | | | $ | 0 | |
Not designated as hedging instruments | | | 21,133 | | | | | | | | 21,133 | | | | | |
| | | | | | | | | | | | | | | | |
Total | | $ | 73,161 | | | $ | 0 | | | $ | 73,161 | | | $ | 0 | |
| | | | | | | | | | | | | | | | |
| (1) | Included in Other assets. |
| (2) | Included in Other liabilities. |
122
| | | | | | | | | | | | | | | | |
| | | | | | Fair Value Measurements at Reporting Date Using | |
Description | | December 31, 2010 | | | Quoted Prices in
Active Markets for
Identical Instruments
(Level 1) | | | Significant Other
Observable Inputs
(Level 2) | | | Significant
Unobservable Inputs
(Level 3) | |
Assets | | | | | | | | | | | | | | | | |
Available-for-sale securities: | | | | | | | | | | | | | | | | |
U.S. Government Agencies | | $ | 268,175 | | | $ | 0 | | | $ | 268,175 | | | $ | 0 | |
Obligations of states and political subdivisions | | | 396,660 | | | | | | | | 396,660 | | | | | |
Agency residential mortgage-backed securities | | | 1,323,569 | | | | | | | | 1,323,569 | | | | | |
Non-agency residential mortgage-backed securities | | | 116,811 | | | | | | | | 116,811 | | | | | |
Commercial mortgage-backed securities | | | 104,842 | | | | | | | | 104,842 | | | | | |
Other structured financial products | | | 12,503 | | | | | | | | 0 | | | | 12,503 | |
Other debt securities | | | 41,000 | | | | | | | | 41,000 | | | | | |
Equity securities of the FHLB | | | 71,065 | | | | | | | | 71,065 | | | | | |
Equity securities of the FRB | | | 50,225 | | | | | | | | 50,225 | | | | | |
Other equity securities | | | 24,093 | | | | 2,446 | | | | 18,266 | | | | 3,381 | |
Derivatives: (1) | | | | | | | | | | | | | | | | |
Designated as hedging instruments | | | 181 | | | | | | | | 181 | | | | | |
Not designated as hedging instruments | | | 17,167 | | | | | | | | 17,167 | | | | | |
| | | | | | | | | | | | | | | | |
Total | | $ | 2,426,291 | | | $ | 2,446 | | | $ | 2,407,961 | | | $ | 15,884 | |
| | | | | | | | | | | | | | | | |
Liabilities | | | | | | | | | | | | | | | | |
Derivatives: (2) | | | | | | | | | | | | | | | | |
Designated as hedging instruments | | $ | 31,793 | | | $ | 0 | | | $ | 31,793 | | | $ | 0 | |
Not designated as hedging instruments | | | 16,767 | | | | | | | | 16,767 | | | | | |
| | | | | | | | | | | | | | | | |
Total | | $ | 48,560 | | | $ | 0 | | | $ | 48,560 | | | $ | 0 | |
| | | | | | | | | | | | | | | | |
| (1) | Included in Other assets. |
| (2) | Included in Other liabilities. |
Assets Measured at Fair Value on a Recurring Basis Using Significant Unobservable Inputs
The following tables present roll-forwards of the balance sheet amounts for the twelve months ended December 31, 2011 and 2010, for financial instruments classified by Susquehanna within Level 3 of the valuation hierarchy.
123
| | | | | | | | | | | | |
| | | Available-for-sale Securities | | | | |
| | | Equity
Securities | | | Other
Structured
Financial
Products | | | Total | |
Balance at January 1, 2011 | | $ | 3,381 | | | $ | 12,503 | | | $ | 15,884 | |
Total gains or losses (realized/unrealized): | | | | | | | | | | | | |
Other-than-temporary impairment (1) | | | (46 | ) | | | 0 | | | | (46 | ) |
Included in other comprehensive income (before taxes) | | | 95 | | | | 790 | | | | 885 | |
| | | | | | | | | | | | |
Balance at December 31, 2011 | | $ | 3,430 | | | $ | 13,293 | | | $ | 16,723 | |
| | | | | | | | | | | | |
| | | | | | | | | | | | | | | | | | | | | | | | |
| | | Available-for-sale Securities | | | | | | | |
| | | Equity
Securities | | | Synthetic
Collateralized
Debt
Obligations | | | Other
Structured
Financial
Products | | | Non-agency
Residential
Mortgage-
backed
Securities | | | Interest-only
Strips | | | Total | |
Balance at January 1, 2010 | | $ | 4,081 | | | $ | 1,331 | | | $ | 14,113 | | | $ | 2,111 | | | $ | 17,840 | | | $ | 39,476 | |
Adjustments relating to the consolidation of variable interest entities | | | | | | | | | | | | | | | (2,111 | ) | | | (17,840 | ) | | | (19,951 | ) |
Total gains or losses (realized/unrealized): | | | | | | | | | | | | | | | | | | | | | | | | |
Other-than-temporary impairment (1) | | | (240 | ) | | | (1,331 | ) | | | 0 | | | | 0 | | | | 0 | | | | (1,571 | ) |
Included in other comprehensive income (before taxes) | | | (460 | ) | | | 0 | | | | (1,610 | ) | | | 0 | | | | 0 | | | | (2,070 | ) |
| | | | | | | | | | | | | | | | | | | | | | | | |
Balance at December 31, 2010 | | $ | 3,381 | | | $ | 0 | | | $ | 12,503 | | | $ | 0 | | | $ | 0 | | | $ | 15,884 | |
| | | | | | | | | | | | | | | | | | | | | | | | |
| (1) | Included in noninterest income, net impairment losses recognized in earnings. |
Assets Measured at Fair Value on a Nonrecurring Basis
Impaired loans
Impaired collateral dependent loans and other loans where the carrying value is based on the fair value of the underlying collateral, such as residential mortgage loans charged off in accordance with regulatory guidance, are measured at fair value on a nonrecurring basis. The fair value of the underlying collateral is incorporated into the estimate of the impairment of a loan. Most of Susquehanna’s impaired collateral dependent loans are secured by real estate. The value of the real estate collateral is determined through appraisals performed by third-party, licensed appraisers. As part of Susquehanna’s overall valuation process, management evaluates these third-party appraisals to ensure that they are representative of the exit prices in Susquehanna’s principal markets. Susquehanna considers the appraisals used in its impairment analysis to be Level 3 inputs. When the value of the real estate, less estimated costs to sell, is less than the principal balance of the loan, a specific reserve is established. Impaired loans are reviewed at least quarterly for additional impairment, and reserves are adjusted accordingly.
Foreclosed Assets
Other real estate property acquired through foreclosure is recorded at the lower of its carrying value or the fair value of the related real estate collateral at the transfer date, less estimated selling costs. The value of the real estate collateral is determined through appraisals performed by third party licensed appraisers. As part of
124
Susquehanna’s overall valuation process, management evaluates these third-party appraisals to ensure that they are representative of the exit prices in Susquehanna’s principal markets. Susquehanna considers the appraisals used in its impairment analysis to be Level 3 inputs.
The following tables present assets measured at fair value on a nonrecurring basis at December 31, 2011 and December 31, 2010, on the consolidated balance sheets and by the valuation hierarchy.
| | | | | | | | | | | | | | | | |
| | | | | | Quoted | | | | | | | |
| | | | | | Prices | | | | | | | |
| | | | | | in Active | | | Significant | | | | |
| | | | | | Markets for | | | Other | | | Significant | |
| | | | | | Identical | | | Observable | | | Unobservable | |
| | | | | | Instruments | | | Inputs | | | Inputs | |
Description | | December 31, 2011 | | | (Level 1) | | | (Level 2) | | | (Level 3) | |
Impaired loans | | $ | 71,062 | | | $ | 0 | | | $ | 0 | | | $ | 71,062 | |
Foreclosed assets | | | 41,050 | | | | 0 | | | | 0 | | | | 41,050 | |
| | | | | | | | | | | | | | | | |
| | $ | 112,112 | | | $ | 0 | | | $ | 0 | | | $ | 112,112 | |
| | | | | | | | | | | | | | | | |
Specific reserves for the year ended December 31, 2011 were reduced by $4,732. These specific reserves were taken into consideration when the required level of the allowance for loan and lease losses was determined at December 31, 2011.
| | | | | | | | | | | | | | | | |
Description | | December 31, 2010 | | | Quoted Prices in
Active Markets for
Identical Instruments
(Level 1) | | | Significant Other
Observable Inputs
(Level 2) | | | Significant
Unobservable Inputs
(Level 3) | |
Impaired loans | | $ | 103,818 | | | $ | 0 | | | $ | 0 | | | $ | 103,818 | |
Foreclosed assets | | | 18,489 | | | | 0 | | | | 0 | | | | 18,489 | |
| | | | | | | | | | | | | | | | |
| | $ | 122,307 | | | $ | 0 | | | $ | 0 | | | $ | 122,307 | |
| | | | | | | | | | | | | | | | |
Specific reserves for the year ended December 31, 2010 were reduced by $4,732. These specific reserves were taken into consideration when the required level of the allowance for loan and lease losses was determined at December 31, 2010.
Additional Disclosures about Fair Value of Financial Instruments
The following methods and assumptions were used to estimate the fair value of each class of financial instruments for which it is practicable to estimate that value:
Cash and due from banks and short-term investments
For those short-term instruments, the carrying amount is a reasonable estimate of fair value.
Investment securities
Refer to the above discussion on securities.
Loans and leases
Variable-rate loans, which do not expose Susquehanna to interest-rate risk, have a fair value that equals their carrying value, discounted for estimated future credit losses. The fair value of fixed-rate loans and leases was based upon the present value of projected cash flows. The discount rate was based upon the U.S. Treasury yield curve.
125
Deposits
The fair values of demand, interest-bearing demand, and savings deposits are the amounts payable on demand at the balance sheet date; recognition of the inherent funding value of these instruments is not permitted. The carrying value of variable-rate time deposits represents a reasonable estimate of fair value. The fair value of fixed-rate time deposits is based upon the discounted value of future cash flows expected to be paid at maturity, using the U.S. Treasury yield curve.
Short-term borrowings
For those short-term instruments, the carrying amount is a reasonable estimate of fair value.
FHLB borrowings and long-term debt
Fair values were based upon quoted rates of similar instruments issued by banking institutions with similar credit ratings.
Derivatives
Refer to the above discussion on derivatives.
Off-balance-sheet items
The fair values of unused commitments to lend and standby letters of credit are considered to be the same as their contractual amounts. The fair values of commitments to originate mortgage loans to be held for sale and their corresponding forward-sales agreements are calculated as the amounts that Susquehanna would agree to pay to transfer the liability or receive to sell the asset, after considering the likelihood of the commitments expiring.
The following table represents the carrying amounts and estimated fair values of Susquehanna’s financial instruments:
| | | | | | | | | | | | | | | | |
| | | December 31, 2011 | | | December 31, 2010 | |
| | | Carrying Amount | | | Fair Value | | | Carrying Amount | | | Fair Value | |
Financial assets: | | | | | | | | | | | | | | | | |
Cash and due from banks | | $ | 276,384 | | | $ | 276,384 | | | $ | 200,646 | | | $ | 200,646 | |
Short-term investments | | | 121,686 | | | | 121,686 | | | | 93,947 | | | | 93,947 | |
Investment securities | | | 2,431,515 | | | | 2,431,515 | | | | 2,417,611 | | | | 2,417,611 | |
Loans and leases | | | 10,259,830 | | | | 10,344,966 | | | | 9,441,363 | | | | 9,492,108 | |
Derivatives | | | 26,463 | | | | 26,463 | | | | 17,348 | | | | 17,348 | |
Financial liabilities: | | | | | | | | | | | | | | | | |
Deposits | | | 10,290,472 | | | | 9,953,598 | | | | 9,191,207 | | | | 9,265,942 | |
Short-term borrowings | | | 613,306 | | | | 613,306 | | | | 770,623 | | | | 770,623 | |
FHLB borrowings | | | 971,020 | | | | 967,163 | | | | 1,101,620 | | | | 1,167,743 | |
Long-term debt | | | 656,726 | | | | 622,167 | | | | 705,954 | | | | 683,628 | |
Derivatives | | | 73,161 | | | | 73,161 | | | | 48,560 | | | | 48,560 | |
126
25. Condensed Financial Statements of Parent Company
Balance Sheets
| | | | | | | | |
| | | December 31, | |
| | | 2011 | | | 2010 | |
Assets | | | | | | | | |
Cash in subsidiary banks | | $ | 97 | | | $ | 101 | �� |
Investments in and receivables from consolidated subsidiaries | | | 2,678,620 | | | | 2,460,882 | |
Other investment securities | | | 6,176 | | | | 6,252 | |
Premises and equipment, net | | | 3,803 | | | | 3,370 | |
Other assets | | | 63,733 | | | | 61,272 | |
| | | | | | | | |
Total assets | | $ | 2,752,429 | | | $ | 2,531,877 | |
| | | | | | | | |
Liabilities and Shareholders’ Equity | | | | | | | | |
Long-term debt | | $ | 150,000 | | | $ | 150,000 | |
Junior subordinated debentures | | | 323,317 | | | | 322,880 | |
Other liabilities | | | 89,484 | | | | 74,195 | |
| | | | | | | | |
Total liabilities | | | 562,801 | | | | 547,075 | |
Shareholders' equity | | | 2,189,628 | | | | 1,984,802 | |
| | | | | | | | |
Total liabilities and shareholders' equity | | $ | 2,752,429 | | | $ | 2,531,877 | |
| | | | | | | | |
Statements of Income
| | | | | | | | | | | | |
| | | Years Ended December 31, | |
| | | 2011 | | | 2010 | | | 2009 | |
Income: | | | | | | | | | | | | |
Dividends from bank subsidiary | | $ | 0 | | | $ | 0 | | | $ | 41,000 | |
Dividends from nonbank subsidiaries | | | 4,700 | | | | 7,000 | | | | 7,000 | |
Gains (losses) on sales of investment securities | | | (39 | ) | | | (32 | ) | | | (8 | ) |
Interest and management fees from bank subsidiary | | | 69,568 | | | | 69,062 | | | | 66,341 | |
Interest and management fees from nonbank subsidiaries | | | 2,162 | | | | 3,940 | | | | 16,270 | |
Other | | | 1,080 | | | | 3,360 | | | | 2,182 | |
| | | | | | | | | | | | |
Total income | | | 77,471 | | | | 83,330 | | | | 132,785 | |
| | | | | | | | | | | | |
Expenses: | | | | | | | | | | | | |
Interest | | | 31,881 | | | | 32,533 | | | | 28,863 | |
Other | | | 95,906 | | | | 77,995 | | | | 79,145 | |
| | | | | | | | | | | | |
Total expenses | | | 127,787 | | | | 110,528 | | | | 108,008 | |
| | | | | | | | | | | | |
Income before taxes and equity in undistributed income of subsidiaries | | | (50,316 | ) | | | (27,198 | ) | | | 24,777 | |
Income tax (benefit) provision | | | (5,320 | ) | | | (3,376 | ) | | | (1,587 | ) |
Equity in undistributed net income (losses) of subsidiaries | | | 99,901 | | | | 55,669 | | | | (13,689 | ) |
| | | | | | | | | | | | |
Net Income | | | 54,905 | | | | 31,847 | | | | 12,675 | |
Preferred stock dividends and accretion | | | 0 | | | | 15,572 | | | | 16,659 | |
| | | | | | | | | | | | |
Net Income (Loss) Applicable to Common Shareholders | | $ | 54,905 | | | $ | 16,275 | | | $ | (3,984 | ) |
| | | | | | | | | | | | |
127
Statements of Cash Flows
| | | | | | | | | | | | |
| | | Years Ended December 31, | |
| | | 2011 | | | 2010 | | | 2009 | |
Cash Flows from Operating Activities: | | | | | | | | | | | | |
Net income | | $ | 54,905 | | | $ | 31,847 | | | $ | 12,675 | |
Adjustments to reconcile net income to cash provided by operating activities: | | | | | | | | | | | | |
Depreciation and amortization | | | 3,758 | | | | 2,465 | | | | 3,878 | |
Realized (gain) loss on sale of available-for-sale securities | | | 39 | | | | 32 | | | | 8 | |
Equity in undistributed net income of subsidiaries | | | (99,901 | ) | | | (55,669 | ) | | | 13,689 | |
Other, net | | | 6,738 | | | | 3,062 | | | | 9,488 | |
| | | | | | | | | | | | |
Net cash provided by operating activities | | | (34,461 | ) | | | (18,263 | ) | | | 39,738 | |
| | | | | | | | | | | | |
Cash Flows from Investing Activities: | | | | | | | | | | | | |
Purchase of investment securities | | | (1,500 | ) | | | (1,500 | ) | | | 0 | |
Proceeds from the sale/maturities of investment securities | | | 1,461 | | | | 1,468 | | | | 0 | |
Capital expenditures | | | (1,400 | ) | | | (2,559 | ) | | | (3,657 | ) |
Net investment in subsidiaries | | | 48,873 | | | | (42,962 | ) | | | 7,000 | |
Acquisitions | | | (4 | ) | | | 0 | | | | 0 | |
| | | | | | | | | | | | |
Net cash provided by (used in) investing activities | | | 47,430 | | | | (45,553 | ) | | | 3,343 | |
| | | | | | | | | | | | |
Cash Flows from Financing Activities: | | | | | | | | | | | | |
Proceeds from issuance of common stock | | | 4,368 | | | | 330,721 | | | | 2,648 | |
Redemption of preferred stock | | | 0 | | | | (300,000 | ) | | | 0 | |
Redemption of warrant | | | (5,269 | ) | | | 0 | | | | 0 | |
Proceeds from issuance of long-term debt | | | 0 | | | | 47,749 | | | | 0 | |
Purchase of treasury stock | | | (860 | ) | | | 0 | | | | 0 | |
Dividends paid | | | (11,212 | ) | | | (14,604 | ) | | | (45,773 | ) |
| | | | | | | | | | | | |
Net cash provided by (used in) financing activities | | | (12,973 | ) | | | 63,866 | | | | (43,125 | ) |
| | | | | | | | | | | | |
Net decrease in cash and cash equivalents | | | (4 | ) | | | 50 | | | | (44 | ) |
Cash and cash equivalents at January 1, | | | 101 | | | | 51 | | | | 95 | |
| | | | | | | | | | | | |
Cash and cash equivalents at December 31, | | | $97 | | | | $101 | | | | $51 | |
| | | | | | | | | | | | |
128
26. Summary of Quarterly Financial Data (Unaudited)
| | | | | | | | | | | | | | | | |
| | | 2011 | |
Quarter Ended | | March 31 | | | June 30 | | | September 30 | | | December 31 | |
Interest income | | $ | 147,481 | | | $ | 147,278 | | | $ | 147,208 | | | $ | 152,801 | |
Interest expense | | | 42,458 | | | | 41,192 | | | | 40,369 | | | | 37,600 | |
| | | | | | �� | | | | | | | | | | |
Net interest income | | | 105,023 | | | | 106,086 | | | | 106,839 | | | | 115,201 | |
Provision for loan and lease losses | | | 35,000 | | | | 28,000 | | | | 25,000 | | | | 22,000 | |
| | | | | | | | | | | | | | | | |
Net interest income after provision for loan and lease losses | | | 70,023 | | | | 78,086 | | | | 81,839 | | | | 93,201 | |
Noninterest income | | | 37,467 | | | | 37,054 | | | | 36,800 | | | | 71,347 | |
Noninterest expense | | | 95,883 | | | | 101,157 | | | | 100,745 | | | | 162,395 | |
| | | | | | | | | | | | | | | | |
Income before income taxes | | | 11,607 | | | | 13,983 | | | | 17,894 | | | | 2,153 | |
Provision for income taxes | | | 1,846 | | | | 2,928 | | | | 2,934 | | | | (16,976 | ) |
| | | | | | | | | | | | | | | | |
Net income | | $ | 9,761 | | | $ | 11,055 | | | $ | 14,960 | | | $ | 19,129 | |
| | | | | | | | | | | | | | | | |
Earnings per common share: | | | | | | | | | | | | | | | | |
Basic | | $ | 0.08 | | | $ | 0.09 | | | $ | 0.12 | | | $ | 0.12 | |
Diluted | | $ | 0.08 | | | $ | 0.09 | | | $ | 0.12 | | | $ | 0.12 | |
| | | | | | | | | | | | | | | | |
| | | 2010 | |
Quarter Ended | | March 31 | | | June 30 | | | September 30 | | | December 31 | |
Interest income | | $ | 154,956 | | | $ | 154,082 | | | $ | 152,489 | | | $ | 152,168 | |
Interest expense | | | 46,665 | | | | 47,851 | | | | 47,078 | | | | 45,595 | |
| | | | | | | | | | | | | | | | |
Net interest income | | | 108,291 | | | | 106,231 | | | | 105,411 | | | | 106,573 | |
Provision for loan and lease losses | | | 45,000 | | | | 43,000 | | | | 40,000 | | | | 35,000 | |
| | | | | | | | | | | | | | | | |
Net interest income after provision for loan and lease losses | | | 63,291 | | | | 63,231 | | | | 65,411 | | | | 71,573 | |
Noninterest income | | | 38,682 | | | | 38,271 | | | | 35,407 | | | | 39,788 | |
Noninterest expense | | | 94,304 | | | | 96,163 | | | | 96,212 | | | | 95,971 | |
| | | | | | | | | | | | | | | | |
Income before income taxes | | | 7,669 | | | | 5,339 | | | | 4,606 | | | | 15,390 | |
Provision for (benefit from) income taxes | | | 166 | | | | (52 | ) | | | (1,374 | ) | | | 2,417 | |
| | | | | | | | | | | | | | | | |
Net income | | | 7,503 | | | | 5,391 | | | | 5,980 | | | | 12,973 | |
Preferred stock dividends and accretion | | | 4,188 | | | | 6,754 | | | | 1,396 | | | | 3,234 | |
| | | | | | | | | | | | | | | | |
Net income (loss) applicable to common shareholders | | $ | 3,315 | | | $ | (1,363 | ) | | $ | 4,584 | | | $ | 9,739 | |
| | | | | | | | | | | | | | | | |
Earnings per common share: | | | | | | | | | | | | | | | | |
Basic | | $ | 0.04 | | | $ | (0.01 | ) | | $ | 0.04 | | | $ | 0.08 | |
Diluted | | $ | 0.04 | | | $ | (0.01 | ) | | $ | 0.04 | | | $ | 0.08 | |
27. Subsequent Event
On February 17, 2012 Susquehanna acquired all of the outstanding common stock of Tower Bancorp, Inc. (“Tower”), headquartered in Harrisburg, Pennsylvania, in a stock and cash transaction, in which Tower was merged with and into Susquehanna. Tower shareholders had the option to elect to receive either 3.4696 shares of Susquehanna common stock or $28.00 in cash for each share of Tower common stock held immediately prior to the effective time of the Tower merger, with $88.0 million of the aggregate consideration being paid in cash. A total of 30.8 million shares of Susquehanna common stock were issued in connection with the Tower merger.
129
MANAGEMENT’S RESPONSIBILITY FOR FINANCIAL STATEMENTS and REPORT ON INTERNAL CONTROL OVER FINANCIAL REPORTING
Management of Susquehanna Bancshares, Inc. (the “Company”) is responsible for the preparation of the Company’s consolidated financial statements and related information as they appear in this report. Management believes that the consolidated financial statements of Susquehanna Bancshares, Inc. fairly reflect the form and substance of transactions and that the financial statements present the Company’s financial position and results of operations in conformity with generally accepted accounting principles. Management also has included in the Company’s financial statements amounts that are based on estimates and judgments which it believes are reasonable under the circumstances.
The independent registered public accounting firm of PricewaterhouseCoopers LLP audits the Company’s consolidated financial statements in accordance with the standards of the Public Company Accounting Oversight Board (United States).
The Board of Directors of the Company has an Audit Committee composed of four non-management Directors. The Committee meets periodically with financial management, the internal auditors and the independent registered public accounting firm to review accounting, control, auditing, corporate governance and financial reporting matters.
Management of Susquehanna Bancshares, Inc. is responsible for establishing and maintaining adequate internal control over financial reporting, as such term is defined in Exchange Act Rule 13a-15(f). Under the supervision and with the participation of management, including the Chief Executive Officer and Chief Financial Officer, we conducted an evaluation of the effectiveness of our internal control over financial reporting based on the framework inInternal Control — Integrated Framework issued by the Committee of Sponsoring Organizations of the Treadway Commission. Based on our evaluation under the framework inInternal Control — Integrated Framework, management concluded that our internal control over financial reporting was effective as of December 31, 2011. Management’s assessment of the effectiveness of our internal control over financial reporting as of December 31, 2011 has been audited by PricewaterhouseCoopers LLP, an independent registered public accounting firm, as stated in their report which is included herein.
130
Report of Independent Registered Public Accounting Firm

To the Board of Directors and Stockholders
of Susquehanna Bancshares, Inc.
In our opinion, the accompanying consolidated balance sheets and the related consolidated statements of income, shareholders’ equity and cash flows present fairly, in all material respects, the financial position of Susquehanna Bancshares, Inc. and its subsidiaries (the “Company”) at December 31, 2011 and 2010, and the results of their operations and their cash flows for each of the three years in the period ended December 31, 2011 in conformity with accounting principles generally accepted in the United States of America. Also in our opinion, the Company maintained, in all material respects, effective internal control over financial reporting as of December 31, 2011, based on criteria established inInternal Control—Integrated Framework issued by the Committee of Sponsoring Organizations of the Treadway Commission (COSO). The Company’s management is responsible for these financial statements, for maintaining effective internal control over financial reporting and for its assessment of the effectiveness of internal control over financial reporting, included in Management’s Report on Internal Control over Financial Reporting. Our responsibility is to express opinions on these financial statements and on the Company’s internal control over financial reporting based on our integrated audits. We conducted our audits in accordance with the standards of the Public Company Accounting Oversight Board (United States). Those standards require that we plan and perform the audits to obtain reasonable assurance about whether the financial statements are free of material misstatement and whether effective internal control over financial reporting was maintained in all material respects. Our audits of the financial statements included examining, on a test basis, evidence supporting the amounts and disclosures in the financial statements, assessing the accounting principles used and significant estimates made by management, and evaluating the overall financial statement presentation. Our audit of internal control over financial reporting included obtaining an understanding of internal control over financial reporting, assessing the risk that a material weakness exists, and testing and evaluating the design and operating effectiveness of internal control based on the assessed risk. Our audits also included performing such other procedures as we considered necessary in the circumstances. We believe that our audits provide a reasonable basis for our opinions.
A company’s internal control over financial reporting is a process designed to provide reasonable assurance regarding the reliability of financial reporting and the preparation of financial statements for external purposes in accordance with generally accepted accounting principles. A company’s internal control over financial reporting includes those policies and procedures that (i) pertain to the maintenance of records that, in reasonable detail, accurately and fairly reflect the transactions and dispositions of the assets of the company; (ii) provide reasonable assurance that transactions are recorded as necessary to permit preparation of financial statements in accordance with generally accepted accounting principles, and that receipts and expenditures of the company are being made only in accordance with authorizations of management and directors of the company; and (iii) provide reasonable assurance regarding prevention or timely detection of unauthorized acquisition, use, or disposition of the company’s assets that could have a material effect on the financial statements.
Because of its inherent limitations, internal control over financial reporting may not prevent or detect misstatements. Also, projections of any evaluation of effectiveness to future periods are subject to the risk that controls may become inadequate because of changes in conditions, or that the degree of compliance with the policies or procedures may deteriorate.
McLean, Virginia
February 29, 2012
PricewaterhouseCoopers LLP, 1800 Tysons Boulevard, Suite 900, McLean, VA 22102
131
T: (703)918 3000, F: (703)918 3100, www.pwc.com/us
Item 9. Changes in and Disagreements with Accountants on Accounting and Financial Disclosure
There has been no change in our principal accountants in over two years. There have been no disagreements with such principal accountants on any matters of accounting principles, practices, financial statement disclosure, auditing scope, or procedures.
Item 9A. Controls and Procedures
Evaluation of Disclosure Controls and Procedures.We have established disclosure controls and procedures to ensure that material information relating to us, including our consolidated subsidiaries, is made known to the officers who certify our financial reports and to other members of senior management and the Board of Directors.
We carried out an evaluation, under the supervision and with the participation of our management, including our Chief Executive Officer and Chief Financial Officer, of the design and operating effectiveness of our disclosure controls and procedures, as defined in Exchange Act Rules 13a-15(e) and 15d-15(e). Based upon that evaluation, our Chief Executive Officer and Chief Financial Officer concluded that, as of December 31, 2011, our disclosure controls and procedures are effective to ensure that the information required to be disclosed by us in the reports that we file or submit under the Securities Exchange Act of 1934 is recorded, processed, summarized, and reported within the time periods specified in the SEC rules and forms.
Management’s Responsibility for Financial Statements and Report on Internal Control over Financial Reporting are included in Part II, Item 7, “Financial Statements and Supplementary Data,” and are incorporated by reference herein.
Changes in Internal Controls. There were no significant changes in our internal controls or other factors that could significantly affect these controls subsequent to the date of their evaluation, including any significant deficiencies or material weaknesses in internal controls that would require corrective action.
Item 9B. Other Information
Not applicable.
132
PART III
Item 10. Directors, Executive Officers and Corporate Governance
Certain portions of the information required by this Item will be included in the Proxy Statement for the 2012 annual meeting in the Election of Directors section, the Corporate Governance section, the Director Compensation section, the Executive Officer Compensation section, and the Compliance with Section 16(a) of the Exchange Act section, each of which sections is incorporated herein by reference. The information concerning our executive officers required by this Item is provided under the caption “Executive Officers” in Item 1, Part I of this Annual Report on Form 10-K.
Item 11. Executive Compensation
The information required by this Item will be included in the Proxy Statement for the 2012 annual meeting in the Director Compensation section and the Executive Officer Compensation section, and is incorporated herein by reference.
Item 12. Security Ownership of Certain Beneficial Owners and Management and Related Shareholder Matters
The information required by this Item will be included in the Proxy Statement for the 2012 annual meeting in the Security Ownership of Certain Beneficial Owners and Holdings of Susquehanna’s Management section and the Executive Officer Compensation — Equity Compensation Plan Information section, and is incorporated herein by reference.
Item 13. Certain Relationships and Related Transactions, and Director Independence
The information required by this Item will be included in the Proxy Statement for the 2012 annual meeting in the Certain Relationships and Related Transactions section and the Corporate Governance — Board Independence section, each of which sections is incorporated herein by reference.
Item 14. Principal Accountant Fees and Services
The information required by this Item will be included in the Proxy Statement for the 2012 annual meeting in the Annual Audit Information — Fees Billed by Independent Accountant to Susquehanna section, and is incorporated herein by reference.
133
PART IV
Item 15. Exhibits and Financial Statement Schedules
| (a) | The following documents are filed as part of this report: |
| | (1) | Financial Statements. See Item 7 of this report for the consolidated financial statements of Susquehanna and its subsidiaries (including the index to financial statements). |
| | | Financial Statement Schedules. Not Applicable. |
| | | Exhibits 2.1-99.2. A list of the Exhibits to this Form 10-K is set forth in (b) below. |
| | (2) 2.1 | Agreement and Plan of Merger by and between Susquehanna and Abington Bancorp, Inc. dated January 26, 2011, incorporated by reference to Exhibit 2.1 of Susquehanna’s Current Report on Form 8-K, filed January 27, 2011. |
| | 2.2 | Agreement and Plan of Merger between Susquehanna and Tower Bancorp, Inc., dated June 20, 2011 and amended on September 28, 2011, incorporated by reference to the conformed version filed as Annex A to the Joint Proxy Statement/Prospectus on Form S-4, filed October 3, 2011. |
| | (3) 3.1 | Amended and Restated Articles of Incorporation, dated May 6, 2011, incorporated by reference to Exhibit 3.1 to Susquehanna’s Quarterly Report on Form 10-Q, filed August 8, 2011. |
| | 3.1.a | Statement with Respect to Shares of Fixed Rate Cumulative Perpetual Preferred Stock, Series A of Susquehanna, incorporated by reference to Exhibit 3.1 to Susquehanna’s Current Report on Form 8-K, filed December 12, 2008. |
| | 3.2 | Amended and Restated Bylaws, dated February 27, 2008, as amended January 19, 2011 and February 24, 2011, incorporated by reference to Exhibit 3.1 to Susquehanna’s Current Report on Form 8-K, filed March 2, 2011. |
| | (4) | Instruments defining the rights of security holders including indentures. The rights of the holders of Susquehanna’s Common Stock and the rights of Susquehanna’s note holders are contained in the following documents or instruments, which are incorporated herein by reference. |
| | 4.1 | Indenture, dated as of November 4, 2002, by and between Susquehanna and JP Morgan Trust Company, National Association, relating to the 6.05% subordinated notes due 2012, incorporated by reference to Exhibit 4.1 to Susquehanna’s Registration Statement on Form S-4, Registration No. 333-102265. |
| | 4.2 | Global Note relating to the 6.05% subordinated notes due 2012, dated February 27, 2003, incorporated by reference to Exhibit 4.3 to Susquehanna’s Annual Report on Form 10-K for the fiscal year ended December 31, 2002. |
| | 4.3 | Registration Rights Agreement, dated as of November 4, 2002, by and among Susquehanna, Keefe Bruyette & Woods Inc. and the other initial purchasers referred to therein, incorporated by reference to Exhibit 4.3 to Susquehanna’s Registration Statement on Form S-4, Registration Statement No. 333-102265. |
| | 4.4 | First Supplemental Indenture, dated May 3, 2004, to Indenture dated November 4, 2002, by and between Susquehanna and J.P. Morgan Trust Company, National Association, relating to the 4.75% fixed rate/floating rate subordinated notes due 2014, incorporated by reference to Exhibit 4.1 to Susquehanna’s Quarterly Report on Form 10-Q for the quarterly period ended June 30, 2004. |
134
| | 4.5 | Global Note to the 4.75% fixed rate/floating rate subordinated notes due 2014, dated May 3, 2004, incorporated by reference to Exhibit 4.2 to Susquehanna’s Quarterly Report on Form 10-Q for the quarterly period ended June 30, 2004. |
| | 4.6 | Registration Rights Agreement, dated as of May 3, 2004, by and among Susquehanna, Keefe Bruyette & Woods Inc. and the other initial purchasers referred to therein, incorporated by reference to Exhibit 4.3 to Susquehanna’s Quarterly Report on Form 10-Q for the quarterly period ended June 30, 2004. |
| | 4.7 | Amended and Restated Trust Agreement, dated as of December 12, 2007, among Susquehanna, The Bank of New York, The Bank of New York (Delaware), the Administrative Trustees named therein and the Holders, incorporated by reference to Exhibit 4.1 to Susquehanna’s Current Report on Form 8-K, filed December 12, 2007. |
| | 4.8 | Guarantee Agreement between Susquehanna and The Bank of New York, as Trustee, dated December 12, 2007, incorporated by reference to Exhibit 4.2 to Susquehanna’s Current Report on Form 8-K, filed December 12, 2007. |
| | 4.9 | Supplemental Indenture between Susquehanna and The Bank of New York, as Trustee, dated December 12, 2007, incorporated by reference to Exhibit 4.3 to Susquehanna’s Current Report on Form 8-K, filed December 12, 2007. |
| | 4.10 | 9.375% Capital Efficient Note, incorporated by reference to Exhibit 4.4 to Susquehanna’s Current Report on Form 8-K, filed December 12, 2007. |
| | 4.11 | 9.375% Capital Securities Note, incorporated by reference to Exhibit 4.11 to Susquehanna’s Annual Report on Form 10-K for the fiscal year ended December 31, 2007. |
| | 4.12 | Indenture, between Susquehanna and The Bank of New York Mellon Trust Company, N.A., as Trustee, relating to the Subordinated Debt, incorporated by reference to Exhibit 4.2 to Susquehanna’s Registration Statement on Form S-3, filed March 8, 2010. |
| | 4.13 | Amended and Restated Trust Agreement, dated as of March 16, 2010, by and among Susquehanna, as depositor, The Bank of New York Mellon Trust Company, N.A., as property trustee, BNY Mellon Trust of Delaware, as Delaware trustee, the administrative trustees named therein and the Holders as defined therein, incorporated by reference to Exhibit 4.1 to Susquehanna’s Current Report on Form 8-K, filed March 16, 2010. |
| | 4.14 | Guarantee Agreement, dated as of March 16, 2010, between Susquehanna, as guarantor, and The Bank of New York Mellon Trust Company, N.A., as trustee, incorporated by reference to Exhibit 4.2 to Susquehanna’s Current Report on Form 8-K, filed March 16, 2010. |
| | 4.15 | First Supplemental Indenture, dated as of March 16, 2010, between Susquehanna and The Bank of New York Mellon Trust Company, N.A., as trustee, incorporated by reference to Exhibit 4.3 to Susquehanna’s Current Report on Form 8-K, filed March 16, 2010. |
| | 4.16 | 11% Cumulative Trust Preferred Securities, Series II, incorporated by reference to Exhibit 4.4 to Susquehanna’s Current Report on Form 8-K, filed March 16, 2010. |
| | 4.17 | 11% Junior Subordinated Deferrable Interest Debentures, Series II, incorporated by reference to Exhibit 4.5 to Susquehanna’s Current Report on Form 8-K, filed March 16, 2010. |
| | 4.18 | Pursuant to Item 601(b)(4)(iii)(A) of Regulation S-K, copies of instruments defining the rights of holders of long-term debt are not filed. Susquehanna agrees to furnish a copy thereof to the Securities and Exchange Commission upon request. |
| | 10.1 | Employment Agreement, as amended and restated effective December 30, 2010, between Susquehanna and William J. Reuter, incorporated by reference to Exhibit 10.1 to |
135
| | Susquehanna’s Amendment No. 1 on Form 8/K-A to Susquehanna’s Current Report on Form 8-K, filed December 30, 2010.* |
| | 10.2 | First Amendment to Employment Agreement, dated December 19, 2011, between Susquehanna and William J. Reuter, attached hereto as Exhibit 10.2.* |
| | 10.3 | Employment Agreement, dated November 16, 2007, by and among Susquehanna and Eddie L. Dunklebarger, incorporated by reference to Exhibit 10.1 of Susquehanna’s Current Report on Form 8-K, filed November 21, 2007. Amendment to Employment Agreement dated February 27, 2009, by Susquehanna and Eddie L. Dunklebarger, incorporated by reference to Exhibit 10.5 of Susquehanna’s Annual Report on Form 10-K for the fiscal year ended December 31, 2008.* |
| | 10.4 | Employment Agreement, as amended and restated effective January 1, 2009, between Susquehanna and Drew K. Hostetter, incorporated by reference to Exhibit 10.6 to Susquehanna’s Annual Report on Form 10-K for the fiscal year ended December 31, 2008.* |
| | 10.5 | First Amendment to Employment Agreement, dated December 19, 2011, between Susquehanna and Drew K. Hostetter, attached hereto as Exhibit 10.5.* |
| | 10.6 | Employment Agreement, dated December 28, 2010, effective as of January 28, 2011, between Susquehanna and Gregory A. Duncan, incorporated by reference to Exhibit 10.2 to Susquehanna’s Amendment No. 1 on Form 8/K-A to Susquehanna’s Current Report on Form 8-K, filed December 30, 2010.* |
| | 10.7 | First Amendment to Employment Agreement, dated December 19, 2011, between Susquehanna and Gregory A. Duncan, attached hereto as Exhibit 10.7.* |
| | 10.8 | Employment Agreement dated November 4, 2003, effective as of January 1, 2004, between Susquehanna, Valley Forge Asset Management Corporation and Bernard A. Francis, Jr., incorporated by reference to Exhibit 10.1 to Susquehanna’s Quarterly Report on Form 10-Q for the quarterly period ended March 31, 2004. First Amendment to Employment Agreement dated January 18, 2005, incorporated by reference to Exhibit 10.1 to Susquehanna’s Current Report on Form 8-K filed January 21, 2005. Second Amendment to Employment Agreement dated February 26, 2007, incorporated by reference to Exhibit 10.1 of Susquehanna’s Quarterly Report on Form 10-Q for the quarterly period ended March 31, 2007. Letter Agreement between Susquehanna, Valley Forge Asset Management Corporation and Bernard A. Francis, Jr., dated December 1, 2008, incorporated by reference to Exhibit 10.7 to Susquehanna’s Annual Report on Form 10-K for the fiscal year ended December 31, 2008.* |
| | 10.9 | Fourth Amendment to Employment Agreement, dated December 19, 2011, between Susquehanna, Valley Forge Asset Management Corp. and Bernard a. Francis, Jr., attached hereto as Exhibit 10.9.* |
| | 10.10 | Employment Agreement, as amended and restated effective January 1, 2009, between Susquehanna and Michael M. Quick, incorporated by reference to Exhibit 10.8 to Susquehanna’s Annual Report on Form 10-K for the fiscal year ended December 31, 2008.* |
| | 10.11 | First Amendment to Employment Agreement, dated December 19, 2011, between Susquehanna and Michael M. Quick, attached hereto as Exhibit 10.11.* |
| | 10.12 | Employment Agreement, as amended and restated effective January 1, 2009, between Susquehanna and James G. Pierné, incorporated by reference to Exhibit 10.9 to Susquehanna’s Annual Report on Form 10-K for the fiscal year ended December 31, 2008.* |
| | 10.13 | Employment Agreement, as amended and restated effective January 1, 2009, between Susquehanna and Edward Balderston, Jr., incorporated by reference to Exhibit 10.10 to Susquehanna’s Annual Report on Form 10-K for the fiscal year ended December 31, 2008. |
136
| | 10.14 | Consulting Services Agreement, dated December 20, 2011, between Susquehanna and Edward Balderston, Jr., incorporated by reference to Exhibit 10.1 to Susquehanna’s Current Report on Form 8-K, filed December 20, 2011.* |
| | 10.15 | Employment Agreement, as amended and restated effective January 1, 2009, between Susquehanna and Rodney A. Lefever, incorporated by reference to Exhibit 10.13 to Susquehanna’s Annual Report on Form 10-K for the fiscal year ended December 31, 2008.* |
| | 10.16 | Employment Agreement, effective January 1, 2009, between Susquehanna and Lisa M. Cavage, incorporated by reference to Exhibit 10.14 to Susquehanna’s Annual Report on Form 10-K for the fiscal year ended December 31, 2008.* |
| | 10.17 | Employment Agreement, as amended and restated effective January 1, 2009, between Susquehanna and John H. Montgomery, incorporated by reference to Exhibit 10.15 to Susquehanna’s Annual Report on Form 10-K for the fiscal year ended December 31, 2008.* |
| | 10.18 | Employment Agreement, as amended and restated effective January 1, 2009, between Susquehanna and Michael E. Hough, incorporated by reference to Exhibit 10.16 to Susquehanna’s Annual Report on Form 10-K for the fiscal year ended December 31, 2008.* |
| | 10.19 | First Amendment to Employment Agreement, dated December 19, 2011, between Susquehanna and Michael E. Hough, attached hereto as Exhibit 10.19.* |
| | 10.20 | Employment Agreement, effective January 1, 2009, between Susquehanna and Joseph R. Lizza, incorporated by reference to Exhibit 10.17 to Susquehanna’s Annual Report on Form 10-K for the fiscal year ended December 31, 2008.* |
| | 10.21 | Employment Agreement, dated January 26, 2011, effective October 1, 2011, between Susquehanna and Robert W. White, incorporated by reference to Exhibit 10.1 to Susquehanna’s Current Report on Form 8-K, filed October 3, 2011.* |
| | 10.22 | Recoupment Policy with Respect to Incentive Awards, attached hereto as Exhibit 10.22.* |
| | 10.23 | Susquehanna’s Executive Deferred Income Plan, effective January 1, 2009, incorporated by reference to Exhibit 10.21 to Susquehanna’s Annual Report on Form 10-K for the fiscal year ended December 31, 2008.* |
| | 10.24 | Susquehanna’s Supplemental Executive Retirement Plan as amended and restated effective January 1, 2009, incorporated by reference to Exhibit 10.22 to Susquehanna’s Annual Report on Form 10-K for the fiscal year ended December 31, 2008.* |
| | 10.25 | Forms of The Insurance Trust for Susquehanna Bancshares Banks and Affiliates Split Dollar Agreement and Split Dollar Policy Endorsement, incorporated by reference to Exhibit 10(v) to Susquehanna’s Annual Report on Form 10-K for the fiscal year ended December 31, 2001.* |
| | 10.26 | Community Banks, Inc. Survivor Income Agreement, including Split Dollar Addendum to Community Banks, Inc. Survivor Income Agreement, incorporated by reference to Exhibit 10.18 to Susquehanna’s Annual Report on Form 10-K for the fiscal year ending December 31, 2007.* |
| | 10.27 | Amended and Restated Salary Continuation Agreement between Community Banks, Inc. and Eddie L. Dunklebarger, dated January 1, 2004, as amended November 16, 2007, incorporated by reference to Exhibit 10.19 to Susquehanna’s Annual Report on Form 10-K for the fiscal year ended December 31, 2007.* |
| | 10.28 | Susquehanna’s Key Employee Severance Pay Plan, amended and restated as of January 1, 2009, incorporated by reference to Exhibit 10.26 to Susquehanna’s Annual Report on Form 10-K for the fiscal year ended December 31, 2008.* |
| | 10.29 | Descriptions of Executive Life Insurance Program, Executive Supplemental Long Term Disability Plan, Francis Life Insurance Policy and the bonus programs offered by Valley |
137
| | Forge Asset Management Corp., incorporated by reference to Exhibit 10.15 to Susquehanna’s Annual Report on Form 10-K for the fiscal year ended December 31, 2006.* |
| | 10.30 | Susquehanna’s Amended and Restated 2005 Equity Compensation Plan, as amended, incorporated by reference to Exhibit 10.1 to Susquehanna’s Quarterly Report on Form 10-Q for the quarter ended March 31, 2010.* |
| | 10.31 | Form of Restricted Stock Unit Grant Agreement for Susquehanna’s senior executive officers, incorporated by reference to Exhibit 10.29 to Susquehanna’s Annual Report on Form 10-K for the fiscal year ended December 31, 2010.* |
| | 10.32 | Form of Amended and Restated 2005 Equity Compensation Plan Amended and Restated Restricted Stock Agreement for Susquehanna’s executive officers, incorporated by reference to Exhibit 10.30 to Susquehanna’s Annual Report on Form 10-K for the fiscal year ended December 31, 2010.* |
| | 10.33 | Form of Amended and Restated 2005 Equity Compensation Plan Restricted Stock Agreement for Susquehanna’s executives, incorporated by reference to Exhibit 10.31 to Susquehanna’s Annual Report on Form 10-K for the fiscal year ended December 31, 2010.* |
| | 10.34 | Form of Amended and Restated 2005 Equity Compensation Plan Restricted Stock Agreement for Susquehanna’s directors, incorporated by reference to Exhibit 10.32 to Susquehanna’s Annual Report on Form 10-K for the fiscal year ended December 31, 2010.* |
| | 10.35 | Form of Amended and Restated 2005 Equity Compensation Plan Nonqualified Stock Option Agreement, incorporated by reference to Exhibit 10.33 to Susquehanna’s Annual Report on Form 10-K for the fiscal year ended December 31, 2010.* |
| | 10.36 | Susquehanna’s Equity Compensation Plan, incorporated by reference to Exhibit 10.17 to Susquehanna’s Annual Report on Form 10-K for the fiscal year ended December 31, 2006.* |
| | 10.37 | Susquehanna’s Long Term Incentive Plan, incorporated by reference to Exhibit 10.1 to Susquehanna’s Current Report on Form 8-K, filed March 2, 2011.* |
| | 10.38 | Form of Susquehanna’s Long Term Incentive Plan Restricted Stock Unit Grant Agreement, incorporated by reference to Exhibit 10.2 to Susquehanna’s Current Report on Form 8-K, filed March 2, 2011.* |
| | 10.39 | Form of Susquehanna’s Long Term Incentive Plan Nonqualified Stock Option Grant Agreement, incorporated by reference to Exhibit 10.3 to Susquehanna’s Current Report on Form 8-K, filed March 2, 2011.* |
| | 10.40 | Susquehanna’s Short Term Incentive Plan, incorporated by reference to Exhibit 10.4 to Susquehanna’s Current Report on Form 8-K, filed March 2, 2011.* |
| | 10.41 | Description of Restricted Stock Unit awards granted to Messrs. Reuter, Dunklebarger, Hostetter, Francis and Balderston on May 17, 2011 pursuant to Susquehanna’s Amended and Restated 2005 Equity Incentive Plan and Susquehanna’s Long Term Incentive Plan, incorporated by reference to Susquehanna’s Current Report on Form 8-K, filed May 23, 2011.* |
| | 10.42 | Community Banks, Inc. 1998 Long-Term Incentive Plan, incorporated by reference to Exhibit 99.1 of Susquehanna’s Post-Effective Amendment No. 1 on Form S-8 to Registration Statement on Form S-4 (File No. 333-144397).* |
| | 10.43 | Director Compensation Schedule, effective January 1, 2009, incorporated by reference to Exhibit 10.31 to Susquehanna’s Annual Report on Form 10-K for the fiscal year ended December 31, 2008.* |
138
| | 10.44 | Community Banks, Inc. Directors Stock Option Plan, incorporated by reference to Exhibit 99.2 to Susquehanna’s Post-Effective Amendment No. 1 on Form S-8 to Registration Statement on Form S-4 (File No. 333-144397).* |
| | 10.45 | The Farmers and Merchants National Bank of Hagerstown Executive Supplemental Income Plan, dated March 6, 1984, incorporated by reference to Exhibit 10.28 to Susquehanna’s Annual Report on Form 10-K for the fiscal year ended December 31, 2007.* |
| | 10.46 | Description of Eddie L. Dunklebarger term life insurance policy, incorporated by reference to Exhibit 10.35 to Susquehanna’s Annual Report on Form 10-K for the fiscal year ended December 31, 2008.* |
| | 10.47 | A copy of Susquehanna’s Excessive and Luxury Expenditure Policy, available atwww.susquehanna.net. Click on “Investor Relations”, then “Governance Documents,” then “Excessive and Luxury Expenditure Policy.”* |
| | 10.48 | 2010 Amended and Restated Servicing Agreement between and among Auto Lenders Liquidation Center, Inc., Boston Service Company, Inc., d/b/a Hann Financial Service Corp., Susquehanna Auto Lease Exchange, LLC and SALE NYC, LLC, dated December 22, 2010, incorporated by reference to Exhibit 10.41 to Susquehanna’s Annual Report on Form 10-K for the fiscal year ended December 31, 2010. First Amendment to the 2010 Amended and Restated Servicing Agreement, dated December 21, 2011, attached hereto as Exhibit 10.48. |
| | 10.49 | Abington Bancorp, Inc. Amended and Restated 2005 Stock Option Plan, incorporated by reference to Exhibit 99.1 to Susquehanna’s Post-Effective Amendment No. 1 on Form S-8 to Registration Statement on Form S-4, filed October 13, 2011 (File No. 333-172626).* |
| | 10.50 | Abington Bancorp, Inc. 2007 Stock Option Plan, incorporated by reference to Exhibit 99.2 to Susquehanna’s Post-Effective Amendment No. 1 on Form S-8 to Registration Statement on Form S-4, filed October 13, 2011 (File No. 333-172626).* |
| | 10.51 | Form of Split Dollar Insurance Agreement between Abington Bank and each of Robert W. White, Thomas J. Wasekanes, Frank Kovalcheck, Jack J. Sandoski and Eric L. Golden, attached hereto as Exhibit 10.51.* |
| | 14.1 | A copy of Susquehanna’s Code of Ethics is available on Susquehanna’s website atwww.susquehanna.net. Click on “Investor Relations,” then “Governance Documents,” then “Code of Ethics of Susquehanna Bancshares, Inc.” |
| | (21) | Subsidiaries of the registrant. Filed herewith. |
| | (23) | Consent of PricewaterhouseCoopers LLP. Filed herewith. |
| | (31) | Rule 13a-14(a)/15d-14(a) Certifications. |
| | 31.1 | Rule 13a-14(a)/15d-14(a) Certification by Chief Executive Officer. Filed herewith as Exhibit 31.1. |
| | 31.2 | Rule 13a-14(a)/15d-14(a) Certification by Chief Financial Officer. Filed herewith as Exhibit 31.2. |
| | (32) | Section 1350 Certifications. Filed herewith. |
| | 101.INS | XBRL Instance Document.** *** |
| | 101.SCH | XBRL Taxonomy Extension Schema Document.** |
139
| | 101.CAL | XBRL Taxonomy Extension Calculation Linkbase Document.** |
| | 101.LAB | XBRL Taxonomy Extension Label Linkbase Document.** |
| | 101.PRE | XBRL Taxonomy Extension Presentation Linkbase Document.** |
| | 101.DEF | XBRL Taxonomy Extension Definitions Linkbase Document.** |
| * | Management contract or compensation plan or arrangement required to be filed or incorporated as an exhibit. |
| ** | These interactive data files are being furnished as part of this Current Report, and, in accordance with Rule 402 of Regulation S-1, shall not be deemed filed for purposes of Section 11 or 12 of the Securities Act of 1933, as amended, or Section 18 of the Securities Exchange Act of 1934, as amended, or otherwise subject to liability under those sections. |
| *** | Attached as Exhibit 101 to this report are the following documents formatted in XBRL (Extensible Business Reporting Language): (i) the Consolidated Statement of Earnings for the years ended December 31, 2011, 2010 and 2009, (ii) the Consolidated Balance Sheet at December 31, 2011 and December 31, 2010, (iii) the Consolidated Statement of Cash Flows for the years ended December 31, 2011, 2010 and 2009 and (iv) the Consolidated Statement of Shareholders’ Equity for the years ended December 31, 2011, 2010 and 2009. Users of this data are advised pursuant to Rule 401 of Regulation S-T that the financial and other information contained in the XBRL documents is unaudited and that these are not the official publicly filed financial statements of Susquehanna Bancshares, Inc. The purpose of submitting these XBRL formatted documents is to test the related format and technology and, as a result, investors should continue to rely on the official filed version of the furnished documents and not rely on this information in making investment decisions. |
| (c) | Financial Statement Schedule. None Required. |
140
SIGNATURES
Pursuant to the requirements of Section 13 or 15(d) of the Securities Exchange Act of 1934, the registrant has duly caused this Report to be signed on its behalf by the undersigned, thereunto duly authorized.
| | |
| SUSQUEHANNA BANCSHARES, INC. |
| |
| By: | | /s/ WILLIAM J. REUTER |
| | William J. Reuter, Chairman of the Board and Chief Executive Officer |
Dated: February 24, 2012
Pursuant to the requirements of the Securities Exchange Act of 1934, this Report has been signed by the following persons on behalf of the registrant and in the capacities and on the dates indicated.
| | | | |
Signature | | Title | | Date |
| | |
/s/ WILLIAM J. REUTER (William J. Reuter) | | Chairman of the Board, Chief Executive Officer and Director (Principal Executive Officer) | | February 24, 2012 |
| | |
/s/ DREW K. HOSTETTER (Drew K. Hostetter) | | Executive Vice President, Treasurer and Chief Financial Officer (Principal Financial and Accounting Officer) | | February 24, 2012 |
| | |
/s/ ANTHONY J. AGNONE, SR. (Anthony J. Agnone, Sr.) | | Director | | February 24, 2012 |
| | |
/s/ WAYNE E. ALTER, JR. (Wayne E. Alter, Jr.) | | Director | | February 24, 2012 |
| | |
/s/ PETER DESOTO (Peter DeSoto) | | Director | | February 24, 2012 |
| | |
/s/ EDDIE L. DUNKLEBARGER (Eddie L. Dunklebarger) | | Director | | February 24, 2012 |
| | |
/s/ HENRY R. GIBBEL (Henry R. Gibbel) | | Director | | February 24, 2012 |
| | |
/s/ BRUCE A. HEPBURN (Bruce A. Hepburn) | | Director | | February 24, 2012 |
| | |
/s/ DONALD L. HOFFMAN (Donald L. Hoffman) | | Director | | February 24, 2012 |
| | |
/s/ SARA G. KIRKLAND (Sara G. Kirkland) | | Director | | February 24, 2012 |
141
SECURITIES AND EXCHANGE COMMISSION
SUSQUEHANNA BANCSHARES, INC.
Form 10-K, December 31, 2011
[SIGNATURES CONTINUED]
| | | | |
| | |
/s/ JEFFREY F. LEHMAN. (Jeffrey F. Lehman.) | | Director | | February 24, 2012 |
| | |
/s/ GUY W. MILLER, JR. (Guy W. Miller, Jr.) | | Director | | February 24, 2012 |
| | |
/s/ MICHAEL A. MORELLO (Michael A. Morello) | | Director | | February 24, 2012 |
| | |
/s/ SCOTT J. NEWKAM (Scott J. Newkam) | | Director | | February 24, 2012 |
| | |
/s/ ROBERT E. POOLE, JR. (Robert E. Poole, Jr.) | | Director | | February 24, 2012 |
| | |
/s/ ANDREW S. SAMUEL (Andrew S. Samuel) | | Director | | February 24, 2012 |
| | |
/s/ CHRISTINE SEARS (Christine Sears) | | Director | | February 24, 2012 |
| | |
/s/ JAMES A. ULSH (James A. Ulsh) | | Director | | February 24, 2012 |
| | |
/s/ ROBERT W. WHITE (Robert W. White) | | Director | | February 24, 2012 |
| | |
/s/ ROGER V. WIEST (Roger V. Wiest) | | Director | | February 24, 2012 |
[END OF SIGNATURE PAGES]
142
EXHIBIT INDEX
Exhibit Numbers Description and Method of Filing
Item 14. Exhibits and Financial Statement Schedules
| | (a) | The following documents are filed as part of this report: |
| | (1) | Financial Statements. See Item 7 of this report for the consolidated financial statements of Susquehanna and its subsidiaries (including the index to financial statements). |
| | | Financial Statement Schedules. Not Applicable. |
| | | Exhibits 2.1-99.2. A list of the Exhibits to this Form 10-K is set forth in (b) below. |
| | (2) 2.1 | Agreement and Plan of Merger by and between Susquehanna and Abington Bancorp, Inc. dated January 26, 2011, incorporated by reference to Exhibit 2.1 of Susquehanna’s Current Report on Form 8-K, filed January 27, 2011. |
| | 2.2 | Agreement and Plan of Merger between Susquehanna and Tower Bancorp, Inc., dated June 20, 2011 and amended on September 28, 2011, incorporated by reference to the conformed version filed as Annex A to the Joint Proxy Statement/Prospectus on Form S-4, filed October 3, 2011. |
| | (3) 3.1 | Amended and Restated Articles of Incorporation, dated May 6, 2011, incorporated by reference to Exhibit 3.1 to Susquehanna’s Quarterly Report on Form 10-Q, filed August 8, 2011. |
| | 3.1.a | Statement with Respect to Shares of Fixed Rate Cumulative Perpetual Preferred Stock, Series A of Susquehanna, incorporated by reference to Exhibit 3.1 to Susquehanna’s Current Report on Form 8-K, filed December 12, 2008. |
| | 3.2 | Amended and Restated Bylaws, dated February 27, 2008, as amended January 19, 2011 and February 24, 2011, incorporated by reference to Exhibit 3.1 to Susquehanna’s Current Report on Form 8-K, filed March 2, 2011. |
| | (4) | Instruments defining the rights of security holders including indentures. The rights of the holders of Susquehanna's Common Stock and the rights of Susquehanna's note holders are contained in the following documents or instruments, which are incorporated herein by reference. |
| | 4.1 | Indenture, dated as of November 4, 2002, by and between Susquehanna and JP Morgan Trust Company, National Association, relating to the 6.05% subordinated notes due 2012, incorporated by reference to Exhibit 4.1 to Susquehanna’s Registration Statement on Form S-4, Registration No. 333-102265. |
| | 4.2 | Global Note relating to the 6.05% subordinated notes due 2012, dated February 27, 2003, incorporated by reference to Exhibit 4.3 to Susquehanna’s Annual Report on Form 10-K for the fiscal year ended December 31, 2002. |
| | 4.3 | Registration Rights Agreement, dated as of November 4, 2002, by and among Susquehanna, Keefe Bruyette & Woods Inc. and the other initial purchasers referred to therein, incorporated by reference to Exhibit 4.3 to Susquehanna’s Registration Statement on Form S-4, Registration Statement No. 333-102265. |
| | 4.4 | First Supplemental Indenture, dated May 3, 2004, to Indenture dated November 4, 2002, by and between Susquehanna and J.P. Morgan Trust Company, National Association, |
143
| | relating to the 4.75% fixed rate/floating rate subordinated notes due 2014, incorporated by reference to Exhibit 4.1 to Susquehanna’s Quarterly Report on Form 10-Q for the quarterly period ended June 30, 2004. |
| | 4.5 | Global Note to the 4.75% fixed rate/floating rate subordinated notes due 2014, dated May 3, 2004, incorporated by reference to Exhibit 4.2 to Susquehanna’s Quarterly Report on Form 10-Q for the quarterly period ended June 30, 2004. |
| | 4.6 | Registration Rights Agreement, dated as of May 3, 2004, by and among Susquehanna, Keefe Bruyette & Woods Inc. and the other initial purchasers referred to therein, incorporated by reference to Exhibit 4.3 to Susquehanna’s Quarterly Report on Form 10-Q for the quarterly period ended June 30, 2004. |
| | 4.7 | Amended and Restated Trust Agreement, dated as of December 12, 2007, among Susquehanna, The Bank of New York, The Bank of New York (Delaware), the Administrative Trustees named therein and the Holders, incorporated by reference to Exhibit 4.1 to Susquehanna’s Current Report on Form 8-K, filed December 12, 2007. |
| | 4.8 | Guarantee Agreement between Susquehanna and The Bank of New York, as Trustee, dated December 12, 2007, incorporated by reference to Exhibit 4.2 to Susquehanna’s Current Report on Form 8-K, filed December 12, 2007. |
| | 4.9 | Supplemental Indenture between Susquehanna and The Bank of New York, as Trustee, dated December 12, 2007, incorporated by reference to Exhibit 4.3 to Susquehanna’s Current Report on Form 8-K, filed December 12, 2007. |
| | 4.10 | 9.375% Capital Efficient Note, incorporated by reference to Exhibit 4.4 to Susquehanna’s Current Report on Form 8-K, filed December 12, 2007. |
| | 4.11 | 9.375% Capital Securities Note, incorporated by reference to Exhibit 4.11 to Susquehanna’s Annual Report on Form 10-K for the fiscal year ended December 31, 2007. |
| | 4.12 | Indenture, between Susquehanna and The Bank of New York Mellon Trust Company, N.A., as Trustee, relating to the Subordinated Debt, incorporated by reference to Exhibit 4.2 to Susquehanna’s Registration Statement on Form S-3, filed March 8, 2010. |
| | 4.13 | Amended and Restated Trust Agreement, dated as of March 16, 2010, by and among Susquehanna, as depositor, The Bank of New York Mellon Trust Company, N.A., as property trustee, BNY Mellon Trust of Delaware, as Delaware trustee, the administrative trustees named therein and the Holders as defined therein, incorporated by reference to Exhibit 4.1 to Susquehanna’s Current Report on Form 8-K, filed March 16, 2010. |
| | 4.14 | Guarantee Agreement, dated as of March 16, 2010, between Susquehanna, as guarantor, and The Bank of New York Mellon Trust Company, N.A., as trustee, incorporated by reference to Exhibit 4.2 to Susquehanna’s Current Report on Form 8-K, filed March 16, 2010. |
| | 4.15 | First Supplemental Indenture, dated as of March 16, 2010, between Susquehanna and The Bank of New York Mellon Trust Company, N.A., as trustee, incorporated by reference to Exhibit 4.3 to Susquehanna’s Current Report on Form 8-K, filed March 16, 2010. |
| | 4.16 | 11% Cumulative Trust Preferred Securities, Series II, incorporated by reference to Exhibit 4.4 to Susquehanna’s Current Report on Form 8-K, filed March 16, 2010. |
| | 4.17 | 11% Junior Subordinated Deferrable Interest Debentures, Series II, incorporated by reference to Exhibit 4.5 to Susquehanna’s Current Report on Form 8-K, filed March 16, 2010. |
144
| | 4.18 | Pursuant to Item 601(b)(4)(iii)(A) of Regulation S-K, copies of instruments defining the rights of holders of long-term debt are not filed. Susquehanna agrees to furnish a copy thereof to the Securities and Exchange Commission upon request. |
| | 10.1 | Employment Agreement, as amended and restated effective December 30, 2010, between Susquehanna and William J. Reuter, incorporated by reference to Exhibit 10.1 to Susquehanna’s Amendment No. 1 on Form 8/K-A to Susquehanna’s Current Report on Form 8-K, filed December 30, 2010.* |
| | 10.2 | First Amendment to Employment Agreement, dated December 19, 2011, between Susquehanna and William J. Reuter, attached hereto as Exhibit 10.2.* |
| | 10.3 | Employment Agreement, dated November 16, 2007, by and among Susquehanna and Eddie L. Dunklebarger, incorporated by reference to Exhibit 10.1 of Susquehanna’s Current Report on Form 8-K, filed November 21, 2007. Amendment to Employment Agreement dated February 27, 2009, by Susquehanna and Eddie L. Dunklebarger, incorporated by reference to Exhibit 10.5 of Susquehanna’s Annual Report on Form 10-K for the fiscal year ended December 31, 2008.* |
| | 10.4 | Employment Agreement, as amended and restated effective January 1, 2009, between Susquehanna and Drew K. Hostetter, incorporated by reference to Exhibit 10.6 to Susquehanna’s Annual Report on Form 10-K for the fiscal year ended December 31, 2008. |
| | 10.5 | First Amendment to Employment Agreement, dated December 19, 2011, between Susquehanna and Drew K. Hostetter, attached hereto as Exhibit 10.5.* |
| | 10.6 | Employment Agreement, dated December 28, 2010, effective as of January 28, 2011, between Susquehanna and Gregory A. Duncan, incorporated by reference to Exhibit 10.2 to Susquehanna’s Amendment No. 1 on Form 8/K-A to Susquehanna’s Current Report on Form 8-K, filed December 30, 2010.* |
| | 10.7 | First Amendment to Employment Agreement, dated December 19, 2011, between Susquehanna and Gregory A. Duncan, attached hereto as Exhibit 10.7.* |
| | 10.8 | Employment Agreement dated November 4, 2003, effective as of January 1, 2004, between Susquehanna, Valley Forge Asset Management Corporation and Bernard A. Francis, Jr., incorporated by reference to Exhibit 10.1 to Susquehanna’s Quarterly Report on Form 10-Q for the quarterly period ended March 31, 2004. First Amendment to Employment Agreement dated January 18, 2005, incorporated by reference to Exhibit 10.1 to Susquehanna’s Current Report on Form 8-K filed January 21, 2005. Second Amendment to Employment Agreement dated February 26, 2007, incorporated by reference to Exhibit 10.1 of Susquehanna’s Quarterly Report on Form 10-Q for the quarterly period ended March 31, 2007. Letter Agreement between Susquehanna, Valley Forge Asset Management Corporation and Bernard A. Francis, Jr., dated December 1, 2008, incorporated by reference to Exhibit 10.7 to Susquehanna’s Annual Report on Form 10-K for the fiscal year ended December 31, 2008.* |
| | 10.9 | Fourth Amendment to Employment Agreement, dated December 19, 2011, between Susquehanna, Valley Forge Asset Management Corp. and Bernard a. Francis, Jr., attached hereto as Exhibit 10.9.* |
| | 10.10 | Employment Agreement, as amended and restated effective January 1, 2009, between Susquehanna and Michael M. Quick, incorporated by reference to Exhibit 10.8 to Susquehanna’s Annual Report on Form 10-K for the fiscal year ended December 31, 2008.* |
| | 10.11 | First Amendment to Employment Agreement, dated December 19, 2011, between Susquehanna and Michael M. Quick, attached hereto as Exhibit 10.11.* |
145
| | 10.12 | Employment Agreement, as amended and restated effective January 1, 2009, between Susquehanna and James G. Pierné, incorporated by reference to Exhibit 10.9 to Susquehanna’s Annual Report on Form 10-K for the fiscal year ended December 31, 2008.* |
| | 10.13 | Employment Agreement, as amended and restated effective January 1, 2009, between Susquehanna and Edward Balderston, Jr., incorporated by reference to Exhibit 10.10 to Susquehanna’s Annual Report on Form 10-K for the fiscal year ended December 31, 2008.* |
| | 10.14 | Consulting Services Agreement, dated December 20, 2011, between Susquehanna and Edward Balderston, Jr., incorporated by reference to Exhibit 10.1 to Susquehanna’s Current Report on Form 8-K, filed December 20, 2011.* |
| | 10.15 | Employment Agreement, as amended and restated effective January 1, 2009, between Susquehanna and Rodney A. Lefever, incorporated by reference to Exhibit 10.13 to Susquehanna’s Annual Report on Form 10-K for the fiscal year ended December 31, 2008.* |
| | 10.16 | Employment Agreement, effective January 1, 2009, between Susquehanna and Lisa M. Cavage, incorporated by reference to Exhibit 10.14 to Susquehanna’s Annual Report on Form 10-K for the fiscal year ended December 31, 2008.* |
| | 10.17 | Employment Agreement, as amended and restated effective January 1, 2009, between Susquehanna and John H. Montgomery, incorporated by reference to Exhibit 10.15 to Susquehanna’s Annual Report on Form 10-K for the fiscal year ended December 31, 2008.* |
| | 10.18 | Employment Agreement, as amended and restated effective January 1, 2009, between Susquehanna and Michael E. Hough, incorporated by reference to Exhibit 10.16 to Susquehanna’s Annual Report on Form 10-K for the fiscal year ended December 31, 2008.* |
| | 10.19 | First Amendment to Employment Agreement, dated December 19, 2011, between Susquehanna and Michael E. Hough, attached hereto as Exhibit 10.19.* |
| | 10.20 | Employment Agreement, effective January 1, 2009, between Susquehanna and Joseph R. Lizza, incorporated by reference to Exhibit 10.17 to Susquehanna’s Annual Report on Form 10-K for the fiscal year ended December 31, 2008.* |
| | 10.21 | Employment Agreement, dated January 26, 2011, effective October 1, 2011, between Susquehanna and Robert W. White, incorporated by reference to Exhibit 10.1 to Susquehanna’s Current Report on Form 8-K, filed October 3, 2011.* |
| | 10.22 | Recoupment Policy with Respect to Incentive Awards, attached hereto as Exhibit 10.22.* |
| | 10.23 | Susquehanna’s Executive Deferred Income Plan, effective January 1, 2009, incorporated by reference to Exhibit 10.21 to Susquehanna’s Annual Report on Form 10-K for the fiscal year ended December 31, 2008.* |
| | 10.24 | Susquehanna’s Supplemental Executive Retirement Plan as amended and restated effective January 1, 2009, incorporated by reference to Exhibit 10.22 to Susquehanna’s Annual Report on Form 10-K for the fiscal year ended December 31, 2008.* |
| | 10.25 | Forms of The Insurance Trust for Susquehanna Bancshares Banks and Affiliates Split Dollar Agreement and Split Dollar Policy Endorsement, incorporated by reference to Exhibit 10(v) to Susquehanna’s Annual Report on Form 10-K for the fiscal year ended December 31, 2001.* |
| | 10.26 | Community Banks, Inc. Survivor Income Agreement, including Split Dollar Addendum to Community Banks, Inc. Survivor Income Agreement, incorporated by reference to Exhibit 10.18 to Susquehanna’s Annual Report on Form 10-K for the fiscal year ending December 31, 2007.* |
| | 10.27 | Amended and Restated Salary Continuation Agreement between Community Banks, Inc. and Eddie L. Dunklebarger, dated January 1, 2004, as amended November 16, 2007, |
146
| | incorporated by reference to Exhibit 10.19 to Susquehanna’s Annual Report on Form 10-K for the fiscal year ended December 31, 2007.* |
| | 10.28 | Susquehanna’s Key Employee Severance Pay Plan, amended and restated as of January 1, 2009, incorporated by reference to Exhibit 10.26 to Susquehanna’s Annual Report on Form 10-K for the fiscal year ended December 31, 2008.* |
| | 10.29 | Descriptions of Executive Life Insurance Program, Executive Supplemental Long Term Disability Plan, Francis Life Insurance Policy and the bonus programs offered by Valley Forge Asset Management Corp., incorporated by reference to Exhibit 10.15 to Susquehanna’s Annual Report on Form 10-K for the fiscal year ended December 31, 2006.* |
| | 10.30 | Susquehanna’s Amended and Restated 2005 Equity Compensation Plan, as amended, incorporated by reference to Exhibit 10.1 to Susquehanna’s Quarterly Report on Form 10-Q for the quarter ended March 31, 2010.* |
| | 10.31 | Form of Restricted Stock Unit Grant Agreement for Susquehanna’s senior executive officers, incorporated by reference to Exhibit 10.29 to Susquehanna’s Annual Report on Form 10-K for the fiscal year ended December 31, 2010.* |
| | 10.32 | Form of Amended and Restated 2005 Equity Compensation Plan Amended and Restated Restricted Stock Agreement for Susquehanna’s executive officers, incorporated by reference to Exhibit 10.30 to Susquehanna’s Annual Report on Form 10-K for the fiscal year ended December 31, 2010.* |
| | 10.33 | Form of Amended and Restated 2005 Equity Compensation Plan Restricted Stock Agreement for Susquehanna’s executives, incorporated by reference to Exhibit 10.31 to Susquehanna’s Annual Report on Form 10-K for the fiscal year ended December 31, 2010.* |
| | 10.34 | Form of Amended and Restated 2005 Equity Compensation Plan Restricted Stock Agreement for Susquehanna’s directors, incorporated by reference to Exhibit 10.32 to Susquehanna’s Annual Report on Form 10-K for the fiscal year ended December 31, 2010.* |
| | 10.35 | Form of Amended and Restated 2005 Equity Compensation Plan Nonqualified Stock Option Agreement, incorporated by reference to Exhibit 10.33 to Susquehanna’s Annual Report on Form 10-K for the fiscal year ended December 31, 2010.* |
| | 10.36 | Susquehanna’s Equity Compensation Plan, incorporated by reference to Exhibit 10.17 to Susquehanna’s Annual Report on Form 10-K for the fiscal year ended December 31, 2006.* |
| | 10.37 | Susquehanna’s Long Term Incentive Plan, incorporated by reference to Exhibit 10.1 to Susquehanna’s Current Report on Form 8-K, filed March 2, 2011.* |
| | 10.38 | Form of Susquehanna’s Long Term Incentive Plan Restricted Stock Unit Grant Agreement, incorporated by reference to Exhibit 10.2 to Susquehanna’s Current Report on Form 8-K, filed March 2, 2011.* |
| | 10.39 | Form of Susquehanna’s Long Term Incentive Plan Nonqualified Stock Option Grant Agreement, incorporated by reference to Exhibit 10.3 to Susquehanna’s Current Report on Form 8-K, filed March 2, 2011.* |
| | 10.40 | Susquehanna’s Short Term Incentive Plan, incorporated by reference to Exhibit 10.4 to Susquehanna’s Current Report on Form 8-K, filed March 2, 2011.* |
| | 10.41 | Description of Restricted Stock Unit awards granted to Messrs. Reuter, Dunklebarger, Hostetter, Francis and Balderston on May 17, 2011 pursuant to Susquehanna’s Amended and Restated 2005 Equity Incentive Plan and Susquehanna’s Long Term Incentive Plan, incorporated by reference to Susquehanna’s Current Report on Form 8-K, filed May 23, 2011.* |
147
| | 10.42 | Community Banks, Inc. 1998 Long-Term Incentive Plan, incorporated by reference to Exhibit 99.1 of Susquehanna’s Post-Effective Amendment No. 1 on Form S-8 to Registration Statement on Form S-4 (File No. 333-144397).* |
| | 10.43 | Director Compensation Schedule, effective January 1, 2009, incorporated by reference to Exhibit 10.31 to Susquehanna’s Annual Report on Form 10-K for the fiscal year ended December 31, 2008.* |
| | 10.44 | Community Banks, Inc. Directors Stock Option Plan, incorporated by reference to Exhibit 99.2 to Susquehanna’s Post-Effective Amendment No. 1 on Form S-8 to Registration Statement on Form S-4 (File No. 333-144397).* |
| | 10.45 | The Farmers and Merchants National Bank of Hagerstown Executive Supplemental Income Plan, dated March 6, 1984, incorporated by reference to Exhibit 10.28 to Susquehanna’s Annual Report on Form 10-K for the fiscal year ended December 31, 2007.* |
| | 10.46 | Description of Eddie L. Dunklebarger term life insurance policy, incorporated by reference to Exhibit 10.35 to Susquehanna’s Annual Report on Form 10-K for the fiscal year ended December 31, 2008.* |
| | 10.47 | A copy of Susquehanna’s Excessive and Luxury Expenditure Policy, available atwww.susquehanna.net. Click on “Investor Relations”, then “Governance Documents,” then “Excessive and Luxury Expenditure Policy.”* |
| | 10.48 | 2010 Amended and Restated Servicing Agreement between and among Auto Lenders Liquidation Center, Inc., Boston Service Company, Inc., d/b/a Hann Financial Service Corp., Susquehanna Auto Lease Exchange, LLC and SALE NYC, LLC, dated December 22, 2010, incorporated by reference to Exhibit 10.41 to Susquehanna’s Annual Report on Form 10-K for the fiscal year ended December 31, 2010. First Amendment to the 2010 Amended and Restated Servicing Agreement, dated December 21, 2011, attached hereto as Exhibit 10.48. |
| | 10.49 | Abington Bancorp, Inc. Amended and Restated 2005 Stock Option Plan, incorporated by reference to Exhibit 99.1 to Susquehanna’s Post-Effective Amendment No. 1 on Form S-8 to Registration Statement on Form S-4, filed October 13, 2011 (File No. 333-172626).* |
| | 10.50 | Abington Bancorp, Inc. 2007 Stock Option Plan, incorporated by reference to Exhibit 99.2 to Susquehanna’s Post-Effective Amendment No. 1 on Form S-8 to Registration Statement on Form S-4, filed October 13, 2011 (File No. 333-172626).* |
| | 10.51 | Form of Split Dollar Insurance Agreement between Abington Bank and each of Robert W. White, Thomas J. Wasekanes, Frank Kovalcheck, Jack J. Sandoski and Eric L. Golden, attached hereto as Exhibit 10.51.* |
| | 14.1 | A copy of Susquehanna’s Code of Ethics is available on Susquehanna’s website atwww.susquehanna.net. Click on “Investor Relations,” then “Governance Documents,” then “Code of Ethics of Susquehanna Bancshares, Inc.” |
| | (21) | Subsidiaries of the registrant. Filed herewith. |
| | (23) | Consent of PricewaterhouseCoopers LLP. Filed herewith. |
| | (31) | Rule 13a-14(a)/15d-14(a) Certifications. |
| | 31.1 | Rule 13a-14(a)/15d-14(a) Certification by Chief Executive Officer. Filed herewith as Exhibit 31.1. |
148
| | 31.2 | Rule 13a-14(a)/15d-14(a) Certification by Chief Financial Officer. Filed herewith as Exhibit 31.2. |
| | (32) | Section 1350 Certifications. Filed herewith. |
| | 101.INS | XBRL Instance Document.** *** |
| | 101.SCH | XBRL Taxonomy Extension Schema Document.** |
| | 101.CAL | XBRL Taxonomy Extension Calculation Linkbase Document.** |
| | 101.LAB | XBRL Taxonomy Extension Label Linkbase Document.** |
| | 101.PRE | XBRL Taxonomy Extension Presentation Linkbase Document.** |
| | 101.DEF | XBRL Taxonomy Extension Definitions Linkbase Document.** |
| * | Management contract or compensation plan or arrangement required to be filed or incorporated as an exhibit. |
| ** | These interactive data files are being furnished as part of this Current Report, and, in accordance with Rule 402 of Regulation S-1, shall not be deemed filed for purposes of Section 11 or 12 of the Securities Act of 1933, as amended, or Section 18 of the Securities Exchange Act of 1934, as amended, or otherwise subject to liability under those sections. |
| *** | Attached as Exhibit 101 to this report are the following documents formatted in XBRL (Extensible Business Reporting Language): (i) the Consolidated Statement of Earnings for the years ended December 31, 2011, 2010 and 2009, (ii) the Consolidated Balance Sheet at December 31, 2011 and December 31, 2010, (iii) the Consolidated Statement of Cash Flows for the years ended December 31, 2011, 2010 and 2009 and (iv) the Consolidated Statement of Shareholders' Equity for the years ended December 31, 2011, 2010 and 2009. Users of this data are advised pursuant to Rule 401 of Regulation S-T that the financial and other information contained in the XBRL documents is unaudited and that these are not the official publicly filed financial statements of Susquehanna Bancshares, Inc. The purpose of submitting these XBRL formatted documents is to test the related format and technology and, as a result, investors should continue to rely on the official filed version of the furnished documents and not rely on this information in making investment decisions. |
| (c) | Financial Statement Schedule. None Required. |
149