Exhibit 99.1


Susquehanna Bancshares, Inc.
Lititz, Pennsylvania
William J. Reuter – Chairman and CEO
Drew K. Hostetter – Chief Financial Officer
Michael M. Quick – Chief Corporate Credit Officer
Forward-Looking Statements
During the course of this presentation, we may make projections and other forward-looking statements regarding events or the future financial performance of Susquehanna, including the impact of the acquisitions of Abington Bancorp and Tower Bancorp, as well as projected capital ratios, efficiency ratios, net income and earnings. We wish to caution you that these forward-looking statements may differ materially from actual results due to a number of risks and uncertainties. For a more detailed description of the factors that may affect Susquehanna’s operating results, we refer you to our filings with the Securities & Exchange Commission, including our annual report on Form 10-K for the year ended December 31, 2011. Susquehanna assumes no obligation to update the forward-looking statements made during this presentation.
For more information, please visit our Web site at:
www.susquehanna.net
Susquehanna Profile
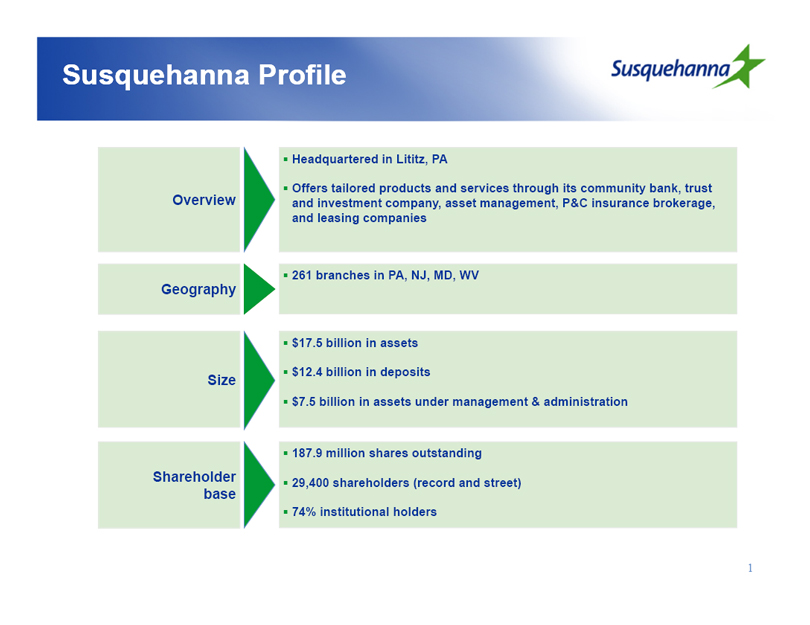
Overview
Headquartered in Lititz, PA
Offers tailored products and services through its community bank, trust and investment company, asset management, P&C insurance brokerage, and leasing companies
Geography
261 branches in PA, NJ, MD, WV
Size
$17.5 billion in assets
$12.4 billion in deposits
$7.5 billion in assets under management & administration
Shareholder base
187.9 million shares outstanding
29,400 shareholders (record and street)
74% institutional holders
1
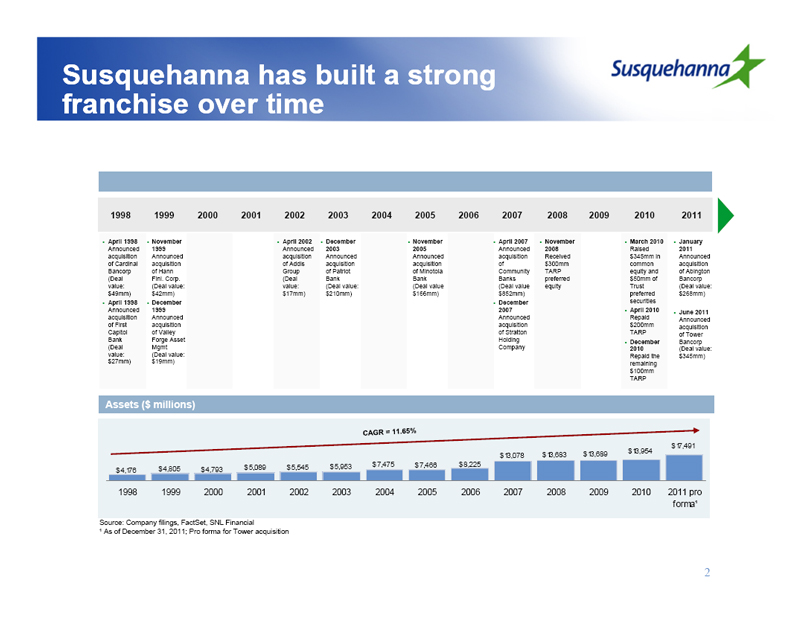
Susquehanna has built a strong franchise over time
1998
April 1998 Announced acquisition of Cardinal Bancorp (Deal value: $49mm)
April 1998 Announced acquisition of First Capitol Bank (Deal value: $27mm)
1999
November 1999 Announced acquisition of Hann Finl. Corp. (Deal value: $42mm)
December 1999 Announced acquisition of Valley Forge Asset Mgmt (Deal value: $19mm)
2000
2001
2002
April 2002 Announced acquisition of Addis Group (Deal value: $17mm)
2003
December 2003 Announced acquisition of Patriot Bank (Deal value: $210mm)
2004
2005
November 2005 Announced acquisition of Minotola Bank (Deal value $166mm)
2006
2007
April 2007 Announced acquisition of Community Banks (Deal value $852mm)
December 2007 Announced acquisition of Stratton Holding Company
2008
November 2008 Received $300mm TARP preferred equity
2009
March 2010 Raised $345mm in common equity and $50mm of Trust preferred securities
April 2010 Repaid $200mm TARP
December 2010 Repaid the remaining $100mm TARP
2011
January 2011 Announced acquisition of Abington Bancorp (Deal value: $268mm)
June 2011 Announced acquisition of Tower Bancorp (Deal value: $345mm)
Assets ($ millions)
CAGR = 11.65%
$4,176 $4,805 $4,793 $5,089 $5,545 $5,953 $7,475 $7,466 $8,225 $13,078 $13,683 $13,689 $13,954 $17,491
1998 1999 2000 2001 2002 2003 2004 2005 2006 2007 2008 2009 2010 2011 pro forma1
Source: Company filings, FactSet, SNL Financial
1 As of December 31, 2011; Pro forma for Tower acquisition
2
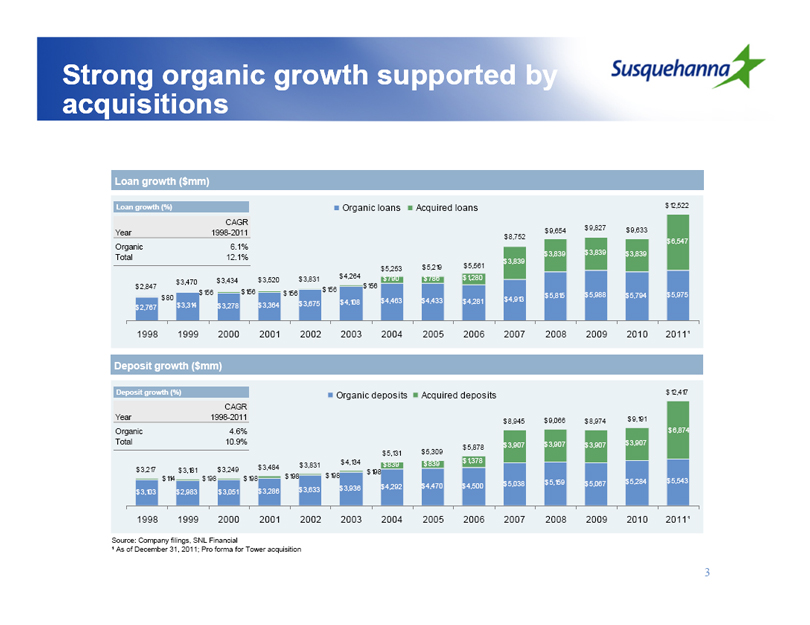
Strong organic growth supported by acquisitions
Loan growth ($mm)
Loan growth (%) Organic loans Acquired loans
Year CAGR 1998-2011
Organic 6.1%
Total 12.1%
$2,847 $3,470 $3,434 $3,520 $3,831 $4,264 $5,253 $5,219 $5,561 $8,752 $9,654 $9,827 $9,633 $12,522
$790 $786 $1,280 $3,839 $3,839 $3,839 $3,839 $6,547
$80 $156 $156 $156 $156 $156
$2,767 $3,314 $3,278 $3,364 $3,675 $4,108 $4,463 $4,433 $4,281 $4,913 $5,815 $5,988 $5,794 $5,975
1998 1999 2000 2001 2002 2003 2004 2005 2006 2007 2008 2009 2010 20111
Deposit growth ($mm)
Deposit growth (%) Organic deposits Acquired deposits
Year CAGR 1998-2011
Organic 4.6%
Total 10.9%
$3,217 $3,181 $3,249 $3,484 $3,831 $4,134 $5,131 $5,309 $5,878 $ 8,945 $9,066 $8,974 $9,191 $12,417
$839 $839 $1,378 $3,907 $3,907 $3,907 $3,907 $6,874
$114 $198 $198 $198 $198 $198
$3,103 $2,983 $3,051 $3,286 $3,633 $3,936 $4,292 $4,470 $4,500 $5,038 $5,159 $5,067 $5,284 $5,543
1998 1999 2000 2001 2002 2003 2004 2005 2006 2007 2008 2009 2010 20111
Source: Company filings, SNL Financial
1 As of December 31, 2011; Pro forma for Tower acquisition
3
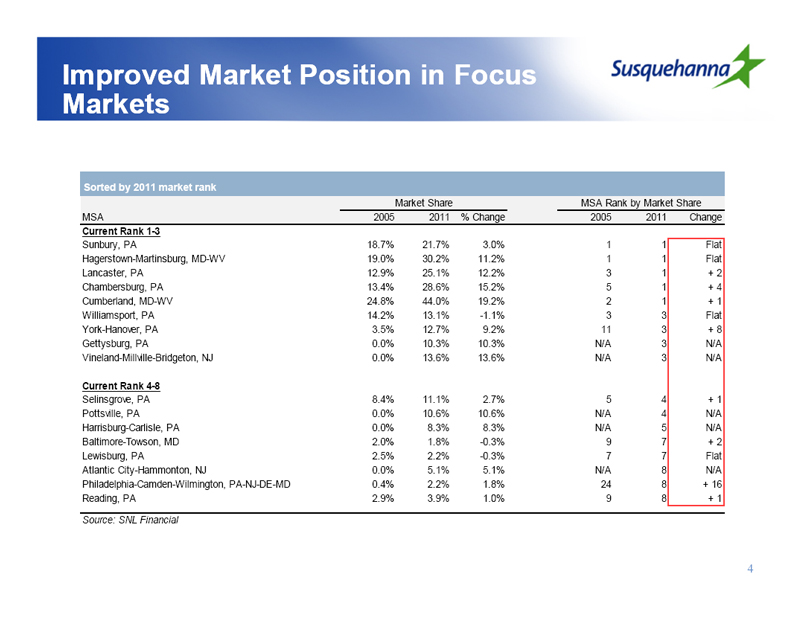
Improved Market Position in Focus Markets
Sorted by 2011 market rank
Market Share MSA Rank by Market Share
MSA 2005 2011 % Change 2005 2011 Change
Current Rank 1-3
Sunbury, PA 18.7% 21.7% 3.0% 1 1 Flat
Hagerstown-Martinsburg, MD-WV 19.0% 30.2% 11.2% 1 1 Flat
Lancaster, PA 12.9% 25.1% 12.2% 3 1 + 2
Chambersburg, PA 13.4% 28.6% 15.2% 5 1 + 4
Cumberland, MD-WV 24.8% 44.0% 19.2% 2 1 + 1
Williamsport, PA 14.2% 13.1% -1.1% 3 3 Flat
York-Hanover, PA 3.5% 12.7% 9.2% 11 3 + 8
Gettysburg, PA 0.0% 10.3% 10.3% N/A 3 N/A
Vineland-Millville-Bridgeton, NJ 0.0% 13.6% 13.6% N/A 3 N/A
Current Rank 4-8
Selinsgrove, PA 8.4% 11.1% 2.7% 5 4 + 1
Pottsville, PA 0.0% 10.6% 10.6% N/A 4 N/A
Harrisburg-Carlisle, PA 0.0% 8.3% 8.3% N/A 5 N/A
Baltimore-Towson, MD 2.0% 1.8% -0.3% 9 7 + 2
Lewisburg, PA 2.5% 2.2% -0.3% 7 7 Flat
Atlantic City-Hammonton, NJ 0.0% 5.1% 5.1% N/A 8 N/A
Philadelphia-Camden-Wilmington, PA-NJ-DE-MD 0.4% 2.2% 1.8% 24 8 + 16
Reading, PA 2.9% 3.9% 1.0% 9 8 + 1
Source: SNL Financial
4
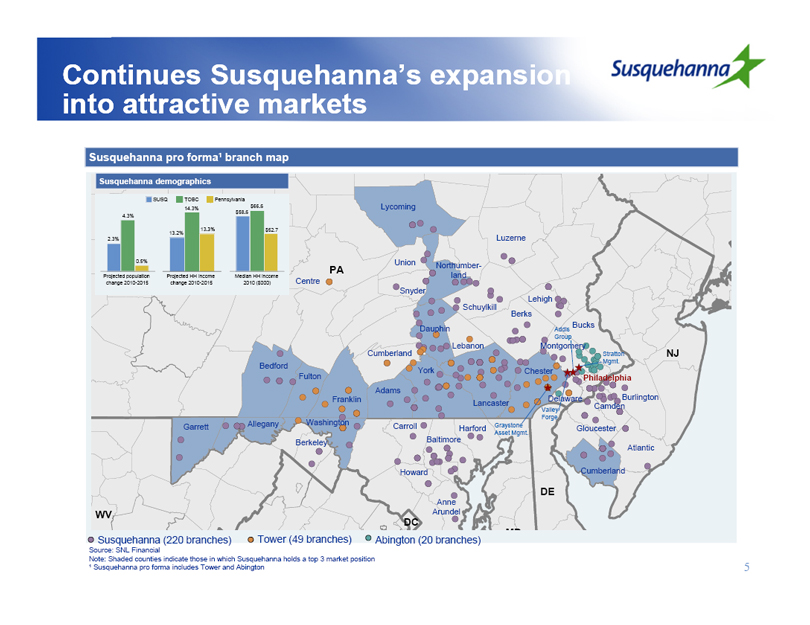
Continues Susquehanna’s expansion into attractive markets
Susquehanna pro forma1 branch map
Susquehanna demographics
SUSQ TOBC Pennsylvania
2.3% 4.3% 0.5%
Projected population change 2010-2015
13.2% 14.3% 13.3%
Projected HH income change 2010-2015
$58.6 $66.6 $52.7
Median HH income 2010 ($000)
Lycoming
Union
Berkeley
Luzerne
PA
Centre
Northumberland
Snyder
Schuylkill
Lehigh
Berks
Bucks
Addis Group
Dauphin
Cumberland
Lebanon
Addis Group
Montgomery
Stratton Mgmt.
NJ
Chester
York
Philadelphia
Bedford
Fulton
Franklin
Adams
Lancaster
Delaware
Burlington
Camden
Valley Forge
Garrett
Allegany
Washington
Carroll
Harford
Graystone Asset Mgmt.
Gloucester
Baltimore
Howard
Atlantic
Cumberland
Anne Arundel
DE
WV
DC
Susquehanna (220 branches) Tower (49 branches) Abington (20 branches)
Source: SNL Financial
Note: Shaded counties indicate those in which Susquehanna holds a top 3 market position
1 Susquehanna pro forma includes Tower and Abington
5
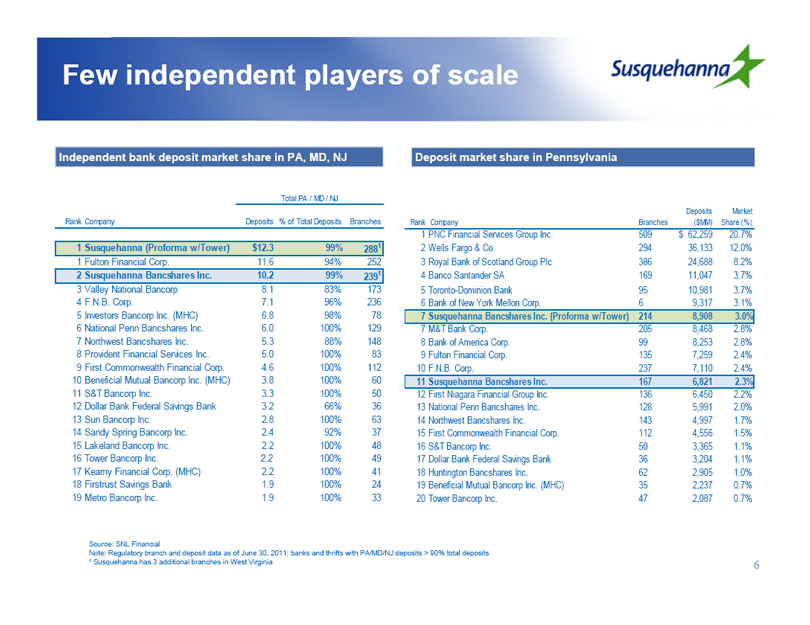
Few independent players of scale
Independent bank deposit market share in PA, MD, NJ
Total PA / MD / NJ
Rank Company Deposits % of Total Deposits Branches
1 Susquehanna (Proforma w/Tower) $12.3 99% 2881
1 Fulton Financial Corp. 11.6 94% 252
2 Susquehanna Bancshares Inc. 10.2 99% 2391
3 Valley National Bancorp 8.1 83% 173
4 F.N.B. Corp. 7.1 96% 236
5 Investors Bancorp Inc. (MHC) 6.8 98% 78
6 National Penn Bancshares Inc. 6.0 100% 129
7 Northwest Bancshares Inc. 5.3 88% 148
8 Provident Financial Services Inc. 5.0 100% 83
9 First Commonwealth Financial Corp. 4.6 100% 112
10 Beneficial Mutual Bancorp Inc. (MHC) 3.8 100% 60
11 S&T Bancorp Inc. 3.3 100% 50
12 Dollar Bank Federal Savings Bank 3.2 66% 36
13 Sun Bancorp Inc. 2.8 100% 63
14 Sandy Spring Bancorp Inc. 2.4 92% 37
15 Lakeland Bancorp Inc. 2.2 100% 48
16 Tower Bancorp Inc. 2.2 100% 49
17 Kearny Financial Corp. (MHC) 2.2 100% 41
18 Firstrust Savings Bank 1.9 100% 24
19 Metro Bancorp Inc. 1.9 100% 33
Deposit market share in Pennsylvania
Deposits Market
Rank Company Branches ($MM) Share (%)
1 PNC Financial Services Group Inc. 509 $ 62,259 20.7%
2 Wells Fargo & Co. 294 36,133 12.0%
3 Royal Bank of Scotland Group Plc 386 24,688 8.2%
4 Banco Santander SA 169 11,047 3.7%
5 Toronto-Dominion Bank 95 10,981 3.7%
6 Bank of New York Mellon Corp. 6 9,317 3.1%
7 Susquehanna Bancshares Inc. (Proforma w/Tower) 214 8,908 3.0%
7 M&T Bank Corp. 205 8,468 2.8%
8 Bank of America Corp. 99 8,253 2.8%
9 Fulton Financial Corp. 135 7,259 2.4%
10 F.N.B. Corp. 237 7,110 2.4%
11 Susquehanna Bancshares Inc. 167 6,821 2.3%
12 First Niagara Financial Group Inc. 136 6,450 2.2%
13 National Penn Bancshares Inc. 128 5,991 2.0%
14 Northwest Bancshares Inc. 143 4,997 1.7%
15 First Commonwealth Financial Corp. 112 4,556 1.5%
16 S&T Bancorp Inc. 50 3,365 1.1%
17 Dollar Bank Federal Savings Bank 36 3,204 1.1%
18 Huntington Bancshares Inc. 62 2,905 1.0%
19 Beneficial Mutual Bancorp Inc. (MHC) 35 2,237 0.7%
20 Tower Bancorp Inc. 47 2,087 0.7%
Source: SNL Financial
Note: Regulatory branch and deposit data as of June 30, 2011; banks and thrifts with PA/MD/NJ deposits > 90% total deposits
1 Susquehanna has 3 additional branches in West Virginia
6
Fourth Quarter Financial Highlights
Significant Improvement in Credit Quality
NCO/Average Loans = 0.95% versus 1.42% in 4Q10
NPA/Loans & OREO = 1.88% versus 2.23% at 12/31/10
Negative NPA Generation for the second consecutive quarter
Loan portfolio contraction halted, as net loans & leases grew 1% for the second consecutive quarter
Core deposits increased 4.2% from prior quarter
Strong capital position that meets fully-phased-in requirements of Basel III
7
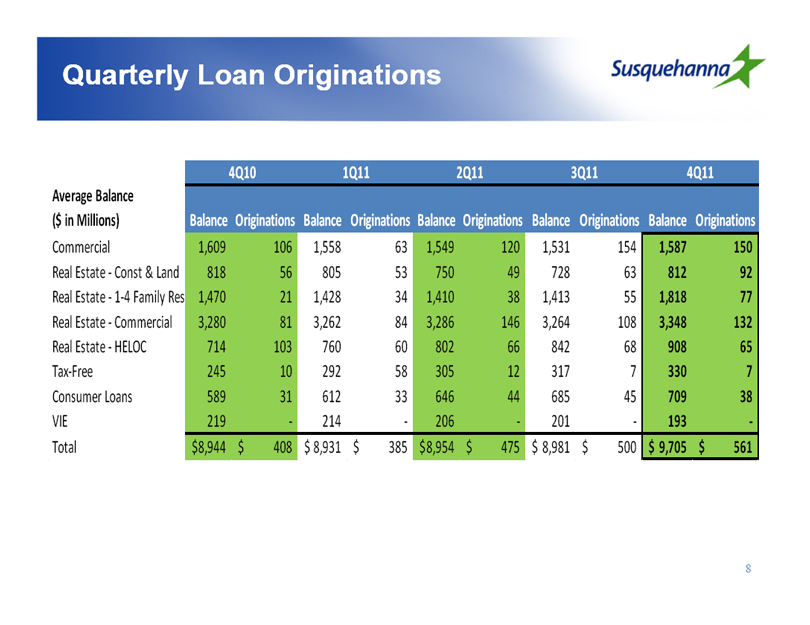
Quarterly Loan Originations
4Q10 1Q11 2Q11 3Q11 4Q11
Average Balance
($ in Millions) Balance Originations Balance Originations Balance Originations Balance Originations Balance Originations
Commercial 1,609 106 1,558 63 1,549 120 1,531 154 1,587 150
Real Estate - Const & Land 818 56 805 53 750 49 728 63 812 92
Real Estate - 1-4 Family Res 1,470 21 1,428 34 1,410 38 1,413 55 1,818 77
Real Estate - Commercial 3,280 81 3,262 84 3,286 146 3,264 108 3,348 132
Real Estate - HELOC 714 103 760 60 802 66 842 68 908 65
Tax-Free 245 10 292 58 305 12 317 7 330 7
Consumer Loans 589 31 612 33 646 44 685 45 709 38
VIE 219 - 214 - 206 - 201 - 193 -
Total $8,944 $408 $8,931 $385 $8,954 $475 $8,981 $500 $9,705 $561
8
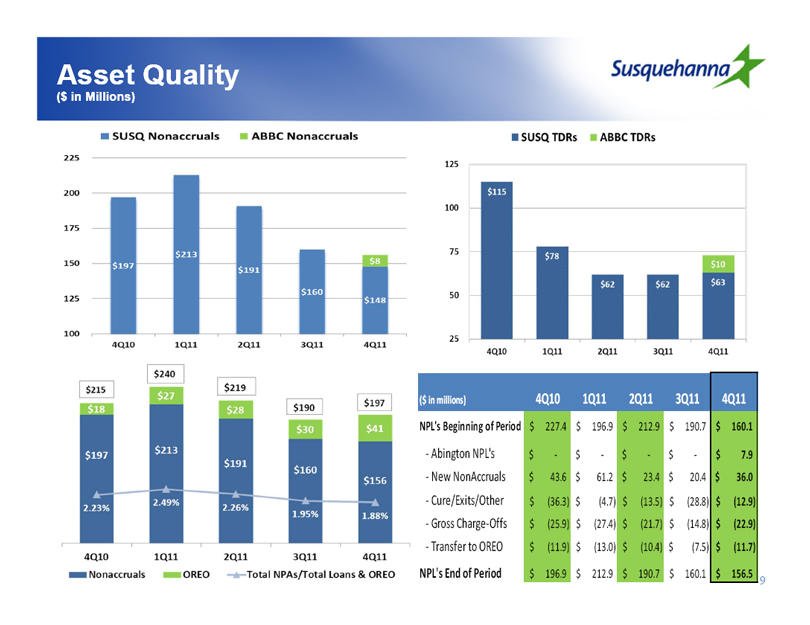
Asset Quality
($ in Millions)
SUSQ Nonaccruals ABBC Nonaccruals
225 200 175 150 125 100
$197 $213 $191 $160 $8 $148
4Q10 1Q11 2Q11 3Q11 4Q11
SUSQ TDRs ABBC TDRs
125 100 75 50 25
$115 $78 $62 $62 $10 $63
4Q10 1Q11 2Q11 3Q11 4Q11
$215 $240 $219 $190 $197
$18 $27 $28 $30 $41
$197 $213 $191 $160 $156
2.23% 2.49% 2.26% 1.95% 1.88%
4Q10 1Q11 2Q11 3Q11 4Q11
Nonaccruals OREO Total NPAs/Total Loans & OREO
($ in millions) 4Q10 1Q11 2Q11 3Q11 4Q11
NPL’s Beginning of Period $227.4 $196.9 $212.9 $190.7 $160.1
Abington NPL’s $- $- $- $- $7.9
New NonAccruals $43.6 $61.2 $23.4 $20.4 $36.0
Cure/Exits/Other $(36.3) $(4.7) $(13.5) $(28.8) $(12.9)
Gross Charge-Offs $(25.9) $(27.4) $(21.7) $(14.8) $(22.9)
Transfer to OREO $(11.9) $(13.0) $(10.4) $(7.5) $(11.7)
NPL’s End of Period $196.9 $212.9 $190.7 $160.1 $156.5
9
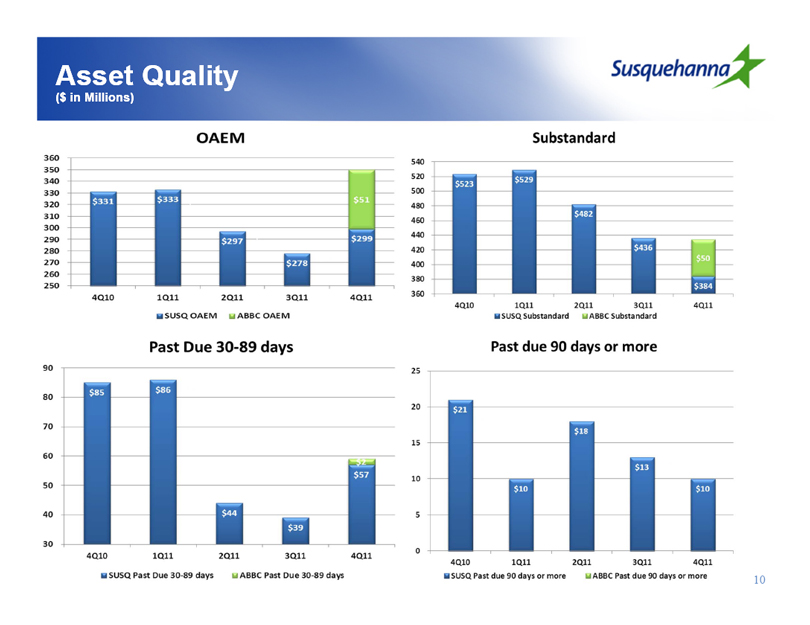
Asset Quality
($ in Millions)
OAEM
360 350 340 330 320 310 300 290 280 270 260 250
$331 $333 $297 $278 $51 $299
4Q10 1Q11 2Q11 3Q11 4Q11
SUSQ OAEM ABBC OAEM
Substandard
540 520 500 480 460 440 420 400 380 360
$523 $529 $482 $436 $50 $384
4Q10 1Q11 2Q11 3Q11 4Q11
SUSQ Substandard ABBC Substandard
Past Due 30-89 days
90 80 70 60 50 40 30
$85 $86 $44 $39 $2 $57
4Q10 1Q11 2Q11 3Q11 4Q11
SUSQ Past Due 30-89 days ABBC Past Due 30-89 days
Past due days or more
25 20 15 10 5 0
$21 $10 $18 $13 $10
4Q10 1Q11 2Q11 3Q11 4Q11
SUSQ Past due days or more ABBC Past due days or more
10
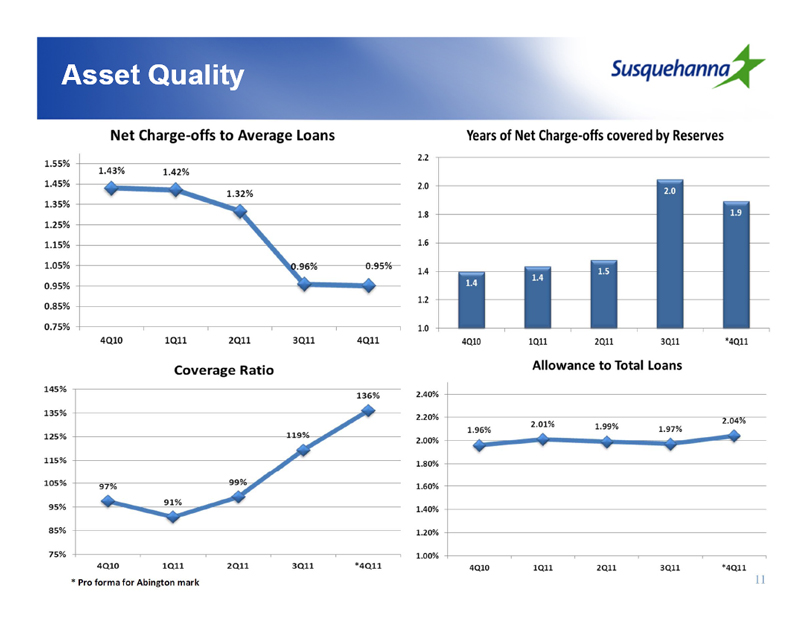
Asset Quality
Net Charge-offs to Average Loans
1.55% 1.45% 1.35% 1.25% 1.15% 1.05% 0.95% 0.85% 0.75%
1.43% 1.42% 1.32% 0.96% 0.95%
4Q10 1Q11 2Q11 3Q11 4Q11
Year of Net Charge-offs covered by Reserves
2.2 2.0 1.8 1.6 1.4 1.2 1.0
1.4 1.4 1.5 2.0 1.9
4Q10 1Q11 2Q11 3Q11 4Q11
Coverage Ratio
145% 135% 125% 115% 105% 95% 85% 75%
97% 91% 99% 119% 136%
4Q10 1Q11 2Q11 3Q11 4Q11
* Pro forma for Abington mark
Allowance to Total Loans
2.40% 2.20% 2.00% 1.80% 1.60% 1.40% 1.20% 1.00%
1.96% 2.01% 1.99% 1.97% 2.04%
4Q10 1Q11 2Q11 3Q11 4Q11
11
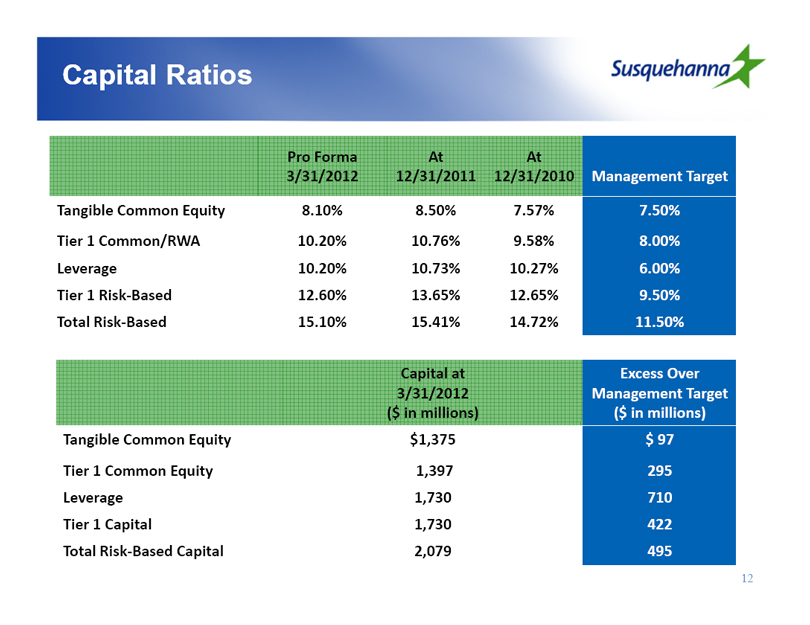
Capital Ratios
Pro Forma At At
3/31/2012 12/31/2011 12/31/2010 Management Target
Tangible Common Equity 8.10% 8.50% 7.57% 7.50%
Tier 1 Common/RWA 10.20% 10.76% 9.58% 8.00%
Leverage 10.20% 10.73% 10.27% 6.00%
Tier 1 Risk-Based 12.60% 13.65% 12.65% 9.50%
Total Risk-Based 15.10% 15.41% 14.72% 11.50%
Capital at Excess Over
3/31/2012 Management Target
($ in millions) ($ in millions)
Tangible Common Equity $1,375 $ 97
Tier 1 Common Equity 1,397 295
Leverage 1,730 710
Tier 1 Capital 1,730 422
Total Risk-Based Capital 2,079 495
12
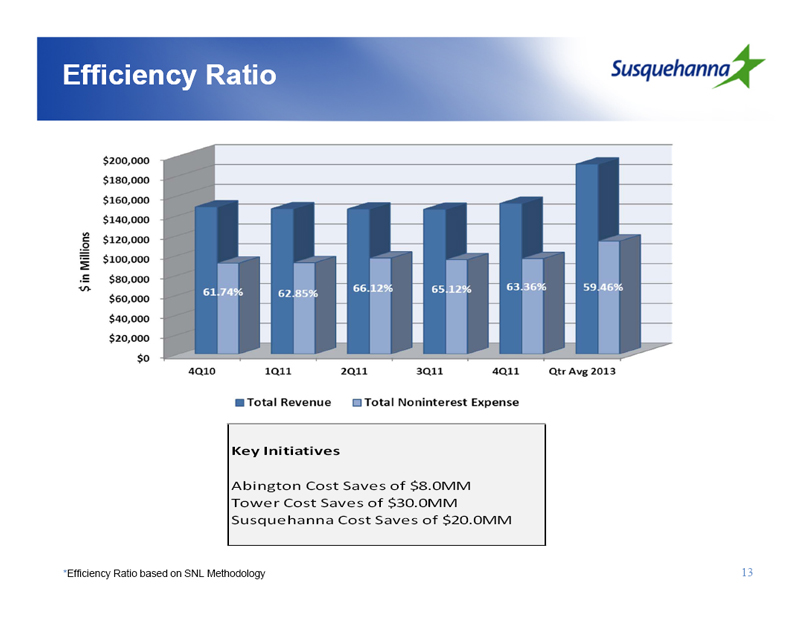
Efficiency Ratio
$ in Millions
$200,000 $180,000 $160,000 $140,000 $120,000 $100,000 $80,000 $60,000 $40,000 $20,000 $0
61.74% 62.85% 66.12% 65.12% 63.36% 59.46%
4Q10 1Q11 2Q11 3Q11 4Q11 Qtr Avg 2013
Total Revenue Total Noninterest Expense
Key Initiatives
Abington Cost Saves of $8.0MM
Tower Cost Saves of $30.0MM
Susquehanna Cost Saves of $20.0MM
*Efficiency Ratio based on SNL Methodology
13
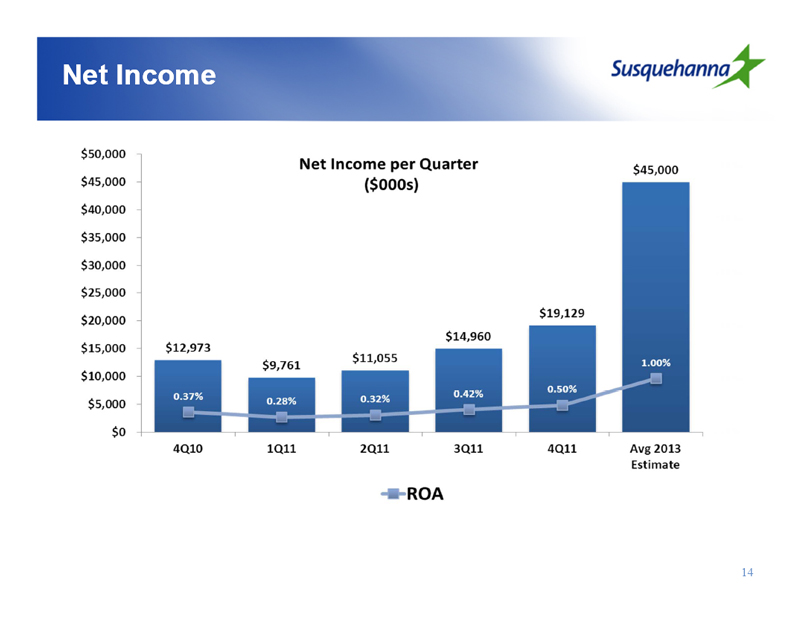
Net Income
Net Income per Quarter
($000s)
$50,000 $45,000 $40,000 $35,000 $30,000 $25,000 $20,000 $15,000 $10,000 $5,000 $0
$12,973 $9,761 $11,055 $14,960 $19,129 $45,000
0.37% 0.28% 0.32% 0.42% 0.50% 1.00%
4Q10 1Q11 2Q11 3Q11 4Q11 Avg 2013 Estimate
ROA
14
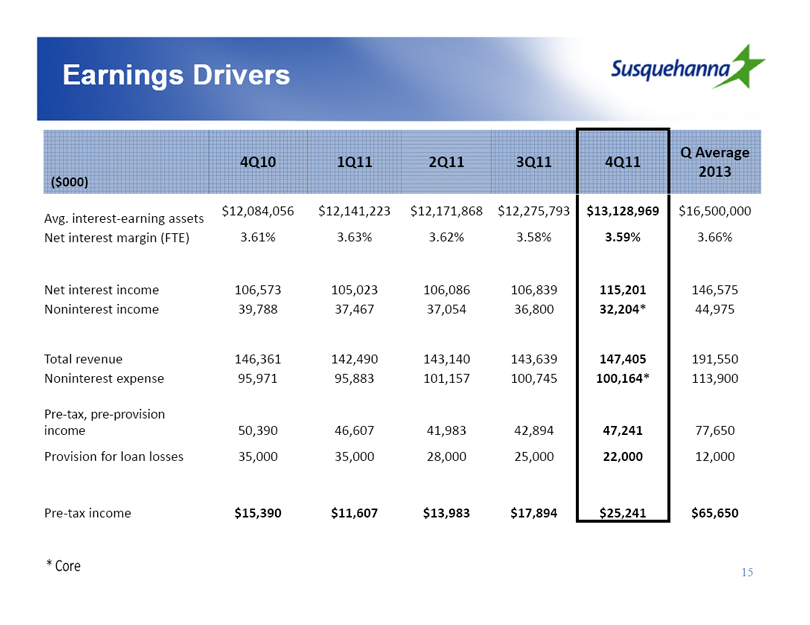
Earnings Drivers
($000) 4Q10 1Q11 2Q11 3Q11 4Q11 Q Average 2013
Avg. interest-earning assets $12,084,056 $12,141,223 $12,171,868 $12,275,793 $13,128,969 $16,500,000
Net interest margin (FTE) 3.61% 3.63% 3.62% 3.58% 3.59% 3.66%
Net interest income 106,573 105,023 106,086 106,839 115,201 146,575
Noninterest income 39,788 37,467 37,054 36,800 32,204* 44,975
Total revenue 146,361 142,490 143,140 143,639 147,405 191,550
Noninterest expense 95,971 95,883 101,157 100,745 100,164* 113,900
Pre-tax, pre-provision income 50,390 46,607 41,983 42,894 47,241 77,650
Provision for loan losses 35,000 35,000 28,000 25,000 22,000 12,000
Pre-tax income $15,390 $11,607 $13,983 $17,894 $25,241 $65,650
* Core
15
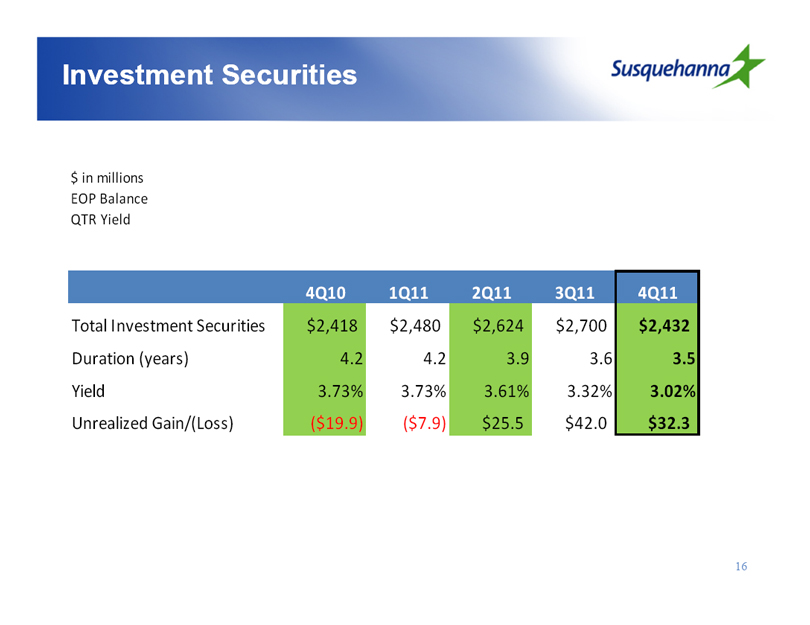
Investment Securities
$ in millions
EOP Balance
QTR Yield
4Q10 1Q11 2Q11 3Q11 4Q11
Total Investment Securities $2,418 $2,480 $2,624 $2,700 $2,432
Duration (years) 4.2 4.2 3.9 3.6 3.5
Yield 3.73% 3.73% 3.61% 3.32% 3.02%
Unrealized Gain/(Loss) ($19.9) ($7.9) $25.5 $42.0 $32.3
16
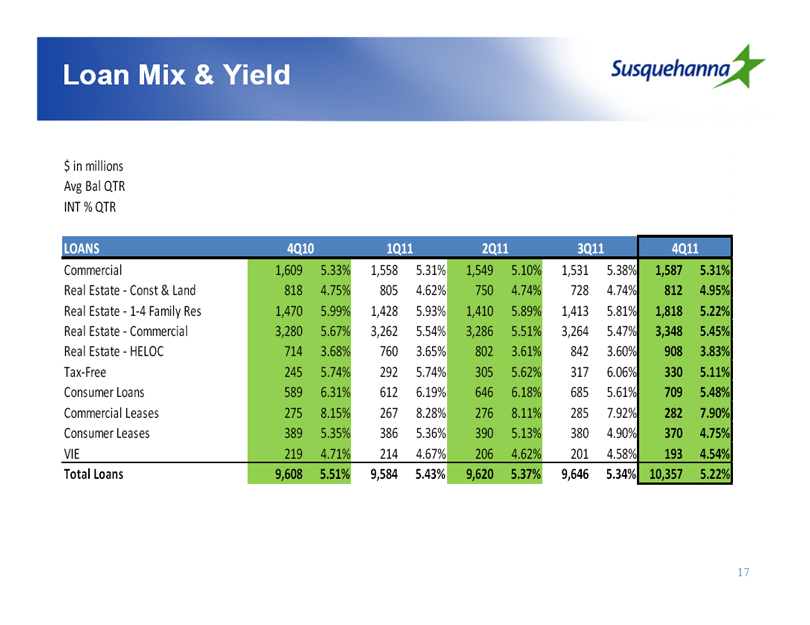
Loan Mix & Yield
$ in millions
Avg Bal QTR
INT % QTR
LOANS 4Q10 1Q11 2Q11 3Q11 4Q11
Commercial 1,609 5.33% 1,558 5.31% 1,549 5.10% 1,531 5.38% 1,587 5.31%
Real Estate - Const & Land 818 4.75% 805 4.62% 750 4.74% 728 4.74% 812 4.95%
Real Estate - 1-4 Family Res 1,470 5.99% 1,428 5.93% 1,410 5.89% 1,413 5.81% 1,818 5.22%
Real Estate - Commercial 3,280 5.67% 3,262 5.54% 3,286 5.51% 3,264 5.47% 3,348 5.45%
Real Estate - HELOC 714 3.68% 760 3.65% 802 3.61% 842 3.60% 908 3.83%
Tax-Free 245 5.74% 292 5.74% 305 5.62% 317 6.06% 330 5.11%
Consumer Loans 589 6.31% 612 6.19% 646 6.18% 685 5.61% 709 5.48%
Commercial Leases 275 8.15% 267 8.28% 276 8.11% 285 7.92% 282 7.90%
Consumer Leases 389 5.35% 386 5.36% 390 5.13% 380 4.90% 370 4.75%
VIE 219 4.71% 214 4.67% 206 4.62% 201 4.58% 193 4.54%
Total Loans 9,608 5.51% 9,584 5.43% 9,620 5.37% 9,646 5.34% 10,357 5.22%
17
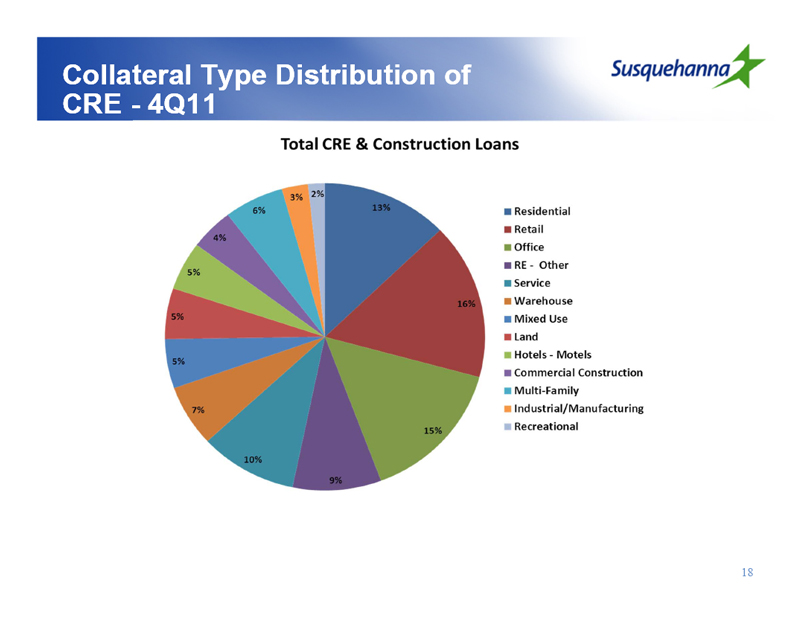
Collateral Type Distribution of CRE - 4Q11
Total CRE & Construction Loans
Residential
Retail
Office
RE - Other
Service
Warehouse
Mixed Use
Land
Hotels - Motels
Commercial Construction
Multi-Family
Industrial/Manufacturing
Recreational
13% 16% 15% 9% 10% 7% 5% 5% 5% 4% 6% 3% 2%
18
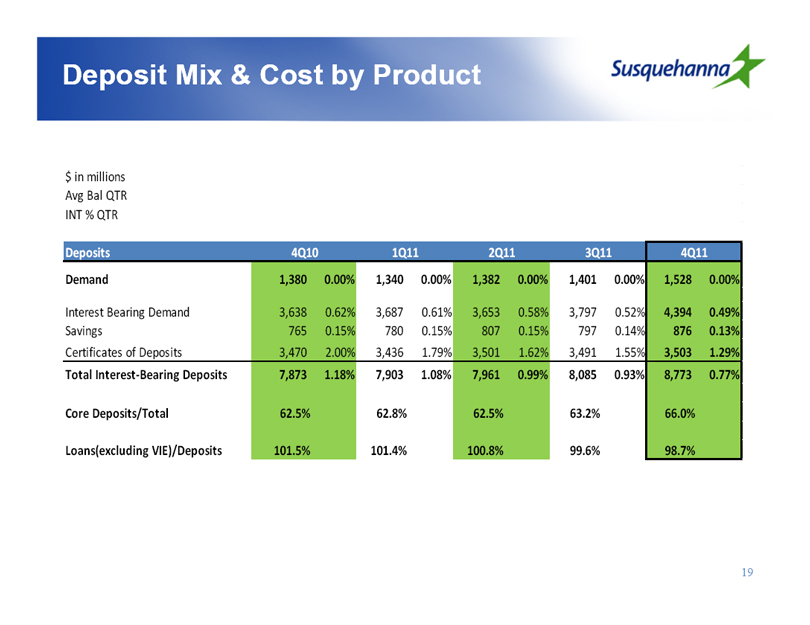
Deposit Mix & Cost by Product
$ in millions
Avg Bal QTR
INT % QTR
Deposits 4Q10 1Q11 2Q11 3Q11 4Q11
Demand 1,380 0.00% 1,340 0.00% 1,382 0.00% 1,401 0.00% 1,528 0.00%
Interest Bearing Demand 3,638 0.62% 3,687 0.61% 3,653 0.58% 3,797 0.52% 4,394 0.49%
Savings 765 0.15% 780 0.15% 807 0.15% 797 0.14% 876 0.13%
Certificates of Deposits 3,470 2.00% 3,436 1.79% 3,501 1.62% 3,491 1.55% 3,503 1.29%
Total Interest-Bearing Deposits 7,873 1.18% 7,903 1.08% 7,961 0.99% 8,085 0.93% 8,773 0.77%
Core Deposits/Total 62.5% 62.8% 62.5% 63.2% 66.0%
Loans(excluding VIE)/Deposits 101.5% 101.4% 100.8% 99.6% 98.7%
19
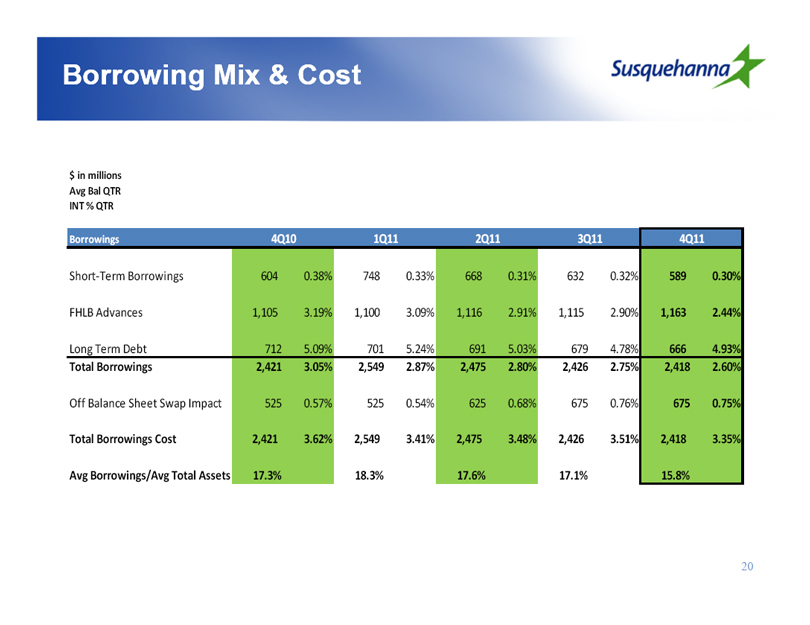
Borrowing Mix & Cost
$ in millions
Avg Bal QTR
INT % QTR
Borrowings 4Q10 1Q11 2Q11 3Q11 4Q11
Short-Term Borrowings 604 0.38% 748 0.33% 668 0.31% 632 0.32% 589 0.30%
FHLB Advances 1,105 3.19% 1,100 3.09% 1,116 2.91% 1,115 2.90% 1,163 2.44%
Long Term Debt 712 5.09% 701 5.24% 691 5.03% 679 4.78% 666 4.93%
Total Borrowings 2,421 3.05% 2,549 2.87% 2,475 2.80% 2,426 2.75% 2,418 2.60%
Off Balance Sheet Swap Impact 525 0.57% 525 0.54% 625 0.68% 675 0.76% 675 0.75%
Total Borrowings Cost 2,421 3.62% 2,549 3.41% 2,475 3.48% 2,426 3.51% 2,418 3.35%
Avg Borrowings/Avg Total Assets 17.3% 18.3% 17.6% 17.1% 15.8%
20
Strategic Objectives for 2012-2013
Continuing strong progress in improving credit quality
Completing acquisition and integration of Tower Bancorp
Growing loans, deposits and revenue
Increasing profitability and shareholder dividends
21