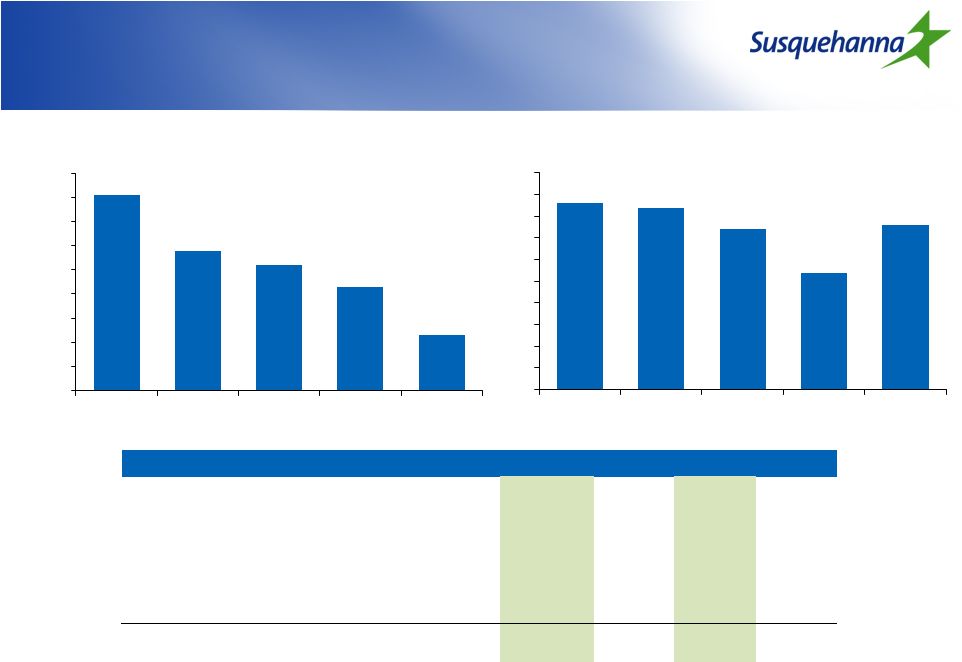
Non-GAAP Reconciliation (Dollars and share data in thousands) Non-GAAP Reconciliation (Dollars and share data in thousands) 36 The efficiency ratio is a non-GAAP based financial measure. Management excludes merger-related expenses and certain other selected items when calculating this ratio, which is used to measure the relationship of operating expenses to revenues. The tangible common ratio is a non-GAAP based financial measure using non-GAAP based amounts. The most directly comparable GAAP-based measure is the ratio of common shareholders’ equity to total assets. In order to calculate tangible common shareholders equity and assets, our management subtracts the intangible assets from both the common shareholders’ equity and total assets. Tangible common equity is then divided by the tangible assets to arrive at the ratio. Management uses the ratio to assess the strength of our capital position. 4Q12 3Q12 2Q12 1Q12 4Q11 Other expense 125,277 $ 122,910 $ 121,475 $ 120,355 $ 162,395 $ Less: Merger related expenses (1,054) (1,500) (3,318) (11,479) (12,211) Loss on extinguishment of debt (409) (5,451) 0 0 (50,020) Noninterest operating expense (numerator) 123,814 $ 115,959 $ 118,157 $ 108,876 $ 100,164 $ Taxable-equivalent net interest income 159,332 $ 152,948 $ 156,416 137,837 118,780 Other income 43,772 43,661 39,811 39,515 71,347 Less: Net realized gain on acquisition 0 0 0 0 (39,143) Denominator 203,104 $ 196,609 $ 196,227 $ 177,352 $ 150,984 $ Efficiency ratio 60.96% 58.98% 60.21% 61.39% 66.34% 4Q12 3Q12 2Q12 1Q12 4Q11 End of period balance sheet data Shareholders' equity 2,595,909 $ 2,584,682 $ 2,544,730 $ 2,512,584 $ 2,189,628 $ (1,263,563) (1,263,361) (1,267,630) (1,268,582) (1,006,412) Tangible common equity (numerator) 1,332,346 $ 1,321,321 $ 1,277,100 $ 1,244,002 $ 1,183,216 $ Assets 18,037,667 $ 18,106,730 $ 18,040,009 $ 17,807,026 $ 14,974,789 $ (1,263,563) (1,263,361) (1,267,630) (1,268,582) (1,047,112) Tangible assets (denominator) 16,774,104 $ 16,843,369 $ 16,772,379 $ 16,538,444 $ 13,927,677 $ Tangible common ratio 7.94% 7.84% 7.61% 7.52% 8.50% Efficiency Ratio Tangible Common Ratio Goodwill and other intangible assets Goodwill and other intangible assets (1) (1) |