Exhibit 99.2
EKSPORT FINANS NORWAR FINANCIAL REPORT Q3/2017
Financial highlights 3 Report from the board of directors 4 Results 4 Balance sheet 5 Lending 5 Securities 5 Liquidity 6 Events after the balance sheet date 6 Condensed statement of profit or loss and other comprehensive income 7 Condensed balance sheet 8 Condensed statement of changes in equity 9 Condensed cash flow statement 10 Notes to the accounts 11 Cover photo: Eksportfinans Some of the information herein constitutes “forward-looking statements” within the meaning of Section 27A of the U.S. Securities Act of 1933, as amended and Section 21E of the U.S. Securities Exchange Act of 1934, as amended. These forward-looking statements rely on a number of assumptions concerning future events. These forward-looking statements involve known and unknown risks, uncertainties and other factors, many of which are outside of Eksportfinans’ control, which may cause actual results to differ materially from any future results expressed or implied from the forward-looking statements. As a result, any forward-looking statements included herein should not be regarded as a representation that the plans, objectives, results or other actions discussed will be achieved. Please see the Company’s Annual Report on Form20-F filed with the U.S. Securities and Exchange Commission for a discussion of certain factors that may cause actual results, performance or events to be materially different from those referred to herein. Eksportfinans disclaims any intention or obligation to update or revise any forward-looking statements, whether as a result of new information, future events or otherwise.
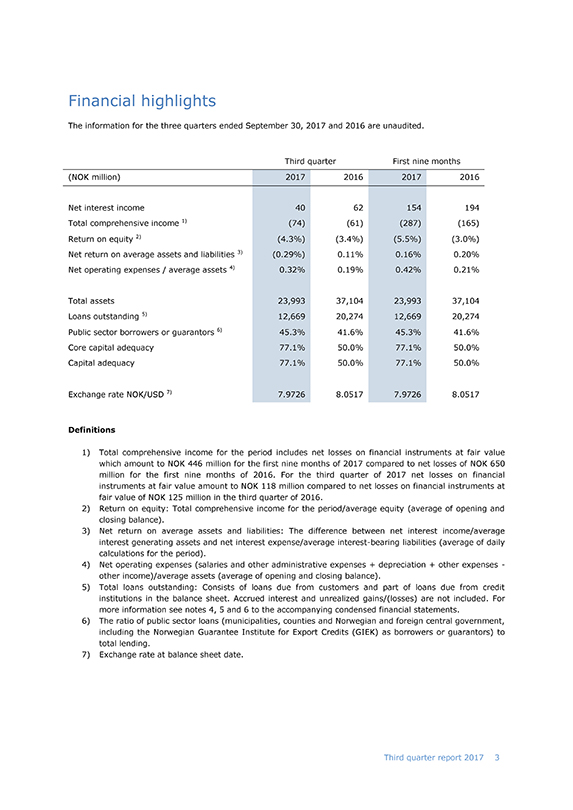
Financial highlights The information for the three quarters ended September 30, 2017 and 2016 are unaudited. Third quarter First nine months (NOK million) 2017 2016 2017 2016 Net interest income 40 62 154 194 Total comprehensive income 1) (74) (61) (287) (165) Return on equity 2) (4.3%) (3.4%) (5.5%) (3.0%) Net return on average assets and liabilities 3) (0.29%) 0.11% 0.16% 0.20% Net operating expenses / average assets 4) 0.32% 0.19% 0.42% 0.21% Total assets 23,993 37,104 23,993 37,104 Loans outstanding 5) 12,669 20,274 12,669 20,274 Public sector borrowers or guarantors 6) 45.3% 41.6% 45.3% 41.6% Core capital adequacy 77.1% 50.0% 77.1% 50.0% Capital adequacy 77.1% 50.0% 77.1% 50.0% Exchange rate NOK/USD 7) 7.9726 8.0517 7.9726 8.0517 Definitions 1) Total comprehensive income for the period includes net losses on financial instruments at fair value which amount to NOK 446 million for the first nine months of 2017 compared to net losses of NOK 650 million for the first nine months of 2016. For the third quarter of 2017 net losses on financial instruments at fair value amount to NOK 118 million compared to net losses on financial instruments at fair value of NOK 125 million in the third quarter of 2016. 2) Return on equity: Total comprehensive income for the period/average equity (average of opening and closing balance). 3) Net return on average assets and liabilities: The difference between net interest income/average interest generating assets and net interest expense/average interest-bearing liabilities (average of daily calculations for the period). 4) Net operating expenses (salaries and other administrative expenses + depreciation + other expenses—other income)/average assets (average of opening and closing balance). 5) Total loans outstanding: Consists of loans due from customers and part of loans due from credit institutions in the balance sheet. Accrued interest and unrealized gains/(losses) are not included. For more information see notes 4, 5 and 6 to the accompanying condensed financial statements. 6) The ratio of public sector loans (municipalities, counties and Norwegian and foreign central government, including the Norwegian Guarantee Institute for Export Credits (GIEK) as borrowers or guarantors) to total lending. 7) Exchange rate at balance sheet date. 20173 Third quarter report
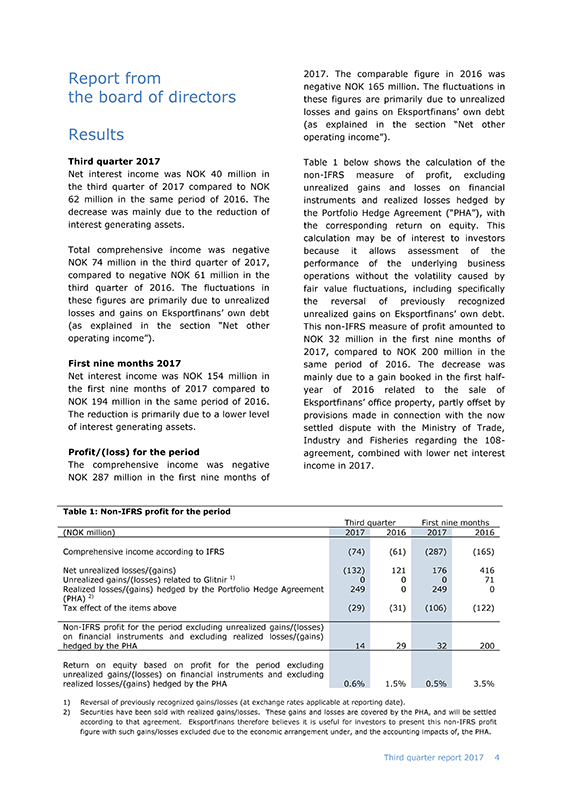
Report from 2017. The comparable figure in 2016 was negative NOK 165 million. The fluctuations in the board of directors these figures are primarily due to unrealized losses and gains on Eksportfinans’ own debt (as explained in the section “Net other Results operating income”). Third quarter 2017 Table 1 below shows the calculation of the Net interest income was NOK 40 million innon-IFRS measure of profit, excluding the third quarter of 2017 compared to NOK unrealized gains and losses on financial 62 million in the same period of 2016. The instruments and realized losses hedged by decrease was mainly due to the reduction of the Portfolio Hedge Agreement (“PHA”), with interest generating assets. the corresponding return on equity. This calculation may be of interest to investors Total comprehensive income was negative because it allows assessment of the NOK 74 million in the third quarter of 2017, performance of the underlying business compared to negative NOK 61 million in the operations without the volatility caused by third quarter of 2016. The fluctuations in fair value fluctuations, including specifically these figures are primarily due to unrealized the reversal of previously recognized losses and gains on Eksportfinans’ own debt unrealized gains on Eksportfinans’ own debt. (as explained in the section “Net other Thisnon-IFRS measure of profit amounted to operating income”). NOK 32 million in the first nine months of 2017, compared to NOK 200 million in the First nine months 2017 same period of 2016. The decrease was Net interest income was NOK 154 million in mainly due to a gain booked in the firsthalf-the first nine months of 2017 compared to year of 2016 related to the sale of NOK 194 million in the same period of 2016. Eksportfinans’ office property, partly offset by The reduction is primarily due to a lower level provisions made in connection with the now of interest generating assets. settled dispute with the Ministry of Trade, Industry and Fisheries regarding the 108-Profit/(loss) for the period agreement, combined with lower net interest The comprehensive income was negative income in 2017. NOK 287 million in the first nine months of Table 1:Non-IFRS profit for the period Third quarter First nine months (NOK million) 2017 2016 2017 2016 Comprehensive income according to IFRS (74) (61) (287) (165) Net unrealized losses/(gains) (132) 121 176 416 Unrealized gains/(losses) related to Glitnir 1) 0 0 0 71 Realized losses/(gains) hedged by the Portfolio Hedge Agreement 249 0 249 0 (PHA) 2) Tax effect of the items above (29) (31) (106) (122)Non-IFRS profit for the period excluding unrealized gains/(losses) on financial instruments and excluding realized losses/(gains) hedged by the PHA 14 29 32 200 Return on equity based on profit for the period excluding unrealized gains/(losses) on financial instruments and excluding realized losses/(gains) hedged by the PHA 0.6% 1.5% 0.5% 3.5% 1) Reversal of previously recognized gains/losses (at exchange rates applicable at reporting date). 2) Securities have been sold with realized gains/losses. These gains and losses are covered by the PHA, and will be settled according to that agreement. Eksportfinans therefore believes it is useful for investors to present thisnon-IFRS profit figure with such gains/losses excluded due to the economic arrangement under, and the accounting impacts of, the PHA. 20174 Third quarter report
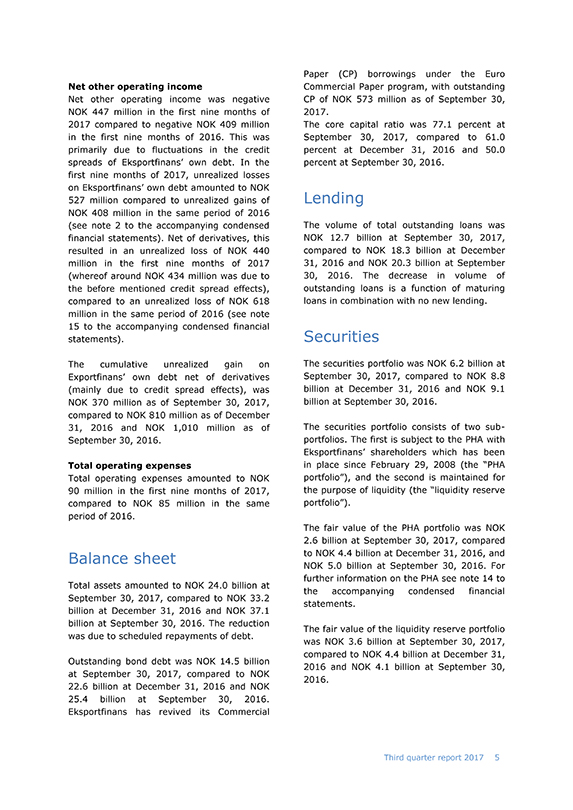
Paper (CP) borrowings under the Euro Net other operating income Commercial Paper program, with outstanding Net other operating income was negative CP of NOK 573 million as of September 30, NOK 447 million in the first nine months of 2017. 2017 compared to negative NOK 409 million The core capital ratio was 77.1 percent at in the first nine months of 2016. This was September 30, 2017, compared to 61.0 primarily due to fluctuations in the credit percent at December 31, 2016 and 50.0 spreads of Eksportfinans’ own debt. In the percent at September 30, 2016. first nine months of 2017, unrealized losses on Eksportfinans’ own debt amounted to NOK 527 million compared to unrealized gains of Lending NOK 408 million in the same period of 2016 (see note 2 to the accompanying condensed The volume of total outstanding loans was financial statements). Net of derivatives, this NOK 12.7 billion at September 30, 2017, resulted in an unrealized loss of NOK 440 compared to NOK 18.3 billion at December million in the first nine months of 2017 31, 2016 and NOK 20.3 billion at September (whereof around NOK 434 million was due to 30, 2016. The decrease in volume of the before mentioned credit spread effects), outstanding loans is a function of maturing compared to an unrealized loss of NOK 618 loans in combination with no new lending. million in the same period of 2016 (see note 15 to the accompanying condensed financial statements). Securities The cumulative unrealized gain on The securities portfolio was NOK 6.2 billion at Exportfinans’ own debt net of derivatives September 30, 2017, compared to NOK 8.8 (mainly due to credit spread effects), was billion at December 31, 2016 and NOK 9.1 NOK 370 million as of September 30, 2017, billion at September 30, 2016. compared to NOK 810 million as of December 31, 2016 and NOK 1,010 million as of The securities portfolio consists of twosub-September 30, 2016. portfolios. The first is subject to the PHA with Eksportfinans’ shareholders which has been Total operating expenses in place since February 29, 2008 (the “PHA Total operating expenses amounted to NOK portfolio”), and the second is maintained for 90 million in the first nine months of 2017, the purpose of liquidity (the “liquidity reserve compared to NOK 85 million in the same portfolio”). period of 2016. The fair value of the PHA portfolio was NOK 2.6 billion at September 30, 2017, compared Balance sheet to NOK 4.4 billion at December 31, 2016, and NOK 5.0 billion at September 30, 2016. For further information on the PHA see note 14 to Total assets amounted to NOK 24.0 billion at the accompanying condensed financial September 30, 2017, compared to NOK 33.2 statements. billion at December 31, 2016 and NOK 37.1 billion at September 30, 2016. The reduction The fair value of the liquidity reserve portfolio was due to scheduled repayments of debt. was NOK 3.6 billion at September 30, 2017, compared to NOK 4.4 billion at December 31, Outstanding bond debt was NOK 14.5 billion 2016 and NOK 4.1 billion at September 30, at September 30, 2017, compared to NOK 2016. 22.6 billion at December 31, 2016 and NOK 25.4 billion at September 30, 2016. Eksportfinans has revived its Commercial 20175 Third quarter report
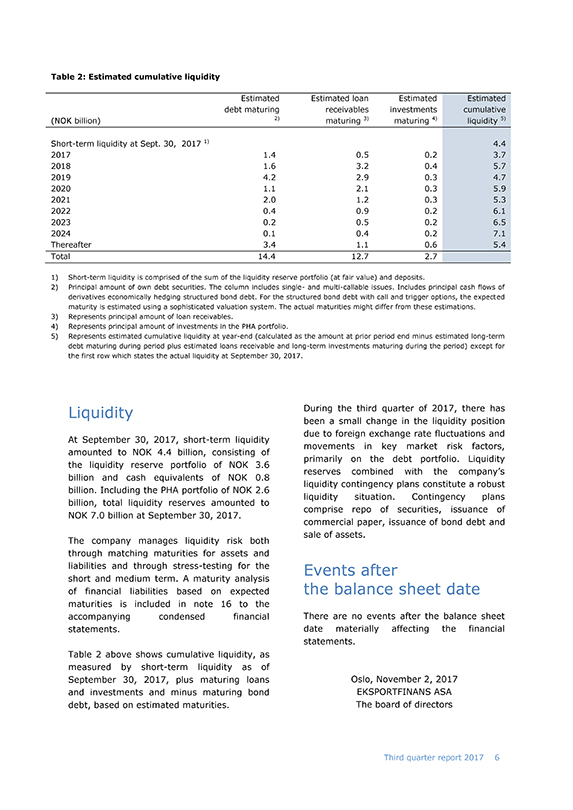
Table 2: Estimated cumulative liquidity Estimated Estimated loan Estimated Estimated debt maturing receivables investments cumulative (NOK billion) 2) maturing 3) maturing 4) liquidity 5) Short-term liquidity at Sept. 30, 2017 1) 4.4 2017 1.4 0.5 0.2 3.7 2018 1.6 3.2 0.4 5.7 2019 4.2 2.9 0.3 4.7 2020 1.1 2.1 0.3 5.9 2021 2.0 1.2 0.3 5.3 2022 0.4 0.9 0.2 6.1 2023 0.2 0.5 0.2 6.5 2024 0.1 0.4 0.2 7.1 Thereafter 3.4 1.1 0.6 5.4 Total 14.4 12.7 2.7 1) Short-term liquidity is comprised of the sum of the liquidity reserve portfolio (at fair value) and deposits. 2) Principal amount of own debt securities. The column includes single- and multi-callable issues. Includes principal cash flows of derivatives economically hedging structured bond debt. For the structured bond debt with call and trigger options, the expected maturity is estimated using a sophisticated valuation system. The actual maturities might differ from these estimations. 3) Represents principal amount of loan receivables. 4) Represents principal amount of investments in the PHA portfolio. 5) Represents estimated cumulative liquidity atyear-end (calculated as the amount at prior period end minus estimated long-term debt maturing during period plus estimated loans receivable and long-term investments maturing during the period) except for the first row which states the actual liquidity at September 30, 2017. Liquidity During the third quarter of 2017, there has been a small change in the liquidity position due to foreign exchange rate fluctuations and At September 30, 2017, short-term liquidity movements in key market risk factors, amounted to NOK 4.4 billion, consisting of primarily on the debt portfolio. Liquidity the liquidity reserve portfolio of NOK 3.6 reserves combined with the company’s billion and cash equivalents of NOK 0.8 liquidity contingency plans constitute a robust billion. Including the PHA portfolio of NOK 2.6 liquidity situation. Contingency plans billion, total liquidity reserves amounted to comprise repo of securities, issuance of NOK 7.0 billion at September 30, 2017. commercial paper, issuance of bond debt and sale of assets. The company manages liquidity risk both through matching maturities for assets and liabilities and through stress-testing for the Events after short and medium term. A maturity analysis of financial liabilities based on expected the balance sheet date maturities is included in note 16 to the accompanying condensed financial There are no events after the balance sheet statements. date materially affecting the financial statements. Table 2 above shows cumulative liquidity, as measured by short-term liquidity as of September 30, 2017, plus maturing loans Oslo, November 2, 2017 and investments and minus maturing bond EKSPORTFINANS ASA debt, based on estimated maturities. The board of directors 20176 Third quarter report
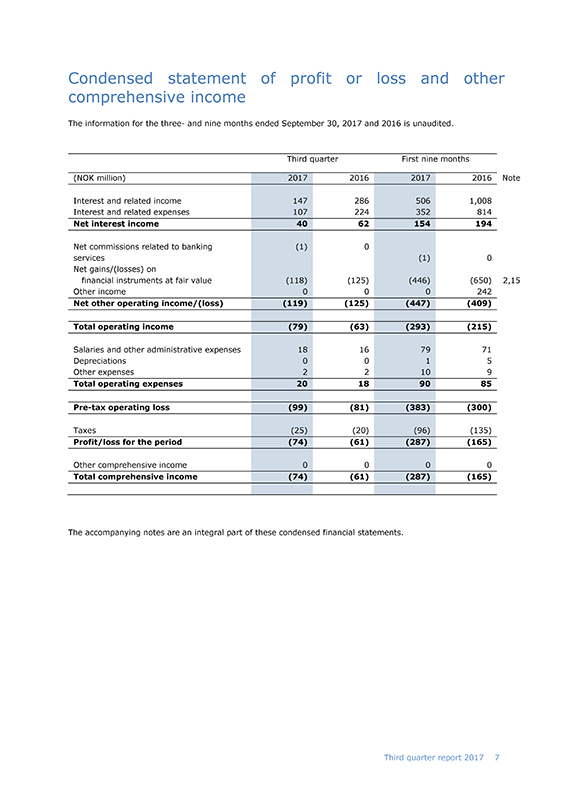
Condensed statement of profit or loss and other comprehensive income The information for the three- and nine months ended September 30, 2017 and 2016 is unaudited. Third quarter First nine months (NOK million) 2017 2016 2017 2016 Note Interest and related income 147 286 506 1,008 Interest and related expenses 107 224 352 814 Net interest income 40 62 154 194 Net commissions related to banking (1) 0 services (1) 0 Net gains/(losses) on financial instruments at fair value (118) (125) (446) (650) 2,15 Other income 0 0 0 242 Net other operating income/(loss) (119) (125) (447) (409) Total operating income (79) (63) (293) (215) Salaries and other administrative expenses 18 16 79 71 Depreciations 0 0 1 5 Other expenses 2 2 10 9 Total operating expenses 20 18 90 85Pre-tax operating loss (99) (81) (383) (300) Taxes (25) (20) (96) (135) Profit/loss for the period (74) (61) (287) (165) Other comprehensive income 0 0 0 0 Total comprehensive income (74) (61) (287) (165) The accompanying notes are an integral part of these condensed financial statements. 20177 Third quarter report
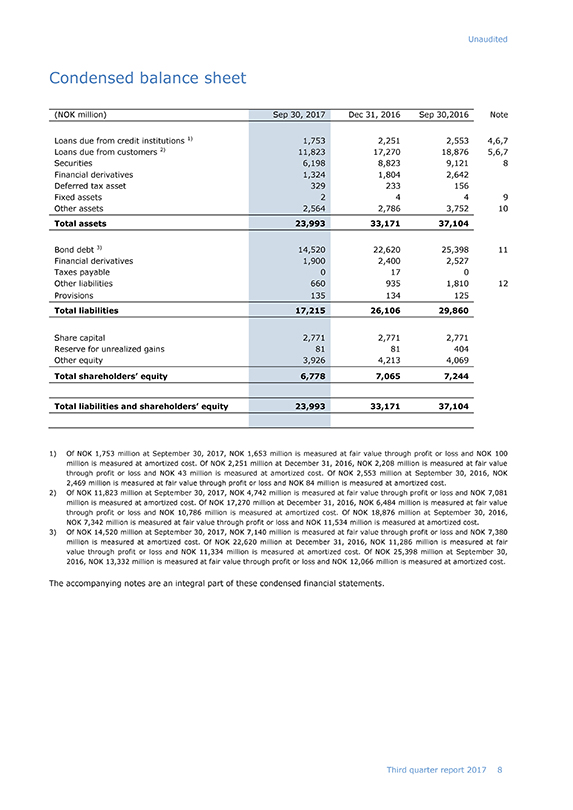
Unaudited Condensed balance sheet (NOK million) Sep 30, 2017 Dec 31, 2016 Sep 30,2016 Note Loans due from credit institutions 1) 1,753 2,251 2,553 4,6,7 Loans due from customers 2) 11,823 17,270 18,876 5,6,7 Securities 6,198 8,823 9,121 8 Financial derivatives 1,324 1,804 2,642 Deferred tax asset 329 233 156 Fixed assets 2 4 4 9 Other assets 2,564 2,786 3,752 10 Total assets 23,993 33,171 37,104 Bond debt 3) 14,520 22,620 25,398 11 Financial derivatives 1,900 2,400 2,527 Taxes payable 0 17 0 Other liabilities 660 935 1,810 12 Provisions 135 134 125 Total liabilities 17,215 26,106 29,860 Share capital 2,771 2,771 2,771 Reserve for unrealized gains 81 81 404 Other equity 3,926 4,213 4,069 Total shareholders’ equity 6,778 7,065 7,244 Total liabilities and shareholders’ equity 23,993 33,171 37,104 1) Of NOK 1,753 million at September 30, 2017, NOK 1,653 million is measured at fair value through profit or loss and NOK 100 million is measured at amortized cost. Of NOK 2,251 million at December 31, 2016, NOK 2,208 million is measured at fair value through profit or loss and NOK 43 million is measured at amortized cost. Of NOK 2,553 million at September 30, 2016, NOK 2,469 million is measured at fair value through profit or loss and NOK 84 million is measured at amortized cost. 2) Of NOK 11,823 million at September 30, 2017, NOK 4,742 million is measured at fair value through profit or loss and NOK 7,081 million is measured at amortized cost. Of NOK 17,270 million at December 31, 2016, NOK 6,484 million is measured at fair value through profit or loss and NOK 10,786 million is measured at amortized cost. Of NOK 18,876 million at September 30, 2016, NOK 7,342 million is measured at fair value through profit or loss and NOK 11,534 million is measured at amortized cost. 3) Of NOK 14,520 million at September 30, 2017, NOK 7,140 million is measured at fair value through profit or loss and NOK 7,380 million is measured at amortized cost. Of NOK 22,620 million at December 31, 2016, NOK 11,286 million is measured at fair value through profit or loss and NOK 11,334 million is measured at amortized cost. Of NOK 25,398 million at September 30, 2016, NOK 13,332 million is measured at fair value through profit or loss and NOK 12,066 million is measured at amortized cost. The accompanying notes are an integral part of these condensed financial statements. report 20178 Third quarter
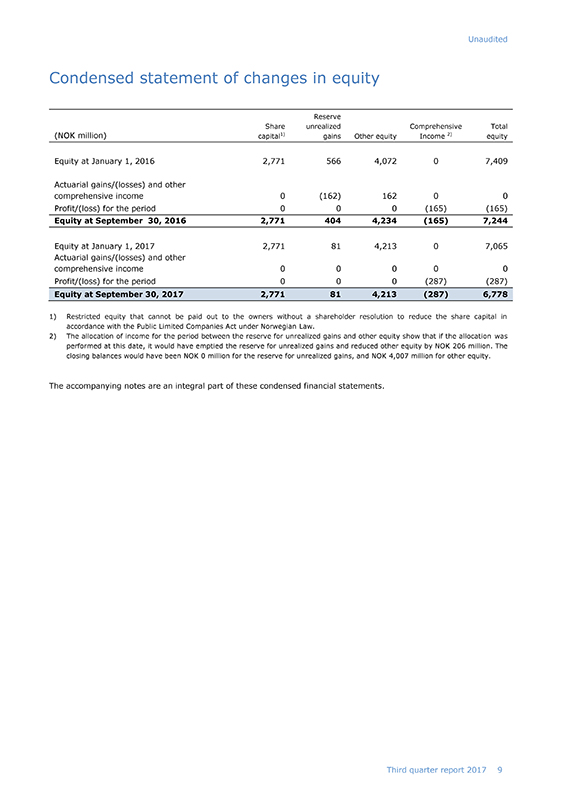
Unaudited Condensed statement of changes in equity Reserve Share unrealized Comprehensive Total (NOK million) capital1) gains Other equity Income 2) equity Equity at January 1, 2016 2,771 566 4,072 0 7,409 Actuarial gains/(losses) and other comprehensive income 0 (162) 162 0 0 Profit/(loss) for the period 0 0 0 (165) (165) Equity at September 30, 2016 2,771 404 4,234 (165) 7,244 Equity at January 1, 2017 2,771 81 4,213 0 7,065 Actuarial gains/(losses) and other comprehensive income 0 0 0 0 0 Profit/(loss) for the period 0 0 0 (287) (287) Equity at September 30, 2017 2,771 81 4,213 (287) 6,778 1) Restricted equity that cannot be paid out to the owners without a shareholder resolution to reduce the share capital in accordance with the Public Limited Companies Act under Norwegian Law. 2) The allocation of income for the period between the reserve for unrealized gains and other equity show that if the allocation was performed at this date, it would have emptied the reserve for unrealized gains and reduced other equity by NOK 206 million. The closing balances would have been NOK 0 million for the reserve for unrealized gains, and NOK 4,007 million for other equity. The accompanying notes are an integral part of these condensed financial statements. report 20179 Third quarter
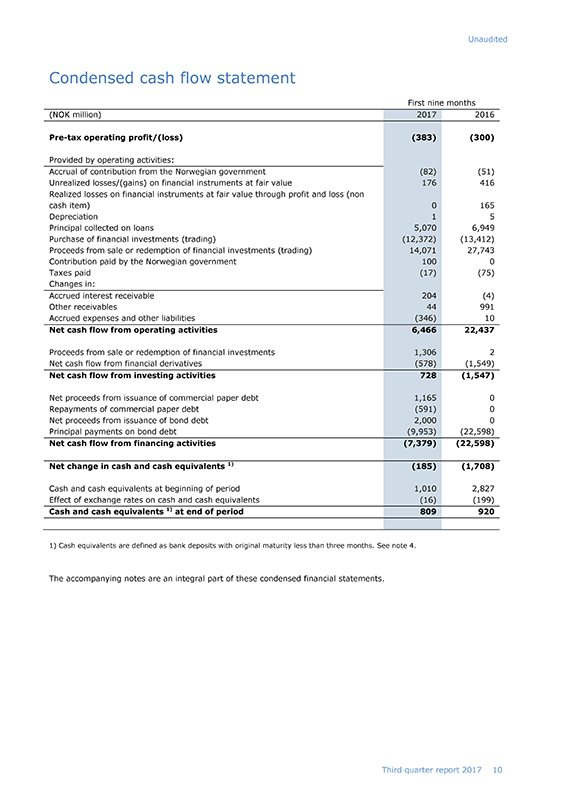
Unaudited Condensed cash flow statement First nine months (NOK million) 2017 2016Pre-tax operating profit/(loss) (383) (300) Provided by operating activities: Accrual of contribution from the Norwegian government (82) (51) Unrealized losses/(gains) on financial instruments at fair value 176 416 Realized losses on financial instruments at fair value through profit and loss (non cash item) 0 165 Depreciation 1 5 Principal collected on loans 5,070 6,949 Purchase of financial investments (trading) (12,372) (13,412) Proceeds from sale or redemption of financial investments (trading) 14,071 27,743 Contribution paid by the Norwegian government 100 0 Taxes paid (17) (75) Changes in: Accrued interest receivable 204 (4) Other receivables 44 991 Accrued expenses and other liabilities (346) 10 Net cash flow from operating activities 6,466 22,437 Proceeds from sale or redemption of financial investments 1,306 2 Net cash flow from financial derivatives (578) (1,549) Net cash flow from investing activities 728 (1,547) Net proceeds from issuance of commercial paper debt 1,165 0 Repayments of commercial paper debt (591) 0 Net proceeds from issuance of bond debt 2,000 0 Principal payments on bond debt (9,953) (22,598) Net cash flow from financing activities (7,379) (22,598) Net change in cash and cash equivalents 1) (185) (1,708) Cash and cash equivalents at beginning of period 1,010 2,827 Effect of exchange rates on cash and cash equivalents (16) (199) Cash and cash equivalents 1) at end of period 809 920 1) Cash equivalents are defined as bank deposits with original maturity less than three months. See note 4. The accompanying notes are an integral part of these condensed financial statements. report 2017 10 Third quarter
Unaudited Notes to the accounts 1. Accounting policies Eksportfinans’ third quarter condensed interim financial statements have been presented in accordance with International Financial Reporting Standards (IFRS), in line with IFRS as adopted by the European Union (EU). The condensed interim financial statements have been prepared in accordance with IAS 34, Interim Financial Reporting. Except for the changed presentation of interest income and expenses related to the 108 agreement, described below, the accounting policies and methods of computation applied in the preparation of these condensed interim financial statements (including information as of and for the year ended December 31, 2016) are the same as those applied in Eksportfinans’ annual financial statements of 2016. Those financial statements were approved for issue by the Board of Directors on February 16, 2017 and included in the company’s Annual Report on Form20-F for theyear-end December 31, 2016. These policies have been consistently applied to all the periods presented. These financial statements should be read in conjunction with the annual report on Form20-F for the year ended December 31, 2016. Judgments made in the preparations of these financial statements are the same as those made in theyear-end financial statements. The interim financial statements do not include risk disclosures and which should be read in conjunction with the annual financial statements. The Norwegian Ministry of Trade, Industry and Fisheries and Eksportfinans have agreed to amend part of the «108 agreement» with effect from January 1, 2017. These amendments will simplify the accounting and reporting procedures of the agreement. The amendments have also changed the presentation of interest income and expenses for the loans under the 108 agreement, with the effect from January 1, 2017. From January 1, 2017, the interest income reflects the actual interest rate paid by the borrower, adjusted by the interest rate adjustments paid by the government. The interest expense reflects the actual interest rate paid to the lender. Previously, both interest income and interest expense were based on reference rates as specified by the 108 agreement. As this change was not reflected in the Q1 quarterly report, the Q1 2017 numbers for both gross interest income and gross interest expenses are reduced by NOK 70 million as of June 30, 2017, compared to the previously reported numbers for March 31, 2017. The net interest income is not impacted by this change. IFRS 9 “Financial Instruments” IASB has completed the new standard for financial instruments, IFRS 9 “Financial instruments”. IFRS 9 covers recognition and derecognition, classification and measurement, impairment and hedging and replaces the current requirements covering these areas in IAS 39. The standard is endorsed by the EU and the standard is effective as from annual periods beginning on or after January 1, 2018. A detailed assessment of the classification and measurement of financial assets was performed in Q3 and no material changes are expected for financial assets. There will be an impact on the company’s accounting for financial liabilities, as the new requirements affect the accounting for financial liabilities that are designated at fair value through profit or loss and the company has bond debt for which the fair value option is applied. Under IAS 39, the changes in fair value have been recognized in profit and loss. Under IFRS 9, the company expects to continue to use the fair value option, and consequently, the changes in fair value as a result of changes in credit spread will be recognized in OCI. As previously communicated, the company does not plan to apply the hedge accounting rules in IFRS 9. The new impairment model requires the recognition of impairment provisions based on expected credit losses (ECL) rather than only incurred credit losses as is the case under IAS 39. As a result of the guarantees covering the majority of the loans, the company does not expect that changing to a ECL model will result in any material changes to the impairment provisions. The information for the three- and nine month periods ended September 30, 2017 and 2016 is unaudited. The information as of and for the year ended December 31, 2016 is derived from the company’s audited consolidated financial statements as of and for the year ended December 31, 2016. report 2017 11 Third quarter
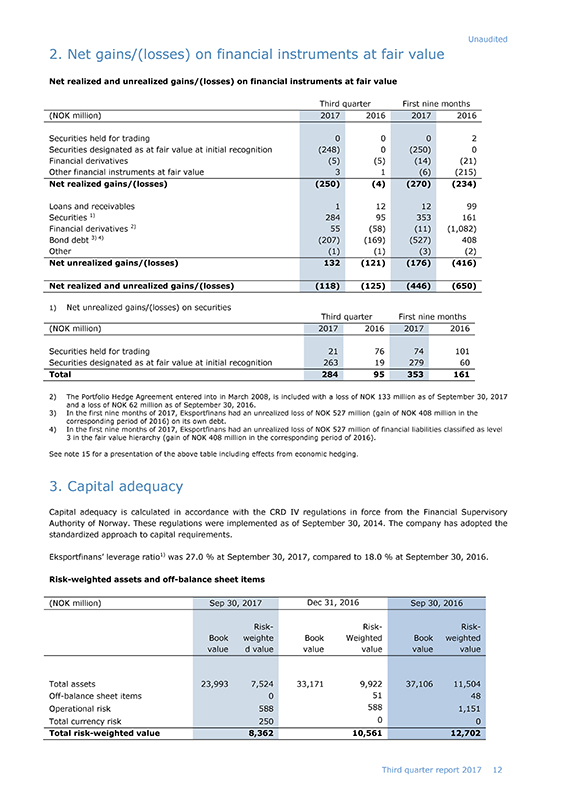
Unaudited 2. Net gains/(losses) on financial instruments at fair value Net realized and unrealized gains/(losses) on financial instruments at fair value Third quarter First nine months (NOK million) 2017 2016 2017 2016 Securities held for trading 0 0 0 2 Securities designated as at fair value at initial recognition (248) 0 (250) 0 Financial derivatives (5) (5) (14) (21) Other financial instruments at fair value 3 1 (6) (215) Net realized gains/(losses) (250) (4) (270) (234) Loans and receivables 1 12 12 99 Securities 1) 284 95 353 161 Financial derivatives 2) 55 (58) (11) (1,082) Bond debt 3) 4) (207) (169) (527) 408 Other (1) (1) (3) (2) Net unrealized gains/(losses) 132 (121) (176) (416) Net realized and unrealized gains/(losses) (118) (125) (446) (650) 1) Net unrealized gains/(losses) on securities Third quarter First nine months (NOK million) 2017 2016 2017 2016 Securities held for trading 21 76 74 101 Securities designated as at fair value at initial recognition 263 19 279 60 Total 284 95 353 161 2) The Portfolio Hedge Agreement entered into in March 2008, is included with a loss of NOK 133 million as of September 30, 2017 and a loss of NOK 62 million as of September 30, 2016. 3) In the first nine months of 2017, Eksportfinans had an unrealized loss of NOK 527 million (gain of NOK 408 million in the corresponding period of 2016) on its own debt. 4) In the first nine months of 2017, Eksportfinans had an unrealized loss of NOK 527 million of financial liabilities classified as level 3 in the fair value hierarchy (gain of NOK 408 million in the corresponding period of 2016). See note 15 for a presentation of the above table including effects from economic hedging. 3. Capital adequacy Capital adequacy is calculated in accordance with the CRD IV regulations in force from the Financial Supervisory Authority of Norway. These regulations were implemented as of September 30, 2014. The company has adopted the standardized approach to capital requirements. Eksportfinans’ leverage ratio1) was 27.0 % at September 30, 2017, compared to 18.0 % at September 30, 2016. Risk-weighted assets andoff-balance sheet items (NOK million) Sep 30, 2017 Dec 31, 2016 Sep 30, 2016 Risk- Risk- Risk-Book weighte Book Weighted Book weighted value d value value value value value Total assets 23,993 7,524 33,171 9,922 37,106 11,504Off-balance sheet items 0 51 48 Operational risk 588 588 1,151 Total currency risk 250 0 0 Total risk-weighted value 8,362 10,561 12,702 report 2017 12 Third quarter
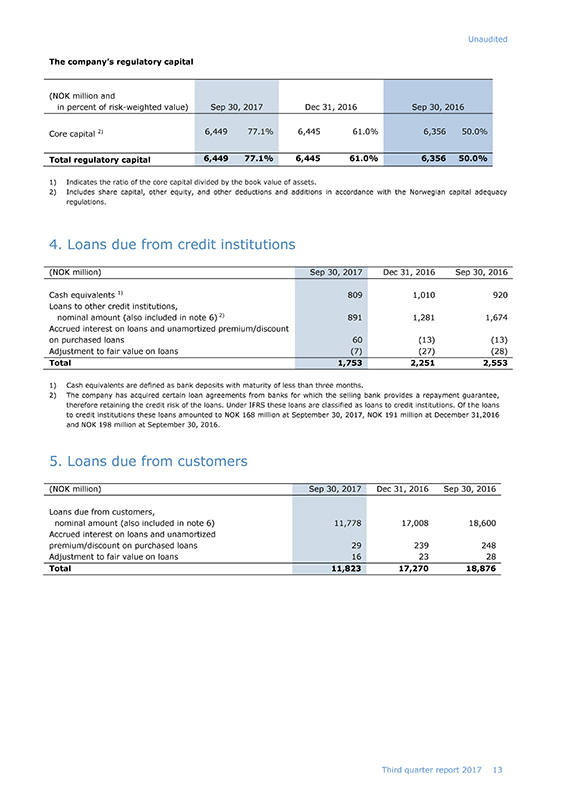
Unaudited The company’s regulatory capital (NOK million and in percent of risk-weighted value) Sep 30, 2017 Dec 31, 2016 Sep 30, 2016 Core capital 2) 6,449 77.1% 6,445 61.0% 6,356 50.0% Total regulatory capital 6,449 77.1% 6,445 61.0% 6,356 50.0% 1) Indicates the ratio of the core capital divided by the book value of assets. 2) Includes share capital, other equity, and other deductions and additions in accordance with the Norwegian capital adequacy regulations. 4. Loans due from credit institutions (NOK million) Sep 30, 2017 Dec 31, 2016 Sep 30, 2016 Cash equivalents 1) 809 1,010 920 Loans to other credit institutions, nominal amount (also included in note 6) 2) 891 1,281 1,674 Accrued interest on loans and unamortized premium/discount on purchased loans 60 (13) (13) Adjustment to fair value on loans (7) (27) (28) Total 1,753 2,251 2,553 1) Cash equivalents are defined as bank deposits with maturity of less than three months. 2) The company has acquired certain loan agreements from banks for which the selling bank provides a repayment guarantee, therefore retaining the credit risk of the loans. Under IFRS these loans are classified as loans to credit institutions. Of the loans to credit institutions these loans amounted to NOK 168 million at September 30, 2017, NOK 191 million at December 31,2016 and NOK 198 million at September 30, 2016. 5. Loans due from customers (NOK million) Sep 30, 2017 Dec 31, 2016 Sep 30, 2016 Loans due from customers, nominal amount (also included in note 6) 11,778 17,008 18,600 Accrued interest on loans and unamortized premium/discount on purchased loans 29 239 248 Adjustment to fair value on loans 16 23 28 Total 11,823 17,270 18,876 report 2017 13 Third quarter
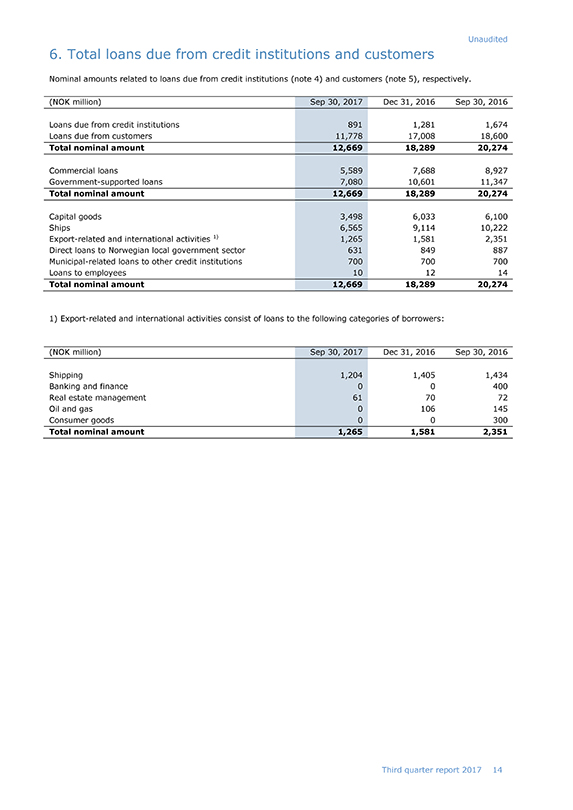
Unaudited 6. Total loans due from credit institutions and customers Nominal amounts related to loans due from credit institutions (note 4) and customers (note 5), respectively. (NOK million) Sep 30, 2017 Dec 31, 2016 Sep 30, 2016 Loans due from credit institutions 891 1,281 1,674 Loans due from customers 11,778 17,008 18,600 Total nominal amount 12,669 18,289 20,274 Commercial loans 5,589 7,688 8,927 Government-supported loans 7,080 10,601 11,347 Total nominal amount 12,669 18,289 20,274 Capital goods 3,498 6,033 6,100 Ships 6,565 9,114 10,222 Export-related and international activities 1) 1,265 1,581 2,351 Direct loans to Norwegian local government sector 631 849 887 Municipal-related loans to other credit institutions 700 700 700 Loans to employees 10 12 14 Total nominal amount 12,669 18,289 20,274 1) Export-related and international activities consist of loans to the following categories of borrowers: (NOK million) Sep 30, 2017 Dec 31, 2016 Sep 30, 2016 Shipping 1,204 1,405 1,434 Banking and finance 0 0 400 Real estate management 61 70 72 Oil and gas 0 106 145 Consumer goods 0 0 300 Total nominal amount 1,265 1,581 2,351 report 2017 14 Third quarter

Unaudited 7. Loans past due or impaired (NOK million) Sep 30, 2017 Dec 31, 2016 Sep 30, 2016 Interest and principal installment1-30 days past due 1 0 10 Not matured principal on loans with payments1-30 days past due 1 0 207 Interest and principal installment31-90 days past due 1 0 1 Not matured principal on loans with payments31-90 days past due 5 0 7 Interest and principal installment more than 90 days past due 7 30 71 Not matured principal on loans with payments more than 90 days past due 14 47 318 Total loans past due 29 77 614 Relevant collateral or guarantees received 1) 29 77 614 Fair value adjustment on loans past due 0 0 0 Impairments on loans measured at amortized cost 0 0 0 1) The company considers all loans to be secured in a satisfactory manner. For these transactions, amounting to NOK 29 million, the Norwegian government, through the Guarantee Institute for Export Credit (GIEK), guarantees approximately 90 percent of the amounts in default. The remaining 10 percent are guaranteed by private banks, most of them operating in Norway. Where applicable, claims have already been submitted in accordance with the guarantees. 8. Securities and repurchase receivable (NOK million) Sep 30, 2017 Dec 31, 2016 Sep 30, 2016 Trading portfolio 6,136 7,659 7,357 Repurchase receivable 0 0 0 Other securities at fair value through profit and loss 62 1,164 1,764 Total 6,198 8,823 9,121 report 2017 15 Third quarter
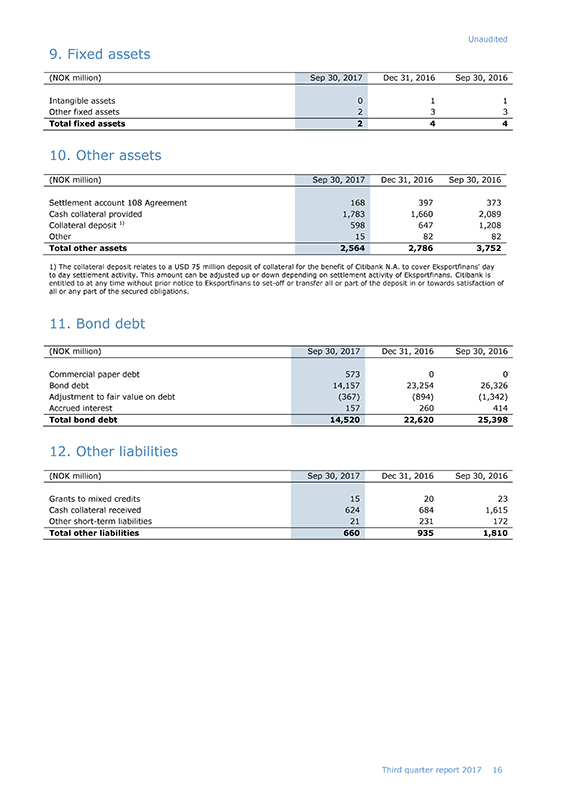
Unaudited 9. Fixed assets (NOK million) Sep 30, 2017 Dec 31, 2016 Sep 30, 2016 Intangible assets 0 1 1 Other fixed assets 2 3 3 Total fixed assets 2 4 4 10. Other assets (NOK million) Sep 30, 2017 Dec 31, 2016 Sep 30, 2016 Settlement account 108 Agreement 168 397 373 Cash collateral provided 1,783 1,660 2,089 Collateral deposit 1) 598 647 1,208 Other 15 82 82 Total other assets 2,564 2,786 3,752 1) The collateral deposit relates to a USD 75 million deposit of collateral for the benefit of Citibank N.A. to cover Eksportfinans’ day to day settlement activity. This amount can be adjusted up or down depending on settlement activity of Eksportfinans. Citibank is entitled to at any time without prior notice to Eksportfinans toset-off or transfer all or part of the deposit in or towards satisfaction of all or any part of the secured obligations. 11. Bond debt (NOK million) Sep 30, 2017 Dec 31, 2016 Sep 30, 2016 Commercial paper debt 573 0 0 Bond debt 14,157 23,254 26,326 Adjustment to fair value on debt (367) (894) (1,342) Accrued interest 157 260 414 Total bond debt 14,520 22,620 25,398 12. Other liabilities (NOK million) Sep 30, 2017 Dec 31, 2016 Sep 30, 2016 Grants to mixed credits 15 20 23 Cash collateral received 624 684 1,615 Other short-term liabilities 21 231 172 Total other liabilities 660 935 1,810 report 2017 16 Third quarter
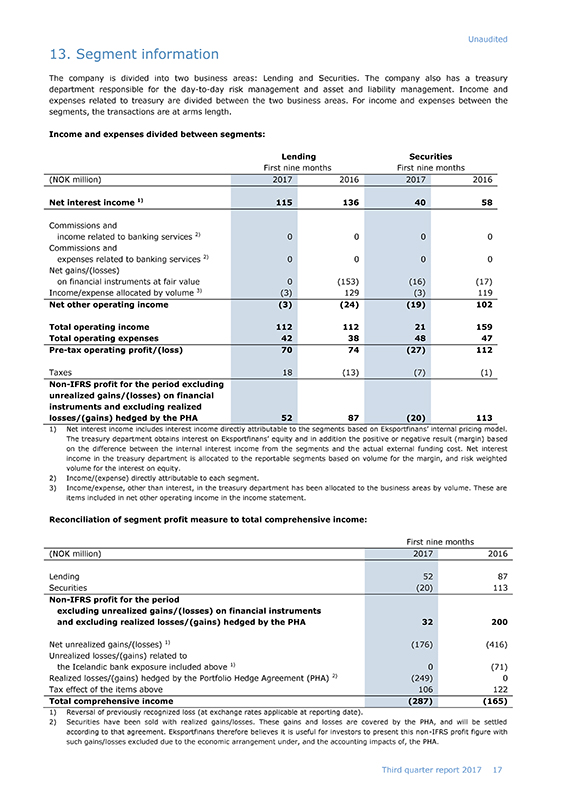
Unaudited 13. Segment information The company is divided into two business areas: Lending and Securities. The company also has a treasury department responsible for theday-to-day risk management and asset and liability management. Income and expenses related to treasury are divided between the two business areas. For income and expenses between the segments, the transactions are at arms length. Income and expenses divided between segments: Lending Securities First nine months First nine months (NOK million) 2017 2016 2017 2016 Net interest income 1) 115 136 40 58 Commissions and income related to banking services 2) 0 0 0 0 Commissions and expenses related to banking services 2) 0 0 0 0 Net gains/(losses) on financial instruments at fair value 0 (153) (16) (17) Income/expense allocated by volume 3) (3) 129 (3) 119 Net other operating income (3) (24) (19) 102 Total operating income 112 112 21 159 Total operating expenses 42 38 48 47Pre-tax operating profit/(loss) 70 74 (27) 112 Taxes 18 (13) (7) (1)Non-IFRS profit for the period excluding unrealized gains/(losses) on financial instruments and excluding realized losses/(gains) hedged by the PHA 52 87 (20) 113 1) Net interest income includes interest income directly attributable to the segments based on Eksportfinans’ internal pricing model. The treasury department obtains interest on Eksportfinans’ equity and in addition the positive or negative result (margin) based on the difference between the internal interest income from the segments and the actual external funding cost. Net interest income in the treasury department is allocated to the reportable segments based on volume for the margin, and risk weighted volume for the interest on equity. 2) Income/(expense) directly attributable to each segment. 3) Income/expense, other than interest, in the treasury department has been allocated to the business areas by volume. These are items included in net other operating income in the income statement. Reconciliation of segment profit measure to total comprehensive income: First nine months (NOK million) 2017 2016 Lending 52 87 Securities (20) 113Non-IFRS profit for the period gains/(losses) on financial instruments excluding unrealized and excluding realized losses/(gains) hedged by the PHA 32 200 Net unrealized gains/(losses) 1) (176) (416) Unrealized losses/(gains) related to the Icelandic bank exposure included above 1) 0 (71) Realized losses/(gains) hedged by the Portfolio Hedge Agreement (PHA) 2) (249) 0 Tax effect of the items above 106 122 Total comprehensive income (287) (165) 1) Reversal of previously recognized loss (at exchange rates applicable at reporting date). 2) Securities have been sold with realized gains/losses. These gains and losses are covered by the PHA, and will be settled according to that agreement. Eksportfinans therefore believes it is useful for investors to present thisnon-IFRS profit figure with such gains/losses excluded due to the economic arrangement under, and the accounting impacts of, the PHA. report 2017 17 Third quarter
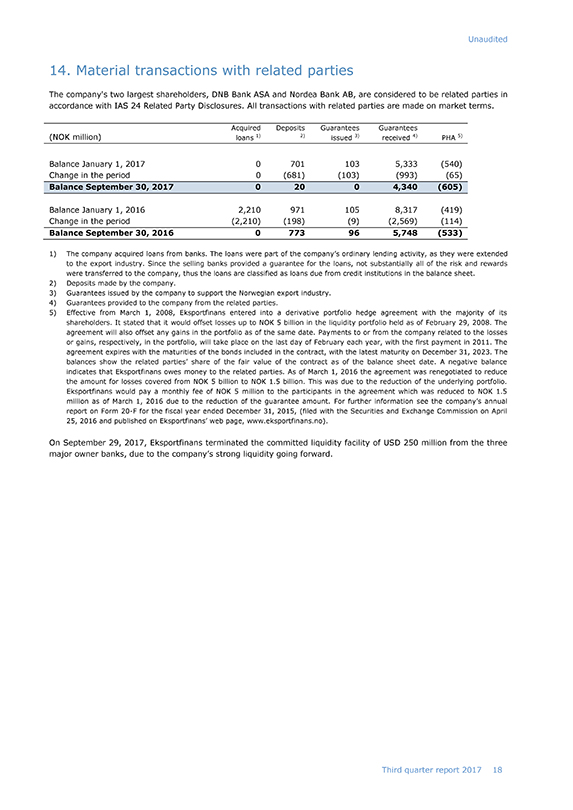
Unaudited 14. Material transactions with related parties The company’s two largest shareholders, DNB Bank ASA and Nordea Bank AB, are considered to be related parties in accordance with IAS 24 Related Party Disclosures. All transactions with related parties are made on market terms. Acquired Deposits Guarantees Guarantees (NOK million) loans 1) 2) issued 3) received 4) PHA 5) Balance January 1, 2017 0 701 103 5,333 (540) Change in the period 0 (681) (103) (993) (65) Balance September 30, 2017 0 20 0 4,340 (605) Balance January 1, 2016 2,210 971 105 8,317 (419) Change in the period (2,210) (198) (9) (2,569) (114) Balance September 30, 2016 0 773 96 5,748 (533) 1) The company acquired loans from banks. The loans were part of the company’s ordinary lending activity, as they were extended to the export industry. Since the selling banks provided a guarantee for the loans, not substantially all of the risk and rewards were transferred to the company, thus the loans are classified as loans due from credit institutions in the balance sheet. 2) Deposits made by the company. 3) Guarantees issued by the company to support the Norwegian export industry. 4) Guarantees provided to the company from the related parties. 5) Effective from March 1, 2008, Eksportfinans entered into a derivative portfolio hedge agreement with the majority of its shareholders. It stated that it would offset losses up to NOK 5 billion in the liquidity portfolio held as of February 29, 2008. The agreement will also offset any gains in the portfolio as of the same date. Payments to or from the company related to the losses or gains, respectively, in the portfolio, will take place on the last day of February each year, with the first payment in 2011. The agreement expires with the maturities of the bonds included in the contract, with the latest maturity on December 31, 2023. The balances show the related parties’ share of the fair value of the contract as of the balance sheet date. A negative balance indicates that Eksportfinans owes money to the related parties. As of March 1, 2016 the agreement was renegotiated to reduce the amount for losses covered from NOK 5 billion to NOK 1.5 billion. This was due to the reduction of the underlying portfolio. Eksportfinans would pay a monthly fee of NOK 5 million to the participants in the agreement which was reduced to NOK 1.5 million as of March 1, 2016 due to the reduction of the guarantee amount. For further information see the company’s annual report on Form20-F for the fiscal year ended December 31, 2015, (filed with the Securities and Exchange Commission on April 25, 2016 and published on Eksportfinans’ web page, www.eksportfinans.no). On September 29, 2017, Eksportfinans terminated the committed liquidity facility of USD 250 million from the three major owner banks, due to the company’s strong liquidity going forward. report 2017 18 Third quarter
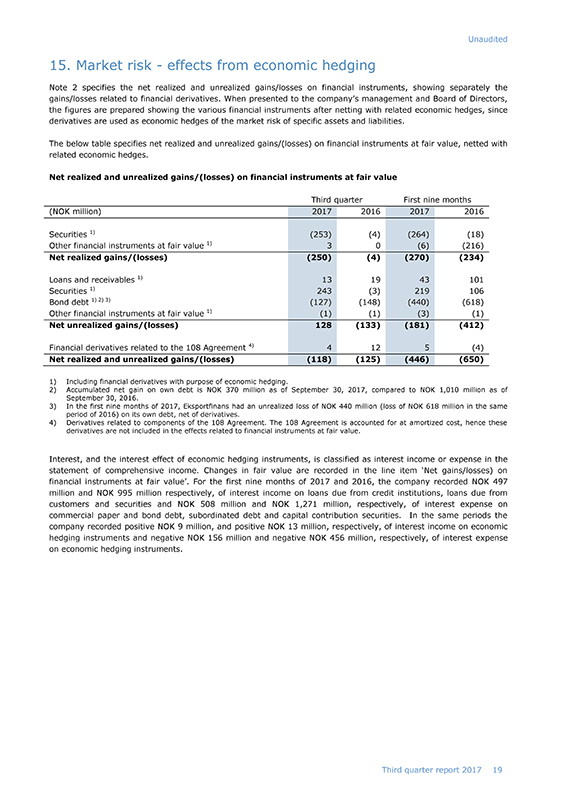
Unaudited 15. Market risk—effects from economic hedging Note 2 specifies the net realized and unrealized gains/losses on financial instruments, showing separately the gains/losses related to financial derivatives. When presented to the company’s management and Board of Directors, the figures are prepared showing the various financial instruments after netting with related economic hedges, since derivatives are used as economic hedges of the market risk of specific assets and liabilities. The below table specifies net realized and unrealized gains/(losses) on financial instruments at fair value, netted with related economic hedges. Net realized and unrealized gains/(losses) on financial instruments at fair value Third quarter First nine months (NOK million) 2017 2016 2017 2016 Securities 1) (253) (4) (264) (18) Other financial instruments at fair value 1) 3 0 (6) (216) Net realized gains/(losses) (250) (4) (270) (234) Loans and receivables 1) 13 19 43 101 Securities 1) 243 (3) 219 106 Bond debt 1) 2) 3) (127) (148) (440) (618) Other financial instruments at fair value 1) (1) (1) (3) (1) Net unrealized gains/(losses) 128 (133) (181) (412) Financial derivatives related to the 108 Agreement 4) 4 12 5 (4) Net realized and unrealized gains/(losses) (118) (125) (446) (650) 1) Including financial derivatives with purpose of economic hedging. 2) Accumulated net gain on own debt is NOK 370 million as of September 30, 2017, compared to NOK 1,010 million as of September 30, 2016. 3) In the first nine months of 2017, Eksportfinans had an unrealized loss of NOK 440 million (loss of NOK 618 million in the same period of 2016) on its own debt, net of derivatives. 4) Derivatives related to components of the 108 Agreement. The 108 Agreement is accounted for at amortized cost, hence these derivatives are not included in the effects related to financial instruments at fair value. Interest, and the interest effect of economic hedging instruments, is classified as interest income or expense in the statement of comprehensive income. Changes in fair value are recorded in the line item ‘Net gains/losses) on financial instruments at fair value’. For the first nine months of 2017 and 2016, the company recorded NOK 497 million and NOK 995 million respectively, of interest income on loans due from credit institutions, loans due from customers and securities and NOK 508 million and NOK 1,271 million, respectively, of interest expense on commercial paper and bond debt, subordinated debt and capital contribution securities. In the same periods the company recorded positive NOK 9 million, and positive NOK 13 million, respectively, of interest income on economic hedging instruments and negative NOK 156 million and negative NOK 456 million, respectively, of interest expense on economic hedging instruments. report 2017 19 Third quarter
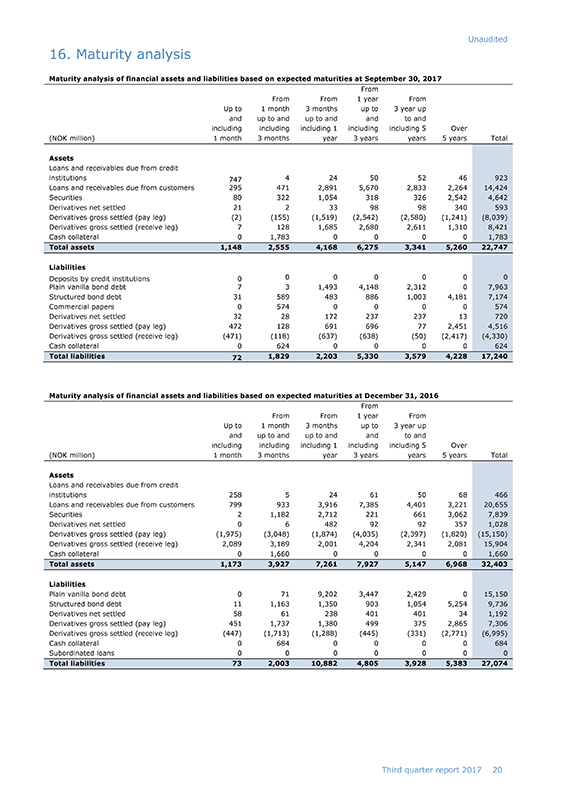
Unaudited 16. Maturity analysis Maturity analysis of financial assets and liabilities based on expected maturities at September 30, 2017 From From From 1 year From Up to 1 month 3 months up to 3 year up and up to and up to and and to and including including including 1 including including 5 Over (NOK million) 1 month 3 months year 3 years years 5 years Total Assets Loans and receivables due from credit institutions 747 4 24 50 52 46 923 Loans and receivables due from customers 295 471 2,891 5,670 2,833 2,264 14,424 Securities 80 322 1,054 318 326 2,542 4,642 Derivatives net settled 21 2 33 98 98 340 593 Derivatives gross settled (pay leg) (2) (155) (1,519) (2,542) (2,580) (1,241) (8,039) Derivatives gross settled (receive leg) 7 128 1,685 2,680 2,611 1,310 8,421 Cash collateral 0 1,783 0 0 0 0 1,783 Total assets 1,148 2,555 4,168 6,275 3,341 5,260 22,747 Liabilities Deposits by credit institutions 0 0 0 0 0 0 0 Plain vanilla bond debt 7 3 1,493 4,148 2,312 0 7,963 Structured bond debt 31 589 483 886 1,003 4,181 7,174 Commercial papers 0 574 0 0 0 0 574 Derivatives net settled 32 28 172 237 237 13 720 Derivatives gross settled (pay leg) 472 128 691 696 77 2,451 4,516 Derivatives gross settled (receive leg) (471) (118) (637) (638) (50) (2,417) (4,330) Cash collateral 0 624 0 0 0 0 624 Total liabilities 72 1,829 2,203 5,330 3,579 4,228 17,240 Maturity analysis of financial assets and liabilities based on expected maturities at December 31, 2016 From From From 1 year From Up to 1 month 3 months up to 3 year up and up to and up to and and to and including including including 1 including including 5 Over (NOK million) 1 month 3 months year 3 years years 5 years Total Assets Loans and receivables due from credit institutions 258 5 24 61 50 68 466 Loans and receivables due from customers 799 933 3,916 7,385 4,401 3,221 20,655 Securities 2 1,182 2,712 221 661 3,062 7,839 Derivatives net settled 0 6 482 92 92 357 1,028 Derivatives gross settled (pay leg) (1,975) (3,048) (1,874) (4,035) (2,397) (1,820) (15,150) Derivatives gross settled (receive leg) 2,089 3,189 2,001 4,204 2,341 2,081 15,904 Cash collateral 0 1,660 0 0 0 0 1,660 Total assets 1,173 3,927 7,261 7,927 5,147 6,968 32,403 Liabilities Plain vanilla bond debt 0 71 9,202 3,447 2,429 0 15,150 Structured bond debt 11 1,163 1,350 903 1,054 5,254 9,736 Derivatives net settled 58 61 238 401 401 34 1,192 Derivatives gross settled (pay leg) 451 1,737 1,380 499 375 2,865 7,306 Derivatives gross settled (receive leg) (447) (1,713) (1,288) (445) (331) (2,771) (6,995) Cash collateral 0 684 0 0 0 0 684 Subordinated loans 0 0 0 0 0 0 0 Total liabilities 73 2,003 10,882 4,805 3,928 5,383 27,074 report 2017 20 Third quarter
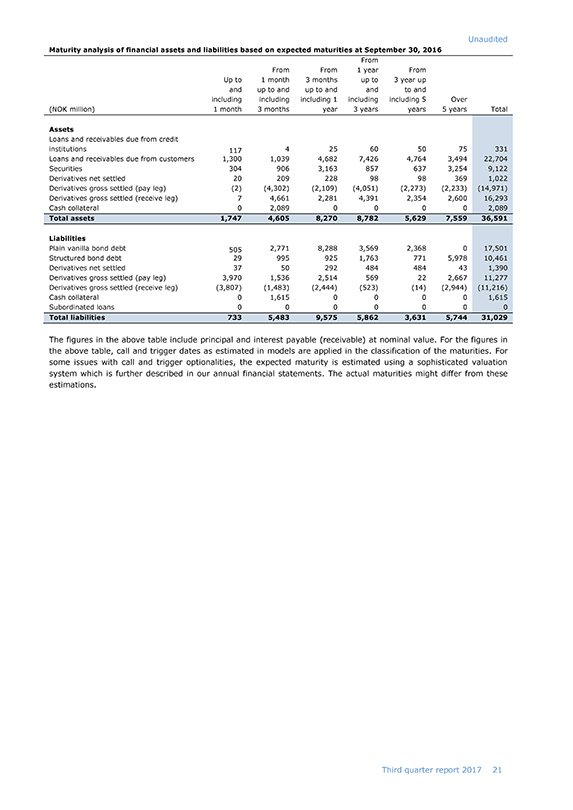
Unaudited Maturity analysis of financial assets and liabilities based on expected maturities at September 30, 2016 From From From 1 year From Up to 1 month 3 months up to 3 year up and up to and up to and and to and including including including 1 including including 5 Over (NOK million) 1 month 3 months year 3 years years 5 years Total Assets Loans and receivables due from credit institutions 117 4 25 60 50 75 331 Loans and receivables due from customers 1,300 1,039 4,682 7,426 4,764 3,494 22,704 Securities 304 906 3,163 857 637 3,254 9,122 Derivatives net settled 20 209 228 98 98 369 1,022 Derivatives gross settled (pay leg) (2) (4,302) (2,109) (4,051) (2,273) (2,233) (14,971) Derivatives gross settled (receive leg) 7 4,661 2,281 4,391 2,354 2,600 16,293 Cash collateral 0 2,089 0 0 0 0 2,089 Total assets 1,747 4,605 8,270 8,782 5,629 7,559 36,591 Liabilities Plain vanilla bond debt 505 2,771 8,288 3,569 2,368 0 17,501 Structured bond debt 29 995 925 1,763 771 5,978 10,461 Derivatives net settled 37 50 292 484 484 43 1,390 Derivatives gross settled (pay leg) 3,970 1,536 2,514 569 22 2,667 11,277 Derivatives gross settled (receive leg) (3,807) (1,483) (2,444) (523) (14) (2,944) (11,216) Cash collateral 0 1,615 0 0 0 0 1,615 Subordinated loans 0 0 0 0 0 0 0 Total liabilities 733 5,483 9,575 5,862 3,631 5,744 31,029 The figures in the above table include principal and interest payable (receivable) at nominal value. For the figures in the above table, call and trigger dates as estimated in models are applied in the classification of the maturities. For some issues with call and trigger optionalities, the expected maturity is estimated using a sophisticated valuation system which is further described in our annual financial statements. The actual maturities might differ from these estimations. report 2017 21 Third quarter
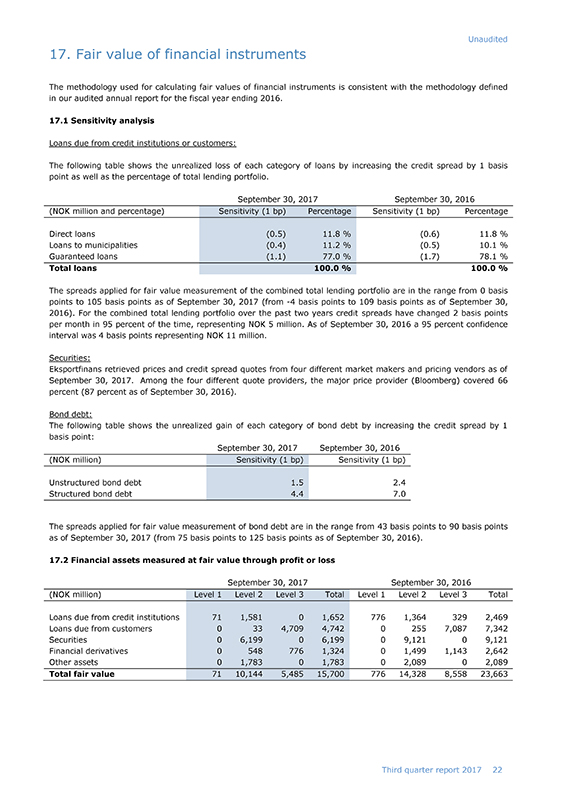
Unaudited 17. Fair value of financial instruments The methodology used for calculating fair values of financial instruments is consistent with the methodology defined in our audited annual report for the fiscal year ending 2016. 17.1 Sensitivity analysis Loans due from credit institutions or customers: The following table shows the unrealized loss of each category of loans by increasing the credit spread by 1 basis point as well as the percentage of total lending portfolio. September 30, 2017 September 30, 2016 (NOK million and percentage) Sensitivity (1 bp) Percentage Sensitivity (1 bp) Percentage Direct loans (0.5) 11.8 % (0.6) 11.8 % Loans to municipalities (0.4) 11.2 % (0.5) 10.1 % Guaranteed loans (1.1) 77.0 % (1.7) 78.1 % Total loans 100.0 % 100.0 % The spreads applied for fair value measurement of the combined total lending portfolio are in the range from 0 basis points to 105 basis points as of September 30, 2017 (from-4 basis points to 109 basis points as of September 30, 2016). For the combined total lending portfolio over the past two years credit spreads have changed 2 basis points per month in 95 percent of the time, representing NOK 5 million. As of September 30, 2016 a 95 percent confidence interval was 4 basis points representing NOK 11 million. Securities: Eksportfinans retrieved prices and credit spread quotes from four different market makers and pricing vendors as of September 30, 2017. Among the four different quote providers, the major price provider (Bloomberg) covered 66 percent (87 percent as of September 30, 2016). Bond debt: The following table shows the unrealized gain of each category of bond debt by increasing the credit spread by 1 basis point: September 30, 2017 September 30, 2016 (NOK million) Sensitivity (1 bp) Sensitivity (1 bp) Unstructured bond debt 1.5 2.4 Structured bond debt 4.4 7.0 The spreads applied for fair value measurement of bond debt are in the range from 43 basis points to 90 basis points as of September 30, 2017 (from 75 basis points to 125 basis points as of September 30, 2016). 17.2 Financial assets measured at fair value through profit or loss September 30, 2017 September 30, 2016 (NOK million) Level 1 Level 2 Level 3 Total Level 1 Level 2 Level 3 Total Loans due from credit institutions 71 1,581 0 1,652 776 1,364 329 2,469 Loans due from customers 0 33 4,709 4,742 0 255 7,087 7,342 Securities 0 6,199 0 6,199 0 9,121 0 9,121 Financial derivatives 0 548 776 1,3240 1,499 1,143 2,642 Other assets 0 1,783 0 1,7830 2,089 0 2,089 Total fair value 71 10,144 5,485 15,700 776 14,328 8,558 23,663 report 2017 22 Third quarter
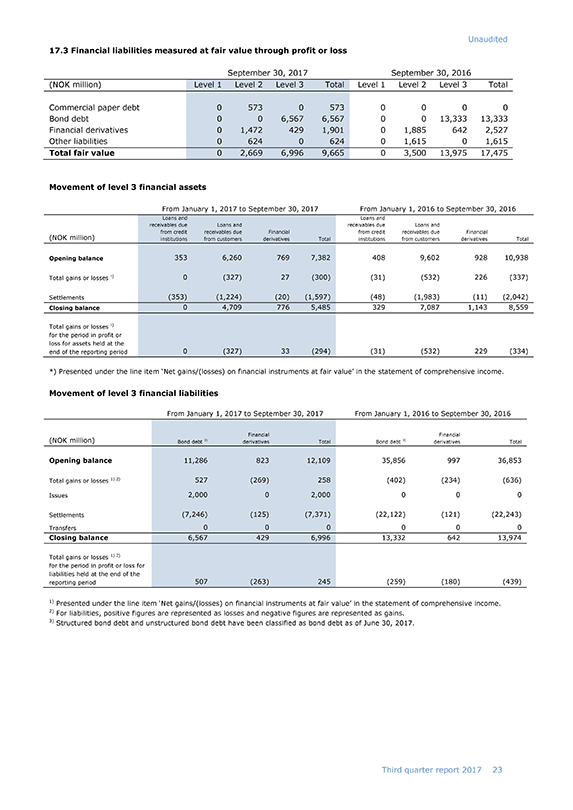
Unaudited 17.3 Financial liabilities measured at fair value through profit or loss September 30, 2017 September 30, 2016 (NOK million) Level 1 Level 2 Level 3 Total Level 1 Level 2 Level 3 Total Commercial paper debt 0 573 0 573 0 0 0 0 Bond debt 0 0 6,567 6,567 0 0 13,333 13,333 Financial derivatives 0 1,472 429 1,901 0 1,885 642 2,527 Other liabilities 0 624 0 624 0 1,615 0 1,615 Total fair value 0 2,669 6,996 9,665 0 3,500 13,975 17,475 Movement of level 3 financial assets From January 1, 2017 to September 30, 2017 From January 1, 2016 to September 30, 2016 Loans and Loans and receivables due Loans and receivables due Loans and from credit receivables due Financial from credit receivables due Financial (NOK million) institutions from customers derivatives Total institutions from customers derivatives Total Opening balance 353 6,260 769 7,382 408 9,602 928 10,938 Total gains or losses !) 0 (327) 27 (300) (31) (532) 226 (337) Settlements (353) (1,224) (20) (1,597) (48) (1,983) (11) (2,042) Closing balance 0 4,709 776 5,485 329 7,087 1,143 8,559 Total gains or losses !) for the period in profit or loss for assets held at the end of the reporting period 0 (327) 33 (294) (31) (532) 229 (334) *) Presented under the line item ‘Net gains/(losses) on financial instruments at fair value’ in the statement of comprehensive income. Movement of level 3 financial liabilities From January 1, 2017 to September 30, 2017 From January 1, 2016 to September 30, 2016 Financial Financial (NOK million) Bond debt 3) derivatives Total Bond debt 3) derivatives Total Opening balance 11,286 823 12,109 35,856 997 36,853 Total gains or losses 1) 2) 527 (269) 258 (402) (234) (636) Issues 2,000 0 2,000 0 0 0 Settlements (7,246) (125) (7,371) (22,122) (121) (22,243) Transfers 0 0 0 0 0 0 Closing balance 6,567 429 6,996 13,332 642 13,974 Total gains or losses 1) 2) for the period in profit or loss for liabilities held at the end of the reporting period 507 (263) 245 (259) (180) (439) 1) Presented under the line item ‘Net gains/(losses) on financial instruments at fair value’ in the statement of comprehensive income. 2) For liabilities, positive figures are represented as losses and negative figures are represented as gains. 3) Structured bond debt and unstructured bond debt have been classified as bond debt as of June 30, 2017. report 2017 23 Third quarter
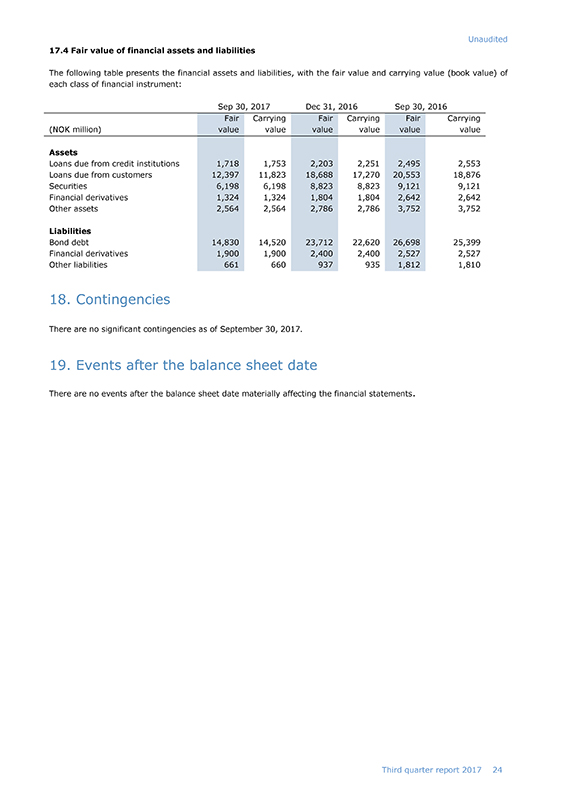
Unaudited 17.4 Fair value of financial assets and liabilities The following table presents the financial assets and liabilities, with the fair value and carrying value (book value) of each class of financial instrument: Sep 30, 2017 Dec 31, 2016 Sep 30, 2016 Fair Carrying Fair Carrying Fair Carrying (NOK million) value value value value value value Assets Loans due from credit institutions 1,718 1,753 2,203 2,251 2,495 2,553 Loans due from customers 12,397 11,823 18,688 17,270 20,553 18,876 Securities 6,198 6,198 8,823 8,823 9,121 9,121 Financial derivatives 1,324 1,324 1,804 1,804 2,642 2,642 Other assets 2,564 2,564 2,786 2,786 3,752 3,752 Liabilities Bond debt 14,830 14,520 23,712 22,620 26,698 25,399 Financial derivatives 1,900 1,900 2,400 2,400 2,527 2,527 Other liabilities 661 660 937 935 1,812 1,810 18. Contingencies There are no significant contingencies as of September 30, 2017. 19. Events after the balance sheet date There are no events after the balance sheet date materially affecting the financial statements. report 2017 24 Third quarter