UNITED STATES
SECURITIES AND EXCHANGE COMMISSION
Washington, D.C. 20549
FORM N-CSR
CERTIFIED SHAREHOLDER REPORT OF REGISTERED MANAGEMENT INVESTMENT COMPANIES
| | |
| Investment Company Act file number: | | 811-03421 |
| |
| Exact name of registrant as specified in charter: | | The Prudential Variable Contract Account – 10 |
| |
| Address of principal executive offices: | | 655 Broad Street, 17th Floor |
| | Newark, New Jersey 07102 |
| |
| Name and address of agent for service: | | Andrew R. French |
| | 655 Broad Street, 17th Floor |
| | Newark, New Jersey 07102 |
| |
| Registrant’s telephone number, including area code: | | 800-225-1852 |
| |
| Date of fiscal year end: | | 12/31/2021 |
| |
| Date of reporting period: | | 12/31/2021 |
Item 1 – Reports to Stockholders
| | |
| |
The MEDLEY Program | | |
| |
ANNUAL REPORT | | December 31, 2021 |

The report is for the information of persons participating in The Prudential Variable Contract Account-10 (VCA-10), The Prudential Variable Contract Account-11 (VCA-11), and The Prudential Variable Contract Account-24 (VCA-24) (Collectively known as the “Accounts”) of The MEDLEY Program. VCA-10, VCA-11, and VCA-24 are group annuity insurance products issued by The Prudential Insurance Company of America, 751 Broad Street, Newark, NJ 07102-3777, and are distributed by Prudential Investment Management Services LLC (PIMS), member SIPC, 655 Broad Street, 19th Floor, Newark, NJ 07102. Both are Prudential Financial companies.
The views expressed in this report and information about the Accounts’ portfolio holdings are for the period covered by this report and are subject to change thereafter.
Please note that this report may include prospectus supplements that are separate from and not a part of this report.

The toll-free number shown below can be used to make transfers and reallocations, review how your premiums are being allocated, and receive current investment option values in your contract. Unit values for each investment option are available to all participants from the toll-free number. Please be sure to have your contract number available when you call.
(800) 458-6333
Investors should consider the contract and the underlying portfolios’ investment objectives, risks, charges and expenses carefully before investing. This and other important information is contained in the prospectuses that can be obtained from your financial professional. You should read the prospectuses carefully before investing.
This report includes the financial statements of VCA-10, and the portfolios of The Prudential Series Fund (the “Funds”) available through VCA-11 and VCA-24.
This report does not include separate account financials for the VCA-11 and VCA-24 Subaccounts. If you would like separate account financial statements, please call the telephone number above.
Annuity contracts contain exclusions, limitations, reductions of benefits, and terms for keeping them in force. Your plan sponsor or licensed financial professional can provide you with costs and complete details. Contract guarantees are based on the claims-paying ability of the issuing company.
Information regarding how the VCA-10 voted proxies relating to portfolio securities during the most recent 12-month period ended June 30 is available on the website of the Securities and Exchange Commission (the “Commission”) at www.sec.gov and on VCA-10’s website.
The MEDLEY Program Statement of Additional Information contains additional information about the Committee Members of VCA-10 and is available without charge upon request by calling (800) 458-6333.
VCA-10 will file with the Commission a complete listing of portfolio holdings as of the end of the first and third quarters on Form N-PORT. Form N-PORT will be available on the Commission’s website at www.sec.gov or call (800) 732-0330. MEDLEY participants may obtain copies of Form N-PORT filings by calling (800) 458-6333.
| | | | |
The Prudential MEDLEY Program Table of Contents | | Annual Report | | December 31, 2021 |
| | ∎ | | VCA-10 REPORT OF THE INVESTMENT MANAGER AND PRESENTATION OF PORTFOLIO HOLDINGS |
Financial Statements
Information about the Committee and Officers
| | ∎ | | VCA-11 AND VCA-24 REPORTS OF THE INVESTMENT MANAGER AND PRESENTATION OF PORTFOLIO HOLDINGS |
| | ∎ | | VCA-11 AND VCA-24 THE PRUDENTIAL SERIES FUND PORTFOLIOS |
Section A Schedule of Investments and Financial Statements
Section B Financial Highlights
Section C Notes to the Financial Statements
Section D Report of Independent Registered Public Accounting Firm
Section E Information about Trustees and Officers
| | | | |
The Prudential MEDLEY Program Letter to Participants | | Annual Report | | December 31, 2021 |
At Prudential, our primary objective is to help investors achieve and maintain long-term financial success. Despite today’s uncertainties, we remain strong and ready to serve and support you. This MEDLEY Program annual report outlines our efforts to achieve this goal. We hope you find it informative and useful.
Prudential has been building on a heritage of success for more than 145 years. You can count on our history of financial stability. We are diversified for endurance. Our balanced mix of risks and businesses positions us well to manage through any economic environment. We’ve applied the lessons from decades of challenges to be stronger, because we are committed to keeping our promises to you.
Your financial professional is the best resource to help you make the most informed investment decisions. Together, you can build a diversified investment portfolio that aligns with your long-term financial goals. Please keep in mind that diversification and asset allocation strategies do not assure a profit or protect against loss in declining markets.
Thank you for selecting Prudential as one of your financial partners. A strong sense of social responsibility for our clients, our employees, and our communities has been embedded in the company since our founding. It guides our efforts to help our customers achieve peace of mind through financial wellness.
We value your trust and appreciate the opportunity to help you achieve financial security.
Sincerely,
| | | | |

| | 
| | |
| | |
Stuart Parker | | Timothy S. Cronin | | |
President, | | President, | | |
The Prudential Variable Contract Account 10 | | The Prudential Series Fund | | |
| | | | January 31, 2022 |
| | | | |
Market Overview — unaudited | | Annual Report | | December 31, 2021 |
Equity Market Overview
Stock markets throughout the world rallied in 2021 in reaction to massive ongoing economic stimulus packages, the re-opening of economies following COVID-19 pandemic lockdowns, rollouts of COVID-19 vaccines, record corporate profits, upbeat employment data, and strong consumer demand. However, supply-chain bottlenecks, concerns about rising inflation, and the emergence of COVID-19 variants led to occasional volatility. While developed markets shined, emerging markets faltered due largely to the poor performance of Chinese stocks and prospects of rising interest rates in the US and elsewhere.
Stocks delivered double-digit returns
For the year, the large-cap S&P 500 Index gained 28.70%, the broad-based Russell 3000 Index rose 25.66%, and the tech-heavy Nasdaq Composite Index returned 21.39%. Internationally, the MSCI ACWI Ex-US Index, a gauge of stock performance in developed and emerging markets outside the US, returned 7.82%. By comparison, fixed income securities, as measured by the Bloomberg US Aggregate Bond Index, declined 1.54%. (Performance is based on net returns in US dollars unless stated otherwise and assumes reinvestment of dividends.)
The economy rebounded, inflation spiked
The pace of economic growth in the US picked up sharply during the first half of 2021, spurred by aggressive fiscal stimulus. Real gross domestic product (GDP) growth surged to 6.7% (at an annual rate) in the second quarter, slipped to 2.3% in the third quarter, and spiked again to 6.9% in the fourth quarter. S&P 500 Index company profits rose significantly during the year. In December, the national unemployment rate dropped to 3.9% and the Consumer Price Index, a measure of inflation, spiked 7% from its level 12 months earlier, triggered in part by product shortages, supply-chain disruptions, labor scarcity, strong consumer demand, and a steep jump in energy prices.
West Texas Intermediate crude oil prices rose from just below $48 a barrel at the start of 2021 to just above $75 a barrel by year-end on expectations that the loosening of pandemic restrictions would boost travel, fueling demand for oil. The US Dollar Index rose 6.71% against a basket of developed market currencies over the year. Despite the pickup in the economy, the Federal Reserve (the Fed) kept its federal funds rate target near zero throughout the year.
US stocks rose despite headwinds
During the first quarter of 2021, US stock prices posted steep gains in anticipation that economic stimulus, which included a $1.9 trillion COVID-19 fiscal relief package in March, and rollouts of COVID-19 vaccines would drive growth. Oil prices rose sharply, the energy sector rallied, and GDP accelerated. The stock market continued its ascent through the second and most of the third quarter but suffered a pullback in September as concerns about inflation mounted.
In November, US inflation rose at its fastest pace in nearly 40 years. To help contain it, the Fed began tapering its monthly purchase of bonds. In December, the Fed signaled it would wind down that stimulus program sooner than previously planned and raise interest rates in 2022. Despite these concerns and worries about the Omicron variant of COVID-19, stocks advanced over the final quarter as investors turned their attention to robust corporate earnings and other positive economic data.
S&P 500 Index: leaders and laggards
In 2021, the top-performing sector in the S&P 500 Index was energy, rising 54.64% on a rebound in oil prices. Next in line were real estate (+46.19%), financials (+35.04%), information technology (+34.53%), materials (+27.28%), health care (+26.13%), consumer discretionary (+24.43%), communication services (+21.57%), and industrials (+21.12%). The “defensive” consumer staples and utilities sectors rose 18.63% and 17.67%, respectively.
Growth performed in line with value, large-cap stocks topped small-cap stocks
Over the year, the Russell 3000 Growth Index returned 25.85%, slightly edging out the Russell 3000 Value Index, which rose 25.37%. The large-cap Russell 1000 Index returned 26.45%, the Russell Midcap Index gained 22.58%, and the small-cap Russell 2000 Index trailed with a return of 14.82%.
International developed market stocks also advanced
Developed equity markets outside the US and Canada, as measured by the MSCI EAFE Index, rose 11.26% during the year. The MSCI UK Index returned 18.50%, and the MSCI Europe Index returned 16.30%, buoyed by government stimulus. The MSCI Japan Index returned 1.71%. Japanese stocks were pressured by supply-chain and COVID-19-related challenges.
Emerging market stocks fell
The MSCI Emerging Markets Index declined 2.54% in 2021. Investor concerns about a slowdown in China’s economy, a plunge in Chinese technology stock prices in response to a government regulatory crackdown, and worries about a stronger US dollar triggered the sell-off. The MSCI China Index dropped 21.72% while the Latin America component of the MSCI Emerging Markets Index fell 8.09% over the year.
| | | | |
Market Overview — unaudited (continued) | | Annual Report | | December 31, 2021 |
Fixed Income Market Overview
Government bond markets dropped modestly in 2021 as investors grew increasingly concerned about rising inflation and the prospect of interest rate hikes. Treasury Inflation-Protected Securities (TIPS) and high yield corporate bonds, however, delivered positive returns.
The global investment-grade bond market, as measured by the Bloomberg Global Aggregate Bond (USD Hedged) Index, fell 1.40% for the year, slightly outperforming the 1.54% decline of the US investment-grade bond market, as measured by the Bloomberg US Aggregate Bond Index. TIPS, issued by the US government and indexed to inflation, rose 5.96%. High yield bonds (i.e., debt rated below investment grade) outperformed their investment-grade counterparts with a gain of 5.28%, as measured by the ICE BofA US High Yield Index. Emerging market debt, based on the J.P. Morgan EMBI Global Diversified Index, dropped 1.80%. (All returns cited are in US dollars unless stated otherwise.)
Aggressive stimulus spurred growth, higher inflation
With unemployment falling and corporate profits rising, the US economy continued to rebound in 2021, despite higher inflation, surging energy prices, and the ongoing COVID-19 pandemic. West Texas Intermediate crude oil prices rose from just below $48 a barrel at the start of the year to just above $75 a barrel by year-end on expectations that the loosening of pandemic restrictions would boost travel, fueling demand for oil. The US Dollar Index rose 6.71% against a basket of developed market currencies over the year.
Bond markets wobbled on fears of inflation, rate hikes
Early in 2021, expectations of aggressive US fiscal stimulus, including a $1.9 trillion COVID-19 fiscal relief package in March, and rollouts of COVID-19 vaccines raised fears that the economy could heat up and lead to higher inflation and interest rate hikes.
These concerns triggered a steep pullback in investment-grade bond prices while their yields, which move in the opposite direction to prices, rose. In the first quarter of 2021, US Treasuries suffered their second-worst quarterly performance in more than 40 years. Investors’ concerns also rippled through many international bond markets. Although US investment-grade bond returns fell over the first quarter, high yield corporate bonds posted positive total returns.
Real gross domestic product growth surged to 6.7% (at an annual rate) in the second quarter of 2021, slipped to 2.3% in the third quarter, and spiked again to 6.9% in the fourth quarter. Yields on long-term US Treasuries dropped modestly during the second quarter but rose notably late in the third quarter as concerns about inflation escalated.
In December, the national unemployment rate dropped to 3.9% and the Consumer Price Index, a measure of inflation, jumped 7% above its level 12 months earlier. The increase was triggered in part by product shortages, supply-chain disruptions, labor scarcity, strong consumer demand, and a steep leapin energy prices. In response, the Federal Reserve signaled it would wind down its monthly purchase of bonds, a program that began at the start of the pandemic to stimulate the economy, sooner than previously planned and raise interest rates in 2022. The inflation fears bolstered demand for TIPS, which returned 2.36% over the fourth quarter, surpassing other fixed income assets.
The yield on the 10-year US Treasury note closed 2021 at 1.51%, up from 0.92% at the beginning of the year. For the year, US Treasuries fell 2.32%, investment-grade US credits declined 1.04%, mortgage-backed (agency) securities dropped 1.04%, and the Bloomberg Municipal Bond Index rose 1.52%. (Returns of US investment-grade bonds are based on Bloomberg bond indexes unless stated otherwise.)
High yield bonds outperformed
US high yield bonds, with the 5.28% gain for 2021 noted above, benefited from the rebound in the US economy, stronger-than-expected corporate earnings, fiscal stimulus, and investors’ search for enhanced yields in the low-interest-rate environment. Fundamentals of corporate bond issuers improved as the economy recovered. High yield bond prices are less susceptible to rising interest rates than US Treasuries and other higher-rated debt, although they are more sensitive to the economic outlook and earnings of companies that issue them. The annual interest rate paid on a high yield bond is typically higher than the rate on an investment-grade bond because high yield bonds are riskier.
Emerging market bonds lagged
As mentioned above, emerging market bonds fell 1.80% in 2021. China’s high yield corporate debt market was a particularly poor performer. Turkey and Brazil also lagged as they both contended with inflation and political turmoil.
| | |
The Prudential MEDLEY Program — VCA-10 | | December 31, 2021 |
Report of the Investment Manager - As of December 31, 2021 (Unaudited)
| | | | | | | | | | |
| | | Average Annual Total Returns | | 1 Year | | 5 Years | | 10 Years | | $10,000 INVESTED OVER 10 YEARS 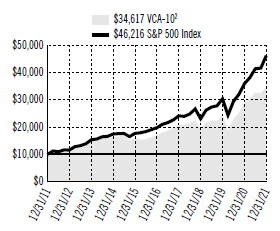
|
| | | VCA-101—Standard Contract | | 20.78% | | 15.26% | | 13.22% |
| | | VCA-101—0.50% Contract | | 21.38 | | 15.83 | | 13.78 |
| | | VCA-101—0.45% Contract | | 21.44 | | 15.89 | | 13.84 |
| | | S&P 500 Index | | 28.70 | | 18.47 | | 16.54 |
| | | Past performance does not guarantee future returns. The Account performance is net of fund expenses. The investment return and principal value of an investment will fluctuate, so that shares, when redeemed, may be worth more or less than their original cost. Current performance may be lower or higher than the past performance. |
For the year ended December 31, 2021, the value of the Standard Contract for the Prudential Variable Contract Account 10 (“VCA-10” or the “Account”) returned 20.78%, the value of a contract with annual expenses of 0.50% returned 21.38%, and the value of a contract with annual expenses of 0.45% returned 21.44%. The Account underperformed the S&P 500 Index.
What were the market conditions during the reporting period?
The US economy expanded during calendar-year 2021 (the reporting period), as policymakers continued to support growth with extraordinary monetary and fiscal stimulus programs aimed at combating the effects of the COVID-19 pandemic. The final three months of the period were marked by the emergence of the COVID-19 Omicron variant and heightened concerns over inflation, which led the Federal Reserve to announce an accelerated tapering plan to reduce its monthly asset purchases. Against this backdrop, equity markets rose to all-time highs to close out the period.
Corporate earnings remained strong during the period, benefiting from a robust economic recovery from pandemic lows. The effects of monetary and fiscal stimulus were visible in the record levels of household and corporate cash, which bolstered demand, and strength in corporate capital expenditures. While supply chains remained tight during the period, the worst of the port and logistics congestion showed signs of easing as the period ended. Holiday shopping took place earlier than normal, but overall supply appeared to keep pace with the seasonal step-up in demand.
Employment continued to rebound during the period, with minimum wage increases, bonus payments, and benefit enhancements instituted across a broad spectrum of industries to retain talent and encourage workers to return to the labor force. Consumer confidence remained strong during the period, although it declined following the emergence of the COVID-19 Delta and Omicron variants.
The S&P 500 Index (the Index) gained 28.70% during the period. All Index sectors posted positive results. The energy, real estate, and financials sectors posted the strongest absolute returns, while the consumer staples and utilities sectors posted the weakest returns.
What strategies or holdings affected the Portfolio’s performance?*
All Portfolio sectors contributed positively to absolute return over the period, with positions in the financials and information technology sectors contributing the most and positions in the real estate and utilities sectors contributing the least.
1 The Account performance results is net of all contract charges but not including the effect of any sales charges. The standard VCA-10 contract has total annual expenses (as a percentage of net assets) of 1.00%. Certain VCA-10 contracts include reduced administrative fees and have total annual expenses of either 0.50% or 0.45%. Performance of the VCA-10 contracts with reduced expenses will be higher than the performance of the standard VCA-10 contract. All total returns are for the periods indicated and are calculated based on changes in unit values.
2 The graph is based on the performance of the Standard Contract. Performance of the 0.50% Contract and the 0.45% Contract will be higher due to a lower fee structure.
For a complete list of holdings, refer to the Statement of Net Assets section of this report. Holdings reflect only long-term investments.
| | |
The Prudential MEDLEY Program — VCA-10 | | December 31, 2021 |
Report of the Investment Manager - As of December 31, 2021 (Unaudited) (Continued)
Relative to the Index, stock selection within the information technology, communication services, consumer discretionary, and materials sectors all detracted the most from relative return. An underweight allocation to the information technology sector—specifically among systems software—also meaningfully detracted. In contrast, stock selection in the health care and financials sectors added to relative performance, most notably the Portfolio’s positions within the asset management and custody banks, pharmaceuticals, and biotechnology sectors. Underweight positions within the integrated communication services sector also meaningfully contributed to relative results.
The most notable stocks to contribute to the Portfolio’s overall performance during the period included Alphabet Inc., NVIDIA Corp., Microsoft Corp., Johnson Controls, and Eli Lilly and Co. Top detractors for the period included RingCentral Inc., Uber Technologies Inc., Sea Ltd., Peloton Interactive Inc., and Farfetch Ltd. The Account no longer held a position in RingCentral Inc., Peloton Interactive Inc., and Farfetch Ltd. at the end of the reporting period.
*This strategy and performance overview, which discusses what strategies or holdings (including derivatives, if applicable) affected the Portfolio’s performance, is compiled based on how the Portfolio performed relative to the Portfolio’s assigned index and is viewed for performance attribution purposes at the aggregate Portfolio level, which in most instances will not directly correlate to the amounts disclosed in the Statement of Operations which conform to U.S. generally accepted accounting principles.
Presentation of Portfolio Holdings — unaudited
| | | | | | |
| VCA-10 (As of 12/31/2021) | |
| Ten Largest Holdings | | Line of Business | | | % of Net Assets | |
| Microsoft Corp. | | Software | | | 3.6% | |
| Alphabet, Inc. (Class A Stock) | | Interactive Media & Services | | | 3.0% | |
| Eli Lilly & Co | | Pharmaceuticals | | | 3.0% | |
| Tesla, Inc | | Automobiles | | | 2.4% | |
| JPMorgan Chase & Co | | Banks | | | 2.4% | |
| Amazon.com, Inc | | Internet & Direct Marketing Retail | | | 2.2% | |
| Goldman Sachs Group, Inc. (The) | | Capital Markets | | | 1.9% | |
| Chevron Corp. | | Oil, Gas & Consumable Fuels | | | 1.9% | |
| Bank of America Corp. | | Banks | | | 1.9% | |
| ConocoPhillips | | Oil, Gas & Consumable Fuels | | | 1.8% | |
For a complete listing of holdings, refer to the Statement of Net Assets section of this report. Holdings reflect only long-term investments.
FINANCIAL STATEMENTS OF
VCA-10
December 31, 2021
| | | | | | | | |
| LONG-TERM INVESTMENTS — 98.2% | | | | |
| COMMON STOCKS | | Shares | | |
Value | |
Aerospace & Defense — 1.9% | | | | | | | | |
Airbus SE (France)* | | | 12,246 | | | $ | 1,565,012 | |
Raytheon Technologies Corp. | | | 25,441 | | | | 2,189,452 | |
| | | | | | | | |
| | | | | | | 3,754,464 | |
| | | | | | | | |
Air Freight & Logistics — 0.5% | | | | | | | | |
FedEx Corp. | | | 3,909 | | | | 1,011,024 | |
| | | | | | | | |
Airlines — 0.7% | | | | | | | | |
Delta Air Lines, Inc.* | | | 36,622 | | | | 1,431,188 | |
| | | | | | | | |
Automobiles — 3.9% | | | | | | | | |
General Motors Co.* | | | 47,511 | | | | 2,785,570 | |
Tesla, Inc.* | | | 4,390 | | | | 4,639,264 | |
| | | | | | | | |
| | | | | | | 7,424,834 | |
| | | | | | | | |
Banks — 8.3% | | | | | | | | |
Bank of America Corp. | | | 81,041 | | | | 3,605,514 | |
Citigroup, Inc. | | | 31,927 | | | | 1,928,071 | |
JPMorgan Chase & Co. | | | 28,619 | | | | 4,531,819 | |
PNC Financial Services Group, Inc. (The) | | | 14,798 | | | | 2,967,295 | |
Truist Financial Corp. | | | 49,396 | | | | 2,892,136 | |
| | | | | | | | |
| | | | | | | 15,924,835 | |
| | | | | | | | |
Beverages — 1.1% | | | | | | | | |
PepsiCo, Inc. | | | 11,827 | | | | 2,054,468 | |
| | | | | | | | |
Biotechnology — 1.1% | | | | | | | | |
AbbVie, Inc. | | | 15,544 | | | | 2,104,658 | |
| | | | | | | | |
Building Products — 1.6% | | | | | | | | |
Johnson Controls International PLC | | | 36,909 | | | | 3,001,071 | |
| | | | | | | | |
Capital Markets — 3.0% | | | | | | | | |
Blackstone, Inc. | | | 15,655 | | | | 2,025,600 | |
Goldman Sachs Group, Inc. (The) | | | 9,539 | | | | 3,649,145 | |
| | | | | | | | |
| | | | | | | 5,674,745 | |
| | | | | | | | |
Chemicals — 2.6% | | | | | | | | |
Dow, Inc. | | | 29,909 | | | | 1,696,438 | |
Linde PLC (United Kingdom) | | | 9,306 | | | | 3,223,878 | |
| | | | | | | | |
| | | | | | | 4,920,316 | |
| | | | | | | | |
Communications Equipment — 1.0% | | | | | | | | |
Cisco Systems, Inc. | | | 31,218 | | | | 1,978,285 | |
| | | | | | | | |
Consumer Finance — 1.8% | | | | | | | | |
Capital One Financial Corp. | | | 13,216 | | | | 1,917,509 | |
SLM Corp. | | | 82,753 | | | | 1,627,752 | |
| | | | | | | | |
| | | | | | | 3,545,261 | |
| | | | | | | | |
Containers & Packaging — 1.1% | | | | | | | | |
Crown Holdings, Inc. | | | 18,363 | | | | 2,031,315 | |
| | | | | | | | |
Entertainment — 2.9% | | | | | | | | |
Netflix, Inc.* | | | 3,008 | | | | 1,812,139 | |
ROBLOX Corp. (Class A Stock)* | | | 8,404 | | | | 866,957 | |
Sea Ltd. (Singapore), ADR* | | | 4,867 | | | | 1,088,797 | |
Walt Disney Co. (The)* | | | 11,386 | | | | 1,763,577 | |
| | | | | | | | |
| | | | | | | 5,531,470 | |
| | | | | | | | |
| | | | | | | | |
COMMON STOCKS (continued) | | Shares | | | Value | |
Equity Real Estate Investment Trusts (REITs) — 2.0% | |
Alexandria Real Estate Equities, Inc. | | | 6,560 | | | $ | 1,462,617 | |
American Campus Communities, Inc. | | | 19,775 | | | | 1,132,910 | |
American Tower Corp. | | | 4,194 | | | | 1,226,745 | |
| | | | | | | | |
| | | | | | | 3,822,272 | |
| | | | | | | | |
Food & Staples Retailing — 1.3% | | | | | | | | |
Walmart, Inc. | | | 17,896 | | | | 2,589,372 | |
| | | | | | | | |
Food Products — 1.1% | | | | | | | | |
Mondelez International, Inc. (Class A Stock) | | | 31,299 | | | | 2,075,437 | |
| | | | | | | | |
Health Care Equipment & Supplies — 2.6% | |
Abbott Laboratories | | | 24,792 | | | | 3,489,226 | |
Align Technology, Inc.* | | | 2,337 | | | | 1,535,830 | |
| | | | | | | | |
| | | | | | | 5,025,056 | |
| | | | | | | | |
Health Care Providers & Services — 1.9% | |
Cigna Corp. | | | 6,808 | | | | 1,563,321 | |
Laboratory Corp. of America Holdings* | | | 6,823 | | | | 2,143,855 | |
| | | | | | | | |
| | | | | | | 3,707,176 | |
| | | | | | | | |
Hotels, Restaurants & Leisure — 2.6% | | | | | | | | |
Airbnb, Inc. (Class A Stock)* | | | 11,110 | | | | 1,849,704 | |
McDonald’s Corp. | | | 6,489 | | | | 1,739,506 | |
Royal Caribbean Cruises Ltd.* | | | 18,407 | | | | 1,415,498 | |
| | | | | | | | |
| | | | | | | 5,004,708 | |
| | | | | | | | |
Household Durables — 0.8% | | | | | | | | |
DR Horton, Inc. | | | 13,845 | | | | 1,501,490 | |
| | | | | | | | |
Household Products — 0.8% | | | | | | | | |
Procter & Gamble Co. (The) | | | 9,001 | | | | 1,472,384 | |
| | | | | | | | |
Insurance — 4.4% | | | | | | | | |
Chubb Ltd. (Switzerland) | | | 16,238 | | | | 3,138,968 | |
Marsh & McLennan Cos., Inc. | | | 8,937 | | | | 1,553,429 | |
MetLife, Inc. | | | 33,563 | | | | 2,097,352 | |
RenaissanceRe Holdings Ltd. (Bermuda) | | | 9,960 | | | | 1,686,527 | |
| | | | | | | | |
| | | | | | | 8,476,276 | |
| | | | | | | | |
Interactive Media & Services — 5.7% | | | | | | | | |
Alphabet, Inc. (Class A Stock)* | | | 1,990 | | | | 5,765,109 | |
Alphabet, Inc. (Class C Stock)* | | | 630 | | | | 1,822,962 | |
Match Group, Inc.* | | | 8,931 | | | | 1,181,125 | |
Snap, Inc.* | | | 22,380 | | | | 1,052,531 | |
ZoomInfo Technologies, Inc.* | | | 16,228 | | | | 1,041,838 | |
| | | | | | | | |
| | | | | | | 10,863,565 | |
| | | | | | | | |
Internet & Direct Marketing Retail — 3.0% | | | | | |
Amazon.com, Inc.* | | | 1,274 | | | | 4,247,949 | |
MercadoLibre, Inc. (Argentina)* | | | 1,061 | | | | 1,430,652 | |
| | | | | | | | |
| | | | | | | 5,678,601 | |
| | | | | | | | |
IT Services — 3.8% | | | | | | | | |
Adyen NV (Netherlands), 144A* | | | 599 | | | | 1,570,581 | |
Block, Inc.* | | | 6,128 | | | | 989,733 | |
SEE NOTES TO FINANCIAL STATEMENTS.
FINANCIAL STATEMENTS OF VCA-10
December 31, 2021
| | | | | | | | |
COMMON STOCKS (continued) | | Shares | | | Value | |
IT Services (continued) | | | | | | | | |
Mastercard, Inc. (Class A Stock) | | | 1,894 | | | $ | 680,552 | |
Shopify, Inc. (Canada) (Class A Stock)* | | | 2,295 | | | | 3,161,110 | |
Snowflake, Inc. (Class A Stock)* | | | 2,470 | | | | 836,713 | |
| | | | | | | | |
| | | | | | | 7,238,689 | |
| | | | | | | | |
Machinery — 2.5% | | | | | | | | |
Deere & Co. | | | 4,413 | | | | 1,513,174 | |
Fortive Corp. | | | 18,091 | | | | 1,380,162 | |
Otis Worldwide Corp. | | | 21,411 | | | | 1,864,256 | |
| | | | | | | | |
| | | | | | | 4,757,592 | |
| | | | | | | | |
Multi-Utilities — 2.4% | | | | | | | | |
Ameren Corp. | | | 18,959 | | | | 1,687,541 | |
Dominion Energy, Inc. | | | 36,813 | | | | 2,892,029 | |
| | | | | | | | |
| | | | | | | 4,579,570 | |
| | | | | | | | |
Oil, Gas & Consumable Fuels — 5.0% | | | | | | | | |
Chevron Corp. | | | 30,983 | | | | 3,635,855 | |
ConocoPhillips | | | 48,652 | | | | 3,511,701 | |
Hess Corp. | | | 10,279 | | | | 760,954 | |
Williams Cos., Inc. (The) | | | 64,042 | | | | 1,667,654 | |
| | | | | | | | |
| | | | | | | 9,576,164 | |
| | | | | | | | |
Personal Products — 1.1% | | | | | | | | |
Estee Lauder Cos., Inc. (The) (Class A Stock) | | | 5,504 | | | | 2,037,581 | |
| | | | | | | | |
Pharmaceuticals — 5.0% | | | | | | | | |
AstraZeneca PLC (United Kingdom), ADR | | | 36,616 | | | | 2,132,882 | |
Bristol-Myers Squibb Co. | | | 29,685 | | | | 1,850,860 | |
Eli Lilly & Co. | | | 20,373 | | | | 5,627,430 | |
| | | | | | | | |
| | | | | | | 9,611,172 | |
| | | | | | | | |
Road & Rail — 1.5% | | | | | | | | |
Uber Technologies, Inc.* | | | 13,779 | | | | 577,754 | |
Union Pacific Corp. | | | 9,081 | | | | 2,287,776 | |
| | | | | | | | |
| | | | | | | 2,865,530 | |
| | | | | | | | |
Semiconductors & Semiconductor Equipment — 6.4% | |
Broadcom, Inc. | | | 4,744 | | | | 3,156,705 | |
Lam Research Corp. | | | 2,440 | | | | 1,754,726 | |
NVIDIA Corp. | | | 10,815 | | | | 3,180,800 | |
NXP Semiconductors NV (Netherlands) | | | 8,061 | | | | 1,836,134 | |
QUALCOMM, Inc. | | | 13,295 | | | | 2,431,257 | |
| | | | | | | | |
| | | | | | | 12,359,622 | |
| | | | | | | | |
Software — 6.2% | | | | | | | | |
Adobe, Inc.* | | | 2,410 | | | | 1,366,615 | |
Atlassian Corp. PLC (Australia) (Class A Stock)* | | | 2,865 | | | | 1,092,396 | |
HashiCorp, Inc. (Class A Stock)* | | | 3,876 | | | | 352,871 | |
HubSpot, Inc.* | | | 1,410 | | | | 929,401 | |
Microsoft Corp. | | | 20,596 | | | | 6,926,847 | |
salesforce.com, Inc.* | | | 5,165 | | | | 1,312,581 | |
| | | | | | | | |
| | | | | | | 11,980,711 | |
| | | | | | | | |
| | | | | | | | |
COMMON STOCKS (continued) | | Shares | | | Value | |
Specialty Retail — 2.0% | | | | | | | | |
Lowe’s Cos., Inc. | | | 8,594 | | | $ | 2,221,377 | |
Ross Stores, Inc. | | | 14,462 | | | | 1,652,717 | |
| | | | | | | | |
| | | | | | | 3,874,094 | |
| | | | | | | | |
Technology Hardware, Storage & Peripherals — 1.3% | |
Apple, Inc. | | | 13,946 | | | | 2,476,391 | |
| | | | | | | | |
Textiles, Apparel & Luxury Goods — 2.6% | |
Lululemon Athletica, Inc. (Canada)* | | | 3,007 | | | | 1,177,090 | |
LVMH Moet Hennessy Louis Vuitton SE (France) | | | 2,883 | | | | 2,379,888 | |
NIKE, Inc. (Class B Stock) | | | 9,128 | | | | 1,521,364 | |
| | | | | | | | |
| | | | | | | 5,078,342 | |
| | | | | | | | |
Trading Companies & Distributors — 0.7% | |
United Rentals, Inc.* | | | 3,797 | | | | 1,261,705 | |
| | | | | | | | |
TOTAL COMMON STOCKS | | | | | | | | |
(cost $111,090,764) | | | | | | | 188,301,434 | |
| | | | | | | | |
| |
SHORT-TERM INVESTMENT — 1.8% | | | | | |
AFFILIATED MUTUAL FUND | | | | | | | | |
PGIM Core Ultra Short Bond Fund
(cost $3,372,443)(a) | | | 3,372,443 | | | | 3,372,443 | |
| | | | | | | | |
TOTAL INVESTMENTS — 100.0% | | | | | |
(cost $114,463,207) | | | | 191,673,877 | |
| | | | | | | | |
OTHER ASSETS IN EXCESS OF LIABILITIES — 0.0% | |
Dividends and Interests Receivable | | | | 96,163 | |
Tax Reclaim Receivable | | | | 8,806 | |
Payable for Pending Capital Transactions | | | | 400,305 | |
Payable for Securities Purchased | | | | (428,194 | ) |
| | | | | | | | |
OTHER ASSETS IN EXCESS OF LIABILITIES | | | | 77,080 | |
| | | | | | | | |
NET ASSETS — 100.0% | | | $ | 191,750,957 | |
| | | | | | | | |
NET ASSETS, representing: | | | | | |
Equity of Participants | | | $ | 191,751,044 | |
Equity of The Prudential Insurance Company of America | | | | (87 | ) |
| | | | | | | | |
| | | $ | 191,750,957 | |
| | | | | | | | |
The following abbreviations are used in the annual report:
| | |
| 144A | | Security exempt from registration under Rule 144A of the Securities Act of 1933. These securities may be resold in transactions exempt from registration, typically only to qualified institutional buyers. |
| ADR | | American Depositary Receipt |
| * | Non-income producing security. |
| (a) | PGIM Investments LLC, the manager of the Account, also serves as manager of the PGIM Core Ultra Short Bond Fund. |
SEE NOTES TO FINANCIAL STATEMENTS.
FINANCIAL STATEMENTS OF VCA-10
December 31, 2021
Fair Value Measurements:
Various inputs are used in determining the value of the Account’s investments. These inputs are summarized in the three broad levels listed below.
| Level 1— | unadjusted quoted prices generally in active markets for identical securities. |
| Level 2— | quoted prices for similar securities, interest rates and yield curves, prepayment speeds, foreign currency exchange rates, and other observable inputs. |
| Level 3— | unobservable inputs for securities valued in accordance with the Account’s Committee approved fair valuation procedures. |
The following is a summary of the inputs used as of December 31, 2021 in valuing such portfolio securities:
| | | | | | | | | | | | |
| | | Level 1 | | | Level 2 | | | Level 3 | |
Investments In Securities | | | | | | | | | | | | |
Assets | | | | | | | | | | | | |
Long-Term Investments | | | | | | | | | | | | |
Common Stocks | | | | | | | | | | | | |
Aerospace & Defense | | $ | 2,189,452 | | | $ | 1,565,012 | | | $ | — | |
Air Freight & Logistics | | | 1,011,024 | | | | — | | | | — | |
Airlines | | | 1,431,188 | | | | — | | | | — | |
Automobiles | | | 7,424,834 | | | | — | | | | — | |
Banks | | | 15,924,835 | | | | — | | | | — | |
Beverages | | | 2,054,468 | | | | — | | | | — | |
Biotechnology | | | 2,104,658 | | | | — | | | | — | |
Building Products | | | 3,001,071 | | | | — | | | | — | |
Capital Markets | | | 5,674,745 | | | | — | | | | — | |
Chemicals | | | 4,920,316 | | | | — | | | | — | |
Communications Equipment | | | 1,978,285 | | | | — | | | | — | |
Consumer Finance | | | 3,545,261 | | | | — | | | | — | |
Containers & Packaging | | | 2,031,315 | | | | — | | | | — | |
Entertainment | | | 5,531,470 | | | | — | | | | — | |
Equity Real Estate Investment Trusts (REITs) | | | 3,822,272 | | | | — | | | | — | |
Food & Staples Retailing | | | 2,589,372 | | | | — | | | | — | |
Food Products | | | 2,075,437 | | | | — | | | | — | |
Health Care Equipment & Supplies | | | 5,025,056 | | | | — | | | | — | |
Health Care Providers & Services | | | 3,707,176 | | | | — | | | | — | |
Hotels, Restaurants & Leisure | | | 5,004,708 | | | | — | | | | — | |
Household Durables | | | 1,501,490 | | | | — | | | | — | |
Household Products | | | 1,472,384 | | | | — | | | | — | |
Insurance | | | 8,476,276 | | | | — | | | | — | |
Interactive Media & Services | | | 10,863,565 | | | | — | | | | — | |
Internet & Direct Marketing Retail | | | 5,678,601 | | | | — | | | | — | |
IT Services | | | 5,668,108 | | | | 1,570,581 | | | | — | |
Machinery | | | 4,757,592 | | | | — | | | | — | |
Multi-Utilities | | | 4,579,570 | | | | — | | | | — | |
Oil, Gas & Consumable Fuels | | | 9,576,164 | | | | — | | | | — | |
Personal Products | | | 2,037,581 | | | | — | | | | — | |
Pharmaceuticals | | | 9,611,172 | | | | — | | | | — | |
Road & Rail | | | 2,865,530 | | | | — | | | | — | |
Semiconductors & Semiconductor Equipment | | | 12,359,622 | | | | — | | | | — | |
Software | | | 11,980,711 | | | | — | | | | — | |
Specialty Retail | | | 3,874,094 | | | | — | | | | — | |
Technology Hardware, Storage & Peripherals | | | 2,476,391 | | | | — | | | | — | |
Textiles, Apparel & Luxury Goods | | | 2,698,454 | | | | 2,379,888 | | | | — | |
Trading Companies & Distributors | | | 1,261,705 | | | | — | | | | — | |
Short-Term Investment | | | | | | | | | | | | |
Affiliated Mutual Fund | | | 3,372,443 | | | | — | | | | — | |
| | | | | | | | | | | | |
Total | | $ | 186,158,396 | | | $ | 5,515,481 | | | $ | — | |
| | | | | | | | | | | | |
SEE NOTES TO FINANCIAL STATEMENTS.
FINANCIAL STATEMENTS OF VCA-10
December 31, 2021
Industry Classification:
The industry classification of investments and other assets in excess of liabilities shown as a percentage of net assets as of December 31, 2021 were as follows (unaudited):
| | | | |
Banks | | | 8.3 | % |
Semiconductors & Semiconductor Equipment | | | 6.4 | |
Software | | | 6.2 | |
Interactive Media & Services | | | 5.7 | |
Pharmaceuticals | | | 5.0 | |
Oil, Gas & Consumable Fuels | | | 5.0 | |
Insurance | | | 4.4 | |
Automobiles | | | 3.9 | |
IT Services | | | 3.8 | |
Internet & Direct Marketing Retail | | | 3.0 | |
Capital Markets | | | 3.0 | |
Entertainment | | | 2.9 | |
Textiles, Apparel & Luxury Goods | | | 2.6 | |
Health Care Equipment & Supplies | | | 2.6 | |
Hotels, Restaurants & Leisure | | | 2.6 | |
Chemicals | | | 2.6 | |
Machinery | | | 2.5 | |
Multi-Utilities | | | 2.4 | |
Specialty Retail | | | 2.0 | |
Equity Real Estate Investment Trusts (REITs) | | | 2.0 | |
Aerospace & Defense | | | 1.9 | |
Health Care Providers & Services | | | 1.9 | |
Consumer Finance | | | 1.8 | |
| | | | |
Affiliated Mutual Fund | | | 1.8 | % |
Building Products | | | 1.6 | |
Road & Rail | | | 1.5 | |
Food & Staples Retailing | | | 1.3 | |
Technology Hardware, Storage & Peripherals | | | 1.3 | |
Biotechnology | | | 1.1 | |
Food Products | | | 1.1 | |
Beverages | | | 1.1 | |
Personal Products | | | 1.1 | |
Containers & Packaging | | | 1.1 | |
Communications Equipment | | | 1.0 | |
Household Durables | | | 0.8 | |
Household Products | | | 0.8 | |
Airlines | | | 0.7 | |
Trading Companies & Distributors | | | 0.7 | |
Air Freight & Logistics | | | 0.5 | |
| | | | |
| | | 100.0 | |
Other assets in excess of liabilities | | | 0.0 | * |
| | | | |
| | | 100.0 | % |
| | | | |
SEE NOTES TO FINANCIAL STATEMENTS.
FINANCIAL STATEMENTS OF VCA-10
Year Ended December 31, 2021
| | | | |
| | | | |
INVESTMENT INCOME | | | | |
Unaffiliated Dividend Income (net of $4,829 foreign withholding tax) | | $ | 2,595,457 | |
Affiliated Dividend Income | | | 3,166 | |
Total Income | | | 2,598,623 | |
EXPENSES | | | | |
Fees Charged to Participants for Investment Management Services | | | (467,043 | ) |
Fees Charged to Participants for Administrative Expenses: | | | | |
Standard Contract | | | (1,247,994 | ) |
0.50% Contract | | | (13,597 | ) |
0.45% Contract | | | (23,957 | ) |
Total Expenses | | | (1,752,591 | ) |
NET INVESTMENT INCOME | | | 846,032 | |
REALIZED AND UNREALIZED GAIN (LOSS) ON INVESTMENT AND FOREIGN CURRENCY TRANSACTIONS | | | | |
Net Realized Gain (Loss) on: | | | | |
Investment Transactions | | | 19,971,880 | |
Foreign Currency Transactions | | | (225 | ) |
| | | | 19,971,655 | |
Net Change in Unrealized Appreciation (Depreciation) on: | | | | |
Investments | | | 13,805,421 | |
Foreign Currencies | | | (126 | ) |
| | | | 13,805,295 | |
NET GAIN ON INVESTMENT AND FOREIGN CURRENCY TRANSACTIONS | | | 33,776,950 | |
NET INCREASE IN NET ASSETS RESULTING FROM OPERATIONS | | $ | 34,622,982 | |
| | | | | | |
| | |
| | STATEMENT OF CHANGES IN NET ASSETS | | |
| | | | | | | | |
| | | Year Ended
December 31, 2021 | | | Year Ended
December 31, 2020 | |
OPERATIONS | | | | | | | | |
Net Investment Income | | $ | 846,032 | | | $ | 1,324,177 | |
Net Realized Gain on Investment and Foreign Currency Transactions | | | 19,971,655 | | | | 14,903,574 | |
Net Change in Unrealized Appreciation (Depreciation) on Investments and Foreign Currencies | | | 13,805,295 | | | | 9,431,336 | |
NET INCREASE IN NET ASSETS RESULTING FROM OPERATIONS | | | 34,622,982 | | | | 25,659,087 | |
CAPITAL TRANSACTIONS | | | | | | | | |
Purchase Payments and Transfers In | | | 2,651,267 | | | | 1,447,977 | |
Withdrawals and Transfers Out | | | (16,578,727 | ) | | | (15,428,383 | ) |
NET DECREASE IN NET ASSETS RESULTING FROM CAPITAL TRANSACTIONS | | | (13,927,460 | ) | | | (13,980,406 | ) |
NET INCREASE (DECREASE) IN NET ASSETS RESULTING FROM SURPLUS TRANSFERS | | | 176 | | | | (1,581 | ) |
TOTAL INCREASE IN NET ASSETS | | | 20,695,698 | | | | 11,677,100 | |
NET ASSETS | | | | | | | | |
Beginning of year | | | 171,055,259 | | | | 159,378,159 | |
End of year | | $ | 191,750,957 | | | $ | 171,055,259 | |
Accumulation Unit Values and Equity of Participants as of December 31, 2021
| | | | |
Standard Contract: | | | | |
Accumulation Unit Value and Equity of Participants, $ 173,622,402/ 5,358,830 Accumulation Units | | $ | 32.3993 | |
| | | | |
| |
0.50% Contract: | | | | |
Accumulation Unit Value and Equity of Participants, $ 5,789,428/ 157,354 Accumulation Units | | $ | 36.7924 | |
| | | | |
| |
0.45% Contract: | | | | |
Accumulation Unit Value and Equity of Participants, $ 12,339,214/ 333,554 Accumulation Units | | $ | 36.9931 | |
| | | | |
Accumulation Unit Value may not recalculate due to rounding.
SEE NOTES TO FINANCIAL STATEMENTS.
FINANCIAL HIGHLIGHTS FOR VCA-10
| | | | | | |
| | |
| | INCOME PER ACCUMULATION UNIT* | | |
(For an Accumulation Unit outstanding throughout the year)
| | | | | | | | | | | | | | | | | | | | | | | | |
| | | Year Ended December 31, 2021 | | | Year Ended December 31, 2020 | |
| | | Standard
Contract | | | 0.50%
Contract | | | 0.45%
Contract | | | Standard
Contract | | | 0.50%
Contract | | | 0.45%
Contract | |
Investment Income | | $ | 0.4237 | | | $ | 0.4795 | | | $ | 0.4820 | | | $ | 0.4113 | | | $ | 0.4630 | | | $ | 0.4651 | |
Expenses | | | | | | | | | | | | | | | | | | | | | | | | |
Investment management fee | | | (0.0754 | ) | | | (0.0854 | ) | | | (0.0858 | ) | | | (0.0563 | ) | | | (0.0634 | ) | | | (0.0637 | ) |
Administrative expenses | | | (0.2256 | ) | | | (0.0854 | ) | | | (0.0687 | ) | | | (0.1684 | ) | | | (0.0634 | ) | | | (0.0510 | ) |
Net Investment Income | | | 0.1227 | | | | 0.3087 | | | | 0.3275 | | | | 0.1866 | | | | 0.3362 | | | | 0.3504 | |
Net realized and unrealized gain (loss) on investment and foreign currency transactions . | | | 5.4505 | | | | 6.1710 | | | | 6.2028 | | | | 3.8615 | | | | 4.3654 | | | | 4.3873 | |
Net Increase (Decrease) in Accumulation Unit Value | | | 5.5732 | | | | 6.4797 | | | | 6.5303 | | | | 4.0481 | | | | 4.7016 | | | | 4.7377 | |
Accumulation Unit Value | | | | | | | | | | | | | | | | | | | | | | | | |
Beginning of year | | | 26.8261 | | | | 30.3127 | | | | 30.4628 | | | | 22.7780 | | | | 25.6111 | | | | 25.7251 | |
End of year | | $ | 32.3993 | | | $ | 36.7924 | | | $ | 36.9931 | | | $ | 26.8261 | | | $ | 30.3127 | | | $ | 30.4628 | |
Total Return** | | | 20.78 | % | | | 21.38 | % | | | 21.44 | % | | | 17.77 | % | | | 18.36 | % | | | 18.42 | % |
Ratio of Expenses To Average Net Assets*** | | | 1.00 | % | | | 0.50 | % | | | 0.45 | % | | | 1.00 | % | | | 0.50 | % | | | 0.45 | % |
Ratio of Net Investment Income To Average Net Assets*** | | | 0.41 | % | | | 0.91 | % | | | 0.96 | % | | | 0.83 | % | | | 1.32 | % | | | 1.37 | % |
Portfolio Turnover Rate | | | 36 | % | | | 36 | % | | | 36 | % | | | 56 | % | | | 56 | % | | | 56 | % |
Number of Accumulation Units Outstanding For
Participants at end of year (000’s omitted) | | | 5,359 | | | | 157 | | | | 334 | | | | 5,772 | | | | 165 | | | | 368 | |
| * | Calculated by accumulating the actual per unit amounts daily. |
| ** | Total return does not consider the effects of sales loads. Total return is calculated assuming a purchase of a share on the first day and a sale on the last day of each period reported. Total returns may reflect adjustments to conform to generally accepted accounting principles. Total returns for periods less than one full year are not annualized. |
| *** | These calculations exclude PICA’s equity in VCA-10. |
The above table does not reflect the annual administration charge, which does not affect the Accumulation Unit Value. This charge is made by reducing Participants’ Accumulation Accounts by a number of Accumulation Units equal in value to the charge.
SEE NOTES TO FINANCIAL STATEMENTS.
FINANCIAL HIGHLIGHTS FOR VCA-10
| | | | | | |
| | |
| | INCOME PER ACCUMULATION UNIT | | |
(For an Accumulation Unit outstanding throughout the year)
| | | | | | | | | | | | | | | | | | | | | | | | | | | | | | | | | | | | |
| | | Year Ended December 31, 2019 | | | Year Ended December 31, 2018 | | | Year Ended December 31, 2017 | |
| | | Standard Contract | | | 0.50% Contract | | | 0.45% Contract | | | Standard Contract | | | 0.50% Contract | | | 0.45% Contract | | | Standard Contract | | | 0.50% Contract | | | 0.45% Contract | |
Investment Income | | $ | 0.4116 | | | $ | 0.4617 | | | $ | 0.4633 | | | $ | 0.3666 | | | $ | 0.4087 | | | $ | 0.4102 | | | $ | 0.2909 | | | $ | 0.3229 | | | $ | 0.3239 | |
Expenses | | | | | | | | | | | | | | | | | | | | | | | | | | | | | | | | | | | | |
Investment management fee | | | (0.0516 | ) | | | (0.0579 | ) | | | (0.0581 | ) | | | (0.0500 | ) | | | (0.0558 | ) | | | (0.0560 | ) | | | (0.0440 | ) | | | (0.0489 | ) | | | (0.0491 | ) |
Administrative expenses | | | (0.1544 | ) | | | (0.0579 | ) | | | (0.0465 | ) | | | (0.1497 | ) | | | (0.0558 | ) | | | (0.0448 | ) | | | (0.1318 | ) | | | (0.0489 | ) | | | (0.0392 | ) |
Net Investment Income | | | 0.2056 | | | | 0.3459 | | | | 0.3587 | | | | 0.1669 | | | | 0.2971 | | | | 0.3094 | | | | 0.1151 | | | | 0.2251 | | | | 0.2356 | |
Net realized and unrealized gain (loss) on investment and foreign currency transactions | | | 4.6253 | | | | 5.1859 | | | | 5.2076 | | | | (1.7016 | ) | | | (1.9064 | ) | | | (1.9142 | ) | | | 3.4389 | | | | 3.8193 | | | | 3.8316 | |
Net Increase (Decrease) in Accumulation Unit Value | | | 4.8309 | | | | 5.5318 | | | | 5.5663 | | | | (1.5347 | ) | | | (1.6093 | ) | | | (1.6048 | ) | | | 3.5540 | | | | 4.0444 | | | | 4.0672 | |
Accumulation Unit Value | | | | | | | | | | | | | | | | | | | | | | | | | | | | | | | | | | | | |
Beginning of year | | | 17.9471 | | | | 20.0793 | | | | 20.1588 | | | | 19.4818 | | | | 21.6886 | | | | 21.7635 | | | | 15.9278 | | | | 17.6442 | | | | 17.6963 | |
End of year | | $ | 22.7780 | | | $ | 25.6111 | | | $ | 25.7251 | | | $ | 17.9471 | | | $ | 20.0793 | | | $ | 20.1588 | | | $ | 19.4818 | | | $ | 21.6886 | | | $ | 21.7635 | |
Total Return** | | | 26.89 | % | | | 27.52 | % | | | 27.58 | % | | | (7.88 | )% | | | (7.42 | )% | | | (7.37 | )% | | | 22.31 | % | | | 22.92 | % | | | 22.98 | % |
Ratio of Expenses To Average Net Assets*** . | | | 1.00 | % | | | 0.50 | % | | | 0.45 | % | | | 1.00 | % | | | 0.50 | % | | | 0.45 | % | | | 1.00 | % | | | 0.50 | % | | | 0.45 | % |
Ratio of Net Investment Income To Average Net Assets*** | | | 1.00 | % | | | 1.50 | % | | | 1.55 | % | | | 0.84 | % | | | 1.34 | % | | | 1.39 | % | | | 0.65 | % | | | 1.15 | % | | | 1.20 | % |
Portfolio Turnover Rate | | | 48 | % | | | 48 | % | | | 48 | % | | | 36 | % | | | 36 | % | | | 36 | % | | | 49 | % | | | 49 | % | | | 49 | % |
Number of Accumulation Units Outstanding
For Participants at end of year (000’s omitted) | | | 6,347 | | | | 179 | | | | 398 | | | | 7,081 | | | | 181 | | | | 427 | | | | 7,755 | | | | 190 | | | | 474 | |
| ** | Total return does not consider the effects of sales loads. Total return is calculated assuming a purchase of a share on the first day and a sale on the last day of each period reported. Total returns may reflect adjustments to conform to generally accepted accounting principles. Total returns for periods less than one full year are not annualized. |
| *** | These calculations exclude PICA’s equity in VCA-10. |
The above table does not reflect the annual administration charge, which does not affect the Accumulation Unit Value. This charge is made by reducing Participants’ Accumulation Accounts by a number of Accumulation Units equal in value to the charge.
SEE NOTES TO FINANCIAL STATEMENTS.
NOTES TO FINANCIAL STATEMENTS OF
VCA-10
The Prudential Variable Contract Account-10 (“VCA-10” or the “Account”) was established on March 1, 1982 by The Prudential Insurance Company of America (“PICA”) under the laws of the State of New Jersey and is registered as an open-end, diversified management investment company under the Investment Company Act of 1940 (“1940 Act”), as amended. VCA-10 has been designed for use by employers (“Contractholders”) in making retirement arrangements on behalf of their employees (“Participants”). The investment objective of the Account is long-term growth of capital.
PICA issues standard VCA-10 contracts with annual expenses of 1.00%, as a percentage of net assets, (the “Standard Contracts”), contracts with annual expenses of 0.50%, as a percentage of net assets, (the “0.50% Contracts”), and contracts with annual expenses of 0.45%, as a percentage of net assets, (the “0.45% Contracts”). The financial statements show separate Accumulation Unit Values for each type of contract.
| Note 2: | | Accounting Policies |
The Account follows investment company accounting and reporting guidance of the Financial Accounting Standards Board (“FASB”) Accounting Standard Codification (“ASC”) Topic 946 Financial Services — Investment Companies. The following accounting policies conform to U.S. generally accepted accounting principles (“GAAP”). The Account consistently follows such policies in the preparation of its financial statements.
Securities Valuation: The Account holds securities and other assets and liabilities that are fair valued at the close of each day (generally, 4:00 PM Eastern time) the New York Stock Exchange (“NYSE”) is open for trading. Fair value is the price that would be received to sell an asset or paid to transfer a liability in an orderly transaction between market participants on the measurement date. The Account’s Committee Members (the “Committee”) have adopted valuation procedures for security valuation under which fair valuation responsibilities have been delegated to PGIM Investments LLC (“PGIM Investments” or the “Manager”). Pursuant to the Committee’s delegation, the Manager has established a Valuation Committee responsible for supervising the fair valuation of portfolio securities and other assets and liabilities. The valuation procedures permit the Account to utilize independent pricing vendor services, quotations from market makers, and alternative valuation methods when market quotations are either not readily available or not deemed representative of fair value. A record of the Valuation Committee’s actions is subject to the Committee’s review, approval, and ratification at its next regularly scheduled quarterly meeting.
For the fiscal reporting year-end, securities and other assets and liabilities were fair valued at the close of the last U.S. business day. Trading in certain foreign securities may occur when the NYSE is closed (including weekends and holidays). Because such foreign securities trade in markets that are open on weekends and U.S. holidays, the values of some of the Account’s foreign investments may change on days when investors cannot purchase or redeem Account shares.
Various inputs determine how the Account’s investments are valued, all of which are categorized according to the three broad levels (Level 1, 2, or 3) detailed in the table following the Account’s Statement of Net Assets and referred to herein as the “fair value hierarchy” in accordance with FASB ASC Topic 820 — Fair Value Measurement.
Common or preferred stocks, exchange-traded funds, and derivative instruments, if applicable, that are traded on a national securities exchange are valued at the last sale price as of the close of trading on the applicable exchange where the security principally trades. Securities traded via NASDAQ are valued at the NASDAQ official closing price. To the extent these securities are valued at the last sale price or NASDAQ official closing price, they are classified as Level 1 in the fair value hierarchy. In the event that no sale or official closing price on valuation date exists, these securities are generally valued at the mean between the last reported bid and ask prices, or at the last bid price in the absence of an ask price. These securities are classified as Level 2 in the fair value hierarchy.
Foreign equities traded on foreign securities exchanges are valued using pricing vendor services that provide model prices derived using adjustment factors based on information such as local closing price, relevant general and sector indices, currency fluctuations, depositary receipts, and futures, as applicable. Securities valued using such model prices are classified as Level 2 in the fair value hierarchy. The models generate an evaluated adjustment factor for each security, which is applied to the local closing price to
adjust it for post-closing market movements up to the time the Account is valued. Utilizing that evaluated adjustment factor, the vendor provides an evaluated price for each security. If the vendor does not provide an evaluated price, securities are valued in accordance with exchange-traded common and preferred stock valuation policies discussed above.
Investments in open-end (other than exchange-traded funds) are valued at their net asset values as of the close of the NYSE on the date of valuation. These securities are classified as Level 1 in the fair value hierarchy since they may be purchased or sold at their net asset values on the date of valuation.
Securities and other assets that cannot be priced according to the methods described above are valued based on pricing methodologies approved by the Committee. In the event that unobservable inputs are used when determining such valuations, the securities will be classified as Level 3 in the fair value hierarchy. Altering one or more unobservable inputs may result in a significant change to a Level 3 security’s fair value measurement.
When determining the fair value of securities, some of the factors influencing the valuation include: the nature of any restrictions on disposition of the securities; assessment of the general liquidity of the securities; the issuer’s financial condition and the markets in which it does business; the cost of the investment; the size of the holding and the capitalization of the issuer; the prices of any recent transactions or bids/offers for such securities or any comparable securities; any available analyst media or other reports or information deemed reliable by the Manager regarding the issuer or the markets or industry in which it operates. Using fair value to price securities may result in a value that is different from a security’s most recent closing price and from the price used by other mutual funds to calculate their net asset values.
Foreign Currency Translation: The books and records of the Account are maintained in U.S. dollars. Foreign currency amounts are translated into U.S. dollars on the following basis:
(i) market value of investment securities, other assets and liabilities — at the current rates of exchange;
(ii) purchases and sales of investment securities, income and expenses — at the rates of exchange prevailing on the respective dates of such transactions.
Although the net assets of the Account are presented at the foreign exchange rates and market values at the close of the period, the Account does not generally isolate that portion of the results of operations arising as a result of changes in the foreign exchange rates from the fluctuations arising from changes in the market prices of long-term portfolio securities held at the end of the period. Similarly, the Account does not isolate the effect of changes in foreign exchange rates from the fluctuations arising from changes in the market prices of long-term portfolio securities sold during the period. Accordingly, holding period realized foreign currency gains (losses) are included in the reported net realized gains (losses) on investment transactions.
Net realized gains (losses) on foreign currency transactions represent net foreign exchange gains (losses) from holdings of foreign currencies, currency gains (losses) realized between the trade and settlement dates on securities transactions, and the difference between the amounts of interest, dividends and foreign withholding taxes recorded on the Account’s books and the U.S. dollar equivalent amounts actually received or paid. Net unrealized currency gains (losses) from valuing foreign currency denominated assets and liabilities (other than investments) at period end exchange rates are reflected as a component of net unrealized appreciation (depreciation) on foreign currencies.
Securities Transactions and Net Investment Income: Securities transactions are recorded on the trade date. Realized gains (losses) from investment and currency transactions are calculated on the specific identification method. Dividend income is recorded on the ex-date, or for certain foreign securities, when the Account becomes aware of such dividends. Interest income, including amortization of premium and accretion of discount on debt securities, as required, is recorded on the accrual basis. Expenses are recorded on the accrual basis, which may require the use of certain estimates by management that may differ from actual. Net investment income and realized and unrealized gain (losses) (other than administrative fees) are allocated to the Participants and PICA on a daily basis in proportion to their respective ownership in VCA-10.
Estimates: The preparation of financial statements requires management to make estimates and assumptions that affect the reported amounts and disclosures in the financial statements. Actual results could differ from those estimates.
Federal Income Taxes: The operations of VCA-10 are part of, and are taxed with, the operations of PICA. Under the current provisions of the Internal Revenue Code, PICA does not expect to incur federal income taxes on earnings of VCA-10 to the extent the earnings are credited under the Contracts. As a result, the Unit Value of VCA-10 has not been reduced by federal income taxes.
| Note 3: | | Investment Management Agreement and Charges |
The Account has a management agreement with PGIM Investments. Pursuant to this agreement, PGIM Investments has responsibility for all investment advisory services and supervises the subadviser’s performance of such services. PGIM Investments has entered into a subadvisory agreement with Jennison Associates LLC (“Jennison”). The subadvisory agreement provides that Jennison will furnish investment advisory services in connection with management of the Account. PGIM Investments pays for the services of Jennison.
VCA-10 is subject to fees for investment management and administration services. PICA may impose a reduced administrative fee where warranted by economies of scale and the expense characteristics of the employer, association or trust to which PICA has issued a contract.
Standard Contracts have an effective annual rate of up to 1.00% of the current value of the Participant’s account of which 0.75% is paid to PICA for administrative expenses not provided by the annual account charge (explained below), and 0.25% is paid to PGIM Investments, for investment management services. The 0.50% contracts have an effective annual rate of up to 0.50% of the current value of the Participant’s account of which 0.25% is paid to PICA for administrative expenses not provided by the annual account charge, and 0.25% is paid to PGIM Investments, for investment management services. The 0.45% contracts have an effective annual rate of up to 0.45% of the current value of the Participant’s account of which 0.20% is paid to PICA for administrative expenses not provided by the annual account charge, and 0.25% is paid to PGIM Investments, for investment management services.
An annual account charge of not more than $30 is deducted from the account of each Participant, if applicable, at the time of withdrawal of the value of all of the Participant’s account or on the last business day of each calendar year. Such amounts are reflected as withdrawals on the Statements of Changes in Net Assets.
PICA, PGIM Investments and Jennison are indirect, wholly-owned subsidiaries of Prudential Financial, Inc.
| Note 4: | | Other Transactions with Affiliates |
During the year ended December 31, 2021, the Account invested in the PGIM Core Ultra Short Bond Fund (the “Core Fund”), a portfolio of Prudential Investment Portfolios 2, registered under the 1940 Act, and managed by PGIM Investments. Through the Account’s investment in the mentioned underlying fund, PGIM Investments and/or its affiliates are paid fees or compensated for providing their services. Earnings from the Core Fund are disclosed on the Statement of Operations as “Affiliated Dividend Income”.
The Account may enter into certain securities purchase or sale transactions under Committee approved Rule 17a-7 procedures. Rule 17a-7 is an exemptive rule under the 1940 Act, that subject to certain conditions, permits purchase and sale transactions among affiliated investment companies, or between an investment company and a person that is affiliated solely by reason of having a common (or affiliated) investment adviser, common directors, and/or common officers. Such transactions are subject to ratification by the Committee. For the year ended December 31, 2021, no 17a-7 transactions were entered into by the Account.
| Note 5: | | Portfolio Securities |
For the year ended December 31, 2021, the aggregate cost of purchases and the proceeds from sales of securities, excluding short-term investments, were $64,736,331 and $77,872,197, respectively.
A summary of the cost of purchases and proceeds from sales of shares of an affiliated mutual fund for the year ended December 31, 2021, is presented as follows:
| | | | | | | | | | | | | | | | | | | | | | | | | | | | |
Value,
Beginning
of Year | | Cost of
Purchases | | | Proceeds
from Sales | | | Change in
Unrealized
Gain(Loss) | | | Realized
Gain(Loss) | | | Value, End
of Year | | | Shares,
End of Year | | | Income | |
| | | | | |
| Short-Term Investments — Affiliated Mutual Fund: | | | | | | | | | | | | | | | | | | | | | |
PGIM Core Ultra Short Bond Fund(1)(a) | |
| $3,335,484 | | $ | 26,761,723 | | | $ | (26,724,764 | ) | | $ | — | | | $ | — | | | $ | 3,372,443 | | | | 3,372,443 | | | $ | 3,166 | |
| | | | | | | | | | | | | | | | | | | | | | | | | | | | |
| | (1) | The Account did not have any capital gain distributions during the reporting period. |
| | (a) | PGIM Investments LLC, the manager of the Account, also serves as manager of the PGIM Core Ultra Short Bond Fund. |
| Note 6: | | Unit Transactions |
The number of Accumulation Units issued and redeemed for the year ended December 31, 2021 and the year ended December 31, 2020, respectively, are as follows:
| | | | | | | | |
Standard Contracts | | Units | | | Amount | |
Year ended December 31, 2021: | | | | | | | | |
Account units issued | | | 87,015 | | | $ | 2,651,267 | |
Account units redeemed | | | (500,008 | ) | | | (15,140,575 | ) |
| | | | | | | | |
Net increase (decrease) in units outstanding | | | (412,993 | ) | | $ | (12,489,308 | ) |
| | | | | | | | |
Year ended December 31, 2020: | | | | | | | | |
Account units issued | | | 66,701 | | | $ | 1,447,977 | |
Account units redeemed | | | (642,148 | ) | | | (14,359,678 | ) |
| | | | | | | | |
Net increase (decrease) in units outstanding | | | (575,447 | ) | | $ | (12,911,701 | ) |
| | | | | | | | |
| | |
0.50% Contracts | | Units | | | Amount | |
Year ended December 31, 2021: | | | | | | | | |
Account units issued | | | — | | | $ | — | |
Account units redeemed | | | (7,548 | ) | | | (249,034 | ) |
| | | | | | | | |
Net increase (decrease) in units outstanding | | | (7,548 | ) | | $ | (249,034 | ) |
| | | | | | | | |
Year ended December 31, 2020: | | | | | | | | |
Account units issued | | | — | | | $ | — | |
Account units redeemed | | | (13,690 | ) | | | (360,835 | ) |
| | | | | | | | |
Net increase (decrease) in units outstanding | | | (13,690 | ) | | $ | (360,835 | ) |
| | | | | | | | |
| | |
0.45% Contracts | | Units | | | Amount | |
Year ended December 31, 2021: | | | | | | | | |
Account units issued | | | — | | | $ | — | |
Account units redeemed | | | (34,808 | ) | | | (1,189,118 | ) |
| | | | | | | | |
Net increase (decrease) in units outstanding | | | (34,808 | ) | | $ | (1,189,118 | ) |
| | | | | | | | |
Year ended December 31, 2020: | | | | | | | | |
Account units issued | | | — | | | $ | — | |
Account units redeemed | | | (29,153 | ) | | | (707,870 | ) |
| | | | | | | | |
Net increase (decrease) in units outstanding | | | (29,153 | ) | | $ | (707,870 | ) |
| | | | | | | | |
| Note 7: | | Net Increase (Decrease) In Net Assets Resulting From Surplus Transfers |
The increase (decrease) in net assets resulting from surplus transfers represents the net increase to/(reductions from) PICA’s investment in the Account.
| Note 8: | | Participant Loans |
Loans are considered to be withdrawals from the Account from which the loan amount was deducted, though they are not considered a withdrawal from the MEDLEY Program. Withdrawals, transfers and loans from VCA-10 are considered to be withdrawals of contributions until all of the Participant’s contributions to the Account have been withdrawn, transferred or borrowed.
For the year ended December 31, 2021, $43,132 in participant loans were withdrawn from VCA-10 and $53,193 of principal and interest was repaid to VCA-10. For the year ended December 31, 2020, $57,662 in participant loans were withdrawn from VCA-10 and $65,334 of principal and interest was repaid to VCA-10. Loan repayments are invested in Participant’s account(s) as chosen by the Participant, which may not necessarily be VCA-10. The initial loan proceeds which are being repaid may not necessarily have originated solely from VCA-10. During the year ended December 31, 2021, PICA has advised the Account that it received $422 in loan origination fees. The participant loan principal and interest repayments are included in purchase payments and transfers within the Statement of Changes in Net Assets.
| Note 9: | | Risks of Investing in the Account |
The Account’s risks include, but are not limited to, some or all of the risks discussed below. For further information on the Account’s risk, please refer to the Account’s Prospectus and Statement of Additional Information.
Risks Associated with Variable Investment Options: You take all the investment risk for amounts allocated to the Investment Options. If the assets in an Investment Option increase in value, then your Unit Value goes up; if they decrease in value, your Unit Value goes down. How much your Unit Value goes up or down depends on the performance of the Investment Options. We do not guarantee the investment results of the Investment Options. An investment in any Contract is subject to the risk of poor investment performance, and the value of your investment can vary depending on the performance of the Investment Options.
Insurance Company Risk: No company other than PICA has any legal responsibility to pay amounts that PICA owes under the Contracts. You should look to the financial strength of PICA for its claims-paying ability. PICA is also subject to risks related to disasters and other events, such as storms, earthquakes, fires, outbreaks of infectious diseases (such as COVID-19), utility failures, terrorist acts, including cybersecurity attacks, political and social developments, and military and governmental actions. These risks are often collectively referred to as “business continuity” risks. These events could adversely affect PICA and our ability to conduct business and process transactions. Although PICA has business continuity plans, it is possible that the plans may not operate as intended or required and that PICA may not be able to provide required services, process transactions, deliver documents or calculate values. It is also possible that service levels may decline as a result of such events.
Annuitization: Once you annuitize your interest under a Contract, your decision is irrevocable. The impacts of this decision are:
| | ∎ | Your Unit Value is no longer available to you to allocate among Investment Options (to the extent allowed under the Contracts) or make further withdrawals. Instead, you will be paid a stream of annuity payments. |
| | ∎ | You generally cannot change the payment stream you chose once it has begun. |
| | ∎ | The Death Benefit terminates upon annuitization. |
Possible Adverse Tax Consequences: The tax considerations associated with the Contracts vary and can be complicated. The tax considerations discussed in this prospectus are general in nature and describe only federal income tax law (not state, local, foreign or other federal tax laws). The effect of federal taxation depends largely upon the type of retirement plan, so we can provide only a generalized description. Before payments are made under the Contracts for your benefit or taking other action related to your Contracts, you should consult with a qualified tax adviser for complete information and advice.
Not a Short-Term Investment: The Contracts are not short-term investment vehicles and are not an appropriate investment for an investor who needs ready access to cash. The Contracts are designed to provide benefits on a long-term basis. Consequently, you should not use the Contracts as short-term investment or savings vehicles. Because of the long-term nature of the Contracts, you should consider whether investing Contributions in the Contracts is consistent with the purpose for which the investment is being considered.
Risk of Loss: All investments have risks to some degree and it is possible that you could lose money by investing in the Contracts. Investments in the Contracts are not deposits with a bank and are not insured or guaranteed by the Federal Deposit Insurance Corporation or any other government agency
| Note 10: | | Recent Regulatory Developments |
On December 3, 2020, the SEC announced that it voted to adopt a new rule that establishes an updated regulatory framework for valuation practices (the “Rule”). The Rule, in part, provides (i) a framework for determining fair value in good faith and (ii) provides for the Account Committee’s assignment of its responsibility for the execution of valuation-related activities to the Account’s investment adviser. Further, the SEC is rescinding previously issued guidance on related issues. The Rule took effect on March 8, 2021, with a compliance date of September 8, 2022. Management is currently evaluating the Rule and its impact to the Account.
Report of Independent Registered Public Accounting Firm
To the Board of Directors and Participants of The Prudential Variable Contract Account-10
Opinion on the Financial Statements
We have audited the accompanying statement of net assets of The Prudential Variable Contract Account-10 (the “Account”) as of December 31, 2021, the related statement of operations for the year ended December 31, 2021, the statement of changes in net assets for each of the two years in the period ended December 31, 2021, including the related notes, and the financial highlights for each of the two years in the period ended December 31, 2021 (collectively referred to as the “financial statements”). In our opinion, the financial statements present fairly, in all material respects, the financial position of the Account as of December 31, 2021, the results of its operations for the year then ended, and the changes in its net assets and the financial highlights for each of the two years in the period ended December 31, 2021 in conformity with accounting principles generally accepted in the United States of America.
The financial statements of the Account as of and for the year ended December 31, 2019 and the financial highlights for each of the periods ended on or prior to December 31, 2019 (not presented herein, other than the financial highlights) were audited by other auditors whose report dated February 19, 2020 expressed an unqualified opinion on those financial statements and financial highlights.
Basis for Opinion
These financial statements are the responsibility of the Account’s management. Our responsibility is to express an opinion on the Account’s financial statements based on our audits. We are a public accounting firm registered with the Public Company Accounting Oversight Board (United States) (PCAOB) and are required to be independent with respect to the Account in accordance with the U.S. federal securities laws and the applicable rules and regulations of the Securities and Exchange Commission and the PCAOB.
We conducted our audits of these financial statements in accordance with the standards of the PCAOB. Those standards require that we plan and perform the audit to obtain reasonable assurance about whether the financial statements are free of material misstatement, whether due to error or fraud.
Our audits included performing procedures to assess the risks of material misstatement of the financial statements, whether due to error or fraud, and performing procedures that respond to those risks. Such procedures included examining, on a test basis, evidence regarding the amounts and disclosures in the financial statements. Our audits also included evaluating the accounting principles used and significant estimates made by management, as well as evaluating the overall presentation of the financial statements. Our procedures included confirmation of securities owned as of December 31, 2021 by correspondence with the custodian, transfer agent and brokers; when replies were not received from brokers, we performed other auditing procedures. We believe that our audits provide a reasonable basis for our opinion.
/s/PricewaterhouseCoopers LLP
New York, New York
February 24, 2022
We have served as the auditor of one or more investment companies in the Prudential Variable Contract Accounts complex since 2020.
THE VCA 10 COMMITTEE AND OFFICERS
MANAGEMENT OF VCA 10
VCA 10 has a Committee—similar to a board of directors—that provides general supervision and manages VCA 10. The members of the VCA 10 Committee are elected for indefinite terms by the persons having voting rights in respect of the VCA 10 Account. The affairs of VCA 10 are conducted in accordance with the Rules and Regulations of VCA 10. A majority of the members of the VCA 10 Committee are not “interested persons” of Prudential Financial or its affiliates, as defined by the Investment Company Act.
The members of the VCA 10 Committee oversee the operations of the VCA 10 Account and appoint officers who are responsible for day-to-day business decisions based on policies set by the members of the VCA 10 Committee.
Information pertaining to the members of the VCA 10 Committee (hereafter referred to as “Committee Members” or “Board Members”) is set forth below. Committee Members who are not deemed to be “interested persons” of VCA 10 as defined in the Investment Company Act are referred to as “Independent Committee Members.” Committee Members who are deemed to be “interested persons” of VCA 10 are referred to as “Interested Committee Members.” “Fund Complex” consists of VCA 10 and any other investment companies managed by PGIM Investments. Information pertaining to the Officers of VCA 10 is also set forth below. VCA 10 is also referred to as “Fund,” and together with certain registered investment companies overseen by the VCA 10 Committee, the “Funds.”
| | | | | | |
| | |
| Independent Committee Members | | |
Name Year of Birth Position(s) Portfolios Overseen | | Principal Occupation(s) During Past Five Years | | Other Directorships Held During Past Five Years | | Length of Board Service |
Ellen S. Alberding 1958 Committee Member Portfolios Overseen: 95 | | President and Board Member, The Joyce Foundation (charitable foundation) (since 2002); formerly Vice Chair, City Colleges of Chicago (community college system) (2011-2015); Trustee, National Park Foundation (charitable foundation for national park system) (2009-2018); Trustee, Economic Club of Chicago (since 2009); Trustee, Loyola University (since 2018). | | None. | | Since September 2013 |
Kevin J. Bannon 1952 Committee Member Portfolios Overseen: 95 | | Retired; formerly Managing Director (April 2008-May 2015) and Chief Investment Officer (October 2008-November 2013) of Highmount Capital LLC (registered investment adviser); formerly Executive Vice President and Chief Investment Officer (April 1993-August 2007) of Bank of New York Company; President (May 2003-May 2007) of BNY Hamilton Family of Mutual Funds. | | Director of Urstadt Biddle Properties (equity real estate investment trust) (since September 2008). | | Since July 2008 |
Linda W. Bynoe 1952 Committee Member Portfolios Overseen: 92 | | President and Chief Executive Officer (since March 1995) and formerly Chief Operating Officer (December 1989-February 1995) of Telemat Limited LLC (formerly Telemat Ltd.) (management consulting); formerly Vice President (January 1985-June 1989) at Morgan Stanley & Co. (broker-dealer). | | Trustee of Equity Residential (residential real estate) (since December 2009); Director of Northern Trust Corporation (financial services) (since April 2006); formerly, Director of Anixter International, Inc. (communication products distributor) (January 2006-June 2020). | | Since March 2005 |
Keith F. Hartstein 1956 Committee Member & Independent Chair Portfolios Overseen: 95 | | Retired; Member (since November 2014) of the Governing Council of the Independent Directors Council (IDC) (organization of independent mutual fund directors); formerly Executive Committee of the IDC Board of Governors (October 2019-December 2021); formerly President and Chief Executive Officer (2005-2012), Senior Vice President (2004-2005), Senior Vice President of Sales and Marketing (1997-2004), and various executive management positions (1990-1997), John Hancock Funds, LLC (asset management); Chairman, Investment Company Institute’s Sales Force Marketing Committee (2003-2008). | | None. | | Since September 2013 |
E1
| | | | | | |
| | |
| Interested Committee Member | | |
| | | | |
Name Year of Birth Position(s) Portfolios Overseen | | Principal Occupation(s) During Past Five Years | | Other Directorships Held During Past Five Years | | Length of Board Service |
| | | | |
Scott E. Benjamin 1973 Committee Member & Vice President Portfolios Overseen:95 | | Executive Vice President (since May 2009) of PGIM Investments LLC; Vice President (since June 2012) of Prudential Investment Management Services LLC; Executive Vice President (since September 2009) of AST Investment Services, Inc.; Senior Vice President of Product Development and Marketing, PGIM Investments (since February 2006); formerly Vice President of Product Development and Product Management, PGIM Investments LLC (2003-2006). | | None. | | Since March 2010 |
| | | | |
| | | |
| Fund Officers(a) | | | | |
| | | |
Name Year of Birth Fund Position | | Principal Occupation(s) During Past Five Years | | Length of Service as Fund Officer |
| | | |
Claudia DiGiacomo 1974 Chief Legal Officer | | Chief Legal Officer, Executive Vice President and Secretary of PGIM Investments LLC (since August 2020); Chief Legal Officer of Prudential Mutual Fund Services LLC (since August 2020); Chief Legal Officer of PIFM Holdco, LLC (since August 2020); Vice President and Corporate Counsel (since January 2005) of Prudential; and Corporate Counsel of AST Investment Services, Inc. (since August 2020); formerly Vice President and Assistant Secretary of PGIM Investments LLC (2005-2020); formerly Associate at Sidley Austin Brown & Wood LLP (1999-2004). | | Since December 2005 |
| | | |
Dino Capasso 1974 Chief Compliance Officer | | Chief Compliance Officer (since July 2019) of PGIM Investments LLC; Chief Compliance Officer (since July 2019) of the PGIM Funds, Target Funds, Advanced Series Trust, The Prudential Series Fund, Prudential’s Gibraltar Fund, Inc., PGIM Global High Yield Fund, Inc., PGIM High Yield Bond Fund, Inc., and PGIM Short Duration High Yield Opportunities Fund; Vice President and Deputy Chief Compliance Officer (June 2017-2019) of PGIM Investments LLC; formerly Senior Vice President and Senior Counsel (January 2016-June 2017), and Vice President and Counsel (February 2012-December 2015) of Pacific Investment Management Company LLC. | | Since March 2018 |
| | | |
Andrew R. French 1962 Secretary | | Vice President (since December 2018) of PGIM Investments LLC; formerly Vice President and Corporate Counsel (2010-2018) of Prudential; formerly Director and Corporate Counsel (2006-2010) of Prudential; Vice President and Assistant Secretary (since January 2007) of PGIM Investments LLC; Vice President and Assistant Secretary (since January 2007) of Prudential Mutual Fund Services LLC. | | Since October 2006 |
| | | |
Diana N. Huffman 1982 Assistant Secretary | | Vice President and Corporate Counsel (since September 2015) of Prudential; Vice President and Assistant Secretary (since August 2020) of PGIM Investments LLC; formerly Associate at Willkie Farr & Gallagher LLP (2009-2015). | | Since March 2019 |
| | | |
Melissa Gonzalez 1980 Assistant Secretary | | Vice President and Corporate Counsel (since September 2018) of Prudential; Vice President and Assistant Secretary (since August 2020) of PGIM Investments LLC; formerly Director and Corporate Counsel (March 2014-September 2018) of Prudential. | | Since March 2020 |
| | | |
Patrick E. McGuinness 1986 Assistant Secretary | | Vice President and Assistant Secretary (since August 2020) of PGIM Investments LLC; Director and Corporate Counsel (since February 2017) of Prudential; and Corporate Counsel (2012-2017) of IIL, Inc. | | Since June 2020 |
| | | |
Debra Rubano 1975 Assistant Secretary | | Vice President and Corporate Counsel (since November 2020) of Prudential; formerly Director and Senior Counsel of Allianz Global Investors U.S. Holdings LLC (2010-2020) and Assistant Secretary of numerous funds in the Allianz fund complex (2015-2020). | | Since December 2020 |
| | | |
Kelly A. Coyne 1968 Assistant Secretary | | Director, Investment Operations of Prudential Mutual Fund Services LLC (since 2010). | | Since March 2015 |
| | | |
Christian J. Kelly 1975 Treasurer and Principal Financial
and Accounting Officer | | Vice President, Head of Fund Administration of PGIM Investments LLC (since November 2018); formerly Director of Fund Administration of Lord Abbett & Co. LLC (2009-2018), Treasurer and Principal Accounting Officer of the Lord Abbett Family of Funds (2017-2018); Director of Accounting, Avenue Capital Group (2008-2009); Senior Manager, Investment Management Practice of Deloitte & Touche LLP (1998-2007). | | Since January 2019 |
| | | |
Lana Lomuti 1967 Assistant Treasurer | | Vice President (since 2007) and Director (2005-2007), within PGIM Investments Fund Administration; formerly Assistant Treasurer (December 2007-February 2014) of The Greater China Fund, Inc. | | Since April 2014 |
E2
| | | | |
| | | |
| Fund Officers(a) | | | | |
| | | |
Name Year of Birth Fund Position | | Principal Occupation(s) During Past Five Years | | Length of Service as Fund Officer |
| | | |
Russ Shupak 1973 Assistant Treasurer | | Vice President (since 2017) and Director (2013-2017), within PGIM Investments Fund Administration. | | Since October 2019 |
| | | |
Deborah Conway 1969 Assistant Treasurer | | Vice President (since 2017) and Director (2007-2017), within PGIM Investments Fund Administration. | | Since October
2019 |
| | | |
Elyse M. McLaughlin 1974 Assistant Treasurer | | Vice President (since 2017) and Director (2011-2017), within PGIM Investments Fund Administration. | | Since October 2019 |
| | | |
Jonathan Corbett 1983 Anti-Money Laundering Compliance Officer | | Vice President, Corporate Compliance, Global Compliance Programs and Compliance Risk Management (since August 2019) of Prudential; formerly Vice President and Head of Key Risk Areas Compliance (March 2016 to July 2019), Chief Privacy Officer (March 2016 to July 2019) and Head of Global Financial Crimes Unit (April 2014 to March 2016) at MetLife. | | Since October 2021 |
(a) Excludes Mr. Parker and Mr. Benjamin, interested Board Members who also serve as President and Vice President, respectively.
Explanatory Notes to Tables:
| ∎ | | Board Members are deemed to be “Interested,” as defined in the 1940 Act, by reason of their affiliation with PGIM Investments LLC and/or an affiliate of PGIM Investments LLC. |
| ∎ | | Unless otherwise noted, the address of all Board Members and Officers is c/o PGIM Investments LLC, 655 Broad Street, Newark, New Jersey 07102-4410. |
| ∎ | | There is no set term of office for Board Members or Officers. The Board Members have adopted a retirement policy, which calls for the retirement of Board Members on December 31 of the year in which they reach the age of 75. |
| ∎ | | “Other Directorships Held” includes all directorships of companies required to register or file reports with the SEC under the 1934 Act (that is, “public companies”) or other investment companies registered under the 1940 Act. |
| ∎ | | “Portfolios Overseen” includes all investment companies managed by PGIM Investments LLC. The investment companies for which PGIM Investments LLC serves as manager include the PGIM Funds, Target Funds, The Prudential Variable Contract Accounts, PGIM ETF Trust, PGIM High Yield Bond Fund, Inc., PGIM Global High Yield Fund, Inc., PGIM Short Duration High Yield Opportunities Fund, The Prudential Series Fund, Prudential’s Gibraltar Fund, Inc. and the Advanced Series Trust. |
| ∎ | | As used in the Fund Officers table “Prudential” means The Prudential Insurance Company of America. |
E3
The Prudential Series Fund
The following pages represent information on the Prudential Series Fund Portfolios. Returns are at the Portfolio level, not at the Subaccount level.
Each Subaccount of VCA-11 and VCA-24 will invest in the corresponding Portfolio of the Prudential Series Fund (the “Fund”). Of the Portfolios comprising the Fund, eight Portfolios are presently available to The MEDLEY Program. The PSF PGIM 50/50 Balanced Subaccount invests in the PSF PGIM 50/50 Balanced Portfolio, the PSF PGIM Total Return Bond Subaccount invests in the PSF PGIM Total Return Bond Portfolio, the PSF PGIM Jennison Blend Subaccount invests in the PSF PGIM Jennison Blend Portfolio, the PSF PGIM Flexible Managed Subaccount invests in the PSF PGIM Flexible Managed Portfolio, the PSF Global Subaccount invests in the PSF Global Portfolio, the PSF PGIM Government Income Subaccount invests in the PSF PGIM Government Income Portfolio, the PSF PGIM Government Money Market Subaccount invests in the PSF PGIM Government Money Market Portfolio, and the PSF Stock Index Subaccount invests in the PSF Stock Index Portfolio.
There is no assurance that the investment objective of the Portfolios will be attained, nor is there any guarantee that the amount available to a Participant will equal or exceed the total contributions made on that Participant’s behalf. The value of the investments held in each account may fluctuate daily and is subject to the risks of both changing economic conditions and the selection of investments necessary to meet the Subaccounts’ or Portfolios’ objectives.
Important Note
This information supplements the financial statements and other information included in this Report to Participants in The MEDLEY Program. It highlights the investment performance of the eight portfolios of the Fund which are available through the Prudential Variable Contract Accounts 11 and 24. The rates of return quoted on the following pages reflect deduction of investment management fees and portfolio expenses, but not product charges. They reflect the reinvestment of dividend and capital gains distributions. They are not an estimate or a guarantee of future performance.
Contract unit values increase or decrease based on the performance of each corresponding Portfolio and when redeemed, may be worth more or less than original cost. Changes in contract values depend not only on the investment performance of each Portfolio but also on the insurance, administrative charges and applicable sales charges, if any, under a contract. These contract charges effectively reduce the dollar amount of any net gains and increase the dollar amount of any net losses.
| | |
The Prudential Series Fund, PSF Global Portfolio | | December 31, 2021 |
Report of the Investment Manager - As of December 31, 2021 (Unaudited)
| | | | | | | | | | | | | | | | | | | | | | |
| | | Average Annual Total Returns | | | 1 Year | | | | 5 Years | | | | 10 Years | | | | Since Inception | | | | $10,000 INVESTED OVER 10 YEARS 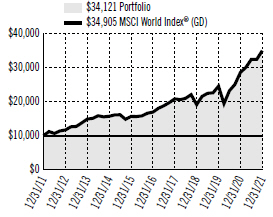
| |
| | | Portfolio: Class I | | 18.23% | | | 15.62% | | | 13.06% | | | — | |
| | | Portfolio: Class III | | N/A | | | N/A | | | N/A | | | 6.76 | |
| | | MSCI World Index® (GD) | | 22.35 | | | 15.64 | | | 13.32 | | | — | |
| | | Past performance does not guarantee future returns. The investment return and principal value of an investment will fluctuate, so that shares, when redeemed, may be worth more or less than their original cost. Current performance may be lower or higher than the past performance. Portfolio Class III inception: 04/26/2021. Portfolio performance is net of fund expenses, but not contract charges, which, if included, would significantly lower the performance quoted. Performance figures may reflect fee waivers and/or expense reimbursements. In the absence of such fee waivers and/or expense reimbursements, performance would be lower. Unless noted otherwise, Index returns are based on the Portfolio’s Class I shares. | |
| | | | | | | | | | | | | | | | | | | |
| | | The graph is based on the performance of Class I shares. Performance of Class III shares will be lower due to differences in the fee structure. Class III shares have associated 12b-1 fees at an annual rate of 0.25%, of the average daily net assets of the Class III shares. | |
| | | | | | | | | | | | | | | | | | | | | | | |
For the year ended December 31, 2021, the PSF Global Portfolio Class I shares returned 18.23%. The Portfolio’s Class I shares underperformed the MSCI World Index (GD).
What were the market conditions during the reporting period?
Despite economic constraints brought on by the COVID-19 global pandemic, investment market returns were largely positive in calendar-year 2021 (the reporting period). Generally, equities and real assets outperformed bonds by significant margins. For the period, US equities, as measured by the Russell 3000 Index, rose 25.66%; international equities, as measured by the MSCI EAFE Index, returned 11.78%. Conversely, bonds, as measured by the Bloomberg US Aggregate Bond Index, fell 1.54% over the period.
What strategies or holdings affected the Portfolio’s performance?*
Each of the Portfolio’s subadvisors outperformed their respective style-specific benchmark during the period, with the exception of the domestic large-cap growth sleeve, which underperformed the Russell 1000 Growth index by a wide margin.
From a tactical perspective, the Portfolio was overweight US equities for most of the period, which added to its performance, but it rotated into international equities in the fourth quarter of the period, which subtracted some of those gains. Stylistically, the Portfolio maintained an overweight to domestic value investments. With growth and value stocks oscillating throughout the period, this overweight had minimal impact. An overweight to international growth equities during the fourth quarter was a net positive.
*This strategy and performance overview, which discusses what strategies or holdings (including derivatives, if applicable) affected the Portfolio’s performance, is compiled based on how the Portfolio performed relative to the Portfolio’s assigned index and is viewed for performance attribution purposes at the aggregate Portfolio level, which in most instances will not directly correlate to the amounts disclosed in the Statement of Operations which conform to U.S. generally accepted accounting principles.
For a complete list of holdings, please refer to the Schedule of Investments section of this report. Holdings reflect only long-term investments.
| | |
The Prudential Series Fund, PSF Global Portfolio | | December 31, 2021 |
Report of the Investment Manager - As of December 31, 2021 (Unaudited) (Continued)
Presentation of Portfolio Holdings — unaudited
| | | | | | | | |
PSF Global Portfolio (As of 12/31/2021) | |
| Ten Largest Holdings | | Line of Business | | Country | | | % of Net Assets | |
| Microsoft Corp. | | Software | | United States | | | 2.6% | |
| Alphabet, Inc. (Class C Stock) | | Interactive Media & Services | | United States | | | 1.9% | |
| Thermo Fisher Scientific, Inc. | | Life Sciences Tools & Services | | United States | | | 1.8% | |
| ServiceNow, Inc. | | Software | | United States | | | 1.6% | |
| NXP Semiconductors NV | | Semiconductors & Semiconductor Equipment | | China | | | 1.6% | |
| Intuit, Inc. | | Software | | United States | | | 1.5% | |
| Intuitive Surgical, Inc. | | Health Care Equipment & Supplies | | United States | | | 1.5% | |
| Zoetis, Inc. | | Pharmaceuticals | | United States | | | 1.3% | |
| Edwards Lifesciences Corp. | | Health Care Equipment & Supplies | | United States | | | 1.2% | |
| SBA Communications Corp., REIT | | Equity Real Estate Investment Trusts (REITs) | | United States | | | 1.2% | |
For a complete list of holdings, please refer to the Schedule of Investments section of this report. Holdings reflect only long-term investments.
| | |
The Prudential Series Fund, PSF PGIM 50/50 Balanced Portfolio | | December 31, 2021 |
Report of the Investment Manager - As of December 31, 2021 (Unaudited)
| | | | | | | | | | | | | | | | | | | | | | | | | | |
| | | Average Annual Total Returns | | | 1 Year | | | | 5 Years | | | | 10 Years | | | | Since Inception | | | | $10,000 INVESTED OVER 10 YEARS 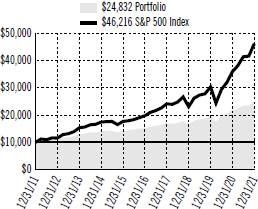
| | | | | |
| | | Portfolio: Class I | | 13.38% | | | 10.41% | | | 9.52% | | | — | |
| | | Portfolio: Class III | | N/A | | | N/A | | | N/A | | | 7.76 | |
| | | Blended Index | | 12.98 | | | 10.86 | | | 9.52 | | | — | |
| | | S&P 500 Index | | 28.70 | | | 18.47 | | | 16.54 | | | — | |
| | | Past performance does not guarantee future returns. The investment return and principal value of an investment will fluctuate, so that shares, when redeemed, may be worth more or less than their original cost. Current performance may be lower or higher than the past performance. Portfolio Class III inception: 04/26/2021. Portfolio performance is net of fund expenses, but not contract charges, which, if included, would significantly lower the performance quoted. Performance figures may reflect fee waivers and/or expense reimbursements. In the absence of such fee waivers and/or expense reimbursements, performance would be lower. Unless noted otherwise, Index returns are based on the Portfolio’s Class I shares. | |
| | | | | | | | | | | | | | | | | | | |
| | | The graph is based on the performance of Class I shares. Performance of Class III shares will be lower due to differences in the fee structure. Class III shares have associated 12b-1 fees at an annual rate of 0.25%, of the average daily net assets of the Class III shares. | | | | | |
| | | | | | | | | | | | | | | | | | | | | | | | | | | |
For the year ended December 31, 2021, the PSF PGIM 50/50 Balanced Portfolio Class I shares returned 13.38%. The Portfolio’s Class I shares outperformed the Blended Index and underperformed the S&P 500 Index.
What were the market conditions during the reporting period?
Calendar-year 2021 (the reporting period) was characterized by a stable first half as global economies recovered, before growth slowed in the third quarter on supply-chain disruptions and the increased spread of COVID-19. However, various economic indicators maintained strength through the final quarter of the period, which provided a tailwind for risk assets and helped US equities cap a third year of double-digit gains, despite the ongoing global pandemic and the economic disruptions it caused. Swift medical developments, including the global rollout of COVID-19 vaccines, as well as extraordinary fiscal and monetary stimulus unleashed by global economies, contributed to these gains. Other risk assets also performed well, including international equities, credit, commodities, and real estate.
Inflation was also a key factor during the period, as energy and commodity prices continued to trend higher and pushed the Consumer Price Index to its highest level since the early 1980s. The 10-year US Treasury yield ended the period at 1.5%, roughly in line with the rest of the period but a full half-percent above its level in January. This rise in rates was a decidedly negative factor for fixed income holdings, especially those without credit exposure to help cushion the blow to duration. (Duration measures the sensitivity of the price—the value of principal—of a bond to a change in interest rates.) Despite the continued rise in inflation throughout the period, longer-term yields remained stable, as investors adopted the Federal Reserve’s view that price increases were transitory. Indeed, various market measures of longer-term inflation expectations remained grounded, including market surveys and yields on Treasury inflation-protected securities. Short-term rates, on the other hand, rose almost 50 basis points as markets gradually priced in the rate hikes expected in 2022. (One basis point equals 0.01%.)
What strategies or holdings affected the Portfolio’s performance?*
Asset allocation decisions had a positive impact on Portfolio performance during the reporting period. A consistent and diversified overweight to risk assets over the course of the period benefited returns as the continued global recovery provided a strong tailwind. An off-benchmark position in international equities, meant to diversify equity exposure, was not exceptionally effective as it trailed domestic equity markets. However, the position was funded by an underweight to fixed income, so it was a positive performer overall. In addition, cash was kept at close-to-benchmark levels, which helped shorten the duration of the underweight fixed income allocation. Lastly, the fixed income manager also added value by prudently responding to duration and using credit exposure effectively to outpace the benchmark in the face of rising interest rates.
For a complete list of holdings, please refer to the Schedule of Investments section of this report. Holdings reflect only long-term investments.
| | |
The Prudential Series Fund, PSF PGIM 50/50 Balanced Portfolio | | December 31, 2021 |
Report of the Investment Manager - As of December 31, 2021 (Unaudited) (Continued)
During the period, the Portfolio used interest rate swaps to help manage duration and yield curve exposure. In aggregate, the use of interest rate swaps had a negative impact on performance during the period. In addition, the Portfolio used futures to manage interest rate risk, a more efficient way of managing interest rate risk than through the purchase and sale of cash bonds. The use of futures had a negligible impact on performance for the period. The Portfolio also used credit derivatives in the form of the Credit Default Swap Index (CDX) to manage credit risk. The use of CDX detracted from performance for the period.
*This strategy and performance overview, which discusses what strategies or holdings (including derivatives, if applicable) affected the Portfolio’s performance, is compiled based on how the Portfolio performed relative to the Portfolio’s assigned index and is viewed for performance attribution purposes at the aggregate Portfolio level, which in most instances will not directly correlate to the amounts disclosed in the Statement of Operations which conform to U.S. generally accepted accounting principles.
Presentation of Portfolio Holdings — unaudited
| | | | | | |
|
| PSF PGIM 50/50 Balanced Portfolio (As of 12/31/2021) | |
| Ten Largest Holdings | | Line of Business | | | % of Net Assets | |
| Apple, Inc. | | Technology Hardware, Storage & Peripherals | | | 3.6% | |
| Microsoft Corp. | | Software | | | 3.3% | |
| Amazon.com, Inc. | | Internet & Direct Marketing Retail | | | 1.9% | |
| Alphabet, Inc. (Class A Stock) | | Interactive Media & Services | | | 1.1% | |
| Tesla, Inc. | | Automobiles | | | 1.1% | |
| Alphabet, Inc. (Class C Stock) | | Interactive Media & Services | | | 1.1% | |
| Meta Platforms, Inc. (Class A Stock) | | Interactive Media & Services | | | 1.0% | |
| NVIDIA Corp. | | Semiconductors & Semiconductor Equipment | | | 1.0% | |
| Berkshire Hathaway, Inc. (Class B Stock) | | Diversified Financial Services | | | 0.7% | |
| UnitedHealth Group, Inc. | | Health Care Providers & Services | | | 0.6% | |
For a complete list of holdings, please refer to the Schedule of Investments section of this report. Holdings reflect only long-term investments.
| | |
The Prudential Series Fund, PSF PGIM Flexible Managed Portfolio | | December 31, 2021 |
Report of the Investment Manager - As of December 31, 2021 (Unaudited)
| | | | | | | | | | | | | | | | | | | | | | |
| | | Average Annual Total Returns | | | 1 Year | | | | 5 Years | | | | 10 Years | | | | Since Inception | | | | $10,000 INVESTED OVER 10 YEARS 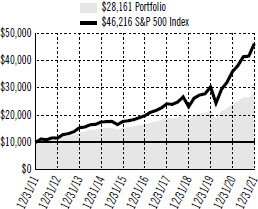
| |
| | | Portfolio: Class I | | 17.36% | | | 11.17% | | | 10.91% | | | — | |
| | | Portfolio: Class III | | | N/A | | | | N/A | | | | N/A | | | | 8.18 | |
| | | Blended Index | | | 15.95 | | | | 12.48 | | | | 11.01 | | | | — | |
| | | S&P 500 Index | | | 28.70 | | | | 18.47 | | | | 16.54 | | | | — | |
| | | Past performance does not guarantee future returns. The investment return and principal value of an investment will fluctuate, so that shares, when redeemed, may be worth more or less than their original cost. Current performance may be lower or higher than the past performance. Portfolio Class III inception: 04/26/2021. Portfolio performance is net of fund expenses, but not contract charges, which, if included, would significantly lower the performance quoted. Performance figures may reflect fee waivers and/or expense reimbursements. In the absence of such fee waivers and/or expense reimbursements, performance would be lower. Unless noted otherwise, Index returns are based on the Portfolio’s Class I shares. | |
| | | The graph is based on the performance of Class I shares. Performance of Class III shares will be lower due to differences in the fee structure. Class III shares have associated 12b-1 fees at an annual rate of 0.25%, of the average daily net assets of the Class III shares. | |
| | | | | | | | | | | | | | | | | | | | | | | |
For the year ended December 31, 2021, the PSF PGIM Flexible Managed Portfolio Class I shares returned 17.36%. The Portfolio’s Class I shares outperformed the Blended Index and underperformed the S&P 500 Index.
What were the market conditions during the reporting period?
Calendar-year 2021 (the reporting period) was characterized by a stable first half as global economies recovered, before growth slowed in the third quarter on supply-chain disruptions and the increased spread of COVID-19. However, various economic indicators maintained strength through the final quarter of the period, which provided a tailwind for risk assets and helped US equities cap a third year of double-digit gains, despite the ongoing global pandemic and the economic disruptions it caused. Swift medical developments, including the global rollout of COVID-19 vaccines, as well as extraordinary fiscal and monetary stimulus unleashed by global economies, contributed to these gains. Other risk assets also performed well, including international equities, credit, commodities, and real estate.
Inflation was also a key factor during the period, as energy and commodity prices continued to trend higher and pushed the Consumer Price Index to its highest level since the early 1980s. The 10-year US Treasury yield ended the period at 1.5%, roughly in line with the rest of the period but a full half-percent above its level in January. This rise in rates was a decidedly negative factor for fixed income holdings, especially those without credit exposure to help cushion the blow to duration. (Duration measures the sensitivity of the price—the value of principal—of a bond to a change in interest rates.) Despite the continued rise in inflation throughout the period, longer-term yields remained stable, as investors adopted the Federal Reserve’s view that price increases were transitory. Indeed, various market measures of longer-term inflation expectations remained grounded, including market surveys and yields on Treasury inflation-protected securities. Short-term rates, on the other hand, rose almost 50 basis points as markets gradually priced in the rate hikes expected in 2022. (One basis point equals 0.01%.)
What strategies or holdings affected the Portfolio’s performance?*
Asset allocation decisions had a positive impact on Portfolio performance during the reporting period. A consistent and diversified overweight to risk assets over the course of the period benefited returns as the continued global recovery provided a strong tailwind. An off-benchmark position in international equities, meant to diversify equity exposure, was not exceptionally effective as it trailed domestic markets. However, the position was funded by an underweight to fixed income, so it was a positive performer overall. In addition, cash was kept at close-to-benchmark levels, which helped shorten the duration of the underweight fixed income allocation.
Managers also added to Portfolio returns during the period. In the face of rising interest rates, the fixed income manager prudently responded to duration and used credit exposure effectively to outpace the benchmark. In addition, the equity managers’ preference for cheap, high-quality stocks was a successful strategy that helped them handily outpace their respective benchmarks.
For a complete list of holdings, please refer to the Schedule of Investments section of this report. Holdings reflect only long-term investments.
| | |
The Prudential Series Fund, PSF PGIM Flexible Managed Portfolio | | December 31, 2021 |
Report of the Investment Manager - As of December 31, 2021 (Unaudited) (Continued)
During the period, the Portfolio used interest rate swaps to help manage duration and yield curve exposure. In aggregate, the use of interest rate swaps had a negative impact on performance during the period. In addition, the Portfolio used futures to manage interest rate risk, a more efficient way of managing interest rate risk than through the purchase and sale of cash bonds. The use of futures had a negligible impact on performance for the period. The Portfolio also used credit derivatives in the form of the Credit Default Swap Index (CDX) to manage credit risk. The use of CDX detracted from performance for the period.
*This strategy and performance overview, which discusses what strategies or holdings (including derivatives, if applicable) affected the Portfolio’s performance, is compiled based on how the Portfolio performed relative to the Portfolio’s assigned index and is viewed for performance attribution purposes at the aggregate Portfolio level, which in most instances will not directly correlate to the amounts disclosed in the Statement of Operations which conform to U.S. generally accepted accounting principles.
Presentation of Portfolio Holdings — unaudited
| | | | | | |
PSF PGIM Flexible Managed Portfolio (As of 12/31/2021) | | | | |
Ten Largest Holdings | | Line of Business | | | % of Net Assets | |
Microsoft Corp. | | Software | | | 4.5% | |
Apple, Inc. | | Technology Hardware, Storage & Peripherals | | | 4.1% | |
Amazon.com, Inc. | | Internet & Direct Marketing Retail | | | 2.0% | |
Alphabet, Inc. (Class A Stock) | | Interactive Media & Services | | | 1.6% | |
Alphabet, Inc. (Class C Stock) | | Interactive Media & Services | | | 1.6% | |
NVIDIA Corp. | | Semiconductors & Semiconductor Equipment | | | 1.5% | |
Tesla, Inc. | | Automobiles | | | 1.4% | |
Meta Platforms, Inc. (Class A Stock) | | Interactive Media & Services | | | 1.0% | |
Johnson & Johnson | | Pharmaceuticals | | | 0.9% | |
Broadcom, Inc. | | Semiconductors & Semiconductor Equipment | | | 0.8% | |
For a complete list of holdings, please refer to the Schedule of Investments section of this report. Holdings reflect only long-term investments.
| | |
The Prudential Series Fund, PSF PGIM Government Income Portfolio | | December 31, 2021 |
Report of the Investment Manager - As of December 31, 2021 (Unaudited)
| | | | | | | | | | | | | | | | | | | | |
| | | Average Annual Total Returns | | | 1 Year | | | | 5 Years | | | | 10 Years | | | | Since Inception | | | $10,000 INVESTED OVER 10 YEARS 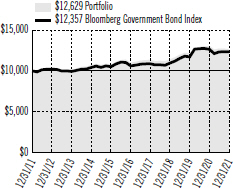
|
| | | Portfolio: Class I | | -3.17% | | | 2.76% | | | 2.36% | | | — | |
| | | Portfolio: Class III | | | N/A | | | | N/A | | | | N/A | | | | -0.99 | |
| | | Bloomberg Government Bond Index | | | -2.28 | | | | 3.07 | | | | 2.14 | | | | — | |
| | | Past performance does not guarantee future returns. The investment return and principal value of an investment will fluctuate, so that shares, when redeemed, may be worth more or less than their original cost. Current performance may be lower or higher than the past performance. Portfolio Class III inception: 04/26/2021. Portfolio performance is net of fund expenses, but not contract charges, which, if included, would significantly lower the performance quoted. Performance figures may reflect fee waivers and/or expense reimbursements. In the absence of such fee waivers and/or expense reimbursements, performance would be lower. Unless noted otherwise, Index returns are based on the Portfolio’s Class I shares. | |
| | | The graph is based on the performance of Class I shares. Performance of Class III shares will be lower due to differences in the fee structure. Class III shares have associated 12b-1 fees at an annual rate of 0.25%, of the average daily net assets of the Class III shares. |
For the year ended December 31, 2021, the PSF PGIM Government Income Portfolio Class I shares returned -3.17%. The Portfolio’s Class I shares underperformed the Bloomberg Government Bond Index.
What were the market conditions during the reporting period?
The strong global rebound from the depths of the COVID-19 pandemic continued throughout much of calendar-year 2021 (the reporting period), as economies continued to respond to monetary and fiscal stimulus. The effective rollout of COVID-19 vaccines, along with clear messaging from both President Biden and the Federal Reserve (the Fed) on the potential for further stimulus, shifted the prospects for growth and inflation in the first half of the period, kicking off a robust “reflation trade” in bond markets. This caused the US Treasury yield curve to steepen sharply over the first half of the period before flattening again in the second half of the period, as the market pulled forward its expectation for interest rate hikes. (A yield curve is a line graph that illustrates the relationship between the yields and maturities of fixed income securities. It is created by plotting the yields of different maturities for the same type of bonds.)
While the yield on the 2-year Treasury note rose sharply in the fourth quarter of the period as markets began pricing in three interest rate hikes in 2022, long-end Treasury yields declined amid uncertainty around the Omicron variant of COVID-19 and the prospect of slower economic growth. Despite steepening over the first part of the period, the US Treasury yield curve flattened slightly over the full period, with the 10-year/2-year Treasury spread declining from 0.80% to 0.78% as of December 31, 2021.
Mortgage-backed securities (MBS) posted negative returns amid increased supply and concerns around the Fed’s tapering of its asset purchases. Meanwhile, strengthening fundamentals generally kept securitized credit on a tightening trajectory as well, with high-quality commercial mortgage-backed securities (CMBS) and collateralized loan obligation (CLO) spreads trading below their pre-pandemic levels at the end of the period.
What strategies or holdings affected the Portfolio’s performance?*
During the period, security selection, especially in US Treasuries, was the largest detractor from the Portfolio’s performance. Selection in MBS also detracted from performance. This was partially offset by security selection in agencies and CMBS, which contributed to returns. Overall sector allocation contributed to the Portfolio’s performance, with overweights to CLOs and CMBS the largest contributors. An underweight to MBS also contributed. The combined impact of the Portfolio’s duration and yield curve strategies detracted from performance for the period. Duration is a measure of a bond’s price sensitivity to interest rate changes over time.
During the period, the Portfolio used interest rate swaps to help manage duration and yield curve exposure. The use of interest rate swaps had a negative impact on performance during the period. The Portfolio used futures to manage the Fund’s interest rate risk, which is a more efficient way of managing interest rate risk than through the purchases and sales of cash bonds. The use of futures detracted from the Portfolio’s performance during the period.
For a complete list of holdings, please refer to the Schedule of Investments section of this report. Holdings reflect only long-term investments.
| | |
The Prudential Series Fund, PSF PGIM Government Income Portfolio | | December 31, 2021 |
Report of the Investment Manager - As of December 31, 2021 (Unaudited) (Continued)
*This strategy and performance overview, which discusses what strategies or holdings (including derivatives, if applicable) affected the Portfolio’s performance, is compiled based on how the Portfolio performed relative to the Portfolio’s assigned index and is viewed for performance attribution purposes at the aggregate Portfolio level, which in most instances will not directly correlate to the amounts disclosed in the Statement of Operations which conform to U.S. generally accepted accounting principles.
Presentation of Portfolio Holdings — unaudited
| | | | | | |
PSF PGIM Government Income Portfolio (As of 12/31/2021) | |
| Credit Quality | | | | | % of Total Investments | |
| AAA | | | | | 97.5% | |
| AA | | | | | 0.8% | |
| NR | | | | | -0.4% | |
| Cash/Cash Equivalents | | | | | 2.1% | |
| Total Investments | | | | | 100.0% | |
Credit ratings reflect the middle rating assigned by a nationally recognized statistical rating organization (NRSRO) such as Moody’s Investor Service, Inc. (Moody’s), S&P Global Ratings (S&P), or Fitch, Inc. (Fitch). Credit ratings reflect the common nomenclature used by both S&P and Fitch. Where applicable, ratings are converted to the comparable S&P/Fitch rating tier nomenclature. These rating agencies are independent, and are widely used. The Not Rated (NR) category consists of securities that have not been rated by a NRSRO. Ratings category may include derivative instruments that could have a negative value. Credit ratings are subject to change.
| | |
The Prudential Series Fund, PSF PGIM Government Money Market Portfolio | | December 31, 2021 |
Report of the Investment Manager - As of December 31, 2021 (Unaudited)
| | | | | | | | | | | | | | | | | | | | | | | | | | |
| | | Average Annual Total Returns | |
| 7-Day* Current
Net Yield |
| | | 1 Year | | | | 5 Years | | | | 10 Years | | | | Since Inception | | | | 7-DAY CURRENT NET YIELD* 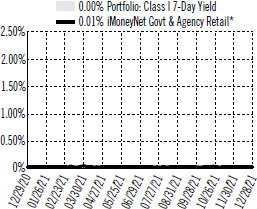
| |
| | | Portfolio: Class I | | 0.00% | | | 0.04% | | | 0.87% | | | 0.44% | | | — | |
| | | Portfolio: Class III | | 0.00 | | | 0.04 | | | N/A | | | N/A | | | 0.03 | |
| | | Lipper US Government Money
Market Index | | N/A | | | 0.01 | | | 0.76 | | | 0.39 | | | — | |
| | | Past performance does not guarantee future returns. The investment return and principal value of an investment will fluctuate, so that shares, when redeemed, may be worth more or less than their original cost. Current performance may be lower or higher than the past performance. The Portfolio Class III inception: 05/18/2020. The yield quotation more closely reflects the current earnings of the Portfolio than the total return quotation. Portfolio performance is net of fund expenses, but not contract charges, which, if included, would significantly lower the performance quoted. Performance figures may reflect fee waivers and/or expense reimbursements. In the absence of such fee waivers and/or expense reimbursements, performance would be lower. Unless noted otherwise, Index returns are based on the Portfolio’s Class I shares. | |
| | | | | | | | | | | | | | | | | | | | | | | |
| | | The graph is based on the performance of Class I shares. Performance of Class III shares will be lower due to differences in the fee structure. Class III shares have associated 12b-1 fees at an annual rate of 0.25%, of the average daily net assets of the Class III shares. | |
| | | * Source: The iMoneyNet Govt��& Agency Retail Average is comprised of 174 funds. The weekly 7-day current net yields of the Government Money Market Portfolio and the iMoneyNet Govt & Agency Retail Average universe are as of 12/31/2021. The graph is based on the 7-day current net yields of Class I shares. | |
| | | An investment in the Government Money Market Portfolio is not insured or guaranteed by the Federal Deposit Insurance Corporation or any other government agency. Although the Portfolio seeks to preserve the value of your investment at $10.00 per share, it is possible to lose money by investing in the Portfolio. | |
| | | | | | | | | | | | | | | | | | | | | | | | | | | |
For the year ended December 31, 2021, the PSF PGIM Government Money Market Portfolio Class I shares returned 0.04%. The Portfolio’s Class I shares outperformed the Lipper US Government Money Market Index.
What were the market conditions during the reporting period?
The strong global rebound from the depths of the COVID-19 pandemic continued throughout much of calendar-year 2021 (the reporting period), as economies continued to respond to monetary and fiscal stimulus. The rollout of COVID-19 vaccines, along with clear messaging from both President Biden and the Federal Reserve (Fed) on the potential for further stimulus, shifted the prospects for growth and inflation in the first half of the period, kicking off a robust “reflation trade” in bond markets. This caused the US Treasury yield curve to steepen sharply over the first half of the period before flattening again in the second half of the period, as the market pulled forward its expectation for interest rate hikes. (A yield curve is a line graph that illustrates the relationship between the yields and maturities of fixed income securities. It is created by plotting the yields of different maturities for the same type of bonds.)
While the yield on the 2-year Treasury note rose sharply in the fourth quarter of the period as markets began pricing in three interest rate hikes in 2022, long-end Treasury yields declined amid uncertainty around the Omicron variant of COVID-19 and the prospect of slower economic growth. Despite steepening over the first part of the period, the US Treasury yield curve flattened slightly over the full period, with the 10-year/2-year Treasury yield spread declining from 0.80% to 0.78% as of December 31, 2021. Meanwhile, the yield on the 3-month Treasury bill declined from 0.08% to 0.05%, while the 3-month LIBOR (London Interbank Offered Rate) declined from 0.24% to 0.22%. In the short-term credit markets, investment-grade credit spreads widened during the period. The Bloomberg 1-3 Year Credit Index, a proxy for the short-term spread market, outperformed similar short-duration Treasuries by 0.29% during the period. (Duration is a measure of a bond’s price sensitivity to interest rate changes over time.)
For a complete list of holdings, please refer to the Schedule of Investments section of this report. Holdings reflect only short-term investments.
| | |
The Prudential Series Fund, PSF PGIM Government Money Market Portfolio | | December 31, 2021 |
Report of the Investment Manager - As of December 31, 2021 (Unaudited) (Continued)
What strategies or holdings affected the Portfolio’s performance?*
The Portfolio’s weighted average maturity (WAM) was shorter than peers during the first quarter of the period. It remained shorter through the first half of the second quarter, extended mid-second quarter, and remained longer than peers through the third quarter of the period. The Portfolio’s WAM shortened at the beginning of the fourth quarter, as it became clear the Fed was nearing a tightening cycle, and remained shorter than peers for the remainder of the period. The Portfolio’s weighted average life (WAL) remained extended through floating rate securities through the third quarter as short-term (overnight) rates hovered near zero, but shortened in the fourth quarter of the period and remained shorter than peers through quarter-end.
Throughout the period, the Portfolio took advantage of changing floating rate spreads and shifted positioning across LIBOR floaters and secured overnight financing rate floaters accordingly. Floaters are bonds or other types of debt whose coupon rate changes with short-term interest rates.
Additionally, to take advantage of changing relative value between the sectors, the Portfolio shifted its positioning in agency discount notes, repurchase agreements, and US Treasuries throughout the period.
*This strategy and performance overview, which discusses what strategies or holdings (including derivatives, if applicable) affected the Portfolio’s performance, is compiled based on how the Portfolio performed relative to the Portfolio’s assigned index and is viewed for performance attribution purposes at the aggregate Portfolio level, which in most instances will not directly correlate to the amounts disclosed in the Statement of Operations which conform to U.S. generally accepted accounting principles.
Presentation of Portfolio Holdings — unaudited
| | | | | | | | | | |
PSF PGIM Government Money Market Portfolio (As of 12/31/2021) | | | | | | | | |
| Ten Largest Holdings | | Interest Rate | | | Maturity Date | | | | % of Net Assets | |
| U.S. Treasury Bills | | 0.067% | | | 03/24/2022 | | | | 6.8% | |
| U.S. Treasury Bills | | 0.061% | | | 03/10/2022 | | | | 5.9% | |
| U.S. Cash Management Bills | | 0.097% | | | 04/26/2022 | | | | 3.9% | |
| U.S. Treasury Bills | | 0.055% | | | 03/17/2022 | | | | 2.9% | |
| U.S. Treasury Bills | | 0.056% | | | 01/06/2022 | | | | 2.5% | |
| U.S. Treasury Bills | | 0.058% | | | 01/11/2022 | | | | 2.5% | |
| U.S. Treasury Bills | | 0.047% | | | 02/22/2022 | | | | 2.5% | |
| Federal Farm Credit Bank | | 0.080% | | | 05/13/2022 | | | | 2.3% | |
| U.S. Cash Management Bills | | 0.051% | | | 03/22/2022 | | | | 2.1% | |
| Federal Home Loan Bank | | 0.065% | | | 03/25/2022 | | | | 2.1% | |
| | | |
| Holdings reflect only short-term investments. | | | | | | | | | | |
For a complete list of holdings, please refer to the Schedule of Investments section of this report. Holdings reflect only short-term investments.
| | |
The Prudential Series Fund, PSF PGIM Jennison Blend Portfolio | | December 31, 2021 |
Report of the Investment Manager - As of December 31, 2021 (Unaudited)
| | | | | | | | | | | | | | | | | | | | |
| | | Average Annual Total Returns | | | 1 Year | | | | 5 Years | | | | 10 Years | | | | Since Inception | | | $10,000 INVESTED OVER 10 YEARS
|
| | | Portfolio: Class I | | | 20.36 | % | | | 19.08 | % | | | 15.32 | % | | | — | | | 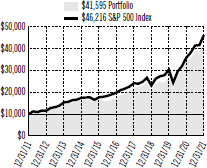
|
| | | Portfolio: Class II | | | 19.88 | | | | 18.61 | | | | 14.86 | | | | — | |
| | | Portfolio: Class III | | | N/A | | | | N/A | | | | N/A | | | | 11.60 | |
| | | Russell 1000® Index | | | 26.45 | | | | 18.43 | | | | 16.54 | | | | — | |
| | | S&P 500 Index | | | 28.70 | | | | 18.47 | | | | 16.54 | | | | — | |
| | | Past performance does not guarantee future returns. The investment return and principal value of an investment will fluctuate, so that shares, when redeemed, may be worth more or less than their original cost. Current performance may be lower or higher than the past performance. Portfolio Class III inception: 04/26/2021. Portfolio performance is net of fund expenses, but not contract charges, which, if included, would significantly lower the performance quoted. Performance figures may reflect fee waivers and/or expense reimbursements. In the absence of such fee waivers and/or expense reimbursements, performance would be lower. Unless noted otherwise, Index returns are based on the Portfolio’s Class I shares. The Russell 1000® Index is a trademark/service mark of the Frank Russell Company. Russell® is a trademark of the Frank Russell Company. | |
| | | The graph is based on the performance of Class I shares. Performance of Class II and Class III shares will be lower due to differences in the fee structure. Class II shares have associated 12b-1 and administrative fees at an annual rate of 0.25% and 0.15%, respectively, of the average daily net assets of the Class II shares. Class III shares have associated 12b-1 fees at an annual rate of 0.25%, of the average daily net assets of the Class III shares. |
For the year ended December 31, 2021, the PSF PGIM Jennison Blend Portfolio Class I shares returned 20.36%. The Portfolio’s Class I shares underperformed both the Russell 1000 Index and the S&P 500 Index.
What were the market conditions during the reporting period?
The US economy expanded during calendar-year 2021 (the reporting period), as policymakers continued to support growth with extraordinary monetary and fiscal stimulus programs aimed at combating the effects of the COVID-19 pandemic. The final three months of the period were marked by the emergence of the COVID-19 Omicron variant and heightened concerns over inflation, which led the Federal Reserve to announce an accelerated tapering plan to reduce its monthly asset purchases. Against this backdrop, equity markets rose to all-time highs to close out the period.
Corporate earnings remained strong during the period, benefiting from a robust economic recovery from pandemic lows. The effects of monetary and fiscal stimulus were visible in the record levels of household and corporate cash, which bolstered demand, and strength in corporate capital expenditures. While supply chains remained tight during the period, the worst of the port and logistics congestion showed signs of easing as the period ended. Holiday shopping took place earlier than normal, but overall supply appeared to keep pace with the seasonal step-up in demand.
Employment continued to rebound during the period, with minimum wage increases, bonus payments, and benefit enhancements instituted across a broad spectrum of industries to retain talent and encourage workers to return to the labor force. Consumer confidence remained strong during the period, although it declined following the emergence of the COVID-19 Delta and Omicron variants.
The S&P 500 Index (the Index) gained 28.70% during the period. All Index sectors posted positive results. Energy, real estate, and financials posted the strongest absolute returns, while consumer staples and utilities posted the weakest returns.
What strategies or holdings affected the Portfolio’s performance?*
All Portfolio sectors contributed positively to the Portfolio’s absolute returns during the reporting period.
Relative to the Index, outperforming sectors were consumer staples and financials. Top sectors that lagged relative to the Index were information technology, consumer discretionary, and communication services.
For a complete list of holdings, please refer to the Schedule of Investments section of this report. Holdings reflect only long-term investments.
| | |
The Prudential Series Fund, PSF PGIM Jennison Blend Portfolio | | December 31, 2021 |
Report of the Investment Manager - As of December 31, 2021 (Unaudited) (Continued)
The most notable stocks to contribute positively to the Portfolio’s performance during the period included positions in Alphabet Inc., Nvidia Corp., Tesla Inc., Microsoft Corp., The ConocoPhillips Company, Johnson Controls International plc, and Apple Inc. Top detractors from the Portfolio’s results during the period included Peloton Interactive Inc., RingCentral Inc., MercadoLibre Inc., BioNTech SE, and Spotify Technology SA. Having underweighted positions in the strongly performing stocks of Microsoft and Apple hurt the Portfolio’s relative performance.
*This strategy and performance overview, which discusses what strategies or holdings (including derivatives, if applicable) affected the Portfolio’s performance, is compiled based on how the Portfolio performed relative to the Portfolio’s assigned index and is viewed for performance attribution purposes at the aggregate Portfolio level, which in most instances will not directly correlate to the amounts disclosed in the Statement of Operations which conform to U.S. generally accepted accounting principles.
Presentation of Portfolio Holdings — unaudited
| | | | |
PSF PGIM Jennison Blend Portfolio (As of 12/31/2021) | | | | |
| | |
Ten Largest Holdings | | Line of Business | | % of Net Assets |
Apple, Inc. | | Technology Hardware, Storage & Peripherals | | 4.5% |
Tesla, Inc. | | Automobiles | | 4.4% |
Microsoft Corp. | | Software | | 4.1% |
Amazon.com, Inc. | | Internet & Direct Marketing Retail | | 3.4% |
Alphabet, Inc. (Class A Stock) | | Interactive Media & Services | | 3.3% |
ConocoPhillips | | Oil, Gas & Consumable Fuels | | 3.0% |
NVIDIA Corp. | | Semiconductors & Semiconductor Equipment | | 2.9% |
Shopify, Inc. (Canada) (Class A Stock) | | IT Services | | 2.2% |
Eli Lilly & Co. | | Pharmaceuticals | | 2.2% |
Alphabet, Inc. (Class C Stock) | | Interactive Media & Services | | 1.7% |
For a complete list of holdings, please refer to the Schedule of Investments section of this report. Holdings reflect only long-term investments.
| | |
The Prudential Series Fund, PSF PGIM Total Return Bond Portfolio | | December 31, 2021 |
Report of the Investment Manager - As of December 31, 2021 (Unaudited)
| | | | | | | | | | | | | | | | | | | | |
| | | Average Annual Total Returns | | | 1 Year | | | | 5 Years | | | | 10 Years | | | | Since Inception | | | $10,000 INVESTED OVER 10 YEARS 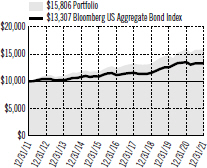
|
| | | Portfolio: Class I | | | -0.76 | % | | | 4.98 | % | | | 4.68 | % | | | — | |
| | | Portfolio: Class III | | | N/A | | | | N/A | | | | N/A | | | | 1.89 | |
| | | Bloomberg US Aggregate Bond Index | | | -1.54 | | | | 3.57 | | | | 2.90 | | | | — | |
| | | Past performance does not guarantee future returns. The investment return and principal value of an investment will fluctuate, so that shares, when redeemed, may be worth more or less than their original cost. Current performance may be lower or higher than the past performance. | |
| | | Portfolio Class III inception: 04/26/2021. Portfolio performance is net of fund expenses, but not contract charges, which, if included, would significantly lower the performance quoted. Performance figures may reflect fee waivers and/or expense reimbursements. In the absence of such fee waivers and/or expense reimbursements, performance would be lower. Unless noted otherwise, Index returns are based on the Portfolio’s Class I shares. | |
| | | The graph is based on the performance of Class I shares. Performance of Class III shares will be lower due to differences in the fee structure. Class III shares have associated 12b-1 fees at an annual rate of 0.25%, of the average daily net assets of the Class III shares. |
For the year ended December 31, 2021, the PSF PGIM Total Return Bond Portfolio Class I shares returned -0.76%. The Portfolio’s Class I shares outperformed the Bloomberg US Aggregate Bond Index.
What were the market conditions during the reporting period?
The strong global rebound from the depths of the COVID-19 pandemic continued throughout much of calendar-year 2021 (the reporting period), as economies continued to respond to monetary and fiscal stimulus. The effective rollout of COVID-19 vaccines, along with clear messaging from both President Biden and the Federal Reserve (the Fed) on the potential for further stimulus, shifted the prospects for growth and inflation in the first half of the period, kicking off a robust “reflation trade” in bond markets. This caused the US Treasury yield curve to steepen sharply over the first half of the period before flattening again in the second half of the period, as the market pulled forward its expectation for interest rate hikes. (A yield curve is a line graph that illustrates the relationship between the yields and maturities of fixed income securities. It is created by plotting the yields of different maturities for the same type of bonds.)
While the yield on the 2-year Treasury note rose sharply in the fourth quarter of the period as markets began pricing in three interest rate hikes in 2022, long-end Treasury yields declined amid uncertainty around the Omicron COVID-19 variant and the prospect of slower economic growth. Despite steepening over the first half of the period, the US Treasury yield curve flattened slightly over the full period, with the 10-year/2-year Treasury spread declining from 0.80% to 0.78% as of December 31, 2021.
Mortgage-backed securities (MBS) posted negative returns amid increased supply and concerns around the Fed’s tapering of its asset purchases. The US investment-grade corporate bond market underperformed, with spreads tightening to near-historic levels in the second quarter of the period, supported by better-than-expected corporate earnings and favorable technicals, before widening in the second half of the period amid concerns around inflation, Omicron, and elevated new issuance. Strengthening fundamentals generally kept securitized credit on a tightening trajectory as well, with high-quality commercial mortgage-backed securities (CMBS) and collateralized loan obligation (CLO) spreads trading below their pre-pandemic levels at the end of the period. US high yield bond spreads generally tightened as fundamentals remained supportive. Meanwhile, emerging market debt spreads widened over the period amid an increasingly uncertain macroeconomic backdrop and a strong US dollar.
What strategies or holdings affected the Portfolio’s performance?*
During the period, individual issue selection and sector allocation both contributed to the Portfolio’s outperformance. Strong sector allocation was highlighted by overweights to high yield, CLOs, CMBS, bank loans, municipal bonds, and asset-backed securities (ABS). An underweight to MBS also contributed. An overweight to investment-grade corporates was a modest detractor. Within security selection, selection in high yield bonds, investment-grade corporate bonds, non-agency MBS, CMBS, emerging market debt, ABS, CLOs, sovereigns, and municipal bonds was positive. This was partially offset by selection in Treasuries, interest rate swaps, and bank loans, which detracted from performance. Within credit, the Portfolio benefited from positions in upstream and midstream energy, foreign non-corporates, and gaming/lodging/leisure. Selection in healthcare & pharmaceuticals, media & entertainment, and
For a complete list of holdings, please refer to the Schedule of Investments section of this report. Holdings reflect only long-term investments.
| | |
The Prudential Series Fund, PSF PGIM Total Return Bond Portfolio | | December 31, 2021 |
Report of the Investment Manager - As of December 31, 2021 (Unaudited) (Continued)
consumer non-cyclicals detracted. The Portfolio’s duration positioning and yield curve positioning detracted from performance over the period. Duration is a measure of a bond’s price sensitivity to interest rate changes over time.
During the period, the Portfolio used interest rate swaps to help manage duration and yield curve exposure. In aggregate, the use of interest rate swaps had a negative impact on performance during the period. In addition, the Portfolio used futures to manage interest rate risk, a more efficient way of managing interest rate risk than through the purchase and sale of cash bonds. The use of futures had a negligible impact on performance for the period. The Portfolio also used credit derivatives in the form of the Credit Default Swap Index (CDX) to manage credit risk. The use of CDX detracted from performance for the period.
*This strategy and performance overview, which discusses what strategies or holdings (including derivatives, if applicable) affected the Portfolio’s performance, is compiled based on how the Portfolio performed relative to the Portfolio’s assigned index and is viewed for performance attribution purposes at the aggregate Portfolio level, which in most instances will not directly correlate to the amounts disclosed in the Statement of Operations which conform to U.S. generally accepted accounting principles.
Presentation of Portfolio Holdings — unaudited
| | | | |
PSF PGIM Total Return Bond Portfolio (As of 12/31/2021) | |
Credit Quality | | | % of Total Investments | |
AAA | | | 41.2% | |
AA | | | 2.7% | |
A | | | 10.9% | |
BBB | | | 20.4% | |
BB | | | 10.4% | |
B | | | 4.3% | |
CCC | | | 1.5% | |
CC | | | 0.1% | |
NR | | | 7.7% | |
Cash/Cash Equivalents | | | 0.8% | |
Total Investments | | | 100.0% | |
Credit ratings reflect the middle rating assigned by a nationally recognized statistical rating organization (NRSRO) such as Moody’s Investor Service, Inc. (Moody’s), S&P Global Ratings (S&P), or Fitch, Inc. (Fitch). Credit ratings reflect the common nomenclature used by both S&P and Fitch. Where applicable, ratings are converted to the comparable S&P/Fitch rating tier nomenclature. These rating agencies are independent, and are widely used. The Not Rated (NR) category consists of securities that have not been rated by a NRSRO. Ratings category may include derivative instruments that could have a negative value. Credit ratings are subject to change.
| | |
The Prudential Series Fund, PSF Stock Index Portfolio | | December 31, 2021 |
Report of the Investment Manager - As of December 31, 2021 (Unaudited)
| | | | | | | | | | | | | | | | | | | | |
| | | Average Annual Total Returns | | | 1 Year | | | | 5 Years | | | | 10 Years | | | | Since Inception | | | $10,000 INVESTED OVER 10 YEARS 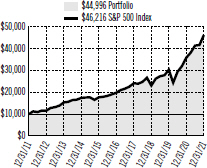
|
| | | Portfolio: Class I | | | 28.28 | % | | | 18.13 | % | | | 16.23 | % | | | — | |
| | | Portfolio: Class III | | | N/A | | | | N/A | | | | N/A | | | | 14.67 | |
| | | S&P 500 Index | | | 28.70 | | | | 18.47 | | | | 16.54 | | | | — | |
| | | Past performance does not guarantee future returns. The investment return and principal value of an investment will fluctuate, so that shares, when redeemed, may be worth more or less than their original cost. Current performance may be lower or higher than the past performance. | |
| | | Portfolio Class III inception: 04/26/2021. Portfolio performance is net of fund expenses, but not contract charges, which, if included, would significantly lower the performance quoted. Performance figures may reflect fee waivers and/or expense reimbursements. In the absence of such fee waivers and/or expense reimbursements, performance would be lower. Unless noted otherwise, Index returns are based on the Portfolio’s Class I shares. | |
| | | The graph is based on the performance of Class I shares. Performance of Class III shares will be lower due to differences in the fee structure. Class III shares have associated 12b-1 fees at an annual rate of 0.25%, of the average daily net assets of the Class III shares. |
For the year ended December 31, 2021, the PSF Stock Index Portfolio Class I shares returned 28.28%. The Portfolio’s Class I shares underperformed the S&P 500 Index.
What were the market conditions during the reporting period?
Calendar-year 2021 (the reporting period) was characterized by a stable first half as global economies recovered, before growth slowed in the third quarter on supply-chain disruptions and the increased spread of COVID-19. However, various economic indicators maintained strength through the final quarter of the period, which provided a tailwind for risk assets and helped US equities cap a third year of double-digit gains, despite the ongoing global pandemic and the economic disruptions it caused. Swift medical developments, including the global rollout of COVID-19 vaccines, as well as extraordinary fiscal and monetary stimulus unleashed by global economies, contributed to these gains.
What strategies or holdings affected the Portfolio’s performance?*
Potential tracking-error differences (i.e., the difference between the return of the Portfolio and that of the Index), brokerage costs, and other Portfolio costs and expenses caused the Portfolio’s return to slightly trail the return of its benchmark, the S&P 500 Index (the Index) during the reporting period.
In terms of positions, Microsoft Corp.and Apple Inc. were the largest contributors to Portfolio performance, while The Walt Disney Co. was the largest detractor.
The Portfolio closely tracked the Index during the period. Most of the buy or sell trades and trades made to increase or decrease the number of shares held in a position were traded market-on-close, or as close as possible to the end of the market day, to more closely track the Index. Securities-lending income consistently added to Portfolio returns. The income was greater for small-cap equities because it is often more difficult to borrow shares of some of the small-cap stocks, which are not typically as widely traded as large-cap stocks.
The Portfolio had a small exposure to derivative instruments during the period to help enhance liquidity, but the position did not have a material impact on performance.
*This strategy and performance overview, which discusses what strategies or holdings (including derivatives, if applicable) affected the Portfolio’s performance, is compiled based on how the Portfolio performed relative to the Portfolio’s assigned index and is viewed for performance attribution purposes at the aggregate Portfolio level, which in most instances will not directly correlate to the amounts disclosed in the Statement of Operations which conform to U.S. generally accepted accounting principles.
For a complete list of holdings, please refer to the Schedule of Investments section of this report. Holdings reflect only long-term investments.
| | |
The Prudential Series Fund, PSF Stock Index Portfolio | | December 31, 2021 |
Report of the Investment Manager - As of December 31, 2021 (Unaudited) (Continued)
Presentation of Portfolio Holdings — unaudited
| | | | | | |
PSF Stock Index Portfolio (As of 12/31/2021) | | | | | | |
| | |
Ten Largest Holdings | | Line of Business | | | % of Net Assets | |
Apple, Inc. | | Technology Hardware, Storage & Peripherals | | | 6.7% | |
Microsoft Corp. | | Software | | | 6.1% | |
Amazon.com, Inc. | | Internet & Direct Marketing Retail | | | 3.5% | |
Alphabet, Inc. (Class A Stock) | | Interactive Media & Services | | | 2.1% | |
Tesla, Inc. | | Automobiles | | | 2.1% | |
Alphabet, Inc. (Class C Stock) | | Interactive Media & Services | | | 1.9% | |
Meta Platforms, Inc. (Class A Stock) | | Interactive Media & Services | | | 1.9% | |
NVIDIA Corp. | | Semiconductors & Semiconductor Equipment | | | 1.8% | |
Berkshire Hathaway, Inc. (Class B Stock) | | Diversified Financial Services | | | 1.3% | |
UnitedHealth Group, Inc. | | Health Care Providers & Services | | | 1.1% | |
For a complete list of holdings, please refer to the Schedule of Investments section of this report. Holdings reflect only long-term investments.
| | |
The Prudential MEDLEY Program Benchmark Glossary — unaudited | | December 31, 2021 |
The indexes are unmanaged and include reinvestment of any income or distributions. They do not reflect any fees, expenses or sales charges. Investors cannot invest directly in a market index.
Bloomberg Government Bond Index is a weighted unmanaged index comprised of securities issued or backed by the US Government, its agencies, and instrumentalities with a remaining maturity of one to 30 years.
Bloomberg US Aggregate Bond Index is an unmanaged index comprised of more than 5,000 government and corporate bonds.
Lipper US Government Money Market Index invests principally in financial instruments issued or guaranteed by the US government, its agencies, or its instrumentalities, with dollar-weighted average maturities of less than 90 days.
Lipper Variable Insurance Products (VIP) Funds Average is calculated by Lipper Analytical Services, Inc., and reflects the investment return of certain portfolios underlying variable life and annuity products. Returns for the Lipper Average reflect the deduction of operating expenses.
MSCI World Index (GD) — The Morgan Stanley Capital International World Index is an unmanaged capitalization weighted index which includes the equity markets of Australia, Austria, Belgium, Canada, Denmark, Finland, France, Germany, Hong Kong, Ireland, Italy, Japan, Malaysia, Netherlands, New Zealand, Norway, Singapore, Spain, Sweden, Switzerland, United Kingdom, and United States. The GD version does not reflect the impact of withholding taxes on reinvested dividends.
PSF PGIM 50/50 Balanced Portfolio Blended Index consists of the S&P 500 Index (50%), an unmanaged, market value-weighted index of over 500 stocks generally representative of the broad stock market, Bloomberg US Aggregate Bond Index (40%), an unmanaged index comprised of more than 5,000 government and corporate bonds, and the FTSE 3-Month T-Bill Index (10%), an unmanaged market value-weighted index of investment grade fixed rate public obligations of the U.S.Treasury with maturities of three months, excluding zero coupon strips.
PSF PGIM Flexible Managed Portfolio Blended Index consists of the S&P 500 Index (60%), an unmanaged, market value-weighted index of over 500 stocks generally representative of the broad stock market, Bloomberg U.S. Aggregate Bond Index (35%), an unmanaged index comprised of more than 5,000 government and corporate bonds, and the FTSE 3-Month T-Bill Index (5%), an unmanaged market value-weighted index of investment grade fixed rate public obligations of the U.S. Treasury with maturities of three months, excluding zero coupon strips.
Russell 1000® Index is an unmanaged market cap-weighted index that measures the performance of the 1,000 largest companies in the Russell 3000 Index, which represents approximately 92% of the total market.
S&P 500 Index is an unmanaged, market value-weighted index of over 500 stocks generally representative of the broad stock market.
For Russell Indexes: Russell Investment Group is the source and owner of the trademarks, service marks and copyrights related to the Russell Indexes. Russell® is a trademark of Russell Investment Group.
The S&P 500 index is a product of S&P Dow Jones Indices LLC and/or its affiliates and has been licensed for use by PGIM, Inc. and/or its affiliates. Copyright © 2022 S&P Dow Jones Indices LLC, a division of S&P Global, Inc., and/or its affiliates. All rights reserved. Redistribution or reproduction in whole or in part are prohibited without written permission of S&P Dow Jones Indices LLC. For more information on any of S&P Dow Jones Indices LLC’s indices please visit www.spdji.com. S&P® is a registered trademark of S&P Global and Dow Jones® is a registered trademark of Dow Jones Trademark Holdings LLC.
The PSF PGIM 50/50 Balanced Portfolio Blended Index and the PSF PGIM Flexible Managed Portfolio Blended Index are calculated by PGIM, Inc. and/or its affiliates with permission from S&P Dow Jones Indices LLC and/or its affiliates. Neither S&P Dow Jones Indices LLC, Dow Jones Trademark Holdings LLC, their affiliates nor their third party licensors make any representation or warranty, express or implied, as to the ability of any index, including the PSF PGIM 50/50 Balanced Portfolio Blended Index and the PSF PGIM Flexible Managed Portfolio Blended Index, to accurately represent the asset class or market sector that it purports to represent and neither S&P Dow Jones Indices LLC, Dow Jones Trademark Holdings LLC, their affiliates nor their third party licensors shall have any liability for any errors, omissions, or interruptions of any index, including the PSF PGIM 50/50 Balanced Portfolio Blended Index and the PSF PGIM Flexible Managed Portfolio Blended Index, or the data included therein.
| | |
The Prudential Series Fund Fees and Expenses — unaudited | | December 31, 2021 |
As a contract owner investing in Portfolios of the Fund through a variable annuity or variable life contract, you incur ongoing costs, including management fees, and other Portfolio expenses. This example is intended to help you understand your ongoing costs (in dollars) of investing in the Fund and to compare these costs with the ongoing costs of investing in other investment options. This example does not reflect fees and charges under your variable annuity or variable life contract. If contract charges were included, the costs shown below would be higher. Please consult the prospectus for your contract for more information about contract fees and charges.
The example is based on an investment of $1,000 invested at the beginning of the period and held for the entire period July 1, 2021 through December 31, 2021.
Actual Expenses
The first line of the table below provides information about actual account values and actual expenses. You may use this information, together with the amount you invested, to estimate the Portfolio expenses that you paid over the period. Simply divide your account value by $1,000 (for example, an $8,600 account value divided by $1,000 = 8.6), then multiply the result by the number in the first line under the heading entitled “Expenses Paid During the Six-Month Period” to estimate the Portfolio expenses you paid on your account during this period. As noted above, the table does not reflect variable contract fees and charges.
Hypothetical Example for Comparison Purposes
The second line of the table below provides information about hypothetical account values and hypothetical expenses based on the Portfolio’s actual expense ratio and an assumed rate of return of 5% per year before expenses, which is not the Portfolio’s actual return. The hypothetical account values and expenses may not be used to estimate the actual ending account balance or expenses you paid for the period. You may use this information to compare the ongoing costs of investing in the Portfolio and other investment options. To do so, compare this 5% hypothetical example with the 5% hypothetical examples that appear in the shareholder reports of the other investment options.
Please note that the expenses shown in the table are meant to highlight your ongoing Portfolio costs only and do not reflect any contract fees and charges, such as sales charges (loads), insurance charges or administrative charges. Therefore the second line of the table is useful to compare ongoing investment option costs only, and will not help you determine the relative total costs of owning different contracts. In addition, if these contract fees and charges were included, your costs would have been higher.
| | | | | | | | | | |
| the Prudential Series Fund Portfolios | | | | Beginning
Account Value
July 1, 2021 | | Ending
Account Value
December 31, 2021 | | Annualized Expense
Ratio Based on the
Six-Month Period | | Expenses Paid
During the
Six-Month Period* |
PSF Global (Class I) | | Actual | | $1,000.00 | | $1,044.29 | | 0.74% | | $3.81 |
| | | Hypothetical | | $1,000.00 | | $1,021.48 | | 0.74% | | $3.77 |
PSF Global (Class III) | | Actual | | $1,000.00 | | $1,043.03 | | 0.99% | | $5.10 |
| | | Hypothetical | | $1,000.00 | | $1,020.21 | | 0.99% | | $5.04 |
PSF PGIM 50/50 Balanced (Class I) | | Actual | | $1,000.00 | | $1,058.43 | | 0.56% | | $2.91 |
| | | Hypothetical | | $1,000.00 | | $1,022.38 | | 0.56% | | $2.85 |
PSF PGIM 50/50 Balanced (Class III) | | Actual | | $1,000.00 | | $1,057.13 | | 0.81% | | $4.20 |
| | | Hypothetical | | $1,000.00 | | $1,021.12 | | 0.81% | | $4.13 |
PSF PGIM Flexible Managed (Class I) | | Actual | | $1,000.00 | | $1,064.38 | | 0.61% | | $3.17 |
| | | Hypothetical | | $1,000.00 | | $1,022.13 | | 0.61% | | $3.11 |
PSF PGIM Flexible Managed (Class III) | | Actual | | $1,000.00 | | $1,062.97 | | 0.86% | | $4.47 |
| | | Hypothetical | | $1,000.00 | | $1,020.87 | | 0.86% | | $4.38 |
PSF PGIM Government Income (Class I) | | Actual | | $1,000.00 | | $ 992.23 | | 0.46% | | $2.31 |
| | | Hypothetical | | $1,000.00 | | $1,022.89 | | 0.46% | | $2.35 |
PSF PGIM Government Income (Class III) | | Actual | | $1,000.00 | | $ 990.82 | | 0.69% | | $3.46 |
| | | Hypothetical | | $1,000.00 | | $1,021.73 | | 0.69% | | $3.52 |
PSF PGIM Government Money Market (Class I) | | Actual | | $1,000.00 | | $1,000.44 | | 0.05% | | $0.25 |
| | | Hypothetical | | $1,000.00 | | $1,024.95 | | 0.05% | | $0.26 |
| | |
The Prudential Series Fund Fees and Expenses — unaudited (continued) | | December 31, 2021 |
| | | | | | | | | | |
| the Prudential Series Fund Portfolios | | | | Beginning
Account Value
July 1, 2021 | | Ending
Account Value
December 31, 2021 | | Annualized Expense
Ratio Based on the
Six-Month Period | | Expenses Paid
During the
Six-Month Period* |
| | | | | |
PSF PGIM Government Money Market (Class III) | | Actual | | $1,000.00 | | $1,000.44 | | 0.05% | | $0.25 |
| | | Hypothetical | | $1,000.00 | | $1,024.95 | | 0.05% | | $0.26 |
| | | | | |
PSF PGIM Jennison Blend (Class I) | | Actual | | $1,000.00 | | $1,074.02 | | 0.46% | | $2.40 |
| | | Hypothetical | | $1,000.00 | | $1,022.89 | | 0.46% | | $2.35 |
| | | | | |
PSF PGIM Jennison Blend (Class II) | | Actual | | $1,000.00 | | $1,071.84 | | 0.86% | | $4.49 |
| | | Hypothetical | | $1,000.00 | | $1,020.87 | | 0.86% | | $4.38 |
| | | | | |
PSF PGIM Jennison Blend (Class III) | | Actual | | $1,000.00 | | $1,072.63 | | 0.70% | | $3.66 |
| | | Hypothetical | | $1,000.00 | | $1,021.68 | | 0.70% | | $3.57 |
| | | | | |
PSF PGIM Total Return Bond (Class I) | | Actual | | $1,000.00 | | $1,003.20 | | 0.42% | | $2.12 |
| | | Hypothetical | | $1,000.00 | | $1,023.09 | | 0.42% | | $2.14 |
| | | | | |
PSF PGIM Total Return Bond (Class III) | | Actual | | $1,000.00 | | $1,002.56 | | 0.67% | | $3.38 |
| | | Hypothetical | | $1,000.00 | | $1,021.83 | | 0.67% | | $3.41 |
| | | | | |
PSF Stock Index (Class I) | | Actual | | $1,000.00 | | $1,114.91 | | 0.29% | | $1.55 |
| | | Hypothetical | | $1,000.00 | | $1,023.74 | | 0.29% | | $1.48 |
| | | | | |
| PSF Stock Index (Class III) | | Actual | | $1,000.00 | | $1,113.47 | | 0.54% | | $2.88 |
| | | Hypothetical | | $1,000.00 | | $1,022.48 | | 0.54% | | $2.75 |
* Portfolio expenses (net of fee waivers or subsidies, if any) are equal to the annualized expense ratio (provided in the table), multiplied by the average account value over the period, multiplied by the 184 days in the six-month period ended December 31, 2021, and divided by the 365 days in the Portfolio’s fiscal year ended December 31, 2021 (to reflect the six-month period). Expenses presented in the table include the expenses of any underlying portfolios in which the Portfolio may invest.
The following abbreviations are used in the Portfolios’ descriptions:
| | |
| AUD | | Australian Dollar |
| BRL | | Brazilian Real |
| CAD | | Canadian Dollar |
| CLP | | Chilean Peso |
| COP | | Colombian Peso |
| EUR | | Euro |
| GBP | | British Pound |
| HUF | | Hungarian Forint |
| MXN | | Mexican Peso |
| NZD | | New Zealand Dollar |
| PLN | | Polish Zloty |
| USD | | US Dollar |
| ZAR | | South African Rand |
|
144A — Security was purchased pursuant to Rule 144A under the Securities Act of 1933 and, pursuant to the requirements of Rule 144A, may not be resold except to qualified institutional buyers. |
A — Annual payment frequency for swaps |
ABS — Asset-Backed Security |
Aces — Alternative Credit Enhancements Securities |
ADR — American Depositary Receipt |
BABs — Build America Bonds |
BBR — New Zealand Bank Bill Rate |
bps — Basis Points |
BROIS — Brazil Overnight Index Swap |
BUBOR — Budapest Interbank Offered Rate |
CDX — Credit Derivative Index |
CLO — Collateralized Loan Obligation |
CLOIS — Sinacofi Chile Interbank Rate Average |
COOIS — Colombia Overnight Interbank Reference Rate |
CPI — Consumer Price Index |
CVA — Certificate Van Aandelen (Bearer) |
CVT — Convertible Security |
EAFE — Europe, Australasia, Far East |
EMTN — Euro Medium Term Note |
ETF — Exchange-Traded Fund |
|
EURIBOR — Euro Interbank Offered Rate |
FHLMC — Federal Home Loan Mortgage Corporation |
FNMA — Federal National Mortgage Association |
GDR — Global Depositary Receipt |
GMTN — Global Medium Term Note |
GNMA — Government National Mortgage Association |
IO — Interest Only (Principal amount represents notional) |
iTraxx — International Credit Derivative Index |
JIBAR — Johannesburg Interbank Agreed Rate |
LIBOR — London Interbank Offered Rate |
LP — Limited Partnership |
M — Monthly payment frequency for swaps |
MSCI — Morgan Stanley Capital International |
MTN — Medium Term Note |
NSA — Non-Seasonally Adjusted |
OTC — Over-the-counter |
PIK — Payment-in-Kind |
PJSC — Public Joint-Stock Company |
PRFC — Preference Shares |
Q — Quarterly payment frequency for swaps |
REITs — Real Estate Investment Trust |
REMICS — Real Estate Mortgage Investment Conduit Security |
S — Semiannual payment frequency for swaps |
S&P — Standard & Poor’s |
SOFR — Secured Overnight Financing Rate |
SONIA — Sterling Overnight Index Average |
SPDR — Standard & Poor’s Depositary Receipts |
STRIPs — Separate Trading of Registered Interest and Principal of Securities |
T — Swap payment upon termination |
TBA — To Be Announced |
USAID — United States Agency for International Development |
USOIS — United States Overnight Index Swap |
WIBOR — Warsaw Interbank Offered Rate |
SEE NOTES TO FINANCIAL STATEMENTS
A1
| | | | | | |
| |
| SCHEDULE OF INVESTMENTS | | as of December 31, 2021 |
| | | | | | | | |
| | | Shares | | | Value | |
LONG-TERM INVESTMENTS — 97.5% | | | | | |
COMMON STOCKS — 97.3% | | | | | | | | |
Argentina — 0.2% | | | | | | | | |
MercadoLibre, Inc.* | | | 1,751 | | | $ | 2,361,048 | |
| | | | | | | | |
Australia — 1.1% | | | | | | | | |
AGL Energy Ltd. | | | 66,200 | | | | 296,033 | |
Aristocrat Leisure Ltd. | | | 137,683 | | | | 4,364,838 | |
Australia & New Zealand Banking | | | | | | | | |
Group Ltd. | | | 61,200 | | | | 1,224,938 | |
Beach Energy Ltd. | | | 395,200 | | | | 362,996 | |
BHP Group Ltd.(a) | | | 42,090 | | | | 1,272,447 | |
Fortescue Metals Group Ltd. | | | 163,200 | | | | 2,285,569 | |
Harvey Norman Holdings Ltd. | | | 258,700 | | | | 929,609 | |
Inghams Group Ltd. | | | 420,300 | | | | 1,073,130 | |
Metcash Ltd. | | | 412,500 | | | | 1,351,764 | |
Perenti Global Ltd. | | | 432,300 | | | | 290,903 | |
Rio Tinto Ltd. | | | 20,600 | | | | 1,504,323 | |
Service Stream Ltd. | | | 343,700 | | | | 201,273 | |
St. Barbara Ltd. | | | 343,600 | | | | 365,027 | |
Stockland, REIT | | | 279,500 | | | | 861,993 | |
Super Retail Group Ltd. | | | 105,600 | | | | 957,264 | |
| | | | | | | | |
| | |
| | | | | | | 17,342,107 | |
| | | | | | | | |
Austria — 0.3% | | | | | | | | |
BAWAG Group AG, 144A* | | | 16,000 | | | | 983,978 | |
OMV AG | | | 33,700 | | | | 1,916,458 | |
Wienerberger AG | | | 26,400 | | | | 971,991 | |
| | | | | | | | |
| | |
| | | | | | | 3,872,427 | |
| | | | | | | | |
Belgium — 0.2% | | | | | | | | |
Bekaert SA | | | 22,500 | | | | 1,003,156 | |
Telenet Group Holding NV | | | 23,500 | | | | 858,803 | |
UCB SA | | | 6,800 | | | | 778,298 | |
| | | | | | | | |
| | |
| | | | | | | 2,640,257 | |
| | | | | | | | |
Brazil — 0.1% | | | | | | | | |
Yara International ASA | | | 18,800 | | | | 948,521 | |
| | | | | | | | |
Canada — 2.0% | | | | | | | | |
Canadian National Railway Co. | | | 43,200 | | | | 5,306,467 | |
Magna International, Inc. | | | 51,202 | | | | 4,144,290 | |
Shopify, Inc. (Class A Stock)* | | | 12,273 | | | | 16,904,708 | |
TC Energy Corp. | | | 77,063 | | | | 3,586,512 | |
| | | | | | | | |
| | |
| | | | | | | 29,941,977 | |
| | | | | | | | |
China — 2.4% | | | | | | | | |
Alibaba Group Holding Ltd.* | | | 186,844 | | | | 2,804,369 | |
China Resources Cement Holdings Ltd. | | | 1,042,000 | | | | 786,790 | |
Kingboard Holdings Ltd. | | | 216,000 | | | | 1,051,370 | |
Lee & Man Paper Manufacturing Ltd. | | | 1,049,000 | | | | 728,948 | |
NXP Semiconductors NV | | | 105,433 | | | | 24,015,529 | |
Tencent Holdings Ltd. | | | 72,300 | | | | 4,201,940 | |
Wilmar International Ltd. | | | 203,400 | | | | 626,957 | |
Wuxi Biologics Cayman, Inc., 144A* | | | 158,000 | | | | 1,895,242 | |
| | | | | | | | |
| | |
| | | | | | | 36,111,145 | |
| | | | | | | | |
Denmark — 1.3% | | | | | | | | |
AP Moller - Maersk A/S (Class B Stock) | | | 400 | | | | 1,435,027 | |
Chr Hansen Holding A/S | | | 20,115 | | | | 1,587,139 | |
| | | | | | | | |
| | | Shares | | | Value | |
COMMON STOCKS (continued) | | | | | | | | |
Denmark (cont’d.) | | | | | | | | |
Coloplast A/S (Class B Stock) | | | 20,270 | | | $ | 3,563,747 | |
D/S Norden A/S | | | 32,500 | | | | 828,365 | |
Danske Bank A/S | | | 61,200 | | | | 1,056,143 | |
DSV A/S | | | 14,518 | | | | 3,392,321 | |
Jyske Bank A/S* | | | 19,600 | | | | 1,009,398 | |
Novo Nordisk A/S (Class B Stock) | | | 48,666 | | | | 5,479,408 | |
Orsted A/S, 144A | | | 17,187 | | | | 2,206,825 | |
| | | | | | | | |
| | |
| | | | | | | 20,558,373 | |
| | | | | | | | |
Finland — 0.4% | | | | | | | | |
Neste OYJ | | | 53,667 | | | | 2,650,325 | |
Nokia OYJ* | | | 236,600 | | | | 1,491,475 | |
Nordea Bank Abp | | | 83,600 | | | | 1,021,374 | |
Valmet OYJ | | | 27,100 | | | | 1,161,503 | |
| | | | | | | | |
| | |
| | | | | | | 6,324,677 | |
| | | | | | | | |
France — 4.5% | | | | | | | | |
Airbus SE* | | | 53,508 | | | | 6,853,801 | |
Arkema SA | | | 8,700 | | | | 1,227,375 | |
AXA SA | | | 54,100 | | | | 1,615,412 | |
BNP Paribas SA | | | 28,200 | | | | 1,950,502 | |
Bouygues SA | | | 33,300 | | | | 1,194,307 | |
Capgemini SE | | | 4,000 | | | | 981,070 | |
Carrefour SA | | | 89,600 | | | | 1,642,399 | |
Cie de Saint-Gobain | | | 15,800 | | | | 1,113,189 | |
Cie Generale des Etablissements Michelin SCA | | | 5,600 | | | | 918,356 | |
CNP Assurances | | | 55,200 | | | | 1,367,738 | |
Credit Agricole SA | | | 78,500 | | | | 1,121,520 | |
Faurecia SE | | | 1,269 | | | | 60,357 | |
Ipsen SA | | | 7,557 | | | | 692,110 | |
L’Oreal SA | | | 8,453 | | | | 4,013,182 | |
LVMH Moet Hennessy Louis Vuitton SE | | | 10,114 | | | | 8,364,965 | |
Nexity SA | | | 13,100 | | | | 616,578 | |
Orange SA | | | 140,000 | | | | 1,499,031 | |
Rubis SCA | | | 22,100 | | | | 660,497 | |
Safran SA | | | 39,176 | | | | 4,791,653 | |
Sanofi | | | 31,700 | | | | 3,191,947 | |
Sartorius Stedim Biotech | | | 6,400 | | | | 3,514,978 | |
Societe BIC SA | | | 15,900 | | | | 856,799 | |
Societe Generale SA | | | 28,600 | | | | 983,836 | |
Sopra Steria Group SACA | | | 7,100 | | | | 1,272,476 | |
Teleperformance | | | 6,242 | | | | 2,779,853 | |
TotalEnergies SE | | | 58,800 | | | | 2,988,592 | |
TotalEnergies SE, ADR(a) | | | 250,169 | | | | 12,373,359 | |
| | | | | | | | |
| | |
| | | | | | | 68,645,882 | |
| | | | | | | | |
Germany — 2.1% | | | | | | | | |
Allianz SE | | | 6,300 | | | | 1,485,808 | |
Aurubis AG | | | 10,800 | | | | 1,082,281 | |
Bayer AG | | | 23,300 | | | | 1,247,101 | |
Bayerische Motoren Werke AG | | | 15,630 | | | | 1,566,883 | |
Daimler AG | | | 17,600 | | | | 1,352,236 | |
Daimler Truck Holding AG* | | | 8,800 | | | | 323,507 | |
Deutsche Post AG | | | 43,900 | | | | 2,816,558 | |
Deutsche Telekom AG | | | 45,300 | | | | 838,724 | |
Fresenius SE & Co. KGaA | | | 18,600 | | | | 748,149 | |
SEE NOTES TO FINANCIAL STATEMENTS.
A2
| | | | | | |
| | |
| | PSF GLOBAL PORTFOLIO (CONTINUED) | | |
| | | | | | |
| |
| SCHEDULE OF INVESTMENTS | | as of December 31, 2021 |
| | | | | | | | |
| | | Shares | | | Value | |
COMMON STOCKS (continued) | |
Germany (cont’d.) | | | | | | | | |
HOCHTIEF AG | | | 8,600 | | | $ | 695,358 | |
Infineon Technologies AG | | | 122,727 | | | | 5,668,530 | |
Muenchener Rueckversicherungs-Gesellschaft AG in Muenchen | | | 2,600 | | | | 768,879 | |
Rational AG | | | 3,190 | | | | 3,265,067 | |
Rheinmetall AG | | | 12,300 | | | | 1,159,742 | |
Siemens AG, ADR | | | 57,659 | | | | 4,993,269 | |
Siltronic AG | | | 8,900 | | | | 1,422,895 | |
United Internet AG | | | 18,400 | | | | 728,186 | |
Volkswagen AG | | | 7,100 | | | | 2,088,636 | |
| | | | | | | | |
| | |
| | | | | | | 32,251,809 | |
| | | | | | | | |
Hong Kong — 0.4% | | | | | | | | |
AIA Group Ltd. | | | 340,000 | | | | 3,428,072 | |
PAX Global Technology Ltd. | | | 933,000 | | | | 662,099 | |
Tongda Group Holdings Ltd.* | | | 8,180,000 | | | | 262,370 | |
WH Group Ltd., 144A | | | 1,173,500 | | | | 735,581 | |
Xinyi Glass Holdings Ltd. | | | 328,000 | | | | 819,770 | |
Yue Yuen Industrial Holdings Ltd.* | | | 296,500 | | | | 496,181 | |
| | | | | | | | |
| | |
| | | | | | | 6,404,073 | |
| | | | | | | | |
India — 0.7% | | | | | | | | |
HDFC Bank Ltd., ADR | | | 70,154 | | | | 4,564,921 | |
Reliance Industries Ltd., 144A, GDR | | | 89,960 | | | | 5,772,241 | |
| | | | | | | | |
| | |
| | | | | | | 10,337,162 | |
| | | | | | | | |
Ireland — 0.8% | | | | | | | | |
ICON PLC* | | | 10,985 | | | | 3,402,055 | |
Kingspan Group PLC | | | 42,767 | | | | 5,110,214 | |
Ryanair Holdings PLC, ADR* | | | 33,406 | | | | 3,418,436 | |
| | | | | | | | |
| | |
| | | | | | | 11,930,705 | |
| | | | | | | | |
Israel — 0.2% | | | | | | | | |
Check Point Software Technologies Ltd.* | | | 9,500 | | | | 1,107,320 | |
Wix.com Ltd.* | | | 12,829 | | | | 2,024,288 | |
| | | | | | | | |
| | |
| | | | | | | 3,131,608 | |
| | | | | | | | |
Italy — 0.4% | | | | | | | | |
A2A SpA | | | 546,200 | | | | 1,066,150 | |
Enel SpA | | | 103,800 | | | | 831,168 | |
Leonardo SpA* | | | 97,000 | | | | 691,085 | |
Mediobanca Banca di Credito Finanziario SpA | | | 87,600 | | | | 1,006,442 | |
Piaggio & C SpA | | | 29,922 | | | | 97,876 | |
Pirelli & C SpA, 144A | | | 171,800 | | | | 1,193,823 | |
UnipolSai Assicurazioni SpA | | | 253,700 | | | | 714,043 | |
| | | | | | | | |
| | |
| | | | | | | 5,600,587 | |
| | | | | | | | |
Japan — 4.8% | | | | | | | | |
Aozora Bank Ltd. | | | 36,000 | | | | 787,726 | |
Asahi Intecc Co. Ltd. | | | 44,500 | | | | 954,893 | |
Astellas Pharma, Inc. | | | 46,000 | | | | 748,344 | |
Brother Industries Ltd. | | | 44,300 | | | | 853,364 | |
Credit Saison Co. Ltd. | | | 42,600 | | | | 447,894 | |
Dai-ichi Life Holdings, Inc. | | | 39,900 | | | | 806,293 | |
Daikin Industries Ltd. | | | 19,300 | | | | 4,366,320 | |
| | | | | | | | |
| | | Shares | | | Value | |
COMMON STOCKS (continued) | | | | | | | | |
Japan (cont’d.) | | | | | | | | |
Daiwa House Industry Co. Ltd. | | | 31,900 | | | $ | 917,483 | |
DCM Holdings Co. Ltd. | | | 47,900 | | | | 443,814 | |
DTS Corp. | | | 30,500 | | | | 669,266 | |
EDION Corp. | | | 63,900 | | | | 596,400 | |
Gunze Ltd. | | | 17,000 | | | | 596,870 | |
Haseko Corp. | | | 53,900 | | | | 668,385 | |
Hazama Ando Corp. | | | 119,600 | | | | 899,122 | |
Hitachi Ltd. | | | 12,900 | | | | 698,627 | |
Honda Motor Co. Ltd. | | | 61,600 | | | | 1,744,902 | |
Hoya Corp. | | | 28,600 | | | | 4,242,657 | |
Isuzu Motors Ltd. | | | 78,200 | | | | 970,881 | |
ITOCHU Corp. | | | 54,300 | | | | 1,661,804 | |
Itoham Yonekyu Holdings, Inc. | | | 117,500 | | | | 671,256 | |
Japan Airlines Co. Ltd.* | | | 35,700 | | | | 682,242 | |
Japan Aviation Electronics Industry Ltd. | | | 46,000 | | | | 798,266 | |
KDDI Corp. | | | 98,800 | | | | 2,883,881 | |
Keiyo Bank Ltd. (The) | | | 76,500 | | | | 309,767 | |
Keyence Corp. | | | 9,000 | | | | 5,650,093 | |
Lintec Corp. | | | 30,000 | | | | 687,720 | |
M3, Inc. | | | 17,700 | | | | 889,970 | |
Marubeni Corp. | | | 112,900 | | | | 1,101,133 | |
Medipal Holdings Corp. | | | 30,600 | | | | 573,958 | |
Mitsubishi Gas Chemical Co., Inc. | | | 26,000 | | | | 440,377 | |
Mitsubishi HC Capital, Inc. | | | 210,100 | | | | 1,037,870 | |
Mitsubishi UFJ Financial Group, Inc. | | | 214,300 | | | | 1,162,290 | |
Mitsui & Co. Ltd. | | | 56,300 | | | | 1,333,269 | |
Mitsui Chemicals, Inc. | | | 42,400 | | | | 1,142,172 | |
Mizuho Financial Group, Inc. | | | 73,620 | | | | 936,240 | |
Nihon M&A Center Holdings, Inc. | | | 73,900 | | | | 1,811,233 | |
Nippon Telegraph & Telephone Corp. | | | 107,900 | | | | 2,955,744 | |
Nishi-Nippon Financial Holdings, Inc. | | | 48,600 | | | | 314,059 | |
Nisshin Oillio Group Ltd. (The) | | | 21,400 | | | | 539,400 | |
Nomura Holdings, Inc. | | | 270,700 | | | | 1,178,868 | |
Nomura Real Estate Holdings, Inc. | | | 28,300 | | | | 651,568 | |
Obayashi Corp. | | | 97,500 | | | | 753,942 | |
ORIX Corp. | | | 65,000 | | | | 1,323,242 | |
Rengo Co. Ltd. | | | 134,300 | | | | 1,015,371 | |
Resona Holdings, Inc. | | | 366,600 | | | | 1,424,258 | |
Sankyu, Inc. | | | 18,100 | | | | 751,256 | |
Sawai Group Holdings Co. Ltd. | | | 14,300 | | | | 547,198 | |
Seino Holdings Co. Ltd. | | | 72,500 | | | | 735,308 | |
Shiseido Co. Ltd. | | | 25,400 | | | | 1,416,453 | |
SKY Perfect JSAT Holdings, Inc. | | | 151,000 | | | | 551,225 | |
SMC Corp. | | | 4,900 | | | | 3,301,428 | |
Sompo Holdings, Inc. | | | 15,600 | | | | 657,570 | |
Sumitomo Heavy Industries Ltd. | | | 32,300 | | | | 784,403 | |
Sumitomo Mitsui Financial Group, Inc. | | | 40,900 | | | | 1,399,690 | |
Taisei Corp. | | | 19,200 | | | | 583,544 | |
Teijin Ltd. | | | 67,300 | | | | 828,025 | |
Toagosei Co. Ltd. | | | 28,700 | | | | 288,394 | |
Toho Holdings Co. Ltd. | | | 7,100 | | | | 108,218 | |
Tokuyama Corp. | | | 26,500 | | | | 421,366 | |
Tokyo Seimitsu Co. Ltd. | | | 13,200 | | | | 582,529 | |
Towa Pharmaceutical Co. Ltd. | | | 28,200 | | | | 702,798 | |
Toyota Motor Corp. | | | 55,000 | | | | 1,009,601 | |
Tsubakimoto Chain Co. | | | 17,000 | | | | 466,970 | |
Ube Industries Ltd. | | | 41,500 | | | | 720,662 | |
SEE NOTES TO FINANCIAL STATEMENTS.
A3
| | | | | | |
| | |
| | PSF GLOBAL PORTFOLIO (CONTINUED) | | |
| | | | | | |
| |
| SCHEDULE OF INVESTMENTS | | as of December 31, 2021 |
| | | | | | | | |
| | | Shares | | | Value | |
COMMON STOCKS (continued) | |
Japan (cont’d.) | | | | | | | | |
Yokohama Rubber Co. Ltd. (The) | | | 62,000 | | | $ | 993,681 | |
| | | | | | | | |
| | |
| | | | | | | 72,193,553 | |
| | | | | | | | |
Netherlands — 1.6% | | | | | | | | |
ABN AMRO Bank NV, 144A, CVA | | | 45,300 | | | | 666,765 | |
Adyen NV, 144A* | | | 1,812 | | | | 4,764,438 | |
Aegon NV | | | 215,700 | | | | 1,078,751 | |
ASML Holding NV | | | 8,060 | | | | 6,456,218 | |
ASR Nederland NV | | | 21,200 | | | | 978,358 | |
ING Groep NV | | | 71,300 | | | | 996,611 | |
Koninklijke Ahold Delhaize NV | | | 89,100 | | | | 3,053,802 | |
NN Group NV | | | 18,700 | | | | 1,017,180 | |
Randstad NV | | | 14,700 | | | | 1,007,120 | |
Royal Dutch Shell PLC (Class B Stock) | | | 141,000 | | | | 3,095,369 | |
Signify NV, 144A | | | 27,400 | | | | 1,270,763 | |
| | | | | | | | |
| | |
| | | | | | | 24,385,375 | |
| | | | | | | | |
New Zealand — 0.1% | | | | | | | | |
Air New Zealand Ltd.* | | | 485,600 | | | | 502,755 | |
Fisher & Paykel Healthcare Corp. Ltd. | | | 75,032 | | | | 1,681,949 | |
| | | | | | | | |
| | |
| | | | | | | 2,184,704 | |
| | | | | | | | |
Norway — 0.4% | | | | | | | | |
DNB Bank ASA | | | 53,600 | | | | 1,226,518 | |
Equinor ASA | | | 41,200 | | | | 1,092,958 | |
TOMRA Systems ASA | | | 42,680 | | | | 3,055,794 | |
| | | | | | | | |
| | |
| | | | | | | 5,375,270 | |
| | | | | | | | |
Singapore — 0.1% | | | | | | | | |
DBS Group Holdings Ltd. | | | 41,200 | | | | 998,177 | |
Venture Corp. Ltd. | | | 79,500 | | | | 1,081,834 | |
| | | | | | | | |
| | |
| | | | | | | 2,080,011 | |
| | | | | | | | |
South Africa — 0.1% | | | | | | | | |
Anglo American PLC | | | 48,300 | | | | 1,975,529 | |
| | | | | | | | |
Spain — 0.6% | | | | | | | | |
Amadeus IT Group SA* | | | 60,373 | | | | 4,086,857 | |
Banco Santander SA | | | 249,200 | | | | 830,735 | |
Endesa SA | | | 37,700 | | | | 866,236 | |
Mapfre SA | | | 494,400 | | | | 1,015,063 | |
Repsol SA | | | 117,700 | | | | 1,398,351 | |
Telefonica SA | | | 176,500 | | | | 772,595 | |
| | | | | | | | |
| | |
| | | | | | | 8,969,837 | |
| | | | | | | | |
Sweden — 1.8% | | | | | | | | |
Atlas Copco AB (Class A Stock) | | | 78,817 | | | | 5,446,825 | |
Boliden AB | | | 35,400 | | | | 1,369,563 | |
EQT AB | | | 42,129 | | | | 2,303,174 | |
Hexagon AB (Class B Stock) | | | 347,359 | | | | 5,501,091 | |
Indutrade AB | | | 77,450 | | | | 2,370,538 | |
Nibe Industrier AB (Class B Stock) | | | 221,824 | | | | 3,351,940 | |
Securitas AB (Class B Stock) | | | 65,700 | | | | 904,000 | |
Skanska AB (Class B Stock) | | | 31,100 | | | | 805,242 | |
SKF AB (Class B Stock) | | | 70,400 | | | | 1,665,215 | |
Swedbank AB (Class A Stock) | | | 27,700 | | | | 557,228 | |
Swedish Orphan Biovitrum AB* | | | 30,200 | | | | 617,649 | |
| | | | | | | | |
| | | Shares | | | Value | |
COMMON STOCKS (continued) | |
Sweden (cont’d.) | | | | | | | | |
Volvo AB (Class B Stock) | | | 113,600 | | | $ | 2,629,042 | |
| | | | | | | | |
| | |
| | | | | | | 27,521,507 | |
| | | | | | | | |
Switzerland — 2.9% | | | | | | | | |
Adecco Group AG | | | 25,100 | | | | 1,279,150 | |
Baloise Holding AG | | | 6,000 | | | | 979,852 | |
Credit Suisse Group AG | | | 112,800 | | | | 1,092,104 | |
Helvetia Holding AG | | | 7,600 | | | | 894,301 | |
Holcim Ltd.* | | | 20,100 | | | | 1,027,283 | |
Lonza Group AG | | | 7,452 | | | | 6,215,915 | |
Novartis AG | | | 37,120 | | | | 3,260,289 | |
Partners Group Holding AG | | | 3,074 | | | | 5,070,332 | |
Roche Holding AG | | | 15,300 | | | | 6,358,796 | |
Sika AG | | | 10,031 | | | | 4,182,506 | |
Straumann Holding AG | | | 3,890 | | | | 8,269,061 | |
Swiss Life Holding AG | | | 4,900 | | | | 2,996,699 | |
UBS Group AG | | | 166,700 | | | | 2,986,015 | |
| | | | | | | | |
| | |
| | | | | | | 44,612,303 | |
| | | | | | | | |
Taiwan — 0.6% | | | | | | | | |
Sea Ltd., ADR* | | | 9,485 | | | | 2,121,889 | |
Taiwan Semiconductor Manufacturing Co. Ltd. | | | 295,000 | | | | 6,557,418 | |
| | | | | | | | |
| | |
| | | | | | | 8,679,307 | |
| | | | | | | | |
United Kingdom — 4.1% | | | | | | | | |
3i Group PLC | | | 52,800 | | | | 1,033,886 | |
Ashtead Group PLC | | | 71,994 | | | | 5,777,839 | |
Aviva PLC | | | 197,000 | | | | 1,091,873 | |
BAE Systems PLC | | | 338,300 | | | | 2,514,700 | |
Barratt Developments PLC | | | 61,900 | | | | 625,761 | |
Bellway PLC | | | 23,200 | | | | 1,046,312 | |
British American Tobacco PLC | | | 63,000 | | | | 2,337,805 | |
BT Group PLC | | | 455,900 | | | | 1,044,180 | |
Centrica PLC* | | | 457,200 | | | | 443,188 | |
CK Hutchison Holdings Ltd. | | | 155,500 | | | | 1,002,751 | |
Compass Group PLC* | | | 130,600 | | | | 2,911,097 | |
Crest Nicholson Holdings PLC | | | 143,814 | | | | 724,783 | |
Experian PLC | | | 99,654 | | | | 4,899,220 | |
GlaxoSmithKline PLC | | | 227,100 | | | | 4,931,448 | |
Go-Ahead Group PLC (The)* | | | 34,500 | | | | 312,883 | |
Halma PLC | | | 60,725 | | | | 2,627,415 | |
Imperial Brands PLC | | | 56,400 | | | | 1,232,885 | |
International Consolidated Airlines Group SA*(a) | | | 150,000 | | | | 289,819 | |
Investec PLC | | | 79,700 | | | | 432,136 | |
J Sainsbury PLC | | | 458,700 | | | | 1,711,112 | |
Keller Group PLC | | | 48,200 | | | | 645,630 | |
Kingfisher PLC | | | 357,200 | | | | 1,636,580 | |
Legal & General Group PLC | | | 302,800 | | | | 1,216,825 | |
Lloyds Banking Group PLC | | | 1,666,000 | | | | 1,078,812 | |
London Stock Exchange Group PLC | | | 36,615 | | | | 3,434,359 | |
Marks & Spencer Group PLC* | | | 279,900 | | | | 876,980 | |
Micro Focus International PLC | | | 73,300 | | | | 414,492 | |
Paragon Banking Group PLC | | | 105,900 | | | | 811,199 | |
Premier Foods PLC | | | 357,756 | | | | 544,313 | |
Redde Northgate PLC | | | 36,700 | | | | 217,151 | |
Redrow PLC | | | 77,600 | | | | 736,426 | |
SEE NOTES TO FINANCIAL STATEMENTS.
A4
| | | | | | |
| | |
| | PSF GLOBAL PORTFOLIO (CONTINUED) | | |
| | | | | | |
| |
| SCHEDULE OF INVESTMENTS | | as of December 31, 2021 |
| | | | | | | | |
| | | Shares | | | Value | |
COMMON STOCKS (continued) | |
United Kingdom (cont’d.) | | | | | | | | |
Rentokil Initial PLC | | | 321,995 | | | $ | 2,548,362 | |
Segro PLC, REIT | | | 217,019 | | | | 4,218,916 | |
Spirax-Sarco Engineering PLC | | | 14,628 | | | | 3,175,039 | |
Tate & Lyle PLC | | | 97,100 | | | | 869,563 | |
Taylor Wimpey PLC | | | 263,400 | | | | 624,339 | |
Tesco PLC | | | 213,800 | | | | 839,238 | |
Trainline PLC, 144A* | | | 248,440 | | | | 939,482 | |
Vistry Group PLC | | | 29,222 | | | | 467,835 | |
| | | | | | | | |
| | |
| | | | | | | 62,286,634 | |
| | | | | | | | |
United States — 63.1% | | | | | | | | |
AbbVie, Inc. | | | 57,612 | | | | 7,800,665 | |
Adobe, Inc.* | | | 26,723 | | | | 15,153,544 | |
Alphabet, Inc. (Class C Stock)* | | | 10,097 | | | | 29,216,578 | |
Amazon.com, Inc.* | | | 4,890 | | | | 16,304,923 | |
Ameren Corp. | | | 54,491 | | | | 4,850,244 | |
American International Group, Inc. | | | 256,884 | | | | 14,606,424 | |
Anthem, Inc. | | | 21,511 | | | | 9,971,209 | |
Applied Materials, Inc. | | | 45,151 | | | | 7,104,961 | |
Atlassian Corp. PLC (Class A Stock)* | | | 8,091 | | | | 3,085,017 | |
Autodesk, Inc.* | | | 59,872 | | | | 16,835,408 | |
AvalonBay Communities, Inc., REIT | | | 21,236 | | | | 5,364,001 | |
Bank of America Corp. | | | 224,586 | | | | 9,991,831 | |
Becton, Dickinson & Co. | | | 35,864 | | | | 9,019,079 | |
Boeing Co. (The)* | | | 14,451 | | | | 2,909,275 | |
Brown-Forman Corp. (Class B Stock) | | | 124,186 | | | | 9,048,192 | |
Bunge Ltd. | | | 33,860 | | | | 3,161,170 | |
CF Industries Holdings, Inc. | | | 81,725 | | | | 5,784,496 | |
Charles Schwab Corp. (The) | | | 129,389 | | | | 10,881,615 | |
Chewy, Inc. (Class A Stock)*(a) | | | 167,634 | | | | 9,885,377 | |
Chubb Ltd. | | | 61,512 | | | | 11,890,885 | |
Cigna Corp. | | | 28,123 | | | | 6,457,885 | |
Cintas Corp. | | | 39,311 | | | | 17,421,456 | |
Cisco Systems, Inc. | | | 80,276 | | | | 5,087,090 | |
Citigroup, Inc. | | | 16,750 | | | | 1,011,533 | |
Citrix Systems, Inc. | | | 40,631 | | | | 3,843,286 | |
Coca-Cola Co. (The) | | | 76,804 | | | | 4,547,565 | |
Comcast Corp. (Class A Stock) | | | 132,466 | | | | 6,667,014 | |
Conagra Brands, Inc. | | | 114,354 | | | | 3,905,189 | |
ConocoPhillips | | | 93,479 | | | | 6,747,314 | |
Costco Wholesale Corp. | | | 26,003 | | | | 14,761,903 | |
Coupa Software, Inc.* | | | 46,547 | | | | 7,356,753 | |
Cummins, Inc. | | | 19,154 | | | | 4,178,254 | |
CVS Health Corp. | | | 46,090 | | | | 4,754,644 | |
Dexcom, Inc.* | | | 31,834 | | | | 17,093,266 | |
Edwards Lifesciences Corp.* | | | 144,687 | | | | 18,744,201 | |
Elanco Animal Health, Inc.* | | | 105,429 | | | | 2,992,075 | |
Entergy Corp. | | | 31,491 | | | | 3,547,461 | |
Equitable Holdings, Inc. | | | 182,165 | | | | 5,973,190 | |
Estee Lauder Cos., Inc. (The) (Class A Stock) | | | 49,138 | | | | 18,190,888 | |
Exxon Mobil Corp. | | | 90,948 | | | | 5,565,108 | |
Fifth Third Bancorp | | | 207,393 | | | | 9,031,965 | |
Fiserv, Inc.* | | | 56,659 | | | | 5,880,638 | |
Fox Corp. (Class B Stock) | | | 52,280 | | | | 1,791,636 | |
General Electric Co. | | | 172,556 | | | | 16,301,365 | |
Goldman Sachs Group, Inc. (The) | | | 15,732 | | | | 6,018,277 | |
Hologic, Inc.* | | | 56,833 | | | | 4,351,134 | |
Huntington Bancshares, Inc. | | | 306,100 | | | | 4,720,062 | |
| | | | | | | | |
| | | Shares | | | Value | |
COMMON STOCKS (continued) | |
United States (cont’d.) | | | | | | | | |
IDEX Corp. | | | 51,489 | | | $ | 12,167,880 | |
Illinois Tool Works, Inc. | | | 22,138 | | | | 5,463,658 | |
International Flavors & Fragrances, Inc. | | | 45,120 | | | | 6,797,328 | |
International Paper Co. | | | 203,910 | | | | 9,579,692 | |
Intuit, Inc. | | | 36,283 | | | | 23,337,951 | |
Intuitive Surgical, Inc.* | | | 64,713 | | | | 23,251,381 | |
Johnson & Johnson | | | 48,171 | | | | 8,240,613 | |
Kimberly-Clark Corp. | | | 41,723 | | | | 5,963,051 | |
Kohl’s Corp. | | | 48,249 | | | | 2,383,018 | |
L3Harris Technologies, Inc. | | | 54,828 | | | | 11,691,523 | |
Las Vegas Sands Corp.* | | | 79,466 | | | | 2,991,100 | |
Lululemon Athletica, Inc.* | | | 34,893 | | | | 13,658,865 | |
Marsh & McLennan Cos., Inc. | | | 31,238 | | | | 5,429,789 | |
Mastercard, Inc. (Class A Stock) | | | 48,339 | | | | 17,369,170 | |
Match Group, Inc.* | | | 103,308 | | | | 13,662,483 | |
Medtronic PLC | | | 69,010 | | | | 7,139,085 | |
Merck & Co., Inc. | | | 71,154 | | | | 5,453,243 | |
MetLife, Inc. | | | 149,538 | | | | 9,344,630 | |
Microsoft Corp. | | | 117,463 | | | | 39,505,155 | |
Morgan Stanley | | | 56,755 | | | | 5,571,071 | |
News Corp. (Class A Stock) | | | 199,355 | | | | 4,447,610 | |
NextEra Energy, Inc. | | | 62,877 | | | | 5,870,197 | |
Nielsen Holdings PLC | | | 98,943 | | | | 2,029,321 | |
PayPal Holdings, Inc.* | | | 78,104 | | | | 14,728,852 | |
Perrigo Co. PLC | | | 23,034 | | | | 896,023 | |
Pfizer, Inc. | | | 106,672 | | | | 6,298,982 | |
Philip Morris International, Inc. | | | 61,155 | | | | 5,809,725 | |
Pinterest, Inc. (Class A Stock)* | | | 220,414 | | | | 8,012,049 | |
QUALCOMM, Inc. | | | 64,008 | | | | 11,705,143 | |
Rockwell Automation, Inc. | | | 9,193 | | | | 3,206,978 | |
Roper Technologies, Inc. | | | 26,756 | | | | 13,160,206 | |
SBA Communications Corp., REIT | | | 47,445 | | | | 18,457,054 | |
Sempra Energy | | | 60,598 | | | | 8,015,903 | |
ServiceNow, Inc.* | | | 38,210 | | | | 24,802,493 | |
Sherwin-Williams Co. (The) | | | 50,032 | | | | 17,619,269 | |
Signature Bank | | | 7,115 | | | | 2,301,489 | |
Southern Co. (The) | | | 186,020 | | | | 12,757,252 | |
Southwest Airlines Co.* | | | 74,985 | | | | 3,212,357 | |
Stellantis NV | | | 74,557 | | | | 1,416,629 | |
Stericycle, Inc.* | | | 54,849 | | | | 3,271,194 | |
TE Connectivity Ltd. | | | 25,138 | | | | 4,055,765 | |
Texas Instruments, Inc. | | | 35,624 | | | | 6,714,055 | |
Thermo Fisher Scientific, Inc. | | | 40,367 | | | | 26,934,477 | |
TJX Cos., Inc. (The) | | | 107,941 | | | | 8,194,881 | |
Tyson Foods, Inc. (Class A Stock) | | | 78,512 | | | | 6,843,106 | |
United Parcel Service, Inc. (Class B Stock) | | | 68,014 | | | | 14,578,121 | |
Veeva Systems, Inc. (Class A Stock)* | | | 56,350 | | | | 14,396,298 | |
Walmart, Inc. | | | 44,163 | | | | 6,389,944 | |
Walt Disney Co. (The)* | | | 42,523 | | | | 6,586,387 | |
Wells Fargo & Co. | | | 382,971 | | | | 18,374,949 | |
Welltower, Inc., REIT | | | 42,524 | | | | 3,647,283 | |
Weyerhaeuser Co., REIT | | | 245,124 | | | | 10,094,206 | |
Zimmer Biomet Holdings, Inc. | | | 47,497 | | | | 6,034,019 | |
SEE NOTES TO FINANCIAL STATEMENTS.
A5
| | | | | | |
| | |
| | PSF GLOBAL PORTFOLIO (CONTINUED) | | |
| | | | | | |
| |
| SCHEDULE OF INVESTMENTS | | as of December 31, 2021 |
| | | | | | | | |
| | | Shares | | | Value | |
COMMON STOCKS (continued) | |
United States (cont’d.) | | | | | | | | |
Zoetis, Inc. | | | 78,104 | | | $ | 19,059,719 | |
| | | | | | | | |
| | |
| | | | | | | 958,728,668 | |
| | | | | | | | |
TOTAL COMMON STOCKS
(cost $897,963,257) | | | | 1,477,395,056 | |
| | | | | | | | |
PREFERRED STOCKS — 0.2% | |
Germany — 0.0% | | | | | | | | |
Porsche Automobil Holding SE (PRFC) | | | 11,600 | | | | 1,099,226 | |
| | | | | | | | |
United States — 0.2% | | | | | | | | |
Becton, Dickinson & Co., Series B, CVT, 6.000%, Maturing 06/01/23(a) | | | 18,231 | | | | 961,685 | |
Elanco Animal Health, Inc., CVT, 5.000%, Maturing 02/01/23 | | | 2,497 | | | | 111,516 | |
Southern Co. (The), Series 2019, CVT, 6.750%, Maturing 08/01/22 | | | 34,946 | | | | 1,878,348 | |
| | | | | | | | |
| | |
| | | | | | | 2,951,549 | |
| | | | | | | | |
TOTAL PREFERRED STOCKS
(cost $3,460,607) | | | | 4,050,775 | |
| | | | | | | | |
TOTAL LONG-TERM INVESTMENTS
(cost $901,423,864) | | | | 1,481,445,831 | |
| | | | | | | | |
SHORT-TERM INVESTMENTS — 3.4% | |
AFFILIATED MUTUAL FUNDS | |
PGIM Core Ultra Short Bond Fund(wa) | | | 33,642,687 | | | | 33,642,687 | |
PGIM Institutional Money Market Fund
(cost $17,756,072; includes $17,754,240 of cash collateral for securities on loan)(b)(wa) | | | 17,785,479 | | | | 17,773,029 | |
| | | | | �� | | | |
TOTAL SHORT-TERM INVESTMENTS
(cost $51,398,759) | | | | 51,415,716 | |
| | | | | | | | |
TOTAL INVESTMENTS—100.9%
(cost $952,822,623) | | | | 1,532,861,547 | |
Liabilities in excess of other assets — (0.9)% | | | | (14,185,649 | ) |
| | | | | | | | |
| | |
NET ASSETS — 100.0% | | | | | | $ | 1,518,675,898 | |
| | | | | | | | |
See the Glossary for a list of the abbreviation(s) used in the annual report.
| * | Non-income producing security. |
| (a) | All or a portion of security is on loan. The aggregate market value of such securities, including those sold and pending settlement, is $17,214,249; cash collateral of $17,754,240 (included in liabilities) was received with which the Portfolio purchased highly liquid short-term investments. In the event of significant appreciation in value of securities on loan on the last business day of the reporting period, the Portfolio may reflect a collateral value that is less than the market value of the loaned securities and such shortfall is remedied the following business day. |
| (b) | Represents security, or portion thereof, purchased with cash collateral received for securities on loan and includes dividend reinvestment. |
| (wa) | PGIM Investments LLC, the manager of the Portfolio, also serves as manager of the PGIM Core Ultra Short Bond Fund and PGIM Institutional Money Market Fund, if applicable. |
Fair Value Measurements:
Various inputs are used in determining the value of the Portfolio’s investments. These inputs are summarized in the three broad levels listed below.
Level 1—unadjusted quoted prices generally in active markets for identical securities.
Level 2—quoted prices for similar securities, interest rates and yield curves, prepayment speeds, foreign currency exchange rates and other observable inputs.
Level 3—unobservable inputs for securities valued in accordance with Board approved fair valuation procedures.
The following is a summary of the inputs used as of December 31, 2021 in valuing such portfolio securities:
| | | | | | | | | | | | |
| | | Level 1 | | | Level 2 | | | Level 3 | |
Investments in Securities | | | | | | | | | | | | |
Assets | | | | | | | | | | | | |
Long-Term Investments | | | | | | | | | | | | |
Common Stocks | | | | | | | | | | | | |
Argentina | | $ | 2,361,048 | | | $ | — | | | $ | — | |
Australia | | | — | | | | 17,342,107 | | | | — | |
SEE NOTES TO FINANCIAL STATEMENTS.
A6
| | | | | | |
| | |
| | PSF GLOBAL PORTFOLIO (CONTINUED) | | |
| | | | | | |
| |
| SCHEDULE OF INVESTMENTS | | as of December 31, 2021 |
| | | | | | | | | | | | |
| | | Level 1 | | | Level 2 | | | Level 3 | |
Investments in Securities (continued) | | | | | | | | | | | | |
Assets (continued) | | | | | | | | | | | | |
Long-Term Investments (continued) | | | | | | | | | | | | |
Common Stocks (continued) | | | | | | | | | | | | |
Austria | | $ | — | | | $ | 3,872,427 | | | $ | — | |
Belgium | | | — | | | | 2,640,257 | | | | — | |
Brazil | | | — | | | | 948,521 | | | | — | |
Canada | | | 29,941,977 | | | | — | | | | — | |
China | | | 24,015,529 | | | | 12,095,616 | | | | — | |
Denmark | | | — | | | | 20,558,373 | | | | — | |
Finland | | | — | | | | 6,324,677 | | | | — | |
France | | | 12,373,359 | | | | 56,272,523 | | | | — | |
Germany | | | 4,993,269 | | | | 27,258,540 | | | | — | |
Hong Kong | | | — | | | | 6,404,073 | | | | — | |
India | | | 4,564,921 | | | | 5,772,241 | | | | — | |
Ireland | | | 6,820,491 | | | | 5,110,214 | | | | — | |
Israel | | | 3,131,608 | | | | — | | | | — | |
Italy | | | — | | | | 5,600,587 | | | | — | |
Japan | | | — | | | | 72,193,553 | | | | — | |
Netherlands | | | — | | | | 24,385,375 | | | | — | |
New Zealand | | | — | | | | 2,184,704 | | | | — | |
Norway | | | — | | | | 5,375,270 | | | | — | |
Singapore | | | — | | | | 2,080,011 | | | | — | |
South Africa | | | — | | | | 1,975,529 | | | | — | |
Spain | | | — | | | | 8,969,837 | | | | — | |
Sweden | | | — | | | | 27,521,507 | | | | — | |
Switzerland | | | — | | | | 44,612,303 | | | | — | |
Taiwan | | | 2,121,889 | | | | 6,557,418 | | | | — | |
United Kingdom | | | — | | | | 62,286,634 | | | | — | |
United States | | | 957,312,039 | | | | 1,416,629 | | | | — | |
Preferred Stocks | | | | | | | | | | | | |
Germany | | | — | | | | 1,099,226 | | | | — | |
United States | | | 2,951,549 | | | | — | | | | — | |
Short-Term Investments | | | | | | | | | | | | |
Affiliated Mutual Funds | | | 51,415,716 | | | | — | | | | — | |
| | | | | | | | | | | | |
Total | | $ | 1,102,003,395 | | | $ | 430,858,152 | | | $ | — | |
| | | | | | | | | | | | |
Industry Classification:
The industry classification of investments and liabilities in excess of other assets shown as a percentage of net assets as of December 31, 2021 were as follows (unaudited):
| | | | |
Software | | | 8.9 | % |
Health Care Equipment & Supplies | | | 6.9 | |
Banks | | | 4.9 | |
Pharmaceuticals | | | 4.6 | |
Semiconductors & Semiconductor Equipment | | | 4.6 | |
IT Services | | | 4.5 | |
Insurance | | | 4.3 | |
Interactive Media & Services | | | 3.6 | |
Affiliated Mutual Funds (1.2% represents investments purchased with collateral from securities on loan) | | | 3.4 | |
Machinery | | | 3.2 | |
Oil, Gas & Consumable Fuels | | | 3.1 | |
Chemicals | | | 2.8 | |
Equity Real Estate Investment Trusts (REITs) | | | 2.8 | |
Life Sciences Tools & Services | | | 2.7 | |
Capital Markets | | | 2.6 | |
Industrial Conglomerates | | | 2.5 | |
Internet & Direct Marketing Retail | | | 2.1 | |
| | | | |
Food & Staples Retailing | | | 2.0 | % |
Aerospace & Defense | | | 1.9 | |
Commercial Services & Supplies | | | 1.9 | |
Electric Utilities | | | 1.8 | |
Personal Products | | | 1.6 | |
Electronic Equipment, Instruments & Components | | | 1.6 | |
Textiles, Apparel & Luxury Goods | | | 1.4 | |
Health Care Providers & Services | | | 1.4 | |
Air Freight & Logistics | | | 1.4 | |
Food Products | | | 1.2 | |
Building Products | | | 1.1 | |
Health Care Technology | | | 1.0 | |
Multi-Utilities | | | 0.9 | |
Media | | | 0.9 | |
Professional Services | | | 0.9 | |
Beverages | | | 0.9 | |
Hotels, Restaurants & Leisure | | | 0.8 | |
Specialty Retail | | | 0.7 | |
SEE NOTES TO FINANCIAL STATEMENTS.
A7
| | | | | | |
| | |
| | PSF GLOBAL PORTFOLIO (CONTINUED) | | |
| | | | | | |
| |
| SCHEDULE OF INVESTMENTS | | as of December 31, 2021 |
Industry Classification (continued):
| | | | |
Automobiles | | | 0.7 | % |
Metals & Mining | | | 0.7 | |
Containers & Packaging | | | 0.7 | |
Trading Companies & Distributors | | | 0.7 | |
Tobacco | | | 0.7 | |
Entertainment | | | 0.6 | |
Diversified Financial Services | | | 0.6 | |
Road & Rail | | | 0.6 | |
Auto Components | | | 0.6 | |
Biotechnology | | | 0.5 | |
Diversified Telecommunication Services | | | 0.5 | |
Airlines | | | 0.4 | |
Communications Equipment | | | 0.4 | |
Household Products | | | 0.4 | |
Multiline Retail | | | 0.4 | |
Construction & Engineering | | | 0.3 | |
Electrical Equipment | | | 0.3 | |
| | | | |
Construction Materials | | | 0.3 | % |
Wireless Telecommunication Services | | | 0.2 | |
Household Durables | | | 0.1 | |
Marine | | | 0.1 | |
Real Estate Management & Development | | | 0.1 | |
Technology Hardware, Storage & Peripherals | | | 0.1 | |
Thrifts & Mortgage Finance | | | 0.0 | * |
Paper & Forest Products | | | 0.0 | * |
Gas Utilities | | | 0.0 | * |
Consumer Finance | | | 0.0 | * |
| | | | |
| | | 100.9 | |
Liabilities in excess of other assets | | | (0.9 | ) |
| | | | |
| | | 100.0 | % |
| | | | |
Financial Instruments/Transactions—Summary of Offsetting and Netting Arrangements:
The Portfolio entered into financial instruments/transactions during the reporting period that are either offset in accordance with current requirements or are subject to enforceable master netting arrangements or similar agreements that permit offsetting. The information about offsetting and related netting arrangements for financial instruments/transactions where the legal right to set-off exists is presented in the summary below.
Offsetting of financial instrument/transaction assets and liabilities:
| | | | | | |
Description | | Gross Market
Value of
Recognized
Assets/(Liabilities) | | Collateral
Pledged/(Received)(1) | | Net
Amount |
Securities on Loan | | $17,214,249 | | $(17,214,249) | | $— |
| | | | | | |
| (1) | Collateral amount disclosed by the Portfolio is limited to the market value of financial instruments/transactions. |
SEE NOTES TO FINANCIAL STATEMENTS.
A8
| | | | | | |
| | |
| | PSF GLOBAL PORTFOLIO (CONTINUED) | | |
STATEMENT OF ASSETS AND LIABILITIES
as of December 31, 2021
| | | | |
| ASSETS | | | | |
Investments at value, including securities on loan of $17,214,249: | | | | |
Unaffiliated investments (cost $901,423,864) | | $ | 1,481,445,831 | |
Affiliated investments (cost $51,398,759) | | | 51,415,716 | |
Foreign currency, at value (cost $2,564,968) | | | 2,541,569 | |
Tax reclaim receivable | | | 2,161,216 | |
Dividends and interest receivable | | | 1,173,521 | |
Receivable for investments sold | | | 291,848 | |
Receivable for Portfolio shares sold | | | 22,061 | |
Receivable from affiliate | | | 2,563 | |
Prepaid expenses | | | 12,247 | |
| | | | |
Total Assets | | | 1,539,066,572 | |
| | | | |
LIABILITIES | | | | |
Payable to broker for collateral for securities on loan | | | 17,754,240 | |
Payable to affiliate | | | 936,021 | |
Management fee payable | | | 904,105 | |
Payable for Portfolio shares purchased | | | 349,057 | |
Payable for investments purchased | | | 321,910 | |
Accrued expenses and other liabilities | | | 123,434 | |
Affiliated transfer agent fee payable | | | 980 | |
Trustees’ fees payable | | | 890 | |
Distribution fee payable | | | 37 | |
| | | | |
Total Liabilities | | | 20,390,674 | |
| | | | |
NET ASSETS | | $ | 1,518,675,898 | |
| | | | |
Net assets were comprised of: | | | | |
Partners’ Equity | | $ | 1,518,675,898 | |
| | | | |
Class I: | | | | |
Net asset value and redemption price per share, $1,518,488,934 / 26,726,710 outstanding shares of beneficial interest | | $ | 56.82 | |
| | | | |
Class III: | | | | |
Net asset value and redemption price per share, $186,964 / 3,297 outstanding shares of beneficial interest | | $ | 56.72 | |
| | | | |
| |
| Net Asset Values Per Share may not recalculate due to rounding | | | | |
STATEMENT OF OPERATIONS
Year Ended December 31, 2021
| | | | |
NET INVESTMENT INCOME (LOSS) | | | | |
| |
| INCOME | | | | |
Unaffiliated dividend income (net of $1,554,826 foreign withholding tax, of which $253,438 is reimbursable by an affiliate) | | $ | 23,422,728 | |
Income from securities lending, net (including affiliated income of $18,308) | | | 131,713 | |
Affiliated dividend income | | | 37,078 | |
| | | | |
Total income | | | 23,591,519 | |
| | | | |
EXPENSES | | | | |
Management fee | | | 11,042,400 | |
Distribution fee—Class III | | | 198 | |
Custodian and accounting fees | | | 231,095 | |
Shareholders’ reports | | | 30,746 | |
Audit fee | | | 30,500 | |
Trustees’ fees | | | 27,979 | |
Legal fees and expenses | | | 26,254 | |
Transfer agent’s fees and expenses (including affiliated expense of $5,882) | | | 10,682 | |
Miscellaneous | | | 77,019 | |
| | | | |
Total expenses | | | 11,476,873 | |
Less: Fee waivers and/or expense reimbursement | | | (534,452 | ) |
| | | | |
Net expenses | | | 10,942,421 | |
| | | | |
NET INVESTMENT INCOME (LOSS) | | | 12,649,098 | |
| | | | |
REALIZED AND UNREALIZED GAIN (LOSS) ON INVESTMENT AND FOREIGN CURRENCY TRANSACTIONS | | | | |
Net realized gain (loss) on: | | | | |
Investment transactions (including affiliated of $(7,918)) | | | 117,594,001 | |
Foreign currency transactions | | | (161,290 | ) |
| | | | |
| | | 117,432,711 | |
| | | | |
Net change in unrealized appreciation (depreciation) on: | | | | |
Investments (including affiliated of $(1,128)) | | | 113,121,519 | |
Foreign currencies | | | (105,861 | ) |
| | | | |
| | | 113,015,658 | |
| | | | |
NET GAIN (LOSS) ON INVESTMENT AND FOREIGN CURRENCY TRANSACTIONS | | | 230,448,369 | |
| | | | |
NET INCREASE (DECREASE) IN NET ASSETS RESULTING FROM OPERATIONS | | $ | 243,097,467 | |
| | | | |
| | | | | | | | |
| | |
| STATEMENTS OF CHANGES IN NET ASSETS | | | | | | | | |
| | | Year Ended
December 31, 2021 | | | Year Ended
December 31, 2020 | |
INCREASE (DECREASE) IN NET ASSETS | | | | | | | | |
OPERATIONS | | | | | | | | |
Net investment income (loss) | | $ | 12,649,098 | | | $ | 11,999,429 | |
Net realized gain (loss) on investment and foreign currency transactions | | | 117,432,711 | | | | 96,903,741 | |
Net change in unrealized appreciation (depreciation) on investments and foreign currencies | | | 113,015,658 | | | | 74,773,343 | |
| | | | | | | | |
NET INCREASE (DECREASE) IN NET ASSETS RESULTING FROM OPERATIONS | | | 243,097,467 | | | | 183,676,513 | |
| | | | | | | | |
PORTFOLIO SHARE TRANSACTIONS | | | | | | | | |
Portfolio shares sold | | | 17,833,148 | | | | 15,803,644 | |
Portfolio shares purchased | | | (119,303,863 | ) | | | (86,119,207 | ) |
| | | | | | | | |
NET INCREASE (DECREASE) IN NET ASSETS FROM PORTFOLIO SHARE TRANSACTIONS | | | (101,470,715 | ) | | | (70,315,563 | ) |
| | | | | | | | |
TOTAL INCREASE (DECREASE) | | | 141,626,752 | | | | 113,360,950 | |
NET ASSETS: | | | | | | | | |
Beginning of year | | | 1,377,049,146 | | | | 1,263,688,196 | |
| | | | | | | | |
End of year | | $ | 1,518,675,898 | | | $ | 1,377,049,146 | |
| | | | | | | | |
SEE NOTES TO FINANCIAL STATEMENTS.
A9
| | | | | | |
| | |
| | PSF PGIM 50/50 BALANCED PORTFOLIO | | |
| | | | | | |
| |
| SCHEDULE OF INVESTMENTS | | as of December 31, 2021 |
| | | | | | | | |
| | | Shares | | | Value | |
| |
| LONG-TERM INVESTMENTS — 87.6% | | | | | |
| | |
| COMMON STOCKS — 53.6% | | | | | | | | |
Aerospace & Defense — 0.7% | | | | | | | | |
Airbus SE (France)* | | | 1,220 | | | $ | 156,269 | |
Boeing Co. (The)* | | | 20,650 | | | | 4,157,258 | |
General Dynamics Corp. | | | 8,600 | | | | 1,792,842 | |
Howmet Aerospace, Inc. | | | 14,980 | | | | 476,814 | |
Huntington Ingalls Industries, Inc. | | | 1,600 | | | | 298,784 | |
L3Harris Technologies, Inc. | | | 7,670 | | | | 1,635,551 | |
Lockheed Martin Corp. | | | 9,420 | | | | 3,347,962 | |
Northrop Grumman Corp. | | | 5,762 | | | | 2,230,297 | |
Raytheon Technologies Corp. | | | 56,555 | | | | 4,867,123 | |
Textron, Inc. | | | 8,700 | | | | 671,640 | |
TransDigm Group, Inc.* | | | 1,940 | | | | 1,234,383 | |
| | | | | | | | |
| | |
| | | | | | | 20,868,923 | |
| | | | | | | | |
Air Freight & Logistics — 0.4% | | | | | | | | |
C.H. Robinson Worldwide, Inc.(a) | | | 5,200 | | | | 559,676 | |
Deutsche Post AG (Germany) | | | 5,503 | | | | 353,064 | |
DSV A/S (Denmark) | | | 837 | | | | 195,576 | |
Expeditors International of Washington, Inc. | | | 6,300 | | | | 846,027 | |
FedEx Corp. | | | 9,280 | | | | 2,400,179 | |
United Parcel Service, Inc. (Class B Stock) | | | 27,300 | | | | 5,851,482 | |
| | | | | | | | |
| | |
| | | | | | | 10,206,004 | |
| | | | | | | | |
Airlines — 0.1% | | | | | | | | |
Alaska Air Group, Inc.* | | | 4,900 | | | | 255,290 | |
American Airlines Group, Inc.*(a) | | | 25,100 | | | | 450,796 | |
Delta Air Lines, Inc.* | | | 24,200 | | | | 945,736 | |
Southwest Airlines Co.* | | | 21,900 | | | | 938,196 | |
United Airlines Holdings, Inc.* | | | 12,400 | | | | 542,872 | |
| | | | | | | | |
| | |
| | | | | | | 3,132,890 | |
| | | | | | | | |
Auto Components — 0.1% | | | | | | | | |
Aisin Corp. (Japan) | | | 300 | | | | 11,517 | |
Aptiv PLC*(a) | | | 10,200 | | | | 1,682,490 | |
BorgWarner, Inc. | | | 8,700 | | | | 392,109 | |
Bridgestone Corp. (Japan) | | | 2,200 | | | | 94,681 | |
Cie Generale des Etablissements Michelin SCA (France) | | | 356 | | | | 58,381 | |
Denso Corp. (Japan) | | | 1,000 | | | | 82,866 | |
| | | | | | | | |
| | |
| | | | | | | 2,322,044 | |
| | | | | | | | |
Automobiles — 1.4% | | | | | | | | |
Bayerische Motoren Werke AG (Germany) | | | 671 | | | | 67,267 | |
Daimler AG (Germany) | | | 3,749 | | | | 288,042 | |
Ferrari NV (Italy) | | | 234 | | | | 60,696 | |
Ford Motor Co. | | | 147,285 | | | | 3,059,109 | |
General Motors Co.* | | | 54,500 | | | | 3,195,335 | |
Isuzu Motors Ltd. (Japan) | | | 16,400 | | | | 203,612 | |
Stellantis NV | | | 2,124 | | | | 40,008 | |
Suzuki Motor Corp. (Japan) | | | 800 | | | | 30,796 | |
Tesla, Inc.* | | | 30,600 | | | | 32,337,468 | |
Toyota Motor Corp. (Japan) | | | 8,500 | | | | 156,029 | |
Volkswagen AG (Germany) | | | 65 | | | | 19,121 | |
| | | | | | | | |
| | |
| | | | | | | 39,457,483 | |
| | | | | | | | |
| | | | | | | | |
| | | Shares | | | Value | |
| | |
| COMMON STOCKS (continued) | | | | | | | | |
Banks — 2.2% | | | | | | | | |
Australia & New Zealand Banking Group Ltd. (Australia) | | | 12,411 | | | $ | 248,410 | |
Bank Hapoalim BM (Israel) | | | 24,327 | | | | 250,479 | |
Bank Leumi Le-Israel BM (Israel) | | | 24,516 | | | | 263,774 | |
Bank of America Corp. | | | 270,941 | | | | 12,054,165 | |
Barclays PLC (United Kingdom) | | | 35,682 | | | | 90,331 | |
BNP Paribas SA (France) | | | 4,019 | | | | 277,981 | |
Citigroup, Inc. | | | 76,035 | | | | 4,591,754 | |
Citizens Financial Group, Inc. | | | 16,400 | | | | 774,900 | |
Comerica, Inc. | | | 4,900 | | | | 426,300 | |
Commonwealth Bank of Australia (Australia) | | | 1,280 | | | | 94,025 | |
DBS Group Holdings Ltd. (Singapore) | | | 9,000 | | | | 218,048 | |
DNB Bank ASA (Norway) | | | 2,007 | | | | 45,926 | |
Fifth Third Bancorp | | | 25,621 | | | | 1,115,795 | |
First Republic Bank | | | 6,500 | | | | 1,342,315 | |
Huntington Bancshares, Inc. | | | 56,736 | | | | 874,869 | |
ING Groep NV (Netherlands) | | | 8,003 | | | | 111,864 | |
Israel Discount Bank Ltd. (Israel) (Class A Stock) | | | 2,329 | | | | 15,687 | |
Japan Post Bank Co. Ltd. (Japan) | | | 1,400 | | | | 12,829 | |
JPMorgan Chase & Co. | | | 111,145 | | | | 17,599,811 | |
KBC Group NV (Belgium) | | | 528 | | | | 45,634 | |
KeyCorp | | | 36,500 | | | | 844,245 | |
Lloyds Banking Group PLC (United Kingdom) | | | 459,888 | | | | 297,799 | |
M&T Bank Corp. | | | 5,000 | | | | 767,900 | |
Mediobanca Banca di Credito Finanziario SpA (Italy) | | | 19,726 | | | | 226,633 | |
Mitsubishi UFJ Financial Group, Inc. (Japan) | | | 64,800 | | | | 351,453 | |
Mizuho Financial Group, Inc. (Japan) | | | 4,920 | | | | 62,569 | |
National Australia Bank Ltd. (Australia) | | | 6,699 | | | | 140,516 | |
NatWest Group PLC (United Kingdom) | | | 12,155 | | | | 37,175 | |
Nordea Bank Abp (Finland) | | | 6,685 | | | | 81,673 | |
Oversea-Chinese Banking Corp. Ltd. (Singapore) | | | 3,900 | | | | 33,008 | |
People’s United Financial, Inc. | | | 15,300 | | | | 272,646 | |
PNC Financial Services Group, Inc. (The) | | | 15,933 | | | | 3,194,885 | |
Raiffeisen Bank International AG (Austria) | | | 315 | | | | 9,368 | |
Regions Financial Corp. | | | 35,403 | | | | 771,785 | |
Signature Bank | | | 2,300 | | | | 743,981 | |
Skandinaviska Enskilda Banken AB (Sweden) (Class A Stock) | | | 3,021 | | | | 41,985 | |
Sumitomo Mitsui Financial Group, Inc. (Japan) | | | 2,000 | | | | 68,444 | |
SVB Financial Group* | | | 2,180 | | | | 1,478,563 | |
Svenska Handelsbanken AB (Sweden) (Class A Stock) | | | 3,245 | | | | 35,120 | |
Swedbank AB (Sweden) (Class A Stock) | | | 1,800 | | | | 36,210 | |
Truist Financial Corp. | | | 50,101 | | | | 2,933,414 | |
U.S. Bancorp | | | 50,685 | | | | 2,846,976 | |
United Overseas Bank Ltd. (Singapore) | | | 1,900 | | | | 37,919 | |
Wells Fargo & Co. | | | 149,964 | | | | 7,195,273 | |
SEE NOTES TO FINANCIAL STATEMENTS.
A10
| | | | | | |
| | |
| | PSF PGIM 50/50 BALANCED PORTFOLIO (CONTINUED) | | |
| | | | | | |
| |
| SCHEDULE OF INVESTMENTS | | as of December 31, 2021 |
| | | | | | | | |
| | | Shares | | | Value | |
| | |
| COMMON STOCKS (continued) | | | | | | | | |
Banks (cont’d.) | | | | | | | | |
Zions Bancorp NA | | | 6,350 | | | $ | 401,066 | |
| | | | | | | | |
| | |
| | | | | | | 63,365,503 | |
| | | | | | | | |
Beverages — 0.7% | | | | | | | | |
Brown-Forman Corp. (Class B Stock) | | | 7,075 | | | | 515,484 | |
Carlsberg A/S (Denmark) (Class B Stock) | | | 195 | | | | 33,706 | |
Coca-Cola Co. (The) | | | 145,801 | | | | 8,632,877 | |
Coca-Cola HBC AG (Russia)* | | | 6,855 | | | | 237,017 | |
Constellation Brands, Inc. (Class A Stock) | | | 6,200 | | | | 1,556,014 | |
Diageo PLC (United Kingdom) | | | 931 | | | | 50,851 | |
Molson Coors Beverage Co. (Class B Stock)(a) | | | 7,300 | | | | 338,355 | |
Monster Beverage Corp.* | | | 13,900 | | | | 1,334,956 | |
PepsiCo, Inc. | | | 51,907 | | | | 9,016,765 | |
| | | | | | | | |
| | |
| | | | | | | 21,716,025 | |
| | | | | | | | |
Biotechnology — 0.9% | | | | | | | | |
AbbVie, Inc. | | | 66,301 | | | | 8,977,155 | |
Amgen, Inc. | | | 21,337 | | | | 4,800,185 | |
Biogen, Inc.* | | | 5,660 | | | | 1,357,947 | |
Gilead Sciences, Inc. | | | 47,100 | | | | 3,419,931 | |
Incyte Corp.* | | | 6,900 | | | | 506,460 | |
Moderna, Inc.* | | | 13,050 | | | | 3,314,439 | |
Regeneron Pharmaceuticals, Inc.* | | | 3,900 | | | | 2,462,928 | |
Vertex Pharmaceuticals, Inc.* | | | 9,800 | | | | 2,152,080 | |
| | | | | | | | |
| | |
| | | | | | | 26,991,125 | |
| | | | | | | | |
Building Products — 0.3% | | | | | | | | |
A.O. Smith Corp. | | | 5,200 | | | | 446,420 | |
Allegion PLC | | | 3,433 | | | | 454,667 | |
Carrier Global Corp. | | | 32,202 | | | | 1,746,637 | |
Cie de Saint-Gobain (France) | | | 4,482 | | | | 315,779 | |
Fortune Brands Home & Security, Inc. | | | 5,300 | | | | 566,570 | |
Geberit AG (Switzerland) | | | 354 | | | | 289,010 | |
Johnson Controls International PLC | | | 26,822 | | | | 2,180,897 | |
Kingspan Group PLC (Ireland) | | | 303 | | | | 36,205 | |
Lixil Corp. (Japan) | | | 600 | | | | 15,994 | |
Masco Corp. | | | 9,200 | | | | 646,024 | |
Trane Technologies PLC | | | 8,800 | | | | 1,777,864 | |
Xinyi Glass Holdings Ltd. (Hong Kong) | | | 73,000 | | | | 182,449 | |
| | | | | | | | |
| | |
| | | | | | | 8,658,516 | |
| | | | | | | | |
Capital Markets — 1.6% | | | | | | | | |
3i Group PLC (United Kingdom) | | | 14,126 | | | | 276,604 | |
abrdn PLC (United Kingdom) | | | 13,050 | | | | 42,527 | |
Ameriprise Financial, Inc. | | | 4,220 | | | | 1,273,005 | |
Bank of New York Mellon Corp. (The) | | | 29,458 | | | | 1,710,921 | |
BlackRock, Inc. | | | 5,370 | | | | 4,916,557 | |
Cboe Global Markets, Inc. | | | 4,000 | | | | 521,600 | |
Charles Schwab Corp. (The) | | | 56,350 | | | | 4,739,035 | |
CME Group, Inc. | | | 13,500 | | | | 3,084,210 | |
Daiwa Securities Group, Inc. (Japan) | | | 40,200 | | | | 226,635 | |
EQT AB (Sweden) | | | 608 | | | | 33,239 | |
FactSet Research Systems, Inc. | | | 1,400 | | | | 680,414 | |
Franklin Resources, Inc.(a) | | | 11,000 | | | | 368,390 | |
Goldman Sachs Group, Inc. (The) | | | 12,780 | | | | 4,888,989 | |
| | | | | | | | |
| | | Shares | | | Value | |
| | |
| COMMON STOCKS (continued) | | | | | | | | |
Capital Markets (cont’d.) | | | | | | | | |
Intercontinental Exchange, Inc. | | | 21,855 | | | $ | 2,989,108 | |
Invesco Ltd. | | | 13,300 | | | | 306,166 | |
Macquarie Group Ltd. (Australia) | | | 2,163 | | | | 322,641 | |
MarketAxess Holdings, Inc. | | | 1,420 | | | | 584,003 | |
Moody’s Corp. | | | 6,150 | | | | 2,402,067 | |
Morgan Stanley | | | 54,819 | | | | 5,381,033 | |
MSCI, Inc. | | | 3,060 | | | | 1,874,832 | |
Nasdaq, Inc. | | | 4,500 | | | | 945,045 | |
Northern Trust Corp. | | | 7,700 | | | | 920,997 | |
Partners Group Holding AG (Switzerland) | | | 47 | | | | 77,523 | |
Raymond James Financial, Inc. | | | 7,050 | | | | 707,820 | |
S&P Global, Inc. | | | 9,160 | | | | 4,322,879 | |
SBI Holdings, Inc. (Japan) | | | 600 | | | | 16,333 | |
State Street Corp. | | | 13,500 | | | | 1,255,500 | |
T. Rowe Price Group, Inc.(a) | | | 8,400 | | | | 1,651,776 | |
UBS Group AG (Switzerland) | | | 20,471 | | | | 366,687 | |
| | | | | | | | |
| | |
| | | | | | | 46,886,536 | |
| | | | | | | | |
Chemicals — 1.0% | | | | | | | | |
Air Products & Chemicals, Inc. | | | 8,200 | | | | 2,494,932 | |
Albemarle Corp. | | | 4,500 | | | | 1,051,965 | |
Arkema SA (France) | | | 130 | | | | 18,340 | |
Asahi Kasei Corp. (Japan) | | | 2,600 | | | | 24,442 | |
Celanese Corp. | | | 4,300 | | | | 722,658 | |
CF Industries Holdings, Inc. | | | 8,400 | | | | 594,552 | |
Corteva, Inc. | | | 27,247 | | | | 1,288,238 | |
Covestro AG (Germany), 144A | | | 4,060 | | | | 249,051 | |
Dow, Inc. | | | 27,647 | | | | 1,568,138 | |
DuPont de Nemours, Inc. | | | 19,747 | | | | 1,595,163 | |
Eastman Chemical Co. | | | 5,200 | | | | 628,732 | |
Ecolab, Inc. | | | 9,400 | | | | 2,205,146 | |
Evonik Industries AG (Germany) | | | 440 | | | | 14,256 | |
FMC Corp. | | | 5,000 | | | | 549,450 | |
ICL Group Ltd. (Israel) | | | 8,550 | | | | 82,065 | |
International Flavors & Fragrances, Inc. | | | 9,200 | | | | 1,385,980 | |
Linde PLC (United Kingdom) | | | 19,500 | | | | 6,755,385 | |
LyondellBasell Industries NV (Class A Stock) | | | 9,800 | | | | 903,854 | |
Mitsubishi Chemical Holdings Corp. (Japan) | | | 2,700 | | | | 20,047 | |
Mitsui Chemicals, Inc. (Japan) | | | 7,800 | | | | 210,116 | |
Mosaic Co. (The) | | | 14,300 | | | | 561,847 | |
Nitto Denko Corp. (Japan) | | | 300 | | | | 23,150 | |
PPG Industries, Inc. | | | 9,200 | | | | 1,586,448 | |
Sherwin-Williams Co. (The) | | | 9,150 | | | | 3,222,264 | |
Shin-Etsu Chemical Co. Ltd. (Japan) | | | 700 | | | | 121,114 | |
Solvay SA (Belgium) | | | 155 | | | | 18,001 | |
Sumitomo Chemical Co. Ltd. (Japan) | | | 3,100 | | | | 14,616 | |
Tosoh Corp. (Japan) | | | 9,500 | | | | 141,267 | |
Yara International ASA (Brazil) | | | 350 | | | | 17,659 | |
| | | | | | | | |
| | |
| | | | | | | 28,068,876 | |
| | | | | | | | |
Commercial Services & Supplies — 0.2% | | | | | |
Cintas Corp. | | | 3,420 | | | | 1,515,641 | |
Copart, Inc.* | | | 7,900 | | | | 1,197,798 | |
Rentokil Initial PLC (United Kingdom) | | | 3,827 | | | | 30,288 | |
Republic Services, Inc. | | | 7,765 | | | | 1,082,829 | |
Rollins, Inc. | | | 8,700 | | | | 297,627 | |
SEE NOTES TO FINANCIAL STATEMENTS.
A11
| | | | | | |
| | |
| | PSF PGIM 50/50 BALANCED PORTFOLIO (CONTINUED) | | |
| | | | | | |
| |
| SCHEDULE OF INVESTMENTS | | as of December 31, 2021 |
| | | | | | | | |
| | | Shares | | | Value | |
| | |
| COMMON STOCKS (continued) | | | | | | | | |
Commercial Services & Supplies (cont’d.) | | | | | |
Securitas AB (Sweden) (Class B Stock) | | | 663 | | | $ | 9,123 | |
Waste Management, Inc. | | | 14,542 | | | | 2,427,060 | |
| | | | | | | | |
| | |
| | | | | | | 6,560,366 | |
| | | | | | | | |
Communications Equipment — 0.5% | | | | | | | | |
Arista Networks, Inc.* | | | 8,300 | | | | 1,193,125 | |
Cisco Systems, Inc. | | | 158,100 | | | | 10,018,797 | |
F5, Inc.* | | | 2,300 | | | | 562,833 | |
Juniper Networks, Inc. | | | 12,000 | | | | 428,520 | |
Motorola Solutions, Inc. | | | 6,489 | | | | 1,763,061 | |
Nokia OYJ (Finland)* | | | 11,130 | | | | 70,161 | |
| | | | | | | | |
| | |
| | | | | | | 14,036,497 | |
| | | | | | | | |
Construction & Engineering — 0.0% | | | | | | | | |
Eiffage SA (France) | | | 180 | | | | 18,546 | |
Quanta Services, Inc. | | | 5,100 | | | | 584,766 | |
Skanska AB (Sweden) (Class B Stock) | | | 437 | | | | 11,315 | |
Vinci SA (France) | | | 1,115 | | | | 117,796 | |
| | | | | | | | |
| | |
| | | | | | | 732,423 | |
| | | | | | | | |
Construction Materials — 0.1% | | | | | | | | |
HeidelbergCement AG (Germany) | | | 1,503 | | | | 101,917 | |
Martin Marietta Materials, Inc. | | | 2,480 | | | | 1,092,489 | |
Vulcan Materials Co. | | | 5,100 | | | | 1,058,658 | |
| | | | | | | | |
| | |
| | | | | | | 2,253,064 | |
| | | | | | | | |
Consumer Finance — 0.3% | | | | | | | | |
American Express Co. | | | 23,600 | | | | 3,860,960 | |
Capital One Financial Corp. | | | 16,561 | | | | 2,402,836 | |
Discover Financial Services | | | 11,140 | | | | 1,287,338 | |
Synchrony Financial | | | 21,172 | | | | 982,169 | |
| | | | | | | | |
| | |
| | | | | | | 8,533,303 | |
| | | | | | | | |
Containers & Packaging — 0.2% | | | | | | | | |
Amcor PLC | | | 59,850 | | | | 718,798 | |
Avery Dennison Corp. | | | 3,100 | | | | 671,367 | |
Ball Corp. | | | 12,100 | | | | 1,164,867 | |
International Paper Co. | | | 14,473 | | | | 679,942 | |
Packaging Corp. of America | | | 3,500 | | | | 476,525 | |
Sealed Air Corp. | | | 5,700 | | | | 384,579 | |
Smurfit Kappa Group PLC (Ireland) | | | 4,519 | | | | 249,130 | |
Westrock Co. | | | 10,444 | | | | 463,296 | |
| | | | | | | | |
| | |
| | | | | | | 4,808,504 | |
| | | | | | | | |
Distributors — 0.1% | | | | | | | | |
Genuine Parts Co. | | | 5,500 | | | | 771,100 | |
LKQ Corp. | | | 10,000 | | | | 600,300 | |
Pool Corp. | | | 1,480 | | | | 837,680 | |
| | | | | | | | |
| | |
| | | | | | | 2,209,080 | |
| | | | | | | | |
Diversified Consumer Services — 0.0% | | | | | | | | |
IDP Education Ltd. (Australia) | | | 448 | | | | 11,293 | |
| | | | | | | | |
Diversified Financial Services — 0.7% | | | | | | | | |
Berkshire Hathaway, Inc. (Class B Stock)* | | | 69,230 | | | | 20,699,770 | |
EXOR NV (Netherlands) | | | 154 | | | | 13,869 | |
Industrivarden AB (Sweden) (Class A Stock) | | | 49 | | | | 1,560 | |
| | | | | | | | |
| | | Shares | | | Value | |
| | |
| COMMON STOCKS (continued) | | | | | | | | |
Diversified Financial Services (cont’d.) | | | | | |
Investor AB (Sweden) (Class A Stock) | | | 1,064 | | | $ | 28,121 | |
Investor AB (Sweden) (Class B Stock) | | | 3,828 | | | | 96,245 | |
| | | | | | | | |
| | |
| | | | | | | 20,839,565 | |
| | | | | | | | |
Diversified Telecommunication Services — 0.5% | | | | | |
AT&T, Inc. | | | 267,936 | | | | 6,591,226 | |
Deutsche Telekom AG (Germany) | | | 6,933 | | | | 128,364 | |
Elisa OYJ (Finland) | | | 297 | | | | 18,283 | |
Koninklijke KPN NV (Netherlands) | | | 48,562 | | | | 150,948 | |
Lumen Technologies, Inc.(a) | | | 37,179 | | | | 466,596 | |
Nippon Telegraph & Telephone Corp. (Japan) | | | 5,400 | | | | 147,924 | |
Telefonica Deutschland Holding AG (Germany) | | | 73,551 | | | | 204,343 | |
Telefonica SA (Spain) | | | 29,040 | | | | 127,117 | |
Verizon Communications, Inc. | | | 155,676 | | | | 8,088,925 | |
| | | | | | | | |
| | |
| | | | | | | 15,923,726 | |
| | | | | | | | |
Electric Utilities — 0.9% | | | | | | | | |
Alliant Energy Corp. | | | 9,300 | | | | 571,671 | |
American Electric Power Co., Inc. | | | 18,560 | | | | 1,651,283 | |
Chubu Electric Power Co., Inc. (Japan) | | | 1,200 | | | | 12,680 | |
CK Infrastructure Holdings Ltd. (Hong Kong) | | | 1,500 | | | | 9,558 | |
Duke Energy Corp. | | | 28,861 | | | | 3,027,519 | |
Edison International | | | 14,100 | | | | 962,325 | |
Electricite de France SA (France) | | | 2,448 | | | | 28,762 | |
Endesa SA (Spain) | | | 10,083 | | | | 231,678 | |
Enel SpA (Italy) | | | 16,295 | | | | 130,480 | |
Entergy Corp. | | | 7,700 | | | | 867,405 | |
Evergy, Inc. | | | 8,500 | | | | 583,185 | |
Eversource Energy | | | 12,700 | | | | 1,155,446 | |
Exelon Corp. | | | 36,313 | | | | 2,097,439 | |
FirstEnergy Corp. | | | 20,156 | | | | 838,288 | |
Fortum OYJ (Finland) | | | 930 | | | | 28,510 | |
Iberdrola SA (Spain) | | | 19,293 | | | | 228,303 | |
NextEra Energy, Inc. | | | 73,600 | | | | 6,871,296 | |
NRG Energy, Inc. | | | 8,700 | | | | 374,796 | |
Pinnacle West Capital Corp. | | | 4,100 | | | | 289,419 | |
Power Assets Holdings Ltd. (Hong Kong) | | | 28,500 | | | | 177,635 | |
PPL Corp. | | | 29,900 | | | | 898,794 | |
Red Electrica Corp. SA (Spain) | | | 911 | | | | 19,753 | |
Southern Co. (The) | | | 39,300 | | | | 2,695,194 | |
SSE PLC (United Kingdom) | | | 7,676 | | | | 171,174 | |
Xcel Energy, Inc. | | | 20,010 | | | | 1,354,677 | |
| | | | | | | | |
| | |
| | | | | | | 25,277,270 | |
| | | | | | | | |
Electrical Equipment — 0.3% | | | | | | | | |
AMETEK, Inc. | | | 8,600 | | | | 1,264,544 | |
Eaton Corp. PLC | | | 14,937 | | | | 2,581,412 | |
Emerson Electric Co. | | | 22,200 | | | | 2,063,934 | |
Generac Holdings, Inc.* | | | 2,500 | | | | 879,800 | |
Mitsubishi Electric Corp. (Japan) | | | 3,700 | | | | 47,017 | |
Rockwell Automation, Inc. | | | 4,500 | | | | 1,569,825 | |
Schneider Electric SE | | | 1,105 | | | | 216,885 | |
| | | | | | | | |
| | |
| | | | | | | 8,623,417 | |
| | | | | | | | |
SEE NOTES TO FINANCIAL STATEMENTS.
A12
| | | | | | |
| | |
| | PSF PGIM 50/50 BALANCED PORTFOLIO (CONTINUED) | | |
| | | | | | |
| |
| SCHEDULE OF INVESTMENTS | | as of December 31, 2021 |
| | | | | | | | |
| | | Shares | | | Value | |
| | |
| COMMON STOCKS (continued) | | | | | | | | |
Electronic Equipment, Instruments & Components — 0.4% | |
Amphenol Corp. (Class A Stock) | | | 22,200 | | | $ | 1,941,612 | |
CDW Corp. | | | 5,050 | | | | 1,034,139 | |
Corning, Inc. | | | 28,500 | | | | 1,061,055 | |
IPG Photonics Corp.* | | | 1,400 | | | | 240,996 | |
Keyence Corp. (Japan) | | | 500 | | | | 313,894 | |
Keysight Technologies, Inc.* | | | 6,800 | | | | 1,404,268 | |
TE Connectivity Ltd. | | | 12,200 | | | | 1,968,348 | |
Teledyne Technologies, Inc.* | | | 1,860 | | | | 812,615 | |
Trimble, Inc.* | | | 9,300 | | | | 810,867 | |
Zebra Technologies Corp. (Class A Stock)* | | | 1,970 | | | | 1,172,544 | |
| | | | | | | | |
| | |
| | | | | | | 10,760,338 | |
| | | | | | | | |
Energy Equipment & Services — 0.1% | | | | | | | | |
Baker Hughes Co. | | | 30,698 | | | | 738,594 | |
Halliburton Co. | | | 33,300 | | | | 761,571 | |
Schlumberger NV | | | 51,924 | | | | 1,555,124 | |
| | | | | | | | |
| | |
| | | | | | | 3,055,289 | |
| | | | | | | | |
Entertainment — 0.9% | | | | | | | | |
Activision Blizzard, Inc. | | | 28,900 | | | | 1,922,717 | |
Electronic Arts, Inc. | | | 10,500 | | | | 1,384,950 | |
Konami Holdings Corp. (Japan) | | | 200 | | | | 9,568 | |
Live Nation Entertainment, Inc.* | | | 4,900 | | | | 586,481 | |
Netflix, Inc.* | | | 16,610 | | | | 10,006,528 | |
Nintendo Co. Ltd. (Japan) | | | 300 | | | | 139,930 | |
Take-Two Interactive Software, Inc.* | | | 4,500 | | | | 799,740 | |
Walt Disney Co. (The)* | | | 68,182 | | | | 10,560,710 | |
| | | | | | | | |
| | |
| | | | | | | 25,410,624 | |
| | | | | | | | |
Equity Real Estate Investment Trusts (REITs) — 1.4% | |
Alexandria Real Estate Equities, Inc. | | | 5,380 | | | | 1,199,525 | |
American Tower Corp. | | | 17,060 | | | | 4,990,050 | |
AvalonBay Communities, Inc. | | | 5,375 | | | | 1,357,671 | |
Boston Properties, Inc. | | | 5,200 | | | | 598,936 | |
Crown Castle International Corp. | | | 16,200 | | | | 3,381,588 | |
Dexus (Australia) | | | 29,980 | | | | 243,366 | |
Digital Realty Trust, Inc. | | | 10,500 | | | | 1,857,135 | |
Duke Realty Corp. | | | 14,000 | | | | 918,960 | |
Equinix, Inc. | | | 3,364 | | | | 2,845,406 | |
Equity Residential | | | 12,600 | | | | 1,140,300 | |
Essex Property Trust, Inc. | | | 2,550 | | | | 898,186 | |
Extra Space Storage, Inc. | | | 4,900 | | | | 1,110,977 | |
Federal Realty Investment Trust | | | 2,700 | | | | 368,064 | |
Goodman Group (Australia) | | | 3,740 | | | | 72,161 | |
GPT Group (The) (Australia) | | | 4,163 | | | | 16,443 | |
Healthpeak Properties, Inc. | | | 20,900 | | | | 754,281 | |
Host Hotels & Resorts, Inc.* | | | 26,682 | | | | 464,000 | |
Iron Mountain, Inc.(a) | | | 11,302 | | | | 591,434 | |
Kimco Realty Corp. | | | 23,700 | | | | 584,205 | |
Klepierre SA (France)* | | | 435 | | | | 10,311 | |
Link REIT (Hong Kong) | | | 4,400 | | | | 38,721 | |
Mid-America Apartment Communities, Inc. | | | 4,500 | | | | 1,032,480 | |
Prologis, Inc. | | | 27,777 | | | | 4,676,536 | |
Public Storage | | | 5,820 | | | | 2,179,939 | |
Realty Income Corp. | | | 21,300 | | | | 1,524,867 | |
Regency Centers Corp. | | | 5,600 | | | | 421,960 | |
| | | | | | | | |
| | | Shares | | | Value | |
| | |
| COMMON STOCKS (continued) | | | | | | | | |
Equity Real Estate Investment Trusts (REITs) (cont’d.) | |
SBA Communications Corp. | | | 4,000 | | | $ | 1,556,080 | |
Simon Property Group, Inc. | | | 12,393 | | | | 1,980,030 | |
Stockland (Australia) | | | 49,094 | | | | 151,409 | |
UDR, Inc. | | | 10,300 | | | | 617,897 | |
Ventas, Inc. | | | 14,568 | | | | 744,716 | |
Vornado Realty Trust | | | 6,125 | | | | 256,393 | |
Welltower, Inc. | | | 15,700 | | | | 1,346,589 | |
Weyerhaeuser Co. | | | 27,818 | | | | 1,145,545 | |
| | | | | | | | |
| | |
| | | | | | | 41,076,161 | |
| | | | | | | | |
Food & Staples Retailing — 0.8% | | | | | | | | |
Carrefour SA (France) | | | 1,080 | | | | 19,797 | |
Coles Group Ltd. (Australia) | | | 2,544 | | | | 33,192 | |
Costco Wholesale Corp. | | | 16,580 | | | | 9,412,466 | |
Etablissements Franz Colruyt NV (Belgium) | | | 120 | | | | 5,085 | |
Jeronimo Martins SGPS SA (Portugal) | | | 496 | | | | 11,332 | |
Kesko OYJ (Finland) (Class B Stock) | | | 528 | | | | 17,615 | |
Koninklijke Ahold Delhaize NV (Netherlands) | | | 9,594 | | | | 328,824 | |
Kroger Co. (The) | | | 25,192 | | | | 1,140,190 | |
Seven & i Holdings Co. Ltd. (Japan) | | | 1,100 | | | | 48,344 | |
Sysco Corp. | | | 19,000 | | | | 1,492,450 | |
Tesco PLC (United Kingdom) | | | 33,576 | | | | 131,797 | |
Walgreens Boots Alliance, Inc. | | | 26,600 | | | | 1,387,456 | |
Walmart, Inc. | | | 53,600 | | | | 7,755,384 | |
| | | | | | | | |
| | |
| | | | | | | 21,783,932 | |
| | | | | | | | |
Food Products — 0.5% | | | | | | | | |
Archer-Daniels-Midland Co. | | | 20,726 | | | | 1,400,870 | |
Campbell Soup Co.(a) | | | 7,900 | | | | 343,334 | |
Conagra Brands, Inc. | | | 18,500 | | | | 631,775 | |
General Mills, Inc. | | | 22,500 | | | | 1,516,050 | |
Hershey Co. (The) | | | 5,700 | | | | 1,102,779 | |
Hormel Foods Corp. | | | 11,000 | | | | 536,910 | |
J.M. Smucker Co. (The) | | | 4,200 | | | | 570,444 | |
Kellogg Co.(a) | | | 9,500 | | | | 611,990 | |
Kraft Heinz Co. (The) | | | 26,767 | | | | 960,935 | |
Lamb Weston Holdings, Inc. | | | 5,400 | | | | 342,252 | |
McCormick & Co., Inc. | | | 9,540 | | | | 921,660 | |
MEIJI Holdings Co. Ltd. (Japan) | | | 300 | | | | 17,899 | |
Mondelez International, Inc. (Class A Stock) | | | 52,453 | | | | 3,478,159 | |
Nestle SA (Switzerland) | | | 4,179 | | | | 584,873 | |
NH Foods Ltd. (Japan) | | | 200 | | | | 7,202 | |
Orkla ASA (Norway) | | | 22,383 | | | | 224,584 | |
Tate & Lyle PLC (United Kingdom) | | | 5,783 | | | | 51,789 | |
Tyson Foods, Inc. (Class A Stock) | | | 10,900 | | | | 950,044 | |
Wilmar International Ltd. (China) | | | 74,800 | | | | 230,562 | |
| | | | | | | | |
| | |
| | | | | | | 14,484,111 | |
| | | | | | | | |
Gas Utilities — 0.0% | | | | | | | | |
Atmos Energy Corp. | | | 4,800 | | | | 502,896 | |
Osaka Gas Co. Ltd. (Japan) | | | 800 | | | | 13,248 | |
Snam SpA (Italy) | | | 4,231 | | | | 25,501 | |
| | | | | | | | |
| | |
| | | | | | | 541,645 | |
| | | | | | | | |
SEE NOTES TO FINANCIAL STATEMENTS.
A13
| | | | | | |
| | |
| | PSF PGIM 50/50 BALANCED PORTFOLIO (CONTINUED) | | |
| | | | | | |
| |
| SCHEDULE OF INVESTMENTS | | as of December 31, 2021 |
| | | | | | | | |
| | | Shares | | | Value | |
| | |
| COMMON STOCKS (continued) | | | | | | | | |
Health Care Equipment & Supplies — 1.6% | | | | | |
Abbott Laboratories | | | 66,500 | | | $ | 9,359,210 | |
ABIOMED, Inc.* | | | 1,660 | | | | 596,222 | |
Align Technology, Inc.* | | | 2,720 | | | | 1,787,530 | |
Baxter International, Inc. | | | 18,900 | | | | 1,622,376 | |
Becton, Dickinson & Co. | | | 10,810 | | | | 2,718,499 | |
Boston Scientific Corp.* | | | 52,867 | | | | 2,245,790 | |
Cooper Cos., Inc. (The) | | | 1,840 | | | | 770,850 | |
DENTSPLY SIRONA, Inc. | | | 8,600 | | | | 479,794 | |
Dexcom, Inc.* | | | 3,640 | | | | 1,954,498 | |
Edwards Lifesciences Corp.* | | | 23,400 | | | | 3,031,470 | |
Hologic, Inc.* | | | 9,400 | | | | 719,664 | |
Hoya Corp. (Japan) | | | 800 | | | | 118,676 | |
IDEXX Laboratories, Inc.* | | | 3,160 | | | | 2,080,734 | |
Intuitive Surgical, Inc.* | | | 13,460 | | | | 4,836,178 | |
Medtronic PLC | | | 50,490 | | | | 5,223,190 | |
ResMed, Inc. | | | 5,600 | | | | 1,458,688 | |
STERIS PLC | | | 3,850 | | | | 937,128 | |
Straumann Holding AG (Switzerland) | | | 20 | | | | 42,514 | |
Stryker Corp. | | | 12,600 | | | | 3,369,492 | |
Teleflex, Inc. | | | 1,800 | | | | 591,264 | |
Zimmer Biomet Holdings, Inc. | | | 7,700 | | | | 978,208 | |
| | | | | | | | |
| | |
| | | | | | | 44,921,975 | |
| | | | | | | | |
Health Care Providers & Services — 1.5% | | | | | | | | |
AmerisourceBergen Corp. | | | 5,700 | | | | 757,473 | |
Anthem, Inc. | | | 9,200 | | | | 4,264,568 | |
Cardinal Health, Inc. | | | 11,150 | | | | 574,114 | |
Centene Corp.* | | | 21,650 | | | | 1,783,960 | |
Cigna Corp. | | | 12,800 | | | | 2,939,264 | |
CVS Health Corp. | | | 49,483 | | | | 5,104,666 | |
DaVita, Inc.* | | | 2,700 | | | | 307,152 | |
Fresenius SE & Co. KGaA (Germany) | | | 5,262 | | | | 211,654 | |
HCA Healthcare, Inc. | | | 9,300 | | | | 2,389,356 | |
Henry Schein, Inc.* | | | 5,300 | | | | 410,909 | |
Humana, Inc. | | | 4,950 | | | | 2,296,107 | |
Laboratory Corp. of America Holdings* | | | 3,600 | | | | 1,131,156 | |
McKesson Corp. | | | 5,930 | | | | 1,474,020 | |
Medipal Holdings Corp. (Japan) | | | 11,800 | | | | 221,330 | |
Quest Diagnostics, Inc. | | | 4,700 | | | | 813,147 | |
Sonic Healthcare Ltd. (Australia) | | | 8,342 | | | | 283,379 | |
UnitedHealth Group, Inc. | | | 35,360 | | | | 17,755,670 | |
Universal Health Services, Inc. (Class B Stock) | | | 3,000 | | | | 388,980 | |
| | | | | | | | |
| | |
| | | | | | | 43,106,905 | |
| | | | | | | | |
Health Care Technology — 0.0% | | | | | | | | |
Cerner Corp. | | | 10,900 | | | | 1,012,283 | |
| | | | | | | | |
Hotels, Restaurants & Leisure — 1.0% | | | | | | | | |
Aristocrat Leisure Ltd. (Australia) | | | 418 | | | | 13,251 | |
Booking Holdings, Inc.* | | | 1,540 | | | | 3,694,814 | |
Caesars Entertainment, Inc.* | | | 8,200 | | | | 766,946 | |
Carnival Corp.*(a) | | | 31,000 | | | | 623,720 | |
Chipotle Mexican Grill, Inc.* | | | 1,060 | | | | 1,853,145 | |
Darden Restaurants, Inc. | | | 5,050 | | | | 760,732 | |
Domino’s Pizza, Inc. | | | 1,360 | | | | 767,489 | |
Evolution AB (Sweden), 144A | | | 1,208 | | | | 171,235 | |
Expedia Group, Inc.* | | | 5,350 | | | | 966,852 | |
Hilton Worldwide Holdings, Inc.* | | | 10,300 | | | | 1,606,697 | |
| | | | | | | | |
| | | Shares | | | Value | |
| | |
| COMMON STOCKS (continued) | | | | | | | | |
Hotels, Restaurants & Leisure (cont’d.) | | | | | |
InterContinental Hotels Group PLC (United Kingdom)* | | | 220 | | | $ | 14,241 | |
La Francaise des Jeux SAEM (France), 144A | | | 195 | | | | 8,639 | |
Las Vegas Sands Corp.* | | | 13,350 | | | | 502,494 | |
Marriott International, Inc. (Class A Stock)* | | | 10,328 | | | | 1,706,599 | |
McDonald’s Corp. | | | 28,100 | | | | 7,532,767 | |
McDonald’s Holdings Co. Japan Ltd. (Japan) | | | 5,000 | | | | 221,332 | |
MGM Resorts International | | | 15,000 | | | | 673,200 | |
Norwegian Cruise Line Holdings Ltd.*(a) | | | 13,800 | | | | 286,212 | |
Penn National Gaming, Inc.*(a) | | | 6,000 | | | | 311,100 | |
Royal Caribbean Cruises Ltd.*(a) | | | 8,700 | | | | 669,030 | |
Sodexo SA (France) | | | 184 | | | | 16,163 | |
Starbucks Corp. | | | 44,300 | | | | 5,181,771 | |
Wynn Resorts Ltd.* | | | 3,900 | | | | 331,656 | |
Yum! Brands, Inc. | | | 11,600 | | | | 1,610,776 | |
| | | | | | | | |
| | |
| | | | | | | 30,290,861 | |
| | | | | | | | |
Household Durables — 0.2% | | | | | | | | |
Barratt Developments PLC (United Kingdom) | | | 2,156 | | | | 21,795 | |
D.R. Horton, Inc. | | | 12,100 | | | | 1,312,245 | |
Electrolux AB (Sweden) (Class B Stock) | | | 450 | | | | 10,925 | |
Garmin Ltd. | | | 5,600 | | | | 762,552 | |
Iida Group Holdings Co. Ltd. (Japan) | | | 10,100 | | | | 235,242 | |
Lennar Corp. (Class A Stock) | | | 10,200 | | | | 1,184,832 | |
Mohawk Industries, Inc.* | | | 2,240 | | | | 408,083 | |
Newell Brands, Inc. | | | 13,814 | | | | 301,698 | |
NVR, Inc.* | | | 130 | | | | 768,153 | |
Persimmon PLC (United Kingdom) | | | 658 | | | | 25,423 | |
PulteGroup, Inc. | | | 10,122 | | | | 578,574 | |
Sony Group Corp. (Japan) | | | 500 | | | | 62,957 | |
Whirlpool Corp.(a) | | | 2,426 | | | | 569,285 | |
| | | | | | | | |
| | |
| | | | | | | 6,241,764 | |
| | | | | | | | |
Household Products — 0.7% | | | | | | | | |
Church & Dwight Co., Inc. | | | 9,100 | | | | 932,750 | |
Clorox Co. (The) | | | 4,500 | | | | 784,620 | |
Colgate-Palmolive Co. | | | 31,700 | | | | 2,705,278 | |
Henkel AG & Co. KGaA (Germany) | | | 198 | | | | 15,447 | |
Kimberly-Clark Corp. | | | 12,500 | | | | 1,786,500 | |
Procter & Gamble Co. (The) | | | 91,125 | | | | 14,906,227 | |
| | | | | | | | |
| | |
| | | | | | | 21,130,822 | |
| | | | | | | | |
Independent Power & Renewable Electricity Producers — 0.0% | |
AES Corp. (The) | | | 25,900 | | | | 629,370 | |
| | | | | | | | |
Industrial Conglomerates — 0.5% | | | | | | | | |
3M Co. | | | 21,700 | | | | 3,854,571 | |
DCC PLC (United Kingdom) | | | 2,812 | | | | 230,163 | |
General Electric Co. | | | 41,178 | | | | 3,890,086 | |
Honeywell International, Inc. | | | 25,912 | | | | 5,402,911 | |
Roper Technologies, Inc. | | | 4,080 | | | | 2,006,789 | |
Siemens AG (Germany) | | | 173 | | | | 29,889 | |
SEE NOTES TO FINANCIAL STATEMENTS.
A14
| | | | | | |
| | |
| | PSF PGIM 50/50 BALANCED PORTFOLIO (CONTINUED) | | |
| | | | | | |
| |
| SCHEDULE OF INVESTMENTS | | as of December 31, 2021 |
| | | | | | | | |
| | | Shares | | | Value | |
|
| COMMON STOCKS (continued) | |
Industrial Conglomerates (cont’d.) | | | | | | | | |
Toshiba Corp. (Japan) | | | 2,900 | | | $ | 119,177 | |
| | | | | | | | |
| | |
| | | | | | | 15,533,586 | |
| | | | | | | | |
Insurance — 1.0% | | | | | | | | |
Aflac, Inc. | | | 22,900 | | | | 1,337,131 | |
Ageas SA/NV (Belgium) | | | 364 | | | | 18,859 | |
AIA Group Ltd. (Hong Kong) | | | 5,800 | | | | 58,479 | |
Allianz SE (Germany) | | | 1,776 | | | | 418,856 | |
Allstate Corp. (The) | | | 11,000 | | | | 1,294,150 | |
American International Group, Inc. | | | 31,739 | | | | 1,804,680 | |
Aon PLC (Class A Stock) | | | 8,600 | | | | 2,584,816 | |
Arthur J. Gallagher & Co. | | | 7,900 | | | | 1,340,393 | |
Assurant, Inc. | | | 2,200 | | | | 342,892 | |
AXA SA (France) | | | 4,040 | | | | 120,633 | |
Brown & Brown, Inc. | | | 9,100 | | | | 639,548 | |
Chubb Ltd. | | | 16,486 | | | | 3,186,909 | |
Cincinnati Financial Corp. | | | 5,537 | | | | 630,830 | |
Dai-ichi Life Holdings, Inc. (Japan) | | | 4,100 | | | | 82,852 | |
Everest Re Group Ltd. | | | 1,540 | | | | 421,837 | |
Globe Life, Inc. | | | 3,425 | | | | 320,991 | |
Hartford Financial Services Group, Inc. (The) | | | 12,900 | | | | 890,616 | |
Japan Post Holdings Co. Ltd. (Japan) | | | 24,600 | | | | 191,887 | |
Japan Post Insurance Co. Ltd. (Japan) | | | 500 | | | | 8,032 | |
Legal & General Group PLC (United Kingdom) | | | 12,177 | | | | 48,934 | |
Lincoln National Corp. | | | 6,918 | | | | 472,223 | |
Loews Corp. | | | 7,675 | | | | 443,308 | |
Marsh & McLennan Cos., Inc. | | | 19,400 | | | | 3,372,108 | |
Medibank Private Ltd. (Australia) | | | 5,560 | | | | 13,540 | |
MetLife, Inc. | | | 27,050 | | | | 1,690,354 | |
MS&AD Insurance Group Holdings, Inc. (Japan) | | | 1,000 | | | | 30,803 | |
NN Group NV (Netherlands) | | | 5,746 | | | | 312,552 | |
Poste Italiane SpA (Italy), 144A | | | 3,032 | | | | 39,697 | |
Principal Financial Group, Inc. | | | 9,200 | | | | 665,436 | |
Progressive Corp. (The) | | | 22,100 | | | | 2,268,565 | |
Sompo Holdings, Inc. (Japan) | | | 700 | | | | 29,506 | |
Suncorp Group Ltd. (Australia) | | | 2,262 | | | | 18,250 | |
T&D Holdings, Inc. (Japan) | | | 1,200 | | | | 15,308 | |
Travelers Cos., Inc. (The) | | | 9,235 | | | | 1,444,631 | |
W.R. Berkley Corp. | | | 5,200 | | | | 428,428 | |
Willis Towers Watson PLC | | | 4,740 | | | | 1,125,703 | |
Zurich Insurance Group AG
(Switzerland) | | | 311 | | | | 136,371 | |
| | | | | | | | |
| | |
| | | | | | | 28,250,108 | |
| | | | | | | | |
Interactive Media & Services — 3.3% | | | | | | | | |
Alphabet, Inc. (Class A Stock)* | | | 11,300 | | | | 32,736,552 | |
Alphabet, Inc. (Class C Stock)* | | | 10,523 | | | | 30,449,248 | |
Auto Trader Group PLC (United
Kingdom), 144A | | | 1,230 | | | | 12,321 | |
Match Group, Inc.* | | | 10,300 | | | | 1,362,175 | |
Meta Platforms, Inc. (Class A Stock)* | | | 89,030 | | | | 29,945,240 | |
Twitter, Inc.* | | | 29,600 | | | | 1,279,312 | |
| | | | | | | | |
| | |
| | | | | | | 95,784,848 | |
| | | | | | | | |
| | | | | | | | |
| | | Shares | | | Value | |
| | |
| COMMON STOCKS (continued) | | | | | | | | |
Internet & Direct Marketing Retail — 2.0% | | | | | |
Amazon.com, Inc.* | | | 16,410 | | | $ | 54,716,519 | |
eBay, Inc. | | | 24,100 | | | | 1,602,650 | |
Etsy, Inc.* | | | 4,700 | | | | 1,029,018 | |
| | | | | | | | |
| | |
| | | | | | | 57,348,187 | |
| | | | | | | | |
IT Services — 2.4% | | | | | | | | |
Accenture PLC (Class A Stock) | | | 23,800 | | | | 9,866,290 | |
Adyen NV (Netherlands), 144A* | | | 41 | | | | 107,805 | |
Akamai Technologies, Inc.* | | | 6,000 | | | | 702,240 | |
Automatic Data Processing, Inc. | | | 15,900 | | | | 3,920,622 | |
Bechtle AG (Germany) | | | 180 | | | | 12,905 | |
Broadridge Financial Solutions, Inc. | | | 4,500 | | | | 822,690 | |
Capgemini SE (France) | | | 557 | | | | 136,614 | |
Cognizant Technology Solutions Corp.
(Class A Stock) | | | 19,500 | | | | 1,730,040 | |
DXC Technology Co.* | | | 9,028 | | | | 290,611 | |
EPAM Systems, Inc.* | | | 2,140 | | | | 1,430,483 | |
Fidelity National Information Services,
Inc. | | | 23,200 | | | | 2,532,280 | |
Fiserv, Inc.* | | | 22,400 | | | | 2,324,896 | |
FleetCor Technologies, Inc.* | | | 3,200 | | | | 716,288 | |
Fujitsu Ltd. (Japan) | | | 1,700 | | | | 290,519 | |
Gartner, Inc.* | | | 3,100 | | | | 1,036,392 | |
Global Payments, Inc. | | | 10,877 | | | | 1,470,353 | |
International Business Machines Corp. | | | 33,700 | | | | 4,504,342 | |
Jack Henry & Associates, Inc. | | | 2,900 | | | | 484,271 | |
Mastercard, Inc. (Class A Stock) | | | 32,750 | | | | 11,767,730 | |
NEC Corp. (Japan) | | | 500 | | | | 23,092 | |
NTT Data Corp. (Japan) | | | 1,400 | | | | 30,040 | |
Paychex, Inc. | | | 11,900 | | | | 1,624,350 | |
PayPal Holdings, Inc.* | | | 44,100 | | | | 8,316,378 | |
TIS, Inc. (Japan) | | | 500 | | | | 14,861 | |
VeriSign, Inc.* | | | 3,800 | | | | 964,516 | |
Visa, Inc. (Class A Stock)(a) | | | 63,300 | | | | 13,717,743 | |
| | | | | | | | |
| | |
| | | | | | | 68,838,351 | |
| | | | | | | | |
Leisure Products — 0.0% | | | | | | | | |
Hasbro, Inc.(a) | | | 5,100 | | | | 519,078 | |
| | | | | | | | |
Life Sciences Tools & Services — 1.1% | | | | | | | | |
Agilent Technologies, Inc. | | | 11,414 | | | | 1,822,245 | |
Bio-Rad Laboratories, Inc. (Class A
Stock)* | | | 800 | | | | 604,456 | |
Bio-Techne Corp. | | | 1,600 | | | | 827,744 | |
Charles River Laboratories
International, Inc.* | | | 1,960 | | | | 738,489 | |
Danaher Corp. | | | 23,900 | | | | 7,863,339 | |
Eurofins Scientific SE (Luxembourg) | | | 269 | | | | 33,328 | |
Illumina, Inc.* | | | 5,900 | | | | 2,244,596 | |
IQVIA Holdings, Inc.* | | | 7,300 | | | | 2,059,622 | |
Mettler-Toledo International, Inc.* | | | 880 | | | | 1,493,545 | |
PerkinElmer, Inc. | | | 4,800 | | | | 965,088 | |
Thermo Fisher Scientific, Inc. | | | 14,760 | | | | 9,848,462 | |
Waters Corp.* | | | 2,400 | | | | 894,240 | |
West Pharmaceutical Services, Inc. | | | 2,900 | | | | 1,360,129 | |
| | | | | | | | |
| | |
| | | | | | | 30,755,283 | |
| | | | | | | | |
SEE NOTES TO FINANCIAL STATEMENTS.
A15
| | | | | | |
| | |
| | PSF PGIM 50/50 BALANCED PORTFOLIO (CONTINUED) | | |
| | | | | | |
| |
| SCHEDULE OF INVESTMENTS | | as of December 31, 2021 |
| | | | | | | | |
| | | Shares | | | Value | |
| | |
| COMMON STOCKS (continued) | | | | | | | | |
Machinery — 0.8% | | | | | | | | |
Atlas Copco AB (Sweden) (Class B
Stock) | | | 754 | | | $ | 44,228 | |
Caterpillar, Inc. | | | 20,600 | | | | 4,258,844 | |
CNH Industrial NV (United Kingdom) | | | 2,144 | | | | 41,762 | |
Cummins, Inc. | | | 5,500 | | | | 1,199,770 | |
Daimler Truck Holding AG (Germany)* | | | 1,875 | | | | 68,911 | |
Deere & Co. | | | 10,540 | | | | 3,614,061 | |
Dover Corp. | | | 5,300 | | | | 962,480 | |
Epiroc AB (Sweden) (Class B Stock) | | | 784 | | | | 16,649 | |
Fortive Corp. | | | 13,250 | | | | 1,010,842 | |
GEA Group AG (Germany) | | | 323 | | | | 17,636 | |
Hino Motors Ltd. (Japan) | | | 12,400 | | | | 102,028 | |
Husqvarna AB (Sweden) (Class B
Stock) | | | 3,554 | | | | 56,792 | |
IDEX Corp. | | | 2,910 | | | | 687,691 | |
Illinois Tool Works, Inc. | | | 10,800 | | | | 2,665,440 | |
Ingersoll Rand, Inc. | | | 15,000 | | | | 928,050 | |
Komatsu Ltd. (Japan) | | | 1,800 | | | | 42,124 | |
MISUMI Group, Inc. (Japan) | | | 600 | | | | 24,645 | |
NGK Insulators Ltd. (Japan) | | | 13,300 | | | | 225,010 | |
Otis Worldwide Corp. | | | 15,801 | | | | 1,375,793 | |
PACCAR, Inc. | | | 12,843 | | | | 1,133,523 | |
Parker-Hannifin Corp. | | | 4,965 | | | | 1,579,466 | |
Pentair PLC(a) | | | 6,577 | | | | 480,318 | |
Schindler Holding AG (Switzerland) | | | 71 | | | | 18,991 | |
SKF AB (Sweden) (Class B Stock) | | | 750 | | | | 17,740 | |
SMC Corp. (Japan) | | | 200 | | | | 134,752 | |
Snap-on, Inc. | | | 2,100 | | | | 452,298 | |
Stanley Black & Decker, Inc. | | | 5,997 | | | | 1,131,154 | |
Techtronic Industries Co. Ltd. (Hong Kong) | | | 3,000 | | | | 59,751 | |
Volvo AB (Sweden) (Class A Stock) | | | 442 | | | | 10,370 | |
Westinghouse Air Brake Technologies
Corp. | | | 6,951 | | | | 640,257 | |
Xylem, Inc.(a) | | | 6,700 | | | | 803,464 | |
| | | | | | | | |
| | |
| | | | | | | 23,804,840 | |
| | | | | | | | |
Marine — 0.0% | | | | | | | | |
AP Moller - Maersk A/S (Denmark)
(Class A Stock) | | | 6 | | | | 19,985 | |
AP Moller - Maersk A/S (Denmark)
(Class B Stock) | | | 90 | | | | 322,881 | |
Kuehne + Nagel International AG
(Switzerland) | | | 436 | | | | 140,692 | |
Nippon Yusen KK (Japan) | | | 400 | | | | 30,459 | |
SITC International Holdings Co. Ltd.
(China) | | | 32,000 | | | | 115,817 | |
| | | | | | | | |
| | |
| | | | | | | 629,834 | |
| | | | | | | | |
Media — 0.5% | | | | | | | | |
Charter Communications, Inc. (Class A
Stock)* | | | 4,760 | | | | 3,103,377 | |
Comcast Corp. (Class A Stock) | | | 171,880 | | | | 8,650,720 | |
Dentsu Group, Inc. (Japan) | | | 500 | | | | 17,825 | |
Discovery, Inc. (Class A Stock)*(a) | | | 6,400 | | | | 150,656 | |
Discovery, Inc. (Class C Stock)*(a) | | | 11,800 | | | | 270,220 | |
DISH Network Corp. (Class A Stock)* | | | 9,017 | | | | 292,512 | |
Fox Corp. (Class A Stock) | | | 12,100 | | | | 446,490 | |
Fox Corp. (Class B Stock) | | | 5,733 | | | | 196,470 | |
| | | | | | | | |
| | | Shares | | | Value | |
| | |
| COMMON STOCKS (continued) | | | | | | | | |
Media (cont’d.) | | | | | | | | |
Interpublic Group of Cos., Inc. (The)(a) | | | 14,531 | | | $ | 544,186 | |
News Corp. (Class A Stock) | | | 15,175 | | | | 338,554 | |
News Corp. (Class B Stock) | | | 4,800 | | | | 108,000 | |
Omnicom Group, Inc.(a) | | | 8,300 | | | | 608,141 | |
Publicis Groupe SA (France) | | | 2,740 | | | | 184,504 | |
ViacomCBS, Inc. (Class B Stock) | | | 23,030 | | | | 695,045 | |
Vivendi SE (France) | | | 1,219 | | | | 16,500 | |
WPP PLC (United Kingdom) | | | 18,535 | | | | 280,403 | |
| | | | | | | | |
| | |
| | | | | | | 15,903,603 | |
| | | | | | | | |
Metals & Mining — 0.2% | | | | | | | | |
Anglo American PLC (South Africa) | | | 2,595 | | | | 106,139 | |
ArcelorMittal SA (Luxembourg) | | | 8,083 | | | | 258,652 | |
BHP Group Ltd. (Australia)(a) | | | 6,240 | | | | 188,645 | |
BHP Group PLC (Australia) | | | 1,816 | | | | 54,144 | |
BlueScope Steel Ltd. (Australia) | | | 14,921 | | | | 227,255 | |
Evraz PLC (Russia) | | | 1,057 | | | | 8,624 | |
Fortescue Metals Group Ltd. (Australia) | | | 3,598 | | | | 50,389 | |
Freeport-McMoRan, Inc. | | | 54,488 | | | | 2,273,784 | |
Glencore PLC (Australia)* | | | 20,720 | | | | 105,122 | |
Newmont Corp. | | | 29,600 | | | | 1,835,792 | |
Norsk Hydro ASA (Norway) | | | 2,850 | | | | 22,498 | |
Nucor Corp. | | | 10,900 | | | | 1,244,235 | |
Rio Tinto Ltd. (Australia) | | | 705 | | | | 51,483 | |
Rio Tinto PLC (Australia) | | | 3,274 | | | | 217,168 | |
South32 Ltd. (Australia) | | | 9,633 | | | | 28,250 | |
voestalpine AG (Austria) | | | 240 | | | | 8,766 | |
| | | | | | | | |
| | |
| | | | | | | 6,680,946 | |
| | | | | | | | |
Multiline Retail — 0.3% | | | | | | | | |
Dollar General Corp. | | | 8,900 | | | | 2,098,887 | |
Dollar Tree, Inc.* | | | 8,565 | | | | 1,203,554 | |
Next PLC (United Kingdom) | | | 276 | | | | 30,383 | |
Target Corp. | | | 18,560 | | | | 4,295,526 | |
| | | | | | | | |
| | |
| | | | | | | 7,628,350 | |
| | | | | | | | |
Multi-Utilities — 0.4% | | | | | | | | |
Ameren Corp. | | | 9,500 | | | | 845,595 | |
CenterPoint Energy, Inc. | | | 23,000 | | | | 641,930 | |
CMS Energy Corp. | | | 11,200 | | | | 728,560 | |
Consolidated Edison, Inc. | | | 13,100 | | | | 1,117,692 | |
Dominion Energy, Inc. | | | 30,015 | | | | 2,357,978 | |
DTE Energy Co. | | | 7,200 | | | | 860,688 | |
E.ON SE (Germany) | | | 21,647 | | | | 300,607 | |
Engie SA (France) | | | 10,590 | | | | 156,832 | |
NiSource, Inc. | | | 15,200 | | | | 419,672 | |
Public Service Enterprise Group, Inc. | | | 18,700 | | | | 1,247,851 | |
Sempra Energy | | | 11,819 | | | | 1,563,417 | |
WEC Energy Group, Inc. | | | 11,713 | | | | 1,136,981 | |
| | | | | | | | |
| | |
| | | | | | | 11,377,803 | |
| | | | | | | | |
Oil, Gas & Consumable Fuels — 1.3% | | | | | | | | |
APA Corp. | | | 13,914 | | | | 374,148 | |
BP PLC (United Kingdom) | | | 76,290 | | | | 341,306 | |
Chevron Corp. | | | 72,622 | | | | 8,522,192 | |
ConocoPhillips | | | 50,219 | | | | 3,624,807 | |
Coterra Energy, Inc. | | | 30,400 | | | | 577,600 | |
Devon Energy Corp. | | | 23,400 | | | | 1,030,770 | |
SEE NOTES TO FINANCIAL STATEMENTS.
A16
| | | | | | |
| | |
| | PSF PGIM 50/50 BALANCED PORTFOLIO (CONTINUED) | | |
| | | | | | |
| |
| SCHEDULE OF INVESTMENTS | | as of December 31, 2021 |
| | | | | | | | |
| | | Shares | | | Value | |
| | |
| COMMON STOCKS (continued) | | | | | | | | |
Oil, Gas & Consumable Fuels (cont’d.) | | | | | |
Diamondback Energy, Inc. | | | 6,300 | | | $ | 679,455 | |
EOG Resources, Inc. | | | 21,700 | | | | 1,927,611 | |
Equinor ASA (Norway) | | | 7,504 | | | | 199,067 | |
Exxon Mobil Corp. | | | 158,899 | | | | 9,723,030 | |
Hess Corp. | | | 10,600 | | | | 784,718 | |
Inpex Corp. (Japan) | | | 19,600 | | | | 170,562 | |
Kinder Morgan, Inc. | | | 72,398 | | | | 1,148,232 | |
Lundin Energy AB (Sweden) | | | 5,595 | | | | 200,108 | |
Marathon Oil Corp. | | | 28,782 | | | | 472,600 | |
Marathon Petroleum Corp. | | | 23,719 | | | | 1,517,779 | |
Occidental Petroleum Corp. | | | 32,904 | | | | 953,887 | |
OMV AG (Austria) | | | 4,685 | | | | 266,427 | |
ONEOK, Inc. | | | 16,500 | | | | 969,540 | |
Phillips 66 | | | 16,238 | | | | 1,176,606 | |
Pioneer Natural Resources Co. | | | 8,550 | | | | 1,555,074 | |
Repsol SA (Spain) | | | 2,945 | | | | 34,988 | |
Royal Dutch Shell PLC (Netherlands)
(Class A Stock) | | | 8,420 | | | | 184,834 | |
Royal Dutch Shell PLC (Netherlands)
(Class B Stock) | | | 3,378 | | | | 74,157 | |
TotalEnergies SE (France) | | | 1,440 | | | | 73,190 | |
Valero Energy Corp. | | | 15,200 | | | | 1,141,672 | |
Williams Cos., Inc. (The) | | | 45,100 | | | | 1,174,404 | |
| | | | | | | | |
| | |
| | | | | | | 38,898,764 | |
| | | | | | | | |
Paper & Forest Products — 0.0% | | | | | | | | |
Stora Enso OYJ (Finland) (Class R
Stock) | | | 1,218 | | | | 22,322 | |
| | | | | | | | |
Personal Products — 0.1% | | | | | | | | |
Estee Lauder Cos., Inc. (The)
(Class A Stock) | | | 8,800 | | | | 3,257,760 | |
L’Oreal SA (France) | | | 602 | | | | 285,808 | |
Unilever PLC (United Kingdom) | | | 9,540 | | | | 510,480 | |
| | | | | | | | |
| | |
| | | | | | | 4,054,048 | |
| | | | | | | | |
Pharmaceuticals — 2.1% | | | | | | | | |
AstraZeneca PLC (United Kingdom) | | | 1,092 | | | | 127,888 | |
Bayer AG (Germany) | | | 856 | | | | 45,816 | |
Bristol-Myers Squibb Co. | | | 83,370 | | | | 5,198,120 | |
Catalent, Inc.* | | | 6,300 | | | | 806,589 | |
Chugai Pharmaceutical Co. Ltd.
(Japan) | | | 1,400 | | | | 45,488 | |
Eli Lilly & Co. | | | 29,800 | | | | 8,231,356 | |
GlaxoSmithKline PLC (United Kingdom) | | | 20,597 | | | | 447,261 | |
Hikma Pharmaceuticals PLC (Jordan) | | | 367 | | | | 11,026 | |
Ipsen SA (France) | | | 2,296 | | | | 210,280 | |
Johnson & Johnson | | | 98,758 | | | | 16,894,531 | |
Merck & Co., Inc. | | | 95,033 | | | | 7,283,329 | |
Merck KGaA (Germany) | | | 852 | | | | 219,985 | |
Novartis AG (Switzerland) | | | 4,592 | | | | 403,320 | |
Novo Nordisk A/S (Denmark) (Class B
Stock) | | | 3,644 | | | | 410,286 | |
Ono Pharmaceutical Co. Ltd. (Japan) | | | 800 | | | | 19,846 | |
Organon & Co. | | | 9,853 | | | | 300,024 | |
Otsuka Holdings Co. Ltd. (Japan) | | | 2,500 | | | | 90,543 | |
Pfizer, Inc. | | | 210,370 | | | | 12,422,349 | |
Roche Holding AG (Switzerland) | | | 2,040 | | | | 847,839 | |
| | | | | | | | |
| | | Shares | | | Value | |
| | |
| COMMON STOCKS (continued) | | | | | | | | |
Pharmaceuticals (cont’d.) | | | | | | | | |
Sanofi (France) | | | 4,420 | | | $ | 445,060 | |
Shionogi & Co. Ltd. (Japan) | | | 300 | | | | 21,228 | |
Sumitomo Dainippon Pharma Co. Ltd.
(Japan) | | | 400 | | | | 4,607 | |
Takeda Pharmaceutical Co. Ltd.
(Japan) | | | 3,900 | | | | 106,420 | |
Viatris, Inc. | | | 46,386 | | | | 627,603 | |
Vifor Pharma AG (Switzerland) | | | 102 | | | | 18,084 | |
Zoetis, Inc. | | | 17,800 | | | | 4,343,734 | |
| | | | | | | | |
| | |
| | | | | | | 59,582,612 | |
| | | | | | | | |
Professional Services — 0.2% | | | | | | | | |
Equifax, Inc. | | | 4,700 | | | | 1,376,113 | |
Experian PLC (United Kingdom) | | | 1,920 | | | | 94,392 | |
IHS Markit Ltd. | | | 14,800 | | | | 1,967,216 | |
Jacobs Engineering Group, Inc. | | | 4,800 | | | | 668,304 | |
Leidos Holdings, Inc. | | | 5,200 | | | | 462,280 | |
Nielsen Holdings PLC | | | 13,200 | | | | 270,732 | |
Randstad NV (Netherlands) | | | 3,536 | | | | 242,257 | |
RELX PLC (United Kingdom) | | | 3,979 | | | | 129,437 | |
Robert Half International, Inc. | | | 4,200 | | | | 468,384 | |
SGS SA (Switzerland) | | | 5 | | | | 16,684 | |
Verisk Analytics, Inc. | | | 6,200 | | | | 1,418,126 | |
Wolters Kluwer NV (Netherlands) | | | 552 | | | | 65,011 | |
| | | | | | | | |
| | |
| | | | | | | 7,178,936 | |
| | | | | | | | |
Real Estate Management & Development — 0.1% | |
CBRE Group, Inc. (Class A Stock)* | | | 12,400 | | | | 1,345,524 | |
CK Asset Holdings Ltd. (Hong Kong) | | | 33,000 | | | | 207,839 | |
Daito Trust Construction Co. Ltd. (Japan) | | | 600 | | | | 68,772 | |
Daiwa House Industry Co. Ltd.
(Japan) | | | 1,200 | | | | 34,513 | |
ESR Cayman Ltd. (China), 144A* | | | 4,000 | | | | 13,516 | |
Hang Lung Properties Ltd. (Hong Kong) | | | 4,000 | | | | 8,218 | |
Henderson Land Development Co. Ltd.
(Hong Kong) | | | 3,000 | | | | 12,769 | |
Hongkong Land Holdings Ltd. (Hong Kong) | | | 2,400 | | | | 12,477 | |
New World Development Co. Ltd.
(Hong Kong) | | | 4,000 | | | | 15,803 | |
Swiss Prime Site AG (Switzerland) | | | 156 | | | | 15,331 | |
| | | | | | | | |
| | |
| | | | | | | 1,734,762 | |
| | | | | | | | |
Road & Rail — 0.5% | | | | | | | | |
CSX Corp. | | | 84,600 | | | | 3,180,960 | |
J.B. Hunt Transport Services, Inc.(a) | | | 3,200 | | | | 654,080 | |
Norfolk Southern Corp. | | | 9,300 | | | | 2,768,703 | |
Old Dominion Freight Line, Inc. | | | 3,665 | | | | 1,313,462 | |
Union Pacific Corp. | | | 24,660 | | | | 6,212,594 | |
| | | | | | | | |
| | |
| | | | | | | 14,129,799 | |
| | | | | | | | |
Semiconductors & Semiconductor Equipment — 3.4% | |
Advanced Micro Devices, Inc.* | | | 45,500 | | | | 6,547,450 | |
Advantest Corp. (Japan) | | | 400 | | | | 37,704 | |
Analog Devices, Inc. | | | 20,247 | | | | 3,558,815 | |
Applied Materials, Inc. | | | 34,300 | | | | 5,397,448 | |
ASM International NV (Netherlands) | | | 96 | | | | 42,378 | |
SEE NOTES TO FINANCIAL STATEMENTS.
A17
| | | | | | |
| | |
| | PSF PGIM 50/50 BALANCED PORTFOLIO (CONTINUED) | | |
| | | | | | |
| |
| SCHEDULE OF INVESTMENTS | | as of December 31, 2021 |
| | | | | | | | |
| | | Shares | | | Value | |
| | |
| COMMON STOCKS (continued) | | | | | | | | |
Semiconductors & Semiconductor Equipment (cont’d.) | |
ASML Holding NV (Netherlands) | | | 748 | | | $ | 599,163 | |
Broadcom, Inc. | | | 15,500 | | | | 10,313,855 | |
Disco Corp. (Japan) | | | 100 | | | | 30,443 | |
Enphase Energy, Inc.* | | | 5,200 | | | | 951,288 | |
Intel Corp. | | | 152,200 | | | | 7,838,300 | |
KLA Corp. | | | 5,850 | | | | 2,516,144 | |
Lam Research Corp. | | | 5,350 | | | | 3,847,452 | |
Microchip Technology, Inc. | | | 20,700 | | | | 1,802,142 | |
Micron Technology, Inc. | | | 42,300 | | | | 3,940,245 | |
Monolithic Power Systems, Inc. | | | 1,600 | | | | 789,328 | |
NVIDIA Corp. | | | 94,060 | | | | 27,663,987 | |
NXP Semiconductors NV (China) | | | 10,000 | | | | 2,277,800 | |
Qorvo, Inc.* | | | 4,307 | | | | 673,572 | |
QUALCOMM, Inc. | | | 42,300 | | | | 7,735,401 | |
Renesas Electronics Corp. (Japan)* | | | 1,600 | | | | 19,771 | |
Skyworks Solutions, Inc.(a) | | | 6,300 | | | | 977,382 | |
SolarEdge Technologies, Inc.* | | | 2,000 | | | | 561,140 | |
STMicroelectronics NV (Singapore) | | | 3,738 | | | | 184,471 | |
Teradyne, Inc. | | | 6,300 | | | | 1,030,239 | |
Texas Instruments, Inc. | | | 34,700 | | | | 6,539,909 | |
Xilinx, Inc. | | | 9,400 | | | | 1,993,082 | |
| | | | | | | | |
| | |
| | | | | | | 97,868,909 | |
| | | | | | | | |
Software — 5.0% | | | | | | | | |
Adobe, Inc.* | | | 17,880 | | | | 10,139,033 | |
ANSYS, Inc.* | | | 3,400 | | | | 1,363,808 | |
Autodesk, Inc.* | | | 8,300 | | | | 2,333,877 | |
Cadence Design Systems, Inc.* | | | 10,500 | | | | 1,956,675 | |
Ceridian HCM Holding, Inc.* | | | 4,950 | | | | 517,077 | |
Check Point Software Technologies Ltd.
(Israel)* | | | 200 | | | | 23,312 | |
Citrix Systems, Inc. | | | 4,600 | | | | 435,114 | |
Dassault Systemes SE (France) | | | 5,490 | | | | 327,360 | |
Fortinet, Inc.* | | | 5,200 | | | | 1,868,880 | |
Intuit, Inc. | | | 10,620 | | | | 6,830,996 | |
Microsoft Corp. | | | 282,420 | | | | 94,983,494 | |
Nemetschek SE (Germany) | | | 119 | | | | 15,200 | |
NortonLifeLock, Inc. | | | 22,178 | | | | 576,184 | |
Oracle Corp. | | | 60,650 | | | | 5,289,287 | |
Paycom Software, Inc.* | | | 1,920 | | | | 797,165 | |
PTC, Inc.* | | | 3,900 | | | | 472,485 | |
salesforce.com, Inc.* | | | 36,850 | | | | 9,364,691 | |
SAP SE (Germany) | | | 2,126 | | | | 300,312 | |
ServiceNow, Inc.* | | | 7,430 | | | | 4,822,887 | |
Synopsys, Inc.* | | | 5,800 | | | | 2,137,300 | |
Trend Micro, Inc. (Japan)* | | | 300 | | | | 16,657 | |
Tyler Technologies, Inc.* | | | 1,510 | | | | 812,305 | |
| | | | | | | | |
| | |
| | | | | | | 145,384,099 | |
| | | | | | | | |
Specialty Retail — 1.3% | | | | | | | | |
Advance Auto Parts, Inc. | | | 2,500 | | | | 599,700 | |
AutoZone, Inc.* | | | 820 | | | | 1,719,040 | |
Bath & Body Works, Inc. | | | 9,806 | | | | 684,361 | |
Best Buy Co., Inc. | | | 8,325 | | | | 845,820 | |
CarMax, Inc.* | | | 6,000 | | | | 781,380 | |
Chow Tai Fook Jewellery Group Ltd.
(China)* | | | 7,000 | | | | 12,588 | |
Gap, Inc. (The) | | | 8,400 | | | | 148,260 | |
Home Depot, Inc. (The) | | | 39,950 | | | | 16,579,649 | |
| | | | | | | | |
| | | Shares | | | Value | |
| | |
| COMMON STOCKS (continued) | | | | | | | | |
Specialty Retail (cont’d.) | | | | | | | | |
Industria de Diseno Textil SA (Spain) | | | 2,261 | | | $ | 73,326 | |
JD Sports Fashion PLC (United Kingdom) | | | 42,480 | | | | 125,120 | |
Kingfisher PLC (United Kingdom) | | | 49,004 | | | | 224,521 | |
Lowe’s Cos., Inc. | | | 26,500 | | | | 6,849,720 | |
O’Reilly Automotive, Inc.* | | | 2,550 | | | | 1,800,887 | |
Ross Stores, Inc. | | | 13,200 | | | | 1,508,496 | |
Shimamura Co. Ltd. (Japan) | | | 2,600 | | | | 218,535 | |
TJX Cos., Inc. (The) | | | 45,300 | | | | 3,439,176 | |
Tractor Supply Co. | | | 4,400 | | | | 1,049,840 | |
Ulta Beauty, Inc.* | | | 2,200 | | | | 907,148 | |
USS Co. Ltd. (Japan) | | | 8,900 | | | | 138,999 | |
| | | | | | | | |
| | |
| | | | | | | 37,706,566 | |
| | | | | | | | |
Technology Hardware, Storage & Peripherals — 3.8% | |
Apple, Inc. | | | 586,340 | | | | 104,116,394 | |
Brother Industries Ltd. (Japan) | | | 500 | | | | 9,632 | |
Canon, Inc. (Japan) | | | 11,100 | | | | 270,090 | |
FUJIFILM Holdings Corp. (Japan) | | | 800 | | | | 59,220 | |
Hewlett Packard Enterprise Co. | | | 48,448 | | | | 764,025 | |
HP, Inc. | | | 44,548 | | | | 1,678,123 | |
NetApp, Inc. | | | 8,300 | | | | 763,517 | |
Seagate Technology Holdings PLC | | | 7,700 | | | | 869,946 | |
Seiko Epson Corp. (Japan) | | | 10,000 | | | | 179,986 | |
Western Digital Corp.* | | | 11,303 | | | | 737,068 | |
| | | | | | | | |
| | |
| | | | | | | 109,448,001 | |
| | | | | | | | |
Textiles, Apparel & Luxury Goods — 0.4% | | | | | |
Burberry Group PLC (United Kingdom) | | | 874 | | | | 21,449 | |
Cie Financiere Richemont SA
(Switzerland) (Class A Stock) | | | 2,137 | | | | 320,044 | |
EssilorLuxottica SA (France) | | | 588 | | | | 125,205 | |
Hermes International (France) | | | 144 | | | | 251,505 | |
Kering SA (France) | | | 124 | | | | 99,779 | |
LVMH Moet Hennessy Louis Vuitton SE
(France) | | | 579 | | | | 478,872 | |
Moncler SpA (Italy) | | | 432 | | | | 31,358 | |
NIKE, Inc. (Class B Stock) | | | 48,000 | | | | 8,000,160 | |
Pandora A/S (Denmark) | | | 196 | | | | 24,406 | |
PVH Corp. | | | 2,800 | | | | 298,620 | |
Ralph Lauren Corp. | | | 1,800 | | | | 213,948 | |
Swatch Group AG (The) (Switzerland) | | | 60 | | | | 18,329 | |
Swatch Group AG (The) (registered shares) (Switzerland) | | | 77 | | | | 4,517 | |
Tapestry, Inc. | | | 10,500 | | | | 426,300 | |
Under Armour, Inc. (Class A Stock)* | | | 7,300 | | | | 154,687 | |
Under Armour, Inc. (Class C Stock)* | | | 7,374 | | | | 133,027 | |
VF Corp. | | | 12,400 | | | | 907,928 | |
| | | | | | | | |
| | |
| | | | | | | 11,510,134 | |
| | | | | | | | |
Tobacco — 0.3% | | | | | | | | |
Altria Group, Inc. | | | 69,200 | | | | 3,279,388 | |
British American Tobacco PLC
(United Kingdom) | | | 10,470 | | | | 388,521 | |
Imperial Brands PLC (United Kingdom) | | | 1,916 | | | | 41,883 | |
Japan Tobacco, Inc. (Japan) | | | 13,100 | | | | 264,567 | |
Philip Morris International, Inc. | | | 58,500 | | | | 5,557,500 | |
SEE NOTES TO FINANCIAL STATEMENTS.
A18
| | | | | | |
| | |
| | PSF PGIM 50/50 BALANCED PORTFOLIO (CONTINUED) | | |
| | | | | | |
| |
| SCHEDULE OF INVESTMENTS | | as of December 31, 2021 |
| | | | | | | | |
| | | Shares | | | Value | |
|
| COMMON STOCKS (continued) | |
Tobacco (cont’d.) | | | | | | | | |
Swedish Match AB (Sweden) | | | 26,980 | | | $ | 214,788 | |
| | | | | | | | |
| | |
| | | | | | | 9,746,647 | |
| | | | | | | | |
Trading Companies & Distributors — 0.2% | |
Ashtead Group PLC (United Kingdom) | | | 1,812 | | | | 145,421 | |
Brenntag SE (Germany) | | | 2,571 | | | | 232,605 | |
Bunzl PLC (United Kingdom) | | | 700 | | | | 27,349 | |
Fastenal Co. | | | 21,300 | | | | 1,364,478 | |
Ferguson PLC | | | 1,032 | | | | 182,770 | |
ITOCHU Corp. (Japan) | | | 2,500 | | | | 76,510 | |
Marubeni Corp. (Japan) | | | 22,000 | | | | 214,570 | |
Mitsubishi Corp. (Japan) | | | 3,200 | | | | 101,813 | |
Mitsui & Co. Ltd. (Japan) | | | 13,000 | | | | 307,860 | |
Toyota Tsusho Corp. (Japan) | | | 500 | | | | 23,066 | |
United Rentals, Inc.* | | | 2,800 | | | | 930,412 | |
W.W. Grainger, Inc. | | | 1,640 | | | | 849,914 | |
| | | | | | | | |
| | |
| | | | | | | 4,456,768 | |
| | | | | | | | |
Water Utilities — 0.0% | | | | | | | | |
American Water Works Co., Inc. | | | 6,700 | | | | 1,265,362 | |
| | | | | | | | |
Wireless Telecommunication Services — 0.1% | |
KDDI Corp. (Japan) | | | 6,600 | | | | 192,648 | |
SoftBank Group Corp. (Japan) | | | 700 | | | | 33,213 | |
T-Mobile US, Inc.* | | | 21,800 | | | | 2,528,364 | |
Vodafone Group PLC (United Kingdom) | | | 64,289 | | | | 97,289 | |
| | | | | | | | |
| | | | | | | 2,851,514 | |
| | | | | | | | |
TOTAL COMMON STOCKS
(cost $345,799,609) | | | | | | | 1,554,822,573 | |
| | | | | | | | |
|
| EXCHANGE-TRADED FUNDS — 0.3% | |
iShares Core S&P 500 ETF | | | 15,900 | | | | 7,584,141 | |
iShares MSCI EAFE ETF(a) | | | 1,759 | | | | 138,398 | |
| | | | | | | | |
TOTAL EXCHANGE-TRADED FUNDS
(cost $4,266,112) | | | | 7,722,539 | |
| | | | | | | | |
| |
| PREFERRED STOCKS — 0.0% | | | | | |
Automobiles — 0.0% | | | | | | | | |
Bayerische Motoren Werke AG (Germany) (PRFC) | | | 75 | | | | 6,221 | |
| | | | | | | | |
Banks — 0.0% | | | | | | | | |
Citigroup Capital XIII, 6.499%(c), 3 Month LIBOR + 6.370%, Maturing 10/30/40 | | | 20,000 | | | | 558,000 | |
| | | | | | | | |
Capital Markets — 0.0% | | | | | | | | |
State Street Corp., 5.350%(c), 3 Month LIBOR + 3.709%, Series G, Maturing 03/15/26(oo) | | | 30,000 | | | | 858,300 | |
| | | | | | | | |
Household Products — 0.0% | | | | | | | | |
Henkel AG & Co. KGaA (Germany) (PRFC) | | | 423 | | | | 34,162 | |
| | | | | | | | |
TOTAL PREFERRED STOCKS
(cost $1,290,359) | | | | | | | 1,456,683 | |
| | | | | | | | |
| | | | | | | | | | | | | | | | |
Interest
Rate | | Maturity
Date | | | | | | Principal
Amount
(000)# | | | Value | |
| | | | | | | | | | | | | | | | |
| |
| ASSET-BACKED SECURITIES — 6.7% | | | | | |
Automobiles — 2.0% | | | | | | | | | | | | | |
AmeriCredit Automobile Receivables Trust, | |
Series 2019-01, Class B | | | | | | | | | | | | | |
3.130% | | | 02/18/25 | | | | | | | | 600 | | | $ | 604,124 | |
Series 2019-01, Class C | | | | | | | | | | | | | |
3.360% | | | 02/18/25 | | | | | | | | 700 | | | | 715,740 | |
Series 2019-02, Class C | | | | | | | | | | | | | |
2.740% | | | 04/18/25 | | | | | | | | 1,400 | | | | 1,428,450 | |
Series 2019-03, Class C | | | | | | | | | | | | | |
2.320% | | | 07/18/25 | | | | | | | | 2,300 | | | | 2,332,790 | |
Series 2020-02, Class C | | | | | | | | | | | | | |
1.480% | | | 02/18/26 | | | | | | | | 400 | | | | 402,346 | |
Series 2020-03, Class C | | | | | | | | | | | | | |
1.060% | | | 08/18/26 | | | | | | | | 700 | | | | 698,236 | |
Series 2021-02, Class C | | | | | | | | | | | | | |
1.010% | | | 01/19/27 | | | | | | | | 900 | | | | 884,818 | |
Series 2021-03, Class C | | | | | | | | | | | | | |
1.410% | | | 08/18/27 | | | | | | | | 900 | | | | 892,407 | |
Avis Budget Rental Car Funding AESOP LLC, | | | | | |
Series 2018-02A, Class A, 144A | | | | | |
4.000% | | | 03/20/25 | | | | | | | | 1,100 | | | | 1,159,586 | |
Series 2019-02A, Class A, 144A | | | | | |
3.350% | | | 09/22/25 | | | | | | | | 2,000 | | | | 2,094,520 | |
Series 2019-03A, Class A, 144A | | | | | |
2.360% | | | 03/20/26 | | | | | | | | 2,700 | | | | 2,759,895 | |
Series 2020-01A, Class A, 144A | | | | | |
2.330% | | | 08/20/26 | | | | | | | | 1,300 | | | | 1,331,026 | |
Series 2021-01A, Class A, 144A | | | | | |
1.380% | | | 08/20/27 | | | | | | | | 2,400 | | | | 2,356,745 | |
Series 2021-02A, Class A, 144A | | | | | |
1.660% | | | 02/20/28 | | | | | | | | 2,600 | | | | 2,576,340 | |
CarMax Auto Owner Trust, | | | | | | | | | | | | | |
Series 2021-02, Class C | | | | | | | | | | | | | |
1.340% | | | 02/16/27 | | | | | | | | 800 | | | | 791,774 | |
Series 2021-04, Class C | | | | | | | | | | | | | |
1.380% | | | 07/15/27 | | | | | | | | 600 | | | | 588,322 | |
Carvana Auto Receivables Trust, | | | | | |
Series 2021-P03, Class B | | | | | | | | | | | | | |
1.420% | | | 08/10/27 | | | | | | | | 100 | | | | 98,209 | |
Series 2021-P04, Class B | | | | | | | | | | | | | |
1.980% | | | 02/10/28 | | | | | | | | 200 | | | | 199,865 | |
Ford Auto Securitization Trust (Canada), | | | | | |
Series 2019-BA, Class A2, 144A | | | | | |
2.321% | | | 10/15/23 | | | | CAD | | | | 455 | | | | 361,575 | |
Ford Credit Auto Owner Trust, | | | | | | | | | |
Series 2018-01, Class A, 144A | | | | | |
3.190% | | | 07/15/31 | | | | | | | | 2,700 | | | | 2,844,516 | |
Series 2019-01, Class A, 144A | | | | | |
3.520% | | | 07/15/30 | | | | | | | | 3,300 | | | | 3,459,732 | |
Series 2020-01, Class A, 144A | | | | | |
2.040% | | | 08/15/31 | | | | | | | | 2,500 | | | | 2,545,031 | |
Series 2020-02, Class A, 144A | | | | | |
1.060% | | | 04/15/33 | | | | | | | | 3,100 | | | | 3,037,771 | |
Series 2021-02, Class B, 144A | | | | | |
1.910% | | | 05/15/34 | | | | | | | | 400 | | | | 397,269 | |
GM Financial Consumer Automobile Receivables Trust, | |
Series 2018-04, Class C | |
3.620% | | | 06/17/24 | | | | | | | | 300 | | | | 306,143 | |
SEE NOTES TO FINANCIAL STATEMENTS.
A19
| | | | | | |
| | |
| | PSF PGIM 50/50 BALANCED PORTFOLIO (CONTINUED) | | |
| | | | | | |
| |
| SCHEDULE OF INVESTMENTS | | as of December 31, 2021 |
| | | | | | | | | | | | | | | | |
Interest
Rate | | Maturity
Date | | | | | | Principal
Amount
(000)# | | | Value | |
| | | | | | | | | | | | | | | | |
|
| ASSET-BACKED SECURITIES (continued) | |
Automobiles (cont’d.) | | | | | | | | | | | | | |
GM Financial Revolving Receivables Trust, | | | | | |
Series 2021-01, Class B, 144A | | | | | | | | | |
1.490% | | | 06/12/34 | | | | | | | | 200 | | | $ | 195,928 | |
Hertz Vehicle Financing III LP, | | | | | | | | | | | | | |
Series 2021-02A, Class A, 144A | | | | | | | | | |
1.680% | | | 12/27/27 | | | | | | | | 1,300 | | | | 1,280,483 | |
Hertz Vehicle Financing LLC, | | | | | | | | | | | | | |
Series 2021-01A, Class A, 144A | | | | | | | | | |
1.210% | | | 12/26/25 | | | | | | | | 1,500 | | | | 1,485,201 | |
OneMain Direct Auto Receivables Trust, | | | | | | | | | |
Series 2018-01A, Class A, 144A | | | | | | | | | |
3.430% | | | 12/16/24 | | | | | | | | 113 | | | | 112,562 | |
Series 2019-01A, Class A, 144A | | | | | | | | | |
3.630% | | | 09/14/27 | | | | | | | | 4,100 | | | | 4,325,871 | |
Series 2021-01A, Class B, 144A | | | | | | | | | |
1.260% | | | 07/14/28 | | | | | | | | 1,800 | | | | 1,779,111 | |
Santander Drive Auto Receivables Trust, | |
Series 2020-02, Class C | | | | | | | | | | | | | |
1.460% | | | 09/15/25 | | | | | | | | 600 | | | | 602,804 | |
Series 2020-03, Class C | | | | | | | | | | | | | |
1.120% | | | 01/15/26 | | | | | | | | 1,800 | | | | 1,805,241 | |
Series 2020-04, Class C | | | | | | | | | | | | | |
1.010% | | | 01/15/26 | | | | | | | | 1,100 | | | | 1,101,467 | |
Series 2021-01, Class C | | | | | | | | | | | | | |
0.750% | | | 02/17/26 | | | | | | | | 2,100 | | | | 2,097,873 | |
Series 2021-02, Class C | | | | | | | | | | | | | |
0.900% | | | 06/15/26 | | | | | | | | 1,500 | | | | 1,495,520 | |
Series 2021-02, Class D | | | | | | | | | | | | | |
1.350% | | | 07/15/27 | | | | | | | | 2,000 | | | | 1,987,723 | |
Series 2021-03, Class C | | | | | | | | | | | | | |
0.950% | | | 09/15/27 | | | | | | | | 2,000 | | | | 1,980,718 | |
Series 2021-04, Class C | | | | | | | | | | | | | |
1.260% | | | 02/16/27 | | | | | | | | 1,900 | | | | 1,888,419 | |
World Omni Select Auto Trust, | | | | | | | | | | | | | |
Series 2021-A, Class C | | | | | | | | | | | | | |
1.090% | | | 11/15/27 | | | | | | | | 400 | | | | 393,147 | |
| | | | | | | | | | | | | | | | |
| | | | |
| | | | | | | | | | | | | | | 57,399,298 | |
| | | | | | | | | | | | | | | | |
Collateralized Loan Obligations — 3.5% | |
Balboa Bay Loan Funding Ltd. (Cayman Islands), | | | | | |
Series 2021-01A, Class A, 144A, 3 Month LIBOR + 1.200% (Cap N/A, Floor 1.200%) | |
1.334%(c) | | | 07/20/34 | | | | | | | | 2,500 | | | | 2,503,163 | |
Benefit Street Partners CLO Ltd. (Cayman Islands), | |
Series 2013-IIA, Class A1R2, 144A, 3 Month LIBOR + 0.870% (Cap N/A, Floor 0.870%) | |
0.994%(c) | | | 07/15/29 | | | | | | | | 916 | | | | 916,340 | |
BNPP AM Euro CLO DAC (Ireland), | |
Series 2018-01A, Class AR, 144A, 3 Month EURIBOR + 0.600% (Cap N/A, Floor 0.600%) | |
0.600%(c) | | | 04/15/31 | | | | EUR | | | | 1,750 | | | | 1,985,107 | |
Brookside Mill CLO Ltd. (Cayman Islands), | |
Series 2013-01A, Class AR, 144A, 3 Month LIBOR + 0.820% (Cap N/A, Floor 0.000%) | |
0.942%(c) | | | 01/17/28 | | | | | | | | 305 | | | | 305,223 | |
| | | | | | | | | | | | | | | | |
Interest
Rate | | Maturity
Date | | | | | | Principal
Amount
(000)# | | | Value | |
| | | | | | | | | | | | | | | | |
|
| ASSET-BACKED SECURITIES (continued) | |
Collateralized Loan Obligations (cont’d.) | |
Canyon Capital CLO Ltd. (Cayman Islands), | |
Series 2017-01A, Class AR, 144A, 3 Month LIBOR + 1.000% (Cap N/A, Floor 1.000%) | |
1.124%(c) | | | 07/15/30 | | | | | | | | 2,750 | | | $ | 2,749,392 | |
Carlyle Euro CLO DAC (Ireland), | |
Series 2017-02A, Class A1R, 144A, 3 Month EURIBOR + 0.630% (Cap N/A, Floor 0.630%) | |
0.630%(c) | | | 08/15/30 | | | | EUR | | | | 4,996 | | | | 5,670,862 | |
Carlyle Global Market Strategies CLO Ltd. (Cayman Islands), | |
Series 2015-05A, Class A1RR, 144A, 3 Month LIBOR + 1.080% (Cap N/A, Floor 1.080%) | |
1.212%(c) | | | 01/20/32 | | | | | | | | 6,750 | | | | 6,747,684 | |
CIFC Funding Ltd. (Cayman Islands), | |
Series 2014-05A, Class A1R2, 144A, 3 Month LIBOR + 1.200% (Cap N/A, Floor 1.200%) | |
1.322%(c) | | | 10/17/31 | | | | | | | | 7,000 | | | | 7,000,201 | |
CVC Cordatus Loan Fund DAC (Ireland), | |
Series 14A, Class A1R, 144A, 3 Month EURIBOR + 0.850% (Cap N/A, Floor 0.850%) | |
0.850%(c) | | | 05/22/32 | | | | EUR | | | | 1,750 | | | | 1,989,650 | |
Series 14A, Class A2R, 144A | | | | | | | | | | | | | |
1.250% | | | 05/22/32 | | | | EUR | | | | 3,800 | | | | 4,318,771 | |
Elevation CLO Ltd. (Cayman Islands), | |
Series 2017-06A, Class A1, 144A, 3 Month LIBOR + 1.280% (Cap N/A, Floor 0.000%) | |
1.404%(c) | | | 07/15/29 | | | | | | | | 500 | | | | 499,921 | |
Greenwood Park CLO Ltd. (Cayman Islands), | | | | | | | | | |
Series 2018-01A, Class A2, 144A, 3 Month LIBOR + 1.010% (Cap N/A, Floor 0.000%) | |
1.134%(c) | | | 04/15/31 | | | | | | | | 1,000 | | | | 999,443 | |
HPS Loan Management Ltd. (Cayman Islands), | |
Series 15A-19, Class A1, 144A, 3 Month LIBOR + 1.320% (Cap N/A, Floor 1.320%) | |
1.448%(c) | | | 07/22/32 | | | | | | | | 2,500 | | | | 2,500,820 | |
Series 2015-06A, Class A1R, 144A, 3 Month LIBOR + 1.000% (Cap N/A, Floor 0.000%) | |
1.140%(c) | | | 02/05/31 | | | | | | | | 248 | | | | 248,241 | |
ICG US CLO Ltd. (Cayman Islands), | | | | | |
Series 2015-01A, Class A1R, 144A, 3 Month LIBOR + 1.140% (Cap N/A, Floor 1.140%) | |
1.264%(c) | | | 10/19/28 | | | | | | | | 5,821 | | | | 5,820,546 | |
Jamestown CLO Ltd. (Cayman Islands), | | | | | |
Series 2019-01A, Class A1, 144A, 3 Month LIBOR + 1.470% (Cap N/A, Floor 1.470%) | |
1.602%(c) | | | 04/20/32 | | | | | | | | 4,750 | | | | 4,752,219 | |
Jefferson Mill CLO Ltd. (Cayman Islands), | |
Series 2015-01A, Class AR, 144A, 3 Month LIBOR + 1.175% (Cap N/A, Floor 0.000%) | |
1.307%(c) | | | 10/20/31 | | | | | | | | 4,237 | | | | 4,235,308 | |
Madison Park Funding Ltd. (Cayman Islands), | |
Series 2012-10A, Class AR3, 144A, 3 Month LIBOR + 1.010% (Cap N/A, Floor 0.000%) | |
1.142%(c) | | | 01/20/29 | | | | | | | | 3,428 | | | | 3,425,733 | |
MidOcean Credit CLO (Cayman Islands), | |
Series 2014-03A, Class A1R, 144A, 3 Month LIBOR + 1.120% (Cap N/A, Floor 1.120%) | |
1.250%(c) | | | 04/21/31 | | | | | | | | 3,458 | | | | 3,458,510 | |
SEE NOTES TO FINANCIAL STATEMENTS.
A20
| | | | | | |
| | |
| | PSF PGIM 50/50 BALANCED PORTFOLIO (CONTINUED) | | |
| | | | | | |
| |
| SCHEDULE OF INVESTMENTS | | as of December 31, 2021 |
| | | | | | | | | | | | | | | | |
Interest Rate | | Maturity
Date | | | | | | Principal
Amount (000)# | | | Value | |
| | | | | | | | | | | | | | | | |
ASSET-BACKED SECURITIES (continued) | |
Collateralized Loan Obligations (cont’d.) | |
Mountain View CLO Ltd. (Cayman Islands), | |
Series 2015-09A, Class A1R, 144A, 3 Month LIBOR + 1.120% (Cap N/A, Floor 0.000%) | |
1.244%(c) | | | 07/15/31 | | | | | | | | 2,500 | | | $ | 2,498,066 | |
Octagon Investment Partners 31 LLC (Cayman Islands), | |
Series 2017-01A, Class AR, 144A, 3 Month LIBOR + 1.050% (Cap N/A, Floor 1.050%) | |
1.182%(c) | | | 07/20/30 | | | | | | | | 2,500 | | | | 2,499,495 | |
OZLM Ltd. (Cayman Islands), | |
Series 2014-06A, Class A1S, 144A, 3 Month LIBOR + 1.080% (Cap N/A, Floor 0.000%) | |
1.202%(c) | | | 04/17/31 | | | | | | | | 2,956 | | | | 2,948,240 | |
Series 2015-11A, Class A1R, 144A, 3 Month LIBOR + 1.250% (Cap N/A, Floor 0.000%) | |
1.382%(c) | | | 10/30/30 | | | | | | | | 742 | | | | 742,442 | |
Palmer Square CLO Ltd. (Cayman Islands), | |
Series 2015-02A, Class A1R2, 144A, 3 Month LIBOR + 1.100% (Cap N/A, Floor 0.000%) | |
1.232%(c) | | | 07/20/30 | | | | | | | | 5,000 | | | | 4,997,513 | |
Regatta Funding Ltd. (Cayman Islands), | |
Series 2016-01A, Class A1R2, 144A, 3 Month LIBOR + 1.150% (Cap N/A, Floor 1.150%) | |
1.364%(c) | | | 06/20/34 | | | | | | | | 3,750 | | | | 3,747,925 | |
TCW CLO Ltd. (Cayman Islands), | |
Series 2021-02A, Class AS, 144A, 3 Month LIBOR + 1.180% (Cap N/A, Floor 1.180%) | |
1.305%(c) | | | 07/25/34 | | | | | | | | 4,750 | | | | 4,752,270 | |
TIAA CLO Ltd. (Cayman Islands), | |
Series 2016-01A, Class AR, 144A, 3 Month LIBOR + 1.200% (Cap N/A, Floor 0.000%) | |
1.332%(c) | | | 07/20/31 | | | | | | | | 1,750 | | | | 1,750,113 | |
Toro European CLO DAC (Ireland), | |
Series 02A, Class ARR, 144A, 3 Month EURIBOR + 0.990% (Cap N/A, Floor 0.990%) | |
0.990%(c) | | | 07/25/34 | | | | EUR | | | | 3,000 | | | | 3,385,976 | |
Trimaran Cavu Ltd. (Cayman Islands), | |
Series 2019-01A, Class A1, 144A, 3 Month LIBOR + 1.460% (Cap N/A, Floor 1.460%) | |
1.592%(c) | | | 07/20/32 | | | | | | | | 7,500 | | | | 7,511,224 | |
Venture CLO Ltd. (Cayman Islands), | |
Series 2015-21A, Class AR, 144A, 3 Month LIBOR + 0.880% (Cap N/A, Floor 0.000%) | |
1.004%(c) | | | 07/15/27 | | | | | | | | 282 | | | | 281,598 | |
Wellfleet CLO Ltd. (Cayman Islands), | |
Series 2017-03A, Class A1, 144A, 3 Month LIBOR + 1.150% (Cap N/A, Floor 1.150%) | |
1.272%(c) | | | 01/17/31 | | | | | | | | 2,000 | | | | 2,000,098 | |
Series 2018-02A, Class A1, 144A, 3 Month LIBOR + 1.200% (Cap N/A, Floor 1.200%) | |
1.332%(c) | | | 10/20/31 | | | | | | | | 3,750 | | | | 3,748,147 | |
| | | | | | | | | | | | | | | | |
| | | | |
| | | | | | | | | | | | | | | 100,990,241 | |
| | | | | | | | | | | | | | | | |
Consumer Loans — 0.3% | |
Lendmark Funding Trust, | |
Series 2019-02A, Class A, 144A | |
2.780% | | | 04/20/28 | | | | | | | | 2,400 | | | | 2,433,511 | |
| | | | | | | | | | | | | | | | |
Interest Rate | | Maturity
Date | | | | | | Principal
Amount
(000)# | | | Value | |
| | | | | | | | | | | | | | | | |
ASSET-BACKED SECURITIES (continued) | |
Consumer Loans (cont’d.) | |
OneMain Financial Issuance Trust, | |
Series 2020-01A, Class A, 144A | |
3.840% | | | 05/14/32 | | | | | | | | 800 | | | $ | 818,086 | |
Series 2020-02A, Class A, 144A | |
1.750% | | | 09/14/35 | | | | | | | | 1,400 | | | | 1,390,842 | |
Series 2021-01A, Class A2, 144A, 30 Day Average SOFR + 0.760% (Cap N/A, Floor 0.000%) | |
0.810%(c) | | | 06/16/36 | | | | | | | | 2,000 | | | | 2,000,996 | |
Oportun Funding XIV LLC, | |
Series 2021-A, Class A, 144A | |
1.210% | | | 03/08/28 | | | | | | | | 700 | | | | 698,415 | |
| | | | | | | | | | | | | | | | |
| | | | |
| | | | | | | | | | | | | | | 7,341,850 | |
| | | | | | | | | | | | | | | | |
Equipment — 0.2% | | | | | | | | | | | | | | | | |
MMAF Equipment Finance LLC, | |
Series 2017-B, Class A5, 144A | |
2.720% | | | 06/15/40 | | | | | | | | 2,100 | | | | 2,155,281 | |
Series 2018-A, Class A5, 144A | |
3.610% | | | 03/10/42 | | | | | | | | 500 | | | | 523,383 | |
Series 2019-A, Class A5, 144A | |
3.080% | | | 11/12/41 | | | | | | | | 1,600 | | | | 1,663,663 | |
Series 2019-B, Class A5, 144A | |
2.290% | | | 11/12/41 | | | | | | | | 1,600 | | | | 1,640,650 | |
| | | | | | | | | | | | | | | | |
| | | | |
| | | | | | | | | | | | | | | 5,982,977 | |
| | | | | | | | | | | | | | | | |
Home Equity Loans — 0.0% | |
CDC Mortgage Capital Trust, | |
Series 2002-HE03, Class M1, 1 Month LIBOR + 1.650% (Cap N/A, Floor 1.650%) | |
1.752%(c) | | | 03/25/33 | | | | | | | | 21 | | | | 22,724 | |
| | | | | | | | | | | | | | | | |
Other — 0.1% | | | | | | | | | | | | | | | | |
Home Partners of America Trust, | |
Series 2021-03, Class A, 144A | |
2.200% | | | 01/17/41 | | | | | | | | 1,350 | | | | 1,345,649 | |
TH MSR Issuer Trust, | | | | | | | | | | | | | | | | |
Series 2019-FT01, Class A, 144A, 1 Month LIBOR + 2.800% (Cap N/A, Floor 2.800%) | |
2.892%(c) | | | 06/25/24 | | | | | | | | 2,240 | | | | 2,233,242 | |
| | | | | | | | | | | | | | | | |
| | | | |
| | | | | | | | | | | | | | | 3,578,891 | |
| | | | | | | | | | | | | | | | |
Residential Mortgage-Backed Securities — 0.2% | |
Countrywide Asset-Backed Certificates, | |
Series 2004-01, Class M1, 1 Month LIBOR + 0.750% (Cap N/A, Floor 0.750%) | |
0.852%(c) | | | 03/25/34 | | | | | | | | 161 | | | | 160,863 | |
Credit Suisse Mortgage Trust, | |
Series 2020-11R, Class 1A1, 144A, 1 Month LIBOR + 2.150% | |
2.252%(c) | | | 04/25/38 | | | | | | | | 769 | | | | 778,181 | |
Legacy Mortgage Asset Trust, | |
Series 2019-GS02, Class A1, 144A | |
3.750% | | | 01/25/59 | | | | | | | | 103 | | | | 103,175 | |
Series 2019-GS04, Class A1, 144A | |
3.438% | | | 05/25/59 | | | | | | | | 729 | | | | 729,404 | |
Long Beach Mortgage Loan Trust, | |
Series 2004-02, Class M1, 1 Month LIBOR + 0.795% (Cap N/A, Floor 0.795%) | |
0.897%(c) | | | 06/25/34 | | | | | | | | 123 | | | | 122,166 | |
SEE NOTES TO FINANCIAL STATEMENTS.
A21
| | | | | | |
| | |
| | PSF PGIM 50/50 BALANCED PORTFOLIO (CONTINUED) | | |
| | | | | | |
| |
| SCHEDULE OF INVESTMENTS | | as of December 31, 2021 |
| | | | | | | | | | | | | | |
Interest Rate | | Maturity
Date | | | | | Principal Amount (000)# | | | Value | |
| | | | | | | | | | | | | | |
ASSET-BACKED SECURITIES (continued) | |
Residential Mortgage-Backed Securities (cont’d.) | |
Mill City Mortgage Loan Trust, | |
Series 2017-03, Class A1, 144A | |
2.750%(cc) | | | 01/25/61 | | | | | | 520 | | | $ | 526,394 | |
TFS (Spain), | | | | | | | | | | | | | | |
Series 2018-03, Class A1, 1 Month EURIBOR + 3.000% | |
3.000%(c) | | | 04/16/23 | | | EUR | | | 1,547 | | | | 1,585,015 | |
Towd Point Mortgage Trust, | |
Series 2017-05, Class A1, 144A, 1 Month LIBOR + 0.600% (Cap N/A, Floor 0.000%) | |
0.692%(c) | | | 02/25/57 | | | | | | 807 | | | | 806,295 | |
Series 2020-04, Class A1, 144A | |
1.750% | | | 10/25/60 | | | | | | 725 | | | | 723,035 | |
| | | | | | | | | | | | | | |
| | | | |
| | | | | | | | | | | | | 5,534,528 | |
| | | | | | | | | | | | | | |
Student Loans — 0.4% | |
Commonbond Student Loan Trust, | |
Series 2017-BGS, Class A1, 144A | |
2.680% | | | 09/25/42 | | | | | | 675 | | | | 684,018 | |
Series 2018-AGS, Class A1, 144A | |
3.210% | | | 02/25/44 | | | | | | 500 | | | | 513,317 | |
Series 2018-CGS, Class A1, 144A | |
3.870% | | | 02/25/46 | | | | | | 145 | | | | 148,704 | |
Laurel Road Prime Student Loan Trust, | |
Series 2017-C, Class A2B, 144A | |
2.810% | | | 11/25/42 | | | | | | 230 | | | | 231,954 | |
Series 2018-B, Class A2FX, 144A | |
3.540% | | | 05/26/43 | | | | | | 429 | | | | 434,702 | |
Series 2019-A, Class A2FX, 144A | |
2.730% | | | 10/25/48 | | | | | | 350 | | | | 353,137 | |
Navient Private Education Refi Loan Trust, | |
Series 2018-A, Class A2, 144A | |
3.190% | | | 02/18/42 | | | | | | 745 | | | | 751,369 | |
Series 2018-CA, Class A2, 144A | |
3.520% | | | 06/16/42 | | | | | | 405 | | | | 411,312 | |
Series 2019-CA, Class A2, 144A | |
3.130% | | | 02/15/68 | | | | | | 866 | | | | 882,806 | |
Series 2020-BA, Class A2, 144A | |
2.120% | | | 01/15/69 | | | | | | 825 | | | | 833,831 | |
Pennsylvania Higher Education Assistance Agency, | |
Series 2021-01A, Class A, 144A, 1 Month LIBOR + 0.530% (Cap N/A, Floor 0.530%) | |
0.633%(c) | | | 05/25/70 | | | | | | 1,775 | | | | 1,776,229 | |
SoFi Professional Loan Program LLC, | |
Series 2019-A, Class A2FX, 144A | |
3.690% | | | 06/15/48 | | | | | | 743 | | | | 761,290 | |
Series 2019-B, Class A2FX, 144A | |
3.090% | | | 08/17/48 | | | | | | 847 | | | | 863,843 | |
Series 2019-C, Class A2FX, 144A | |
2.370% | | | 11/16/48 | | | | | | 1,297 | | | | 1,313,084 | |
SoFi Professional Loan Program Trust, | |
Series 2018-B, Class A2FX, 144A | |
3.340% | | | 08/25/47 | | | | | | 976 | | | | 993,382 | |
| | | | | | | | | | | | | | | | |
Interest Rate | | Maturity
Date | | | | | | Principal
Amount
(000)# | | | Value | |
| | | | | | | | | | | | | | | | |
ASSET-BACKED SECURITIES (continued) | |
Student Loans (cont’d.) | |
Series 2020-A, Class A2FX, 144A | |
2.540% | | | 05/15/46 | | | | | | | | 1,684 | | | $ | 1,713,798 | |
| | | | | | | | | | | | | | | | |
| | | | |
| | | | | | | | | | | | | | | 12,666,776 | |
| | | | | | | | | | | | | | | | |
TOTAL ASSET-BACKED SECURITIES
(cost $193,900,718) | | | | 193,517,285 | |
| | | | | | | | | | | | | | | | |
|
COMMERCIAL MORTGAGE-BACKED SECURITIES — 6.2% | |
Assurant Commercial Mortgage Trust, | |
Series 2016-01A, Class AS, 144A | |
3.172% | | | 05/15/49 | | | | | | | | 3,100 | | | | 3,186,279 | |
BANK, | | | | | | | | | | | | | | | | |
Series 2021-BN35, Class A3 | |
1.717% | | | 06/15/64 | | | | | | | | 3,500 | | | | 3,408,382 | |
Series 2021-BN35, Class ASB | |
2.067% | | | 06/15/64 | | | | | | | | 2,300 | | | | 2,306,408 | |
Series 2021-BN37, Class A4 | |
2.370% | | | 11/15/64 | | | | | | | | 3,900 | | | | 3,957,577 | |
Barclays Commercial Mortgage Securities Trust, | |
Series 2018-C02, Class A4 | |
4.047% | | | 12/15/51 | | | | | | | | 3,850 | | | | 4,301,712 | |
Series 2021-C12, Class A4 | |
2.421% | | | 11/15/54 | | | | | | | | 4,500 | | | | 4,566,952 | |
Benchmark Mortgage Trust, | |
Series 2018-B03, Class A4 | |
3.761% | | | 04/10/51 | | | | | | | | 3,600 | | | | 3,902,570 | |
Series 2021-B24, Class A3 | |
2.010% | | | 03/15/54 | | | | | | | | 2,000 | | | | 2,008,519 | |
BXP Trust, | | | | | | | | | | | | | | | | |
Series 2021-601L, Class A, 144A | |
2.618% | | | 01/15/44 | | | | | | | | 5,500 | | | | 5,599,212 | |
CFCRE Commercial Mortgage Trust, | |
Series 2016-C04, Class A3 | |
3.014% | | | 05/10/58 | | | | | | | | 2,500 | | | | 2,608,137 | |
Citigroup Commercial Mortgage Trust, | |
Series 2014-GC21, Class A4 | |
3.575% | | | 05/10/47 | | | | | | | | 835 | | | | 859,918 | |
Series 2016-C01, Class A3 | |
2.944% | | | 05/10/49 | | | | | | | | 2,700 | | | | 2,785,347 | |
Series 2017-P07, Class A3 | |
3.442% | | | 04/14/50 | | | | | | | | 4,000 | | | | 4,271,548 | |
Commercial Mortgage Trust, | |
Series 2014-CR18, Class A4 | |
3.550% | | | 07/15/47 | | | | | | | | 1,770 | | | | 1,826,114 | |
Series 2014-LC17, Class A4 | |
3.648% | | | 10/10/47 | | | | | | | | 4,216 | | | | 4,372,837 | |
CSAIL Commercial Mortgage Trust, | |
Series 2015-C04, Class A3 | |
3.544% | | | 11/15/48 | | | | | | | | 2,483 | | | | 2,604,829 | |
Series 2017-C08, Class A3 | |
3.127% | | | 06/15/50 | | | | | | | | 3,800 | | | | 3,923,409 | |
FHLMC Multifamily Structured Pass-Through Certificates, | |
Series K020, Class X1, IO | |
1.333%(cc) | | | 05/25/22 | | | | | | | | 16,375 | | | | 31,653 | |
Series K021, Class X1, IO | |
1.376%(cc) | | | 06/25/22 | | | | | | | | 4,783 | | | | 3,742 | |
Series K055, Class X1, IO | |
1.354%(cc) | | | 03/25/26 | | | | | | | | 4,447 | | | | 218,999 | |
SEE NOTES TO FINANCIAL STATEMENTS.
A22
| | | | | | |
| | |
| | PSF PGIM 50/50 BALANCED PORTFOLIO (CONTINUED) | | |
| | | | | | |
| |
| SCHEDULE OF INVESTMENTS | | as of December 31, 2021 |
| | | | | | | | | | | | | | | | |
Interest Rate | | Maturity
Date | | | | | | Principal
Amount
(000)# | | | Value | |
| | | | | | | | | | | | | | | | |
|
| COMMERCIAL MORTGAGE-BACKED SECURITIES (continued) | |
Series K080, Class AM | |
3.986%(cc) | | | 07/25/28 | | | | | | | | 3,960 | | | $ | 4,494,605 | |
Series K157, Class A2 | |
3.990%(cc) | | | 05/25/33 | | | | | | | | 3,100 | | | | 3,608,418 | |
Series W5FX, Class AFX | |
3.214%(cc) | | | 04/25/28 | | | | | | | | 860 | | | | 935,406 | |
GS Mortgage Securities Corp. Trust, | |
Series 2021-RENT, Class A, 144A, 1 Month LIBOR + 0.700% (Cap N/A, Floor 0.700%) | |
0.803%(c) | | | 11/21/35 | | | | | | | | 1,075 | | | | 1,070,326 | |
GS Mortgage Securities Trust, | |
Series 2015-GC28, Class A4 | |
3.136% | | | 02/10/48 | | | | | | | | 2,907 | | | | 3,000,750 | |
Series 2015-GC34, Class A3 | |
3.244% | | | 10/10/48 | | | | | | | | 4,715 | | | | 4,845,173 | |
Series 2016-GS03, Class A3 | |
2.592% | | | 10/10/49 | | | | | | | | 3,901 | | | | 3,998,430 | |
Series 2016-GS04, Class A3 | |
3.178% | | | 11/10/49 | | | | | | | | 4,000 | | | | 4,161,065 | |
Series 2020-GSA02, Class A4 | |
1.721% | | | 12/12/53 | | | | | | | | 4,150 | | | | 3,998,465 | |
JPMBB Commercial Mortgage Securities Trust, | |
Series 2014-C25, Class A4A1 | |
3.408% | | | 11/15/47 | | | | | | | | 627 | | | | 648,913 | |
Series 2015-C27, Class A3A1 | |
2.920% | | | 02/15/48 | | | | | | | | 3,978 | | | | 4,090,906 | |
JPMCC Commercial Mortgage Securities Trust, | |
Series 2017-JP06, Class A3 | |
3.109% | | | 07/15/50 | | | | | | | | 5,581 | | | | 5,702,824 | |
JPMDB Commercial Mortgage Securities Trust, | |
Series 2016-C02, Class A3A | |
2.881% | | | 06/15/49 | | | | | | | | 2,500 | | | | 2,568,231 | |
JPMorgan Chase Commercial Mortgage Securities Trust, | |
Series 2013-LC11, Class A4 | |
2.694% | | | 04/15/46 | | | | | | | | 498 | | | | 505,023 | |
MHC Commercial Mortgage Trust, | |
Series 2021-MHC, Class C, 144A, 1 Month LIBOR + 1.351% (Cap N/A,Floor 1.351%) | |
1.461%(c) | | | 04/15/38 | | | | | | | | 2,150 | | | | 2,145,288 | |
Morgan Stanley Bank of America Merrill Lynch Trust, | |
Series 2013-C08, Class A3 | |
2.863% | | | 12/15/48 | | | | | | | | 935 | | | | 940,918 | |
Morgan Stanley Capital I Trust, | |
Series 2015-UBS08, Class A3 | |
3.540% | | | 12/15/48 | | | | | | | | 5,000 | | | | 5,279,422 | |
Series 2016-BNK02, Class A3 | |
2.791% | | | 11/15/49 | | | | | | | | 2,000 | | | | 2,075,213 | |
Series 2016-UB11, Class A3 | |
2.531% | | | 08/15/49 | | | | | | | | 6,300 | | | | 6,432,029 | |
Series 2019-H06, Class A3 | |
3.158% | | | 06/15/52 | | | | | | | | 5,000 | | | | 5,283,497 | |
Series 2019-H07, Class A2 | |
2.492% | | | 07/15/52 | | | | | | | | 9,400 | | | | 9,545,187 | |
UBS Commercial Mortgage Trust, | |
Series 2017-C02, Class ASB | |
3.264% | | | 08/15/50 | | | | | | | | 2,500 | | | | 2,615,983 | |
| | | | | | | | | | | | | | | | |
Interest Rate | | Maturity
Date | | | | | | Principal
Amount
(000)# | | | Value | |
| | | | | | | | | | | | | | | | |
|
| COMMERCIAL MORTGAGE-BACKED SECURITIES (continued) | |
Series 2017-C05, Class A4 | |
3.212% | | | 11/15/50 | | | | | | | | 5,000 | | | $ | 5,237,239 | |
Series 2018-C09, Class A3 | |
3.854% | | | 03/15/51 | | | | | | | | 1,800 | | | | 1,948,936 | |
Series 2018-C14, Class A3 | |
4.180% | | | 12/15/51 | | | | | | | | 2,900 | | | | 3,166,313 | |
UBS-Barclays Commercial Mortgage Trust, | |
Series 2012-C04, Class A4 | |
2.792% | | | 12/10/45 | | | | | | | | 1,400 | | | | 1,403,629 | |
Series 2013-C05, Class A3 | |
2.920% | | | 03/10/46 | | | | | | | | 577 | | | | 582,672 | |
Series 2013-C06, Class A3 | |
2.971% | | | 04/10/46 | | | | | | | | 1,405 | | | | 1,422,688 | |
Wells Fargo Commercial Mortgage Trust, | |
Series 2016-NXS06, Class A3 | |
2.642% | | | 11/15/49 | | | | | | | | 4,500 | | | | 4,657,392 | |
Series 2017-C38, Class A4 | |
3.190% | | | 07/15/50 | | | | | | | | 3,300 | | | | 3,511,005 | |
Series 2019-C49, Class A3 | |
3.749% | | | 03/15/52 | | | | | | | | 7,300 | | | | 7,876,261 | |
Series 2020-C58, Class A3 | |
1.810% | | | 07/15/53 | | | | | | | | 5,000 | | | | 4,862,826 | |
Series 2021-C61, Class A3 | |
2.406% | | | 11/15/54 | | | | | | | | 9,000 | | | | 9,098,563 | |
| | | | | | | | | | | | | | | | |
TOTAL COMMERCIAL MORTGAGE-BACKED SECURITIES
(cost $173,659,001) | | | | 178,457,740 | |
| | | | | | | | | | | | | | | | |
|
| CORPORATE BONDS — 10.4% | |
Aerospace & Defense — 0.2% | |
Boeing Co. (The), | |
Sr. Unsec’d. Notes | |
2.196% | | | 02/04/26 | | | | | | | | 1,610 | | | | 1,609,748 | |
3.750% | | | 02/01/50 | (a) | | | | | | | 1,470 | | | | 1,523,229 | |
Embraer Netherlands Finance BV (Brazil), | |
Gtd. Notes | | | | | | | | | | | | | | | | |
5.050% | | | 06/15/25 | | | | | | | | 551 | | | | 570,132 | |
Embraer Overseas Ltd. (Brazil), | |
Gtd. Notes, 144A | | | | | | | | | | | | | |
5.696% | | | 09/16/23 | | | | | | | | 765 | | | | 799,480 | |
Raytheon Technologies Corp., | |
Sr. Unsec’d. Notes | |
4.125% | | | 11/16/28 | | | | | | | | 910 | | | | 1,018,349 | |
| | | | | | | | | | | | | | | | |
| | | | |
| | | | | | | | | | | | | | | 5,520,938 | |
| | | | | | | | | | | | | | | | |
Agriculture — 0.1% | |
BAT Capital Corp. (United Kingdom), | |
Gtd. Notes | | | | | | | | | | | | | | | | |
3.557% | | | 08/15/27 | | | | | | | | 1,365 | | | | 1,432,835 | |
Vector Group Ltd., | |
Sr. Sec’d. Notes, 144A | |
5.750% | | | 02/01/29 | | | | | | | | 875 | | | | 851,171 | |
| | | | | | | | | | | | | | | | |
| | | | |
| | | | | | | | | | | | | | | 2,284,006 | |
| | | | | | | | | | | | | | | | |
SEE NOTES TO FINANCIAL STATEMENTS.
A23
| | | | | | |
| | |
| | PSF PGIM 50/50 BALANCED PORTFOLIO (CONTINUED) | | |
| | | | | | |
| |
| SCHEDULE OF INVESTMENTS | | as of December 31, 2021 |
| | | | | | | | | | | | | | | | |
Interest Rate | | Maturity Date | | | | | | Principal
Amount
(000)# | | | Value | |
| | | | | | | | | | | | | | | | |
|
| CORPORATE BONDS (continued) | |
Airlines — 0.2% | | | | | | | | | | | | | |
American Airlines 2015-1 Class A Pass-Through Trust, | |
Pass-Through Certificates | |
3.375% | | | 11/01/28 | | | | | | | | 1,782 | | | $ | 1,765,632 | |
Continental Airlines 2012-2 Class A Pass-Through Trust, | |
Pass-Through Certificates | |
4.000% | | | 04/29/26 | | | | | | | | 244 | | | | 252,373 | |
Southwest Airlines Co., | |
Sr. Unsec’d. Notes | |
2.625% | | | 02/10/30 | (a) | | | | | | | 1,765 | | | | 1,764,822 | |
United Airlines, Inc., | | | | | |
Sr. Sec’d. Notes, 144A | |
4.375% | | | 04/15/26 | | | | | | | | 590 | | | | 615,605 | |
4.625% | | | 04/15/29 | | | | | | | | 115 | | | | 119,273 | |
| | | | | | | | | | | | | | | | |
| | | | |
| | | | | | | | | | | | | | | 4,517,705 | |
| | | | | | | | | | | | | | | | |
Apparel — 0.0% | | | | | |
Wolverine World Wide, Inc., | | | | | |
Gtd. Notes, 144A | |
4.000% | | | 08/15/29 | | | | | | | | 550 | | | | 532,296 | |
| | | | | | | | | | | | | | | | |
Auto Manufacturers — 0.4% | | | | | |
Daimler Trucks Finance North America LLC (Germany), | |
Gtd. Notes, 144A | | | | | |
1.625% | | | 12/13/24 | | | | | | | | 3,770 | | | | 3,797,098 | |
Ford Motor Co., | | | | | |
Sr. Unsec’d. Notes | |
5.291% | | | 12/08/46 | | | | | | | | 665 | | | | 780,182 | |
Ford Motor Credit Co. LLC, | | | | | |
Sr. Unsec’d. Notes | |
2.900% | | | 02/16/28 | | | | | | | | 200 | | | | 200,944 | |
3.350% | | | 11/01/22 | | | | | | | | 2,845 | | | | 2,883,753 | |
General Motors Co., | | | | | |
Sr. Unsec’d. Notes | |
6.250% | | | 10/02/43 | | | | | | | | 740 | | | | 1,012,150 | |
6.600% | | | 04/01/36 | | | | | | | | 585 | | | | 789,932 | |
General Motors Financial Co., Inc., | | | | | |
Gtd. Notes | | | | | | | | | | | | | | | | |
3.950% | | | 04/13/24 | | | | | | | | 1,700 | | | | 1,790,290 | |
| | | | | | | | | | | | | | | | |
| | | | | | | | | | | | | | | 11,254,349 | |
| | | | | | | | | | | | | | | | |
Banks — 2.8% | | | | | |
Banco Santander SA (Spain), | | | | | |
Sr. Unsec’d. Notes, 3 Month LIBOR + 1.120% | |
1.241%(c) | | | 04/12/23 | | | | | | | | 400 | | | | 404,004 | |
Sr. Unsec’d. Notes | | | | | |
1.849% | | | 03/25/26 | | | | | | | | 800 | | | | 795,477 | |
Bank of America Corp., | | | | | |
Jr. Sub. Notes, Series JJ | |
5.125%(ff) | | | 06/20/24 | (oo) | | | | | | | 1,145 | | | | 1,193,079 | |
Jr. Sub. Notes, Series MM | | | | | | | | | |
4.300%(ff) | | | 01/28/25 | (oo) | | | | | | | 310 | | | | 314,380 | |
Sr. Unsec’d. Notes, MTN | | | | | | | | | |
1.898%(ff) | | | 07/23/31 | | | | | | | | 1,805 | | | | 1,730,765 | |
2.496%(ff) | | | 02/13/31 | | | | | | | | 5,165 | | | | 5,183,709 | |
3.194%(ff) | | | 07/23/30 | | | | | | | | 1,050 | | | | 1,107,230 | |
3.824%(ff) | | | 01/20/28 | | | | | | | | 615 | | | | 666,445 | |
Sub. Notes, MTN | |
4.000% | | | 01/22/25 | | | | | | | | 1,700 | | | | 1,817,926 | |
| | | | | | | | | | | | | | | | |
Interest Rate | | Maturity
Date | | | | | | Principal
Amount
(000)# | | | Value | |
| | | | | | | | | | | | | | | | |
|
| CORPORATE BONDS (continued) | |
Banks (cont’d.) | | | | | | | | | | | | | |
4.200% | | | 08/26/24 | (a) | | | | | | | 745 | | | $ | 798,315 | |
4.450% | | | 03/03/26 | | | | | | | | 4,790 | | | | 5,278,254 | |
Bank of America NA, | | | | | |
Sub. Notes | | | | | | | | | | | | | | | | |
6.000% | | | 10/15/36 | | | | | | | | 805 | | | | 1,100,097 | |
Barclays PLC (United Kingdom), | | | | | |
Sr. Unsec’d. Notes | |
3.650% | | | 03/16/25 | | | | | | | | 610 | | | | 644,977 | |
3.932%(ff) | | | 05/07/25 | | | | | | | | 320 | | | | 336,812 | |
4.375% | | | 01/12/26 | | | | | | | | 323 | | | | 352,882 | |
Sr. Unsec’d. Notes, MTN | | | | | | | | | |
4.972%(ff) | | | 05/16/29 | | | | | | | | 705 | | | | 806,710 | |
BNP Paribas SA (France), | | | | | |
Sr. Unsec’d. Notes, 144A | |
2.219%(ff) | | | 06/09/26 | | | | | | | | 1,650 | | | | 1,666,906 | |
Citigroup, Inc., | | | | | |
Jr. Sub. Notes, Series V | |
4.700%(ff) | | | 01/30/25 | (oo) | | | | | | | 1,675 | | | | 1,703,181 | |
Sr. Unsec’d. Notes | |
2.561%(ff) | | | 05/01/32 | | | | | | | | 2,100 | | | | 2,111,976 | |
3.200% | | | 10/21/26 | | | | | | | | 670 | | | | 710,186 | |
3.700% | | | 01/12/26 | | | | | | | | 1,610 | | | | 1,740,595 | |
3.887%(ff) | | | 01/10/28 | | | | | | | | 560 | | | | 607,209 | |
Sub. Notes | | | | | | | | | | | | | | | | |
4.450% | | | 09/29/27 | | | | | | | | 1,485 | | | | 1,655,786 | |
4.750% | | | 05/18/46 | | | | | | | | 440 | | | | 544,628 | |
Credit Suisse Group AG (Switzerland), | | | | | |
Sr. Unsec’d. Notes, 144A | | | | | | | | | | | | | |
2.193%(ff) | | | 06/05/26 | | | | | | | | 1,100 | | | | 1,106,856 | |
3.091%(ff) | | | 05/14/32 | | | | | | | | 560 | | | | 569,291 | |
4.282% | | | 01/09/28 | | | | | | | | 980 | | | | 1,065,941 | |
Deutsche Bank AG (Germany), | | | | | |
Sr. Unsec’d. Notes | | | | | | | | | | | | | |
2.129%(ff) | | | 11/24/26 | | | | | | | | 460 | | | | 459,418 | |
Sr. Unsec’d. Notes, Series D | | | | | | | | | | | | | |
5.000% | | | 02/14/22 | | | | | | | | 1,350 | | | | 1,356,136 | |
Discover Bank, | | | | | |
Sr. Unsec’d. Notes | | | | | | | | | | | | | |
4.250% | | | 03/13/26 | | | | | | | | 595 | | | | 649,801 | |
Goldman Sachs Group, Inc. (The), | | | | | |
Jr. Sub. Notes, Series O | | | | | | | | | | | | | |
5.300%(ff) | | | 11/10/26 | (oo) | | | | | | | 560 | | | | 608,238 | |
Sr. Unsec’d. Notes | | | | | | | | | | | | | |
1.542%(ff) | | | 09/10/27 | | | | | | | | 2,345 | | | | 2,298,782 | |
3.750% | | | 02/25/26 | | | | | | | | 1,165 | | | | 1,253,504 | |
3.814%(ff) | | | 04/23/29 | | | | | | | | 440 | | | | 478,902 | |
3.850% | | | 01/26/27 | | | | | | | | 2,625 | | | | 2,826,231 | |
Sub. Notes | | | | | | | | | | | | | | | | |
6.750% | | | 10/01/37 | | | | | | | | 225 | | | | 319,032 | |
ING Groep NV (Netherlands), | | | | | |
Sr. Unsec’d. Notes | | | | | | | | | | | | | |
3.550% | | | 04/09/24 | | | | | | | | 400 | | | | 419,505 | |
JPMorgan Chase & Co., | | | | | |
Jr. Sub. Notes, Series FF | | | | | | | | | | | | | |
5.000%(ff) | | | 08/01/24 | (oo) | | | | | | | 540 | | | | 557,232 | |
Jr. Sub. Notes, Series HH | | | | | | | | | | | | | |
4.600%(ff) | | | 02/01/25 | (oo) | | | | | | | 1,245 | | | | 1,272,615 | |
SEE NOTES TO FINANCIAL STATEMENTS.
A24
| | | | | | |
| | |
| | PSF PGIM 50/50 BALANCED PORTFOLIO (CONTINUED) | | |
| | | | | | |
| |
| SCHEDULE OF INVESTMENTS | | as of December 31, 2021 |
| | | | | | | | | | | | | | | | |
Interest Rate | | Maturity
Date | | | | | | Principal
Amount
(000)# | | | Value | |
| | | | | | | | | | | | | | | | |
|
| CORPORATE BONDS (continued) | |
Banks (cont’d.) | | | | | | | | | | | | | |
Jr. Sub. Notes, Series I, 3 Month LIBOR + 3.470% | |
3.599%(c) | | | 04/30/22 | (oo) | | | | | | | 979 | | | $ | 981,578 | |
Jr. Sub. Notes, Series II | |
4.000%(ff) | | | 04/01/25 | (oo) | | | | | | | 230 | | | | 231,321 | |
Sr. Unsec’d. Notes | |
2.580%(ff) | | | 04/22/32 | | | | | | | | 1,585 | | | | 1,604,750 | |
3.782%(ff) | | | 02/01/28 | | | | | | | | 270 | | | | 292,504 | |
3.964%(ff) | | | 11/15/48 | | | | | | | | 2,240 | | | | 2,622,477 | |
4.005%(ff) | | | 04/23/29 | | | | | | | | 1,360 | | | | 1,502,528 | |
Sub. Notes | | | | | | | | | | | | | | | | |
3.875% | | | 09/10/24 | | | | | | | | 3,525 | | | | 3,751,431 | |
Morgan Stanley, | |
Jr. Sub. Notes, Series H, 3 Month LIBOR + 3.610% | |
3.734%(c) | | | 01/18/22 | (a)(oo) | | | | | | | 640 | | | | 640,237 | |
Sr. Unsec’d. Notes, GMTN | |
2.239%(ff) | | | 07/21/32 | | | | | | | | 2,770 | | | | 2,713,865 | |
3.772%(ff) | | | 01/24/29 | | | | | | | | 1,295 | | | | 1,410,051 | |
3.875% | | | 01/27/26 | | | | | | | | 550 | | | | 596,273 | |
4.431%(ff) | | | 01/23/30 | | | | | | | | 455 | | | | 518,121 | |
Sr. Unsec’d. Notes, MTN | |
3.591%(ff) | | | 07/22/28 | | | | | | | | 1,030 | | | | 1,111,058 | |
Sub. Notes, GMTN | |
4.350% | | | 09/08/26 | | | | | | | | 3,050 | | | | 3,378,251 | |
NatWest Group PLC (United Kingdom), | |
Sr. Unsec’d. Notes | | | | | | | | | | | | | |
5.076%(ff) | | | 01/27/30 | | | | | | | | 1,570 | | | | 1,821,413 | |
Societe Generale SA (France), | |
Sr. Unsec’d. Notes, 144A | |
1.488%(ff) | | | 12/14/26 | | | | | | | | 3,200 | | | | 3,119,586 | |
State Bank of India (India), | |
Sr. Unsec’d. Notes, 144A | | | | | | | | | | | | | |
4.375% | | | 01/24/24 | | | | | | | | 1,255 | | | | 1,322,976 | |
UBS Group AG (Switzerland), | |
Sr. Unsec’d. Notes, 144A | |
1.364%(ff) | | | 01/30/27 | | | | | | | | 2,250 | | | | 2,199,656 | |
Wells Fargo & Co., | |
Sr. Unsec’d. Notes, MTN | | | | | | | | | | | | | |
2.572%(ff) | | | 02/11/31 | | | | | | | | 2,895 | | | | 2,954,947 | |
| | | | | | | | | | | | | | | | |
| | | | |
| | | | | | | | | | | | | | | 81,286,036 | |
| | | | | | | | | | | | | | | | |
Beverages — 0.2% | | | | | | | | | | | | | |
Anheuser-Busch Cos. LLC/Anheuser-Busch InBev Worldwide, Inc. (Belgium), | |
Gtd. Notes | | | | | | | | | | | | | | | | |
4.700% | | | 02/01/36 | | | | | | | | 1,220 | | | | 1,473,682 | |
Bacardi Ltd. (Bermuda), | |
Gtd. Notes, 144A | | | | | | | | | | | | | |
2.750% | | | 07/15/26 | | | | | | | | 2,785 | | | | 2,869,554 | |
Constellation Brands, Inc., | |
Sr. Unsec’d. Notes | | | | | | | | | | | | | |
2.250% | | | 08/01/31 | | | | | | | | 780 | | | | 762,397 | |
| | | | | | | | | | | | | | | | |
| | | | |
| | | | | | | | | | | | | | | 5,105,633 | |
| | | | | | | | | | | | | | | | |
Biotechnology — 0.1% | | | | | | | | | | | | | |
Amgen, Inc., | |
Sr. Unsec’d. Notes | |
2.800% | | | 08/15/41 | | | | | | | | 2,840 | | | | 2,747,326 | |
| | | | | | | | | | | | | | | | |
Interest Rate | | Maturity
Date | | | | | | Principal
Amount
(000)# | | | Value | |
| | | | | | | | | | | | | | | | |
| |
| CORPORATE BONDS (continued) | | | | | |
Biotechnology (cont’d.) | | | | | | | | | | | | | |
Regeneron Pharmaceuticals, Inc., | |
Sr. Unsec’d. Notes | | | | | | | | | | | | | |
2.800% | | | 09/15/50 | | | | | | | | 395 | | | $ | 371,091 | |
| | | | | | | | | | | | | | | | |
| | | | |
| | | | | | | | | | | | | | | 3,118,417 | |
| | | | | | | | | | | | | | | | |
Building Materials — 0.0% | |
Masonite International Corp., | |
Gtd. Notes, 144A | | | | | | | | | | | | | |
3.500% | | | 02/15/30 | | | | | | | | 650 | | | | 644,623 | |
Standard Industries, Inc., | |
Sr. Unsec’d. Notes, 144A | | | | | | | | | | | | | |
4.750% | | | 01/15/28 | | | | | | | | 300 | | | | 310,337 | |
| | | | | | | | | | | | | | | | |
| | | | |
| | | | | | | | | | | | | | | 954,960 | |
| | | | | | | | | | | | | | | | |
Chemicals — 0.1% | |
CF Industries, Inc., | |
Gtd. Notes | | | | | | | | | | | | | | | | |
5.375% | | | 03/15/44 | | | | | | | | 740 | | | | 934,064 | |
Dow Chemical Co. (The), | |
Sr. Unsec’d. Notes | | | | | | | | | | | | | |
4.375% | | | 11/15/42 | | | | | | | | 5 | | | | 5,963 | |
5.250% | | | 11/15/41 | | | | | | | | 350 | | | | 452,203 | |
9.400% | | | 05/15/39 | | | | | | | | 15 | | | | 26,960 | |
LYB International Finance BV, | |
Gtd. Notes | | | | | | | | | | | | | | | | |
5.250% | | | 07/15/43 | | | | | | | | 620 | | | | 796,087 | |
NOVA Chemicals Corp. (Canada), | |
Sr. Unsec’d. Notes, 144A | | | | | | | | | | | | | |
4.875% | | | 06/01/24 | | | | | | | | 875 | | | | 907,357 | |
Sasol Financing USA LLC (South Africa), | |
Gtd. Notes | | | | | | | | | | | | | | | | |
5.875% | | | 03/27/24 | | | | | | | | 600 | | | | 624,832 | |
6.500% | | | 09/27/28 | | | | | | | | 405 | | | | 438,637 | |
| | | | | | | | | | | | | | | | |
| | | | |
| | | | | | | | | | | | | | | 4,186,103 | |
| | | | | | | | | | | | | | | | |
Commercial Services — 0.1% | |
ERAC USA Finance LLC, | |
Gtd. Notes, 144A | | | | | | | | | | | | | |
4.200% | | | 11/01/46 | | | | | | | | 875 | | | | 1,033,341 | |
7.000% | | | 10/15/37 | | | | | | | | 390 | | | | 575,370 | |
United Rentals North America, Inc., | |
Gtd. Notes | | | | | | | | | | | | | | | | |
3.750% | | | 01/15/32 | | | | | | | | 250 | | | | 251,978 | |
4.875% | | | 01/15/28 | | | | | | | | 735 | | | | 772,311 | |
5.250% | | | 01/15/30 | | | | | | | | 265 | | | | 286,892 | |
| | | | | | | | | | | | | | | | |
| | | | |
| | | | | | | | | | | | | | | 2,919,892 | |
| | | | | | | | | | | | | | | | |
Diversified Financial Services — 0.2% | |
BOC Aviation USA Corp. (Singapore), | |
Gtd. Notes, 144A, MTN | | | | | | | | | | | | | |
1.625% | | | 04/29/24 | | | | | | | | 445 | | | | 444,537 | |
CDP Financial, Inc. (Canada), | |
Gtd. Notes, 144A | | | | | | | | | | | | | |
3.150% | | | 07/24/24 | (a) | | | | | | | 445 | | | | 469,133 | |
Discover Financial Services, | |
Sr. Unsec’d. Notes | | | | | | | | | | | | | |
3.850% | | | 11/21/22 | | | | | | | | 900 | | | | 923,964 | |
SEE NOTES TO FINANCIAL STATEMENTS.
A25
| | | | | | |
| | |
| | PSF PGIM 50/50 BALANCED PORTFOLIO (CONTINUED) | | |
| | | | | | |
| |
| SCHEDULE OF INVESTMENTS | | as of December 31, 2021 |
| | | | | | | | | | | | | | | | |
Interest
Rate | | Maturity
Date | | | | | | Principal
Amount
(000)# | | | Value | |
| | | | | | | | | | | | | | | | |
|
| CORPORATE BONDS (continued) | |
Diversified Financial Services (cont’d.) | |
Nomura Holdings, Inc. (Japan), | | | | | |
Sr. Unsec’d. Notes | |
2.608% | | | 07/14/31 | | | | | | | | 1,490 | | | $ | 1,468,888 | |
OneMain Finance Corp., | | | | | |
Gtd. Notes | | | | | | | | | | | | | | | | |
8.250% | | | 10/01/23 | | | | | | | | 1,100 | | | | 1,216,347 | |
Private Export Funding Corp., | | | | | |
U.S. Gov’t. Gtd. Notes, Series NN | |
3.250% | | | 06/15/25 | | | | | | | | 255 | | | | 270,072 | |
| | | | | | | | | | | | | | | | |
| | | | |
| | | | | | | | | | | | | | | 4,792,941 | |
| | | | | | | | | | | | | | | | |
Electric — 0.9% | | | | | | | | | | | | | | | | |
Abu Dhabi National Energy Co. PJSC (United Arab Emirates), | |
Sr. Unsec’d. Notes, 144A, MTN | |
2.000% | | | 04/29/28 | | | | | | | | 370 | | | | 365,915 | |
Alfa Desarrollo SpA (Chile), | | | | | |
Sr. Sec’d. Notes, 144A | |
4.550% | | | 09/27/51 | | | | | | | | 440 | | | | 432,111 | |
Baltimore Gas & Electric Co., | | | | | |
Sr. Unsec’d. Notes | | | | | |
6.350% | | | 10/01/36 | (a) | | | | | | | 530 | | | | 750,579 | |
Berkshire Hathaway Energy Co., | | | | | |
Sr. Unsec’d. Notes | | | | | |
5.950% | | | 05/15/37 | | | | | | | | 335 | | | | 451,591 | |
Calpine Corp., | | | | | | | | | | | | | | | | |
Sr. Sec’d. Notes, 144A | |
3.750% | | | 03/01/31 | | | | | | | | 1,400 | | | | 1,350,378 | |
CenterPoint Energy Houston Electric LLC, | |
General Ref. Mortgage, Series K2 | |
6.950% | | | 03/15/33 | | | | | | | | 300 | | | | 412,050 | |
Connecticut Light & Power Co. (The), | | | | | |
First Mortgage, Series A | |
2.050% | | | 07/01/31 | | | | | | | | 2,290 | | | | 2,264,768 | |
Consolidated Edison Co. of New York, Inc., | |
Sr. Unsec’d. Notes, Series 09-C | |
5.500% | | | 12/01/39 | | | | | | | | 145 | | | | 187,084 | |
Duke Energy Carolinas LLC, | | | | | |
First Mortgage | | | | | | | | | | | | | | | | |
6.050% | | | 04/15/38 | | | | | | | | 530 | | | | 734,303 | |
El Paso Electric Co., | | | | | |
Sr. Unsec’d. Notes | |
6.000% | | | 05/15/35 | | | | | | | | 845 | | | | 1,106,492 | |
Enel Finance International NV (Italy), | | | | | |
Gtd. Notes, 144A | |
2.250% | | | 07/12/31 | | | | | | | | 1,500 | | | | 1,453,011 | |
Engie Energia Chile SA (Chile), | | | | | |
Sr. Unsec’d. Notes, 144A | |
3.400% | | | 01/28/30 | | | | | | | | 400 | | | | 404,444 | |
Florida Power & Light Co., | | | | | |
First Mortgage | | | | | | | | | | | | | | | | |
5.950% | | | 10/01/33 | | | | | | | | 380 | | | | 506,386 | |
Iberdrola International BV (Spain), | | | | | |
Gtd. Notes | | | | | | | | | | | | | | | | |
6.750% | | | 09/15/33 | | | | | | | | 140 | | | | 189,734 | |
Indiana Michigan Power Co., | | | | | |
Sr. Unsec’d. Notes | |
3.850% | | | 05/15/28 | | | | | | | | 2,105 | | | | 2,326,946 | |
| | | | | | | | | | | | | | | | |
Interest
Rate | | Maturity
Date | | | | | | Principal
Amount
(000)# | | | Value | |
| | | | | | | | | | | | | | | | |
| |
| CORPORATE BONDS (continued) | | | | | |
Electric (cont’d.) | | | | | | | | | | | | | |
Israel Electric Corp. Ltd. (Israel), | | | | | | | | | | | | | |
Sr. Sec’d. Notes, 144A, GMTN | |
4.250% | | | 08/14/28 | | | | | | | | 575 | | | $ | 631,816 | |
Monongahela Power Co., | | | | | | | | | | | | | |
First Mortgage, 144A | |
4.100% | | | 04/15/24 | | | | | | | | 1,560 | | | | 1,642,507 | |
Northern States Power Co., | | | | | | | | | | | | | |
First Mortgage | |
3.600% | | | 09/15/47 | | | | | | | | 1,035 | | | | 1,157,190 | |
NRG Energy, Inc., | | | | | | | | | | | | | |
Gtd. Notes, 144A | |
3.875% | | | 02/15/32 | | | | | | | | 200 | | | | 196,727 | |
Sr. Sec’d. Notes, 144A | |
2.000% | | | 12/02/25 | | | | | | | | 225 | | | | 226,549 | |
2.450% | | | 12/02/27 | | | | | | | | 970 | | | | 962,386 | |
Ohio Power Co., | | | | | | | | | | | | | | | | |
Sr. Unsec’d. Notes | |
4.000% | | | 06/01/49 | | | | | | | | 465 | | | | 535,379 | |
PECO Energy Co., | |
First Mortgage | | | | | | | | | | | | | | | | |
2.800% | | | 06/15/50 | | | | | | | | 785 | | | | 770,759 | |
Public Service Electric & Gas Co., | |
First Mortgage, | | | | | | | | | | | | | | | | |
MTN 3.700% | | | 05/01/28 | | | | | | | | 850 | | | | 939,737 | |
Sr. Sec’d. Notes,MTN | |
5.800% | | | 05/01/37 | | | | | | | | 515 | | | | 699,775 | |
Public Service Enterprise Group, Inc., | |
Sr. Unsec’d. Notes | | | | | | | | | | | | | | | | |
1.600% | | | 08/15/30 | | | | | | | | 1,235 | | | | 1,146,015 | |
San Diego Gas & Electric Co., | |
First Mortgage | | | | | | | | | | | | | | | | |
4.150% | | | 05/15/48 | | | | | | | | 1,010 | | | | 1,206,550 | |
Southern California Edison Co., | |
First Ref. Mortgage | |
4.000% | | | 04/01/47 | | | | | | | | 350 | | | | 386,517 | |
First Ref. Mortgage, Series C | |
3.600% | | | 02/01/45 | | | | | | | | 690 | | | | 703,813 | |
Vistra Operations Co. LLC, | |
Gtd. Notes, 144A | |
5.000% | | | 07/31/27 | | | | | | | | 495 | | | | 513,855 | |
Sr. Sec’d. Notes, 144A | |
3.550% | | | 07/15/24 | | | | | | | | 1,475 | | | | 1,520,944 | |
Xcel Energy, Inc., | | | | | | | | | | | | | |
Sr. Unsec’d. Notes | |
4.800% | | | 09/15/41 | | | | | | | | 480 | | | | 586,768 | |
| | | | | | | | | | | | | | | | |
| | | | |
| | | | | | | | | | | | | | | 26,763,079 | |
| | | | | | | | | | | | | | | | |
Engineering & Construction —0.1% | |
AECOM, | | | | | | | | | | | | | | | | |
Gtd. Notes | | | | | | | | | | | | | | | | |
5.125% | | | 03/15/27 | | | | | | | | 900 | | | | 979,680 | |
Mexico City Airport Trust (Mexico), | |
Sr. Sec’d. Notes, 144A | | | | | | | | | | | | | |
5.500% | | | 07/31/47 | | | | | | | | 1,350 | | | | 1,351,452 | |
| | | | | | | | | | | | | | | | |
| | | | |
| | | | | | | | | | | | | | | 2,331,132 | |
| | | | | | | | | | | | | | | | |
SEE NOTES TO FINANCIAL STATEMENTS.
A26
| | | | | | |
| | |
| | PSF PGIM 50/50 BALANCED PORTFOLIO (CONTINUED) | | |
| | | | | | |
| |
| SCHEDULE OF INVESTMENTS | | as of December 31, 2021 |
| | | | | | | | | | | | | | | | |
Interest
Rate | | Maturity
Date | | | Principal
Amount
(000)# | | | Value | |
| | |
| CORPORATE BONDS (continued) | | | | | | | | | |
Foods — 0.1% | | | | | | | | | | | | | | | | |
Kraft Heinz Foods Co., | | | | | | | | | | | | | |
Gtd. Notes | | | | | | | | | | | | | | | | |
4.875% | | | 10/01/49 | | | | | | | | 1,030 | | | $ | 1,297,285 | |
Lamb Weston Holdings, Inc., | | | | | | | | | | | | | |
Gtd. Notes, 144A | | | | | | | | | | | | | |
4.125% | | | 01/31/30 | | | | | | | | 350 | | | | 359,545 | |
4.375% | | | 01/31/32 | | | | | | | | 350 | | | | 361,091 | |
Mars, Inc., | | | | | | | | | | | | | | | | |
Sr. Unsec’d. Notes, 144A | | | | | | | | | | | | | |
2.375% | | | 07/16/40 | | | | | | | | 535 | | | | 509,000 | |
Pilgrim’s Pride Corp., | | | | | | | | | | | | | |
Gtd. Notes, 144A | | | | | | | | | | | | | |
5.875% | | | 09/30/27 | | | | | | | | 1,200 | | | | 1,266,984 | |
| | | | | | | | | | | | | | | | |
| | | | |
| | | | | | | | | | | | | | | 3,793,905 | |
| | | | | | | | | | | | | | | | |
Forest Products & Paper — 0.0% | | | | | | | | | | | | | |
Celulosa Arauco y Constitucion SA (Chile), | | | | | | | | | |
Sr. Unsec’d. Notes | | | | | | | | | | | | | |
4.500% | | | 08/01/24 | | | | | | | | 207 | | | | 219,943 | |
| | | | | | | | | | | | | | | | |
Gas — 0.2% | | | | | | | | | | | | | | | | |
NiSource, Inc., | | | | | | | | | | | | | | | | |
Sr. Unsec’d. Notes | | | | | | | | | | | | | |
1.700% | | | 02/15/31 | (a) | | | | | | | 835 | | | | 781,371 | |
3.600% | | | 05/01/30 | | | | | | | | 1,600 | | | | 1,728,465 | |
Piedmont Natural Gas Co., Inc., | | | | | | | | | | | | | |
Sr. Unsec’d. Notes | | | | | | | | | | | | | |
3.500% | | | 06/01/29 | | | | | | | | 2,090 | | | | 2,237,021 | |
| | | | | | | | | | | | | | | | |
| | | | |
| | | | | | | | | | | | | | | 4,746,857 | |
| | | | | | | | | | | | | | | | |
Healthcare-Products — 0.1% | | | | | | | | | | | | | |
DH Europe Finance II Sarl, | | | | | | | | | | | | | |
Gtd. Notes | | | | | | | | | | | | | | | | |
1.350% | | | 09/18/39 | | | | EUR | | | | 1,125 | | | | 1,277,901 | |
Medtronic Global Holdings SCA, | | | | | | | | | | | | | |
Gtd. Notes | | | | | | | | | | | | | | | | |
2.250% | | | 03/07/39 | | | | EUR | | | | 300 | | | | 389,640 | |
Mozart Debt Merger Sub, Inc., | | | | | | | | | | | | | |
Sr. Sec’d. Notes, 144A | | | | | | | | | | | | | |
3.875% | | | 04/01/29 | | | | | | | | 475 | | | | 473,347 | |
| | | | | | | | | | | | | | | | |
| | | | |
| | | | | | | | | | | | | | | 2,140,888 | |
| | | | | | | | | | | | | | | | |
Healthcare-Services — 0.1% | | | | | | | | | | | | | |
Aetna, Inc., | | | | | | | | | | | | | | | | |
Sr. Unsec’d. Notes | | | | | | | | | | | | | |
6.625% | | | 06/15/36 | | | | | | | | 480 | | | | 685,188 | |
Anthem, Inc., | | | | | | | | | | | | | | | | |
Sr. Unsec’d. Notes | | | | | | | | | | | | | |
3.600% | | | 03/15/51 | | | | | | | | 885 | | | | 983,977 | |
4.625% | | | 05/15/42 | | | | | | | | 330 | | | | 410,940 | |
HCA, Inc., | | | | | | | | | | | | | | | | |
Gtd. Notes | | | | | | | | | | | | | | | | |
5.875% | | | 02/01/29 | | | | | | | | 575 | | | | 685,661 | |
Sr. Sec’d. Notes | | | | | | | | | | | | | |
5.125% | | | 06/15/39 | | | | | | | | 665 | | | | 822,434 | |
| | | | | | | | | | | | |
Interest
Rate | | Maturity
Date | | | Principal
Amount
(000)# | | | Value | |
| |
| CORPORATE BONDS (continued) | | | | | |
Healthcare-Services (cont’d.) | | | | | | | | | |
Kaiser Foundation Hospitals, | | | | | | | | | |
Gtd. Notes | | | | | | | | | | | | |
4.150% | | | 05/01/47 | | | | 670 | | | $ | 829,078 | |
| | | | | | | | | | | | |
| | | |
| | | | | | | | | | | 4,417,278 | |
| | | | | | | | | | | | |
Home Builders — 0.1% | | | | | | | | | |
Taylor Morrison Communities, Inc., | |
Gtd. Notes, 144A | | | | | | | | | |
5.875% | | | 06/15/27 | | | | 405 | | | | 454,285 | |
6.625% | | | 07/15/27 | | | | 425 | | | | 447,636 | |
Taylor Morrison Communities, Inc./Taylor Morrison Holdings II, Inc., | |
Gtd. Notes, 144A | |
5.625% | | | 03/01/24 | | | | 600 | | | | 640,688 | |
| | | | | | | | | | | | |
| | | |
| | | | | | | | | | | 1,542,609 | |
| | | | | | | | | | | | |
Housewares — 0.1% | | | | | | | | | |
Newell Brands, Inc., | | | | | | | | | |
Sr. Unsec’d. Notes | | | | | | | | | |
4.700% | | | 04/01/26 | (a) | | | 2,010 | | | | 2,192,283 | |
| | | | | | | | | | | | |
Insurance — 0.2% | | | | | | | | | |
Liberty Mutual Group, Inc., | | | | | | | | | |
Gtd. Notes, 144A | | | | | | | | | |
3.951% | | | 10/15/50 | | | | 1,125 | | | | 1,248,195 | |
Lincoln National Corp., | | | | | | | | | |
Sr. Unsec’d. Notes | | | | | | | | | |
6.300% | | | 10/09/37 | | | | 701 | | | | 978,445 | |
Markel Corp., | | | | | | | | | | | | |
Sr. Unsec’d. Notes | |
5.000% | | | 03/30/43 | | | | 165 | | | | 199,934 | |
New York Life Insurance Co., | | | | | | | | | |
Sub. Notes, 144A | | | | | | | | | |
6.750% | | | 11/15/39 | | | | 650 | | | | 980,956 | |
Principal Financial Group, Inc., | | | | | | | | | |
Gtd. Notes | | | | | | | | | |
4.625% | | | 09/15/42 | | | | 105 | | | | 130,707 | |
Teachers Insurance & Annuity Association of America, | | | | | |
Sub. Notes, 144A | | | | | |
4.270% | | | 05/15/47 | | | | 1,430 | | | | 1,733,561 | |
6.850% | | | 12/16/39 | | | | 122 | | | | 181,856 | |
| | | | | | | | | | | | |
| | | |
| | | | | | | | | | | 5,453,654 | |
| | | | | | | | | | | | |
Lodging — 0.0% | | | | | | | | | |
Marriott International, Inc., | | | | | | | | | |
Sr. Unsec’d. Notes | | | | | | | | | |
3.250% | | | 09/15/22 | | | | 805 | | | | 812,985 | |
| | | | | | | | | | | | |
Media — 0.5% | | | | | | | | | | | | |
CCO Holdings LLC/CCO Holdings Capital Corp., | |
Sr. Unsec’d. Notes, 144A | | | | | |
5.500% | | | 05/01/26 | | | | 500 | | | | 515,772 | |
Charter Communications Operating LLC/Charter Communications Operating Capital, | |
Sr. Sec’d. Notes | | | | | | | | | |
3.900% | | | 06/01/52 | | | | 500 | | | | 500,326 | |
4.800% | | | 03/01/50 | | | | 870 | | | | 975,248 | |
6.384% | | | 10/23/35 | | | | 1,695 | | | | 2,195,596 | |
6.484% | | | 10/23/45 | | | | 1,000 | | | | 1,367,151 | |
SEE NOTES TO FINANCIAL STATEMENTS.
A27
| | | | | | |
| | |
| | PSF PGIM 50/50 BALANCED PORTFOLIO (CONTINUED) | | |
| | | | | | |
| |
| SCHEDULE OF INVESTMENTS | | as of December 31, 2021 |
| | | | | | | | | | | | | | | | |
Interest
Rate | | Maturity
Date | | | | | | Principal
Amount
(000)# | | | Value | |
| | | | | | | | | | | | | | | | |
| |
| CORPORATE BONDS (continued) | | | | | |
Media (cont’d.) | | | | | | | | | | | | | |
Comcast Cable Holdings LLC, | | | | | | | | | | | | | |
Gtd. Notes | |
9.875% | | | 06/15/22 | | | | | | | | 1,440 | | | $ | 1,493,256 | |
Cox Communications, Inc., | | | | | | | | | | | | | |
Sr. Unsec’d. Notes, 144A | | | | | | | | | | | | | |
2.600% | | | 06/15/31 | | | | | | | | 3,695 | | | | 3,695,984 | |
CSC Holdings LLC, | | | | | | | | | | | | | |
Gtd. Notes, 144A | | | | | | | | | | | | | |
4.500% | | | 11/15/31 | | | | | | | | 1,000 | | | | 988,523 | |
Discovery Communications LLC, | |
Gtd. Notes | | | | | | | | | | | | | |
4.000% | | | 09/15/55 | | | | | | | | 823 | | | | 866,626 | |
Time Warner Cable LLC, | | | | | | | | | | | | | |
Sr. Sec’d. Notes | | | | | | | | | | | | | |
5.500% | | | 09/01/41 | | | | | | | | 270 | | | | 327,074 | |
ViacomCBS, Inc., | | | | | | | | | | | | | |
Sr. Unsec’d. Notes | | | | | | | | | | | | | |
5.250% | | | 04/01/44 | | | | | | | | 1,340 | | | | 1,673,328 | |
Walt Disney Co. (The), | | | | | | | | | | | | | |
Gtd. Notes | | | | | | | | | | | | | |
7.625% | | | 11/30/28 | | | | | | | | 515 | | | | 696,684 | |
| | | | | | | | | | | | | | | | |
| | | | |
| | | | | | | | | | | | | | | 15,295,568 | |
| | | | | | | | | | | | | | | | |
Miscellaneous Manufacturing — 0.1% | | | | | |
Amsted Industries, Inc., | | | | | | | | | | | | | |
Gtd. Notes, 144A | | | | | | | | | | | | | |
5.625% | | | 07/01/27 | (a) | | | | | | | 800 | | | | 832,333 | |
Pentair Finance Sarl, | | | | | | | | | | | | | |
Gtd. Notes | | | | | | | | | | | | | |
4.500% | | | 07/01/29 | | | | | | | | 2,415 | | | | 2,730,895 | |
| | | | | | | | | | | | | | | | |
| | | | |
| | | | | | | | | | | | | | | 3,563,228 | |
| | | | | | | | | | | | | | | | |
Multi-National — 0.0% | | | | | | | | | | | | | |
Corp. Andina de Fomento (Supranational Bank), | | | | | |
Sr. Unsec’d. Notes | | | | | |
2.750% | | | 01/06/23 | | | | | | | | 385 | | | | 392,309 | |
North American Development Bank (Supranational Bank), | |
Sr. Unsec’d. Notes | | | | | |
2.400% | | | 10/26/22 | | | | | | | | 226 | | | | 228,177 | |
| | | | | | | | | | | | | | | | |
| | | | |
| | | | | | | | | | | | | | | 620,486 | |
| | | | | | | | | | | | | | | | |
Office/Business Equipment — 0.1% | |
CDW LLC/CDW Finance Corp., | | | | | | | | | | | | | |
Gtd. Notes | | | | | | | | | | | | | |
2.670% | | | 12/01/26 | | | | | | | | 1,270 | | | | 1,303,218 | |
5.500% | | | 12/01/24 | | | | | | | | 500 | | | | 547,337 | |
| | | | | | | | | | | | | | | | |
| | | | |
| | | | | | | | | | | | | | | 1,850,555 | |
| | | | | | | | | | | | | | | | |
Oil & Gas — 0.5% | | | | | | | | | | | | | |
Antero Resources Corp., | | | | | | | | | | | | | |
Gtd. Notes | | | | | | | | | | | | | |
5.000% | | | 03/01/25 | | | | | | | | 950 | | | | 964,938 | |
Cenovus Energy, Inc. (Canada), | | | | | | | | | | | | | |
Sr. Unsec’d. Notes | | | | | | | | | | | | | |
5.400% | | | 06/15/47 | | | | | | | | 850 | | | | 1,057,926 | |
| | | | | | | | | | | | | | | | |
Interest
Rate | | Maturity
Date | | | | | | Principal
Amount
(000)# | | | Value | |
| | | | | | | | | | | | | | | | |
|
| CORPORATE BONDS (continued) | |
Oil & Gas (cont’d.) | | | | | | | | | | | | | |
ConocoPhillips, | | | | | | | | | | | | | | | | |
Gtd. Notes, 144A | | | | | | | | | | | | | | | | |
4.875% | | | 10/01/47 | | | | | | | | 150 | | | $ | 198,044 | |
Continental Resources, Inc., | | | | | | | | | | | | | |
Gtd. Notes | | | | | | | | | | | | | |
4.500% | | | 04/15/23 | | | | | | | | 430 | | | | 443,934 | |
Devon Energy Corp., | | | | | | | | | | | | | |
Sr. Unsec’d. Notes | | | | | | | | | | | | | |
5.600% | | | 07/15/41 | | | | | | | | 225 | | | | 283,251 | |
Gazprom PJSC Via Gaz Capital SA (Russia), | | | | | |
Sr. Unsec’d. Notes, 144A | | | | | |
4.950% | | | 07/19/22 | | | | | | | | 255 | | | | 259,517 | |
6.510% | | | 03/07/22 | | | | | | | | 440 | | | | 444,539 | |
KazMunayGas National Co. JSC (Kazakhstan), | | | | | |
Sr. Unsec’d. Notes, 144A | | | | | |
4.750% | | | 04/24/25 | | | | | | | | 400 | | | | 434,865 | |
Lundin Energy Finance BV (Netherlands), | | | | | | | | | |
Gtd. Notes, 144A | | | | | | | | | |
3.100% | | | 07/15/31 | | | | | | | | 530 | | | | 535,615 | |
Occidental Petroleum Corp., | | | | | | | | | | | | | |
Sr. Unsec’d. Notes | | | | | | | | | | | | | |
6.450% | | | 09/15/36 | | | | | | | | 1,040 | | | | 1,326,041 | |
Ovintiv, Inc., | | | | | | | | | | | | | | | | |
Gtd. Notes | | | | | | | | | | | | | | | | |
6.625% | | | 08/15/37 | | | | | | | | 240 | | | | 313,571 | |
Petrobras Global Finance BV (Brazil), | | | | | | | | | |
Gtd. Notes | | | | | | | | | |
5.600% | | | 01/03/31 | (a) | | | | | | | 840 | | | | 894,091 | |
Petroleos Mexicanos (Mexico), | | | | | | | | | | | | | |
Gtd. Notes | | | | | | | | | | | | | |
4.750% | | | 02/26/29 | | | | EUR | | | | 100 | | | | 112,304 | |
6.350% | | | 02/12/48 | (a) | | | | | | | 458 | | | | 394,096 | |
6.490% | | | 01/23/27 | | | | | | | | 346 | | | | 368,963 | |
6.500% | | | 03/13/27 | | | | | | | | 130 | | | | 138,671 | |
Gtd. Notes, MTN | | | | | | | | | | | | | | | | |
6.750% | | | 09/21/47 | | | | | | | | 561 | | | | 496,370 | |
6.875% | | | 08/04/26 | (a) | | | | | | | 770 | | | | 845,425 | |
Qatar Energy (Qatar), | | | | | | | | | | | | | |
Sr. Unsec’d. Notes, 144A | | | | | | | | | | | | | |
1.375% | | | 09/12/26 | | | | | | | | 1,544 | | | | 1,513,402 | |
2.250% | | | 07/12/31 | | | | | | | | 545 | | | | 539,955 | |
Sinopec Group Overseas Development 2018 Ltd. (China), | | | | | |
Gtd. Notes, 144A | | | | | |
3.680% | | | 08/08/49 | | | | | | | | 990 | | | | 1,060,828 | |
Valero Energy Corp., | | | | | | | | | | | | | |
Sr. Unsec’d. Notes | | | | | | | | | | | | | |
4.000% | | | 04/01/29 | (a) | | | | | | | 580 | | | | 632,482 | |
| | | | | | | | | | | | | | | | |
| | | | |
| | | | | | | | | | | | | | | 13,258,828 | |
| | | | | | | | | | | | | | | | |
Packaging & Containers — 0.1% | | | | | | | | | |
Berry Global, Inc., | | | | | | | | | | | | | |
Sr. Sec’d. Notes | | | | | | | | | | | | | |
1.570% | | | 01/15/26 | (a) | | | | | | | 3,570 | | | | 3,494,143 | |
| | | | | | | | | | | | | | | | |
Pharmaceuticals — 0.6% | | | | | | | | | | | | | |
AbbVie, Inc., | | | | | | | | | | | | | | | | |
Sr. Unsec’d. Notes | | | | | | | | | | | | | | | | |
3.600% | | | 05/14/25 | | | | | | | | 950 | | | | 1,009,590 | |
SEE NOTES TO FINANCIAL STATEMENTS.
A28
| | | | | | |
| | |
| | PSF PGIM 50/50 BALANCED PORTFOLIO (CONTINUED) | | |
| | | | | | |
| |
| SCHEDULE OF INVESTMENTS | | as of December 31, 2021 |
| | | | | | | | | | | | | | | | |
Interest
Rate | | Maturity
Date | | | | | | Principal
Amount
(000)# | | | Value | |
| | | | | | | | | | | | | | | | |
| |
| CORPORATE BONDS (continued) | | | | | |
Pharmaceuticals (cont’d.) | | | | | | | | | | | | | |
4.250% | | | 11/21/49 | | | | | | | | 1,480 | | | $ | 1,776,871 | |
4.500% | | | 05/14/35 | | | | | | | | 1,595 | | | | 1,906,634 | |
4.550% | | | 03/15/35 | | | | | | | | 1,770 | | | | 2,116,161 | |
4.700% | | | 05/14/45 | | | | | | | | 855 | | | | 1,057,239 | |
Bayer US Finance II LLC (Germany), | |
Gtd. Notes, 144A | | | | | | | | | | | | | |
4.250% | | | 12/15/25 | | | | | | | | 1,150 | | | | 1,247,749 | |
Becton, Dickinson & Co., | | | | | | | | | | | | | |
Sr. Unsec’d. Notes | | | | | | | | | | | | | |
3.734% | | | 12/15/24 | | | | | | | | 102 | | | | 108,489 | |
Bristol-Myers Squibb Co., | | | | | | | | | | | | | |
Sr. Unsec’d. Notes | |
4.125% | | | 06/15/39 | | | | | | | | 280 | | | | 331,188 | |
5.000% | | | 08/15/45 | | | | | | | | 566 | | | | 753,738 | |
Cigna Corp., | | | | | | | | | | | | | | | | |
Gtd. Notes | | | | | | | | | | | | | | | | |
4.375% | | | 10/15/28 | | | | | | | | 1,870 | | | | 2,125,825 | |
Sr. Unsec’d. Notes | |
3.200% | | | 03/15/40 | | | | | | | | 1,555 | | | | 1,606,053 | |
CVS Health Corp., | | | | | | | | | | | | | |
Sr. Unsec’d. Notes | | | | | | | | | | | | | |
5.125% | | | 07/20/45 | | | | | | | | 991 | | | | 1,288,545 | |
5.300% | | | 12/05/43 | | | | | | | | 185 | | | | 243,849 | |
Mylan, Inc., | | | | | | | | | | | | | | | | |
Gtd. Notes | | | | | | | | | | | | | | | | |
5.400% | | | 11/29/43 | | | | | | | | 590 | | | | 730,509 | |
Organon & Co./Organon Foreign Debt Co-Issuer BV, | | | | | |
Sr. Sec’d. Notes, 144A | | | | | |
4.125% | | | 04/30/28 | | | | | | | | 925 | | | | 948,432 | |
Viatris, Inc., | | | | | | | | | | | | | | | | |
Gtd. Notes | | | | | | | | | | | | | | | | |
3.850% | | | 06/22/40 | | | | | | | | 520 | | | | 554,662 | |
| | | | | | | | | | | | | | | | |
| | | | |
| | | | | | | | | | | | | | | 17,805,534 | |
| | | | | | | | | | | | | | | | |
Pipelines — 0.6% | | | | | | | | | | | | | |
Antero Midstream Partners LP/Antero Midstream Finance Corp., | |
Gtd. Notes, 144A | |
7.875% | | | 05/15/26 | | | | | | | | 525 | | | | 578,430 | |
Eastern Gas Transmission & Storage, Inc., | | | | | |
Sr. Unsec’d. Notes, 144A | | | | | |
4.600% | | | 12/15/44 | | | | | | | | 45 | | | | 53,466 | |
Energy Transfer LP, | | | | | | | | | | | | | |
Sr. Unsec’d. Notes | | | | | | | | | | | | | |
4.950% | | | 06/15/28 | | | | | | | | 795 | | | | 896,473 | |
5.000% | | | 05/15/50 | | | | | | | | 990 | | | | 1,139,926 | |
6.125% | | | 12/15/45 | | | | | | | | 120 | | | | 149,804 | |
Energy Transfer LP/Regency Energy Finance Corp., | | | | | |
Sr. Unsec’d. Notes | | | | | |
5.000% | | | 10/01/22 | | | | | | | | 610 | | | | 621,693 | |
Enterprise Products Operating LLC, | |
Gtd. Notes | | | | | | | | | | | | | |
3.750% | | | 02/15/25 | (a) | | | | | | | 1,055 | | | | 1,123,349 | |
Kinder Morgan, Inc., | | | | | | | | | | | | | |
Gtd. Notes | | | | | | | | | | | | | |
3.600% | | | 02/15/51 | | | | | | | | 1,575 | | | | 1,592,691 | |
| | | | | | | | | | | | | | | | |
Interest
Rate | | Maturity
Date | | | | | | Principal
Amount
(000)# | | | Value | |
| | | | | | | | | | | | | | | | |
| |
| CORPORATE BONDS (continued) | | | | | |
Pipelines (cont’d.) | | | | | | | | | | | | | |
MPLX LP, | | | | | | | | | | | | | | | | |
Sr. Unsec’d. Notes | |
4.000% | | | 02/15/25 | | | | | | | | 1,140 | | | $ | 1,215,366 | |
4.700% | | | 04/15/48 | | | | | | | | 750 | | | | 873,395 | |
4.875% | | | 06/01/25 | | | | | | | | 2,275 | | | | 2,489,545 | |
5.200% | | | 03/01/47 | | | | | | | | 25 | | | | 30,595 | |
ONEOK Partners LP, | | | | | | | | | | | | | |
Gtd. Notes | | | | | | | | | | | | | |
6.650% | | | 10/01/36 | | | | | | | | 130 | | | | 170,858 | |
ONEOK, Inc., | | | | | | | | | | | | | | | | |
Gtd. Notes | | | | | | | | | | | | | | | | |
3.100% | | | 03/15/30 | (a) | | | | | | | 3,495 | | | | 3,568,185 | |
4.500% | | | 03/15/50 | | | | | | | | 245 | | | | 271,897 | |
4.950% | | | 07/13/47 | | | | | | | | 640 | | | | 745,734 | |
Venture Global Calcasieu Pass LLC, | |
Sr. Sec’d. Notes, 144A | | | | | | | | | | | | | |
3.875% | | | 08/15/29 | | | | | | | | 80 | | | | 83,273 | |
4.125% | | | 08/15/31 | | | | | | | | 80 | | | | 85,361 | |
Western Midstream Operating LP, | |
Sr. Unsec’d. Notes | | | | | | | | | | | | | |
4.000% | | | 07/01/22 | | | | | | | | 1,315 | | | | 1,320,876 | |
5.300% | | | 03/01/48 | | | | | | | | 80 | | | | 96,396 | |
Williams Cos., Inc. (The), | | | | | | | | | | | | | |
Sr. Unsec’d. Notes | | | | | | | | | | | | | |
4.850% | | | 03/01/48 | | | | | | | | 230 | | | | 279,992 | |
4.900% | | | 01/15/45 | | | | | | | | 1,100 | | | | 1,316,854 | |
| | | | | | | | | | | | | | | | |
| | | | |
| | | | | | | | | | | | | | | 18,704,159 | |
| | | | | | | | | | | | | | | | |
Real Estate Investment Trusts (REITs) — 0.3% | | | | | |
Corporate Office Properties LP, | | | | | | | | | | | | | |
Gtd. Notes | | | | | | | | | | | | | |
2.900% | | | 12/01/33 | | | | | | | | 945 | | | | 930,221 | |
GLP Capital LP/GLP Financing II, Inc., | |
Gtd. Notes | | | | | | | | | | | | | |
5.375% | | | 04/15/26 | | | | | | | | 725 | | | | 809,783 | |
Kimco Realty Corp., | | | | | | | | | | | | | |
Sr. Unsec’d. Notes | | | | | | | | | | | | | |
2.700% | | | 10/01/30 | | | | | | | | 2,420 | | | | 2,463,059 | |
MPT Operating Partnership LP/MPT Finance Corp., | | | | | |
Gtd. Notes | | | | | |
3.500% | | | 03/15/31 | (a) | | | | | | | 750 | | | | 759,397 | |
Realty Income Corp., | | | | | | | | | | | | | |
Sr. Unsec’d. Notes | | | | | | | | | | | | | |
3.250% | | | 01/15/31 | | | | | | | | 2,250 | | | | 2,417,505 | |
| | | | | | | | | | | | | | | | |
| | | | |
| | | | | | | | | | | | | | | 7,379,965 | |
| | | | | | | | | | | | | | | | |
Retail — 0.3% | | | | | | | | | | | | | | | | |
1011778 BC ULC/New Red Finance, Inc. (Canada), | | | | | |
Sr. Sec’d. Notes, 144A | | | | | |
3.875% | | | 01/15/28 | | | | | | | | 650 | | | | 658,120 | |
AutoZone, Inc., | | | | | | | | | | | | | | | | |
Sr. Unsec’d. Notes | |
3.750% | | | 04/18/29 | | | | | | | | 1,820 | | | | 1,991,735 | |
Dollar Tree, Inc., | | | | | | | | | | | | | | | | |
Sr. Unsec’d. Notes | |
4.000% | | | 05/15/25 | | | | | | | | 3,395 | | | | 3,648,789 | |
SEE NOTES TO FINANCIAL STATEMENTS.
A29
| | | | | | |
| | |
| | PSF PGIM 50/50 BALANCED PORTFOLIO (CONTINUED) | | |
| | | | | | |
| |
| SCHEDULE OF INVESTMENTS | | as of December 31, 2021 |
| | | | | | | | | | | | | | | | |
Interest
Rate | | Maturity
Date | | | Principal
Amount
(000)# | | | Value | |
| |
| CORPORATE BONDS (continued) | | | | | |
Retail (cont’d.) | | | | | | | | | |
Gap, Inc. (The), | | | | | | | | | | | | | |
Gtd. Notes, 144A | |
3.625% | | | 10/01/29 | | | | | | | | 200 | | | $ | 197,808 | |
3.875% | | | 10/01/31 | | | | | | | | 200 | | | | 197,639 | |
Sally Holdings LLC/Sally Capital, Inc., | | | | | |
Gtd. Notes | | | | | | | | | | | | | | | | |
5.625% | | | 12/01/25 | | | | | | | | 1,020 | | | | 1,041,989 | |
| | | | | | | | | | | | | | | | |
| | | | |
| | | | | | | | | | | | | | | 7,736,080 | |
| | | | | | | | | | | | | | | | |
Semiconductors — 0.1% | | | | | | | | | | | | | |
Broadcom, Inc.,
| | | | | | | | | | | | | |
Sr. Unsec’d. Notes, 144A | | | | | | | | | |
3.187% | | | 11/15/36 | | | | | | | | 3,650 | | | | 3,661,816 | |
| | | | | | | | | | | | | | | | |
Software — 0.1% | | | | | | | | | | | | | |
Fidelity National Information Services, Inc., | | | | | |
Sr. Unsec’d. Notes | | | | | | | | | | | | | |
2.250% | | | 03/01/31 | (a) | | | | | | | 2,175 | | | | 2,127,740 | |
Microsoft Corp., | |
Sr. Unsec’d. Notes | |
2.675% | | | 06/01/60 | | | | | | | | 360 | | | | 358,462 | |
ServiceNow, Inc., | | | | | | | | | | | | | |
Sr. Unsec’d. Notes | | | | | | | | | | | | | |
1.400% | | | 09/01/30 | | | | | | | | 1,425 | | | | 1,328,713 | |
| | | | | | | | | | | | | | | | |
| | | | |
| | | | | | | | | | | | | | | 3,814,915 | |
| | | | | | | | | | | | | | | | |
Telecommunications — 0.7% | | | | | |
AT&T, Inc., | | | | | | | | | | | | | | | | |
Sr. Unsec’d. Notes | | | | | |
2.550% | | | 12/01/33 | | | | | | | | 1,371 | | | | 1,342,642 | |
3.100% | | | 02/01/43 | | | | | | | | 1,070 | | | | 1,036,261 | |
3.500% | | | 09/15/53 | | | | | | | | 2,817 | | | | 2,847,289 | |
3.650% | | | 09/15/59 | | | | | | | | 4 | | | | 4,038 | |
4.300% | | | 02/15/30 | | | | | | | | 490 | | | | 552,054 | |
4.500% | | | 05/15/35 | | | | | | | | 225 | | | | 259,674 | |
British Telecommunications PLC (United Kingdom), | |
Sr. Unsec’d. Notes | | | | | |
9.625% | | | 12/15/30 | | | | | | | | 350 | | | | 514,667 | |
Level 3 Financing, Inc., | | | | | | | | | | | | | |
Gtd. Notes | | | | | | | | | | | | | | | | |
5.375% | | | 05/01/25 | | | | | | | | 1,300 | | | | 1,326,150 | |
Sr. Sec’d. Notes, 144A | | | | | | | | | |
3.400% | | | 03/01/27 | | | | | | | | 250 | | | | 258,127 | |
T-Mobile USA, Inc., | | | | | | | | | | | | | |
Sr. Sec’d. Notes | | | | | | | | | |
3.875% | | | 04/15/30 | | | | | | | | 5,500 | | | | 6,018,461 | |
Sr. Sec’d. Notes, 144A | | | | | | | | | |
2.700% | | | 03/15/32 | | | | | | | | 875 | | | | 881,156 | |
Verizon Communications, Inc., | | | | | |
Sr. Unsec’d. Notes | | | | | | | | | |
2.550% | | | 03/21/31 | | | | | | | | 1,515 | | | | 1,530,402 | |
2.650% | | | 11/20/40 | | | | | | | | 1,095 | | | | 1,039,315 | |
4.016% | | | 12/03/29 | | | | | | | | 1,365 | | | | 1,530,009 | |
4.500% | | | 08/10/33 | | | | | | | | 865 | | | | 1,019,116 | |
| | | | | | | | | | | | | | | | |
| | | | |
| | | | | | | | | | | | | | | 20,159,361 | |
| | | | | | | | | | | | | | | | |
| | | | | | | | | | | | | | | | |
Interest
Rate | | Maturity
Date | | | Principal
Amount
(000)# | | | Value | |
| |
| CORPORATE BONDS (continued) | | | | | |
Transportation — 0.1% | | | | | | | | | | | | | |
Burlington Northern Santa Fe LLC, | |
Sr. Unsec’d. Notes | | | | | |
6.700% | | | 08/01/28 | | | | | | | | 735 | | | $ | 933,891 | |
CSX Corp., | | | | | | | | | |
Sr. Unsec’d. Notes | | | | | | | | | |
6.150% | | | 05/01/37 | | | | | | | | 690 | | | | 963,815 | |
Norfolk Southern Corp., | | | | | |
Sr. Unsec’d. Notes | | | | | |
5.590% | | | 05/17/25 | | | | | | | | 120 | | | | 134,989 | |
| | | | | | | | | | | | | | | | |
| | | | |
| | | | | | | | | | | | | | | 2,032,695 | |
| | | | | | | | | | | | | | | | |
| |
TOTAL CORPORATE BONDS
(cost $283,611,160) | | | | 300,265,222 | |
| | | | | | | | | | | | | | | | |
|
| MUNICIPAL BONDS — 0.5% | |
Alabama — 0.0% | | | | | | | | | | | | | |
Alabama Economic Settlement Authority, | | | | | |
Taxable, Revenue Bonds, Series B | | | | | |
4.263% | | | 09/15/32 | | | | | | | | 180 | | | | 199,649 | |
| | | | | | | | | | | | | | | | |
California — 0.2% | | | | | | | | | | | | | |
Bay Area Toll Authority, | | | | | |
Revenue Bonds, BABs, Series F2 | | | | | |
6.263% | | | 04/01/49 | | | | | | | | 1,305 | | | | 2,112,447 | |
Taxable, Revenue Bonds | | | | | |
2.574% | | | 04/01/31 | | | | | | | | 415 | | | | 431,821 | |
State of California, | | | | | | | | | | | | | |
General Obligation Unlimited, BABs | | | | | |
7.300% | | | 10/01/39 | | | | | | | | 1,250 | | | | 1,971,467 | |
General Obligation Unlimited, Taxable, BABs | | | | | |
7.500% | | | 04/01/34 | | | | | | | | 350 | | | | 539,723 | |
7.625% | | | 03/01/40 | | | | | | | | 205 | | | | 339,981 | |
| | | | | | | | | | | | | | | | |
| | | | |
| | | | | | | | | | | | | | | 5,395,439 | |
| | | | | | | | | | | | | | | | |
Colorado — 0.0% | | | | | | | | | | | | | |
Regional Transportation District Sales Tax Revenue, | | | | | |
Revenue Bonds, BABs, Series B | | | | | |
5.844% | | | 11/01/50 | | | | | | | | 565 | | | | 893,477 | |
| | | | | | | | | | | | | | | | |
Illinois — 0.1% | | | | | |
Chicago O’Hare International Airport, | | | | | |
Revenue Bonds, BABs, Series B | | | | | |
6.395% | | | 01/01/40 | | | | | | | | 970 | | | | 1,450,612 | |
State of Illinois, | | | | | | | | | |
General Obligation Unlimited, Series D | | | | | |
5.000% | | | 11/01/22 | | | | | | | | 2,305 | | | | 2,392,657 | |
| | | | | | | | | | | | | | | | |
| | | | |
| | | | | | | | | | | | | | | 3,843,269 | |
| | | | | | | | | | | | | | | | |
New Jersey — 0.1% | | | | | | | | | | | | | |
New Jersey Turnpike Authority, | | | | | |
Taxable, Revenue Bonds, BABs, Series F | | | | | |
7.414% | | | 01/01/40 | | | | | | | | 1,000 | | | | 1,627,261 | |
| | | | | | | | | | | | | | | | |
New York — 0.1% | | | | | | | | | | | | | |
New York City Transitional Finance Authority Future Tax Secured Revenue, | |
Taxable, Revenue Bonds, BABs | | | | | |
5.767% | | | 08/01/36 | | | | | | | | 1,100 | | | | 1,371,711 | |
| | | | | | | | | | | | | | | | |
SEE NOTES TO FINANCIAL STATEMENTS.
A30
| | | | | | |
| | |
| | PSF PGIM 50/50 BALANCED PORTFOLIO (CONTINUED) | | |
| | | | | | |
| |
| SCHEDULE OF INVESTMENTS | | as of December 31, 2021 |
| | | | | | | | | | | | | | | | |
Interest
Rate | | Maturity
Date | | | | | | Principal
Amount
(000)# | | | Value | |
| | | | | | | | | | | | | | | | |
| |
| MUNICIPAL BONDS (continued) | | | | | |
Ohio — 0.0% | | | | | | | | | |
Ohio State University (The), | | | | | | | | | |
Taxable, Revenue Bonds, BABs, Series C | | | | | |
4.910% | | | 06/01/40 | | | | | | | | 415 | | | $ | 552,096 | |
Ohio Water Development Authority Water Pollution Control Loan Fund, | |
Taxable, Revenue Bonds, BABs, Series B2 | | | | | |
4.879% | | | 12/01/34 | | | | | | | | 275 | | | | 320,627 | |
| | | | | | | | | | | | | | | | |
| | | | |
| | | | | | | | | | | | | | | 872,723 | |
| | | | | | | | | | | | | | | | |
Oregon — 0.0% | | | | | |
State of Oregon Department of Transportation, | | | | | |
Taxable, Revenue Bonds, BABs, Series A | | | | | |
5.834% | | | 11/15/34 | | | | | | | | 425 | | | | 570,739 | |
| | | | | | | | | | | | | | | | |
Pennsylvania — 0.0% | | | | | | | | | | | | | |
Pennsylvania Turnpike Commission, | | | | | |
Revenue Bonds, BABs, Series B | | | | | |
5.511% | | | 12/01/45 | | | | | | | | 505 | | | | 720,974 | |
| | | | | | | | | | | | | | | | |
Virginia — 0.0% | | | | | | | | | | | | | |
University of Virginia, | | | | | |
Taxable, Revenue Bonds, Series C | | | | | |
4.179% | | | 09/01/2117 | | | | | | | | 355 | | | | 487,384 | |
| | | | | | | | | | | | | | | | |
TOTAL MUNICIPAL BONDS
(cost $11,774,023) | | | | 15,982,626 | |
| | | | | | | | | | | | | | | | |
|
| RESIDENTIAL MORTGAGE-BACKED SECURITIES — 2.4% | |
Alternative Loan Trust, | | | | | | | | | |
Series 2004-18CB, Class 3A1 | | | | | |
5.250% | | | 09/25/35 | | | | | | | | 10 | | | | 10,437 | |
Banc of America Mortgage Trust, | | | | | |
Series 2005-A, Class 2A1 | | | | | |
2.509%(cc) | | | 02/25/35 | | | | | | | | 54 | | | | 56,072 | |
Bellemeade Re Ltd. (Bermuda), | | | | | |
Series 2018-01A, Class M1B, 144A, 1 Month LIBOR + 1.600% (Cap N/A, Floor 0.000%) | |
1.702%(c) | | | 04/25/28 | | | | | | | | 24 | | | | 23,970 | |
Series 2020-04A, Class M2A, 144A, 1 Month LIBOR + 2.600% (Cap N/A, Floor 2.600%) | |
2.702%(c) | | | 06/25/30 | | | | | | | | 15 | | | | 14,962 | |
Series 2021-02A, Class M1A, 144A, 30 Day Average SOFR + 1.200% (Cap N/A, Floor 1.200%) | |
1.250%(c) | | | 06/25/31 | | | | | | | | 2,014 | | | | 2,009,052 | |
Series 2021-03A, Class A2, 144A, 30 Day Average SOFR + 1.000% (Cap N/A, Floor 1.000%) | |
1.050%(c) | | | 09/25/31 | | | | | | | | 1,500 | | | | 1,485,213 | |
Series 2021-03A, Class M1A, 144A, 30 Day Average SOFR + 1.000% (Cap N/A, Floor 1.000%) | |
1.050%(c) | | | 09/25/31 | | | | | | | | 1,100 | | | | 1,094,310 | |
Central Park Funding Trust, | | | | | |
Series 2021-01, Class PT, 144A, 1 Month LIBOR + 2.750% (Cap N/A, Floor 2.750%) | |
2.852%(c) | | | 08/29/22 | | | | | | | | 2,311 | | | | 2,304,161 | |
Chase Mortgage Finance Trust, | | | | | |
Series 2007-A01, Class 1A5 | | | | | | | | | |
2.326%(cc) | | | 02/25/37 | | | | | | | | 100 | | | | 101,216 | |
Credit Suisse Mortgage Trust, | | | | | |
Series 2018-RPL09, Class A, 144A | | | | | |
3.850%(cc) | | | 09/25/57 | | | | | | | | 631 | | | | 655,713 | |
| | | | | | | | | | | | | | | | |
Interest
Rate | | Maturity
Date | | | | | | Principal
Amount
(000)# | | | Value | |
| | | | | | | | | | | | | | | | |
|
| RESIDENTIAL MORTGAGE-BACKED SECURITIES (continued) | |
Eagle Re Ltd. (Bermuda), | | | | | | | | | |
Series 2021-02, Class M1A, 144A, 30 Day Average SOFR + 1.550% (Cap N/A, Floor 1.550%) | |
1.600%(c) | | | 04/25/34 | | | | | | | | 3,840 | | | $ | 3,839,828 | |
Fannie Mae REMICS, | | | | | | | | | | | | | |
Series 2014-73, Class CZ | | | | | |
3.000% | | | 11/25/44 | | | | | | | | 2,506 | | | | 2,660,868 | |
FHLMC Structured Agency Credit Risk Debt Notes, | | | | | |
Series 2020-HQA05, Class M2, 144A, 30 Day Average SOFR + 2.600% (Cap N/A, Floor 0.000%) | |
2.650%(c) | | | 11/25/50 | | | | | | | | 1,901 | | | | 1,920,465 | |
FHLMC Structured Agency Credit Risk REMIC Trust, | | | | | |
Series 2020-HQA03, Class M2, 144A, 1 Month LIBOR + 3.600% (Cap N/A, Floor 0.000%) | |
3.703%(c) | | | 07/25/50 | | | | | | | | 259 | | | | 259,737 | |
Series 2020-HQA04, Class B1, 144A, 1 Month LIBOR + 5.250% (Cap N/A, Floor 0.000%) | |
5.353%(c) | | | 09/25/50 | | | | | | | | 155 | | | | 161,436 | |
Series 2021-DNA03, Class M2, 144A, 30 Day Average SOFR + 2.100% (Cap N/A, Floor 0.000%) | |
2.150%(c) | | | 10/25/33 | | | | | | | | 2,005 | | | | 2,040,800 | |
Series 2021-DNA05, Class M1, 144A, 30 Day Average SOFR + 0.650% (Cap N/A, Floor 0.000%) | |
0.700%(c) | | | 01/25/34 | | | | | | | | 443 | | | | 443,066 | |
Series 2021-DNA05, Class M2, 144A, 30 Day Average SOFR + 1.650% (Cap N/A, Floor 0.000%) | |
1.700%(c) | | | 01/25/34 | | | | | | | | 210 | | | | 210,899 | |
Series 2021-HQA03, Class M1, 144A, 30 Day Average SOFR + 0.850% (Cap N/A, Floor 0.000%) | |
0.900%(c) | | | 09/25/41 | | | | | | | | 4,870 | | | | 4,867,755 | |
FHLMC Structured Agency Credit Risk Trust, | | | | | |
Series 2018-DNA03, Class M1, 144A, 1 Month LIBOR + 0.750% (Cap N/A, Floor 0.000%) | |
0.853%(c) | | | 09/25/48 | | | | | | | | 2 | | | | 2,361 | |
Freddie Mac REMICS, | | | | | | | | | | | | | |
Series 4117, Class ZC | | | | | |
3.000% | | | 10/15/42 | | | | | | | | 2,202 | | | | 2,325,253 | |
Series 4535, Class PA | | | | | |
3.000% | | | 03/15/44 | | | | | | | | 498 | | | | 511,380 | |
Series 4680, Class GZ | | | | | |
3.500% | | | 03/15/47 | | | | | | | | 1,174 | | | | 1,270,757 | |
Government National Mortgage Assoc., | | | | | |
Series 2019-69, Class KB | | | | | |
3.000% | | | 06/20/49 | | | | | | | | 2,400 | | | | 2,570,687 | |
Home Re Ltd. (Bermuda), | | | | | |
Series 2019-01, Class M1, 144A, 1 Month LIBOR + 1.650% (Cap N/A, Floor 0.000%) | |
1.752%(c) | | | 05/25/29 | | | | | | | | 116 | | | | 115,866 | |
Series 2021-02, Class M1A, 144A, 30 Day Average SOFR + 1.250% (Cap N/A, Floor 0.000%) | |
1.300%(c) | | | 01/25/34 | | | | | | | | 950 | | | | 950,447 | |
JPMorgan Mortgage Trust, | | | | | |
Series 2007-A01, Class 4A1 | | | | | |
2.314%(cc) | | | 07/25/35 | | | | | | | | 36 | | | | 36,134 | |
Legacy Mortgage Asset Trust, | | | | | |
Series 2021-GS01, Class A1, 144A | | | | | |
1.892% | | | 10/25/66 | | | | | | | | 270 | | | | 269,801 | |
SEE NOTES TO FINANCIAL STATEMENTS.
A31
| | | | | | |
| | |
| | PSF PGIM 50/50 BALANCED PORTFOLIO (CONTINUED) | | |
| | | | | | |
| |
| SCHEDULE OF INVESTMENTS | | as of December 31, 2021 |
| | | | | | | | | | | | | | | | |
Interest
Rate | | Maturity
Date | | | | | | Principal
Amount
(000)# | | | Value | |
| | | | | | | | | | | | | | | | |
|
| RESIDENTIAL MORTGAGE-BACKED SECURITIES (continued) | |
Mello Warehouse Securitization Trust, | | | | | |
Series 2020-01, Class A, 144A, 1 Month LIBOR + 0.900% (Cap N/A, Floor 0.900%) | |
1.002%(c) | | | 10/25/53 | | | | | | | | 1,260 | | | $ | 1,259,390 | |
Series 2021-01, Class A, 144A, 1 Month LIBOR + 0.700% (Cap N/A, Floor 0.700%) | |
0.789%(c) | | | 02/25/55 | | | | | | | | 1,600 | | | | 1,590,385 | |
MFA Trust, | | | | | | | | | |
Series 2021-RPL01, Class A1, 144A | | | | | |
1.131%(cc) | | | 07/25/60 | | | | | | | | 2,351 | | | | 2,311,608 | |
Mortgage Repurchase Agreement Financing Trust, | | | | | |
Series 2020-05, Class A1, 144A, 1 Month LIBOR + 1.000% (Cap N/A, Floor 0.000%) | |
1.101%(c) | | | 08/10/23 | | | | | | | | 1,090 | | | | 1,090,135 | |
Series 2021-01, Class A2, 144A, 1 Month LIBOR + 0.500% (Cap N/A, Floor 0.000%) | |
0.601%(c) | | | 03/10/22 | | | | | | | | 2,600 | | | | 2,600,212 | |
Series 2021-S01, Class A1, 144A, 1 Month LIBOR + 0.500% (Cap N/A, Floor 0.500%) | |
0.601%(c) | | | 09/10/22 | | | | | | | | 1,800 | | | | 1,799,631 | |
MRA Issuance Trust, | | | | | |
Series 2020-07, Class A2X, 144A, 1 Month LIBOR + 1.300% | |
1.399%(c) | | | 09/15/22^ | | | | | | | | 7,800 | | | | 7,800,000 | |
MSG III Securitization Trust, | | | | | |
Series 2021-01, Class A, 144A, 1 Month LIBOR + 0.750% (Cap N/A, Floor 0.750%) | |
0.842%(c) | | | 06/25/54 | | | | | | | | 1,500 | | | | 1,498,911 | |
Series 2021-01, Class B, 144A, 1 Month LIBOR + 0.900% (Cap N/A, Floor 0.900%) | |
0.992%(c) | | | 06/25/54 | | | | | | | | 270 | | | | 269,852 | |
Series 2021-01, Class C, 144A, 1 Month LIBOR + 1.100% (Cap N/A, Floor 1.100%) | |
1.192%(c) | | | 06/25/54 | | | | | | | | 230 | | | | 229,875 | |
Series 2021-01, Class D, 144A, 1 Month LIBOR + 1.300% (Cap N/A, Floor 1.300%) | |
1.392%(c) | | | 06/25/54 | | | | | | | | 90 | | | | 89,951 | |
New Residential Mortgage Loan Trust, | | | | | |
Series 2018-04A, Class A1S, 144A, 1 Month LIBOR + 0.750% (Cap N/A, Floor 0.750%) | |
0.853%(c) | | | 01/25/48 | | | | | | | | 232 | | | | 231,847 | |
Oaktown Re II Ltd. (Bermuda), | | | | | |
Series 2018-01A, Class M1, 144A, 1 Month LIBOR + 1.550% (Cap N/A, Floor 0.000%) | |
1.652%(c) | | | 07/25/28 | | | | | | | | 103 | | | | 103,277 | |
Oaktown Re III Ltd. (Bermuda), | | | | | |
Series 2019-01A, Class M1A, 144A, 1 Month LIBOR + 1.400% (Cap N/A, Floor 1.400%) | |
1.502%(c) | | | 07/25/29 | | | | | | | | 29 | | | | 28,743 | |
Oaktown Re VII Ltd. (Bermuda), | | | | | |
Series 2021-02, Class M1A, 144A, 30 Day Average SOFR + 1.600% (Cap N/A, Floor 1.600%) | |
1.650%(c) | | | 04/25/34 | | | | | | | | 2,700 | | | | 2,695,093 | |
PMT Credit Risk Transfer Trust, | | | | | |
Series 2020-02R, Class A, 144A, 1 Month LIBOR + 3.815% (Cap N/A, Floor 3.815%) | |
3.917%(c) | | | 12/25/22 | | | | | | | | 1,473 | | | | 1,476,226 | |
| | | | | | | | | | | | | | | | | | | | |
Interest
Rate | | Maturity
Date | | | | | | Principal
Amount
(000)# | | | Value | |
| | | | | | | | | | | | | | | | |
|
| RESIDENTIAL MORTGAGE-BACKED SECURITIES (continued) | |
Series 2021-01R, Class A, 144A, 1 Month LIBOR + 2.900% (Cap N/A, Floor 2.900%) | |
3.002%(c) | | | 02/27/24 | | | | | | | | | | | | 2,357 | | | $ | 2,387,806 | |
Provident Funding Mortgage Warehouse Securitization Trust, | |
Series 2021-01, Class A, 144A, 1 Month LIBOR + 0.700% (Cap N/A, Floor 0.700%) | |
0.802%(c) | | | 02/25/55 | | | | | | | | | | | | 2,340 | | | | 2,327,530 | |
Seasoned Credit Risk Transfer Trust, | |
Series 2019-02, Class MA | | | | | |
3.500% | | | 08/25/58 | | | | | | | | | | | | 969 | | | | 1,011,187 | |
Station Place Securitization Trust, | |
Series 2021-04, Class A, 144A, 1 Month LIBOR + 0.900% (Cap N/A, Floor 0.900%) | |
1.002%(c) | | | 04/11/22 | | | | | | | | | | | | 2,600 | | | | 2,597,290 | |
Series 2021-08, Class A, 144A, 1 Month LIBOR + 0.800% (Cap N/A, Floor 0.800%) | |
0.902%(c) | | | 06/20/22 | | | | | | | | | | | | 2,040 | | | | 2,041,761 | |
Series 2021-WL01, Class A, 144A, 1 Month LIBOR + 0.650% (Cap N/A, Floor 0.650%) | |
0.752%(c) | | | 01/26/54 | | | | | | | | | | | | 657 | | | | 656,592 | |
Structured Adjustable Rate Mortgage Loan Trust, | |
Series 2004-01, Class 4A3 | | | | | |
2.431%(cc) | | | 02/25/34 | | | | | | | | | | | | 75 | | | | 75,336 | |
| | | | | | | | | | | | | | | | | | | | |
| |
TOTAL RESIDENTIAL MORTGAGE-BACKED SECURITIES
(cost $68,411,353) | | | | 68,385,284 | |
| | | | | | | | | | | | | | | | | | | | |
| |
| SOVEREIGN BONDS — 0.7% | | | | | |
Abu Dhabi Government International Bond (United Arab Emirates), | |
Sr. Unsec’d. Notes, 144A | | | | | | | | | |
3.125% | | | 10/11/27 | (a) | | | | | | | | | | | 2,420 | | | | 2,599,707 | |
Bermuda Government International Bond (Bermuda), | | | | | |
Sr. Unsec’d. Notes, 144A | |
2.375% | | | 08/20/30 | | | | | | | | | | | | 465 | | | | 463,837 | |
Colombia Government International Bond (Colombia), | |
Sr. Unsec’d. Notes | | | | | | | | | |
4.500% | | | 01/28/26 | | | | | | | | | | | | 220 | | | | 230,400 | |
Export-Import Bank of India (India), | | | | | |
Sr. Unsec’d. Notes, 144A | | | | | | | | | |
3.875% | | | 02/01/28 | | | | | | | | | | | | 745 | | | | 796,638 | |
Finnvera OYJ (Finland), | | | | | |
Gov’t. Gtd. Notes, 144A, MTN | | | | | |
2.375% | | | 06/04/25 | | | | | | | | | | | | 400 | | | | 415,953 | |
Indonesia Government International Bond (Indonesia), | |
Sr. Unsec’d. Notes | | | | | |
3.375% | | | 07/30/25 | | | | | | | | EUR | | | | 1,200 | | | | 1,502,179 | |
Sr. Unsec’d. Notes, 144A, MTN | | | | | |
5.875% | | | 01/15/24 | | | | | | | | | | | | 750 | | | | 821,407 | |
Sr. Unsec’d. Notes, EMTN | | | | | |
2.150% | | | 07/18/24 | | | | | | | | EUR | | | | 1,510 | | | | 1,798,604 | |
Japan Bank for International Cooperation (Japan), | | | | | |
Gov’t. Gtd. Notes | | | | | |
3.375% | | | 10/31/23 | | | | | | | | | | | | 200 | | | | 209,216 | |
Japan Finance Organization for Municipalities (Japan), | | | | | |
Sr. Unsec’d. Notes, 144A, MTN | | | | | |
2.125% | | | 10/25/23 | | | | | | | | | | | | 1,000 | | | | 1,021,133 | |
2.625% | | | 04/20/22 | | | | | | | | | | | | 1,400 | | | | 1,409,255 | |
SEE NOTES TO FINANCIAL STATEMENTS.
A32
| | | | | | |
| | |
| | PSF PGIM 50/50 BALANCED PORTFOLIO (CONTINUED) | | |
| | | | | | |
| |
| SCHEDULE OF INVESTMENTS | | as of December 31, 2021 |
| | | | | | | | | | | | | | | | |
Interest Rate | | Maturity
Date | | | | | | Principal
Amount
(000)# | | | Value | |
| | | | | | | | | | | | | | | | |
|
| SOVEREIGN BONDS (continued) | |
3.000% | | | 03/12/24 | | | | | | | | 200 | | | $ | 208,493 | |
Panama Government International Bond (Panama), | |
Sr. Unsec’d. Notes | |
4.500% | | | 04/16/50 | (a) | | | | | | | 340 | | | | 374,772 | |
Peruvian Government International Bond (Peru), | |
Sr. Unsec’d. Notes | |
2.783% | | | 01/23/31 | | | | | | | | 514 | | | | 511,770 | |
Qatar Government International Bond (Qatar), | |
Sr. Unsec’d. Notes, 144A | |
3.875% | | | 04/23/23 | | | | | | | | 800 | | | | 831,983 | |
5.103% | | | 04/23/48 | | | | | | | | 665 | | | | 898,973 | |
Romanian Government International Bond (Romania), | |
Sr. Unsec’d. Notes, EMTN | |
4.125% | | | 03/11/39 | | | | EUR | | | | 960 | | | | 1,169,376 | |
Saudi Government International Bond (Saudi Arabia), | |
Sr. Unsec’d. Notes, 144A, MTN | |
2.875% | | | 03/04/23 | | | | | | | | 1,285 | | | | 1,315,104 | |
4.000% | | | 04/17/25 | | | | | | | | 750 | | | | 807,983 | |
Tokyo Metropolitan Government (Japan), | |
Sr. Unsec’d. Notes, 144A | |
2.500% | | | 06/08/22 | | | | | | | | 1,200 | | | | 1,210,276 | |
3.250% | | | 06/01/23 | | | | | | | | 600 | | | | 620,103 | |
Uruguay Government International Bond (Uruguay), | |
Sr. Unsec’d. Notes | |
4.975% | | | 04/20/55 | (a) | | | | | | | 405 | | | | 531,564 | |
5.100% | | | 06/18/50 | (a) | | | | | | | 395 | | | | 523,652 | |
| | | | | | | | | | | | | | | | |
TOTAL SOVEREIGN BONDS
(cost $19,154,191) | | | | | | | | 20,272,378 | |
| | | | | | | | | | | | | | | | |
|
| U.S. GOVERNMENT AGENCY OBLIGATIONS — 6.2% | |
Federal Home Loan Bank | |
5.500% | | | 07/15/36 | | | | | | | | 850 | | | | 1,228,346 | |
Federal Home Loan Mortgage Corp. | |
1.500% | | | 11/01/50 | | | | | | | | 1,353 | | | | 1,307,122 | |
2.000% | | | 01/01/32 | | | | | | | | 471 | | | | 484,046 | |
2.000% | | | 06/01/40 | | | | | | | | 840 | | | | 852,745 | |
2.000% | | | 10/01/40 | | | | | | | | 1,387 | | | | 1,407,707 | |
2.000% | | | 09/01/50 | | | | | | | | 3,150 | | | | 3,143,532 | |
2.000% | | | 03/01/51 | | | | | | | | 1,014 | | | | 1,011,775 | |
2.500% | | | 03/01/30 | | | | | | | | 274 | | | | 284,955 | |
2.500% | | | 03/01/51 | | | | | | | | 780 | | | | 804,789 | |
2.500% | | | 04/01/51 | | | | | | | | 6,900 | | | | 7,050,150 | |
2.500% | | | 08/01/51 | | | | | | | | 2,881 | | | | 2,944,472 | |
2.500% | | | 09/01/51 | | | | | | | | 4,963 | | | | 5,076,411 | |
3.000% | | | 10/01/28 | | | | | | | | 183 | | | | 193,264 | |
3.000% | | | 06/01/29 | | | | | | | | 392 | | | | 413,542 | |
3.000% | | | 01/01/37 | | | | | | | | 104 | | | | 109,223 | |
3.000% | | | 06/01/42 | | | | | | | | 162 | | | | 171,598 | |
3.000% | | | 10/01/42 | | | | | | | | 402 | | | | 424,861 | |
3.000% | | | 01/01/43 | | | | | | | | 377 | | | | 398,301 | |
3.000% | | | 07/01/43 | | | | | | | | 1,009 | | | | 1,064,733 | |
3.000% | | | 11/01/49 | | | | | | | | 1,430 | | | | 1,482,273 | |
3.000% | | | 02/01/50 | | | | | | | | 1,685 | | | | 1,751,154 | |
3.000% | | | 05/01/50 | | | | | | | | 367 | | | | 380,848 | |
3.500% | | | 06/01/42 | | | | | | | | 173 | | | | 186,633 | |
3.500% | | | 01/01/47 | | | | | | | | 298 | | | | 318,211 | |
3.500% | | | 02/01/47 | | | | | | | | 461 | | | | 491,682 | |
4.000% | | | 06/01/26 | | | | | | | | 192 | | | | 201,868 | |
| | | | | | | | | | | | | | |
Interest Rate | | Maturity
Date | | | | | Principal
Amount
(000)# | | | Value | |
| | | | | | | | | | | | | | |
|
| U.S. GOVERNMENT AGENCY OBLIGATIONS(continued) | |
4.000% | | 09/01/26 | | | | | | | 68 | | | $ | 71,959 | |
4.000% | | 03/01/38 | | | | | | | 207 | | | | 222,785 | |
4.000% | | 10/01/39 | | | | | | | 355 | | | | 389,654 | |
4.000% | | 09/01/40 | | | | | | | 417 | | | | 457,910 | |
4.000% | | 12/01/40 | | | | | | | 186 | | | | 204,368 | |
4.000% | | 10/01/41 | | | | | | | 189 | | | | 207,424 | |
4.000% | | 01/01/42 | | | | | | | 65 | | | | 71,768 | |
4.500% | | 02/01/39 | | | | | | | 50 | | | | 55,139 | |
4.500% | | 09/01/39 | | | | | | | 69 | | | | 76,875 | |
4.500% | | 10/01/39 | | | | | | | 605 | | | | 667,175 | |
4.500% | | 12/01/39 | | | | | | | 61 | | | | 67,679 | |
4.500% | | 07/01/41 | | | | | | | 77 | | | | 82,960 | |
4.500% | | 07/01/41 | | | | | | | 1,105 | | | | 1,224,933 | |
4.500% | | 08/01/41 | | | | | | | 113 | | | | 121,526 | |
4.500% | | 08/01/41 | | | | | | | 175 | | | | 191,005 | |
4.500% | | 08/01/41 | | | | | | | 195 | | | | 212,087 | |
4.500% | | 10/01/41 | | | | | | | 100 | | | | 107,035 | |
4.500% | | 12/01/47 | | | | | | | 133 | | | | 143,534 | |
4.500% | | 08/01/48 | | | | | | | 277 | | | | 297,080 | |
5.000% | | 05/01/34 | | | | | | | 14 | | | | 15,499 | |
5.000% | | 05/01/34 | | | | | | | 165 | | | | 186,684 | |
5.000% | | 10/01/35 | | | | | | | 4 | | | | 4,474 | |
5.000% | | 07/01/37 | | | | | | | 224 | | | | 253,324 | |
5.000% | | 05/01/39 | | | | | | | 32 | | | | 36,151 | |
5.500% | | 12/01/33 | | | | | | | 35 | | | | 38,843 | |
5.500% | | 01/01/34 | | | | | | | 31 | | | | 34,407 | |
5.500% | | 06/01/34 | | | | | | | 63 | | | | 72,192 | |
5.500% | | 07/01/34 | | | | | | | 119 | | | | 134,938 | |
5.500% | | 05/01/37 | | | | | | | 29 | | | | 33,596 | |
5.500% | | 02/01/38 | | | | | | | 234 | | | | 268,382 | |
5.500% | | 05/01/38 | | | | | | | 26 | | | | 29,381 | |
5.500% | | 07/01/38 | | | | | | | 62 | | | | 70,837 | |
6.000% | | 03/01/32 | | | | | | | 124 | | | | 137,700 | |
6.000% | | 12/01/33 | | | | | | | 45 | | | | 49,840 | |
6.000% | | 11/01/36 | | | | | | | 30 | | | | 34,197 | |
6.000% | | 01/01/37 | | | | | | | 28 | | | | 32,498 | |
6.000% | | 05/01/37 | | | | | | | 13 | | | | 14,812 | |
6.000% | | 02/01/38 | | | | | | | 2 | | | | 2,660 | |
6.000% | | 08/01/39 | | | | | | | 37 | | | | 42,459 | |
6.750% | | 03/15/31(k) | | | | | | | 550 | | | | 788,458 | |
7.000% | | 05/01/31 | | | | | | | 6 | | | | 5,847 | |
7.000% | | 06/01/31 | | | | | | | 12 | | | | 12,318 | |
7.000% | | 08/01/31 | | | | | | | 96 | | | | 106,371 | |
7.000% | | 10/01/31 | | | | | | | 6 | | | | 6,028 | |
Federal National Mortgage Assoc. | | | | | | | | | |
1.500% | | 11/01/50 | | | | | | | 933 | | | | 901,898 | |
1.500% | | 12/01/50 | | | | | | | 3,742 | | | | 3,617,191 | |
2.000% | | TBA | | | | | | | 1,500 | | | | 1,495,378 | |
2.000% | | 08/01/31 | | | | | | | 460 | | | | 472,656 | |
2.000% | | 02/01/41 | | | | | | | 1,759 | | | | 1,787,417 | |
2.000% | | 05/01/41 | | | | | | | 9,654 | | | | 9,809,034 | |
2.000% | | 08/01/50 | | | | | | | 1,290 | | | | 1,286,837 | |
2.000% | | 10/01/50 | | | | | | | 7,257 | | | | 7,240,716 | |
2.000% | | 11/01/50 | | | | | | | 1,745 | | | | 1,741,510 | |
2.000% | | 03/01/51 | | | | | | | 3,505 | | | | 3,497,046 | |
2.000% | | 05/01/51 | | | | | | | 2,535 | | | | 2,529,214 | |
2.500% | | 05/01/41 | | | | | | | 7,844 | | | | 8,098,378 | |
2.500% | | 10/01/43 | | | | | | | 385 | | | | 397,005 | |
SEE NOTES TO FINANCIAL STATEMENTS.
A33
| | | | | | |
| | |
| | PSF PGIM 50/50 BALANCED PORTFOLIO (CONTINUED) | | |
| | | | | | |
| |
| SCHEDULE OF INVESTMENTS | | as of December 31, 2021 |
| | | | | | | | | | | | | | |
Interest Rate | | Maturity
Date | | | | | Principal
Amount
(000)# | | | Value | |
| | | | | | | | | | | | | | |
|
| U.S. GOVERNMENT AGENCY OBLIGATIONS(continued) | |
2.500% | | 12/01/46 | | | | | | | 790 | | | $ | 811,325 | |
2.500% | | 03/01/50 | | | | | | | 788 | | | | 806,867 | |
2.500% | | 08/01/50 | | | | | | | 2,791 | | | | 2,849,783 | |
2.500% | | 04/01/51 | | | | | | | 3,701 | | | | 3,779,880 | |
3.000% | | TBA | | | | | | | 1,000 | | | | 1,034,440 | |
3.000% | | TBA(tt) | | | | | | | 2,500 | | | | 2,589,908 | |
3.000% | | 02/01/27 | | | | | | | 689 | | | | 723,371 | |
3.000% | | 08/01/30 | | | | | | | 520 | | | | 546,871 | |
3.000% | | 11/01/36 | | | | | | | 810 | | | �� | 845,625 | |
3.000% | | 12/01/42 | | | | | | | 662 | | | | 695,744 | |
3.000% | | 03/01/43 | | | | | | | 142 | | | | 150,109 | |
3.000% | | 11/01/46 | | | | | | | 498 | | | | 519,859 | |
3.000% | | 01/01/47 | | | | | | | 741 | | | | 777,192 | |
3.000% | | 02/01/47 | | | | | | | 780 | | | | 815,984 | |
3.000% | | 03/01/47 | | | | | | | 411 | | | | 430,702 | |
3.000% | | 06/01/49 | | | | | | | 19 | | | | 19,522 | |
3.000% | | 12/01/49 | | | | | | | 1,629 | | | | 1,688,325 | |
3.000% | | 02/01/50 | | | | | | | 3,357 | | | | 3,478,773 | |
3.000% | | 03/01/50 | | | | | | | 340 | | | | 352,307 | |
3.500% | | TBA(tt) | | | | | | | 500 | | | | 526,362 | |
3.500% | | 07/01/31 | | | | | | | 493 | | | | 522,618 | |
3.500% | | 02/01/33 | | | | | | | 1,094 | | | | 1,157,304 | |
3.500% | | 06/01/39 | | | | | | | 311 | | | | 335,735 | |
3.500% | | 01/01/42 | | | | | | | 1,809 | | | | 1,941,047 | |
3.500% | | 05/01/42 | | | | | | | 895 | | | | 959,750 | |
3.500% | | 07/01/42 | | | | | | | 478 | | | | 516,301 | |
3.500% | | 08/01/42 | | | | | | | 185 | | | | 200,185 | |
3.500% | | 08/01/42 | | | | | | | 487 | | | | 525,477 | |
3.500% | | 09/01/42 | | | | | | | 237 | | | | 255,494 | |
3.500% | | 09/01/42 | | | | | | | 955 | | | | 1,031,329 | |
3.500% | | 11/01/42 | | | | | | | 127 | | | | 135,765 | |
3.500% | | 03/01/43 | | | | | | | 1,469 | | | | 1,586,275 | |
3.500% | | 04/01/43 | | | | | | | 291 | | | | 314,789 | |
3.500% | | 04/01/43 | | | | | | | 407 | | | | 439,260 | |
3.500% | | 01/01/46 | | | | | | | 740 | | | | 798,046 | |
3.500% | | 07/01/46 | | | | | | | 554 | | | | 588,840 | |
3.500% | | 11/01/46 | | | | | | | 674 | | | | 718,278 | |
3.500% | | 09/01/47 | | | | | | | 337 | | | | 356,653 | |
3.500% | | 01/01/48 | | | | | | | 2,888 | | | | 3,058,640 | |
3.500% | | 05/01/48 | | | | | | | 574 | | | | 605,809 | |
3.500% | | 07/01/48 | | | | | | | 354 | | | | 373,862 | |
4.000% | | 10/01/41 | | | | | | | 1,263 | | | | 1,385,989 | |
4.000% | | 09/01/44 | | | | | | | 807 | | | | 878,406 | |
4.000% | | 10/01/46 | | | | | | | 279 | | | | 300,720 | |
4.000% | | 02/01/47 | | | | | | | 160 | | | | 171,165 | |
4.000% | | 09/01/47 | | | | | | | 575 | | | | 615,357 | |
4.000% | | 11/01/47 | | | | | | | 386 | | | | 420,455 | |
4.000% | | 11/01/47 | | | | | | | 844 | | | | 903,906 | |
4.000% | | 03/01/49 | | | | | | | 3,739 | | | | 3,972,960 | |
4.500% | | 07/01/33 | | | | | | | 30 | | | | 32,700 | |
4.500% | | 08/01/33 | | | | | | | 28 | | | | 30,384 | |
4.500% | | 09/01/33 | | | | | | | 55 | | | | 60,535 | |
4.500% | | 10/01/33 | | | | | | | 4 | | | | 4,347 | |
4.500% | | 10/01/33 | | | | | | | 20 | | | | 22,015 | |
4.500% | | 10/01/33 | | | | | | | 69 | | | | 76,027 | |
4.500% | | 01/01/35 | | | | | | | 1 | | | | 936 | |
4.500% | | 07/01/39 | | | | | | | 469 | | | | 518,321 | |
4.500% | | 08/01/39 | | | | | | | 695 | | | | 768,668 | |
| | | | | | | | | | | | | | |
Interest Rate | | Maturity
Date | | | | | Principal
Amount
(000)# | | | Value | |
| | | | | | | | | | | | | | |
|
| U.S. GOVERNMENT AGENCY OBLIGATIONS(continued) | |
4.500% | | 03/01/41 | | | | | | | 223 | | | $ | 246,486 | |
4.500% | | 11/01/47 | | | | | | | 1,292 | | | | 1,395,309 | |
4.500% | | 01/01/49 | | | | | | | 222 | | | | 237,707 | |
5.000% | | 03/01/34 | | | | | | | 140 | | | | 157,572 | |
5.000% | | 06/01/35 | | | | | | | 50 | | | | 56,413 | |
5.000% | | 07/01/35 | | | | | | | 63 | | | | 71,705 | |
5.000% | | 09/01/35 | | | | | | | 52 | | | | 58,753 | |
5.000% | | 11/01/35 | | | | | | | 59 | | | | 66,145 | |
5.000% | | 02/01/36 | | | | | | | 61 | | | | 69,293 | |
5.000% | | 05/01/36 | | | | | | | 31 | | | | 34,609 | |
5.500% | | 09/01/33 | | | | | | | 113 | | | | 126,554 | |
5.500% | | 10/01/33 | | | | | | | 52 | | | | 58,972 | |
5.500% | | 12/01/33 | | | | | | | 33 | | | | 37,157 | |
5.500% | | 01/01/34 | | | | | | | 1 | | | | 808 | |
5.500% | | 12/01/34 | | | | | | | 109 | | | | 123,566 | |
5.500% | | 10/01/35 | | | | | | | 379 | | | | 426,617 | |
5.500% | | 03/01/36 | | | | | | | 46 | | | | 51,026 | |
5.500% | | 05/01/36 | | | | | | | 108 | | | | 123,056 | |
5.500% | | 04/01/37 | | | | | | | 57 | | | | 64,683 | |
6.000% | | 08/01/22 | | | | | | | 3 | | | | 2,879 | |
6.000% | | 04/01/33 | | | | | | | 8 | | | | 8,766 | |
6.000% | | 06/01/33 | | | | | | | 3 | | | | 3,588 | |
6.000% | | 10/01/33 | | | | | | | 186 | | | | 208,013 | |
6.000% | | 11/01/33 | | | | | | | 2 | | | | 2,496 | |
6.000% | | 11/01/33 | | | | | | | 13 | | | | 13,893 | |
6.000% | | 11/01/33 | | | | | | | 42 | | | | 46,321 | |
6.000% | | 01/01/34 | | | | | | | 191 | | | | 217,307 | |
6.000% | | 02/01/34 | | | | | | | 42 | | | | 46,915 | |
6.000% | | 03/01/34 | | | | | | | 24 | | | | 26,581 | |
6.000% | | 03/01/34 | | | | | | | 37 | | | | 40,706 | |
6.000% | | 07/01/34 | | | | | | | 135 | | | | 155,659 | |
6.000% | | 08/01/34 | | | | | | | —(r | ) | | | 606 | |
6.000% | | 10/01/34 | | | | | | | 3 | | | | 3,188 | |
6.000% | | 11/01/34 | | | | | | | 2 | | | | 2,568 | |
6.000% | | 11/01/34 | | | | | | | 7 | | | | 8,056 | |
6.000% | | 01/01/35 | | | | | | | 49 | | | | 55,198 | |
6.000% | | 01/01/35 | | | | | | | 99 | | | | 108,547 | |
6.000% | | 02/01/35 | | | | | | | 38 | | | | 41,584 | |
6.000% | | 02/01/35 | | | | | | | 161 | | | | 184,903 | |
6.000% | | 03/01/35 | | | | | | | 1 | | | | 1,189 | |
6.000% | | 04/01/35 | | | | | | | 1 | | | | 603 | |
6.000% | | 07/01/36 | | | | | | | 24 | | | | 27,420 | |
6.000% | | 02/01/37 | | | | | | | 45 | | | | 52,453 | |
6.000% | | 05/01/37 | | | | | | | 17 | | | | 19,181 | |
6.000% | | 06/01/37 | | | | | | | —(r | ) | | | 387 | |
6.000% | | 08/01/37 | | | | | | | 9 | | | | 10,558 | |
6.000% | | 09/01/37 | | | | | | | —(r | ) | | | 225 | |
6.000% | | 10/01/37 | | | | | | | 28 | | | | 32,804 | |
6.000% | | 05/01/38 | | | | | | | 39 | | | | 45,692 | |
6.000% | | 06/01/38 | | | | | | | 2 | | | | 2,171 | |
6.250% | | 05/15/29(k) | | | | | | | 610 | | | | 810,351 | |
6.500% | | 07/01/32 | | | | | | | 30 | | | | 33,859 | |
6.500% | | 09/01/32 | | | | | | | 1 | | | | 1,537 | |
6.500% | | 09/01/32 | | | | | | | 38 | | | | 42,295 | |
6.500% | | 09/01/32 | | | | | | | 46 | | | | 50,884 | |
6.500% | | 09/01/32 | | | | | | | 52 | | | | 58,232 | |
6.500% | | 04/01/33 | | | | | | | 55 | | | | 62,801 | |
6.500% | | 11/01/33 | | | | | | | 19 | | | | 21,826 | |
SEE NOTES TO FINANCIAL STATEMENTS.
A34
| | | | | | |
| | |
| | PSF PGIM 50/50 BALANCED PORTFOLIO (CONTINUED) | | |
| | | | | | |
| |
| SCHEDULE OF INVESTMENTS | | as of December 31, 2021 |
| | | | | | | | | | | | |
Interest
Rate | | Maturity
Date | | | | Principal
Amount
(000)# | | | Value | |
| | | | | | | | | | | | |
|
| U.S. GOVERNMENT AGENCY OBLIGATIONS(continued) | |
6.500% | | 01/01/34 | | | | | 20 | | | $ | 22,474 | |
6.500% | | 09/01/34 | | | | | 54 | | | | 59,951 | |
6.500% | | 09/01/36 | | | | | 46 | | | | 53,320 | |
6.500% | | 10/01/36 | | | | | 11 | | | | 12,999 | |
6.500% | | 11/01/36 | | | | | 19 | | | | 21,397 | |
6.500% | | 01/01/37 | | | | | 37 | | | | 40,569 | |
6.500% | | 01/01/37 | | | | | 93 | | | | 104,430 | |
6.625% | | 11/15/30(k) | | | | | 800 | | | | 1,128,733 | |
7.000% | | 02/01/32 | | | | | 12 | | | | 13,556 | |
7.000% | | 05/01/32 | | | | | 10 | | | | 12,322 | |
7.000% | | 06/01/32 | | | | | 10 | | | | 11,013 | |
7.000% | | 07/01/32 | | | | | 36 | | | | 40,526 | |
7.125% | | 01/15/30(k) | | | | | 3,195 | | | | 4,528,705 | |
Government National Mortgage Assoc. | |
2.000% | | 03/20/51 | | | | | 914 | | | | 923,327 | |
2.500% | | TBA | | | | | 1,000 | | | | 1,021,835 | |
2.500% | | TBA | | | | | 1,000 | | | | 1,024,061 | |
2.500% | | 03/20/43 | | | | | 159 | | | | 164,673 | |
2.500% | | 12/20/46 | | | | | 299 | | | | 307,732 | |
2.500% | | 05/20/51 | | | | | 479 | | | | 490,914 | |
2.500% | | 08/20/51 | | | | | 787 | | | | 806,719 | |
3.000% | | TBA | | | | | 3,000 | | | | 3,103,958 | |
3.000% | | 12/20/44 | | | | | 111 | | | | 116,188 | |
3.000% | | 03/15/45 | | | | | 369 | | | | 384,531 | |
3.000% | | 11/20/45 | | | | | 339 | | | | 354,237 | |
3.000% | | 03/20/46 | | | | | 718 | | | | 749,460 | |
3.000% | | 07/20/46 | | | | | 1,832 | | | | 1,912,501 | |
3.000% | | 08/20/46 | | | | | 484 | | | | 505,077 | |
3.000% | | 10/20/46 | | | | | 423 | | | | 441,766 | |
3.000% | | 11/20/46 | | | | | 255 | | | | 266,646 | |
3.000% | | 12/20/46 | | | | | 463 | | | | 483,120 | |
3.000% | | 01/20/47 | | | | | 132 | | | | 137,770 | |
3.000% | | 04/20/47 | | | | | 591 | | | | 616,534 | |
3.000% | | 12/20/49 | | | | | 210 | | | | 217,406 | |
3.500% | | 12/20/42 | | | | | 660 | | | | 702,808 | |
3.500% | | 05/20/43 | | | | | 199 | | | | 213,642 | |
3.500% | | 04/20/45 | | | | | 611 | | | | 646,666 | |
3.500% | | 07/20/46 | | | | | 2,250 | | | | 2,370,077 | |
3.500% | | 07/20/48 | | | | | 1,764 | | | | 1,848,497 | |
3.500% | | 11/20/48 | | | | | 582 | | | | 609,062 | |
3.500% | | 06/20/49 | | | | | 2,277 | | | | 2,373,237 | |
4.000% | | 06/15/40 | | | | | 37 | | | | 41,023 | |
4.000% | | 05/20/41 | | | | | 34 | | | | 36,869 | |
4.000% | | 12/20/42 | | | | | 364 | | | | 393,920 | |
4.000% | | 08/20/44 | | | | | 140 | | | | 151,201 | |
4.000% | | 11/20/45 | | | | | 273 | | | | 295,507 | |
4.000% | | 12/20/45 | | | | | 750 | | | | 811,957 | |
4.000% | | 09/20/47 | | | | | 2,190 | | | | 2,327,877 | |
4.000% | | 02/20/49 | | | | | 815 | | | | 861,602 | |
4.000% | | 01/20/50 | | | | | 326 | | | | 343,801 | |
4.500% | | 04/15/40 | | | | | 216 | | | | 242,027 | |
4.500% | | 01/20/41 | | | | | 253 | | | | 280,890 | |
4.500% | | 02/20/41 | | | | | 399 | | | | 442,795 | |
4.500% | | 03/20/41 | | | | | 199 | | | | 219,408 | |
4.500% | | 06/20/44 | | | | | 300 | | | | 331,774 | |
4.500% | | 09/20/46 | | | | | 244 | | | | 270,043 | |
4.500% | | 11/20/46 | | | | | 349 | | | | 385,832 | |
4.500% | | 03/20/47 | | | | | 192 | | | | 206,460 | |
| | | | | | | | | | | | |
Interest
Rate | | Maturity
Date | | | | Principal
Amount
(000)# | | | Value | |
| | | | | | | | | | | | |
|
| U.S. GOVERNMENT AGENCY OBLIGATIONS(continued) | |
4.500% | | 05/20/48 | | | | | 323 | | | $ | 343,271 | |
4.500% | | 08/20/48 | | | | | 566 | | | | 599,946 | |
5.000% | | 10/20/37 | | | | | 61 | | | | 68,877 | |
5.000% | | 04/20/45 | | | | | 340 | | | | 384,408 | |
5.500% | | 08/15/33 | | | | | 161 | | | | 176,781 | |
5.500% | | 08/15/33 | | | | | 166 | | | | 182,379 | |
5.500% | | 09/15/33 | | | | | 36 | | | | 39,585 | |
5.500% | | 12/15/33 | | | | | 11 | | | | 11,795 | |
5.500% | | 03/15/34 | | | | | 105 | | | | 115,932 | |
5.500% | | 12/15/34 | | | | | 205 | | | | 234,694 | |
5.500% | | 07/15/35 | | | | | 36 | | | | 41,960 | |
5.500% | | 04/15/36 | | | | | 42 | | | | 46,627 | |
6.000% | | 04/15/33 | | | | | 5 | | | | 5,287 | |
6.000% | | 12/15/33 | | | | | 69 | | | | 75,895 | |
6.000% | | 01/15/34 | | | | | 19 | | | | 20,821 | |
6.000% | | 01/15/34 | | | | | 23 | | | | 25,597 | |
6.000% | | 01/15/34 | | | | | 39 | | | | 45,167 | |
6.000% | | 06/20/34 | | | | | 70 | | | | 80,516 | |
6.000% | | 07/15/34 | | | | | 49 | | | | 57,546 | |
6.500% | | 10/15/23 | | | | | —(r | ) | | | 292 | |
6.500% | | 12/15/23 | | | | | 1 | | | | 1,002 | |
6.500% | | 01/15/24 | | | | | —(r | ) | | | 216 | |
6.500% | | 01/15/24 | | | | | 2 | | | | 1,705 | |
6.500% | | 01/15/24 | | | | | 4 | | | | 4,129 | |
6.500% | | 01/15/24 | | | | | 4 | | | | 4,923 | |
6.500% | | 01/15/24 | | | | | 9 | | | | 9,710 | |
6.500% | | 01/15/24 | | | | | 17 | | | | 18,536 | |
6.500% | | 02/15/24 | | | | | —(r | ) | | | 345 | |
6.500% | | 02/15/24 | | | | | 1 | | | | 737 | |
6.500% | | 02/15/24 | | | | | 2 | | | | 1,693 | |
6.500% | | 02/15/24 | | | | | 2 | | | | 1,986 | |
6.500% | | 02/15/24 | | | | | 2 | | | | 2,649 | |
6.500% | | 02/15/24 | | | | | 3 | | | | 3,453 | |
6.500% | | 03/15/24 | | | | | —(r | ) | | | 237 | |
6.500% | | 03/15/24 | | | | | 1 | | | | 769 | |
6.500% | | 04/15/24 | | | | | —(r | ) | | | 194 | |
6.500% | | 04/15/24 | | | | | 1 | | | | 762 | |
6.500% | | 04/15/24 | | | | | 1 | | | | 858 | |
6.500% | | 04/15/24 | | | | | 1 | | | | 1,031 | |
6.500% | | 04/15/24 | | | | | 3 | | | | 3,821 | |
6.500% | | 04/15/24 | | | | | 4 | | | | 4,856 | |
6.500% | | 05/15/24 | | | | | 1 | | | | 1,639 | |
6.500% | | 05/15/24 | | | | | 2 | | | | 2,008 | |
6.500% | | 05/15/24 | | | | | 6 | | | | 6,074 | |
6.500% | | 10/15/24 | | | | | 5 | | | | 5,351 | |
6.500% | | 11/15/28 | | | | | 3 | | | | 3,280 | |
6.500% | | 08/15/31 | | | | | 4 | | | | 3,987 | |
6.500% | | 12/15/31 | | | | | 7 | | | | 8,242 | |
6.500% | | 02/15/32 | | | | | 25 | | | | 27,680 | |
6.500% | | 06/15/32 | | | | | 12 | | | | 12,914 | |
6.500% | | 07/15/32 | | | | | 24 | | | | 26,594 | |
6.500% | | 08/15/32 | | | | | 3 | | | | 3,642 | |
6.500% | | 08/15/32 | | | | | 4 | | | | 5,075 | |
6.500% | | 08/15/32 | | | | | 7 | | | | 7,325 | |
6.500% | | 08/15/32 | | | | | 23 | | | | 25,312 | |
6.500% | | 08/15/32 | | | | | 117 | | | | 133,649 | |
6.500% | | 08/15/34 | | | | | 22 | | | | 25,051 | |
6.500% | | 06/15/35 | | | | | 23 | | | | 26,024 | |
SEE NOTES TO FINANCIAL STATEMENTS.
A35
| | | | | | |
| | |
| | PSF PGIM 50/50 BALANCED PORTFOLIO (CONTINUED) | | |
| | | | | | |
| |
| SCHEDULE OF INVESTMENTS | | as of December 31, 2021 |
| | | | | | | | | | | | | | | | |
Interest Rate | | Maturity
Date | | | | | | Principal Amount (000)# | | | Value | |
| | | | | | | | | | | | | | | | |
U.S. GOVERNMENT AGENCY OBLIGATIONS(continued) | |
6.500% | | | 09/15/36 | | | | | | | | 30 | | | $ | 34,886 | |
8.000% | | | 01/15/24 | | | | | | | | 3 | | | | 3,122 | |
Tennessee Valley Authority, Sr. Unsec’d. Notes | | | | | |
1.500% | | | 09/15/31 | | | | | | | | 200 | | | | 195,840 | |
7.125% | | | 05/01/30 | | | | | | | | 510 | | | | 724,984 | |
| | | | | | | | | | | | | | | | |
TOTAL U.S. GOVERNMENT AGENCY OBLIGATIONS
(cost $176,351,473) | | | | 179,618,375 | |
| | | | | | | | | | | | | | | | |
|
U.S. TREASURY OBLIGATIONS — 0.6% | |
U.S. Treasury Bonds | | | | | |
2.000% | | | 11/15/41 | | | | | | | | 4,230 | | | | 4,276,927 | |
2.250% | | | 05/15/41 | | | | | | | | 10,220 | | | | 10,727,806 | |
U.S. Treasury Strips Coupon | | | | | |
1.760%(s) | | | 08/15/40 | (k) | | | | | | | 830 | | | | 566,540 | |
2.000%(s) | | | 08/15/39 | (k) | | | | | | | 360 | | | | 253,533 | |
2.378%(s) | | | 11/15/43 | | | | | | | | 3,600 | | | | 2,281,359 | |
| | | | | | | | | | | | | | | | |
TOTAL U.S. TREASURY OBLIGATIONS
(cost $18,147,473) | | | | 18,106,165 | |
| | | | | | | | | | | | | | | | |
TOTAL LONG-TERM INVESTMENTS
(cost $1,296,365,472) | | | | 2,538,606,870 | |
| | | | | | | | | | | | | | | | |
| | | | |
| | | | | | | | | Shares | | | | |
SHORT-TERM INVESTMENTS — 13.8% | |
AFFILIATED MUTUAL FUNDS — 13.7% | | | | | |
PGIM Core Ultra Short Bond Fund(wa) | | | | | | | | 363,398,511 | | | | 363,398,511 | |
PGIM Institutional Money Market Fund (cost $35,455,211; includes $35,452,395 of cash collateral for securities on loan)(b)(wa) | | | | | | | | 35,557,940 | | | | 35,533,049 | |
| | | | | | | | | | | | | | | | |
TOTAL AFFILIATED MUTUAL FUNDS
(cost $398,853,722) | | | | 398,931,560 | |
| | | | | | | | | | | | | | | | |
| | | | |
Interest Rate | | Maturity
Date | | | | | | Principal
Amount
(000)# | | | | |
| | | | | | | | | | | | | | | | |
|
U.S. TREASURY OBLIGATION(k)(n) — 0.1% | |
U.S. Treasury Bills | | | | | |
0.043% | | | 03/17/22 | | | | | | | | 1,920 | | | | 1,919,785 | |
| | | | | | | | | | | | | | | | |
(cost $1,919,830) | | | | | | | | | | | | | |
| |
OPTIONS PURCHASED*~ — 0.0%
(cost $58,689) | | | | 25,402 | |
| | | | | | | | | | | | | | | | |
TOTAL SHORT-TERM INVESTMENTS
(cost $400,832,241) | | | | 400,876,747 | |
| | | | | | | | | | | | | | | | |
TOTAL INVESTMENTS, BEFORE OPTIONS
WRITTEN—101.4%
(cost $1,697,197,713) | | | | 2,939,483,617 | |
| | | | | | | | | | | | | | | | |
| | | | | | | | |
| | | | | | Value | |
OPTIONS WRITTEN*~ — (0.0)%
(premiums received $59,861) | | | | | | $ | (76,842 | ) |
| | | | | | | | |
TOTAL INVESTMENTS, NET OF OPTIONS
WRITTEN—101.4%
(cost $1,697,137,852) | | | | | | | 2,939,406,775 | |
Liabilities in excess of other assets(z) — (1.4)% | | | | (40,364,207 | ) |
| | | | | | | | |
| | |
NET ASSETS — 100.0% | | | | | | $ | 2,899,042,568 | |
| | | | | | | | |
See the Glossary for a list of the abbreviation(s) used in the annual report.
| * | Non-income producing security. |
| # | Principal or notional amount is shown in U.S. dollars unless otherwise stated. |
| ~ | See tables subsequent to the Schedule of Investments for options detail. |
| ^ | Indicates a Level 3 instrument. The aggregate value of Level 3 instruments is $7,803,288 and 0.3% of net assets. |
| (a) | All or a portion of security is on loan. The aggregate market value of such securities, including those sold and pending settlement, is $34,821,643; cash collateral of $35,452,395 (included in liabilities) was received with which the Portfolio purchased highly liquid short-term investments. In the event of significant appreciation in value of securities on loan on the last business day of the reporting period, the Portfolio may reflect a collateral value that is less than the market value of the loaned securities and such shortfall is remedied the following business day. |
| (b) | Represents security, or portion thereof, purchased with cash collateral received for securities on loan and includes dividend reinvestment. |
| (c) | Variable rate instrument. The interest rate shown reflects the rate in effect at December 31, 2021. |
| (cc) | Variable rate instrument. The rate shown is based on the latest available information as of December 31, 2021. Certain variable rate securities are not based on a published reference rate and spread but are determined by the issuer or agent and are based on current market conditions. These securities do not indicate a reference rate and spread in their description. |
| (ff) | Variable rate security. Security may be issued at a fixed coupon rate, which converts to a variable rate at a specified date. Rate shown is the rate in effect as of period end. |
| (k) | Represents security, or a portion thereof, segregated as collateral for centrally cleared/exchange-traded derivatives. |
| (n) | Rate shown reflects yield to maturity at purchased date. |
| (oo) | Perpetual security. Maturity date represents next call date. |
| (r) | Principal or notional amount is less than $500 par. |
| (s) | Represents zero coupon bond or principal only security. Rate represents yield to maturity at purchase date. |
| (tt) | All or partial principal amount represents “TBA” mortgage dollar rolls. The aggregate mortgage dollar roll principal amount of 3,000,000 is 0.1% of net assets. |
| (wa) | PGIM Investments LLC, the manager of the Portfolio, also serves as manager of the PGIM Core Ultra Short Bond Fund and PGIM Institutional Money Market Fund, if applicable. |
| (z) | Includes net unrealized appreciation/(depreciation) and/or market value of the below holdings which are excluded from the Schedule of Investments: |
SEE NOTES TO FINANCIAL STATEMENTS.
A36
| | | | | | |
| | |
| | PSF PGIM 50/50 BALANCED PORTFOLIO (CONTINUED) | | |
| | | | | | |
| |
| SCHEDULE OF INVESTMENTS | | as of December 31, 2021 |
Options Purchased:
OTC Swaptions
| | | | | | | | | | | | | | | | | | | | | | | | | | | | | | | | |
Description | | Call/
Put | | | Counterparty | | | Expiration
Date | | | Strike | | | Receive | | | Pay | | | Notional
Amount
(000)# | | | Value | |
CDX.NA.IG.37.V1,
12/20/26 | | | Call | | | | BNP Paribas S.A. | | | | 02/16/22 | | | | 0.35% | | | | 1.00%(Q) | | | | CDX.NA.IG.37.V1(Q) | | | | 6,880 | | | $ | — | |
CDX.NA.IG.37.V1,
12/20/26 | | | Call | | |
| Morgan Stanley &
Co. International
PLC |
| | | 02/16/22 | | | | 0.35% | | | | 1.00%(Q) | | | | CDX.NA.IG.37.V1(Q) | | | | 6,520 | | | | — | |
CDX.NA.IG.37.V1,
12/20/26 | | | Call | | |
| Morgan Stanley &
Co. International
PLC |
| | | 02/16/22 | | | | 0.35% | | | | 1.00%(Q) | | | | CDX.NA.IG.37.V1(Q) | | | | 6,490 | | | | — | |
CDX.NA.IG.37.V1,
12/20/26 | | | Call | | |
| Morgan Stanley &
Co. International
PLC |
| | | 02/16/22 | | | | 0.35% | | | | 1.00%(Q) | | | | CDX.NA.IG.37.V1(Q) | | | | 3,260 | | | | — | |
CDX.NA.IG.37.V1,
12/20/26 | | | Call | | |
| Morgan Stanley &
Co. International
PLC |
| | | 02/16/22 | | | | 0.35% | | | | 1.00%(Q) | | | | CDX.NA.IG.37.V1(Q) | | | | 9,900 | | | | — | |
CDX.NA.IG.37.V1,
12/20/26 | | | Put | | | | BNP Paribas S.A. | | | | 02/16/22 | | | | 0.58% | | | | CDX.NA.IG.37.V1(Q) | | | | 1.00%(Q) | | | | 6,880 | | | | 5,288 | |
CDX.NA.IG.37.V1,
12/20/26 | | | Put | | |
| Morgan Stanley &
Co. International
PLC |
| | | 02/16/22 | | | | 0.58% | | | | CDX.NA.IG.37.V1(Q) | | | | 1.00%(Q) | | | | 6,520 | | | | 5,011 | |
CDX.NA.IG.37.V1,
12/20/26 | | | Put | | |
| Morgan Stanley &
Co. International
PLC |
| | | 02/16/22 | | | | 0.58% | | | | CDX.NA.IG.37.V1(Q) | | | | 1.00%(Q) | | | | 6,490 | | | | 4,988 | |
CDX.NA.IG.37.V1,
12/20/26 | | | Put | | |
| Morgan Stanley &
Co. International
PLC |
| | | 02/16/22 | | | | 0.58% | | | | CDX.NA.IG.37.V1(Q) | | | | 1.00%(Q) | | | | 3,260 | | | | 2,506 | |
CDX.NA.IG.37.V1,
12/20/26 | | | Put | | |
| Morgan Stanley &
Co. International
PLC |
| | | 02/16/22 | | | | 0.58% | | | | CDX.NA.IG.37.V1(Q) | | | | 1.00%(Q) | | | | 9,900 | | | | 7,609 | |
| | | | | | | | | | | | | | | | | | | | | | | | | | | | | | | | |
Total Options Purchased (cost $58,689) | | | | | | | | | | | $ | 25,402 | |
| | | | | | | | | | | | | | | | | | | | | | | | | | | | | | | | |
| | | | | | | | |
Options Written: | | | | | | | | | | | | | | | | | | | | | | | | | | | | | | | | |
| | | | | | | | |
OTC Swaptions | | | | | | | | | | | | | | | | | | | | | | | | | | | | | | | | |
Description | | Call/
Put | | | Counterparty | | | Expiration
Date | | | Strike | | | Receive | | | Pay | | | Notional
Amount
(000)# | | | Value | |
CDX.NA.IG.37.V1,
12/20/26 | | | Call | | | | BNP Paribas S.A. | | | | 02/16/22 | | | | 0.53% | | | | CDX.NA.IG.37.V1(Q) | | | | 1.00%(Q) | | | | 6,880 | | | $ | (13,964 | ) |
CDX.NA.IG.37.V1,
12/20/26 | | | Call | | |
| Morgan Stanley &
Co. International
PLC |
| | | 02/16/22 | | | | 0.53% | | | | CDX.NA.IG.37.V1(Q) | | | | 1.00%(Q) | | | | 6,520 | | | | (13,233 | ) |
CDX.NA.IG.37.V1,
12/20/26 | | | Call | | |
| Morgan Stanley &
Co. International
PLC |
| | | 02/16/22 | | | | 0.53% | | | | CDX.NA.IG.37.V1(Q) | | | | 1.00%(Q) | | | | 6,490 | | | | (13,173 | ) |
CDX.NA.IG.37.V1, 12/20/26 | | | Call | | |
| Morgan Stanley &
Co. International
PLC |
| | | 02/16/22 | | | | 0.53% | | | | CDX.NA.IG.37.V1(Q) | | | | 1.00%(Q) | | | | 3,260 | | | | (6,617 | ) |
CDX.NA.IG.37.V1,
12/20/26 | | | Call | | |
| Morgan Stanley &
Co. International
PLC |
| | | 02/16/22 | | | | 0.53% | | | | CDX.NA.IG.37.V1(Q) | | | | 1.00%(Q) | | | | 9,900 | | | | (20,094 | ) |
CDX.NA.IG.37.V1,
12/20/26 | | | Put | | |
| Morgan Stanley &
Co. International
PLC |
| | | 02/16/22 | | | | 0.73% | | | | 1.00%(Q) | | | | CDX.NA.IG.37.V1(Q) | | | | 6,490 | | | | (1,960 | ) |
CDX.NA.IG.37.V1,
12/20/26 | | | Put | | | | BNP Paribas S.A. | | | | 02/16/22 | | | | 0.75% | | | | 1.00%(Q) | | | | CDX.NA.IG.37.V1(Q) | | | | 6,880 | | | | (1,839 | ) |
SEE NOTES TO FINANCIAL STATEMENTS.
A37
| | | | | | |
| | |
| | PSF PGIM 50/50 BALANCED PORTFOLIO (CONTINUED) | | |
| | | | | | |
| |
| SCHEDULE OF INVESTMENTS | | as of December 31, 2021 |
Options Written (continued):
OTC Swaptions
| | | | | | | | | | | | | | | | | | | | | | |
Description | | Call/
Put | | Counterparty | | Expiration
Date | | Strike | | Receive | | Pay | | | Notional
Amount
(000)# | | | Value | |
|
CDX.NA.IG.37.V1,
12/20/26 | | Put | | Morgan Stanley & Co. International PLC | | 02/16/22 | | 0.75% | | 1.00%(Q) | | | CDX.NA.IG.37.V1(Q) | | | | 6,520 | | | $ | (1,742 | ) |
CDX.NA.IG.37.V1,
12/20/26 | | Put | | Morgan Stanley & Co. International PLC | | 02/16/22 | | 0.75% | | 1.00%(Q) | | | CDX.NA.IG.37.V1(Q) | | | | 3,260 | | | | (871 | ) |
CDX.NA.IG.37.V1,
12/20/26 | | Put | | Morgan Stanley & Co. International PLC | | 02/16/22 | | 0.75% | | 1.00%(Q) | | | CDX.NA.IG.37.V1(Q) | | | | 9,900 | | | | (2,646 | ) |
GS_21-PJ2A^ | | Put | | Goldman Sachs International | | 11/15/24 | | 0.50% | | 0.50%(M) | | | GS_21-PJ2A(M) | | | | 4,720 | | | | (264 | ) |
GS_21-PJA^ | | Put | | Goldman Sachs International | | 06/17/24 | | 0.25% | | 0.25%(M) | | | GS_21-PJA(M) | | | | 9,100 | | | | (439 | ) |
| | | | | | | | | | | | | | | | | | | | | | |
Total Options Written (premiums received $59,861) | | | | | | | | | | $ | (76,842 | ) |
| | | | | | | | | | | | | | | | | | | | | | |
Futures contracts outstanding at December 31, 2021:
| | | | | | | | | | | | | | |
Number
of
Contracts | | Type | | Expiration Date | | | Current Notional Amount | | | Value / Unrealized Appreciation (Depreciation) | |
| | | | | | | | | | | | | | |
Long Positions: | | | | | | | | | |
| 310 | | 2 Year U.S. Treasury Notes | | | Mar. 2022 | | | $ | 67,633,282 | | | $ | (55,703 | ) |
| 363 | | 5 Year U.S. Treasury Notes | | | Mar. 2022 | | | | 43,914,491 | | | | 76,944 | |
| 135 | | 10 Year U.S. Treasury Notes | | | Mar. 2022 | | | | 17,613,281 | | | | 137,214 | |
| 64 | | 20 Year U.S. Treasury Bonds | | | Mar. 2022 | | | | 10,268,000 | | | | 19,383 | |
| 375 | | 30 Year U.S. Ultra Treasury Bonds | | | Mar. 2022 | | | | 73,921,875 | | | | 1,171,911 | |
| 6 | | Mini MSCI EAFE Index | | | Mar. 2022 | | | | 696,540 | | | | 12,026 | |
| 124 | | S&P 500 E-Mini Index | | | Mar. 2022 | | | | 29,502,700 | | | | 347,084 | |
| | | | | | | | | | | | | | |
| | | | | | | | | | | | | 1,708,859 | |
| | | | | | | | | | | | | | |
Short Positions: | | | | | | | | | |
| 29 | | 5 Year Euro-Bobl | | | Mar. 2022 | | | | 4,399,118 | | | | 37,284 | |
| 23 | | 10 Year Euro-Bund | | | Mar. 2022 | | | | 4,487,409 | | | | 75,083 | |
| 63 | | 10 Year U.S. Ultra Treasury Notes | | | Mar. 2022 | | | | 9,225,563 | | | | (158,219 | ) |
| 23 | | Euro Schatz Index | | | Mar. 2022 | | | | 2,933,562 | | | | 4,899 | |
| | | | | | | | | | | | | | |
| | | | | | | | | | | | | (40,953 | ) |
| | | | | | | | | | | | | | |
| | | | | | | | | | | | $ | 1,667,906 | |
| | | | | | | | | | | | | | |
Forward foreign currency exchange contracts outstanding at December 31, 2021:
| | | | | | | | | | | | | | | | | | | | | | | | |
Sale Contracts | | Counterparty | | | Notional
Amount
(000) | | | Value at
Settlement
Date | | | Current
Value | | | Unrealized
Appreciation | | | Unrealized
Depreciation | |
| OTC Forward Foreign Currency Exchange Contracts: | | | | | | | | | |
Canadian Dollar, | | | | | | | | | | | | | | | | | | | | | |
Expiring 01/19/22 | | | Morgan Stanley & Co. International PLC | | | CAD | 1,384 | | | $ | 1,108,933 | | | $ | 1,093,936 | | | $ | 14,997 | | | $ | — | |
Euro, | | | | | | | | | | | | | | | | | | | | | | | | |
Expiring 01/12/22 | | | BNP Paribas S.A. | | | EUR | 22,253 | | | | 25,082,844 | | | | 25,341,216 | | | | — | | | | (258,372 | ) |
| | | | | | | | | | | | | | | | | | | | | | | | |
| | | | | | | | | | $ | 26,191,777 | | | $ | 26,435,152 | | | $ | 14,997 | | | $ | (258,372 | ) |
| | | | | | | | | | | | | | | | | | | | | | | | |
SEE NOTES TO FINANCIAL STATEMENTS.
A38
| | | | | | |
| | |
| | PSF PGIM 50/50 BALANCED PORTFOLIO (CONTINUED) | | |
| | | | | | |
| |
| SCHEDULE OF INVESTMENTS | | as of December 31, 2021 |
| | | | | | | | | | | | | | | | | | | | | | | | | | | | |
| | | | |
| Credit default swap agreement outstanding at December 31, 2021: | | | | | | | | | | | | | | | |
Reference Entity/
Obligation | | Termination
Date | | | Fixed Rate | | Notional
Amount
(000)#(3) | | | Implied
Credit
Spread at
December 31,
2021(4) | | | Fair
Value | | | Upfront
Premiums
Paid
(Received) | | | Unrealized
Appreciation
(Depreciation) | | | Counterparty |
| | | | | | | | | | | | | | | | | | | | | | | | | | | | |
|
| OTC Credit Default Swap Agreements on asset-backed and/or mortgage-backed securities - Sell Protection(2)^: |
GS_21-PJ2A | | | 01/14/22 | | | 0.500%(M) | | | 4,720 | | | | * | | | $ | 2,032 | | | $ | (441 | ) | | $ | 2,473 | | | Goldman Sachs International |
GS_21-PJA | | | 01/14/22 | | | 0.250%(M) | | | 9,100 | | | | * | | | | 1,959 | | | | (425 | ) | | | 2,384 | | | Goldman Sachs International |
| | | | | | | | | | | | | | | | | | | | | | | | | | | | |
| | | | | | | | | | | | | | | | $ | 3,991 | | | $ | (866 | ) | | $ | 4,857 | | | |
| | | | | | | | | | | | | | | | | | | | | | | | | | | | |
The Portfolio entered into credit default swaps (“CDS”) to provide a measure of protection against defaults or to take an active long or short position with respect to the likelihood of a particular issuer’s default or the reference entity’s credit soundness. CDS contracts generally trade based on a spread which represents the cost a protection buyer has to pay the protection seller. The protection buyer is said to be short the credit as the value of the contract rises the more the credit deteriorates. The value of the CDS contract increases for the protection buyer if the spread increases.
| (1) | If the Portfolio is a buyer of protection, it pays the fixed rate. When a credit event occurs, as defined under the terms of that particular swap agreement, the Portfolio will either (i) receive from the seller of protection an amount equal to the notional amount of the swap and make delivery of the referenced obligation or underlying securities comprising the referenced index or (ii) receive a net settlement amount in the form of cash or securities equal to the notional amount of the swap less the recovery value of the referenced obligation or underlying securities comprising the referenced index. |
| (2) | If the Portfolio is a seller of protection, it receives the fixed rate. When a credit event occurs, as defined under the terms of that particular swap agreement, the Portfolio will either (i) pay to the buyer of protection an amount equal to the notional amount of the swap and take delivery of the referenced obligation or underlying securities comprising the referenced index or (ii) pay a net settlement amount in the form of cash or securities equal to the notional amount of the swap less the recovery value of the referenced obligation or underlying securities comprising the referenced index. |
| (3) | Notional amount represents the maximum potential amount the Portfolio could be required to pay as a seller of credit protection or receive as a buyer of credit protection if a credit event occurs as defined under the terms of that particular swap agreement. |
| (4) | Implied credit spreads, represented in absolute terms, utilized in determining the fair value of credit default swap agreements where the Portfolio is the seller of protection as of the reporting date serve as an indicator of the current status of the payment/ performance risk and represent the likelihood of risk of default for the credit derivative. The implied credit spread of a particular referenced entity reflects the cost of buying/selling protection and may include up-front payments required to be made to enter into the agreement. Wider credit spreads represent a deterioration of the referenced entity’s credit soundness and a greater likelihood of risk of default or other credit event occurring as defined under the terms of the agreement. |
| * | When an implied credit spread is not available, reference the fair value of credit default swap agreements on credit indices and asset-backed securities. Where the Portfolio is the seller of protection, it serves as an indicator of the current status of the payment/performance risk and represents the likelihood of an expected liability (or profit) for the credit derivative should the notional amount of the swap agreement be closed/sold as of the reporting date. Increasing fair value in absolute terms, when compared to the notional amount of the swap, represents a deterioration of the referenced entity’s credit soundness and a greater likelihood of risk of default or other credit event occurring as defined under the terms of the agreement. |
| | | | | | | | | | | | | | | | | | | | |
| Inflation swap agreement outstanding at December 31, 2021: | | | | | | | | | |
Notional Amount (000)# | | Termination
Date | | | Fixed
Rate | | Floating Rate | | Value at
Trade Date | | | Value at
December 31,
2021 | | | Unrealized
Appreciation
(Depreciation) | |
| | | | | | | | | | | | | | | | | | | | |
| Centrally Cleared Inflation Swap Agreements: | | | | | | | | | |
5,200 | | | 01/13/26 | | | 2.152%(T) | | U.S. CPI Urban Consumers NSA Index(2)(T) | | $ | — | | | $ | (430,251 | ) | | $ | (430,251 | ) |
15,685 | | | 02/02/26 | | | 2.295%(T) | | U.S. CPI Urban Consumers NSA Index(2)(T) | | | (43,291 | ) | | | (1,178,080 | ) | | | (1,134,789 | ) |
7,790 | | | 02/18/26 | | | 2.370%(T) | | U.S. CPI Urban Consumers NSA Index(2)(T) | | | — | | | | (547,769 | ) | | | (547,769 | ) |
| | | | | | | | | | | | | | | | | | | | |
| | | | | | | | | | $ | (43,291 | ) | | $ | (2,156,100 | ) | | $ | (2,112,809 | ) |
| | | | | | | | | | | | | | | | | | | | |
| (1) | The Portfolio pays the fixed rate and receives the floating rate. |
| (2) | The Portfolio pays the floating rate and receives the fixed rate. |
SEE NOTES TO FINANCIAL STATEMENTS.
A39
| | | | | | |
| | |
| | PSF PGIM 50/50 BALANCED PORTFOLIO (CONTINUED) | | |
| | | | | | |
| |
| SCHEDULE OF INVESTMENTS | | as of December 31, 2021 |
Total return swap agreements outstanding at December 31, 2021:
| | | | | | | | | | | | | | | | | | | | | | | | | | | | | | | | |
Reference Entity | | Financing
Rate | | Counterparty | | Termination
Date | | Long (Short)
Notional
Amount
(000)#(1) | | Fair
Value | | Upfront
Premiums
Paid
(Received) | | Unrealized
Appreciation
(Depreciation)(2) |
OTC Total Return Swap Agreement: | | | | | | | | | | | | | | | | | | | | | | | | | | | | | | | | |
U.S. Treasury Bonds(T) | | 1 Day USOIS +4.5bps(T) | | |
| JPMorgan Chase
Bank, N.A. |
| | | | 2/22/22 | | | | | 13,010 | | | | $ | 38,221 | | | | $ | — | | | | $ | 38,221 | |
| | | | | | | | | | | | | | | | | | | | | | | | | | | | | | | | |
| (1) | On a long total return swap, the Portfolio receives payments for any positive return on the reference entity (makes payments for any negative return) and pays the financing rate. On a short total return swap, the Portfolio makes payments for any positive return on the reference entity (receives payments for any negative return) and receives the financing rate. |
| (2) | Upfront/recurring fees or commissions, as applicable, are included in the net unrealized appreciation (depreciation). |
Balances Reported in the Statement of Assets and Liabilities for OTC Swap Agreements:
| | | | | | | | |
| | | Premiums Paid | | Premiums Received | | Unrealized
Appreciation | | Unrealized
Depreciation |
OTC Swap Agreements | | $— | | $(866) | | $43,078 | | $— |
Summary of Collateral for Centrally Cleared/Exchange-traded Derivatives:
Cash and securities segregated as collateral, including pending settlement for closed positions, to cover requirements for centrally cleared/exchange-traded derivatives are listed by broker as follows:
| | | | | | | | | | |
Broker | | Cash and/or Foreign Currency | | Securities Market Value |
Citigroup Global Markets, Inc. | | | $ | — | | | | $ | 4,530,317 | |
Goldman Sachs & Co. LLC | | | | — | | | | | 1,919,785 | |
| | | | | | | | | | |
Total | | | $ | — | | | | $ | 6,450,102 | |
| | | | | | | | | | |
Fair Value Measurements:
Various inputs are used in determining the value of the Portfolio’s investments. These inputs are summarized in the three broad levels listed below.
Level 1—unadjusted quoted prices generally in active markets for identical securities.
Level 2—quoted prices for similar securities, interest rates and yield curves, prepayment speeds, foreign currency exchange rates and other observable inputs.
Level 3—unobservable inputs for securities valued in accordance with Board approved fair valuation procedures.
The following is a summary of the inputs used as of December 31, 2021 in valuing such portfolio securities:
| | | | | | | | | | | | |
| | | Level 1 | | | Level 2 | | | Level 3 | |
Investments in Securities | | | | | | | | | | | | |
Assets | | | | | | | | | | | | |
Long-Term Investments | | | | | | | | | | | | |
Common Stocks | | $ | 1,519,120,293 | | | $ | 35,702,280 | | | $ | — | |
Exchange-Traded Funds | | | 7,722,539 | | | | — | | | | — | |
Preferred Stocks | | | 1,416,300 | | | | 40,383 | | | | — | |
Asset-Backed Securities | | | | | | | | | | | | |
Automobiles | | | — | | | | 57,399,298 | | | | — | |
Collateralized Loan Obligations | | | — | | | | 100,990,241 | | | | — | |
Consumer Loans | | | — | | | | 7,341,850 | | | | — | |
Equipment | | | — | | | | 5,982,977 | | | | — | |
Home Equity Loans | | | — | | | | 22,724 | | | | — | |
Other | | | — | | | | 3,578,891 | | | | — | |
Residential Mortgage-Backed Securities | | | — | | | | 5,534,528 | | | | — | |
Student Loans | | | — | | | | 12,666,776 | | | | — | |
Commercial Mortgage-Backed Securities | | | — | | | | 178,457,740 | | | | — | |
Corporate Bonds | | | — | | | | 300,265,222 | | | | — | |
Municipal Bonds | | | — | | | | 15,982,626 | | | | — | |
Residential Mortgage-Backed Securities | | | — | | | | 60,585,284 | | | | 7,800,000 | |
SEE NOTES TO FINANCIAL STATEMENTS.
A40
| | | | | | |
| | |
| | PSF PGIM 50/50 BALANCED PORTFOLIO (CONTINUED) | | |
| | | | | | |
| |
| SCHEDULE OF INVESTMENTS | | as of December 31, 2021 |
| | | | | | | | | | | | | | | |
| | | Level 1 | | Level 2 | | Level 3 |
Investments in Securities (continued) | | | | | | | | | | | | | | | |
Assets (continued) | | | | | | | | | | | | | | | |
Long-Term Investments (continued) | | | | | | | | | | | | | | | |
Sovereign Bonds | | | $ | — | | | | $ | 20,272,378 | | | | $ | — | |
U.S. Government Agency Obligations | | | | — | | | | | 179,618,375 | | | | | — | |
U.S. Treasury Obligations | | | | — | | | | | 18,106,165 | | | | | — | |
Short-Term Investments | | | | | | | | | | | | | | | |
Affiliated Mutual Funds | | | | 398,931,560 | | | | | — | | | | | — | |
U.S. Treasury Obligation | | | | — | | | | | 1,919,785 | | | | | — | |
Options Purchased | | | | — | | | | | 25,402 | | | | | — | |
| | | | | | | | | | | | | | | |
Total | | | $ | 1,927,190,692 | | | | $ | 1,004,492,925 | | | | $ | 7,800,000 | |
| | | | | | | | | | | | | | | |
| | | |
Liabilities | | | | | | | | | | | | | | | |
Options Written | | | $ | — | | | | $ | (76,139 | ) | | | $ | (703 | ) |
| | | | | | | | | | | | | | | |
| | | |
Other Financial Instruments* | | | | | | | | | | | | | | | |
Assets | | | | | | | | | | | | | | | |
Futures Contracts | | | $ | 1,881,828 | | | | $ | — | | | | $ | — | |
OTC Forward Foreign Currency Exchange Contract | | | | — | | | | | 14,997 | | | | | — | |
OTC Credit Default Swap Agreements | | | | — | | | | | — | | | | | 3,991 | |
OTC Total Return Swap Agreement | | | | — | | | | | 38,221 | | | | | — | |
| | | | | | | | | | | | | | | |
Total | | | $ | 1,881,828 | | | | $ | 53,218 | | | | $ | 3,991 | |
| | | | | | | | | | | | | | | |
Liabilities | | | | | | | | | | | | | | | |
Futures Contracts | | | $ | (213,922 | ) | | | $ | — | | | | $ | — | |
OTC Forward Foreign Currency Exchange Contract | | | | — | | | | | (258,372 | ) | | | | — | |
Centrally Cleared Inflation Swap Agreements | | | | — | | | | | (2,112,809 | ) | | | | — | |
| | | | | | | | | | | | | | | |
Total | | | $ | (213,922 | ) | | | $ | (2,371,181 | ) | | | $ | — | |
| | | | | | | | | | | | | | | |
| * | Other financial instruments are derivative instruments not reflected in the Schedule of Investments, such as futures, forwards and centrally cleared swap contracts, which are recorded at the unrealized appreciation (depreciation) on the instrument, and OTC swap contracts which are recorded at fair value. |
Industry Classification:
The industry classification of investments and liabilities in excess of other assets shown as a percentage of net assets as of December 31, 2021 were as follows (unaudited):
| | | | |
Affiliated Mutual Funds (1.2% represents investments purchased with collateral from securities on loan) | | | 13.7 | % |
U.S. Government Agency Obligations | | | 6.2 | |
Commercial Mortgage-Backed Securities | | | 6.2 | |
Software | | | 5.1 | |
Banks | | | 5.0 | |
Technology Hardware, Storage & Peripherals | | | 3.8 | |
Collateralized Loan Obligations | | | 3.5 | |
Semiconductors & Semiconductor Equipment | | | 3.4 | |
Automobiles | | | 3.4 | |
Interactive Media & Services | | | 3.3 | |
Pharmaceuticals | | | 2.7 | |
Residential Mortgage-Backed Securities | | | 2.6 | |
IT Services | | | 2.4 | |
Internet & Direct Marketing Retail | | | 2.0 | |
Capital Markets | | | 1.6 | |
Health Care Equipment & Supplies | | | 1.6 | |
Health Care Providers & Services | | | 1.5 | |
Equity Real Estate Investment Trusts (REITs) | | | 1.4 | |
Oil, Gas & Consumable Fuels | | | 1.3 | |
Specialty Retail | | | 1.3 | |
Insurance | | | 1.2 | |
| | | | |
Chemicals | | | 1.1 | % |
Life Sciences Tools & Services | | | 1.1 | |
Media | | | 1.0 | |
Hotels, Restaurants & Leisure | | | 1.0 | |
Biotechnology | | | 1.0 | |
Beverages | | | 0.9 | |
Electric | | | 0.9 | |
Aerospace & Defense | | | 0.9 | |
Diversified Financial Services | | | 0.9 | |
Entertainment | | | 0.9 | |
Electric Utilities | | | 0.9 | |
Machinery | | | 0.8 | |
Food & Staples Retailing | | | 0.8 | |
Household Products | | | 0.7 | |
Sovereign Bonds | | | 0.7 | |
Telecommunications | | | 0.7 | |
U.S. Treasury Obligations | | | 0.7 | |
Pipelines | | | 0.6 | |
Municipal Bonds | | | 0.5 | |
Diversified Telecommunication Services | | | 0.5 | |
Industrial Conglomerates | | | 0.5 | |
Food Products | | | 0.5 | |
SEE NOTES TO FINANCIAL STATEMENTS.
A41
| | | | | | |
| | |
| | PSF PGIM 50/50 BALANCED PORTFOLIO (CONTINUED) | | |
| | | | | | |
| |
| SCHEDULE OF INVESTMENTS | | as of December 31, 2021 |
Industry Classification (continued):
| | | | |
Road & Rail | | | 0.5 | % |
Communications Equipment | | | 0.5 | |
Oil & Gas | | | 0.5 | |
Student Loans | | | 0.4 | |
Textiles, Apparel & Luxury Goods | | | 0.4 | |
Multi-Utilities | | | 0.4 | |
Auto Manufacturers | | | 0.4 | |
Electronic Equipment, Instruments & Components | | | 0.4 | |
Air Freight & Logistics | | | 0.4 | |
Tobacco | | | 0.3 | |
Building Products | | | 0.3 | |
Electrical Equipment | | | 0.3 | |
Consumer Finance | | | 0.3 | |
Retail | | | 0.3 | |
Exchange-Traded Funds | | | 0.3 | |
Airlines | | | 0.3 | |
Multiline Retail | | | 0.3 | |
Real Estate Investment Trusts (REITs) | | | 0.3 | |
Consumer Loans | | | 0.3 | |
Professional Services | | | 0.2 | |
Metals & Mining | | | 0.2 | |
Commercial Services & Supplies | | | 0.2 | |
Household Durables | | | 0.2 | |
Equipment | | | 0.2 | |
Containers & Packaging | | | 0.2 | |
Gas | | | 0.2 | |
Trading Companies & Distributors | | | 0.2 | |
Healthcare-Services | | | 0.1 | |
Personal Products | | | 0.1 | |
Foods | | | 0.1 | |
Semiconductors | | | 0.1 | |
Other | | | 0.1 | |
Miscellaneous Manufacturing | | | 0.1 | |
Packaging & Containers | | | 0.1 | |
Energy Equipment & Services | | | 0.1 | |
Commercial Services | | | 0.1 | |
| | | | |
Wireless Telecommunication Services | | | 0.1 | % |
Engineering & Construction | | | 0.1 | |
Auto Components | | | 0.1 | |
Agriculture | | | 0.1 | |
Construction Materials | | | 0.1 | |
Distributors | | | 0.1 | |
Housewares | | | 0.1 | |
Healthcare-Products | | | 0.1 | |
Transportation | | | 0.1 | |
Office/Business Equipment | | | 0.1 | |
Real Estate Management & Development | | | 0.1 | |
Home Builders | | | 0.1 | |
Water Utilities | | | 0.0 | * |
Health Care Technology | | | 0.0 | * |
Building Materials | | | 0.0 | * |
Lodging | | | 0.0 | * |
Construction & Engineering | | | 0.0 | * |
Marine | | | 0.0 | * |
Independent Power & Renewable Electricity Producers | | | 0.0 | * |
Multi-National | | | 0.0 | * |
Gas Utilities | | | 0.0 | * |
Apparel | | | 0.0 | * |
Leisure Products | | | 0.0 | * |
Forest Products & Paper | | | 0.0 | * |
Options Purchased | | | 0.0 | * |
Home Equity Loans | | | 0.0 | * |
Paper & Forest Products | | | 0.0 | * |
Diversified Consumer Services | | | 0.0 | * |
| | | | |
| | | 101.4 | |
Options Written | | | (0.0 | )* |
Liabilities in excess of other assets | | | (1.4 | ) |
| | | | |
| | | 100.0 | % |
| | | | |
Effects of Derivative Instruments on the Financial Statements and Primary Underlying Risk Exposure:
The Portfolio invested in derivative instruments during the reporting period. The primary types of risk associated with these derivative instruments are credit contracts risk, equity contracts risk, foreign exchange contracts risk and interest rate contracts risk. See the Notes to Financial Statements for additional detail regarding these derivative instruments and their risks. The effect of such derivative instruments on the Portfolio’s financial position and financial performance as reflected in the Statement of Assets and Liabilities and Statement of Operations is presented in the summary below.
Fair values of derivative instruments as of December 31, 2021 as presented in the Statement of Assets and Liabilities:
| | | | | | | | | | | | |
Derivatives not accounted for as hedging instruments, carried at fair value | | Asset Derivatives | | | Liability Derivatives | |
| | Statement of Assets and
Liabilities Location | | Fair
Value | | | Statement of Assets and
Liabilities Location | | Fair
Value | |
Credit contracts | | — | | $ | — | | | Premiums received for OTC swap agreements | | $ | 866 | |
Credit contracts | | Unaffiliated investments | | | 25,402 | | | Options written outstanding, at value | | | 76,842 | |
Credit contracts | | Unrealized appreciation on OTC swap agreements | | | 4,857 | | | — | | | — | |
Equity contracts | | Due from/to broker-variation margin futures | | | 359,110 | * | | — | | | — | |
SEE NOTES TO FINANCIAL STATEMENTS.
A42
| | | | | | |
| | |
| | PSF PGIM 50/50 BALANCED PORTFOLIO (CONTINUED) | | |
| | | | | | |
| |
| SCHEDULE OF INVESTMENTS | | as of December 31, 2021 |
| | | | | | | | | | | | |
| | | Asset Derivatives | | | Liability Derivatives | |
Derivatives not accounted for as
hedging instruments, carried at fair
value | | Statement of
Assets and Liabilities Location | | Fair
Value | | | Statement of
Assets and Liabilities Location | | Fair
Value | |
Foreign exchange contracts | | Unrealized appreciation on OTC forward foreign currency exchange contracts | | $ | 14,997 | | | Unrealized depreciation on OTC forward foreign currency exchange contracts | | $ | 258,372 | |
Interest rate contracts | | Due from/to broker-variation margin futures | | | 1,522,718 | * | | Due from/to broker-variation margin futures | | | 213,922 | * |
Interest rate contracts | | — | | | — | | | Due from/to broker-variation margin swaps | | | 2,112,809 | * |
Interest rate contracts | | Unrealized appreciation on OTC swap agreements | | | 38,221 | | | — | | | — | |
| | | | | | | | | | | | |
| | | | $ | 1,965,305 | | | | | $ | 2,662,811 | |
| | | | | | | | | | | | |
| * | Includes cumulative appreciation (depreciation) as reported in the schedule of open futures and centrally cleared swap contracts. Only unsettled variation margin receivable (payable) is reported within the Statement of Assets and Liabilities. |
The effects of derivative instruments on the Statement of Operations for the year ended December 31, 2021 are as follows:
| | | | | | | | | | | | | | | | | | | | |
Amount of Realized Gain (Loss) on Derivatives Recognized in Income | |
Derivatives not accounted for as hedging instruments, carried at fair value | | Options
Purchased(1) | | | Options
Written | | | Futures | | | Forward
Currency
Contracts | | | Swaps | |
Credit contracts | | $ | — | | | $ | — | | | $ | — | | | $ | — | | | $ | 25,361 | |
Equity contracts | | | — | | | | — | | | | 9,915,585 | | | | — | | | | — | |
Foreign exchange contracts | | | — | | | | — | | | | — | | | | 1,538,177 | | | | — | |
Interest rate contracts | | | 300,714 | | | | (131,928 | ) | | | (6,491,343 | ) | | | — | | | | 67,476 | |
| | | | | | | | | | | | | | | | | | | | |
Total | | $ | 300,714 | | | $ | (131,928 | ) | | $ | 3,424,242 | | | $ | 1,538,177 | | | $ | 92,837 | |
| | | | | | | | | | | | | | | | | | | | |
| (1) | Included in net realized gain (loss) on investment transactions in the Statement of Operations. |
| | | | | | | | | | | | | | | | | | | | |
Change in Unrealized Appreciation (Depreciation) on Derivatives Recognized in Income | |
Derivatives not accounted for as hedging instruments, carried at fair value | | Options
Purchased(2) | | | Options
Written | | | Futures | | | Forward
Currency
Exchange
Contracts | | | Swaps | |
Credit contracts | | $ | (33,287 | ) | | $ | (16,981 | ) | | $ | — | | | $ | — | | | $ | 11,079 | |
Equity contracts | | | — | | | | — | | | | (338,354 | ) | | | — | | | | — | |
Foreign exchange contracts | | | — | | | | — | | | | — | | | | 44,551 | | | | — | |
Interest rate contracts | | | — | | | | — | | | | 1,931,547 | | | | — | | | | (1,772,319 | ) |
| | | | | | | | | | | | | | | | | | | | |
Total | | $ | (33,287 | ) | | $ | (16,981 | ) | | $ | 1,593,193 | | | $ | 44,551 | | | $ | (1,761,240 | ) |
| | | | | | | | | | | | | | | | | | | | |
| (2) | Included in net change in unrealized appreciation (depreciation) on investments in the Statement of Operations. |
For the year ended December 31, 2021, the Portfolio’s average volume of derivative activities is as follows:
| | | | | | | | |
Options
Purchased(1) | | Options
Written(2) | | Futures
Contracts—
Long
Positions(2) | | Futures
Contracts—
Short
Positions(2) | | Forward Foreign
Currency Exchange
Contracts—
Purchased(3) |
| $34,398 | | $19,648,200 | | $231,230,664 | | $29,492,237 | | $11,940,700 |
SEE NOTES TO FINANCIAL STATEMENTS.
A43
| | | | | | |
| | |
| | PSF PGIM 50/50 BALANCED PORTFOLIO (CONTINUED) | | |
| | | | | | |
| |
| SCHEDULE OF INVESTMENTS | | as of December 31, 2021 |
| | | | |
Forward Foreign
Currency Exchange
Contracts—Sold(3) | | | | Interest Rate
Swap
Agreements(2) |
| $33,373,939 | | | | $7,057,307 |
| | | | | | | | |
Credit Default
Swap Agreements—
Sell Protection(2) | | | | Total Return
Swap
Agreements(2) | | | | Inflation Swap
Agreements(2) |
| $8,644,000 | | | | $7,004,928 | | | | $24,500,000 |
| (2) | Notional Amount in USD. |
| (3) | Value at Settlement Date. |
Average volume is based on average quarter end balances as noted for the year ended December 31, 2021.
Financial Instruments/Transactions—Summary of Offsetting and Netting Arrangements:
The Portfolio invested in OTC derivatives and entered into financial instruments/transactions during the reporting period that are either offset in accordance with current requirements or are subject to enforceable master netting arrangements or similar agreements that permit offsetting. The information about offsetting and related netting arrangements for OTC derivatives and financial instruments/transactions where the legal right to set-off exists is presented in the summary below.
Offsetting of financial instrument/transaction assets and liabilities:
| | | | | | | | | | | | |
Description | | Gross Market
Value of
Recognized
Assets/(Liabilities) | | | Collateral
Pledged/(Received)(2) | | | Net
Amount | |
Securities on Loan | | $ | 34,821,643 | | | $ | (34,821,643 | ) | | $ | — | |
| | | | | | | | | | | | |
Offsetting of OTC derivative assets and liabilities:
| | | | | | | | | | | | | | | | | | | | |
Counterparty | | Gross Amounts of
Recognized
Assets(1) | | | Gross Amounts of
Recognized
Liabilities(1) | | | Net Amounts of
Recognized
Assets/(Liabilities) | | | Collateral
Pledged/(Received)(2) | | | Net Amount | |
BNP Paribas S.A. | | $ | 5,288 | | | $ | (274,175 | ) | | $ | (268,887 | ) | | $ | — | | | $ | (268,887 | ) |
Goldman Sachs International | | | 4,857 | | | | (1,569 | ) | | | 3,288 | | | | — | | | | 3,288 | |
JPMorgan Chase Bank, N.A. | | | 38,221 | | | | — | | | | 38,221 | | | | — | | | | 38,221 | |
Morgan Stanley & Co. International PLC | | | 35,111 | | | | (60,336 | ) | | | (25,225 | ) | | | — | | | | (25,225 | ) |
| | | | | | | | | | | | | | | | | | | | |
| | $ | 83,477 | | | $ | (336,080 | ) | | $ | (252,603 | ) | | $ | — | | | $ | (252,603 | ) |
| | | | | | | | | | | | | | | | | | | | |
| (1) | Includes unrealized appreciation/(depreciation) on swaps and forwards, premiums paid/(received) on swap agreements and market value of purchased and written options, as represented on the Statement of Assets and Liabilities. |
| (2) | Collateral amount disclosed by the Portfolio is limited to the market value of financial instruments/transactions and the Portfolio’s OTC derivative exposure by counterparty. |
SEE NOTES TO FINANCIAL STATEMENTS.
A44
| | | | | | |
| | |
| | PSF PGIM 50/50 BALANCED PORTFOLIO (CONTINUED) | | |
STATEMENT OF ASSETS AND LIABILITIES
as of December 31, 2021
| | | | |
| |
| ASSETS | | | | |
Investments at value, including securities on loan of $34,821,643: | | | | |
Unaffiliated investments (cost $1,298,343,991) | | $ | 2,540,552,057 | |
Affiliated investments (cost $398,853,722) | | | 398,931,560 | |
Foreign currency, at value (cost $618,442) | | | 613,910 | |
Cash | | | 605,017 | |
Dividends and interest receivable | | | 5,689,454 | |
Receivable for investments sold | | | 1,532,520 | |
Due from broker-variation margin futures | | | 650,971 | |
Tax reclaim receivable | | | 279,424 | |
Receivable for Portfolio shares sold | | | 172,263 | |
Unrealized appreciation on OTC swap agreements | | | 43,078 | |
Due from broker-variation margin swaps | | | 25,470 | |
Unrealized appreciation on OTC forward foreign currency exchange contracts | | | 14,997 | |
Receivable from affiliate | | | 1,278 | |
Prepaid expenses | | | 20,794 | |
| | | | |
Total Assets | | | 2,949,132,793 | |
| | | | |
| |
| LIABILITIES | | | | |
Payable to broker for collateral for securities on loan | | | 35,452,395 | |
Payable for investments purchased | | | 12,337,753 | |
Management fee payable | | | 1,341,588 | |
Accrued expenses and other liabilities | | | 378,974 | |
Unrealized depreciation on OTC forward foreign currency exchange contracts | | | 258,372 | |
Due to broker-variation margin futures | | | 85,640 | |
Payable to affiliate | | | 80,716 | |
Options written outstanding, at value (premiums received $59,861) | | | 76,842 | |
Payable for Portfolio shares purchased | | | 74,099 | |
Trustees’ fees payable | | | 1,470 | |
Affiliated transfer agent fee payable | | | 980 | |
Premiums received for OTC swap agreements | | | 866 | |
Distribution fee payable | | | 530 | |
| | | | |
Total Liabilities | | | 50,090,225 | |
| | | | |
NET ASSETS | | $ | 2,899,042,568 | |
| | | | |
Net assets were comprised of: | | | | |
Partners’ Equity | | $ | 2,899,042,568 | |
| | | | |
| |
| Class I: | | | | |
Net asset value and redemption price per share, $2,896,378,610 / 73,017,679 outstanding shares of beneficial interest | | $ | 39.67 | |
| | | | |
| |
| Class III: | | | | |
Net asset value and redemption price per share, $2,663,958 / 67,274 outstanding shares of beneficial interest | | $ | 39.60 | |
| | | | |
STATEMENT OF OPERATIONS
Year Ended December 31, 2021
| | | | |
| |
| NET INVESTMENT INCOME (LOSS) | | | | |
| |
| INCOME | | | | |
Interest income (net of $474 foreign withholding tax) | | $ | 23,987,229 | |
Unaffiliated dividend income (net of $153,100 foreign withholding tax, of which $23,037 is reimbursable by an affiliate) | | | 21,206,861 | |
Affiliated dividend income | | | 484,263 | |
Income from securities lending, net (including affiliated income of $33,122) | | | 37,995 | |
| | | | |
Total income | | | 45,716,348 | |
| | | | |
| |
| EXPENSES | | | | |
Management fee | | | 15,404,639 | |
Distribution fee—Class III | | | 1,898 | |
Custodian and accounting fees | | | 268,216 | |
Shareholders’ reports | | | 70,383 | |
Audit fee | | | 51,200 | |
Trustees’ fees | | | 45,190 | |
Legal fees and expenses | | | 31,643 | |
Transfer agent’s fees and expenses (including affiliated expense of $5,882) | | | 10,682 | |
Miscellaneous | | | 72,894 | |
| | | | |
Total expenses | | | 15,956,745 | |
| | | | |
NET INVESTMENT INCOME (LOSS) | | | 29,759,603 | |
| | | | |
| |
| REALIZED AND UNREALIZED GAIN (LOSS) ON INVESTMENT AND FOREIGN CURRENCY TRANSACTIONS | | | | |
Net realized gain (loss) on: | | | | |
Investment transactions (including affiliated of $12,763) | | | 178,084,110 | |
Futures transactions | | | 3,424,242 | |
Forward currency contract transactions | | | 1,538,177 | |
Options written transactions | | | (131,928 | ) |
Swap agreements transactions | | | 92,837 | |
Foreign currency transactions | | | 264,170 | |
| | | | |
| | | 183,271,608 | |
| | | | |
Net change in unrealized appreciation (depreciation) on: | | | | |
Investments (including affiliated of $(23,300)) | | | 138,805,337 | |
Futures | | | 1,593,193 | |
Forward currency contracts | | | 44,551 | |
Options written | | | (16,981 | ) |
Swap agreements | | | (1,761,240 | ) |
Foreign currencies | | | (37,336 | ) |
| | | | |
| | | 138,627,524 | |
| | | | |
| |
NET GAIN (LOSS) ON INVESTMENT AND FOREIGN CURRENCY TRANSACTIONS | | | 321,899,132 | |
| | | | |
| |
NET INCREASE (DECREASE) IN NET ASSETS RESULTING FROM OPERATIONS | | $ | 351,658,735 | |
| | | | |
STATEMENTS OF CHANGES IN NET ASSETS
| | | | | | | | |
| | | Year Ended
December 31, 2021 | | | Year Ended
December 31, 2020 | |
| | |
| INCREASE (DECREASE) IN NET ASSETS | | | | | | | | |
| | |
| OPERATIONS | | | | | | | | |
Net investment income (loss) | | $ | 29,759,603 | | | $ | 40,139,745 | |
Net realized gain (loss) on investment and foreign currency transactions | | | 183,271,608 | | | | 110,065,845 | |
Net change in unrealized appreciation (depreciation) on investments and foreign currencies | | | 138,627,524 | | | | 129,736,806 | |
| | | | | | | | |
NET INCREASE (DECREASE) IN NET ASSETS RESULTING FROM OPERATIONS | | | 351,658,735 | | | | 279,942,396 | |
| | | | | | | | |
| | |
| PORTFOLIO SHARE TRANSACTIONS | | | | | | | | |
Portfolio shares sold | | | 16,716,926 | | | | 12,730,292 | |
Portfolio shares purchased | | | (179,291,386 | ) | | | (179,703,549 | ) |
| | | | | | | | |
NET INCREASE (DECREASE) IN NET ASSETS FROM PORTFOLIO SHARE TRANSACTIONS | | | (162,574,460 | ) | | | (166,973,257 | ) |
| | | | | | | | |
TOTAL INCREASE (DECREASE) | | | 189,084,275 | | | | 112,969,139 | |
| | |
| NET ASSETS: | | | | | | | | |
Beginning of year | | | 2,709,958,293 | | | | 2,596,989,154 | |
| | | | | | | | |
End of year | | $ | 2,899,042,568 | | | $ | 2,709,958,293 | |
| | | | | | | | |
SEE NOTES TO FINANCIAL STATEMENTS.
A45
| | | | | | |
| | |
| | PSF PGIM FLEXIBLE MANAGED PORTFOLIO | | |
| | | | | | |
| |
| SCHEDULE OF INVESTMENTS | | as of December 31, 2021 |
| | | | | | | | |
| | | Shares | | | Value | |
LONG-TERM INVESTMENTS — 93.9% | |
COMMON STOCKS — 65.9% | |
Aerospace & Defense — 1.3% | |
Airbus SE (France)* | | | 1,708 | | | $ | 218,776 | |
General Dynamics Corp. | | | 102,100 | | | | 21,284,787 | |
Lockheed Martin Corp. | | | 55,700 | | | | 19,796,337 | |
Northrop Grumman Corp. | | | 17,600 | | | | 6,812,432 | |
Raytheon Technologies Corp. | | | 169,000 | | | | 14,544,140 | |
| | | | | | | | |
| | |
| | | | | | | 62,656,472 | |
| | | | | | | | |
Air Freight & Logistics — 0.3% | |
Deutsche Post AG (Germany) | | | 7,680 | | | | 492,737 | |
DSV A/S (Denmark) | | | 596 | | | | 139,263 | |
FedEx Corp. | | | 47,400 | | | | 12,259,536 | |
| | | | | | | | |
| | |
| | | | | | | 12,891,536 | |
| | | | | | | | |
Auto Components — 0.0% | |
Aisin Corp. (Japan) | | | 400 | | | | 15,356 | |
Bridgestone Corp. (Japan) | | | 5,300 | | | | 228,094 | |
Cie Generale des Etablissements Michelin SCA (France) | | | 492 | | | | 80,684 | |
Denso Corp. (Japan) | | | 1,300 | | | | 107,726 | |
| | | | | | | | |
| | |
| | | | | | | 431,860 | |
| | | | | | | | |
Automobiles — 1.6% | |
Bayerische Motoren Werke AG (Germany) | | | 931 | | | | 93,331 | |
Daimler AG (Germany) | | | 3,973 | | | | 305,252 | |
Ferrari NV (Italy) | | | 363 | | | | 94,157 | |
Ford Motor Co. | | | 208,900 | | | | 4,338,853 | |
Isuzu Motors Ltd. (Japan) | | | 24,800 | | | | 307,901 | |
Mazda Motor Corp. (Japan)* | | | 1,700 | | | | 13,051 | |
Stellantis NV | | | 2,982 | | | | 56,170 | |
Suzuki Motor Corp. (Japan) | | | 1,100 | | | | 42,344 | |
Tesla, Inc.* | | | 68,100 | | | | 71,966,718 | |
Thor Industries, Inc.(a) | | | 24,600 | | | | 2,552,742 | |
Toyota Motor Corp. (Japan) | | | 11,500 | | | | 211,098 | |
Volkswagen AG (Germany) | | | 88 | | | | 25,887 | |
| | | | | | | | |
| | |
| | | | | | | 80,007,504 | |
| | | | | | | | |
Banks — 2.2% | |
Australia & New Zealand Banking Group Ltd. (Australia) | | | 11,589 | | | | 231,958 | |
Bank Hapoalim BM (Israel) | | | 32,484 | | | | 334,466 | |
Bank Leumi Le-Israel BM (Israel) | | | 40,523 | | | | 435,997 | |
Bank of America Corp. | | | 304,200 | | | | 13,533,858 | |
Barclays PLC (United Kingdom) | | | 48,858 | | | | 123,687 | |
BNP Paribas SA (France) | | | 5,583 | | | | 386,158 | |
Citigroup, Inc. | | | 218,850 | | | | 13,216,351 | |
Commonwealth Bank of Australia (Australia) | | | 2,885 | | | | 211,925 | |
Credit Agricole SA (France) | | | 3,355 | | | | 47,933 | |
DBS Group Holdings Ltd. (Singapore) | | | 13,500 | | | | 327,073 | |
DNB Bank ASA (Norway) | | | 2,736 | | | | 62,607 | |
ING Groep NV (Netherlands) | | | 11,115 | | | | 155,362 | |
Israel Discount Bank Ltd. (Israel) (Class A Stock) | | | 3,230 | | | | 21,755 | |
Japan Post Bank Co. Ltd. (Japan) | | | 1,000 | | | | 9,164 | |
JPMorgan Chase & Co. | | | 163,894 | | | | 25,952,615 | |
KBC Group NV (Belgium) | | | 744 | | | | 64,302 | |
| | | | | | | | |
| | | Shares | | | Value | |
COMMON STOCKS (continued) | |
Banks (cont’d.) | |
Lloyds Banking Group PLC (United Kingdom) | | | 651,173 | | | $ | 421,665 | |
Mediobanca Banca di Credito Finanziario SpA (Italy) | | | 27,671 | | | | 317,914 | |
Mitsubishi UFJ Financial Group, Inc. (Japan) | | | 89,800 | | | | 487,045 | |
Mizuho Financial Group, Inc. (Japan) | | | 7,140 | | | | 90,801 | |
National Australia Bank Ltd. (Australia) | | | 8,326 | | | | 174,643 | |
Nordea Bank Abp (Finland) | | | 9,366 | | | | 114,428 | |
Oversea-Chinese Banking Corp. Ltd. (Singapore) | | | 6,200 | | | | 52,474 | |
Popular, Inc. (Puerto Rico) | | | 17,600 | | | | 1,443,904 | |
Raiffeisen Bank International AG (Austria) | | | 429 | | | | 12,759 | |
Regions Financial Corp. | | | 342,700 | | | | 7,470,860 | |
Signature Bank | | | 10,000 | | | | 3,234,700 | |
Skandinaviska Enskilda Banken AB (Sweden) (Class A Stock) | | | 11,835 | | | | 164,479 | |
Sumitomo Mitsui Financial Group, Inc. (Japan) | | | 2,200 | | | | 75,289 | |
Svenska Handelsbanken AB (Sweden) (Class A Stock) | | | 4,482 | | | | 48,508 | |
Swedbank AB (Sweden) (Class A Stock) | | | 2,652 | | | | 53,349 | |
U.S. Bancorp | | | 149,900 | | | | 8,419,883 | |
United Overseas Bank Ltd. (Singapore) | | | 3,400 | | | | 67,854 | |
Wells Fargo & Co. | | | 634,900 | | | | 30,462,502 | |
| | | | | | | | |
| | |
| | | | | | | 108,228,268 | |
| | | | | | | | |
Beverages — 1.4% | |
Carlsberg A/S (Denmark) (Class B Stock) | | | 275 | | | | 47,534 | |
Coca-Cola Co. (The) | | | 630,000 | | | | 37,302,300 | |
Coca-Cola HBC AG (Russia)* | | | 5,691 | | | | 196,771 | |
Diageo PLC (United Kingdom) | | | 3,465 | | | | 189,256 | |
PepsiCo, Inc. | | | 191,700 | | | | 33,300,207 | |
| | | | | | | | |
| | |
| | | | | | | 71,036,068 | |
| | | | | | | | |
Biotechnology — 1.0% | |
AbbVie, Inc. | | | 151,300 | | | | 20,486,020 | |
Amgen, Inc. | | | 16,800 | | | | 3,779,496 | |
Gilead Sciences, Inc. | | | 68,850 | | | | 4,999,198 | |
Regeneron Pharmaceuticals, Inc.* | | | 15,200 | | | | 9,599,104 | |
Vertex Pharmaceuticals, Inc.* | | | 38,400 | | | | 8,432,640 | |
| | | | | | | | |
| | |
| | | | | | | 47,296,458 | |
| | | | | | | | |
Building Products — 0.3% | |
Carlisle Cos., Inc. | | | 26,000 | | | | 6,451,120 | |
Carrier Global Corp. | | | 101,100 | | | | 5,483,664 | |
Cie de Saint-Gobain (France) | | | 6,230 | | | | 438,935 | |
Geberit AG (Switzerland) | | | 492 | | | | 401,675 | |
Johnson Controls International PLC | | | 30,400 | | | | 2,471,824 | |
Kingspan Group PLC (Ireland) | | | 406 | | | | 48,513 | |
Lixil Corp. (Japan) | | | 700 | | | | 18,660 | |
UFP Industries, Inc. | | | 10,400 | | | | 956,904 | |
Xinyi Glass Holdings Ltd. (Hong Kong) | | | 101,000 | | | | 252,429 | |
| | | | | | | | |
| | |
| | | | | | | 16,523,724 | |
| | | | | | | | |
SEE NOTES TO FINANCIAL STATEMENTS.
A46
| | | | | | |
| | |
| | PSF PGIM FLEXIBLE MANAGED PORTFOLIO (CONTINUED) | | |
| | | | | | |
| |
| SCHEDULE OF INVESTMENTS | | as of December 31, 2021 |
| | | | | | | | |
| | | Shares | | | Value | |
COMMON STOCKS (continued) | |
Capital Markets — 2.0% | |
3i Group PLC (United Kingdom) | | | 18,384 | | | $ | 359,980 | |
abrdn PLC (United Kingdom) | | | 15,905 | | | | 51,831 | |
Daiwa Securities Group, Inc. (Japan) | | | 55,800 | | | | 314,583 | |
EQT AB (Sweden) | | | 851 | | | | 46,524 | |
Goldman Sachs Group, Inc. (The) | | | 72,800 | | | | 27,849,640 | |
Macquarie Group Ltd. (Australia) | | | 3,002 | | | | 447,789 | |
Morgan Stanley | | | 257,400 | | | | 25,266,384 | |
Northern Trust Corp. | | | 97,000 | | | | 11,602,170 | |
Partners Group Holding AG (Switzerland) | | | 65 | | | | 107,213 | |
Raymond James Financial, Inc. | | | 112,500 | | | | 11,295,000 | |
SBI Holdings, Inc. (Japan) | | | 700 | | | | 19,055 | |
State Street Corp. | | | 207,300 | | | | 19,278,900 | |
Stifel Financial Corp. | | | 61,500 | | | | 4,330,830 | |
UBS Group AG (Switzerland) | | | 28,571 | | | | 511,778 | |
| | | | | | | | |
| | |
| | | | | | | 101,481,677 | |
| | | | | | | | |
Chemicals — 1.6% | |
Arkema SA (France) | | | 182 | | | | 25,676 | |
Asahi Kasei Corp. (Japan) | | | 3,600 | | | | 33,843 | |
CF Industries Holdings, Inc. | | | 280,200 | | | | 19,832,556 | |
Covestro AG (Germany), 144A | | | 5,618 | | | | 344,623 | |
Dow, Inc. | | | 349,000 | | | | 19,795,280 | |
DuPont de Nemours, Inc. | | | 257,000 | | | | 20,760,460 | |
Evonik Industries AG (Germany) | | | 616 | | | | 19,959 | |
ICL Group Ltd. (Israel) | | | 1,974 | | | | 18,947 | |
LyondellBasell Industries NV (Class A Stock) | | | 49,000 | | | | 4,519,270 | |
Mitsubishi Chemical Holdings Corp. (Japan) | | | 3,600 | | | | 26,729 | |
Mitsui Chemicals, Inc. (Japan) | | | 10,800 | | | | 290,931 | |
Nippon Sanso Holdings Corp. (Japan) | | | 500 | | | | 10,932 | |
Nitto Denko Corp. (Japan) | | | 500 | | | | 38,583 | |
Shin-Etsu Chemical Co. Ltd. (Japan) | | | 500 | | | | 86,510 | |
Solvay SA (Belgium) | | | 217 | | | | 25,202 | |
Sumitomo Chemical Co. Ltd. (Japan) | | | 4,400 | | | | 20,745 | |
Tosoh Corp. (Japan) | | | 14,600 | | | | 217,104 | |
Westlake Chemical Corp. | | | 150,000 | | | | 14,569,500 | |
Yara International ASA (Brazil) | | | 475 | | | | 23,965 | |
| | | | | | | | |
| | |
| | | | | | | 80,660,815 | |
| | | | | | | | |
Commercial Services & Supplies — 0.1% | |
Clean Harbors, Inc.* | | | 33,200 | | | | 3,312,364 | |
Rentokil Initial PLC (United Kingdom) | | | 5,306 | | | | 41,993 | |
Securitas AB (Sweden) (Class B Stock) | | | 918 | | | | 12,631 | |
Sohgo Security Services Co. Ltd. (Japan) | | | 300 | | | | 11,924 | |
TOPPAN, Inc. (Japan) | | | 800 | | | | 14,996 | |
| | | | | | | | |
| | |
| | | | | | | 3,393,908 | |
| | | | | | | | |
Communications Equipment — 0.3% | |
Cisco Systems, Inc. | | | 193,800 | | | | 12,281,106 | |
Motorola Solutions, Inc. | | | 8,000 | | | | 2,173,600 | |
Nokia OYJ (Finland)* | | | 15,485 | | | | 97,614 | |
Ubiquiti, Inc. | | | 3,300 | | | | 1,012,110 | |
| | | | | | | | |
| | |
| | | | | | | 15,564,430 | |
| | | | | | | | |
| | | | | | | | |
| | | Shares | | | Value | |
COMMON STOCKS (continued) | |
Construction & Engineering — 0.1% | |
Eiffage SA (France) | | | 250 | | | $ | 25,758 | |
EMCOR Group, Inc. | | | 53,500 | | | | 6,815,365 | |
Skanska AB (Sweden) (Class B Stock) | | | 1,001 | | | | 25,918 | |
Vinci SA (France) | | | 1,512 | | | | 159,739 | |
| | | | | | | | |
| | |
| | | | | | | 7,026,780 | |
| | | | | | | | |
Construction Materials — 0.0% | |
Eagle Materials, Inc. | | | 7,800 | | | | 1,298,388 | |
HeidelbergCement AG (Germany) | | | 2,767 | | | | 187,627 | |
| | | | | | | | |
| | |
| | | | | | | 1,486,015 | |
| | | | | | | | |
Consumer Finance — 0.6% | |
Capital One Financial Corp. | | | 144,700 | | | | 20,994,523 | |
OneMain Holdings, Inc. | | | 141,100 | | | | 7,060,644 | |
| | | | | | | | |
| | |
| | | | | | | 28,055,167 | |
| | | | | | | | |
Containers & Packaging — 0.0% | |
Smurfit Kappa Group PLC (Ireland) | | | 6,275 | | | | 345,938 | |
| | | | | | | | |
Distributors — 0.4% | |
Genuine Parts Co. | | | 83,000 | | | | 11,636,600 | |
LKQ Corp. | | | 178,700 | | | | 10,727,361 | |
| | | | | | | | |
| | |
| | | | | | | 22,363,961 | |
| | | | | | | | |
Diversified Consumer Services — 0.0% | |
IDP Education Ltd. (Australia) | | | 608 | | | | 15,326 | |
| | | | | | | | |
Diversified Financial Services — 0.6% | |
Berkshire Hathaway, Inc. (Class B Stock)* | | | 92,350 | | | | 27,612,650 | |
EXOR NV (Netherlands) | | | 310 | | | | 27,917 | |
Industrivarden AB (Sweden) (Class A Stock) | | | 380 | | | | 12,095 | |
Investor AB (Sweden) (Class A Stock) | | | 1,443 | | | | 38,138 | |
Investor AB (Sweden) (Class B Stock) | | | 5,289 | | | | 132,978 | |
| | | | | | | | |
| | |
| | | | | | | 27,823,778 | |
| | | | | | | | |
Diversified Telecommunication Services — 0.9% | |
AT&T, Inc. | | | 505,300 | | | | 12,430,380 | |
Deutsche Telekom AG (Germany) | | | 9,603 | | | | 177,798 | |
Elisa OYJ (Finland) | | | 405 | | | | 24,931 | |
Koninklijke KPN NV (Netherlands) | | | 60,727 | | | | 188,761 | |
Nippon Telegraph & Telephone Corp. (Japan) | | | 7,600 | | | | 208,190 | |
Telefonica Deutschland Holding AG (Germany) | | | 103,776 | | | | 288,316 | |
Telefonica SA (Spain) | | | 22,499 | | | | 98,485 | |
United Internet AG (Germany) | | | 322 | | | | 12,743 | |
Verizon Communications, Inc. | | | 626,788 | | | | 32,567,905 | |
| | | | | | | | |
| | |
| | | | | | | 45,997,509 | |
| | | | | | | | |
Electric Utilities — 0.6% | |
Chubu Electric Power Co., Inc. (Japan) | | | 1,700 | | | | 17,963 | |
CK Infrastructure Holdings Ltd. (Hong Kong) | | | 2,000 | | | | 12,744 | |
Duke Energy Corp. | | | 9,600 | | | | 1,007,040 | |
Electricite de France SA (France) | | | 1,326 | | | | 15,579 | |
Endesa SA (Spain) | | | 14,006 | | | | 321,817 | |
Enel SpA (Italy) | | | 22,623 | | | | 181,152 | |
Entergy Corp. | | | 19,900 | | | | 2,241,735 | |
SEE NOTES TO FINANCIAL STATEMENTS.
A47
| | | | | | |
| | |
| | PSF PGIM FLEXIBLE MANAGED PORTFOLIO (CONTINUED) | | |
| | | | | | |
| |
| SCHEDULE OF INVESTMENTS | | as of December 31, 2021 |
| | | | | | | | |
| | | Shares | | | Value | |
COMMON STOCKS (continued) | |
Electric Utilities (cont’d.) | |
Exelon Corp. | | | 386,500 | | | $ | 22,324,240 | |
Fortum OYJ (Finland) | | | 1,266 | | | | 38,810 | |
Iberdrola SA (Spain) | | | 22,677 | | | | 268,347 | |
Power Assets Holdings Ltd. (Hong Kong) | | | 16,500 | | | | 102,841 | |
PPL Corp. | | | 35,900 | | | | 1,079,154 | |
Red Electrica Corp. SA (Spain) | | | 10,693 | | | | 231,851 | |
Southern Co. (The) | | | 16,000 | | | | 1,097,280 | |
SSE PLC (United Kingdom) | | | 9,338 | | | | 208,237 | |
| | | | | | | | |
| | |
| | | | | | | 29,148,790 | |
| | | | | | | | |
Electrical Equipment — 0.9% | |
Acuity Brands, Inc. | | | 14,900 | | | | 3,154,628 | |
AMETEK, Inc. | | | 36,000 | | | | 5,293,440 | |
Atkore, Inc.* | | | 95,650 | | | | 10,635,324 | |
Emerson Electric Co. | | | 211,500 | | | | 19,663,155 | |
Mitsubishi Electric Corp. (Japan) | | | 4,900 | | | | 62,266 | |
Regal Rexnord Corp. | | | 18,800 | | | | 3,199,384 | |
Schneider Electric SE | | | 1,538 | | | | 301,872 | |
| | | | | | | | |
| | |
| | | | | | | 42,310,069 | |
| | | | | | | | |
Electronic Equipment, Instruments & Components — 0.5% | |
CDW Corp. | | | 57,900 | | | | 11,856,762 | |
Keyence Corp. (Japan) | | | 700 | | | | 439,452 | |
TD SYNNEX Corp. | | | 14,900 | | | | 1,703,964 | |
Vontier Corp. | | | 30,700 | | | | 943,411 | |
Zebra Technologies Corp. (Class A Stock)* | | | 13,600 | | | | 8,094,720 | |
| | | | | | | | |
| | |
| | | | | | | 23,038,309 | |
| | | | | | | | |
Energy Equipment & Services — 0.2% | |
Halliburton Co. | | | 417,200 | | | | 9,541,364 | |
| | | | | | | | |
Entertainment — 1.4% | |
Activision Blizzard, Inc. | | | 336,100 | | | | 22,360,733 | |
Electronic Arts, Inc. | | | 41,800 | | | | 5,513,420 | |
Konami Holdings Corp. (Japan) | | | 300 | | | | 14,352 | |
Netflix, Inc.* | | | 61,800 | | | | 37,230,792 | |
Nintendo Co. Ltd. (Japan) | | | 500 | | | | 233,216 | |
Playtika Holding Corp.*(a) | | | 114,600 | | | | 1,981,434 | |
Walt Disney Co. (The)* | | | 21,600 | | | | 3,345,624 | |
| | | | | | | | |
| | |
| | | | | | | 70,679,571 | |
| | | | | | | | |
Equity Real Estate Investment Trusts (REITs) — 1.2% | |
Apple Hospitality REIT, Inc. | | | 319,800 | | | | 5,164,770 | |
Dexus (Australia) | | | 41,598 | | | | 337,677 | |
Extra Space Storage, Inc. | | | 29,100 | | | | 6,597,843 | |
Goodman Group (Australia) | | | 4,773 | | | | 92,092 | |
GPT Group (The) (Australia) | | | 5,522 | | | | 21,811 | |
Kite Realty Group Trust | | | 71,100 | | | | 1,548,558 | |
Klepierre SA (France)* | | | 574 | | | | 13,606 | |
Lamar Advertising Co. (Class A Stock) | | | 8,500 | | | | 1,031,050 | |
Link REIT (Hong Kong) | | | 6,100 | | | | 53,681 | |
Prologis, Inc. | | | 119,200 | | | | 20,068,512 | |
Public Storage | | | 6,200 | | | | 2,322,272 | |
SBA Communications Corp. | | | 45,500 | | | | 17,700,410 | |
Stockland (Australia) | | | 69,197 | | | | 213,408 | |
| | | | | | | | |
| | | Shares | | | Value | |
COMMON STOCKS (continued) | |
Equity Real Estate Investment Trusts (REITs) (cont’d.) | |
Weyerhaeuser Co. | | | 162,600 | | | $ | 6,695,868 | |
| | | | | | | | |
| | |
| | | | | | | 61,861,558 | |
| | | | | | | | |
Food & Staples Retailing — 0.5% | |
Carrefour SA (France) | | | 1,718 | | | | 31,492 | |
Coles Group Ltd. (Australia) | | | 3,495 | | | | 45,599 | |
Kesko OYJ (Finland) (Class B Stock) | | | 680 | | | | 22,687 | |
Koninklijke Ahold Delhaize NV (Netherlands) | | | 13,373 | | | | 458,344 | |
Kroger Co. (The) | | | 164,800 | | | | 7,458,848 | |
Seven & i Holdings Co. Ltd. (Japan) | | | 900 | | | | 39,554 | |
Tesco PLC (United Kingdom) | | | 67,475 | | | | 264,863 | |
Walgreens Boots Alliance, Inc. | | | 30,200 | | | | 1,575,232 | |
Walmart, Inc. | | | 103,600 | | | | 14,989,884 | |
| | | | | | | | |
| | |
| | | | | | | 24,886,503 | |
| | | | | | | | |
Food Products — 0.9% | |
Archer-Daniels-Midland Co. | | | 135,000 | | | | 9,124,650 | |
Kraft Heinz Co. (The) | | | 337,400 | | | | 12,112,660 | |
MEIJI Holdings Co. Ltd. (Japan) | | | 400 | | | | 23,866 | |
Nestle SA (Switzerland) | | | 7,192 | | | | 1,006,558 | |
NH Foods Ltd. (Japan) | | | 300 | | | | 10,803 | |
Orkla ASA (Norway) | | | 10,287 | | | | 103,216 | |
Sanderson Farms, Inc. | | | 11,700 | | | | 2,235,636 | |
Tyson Foods, Inc. (Class A Stock) | | | 231,700 | | | | 20,194,972 | |
Wilmar International Ltd. (China) | | | 104,000 | | | | 320,568 | |
| | | | | | | | |
| | |
| | | | | | | 45,132,929 | |
| | | | | | | | |
Gas Utilities — 0.0% | |
Osaka Gas Co. Ltd. (Japan) | | | 1,100 | | | | 18,216 | |
Snam SpA (Italy) | | | 5,797 | | | | 34,940 | |
UGI Corp. | | | 35,000 | | | | 1,606,850 | |
| | | | | | | | |
| | |
| | | | | | | 1,660,006 | |
| | | | | | | | |
Health Care Equipment & Supplies — 2.2% | |
Abbott Laboratories | | | 146,300 | | | | 20,590,262 | |
Align Technology, Inc.* | | | 3,700 | | | | 2,431,566 | |
Baxter International, Inc. | | | 17,700 | | | | 1,519,368 | |
Becton, Dickinson & Co. | | | 79,800 | | | | 20,068,104 | |
Boston Scientific Corp.* | | | 477,400 | | | | 20,279,952 | |
DENTSPLY SIRONA, Inc. | | | 101,100 | | | | 5,640,369 | |
Edwards Lifesciences Corp.* | | | 78,500 | | | | 10,169,675 | |
Hoya Corp. (Japan) | | | 700 | | | | 103,841 | |
Intuitive Surgical, Inc.* | | | 10,100 | | | | 3,628,930 | |
Medtronic PLC | | | 253,000 | | | | 26,172,850 | |
Straumann Holding AG (Switzerland) | | | 30 | | | | 63,772 | |
| | | | | | | | |
| | |
| | | | | | | 110,668,689 | |
| | | | | | | | |
Health Care Providers & Services — 1.7% | |
Anthem, Inc. | | | 39,200 | | | | 18,170,768 | |
Cigna Corp. | | | 27,300 | | | | 6,268,899 | |
CVS Health Corp. | | | 176,400 | | | | 18,197,424 | |
Fresenius SE & Co. KGaA (Germany) | | | 7,336 | | | | 295,076 | |
HCA Healthcare, Inc. | | | 48,500 | | | | 12,460,620 | |
Medipal Holdings Corp. (Japan) | | | 16,000 | | | | 300,109 | |
Sonic Healthcare Ltd. (Australia) | | | 11,553 | | | | 392,457 | |
UnitedHealth Group, Inc. | | | 54,600 | | | | 27,416,844 | |
| | | | | | | | |
| | |
| | | | | | | 83,502,197 | |
| | | | | | | | |
SEE NOTES TO FINANCIAL STATEMENTS.
A48
| | | | | | |
| | |
| | PSF PGIM FLEXIBLE MANAGED PORTFOLIO (CONTINUED) | | |
| | | | | | |
| |
| SCHEDULE OF INVESTMENTS | | as of December 31, 2021 |
| | | | | | | | |
| | | Shares | | | Value | |
|
| COMMON STOCKS (continued) | |
|
| Hotels, Restaurants & Leisure — 1.8% | |
Aristocrat Leisure Ltd. (Australia) | | | 1,715 | | | $ | 54,369 | |
Booking Holdings, Inc.* | | | 9,700 | | | | 23,272,531 | |
Evolution AB (Sweden), 144A | | | 1,676 | | | | 237,574 | |
Hilton Worldwide Holdings, Inc.* | | | 7,200 | | | | 1,123,128 | |
InterContinental Hotels Group PLC (United Kingdom)* | | | 528 | | | | 34,179 | |
La Francaise des Jeux SAEM (France), 144A | | | 266 | | | | 11,784 | |
Marriott International, Inc. (Class A Stock)* | | | 39,100 | | | | 6,460,884 | |
McDonald’s Corp. | | | 127,900 | | | | 34,286,153 | |
McDonald’s Holdings Co. Japan Ltd. (Japan) | | | 6,900 | | | | 305,438 | |
Planet Fitness, Inc. (Class A Stock)* | | | 28,000 | | | | 2,536,240 | |
SeaWorld Entertainment, Inc.* | | | 29,700 | | | | 1,926,342 | |
Sodexo SA (France) | | | 253 | | | | 22,224 | |
Starbucks Corp. | | | 112,600 | | | | 13,170,822 | |
Yum! Brands, Inc. | | | 37,300 | | | | 5,179,478 | |
| | | | | | | | |
| | |
| | | | | | | 88,621,146 | |
| | | | | | | | |
| |
| Household Durables — 0.1% | | | | | |
Barratt Developments PLC (United Kingdom) | | | 3,024 | | | | 30,570 | |
Electrolux AB (Sweden) (Class B Stock) | | | 630 | | | | 15,294 | |
Iida Group Holdings Co. Ltd. (Japan) | | | 14,000 | | | | 326,078 | |
Lennar Corp. (Class A Stock) | | | 9,600 | | | | 1,115,136 | |
Persimmon PLC (United Kingdom) | | | 924 | | | | 35,701 | |
Skyline Champion Corp.* | | | 16,100 | | | | 1,271,578 | |
Sony Group Corp. (Japan) | | | 700 | | | | 88,140 | |
Tri Pointe Homes, Inc.* | | | 67,200 | | | | 1,874,208 | |
| | | | | | | | |
| | |
| | | | | | | 4,756,705 | |
| | | | | | | | |
| |
| Household Products — 0.4% | | | | | |
Essity AB (Sweden) (Class B Stock) | | | 934 | | | | 30,494 | |
Henkel AG & Co. KGaA (Germany) | | | 279 | | | | 21,766 | |
Procter & Gamble Co. (The) | | | 125,505 | | | | 20,530,108 | |
| | | | | | | | |
| | |
| | | | | | | 20,582,368 | |
| | | | | | | | |
|
| Independent Power & Renewable Electricity Producers — 0.3% | |
AES Corp. (The) | | | 675,000 | | | | 16,402,500 | |
| | | | | | | | |
| |
| Industrial Conglomerates — 0.6% | | | | | |
DCC PLC (United Kingdom) | | | 3,511 | | | | 287,376 | |
Honeywell International, Inc. | | | 129,500 | | | | 27,002,045 | |
Siemens AG (Germany) | | | 322 | | | | 55,632 | |
Toshiba Corp. (Japan) | | | 2,100 | | | | 86,301 | |
| | | | | | | | |
| | |
| | | | | | | 27,431,354 | |
| | | | | | | | |
| |
| Insurance — 1.4% | | | | | |
Ageas SA/NV (Belgium) | | | 513 | | | | 26,578 | |
AIA Group Ltd. (Hong Kong) | | | 8,000 | | | | 80,660 | |
Allianz SE (Germany) | | | 2,487 | | | | 586,540 | |
American International Group, Inc. | | | 17,300 | | | | 983,678 | |
Arch Capital Group Ltd.* | | | 26,600 | | | | 1,182,370 | |
AXA SA (France) | | | 5,623 | | | | 167,901 | |
Chubb Ltd. | | | 107,100 | | | | 20,703,501 | |
Dai-ichi Life Holdings, Inc. (Japan) | | | 3,000 | | | | 60,624 | |
| | | | | | | | |
| | | Shares | | | Value | |
|
| COMMON STOCKS (continued) | |
|
| Insurance (cont’d.) | |
Hartford Financial Services Group, Inc. (The) | | | 116,400 | | | $ | 8,036,256 | |
Japan Post Holdings Co. Ltd. (Japan) | | | 39,400 | | | | 307,332 | |
Japan Post Insurance Co. Ltd. (Japan) | | | 700 | | | | 11,245 | |
Legal & General Group PLC (United Kingdom) | | | 17,344 | | | | 69,698 | |
Medibank Private Ltd. (Australia) | | | 7,700 | | | | 18,751 | |
MetLife, Inc. | | | 329,900 | | | | 20,615,451 | |
MS&AD Insurance Group Holdings, Inc. (Japan) | | | 1,300 | | | | 40,044 | |
NN Group NV (Netherlands) | | | 7,753 | | | | 421,722 | |
Old Republic International Corp. | | | 255,200 | | | | 6,272,816 | |
Poste Italiane SpA (Italy), 144A | | | 15,516 | | | | 203,147 | |
Reinsurance Group of America, Inc. | | | 86,000 | | | | 9,416,140 | |
Sompo Holdings, Inc. (Japan) | | | 1,000 | | | | 42,152 | |
Suncorp Group Ltd. (Australia) | | | 3,672 | | | | 29,626 | |
T&D Holdings, Inc. (Japan) | | | 1,600 | | | | 20,411 | |
Zurich Insurance Group AG (Switzerland) | | | 104 | | | | 45,603 | |
| | | | | | | | |
| | |
| | | | | | | 69,342,246 | |
| | | | | | | | |
|
| Interactive Media & Services — 4.2% | |
Alphabet, Inc. (Class A Stock)* | | | 27,750 | | | | 80,392,860 | |
Alphabet, Inc. (Class C Stock)* | | | 26,732 | | | | 77,351,448 | |
Auto Trader Group PLC (United Kingdom), 144A | | | 1,938 | | | | 19,413 | |
Meta Platforms, Inc. (Class A Stock)* | | | 148,650 | | | | 49,998,427 | |
| | | | | | | | |
| | |
| | | | | | | 207,762,148 | |
| | | | | | | | |
|
| Internet & Direct Marketing Retail — 2.3% | |
Amazon.com, Inc.* | | | 30,200 | | | | 100,697,068 | |
eBay, Inc. | | | 206,900 | | | | 13,758,850 | |
| | | | | | | | |
| | |
| | | | | | | 114,455,918 | |
| | | | | | | | |
|
| IT Services — 3.1% | |
Accenture PLC (Class A Stock) | | | 70,250 | | | | 29,122,138 | |
Adyen NV (Netherlands), 144A* | | | 56 | | | | 147,245 | |
Automatic Data Processing, Inc. | | | 61,200 | | | | 15,090,696 | |
Bechtle AG (Germany) | | | 247 | | | | 17,708 | |
Capgemini SE (France) | | | 1,020 | | | | 250,173 | |
Cognizant Technology Solutions Corp. (Class A Stock) | | | 39,000 | | | | 3,460,080 | |
Edenred (France) | | | 748 | | | | 34,520 | |
EPAM Systems, Inc.* | | | 19,500 | | | | 13,034,775 | |
Fidelity National Information Services, Inc. | | | 109,300 | | | | 11,930,095 | |
Fujitsu Ltd. (Japan) | | | 2,300 | | | | 393,055 | |
Gartner, Inc.* | | | 41,500 | | | | 13,874,280 | |
International Business Machines Corp. | | | 110,600 | | | | 14,782,796 | |
Mastercard, Inc. (Class A Stock) | | | 52,700 | | | | 18,936,164 | |
NEC Corp. (Japan) | | | 700 | | | | 32,329 | |
NTT Data Corp. (Japan) | | | 1,800 | | | | 38,623 | |
PayPal Holdings, Inc.* | | | 9,200 | | | | 1,734,936 | |
TIS, Inc. (Japan) | | | 700 | | | | 20,805 | |
Visa, Inc. (Class A Stock)(a) | | | 148,500 | | | | 32,181,435 | |
| | | | | | | | |
| | |
| | | | | | | 155,081,853 | |
| | | | | | | | |
SEE NOTES TO FINANCIAL STATEMENTS.
A49
| | | | | | |
| | |
| | PSF PGIM FLEXIBLE MANAGED PORTFOLIO (CONTINUED) | | |
| | | | | | |
| |
| SCHEDULE OF INVESTMENTS | | as of December 31, 2021 |
| | | | | | | | |
| | | Shares | | | Value | |
|
| COMMON STOCKS (continued) | |
|
| Leisure Products — 0.0% | |
Smith & Wesson Brands, Inc. | | | 129,000 | | | $ | 2,296,200 | |
| | | | | | | | |
| |
| Life Sciences Tools & Services — 1.3% | | | | | |
Danaher Corp. | | | 66,700 | | | | 21,944,967 | |
Eurofins Scientific SE (Luxembourg) | | | 373 | | | | 46,213 | |
IQVIA Holdings, Inc.* | | | 80,700 | | | | 22,768,698 | |
Thermo Fisher Scientific, Inc. | | | 31,500 | | | | 21,018,060 | |
| | | | | | | | |
| | |
| | | | | | | 65,777,938 | |
| | | | | | | | |
| | |
| Machinery — 1.0% | | | | | | | | |
ANDRITZ AG (Austria) | | | 1,641 | | | | 84,693 | |
Atlas Copco AB (Sweden) (Class B Stock) | | | 1,042 | | | | 61,122 | |
Caterpillar, Inc. | | | 33,100 | | | | 6,843,094 | |
CNH Industrial NV (United Kingdom) | | | 2,961 | | | | 57,675 | |
Cummins, Inc. | | | 78,000 | | | | 17,014,920 | |
Daifuku Co. Ltd. (Japan) | | | 300 | | | | 24,487 | |
Daimler Truck Holding AG (Germany)* | | | 1,987 | | | | 73,028 | |
Deere & Co. | | | 36,600 | | | | 12,549,774 | |
Epiroc AB (Sweden) (Class B Stock) | | | 1,075 | | | | 22,829 | |
GEA Group AG (Germany) | | | 456 | | | | 24,898 | |
Hino Motors Ltd. (Japan) | | | 36,400 | | | | 299,502 | |
Husqvarna AB (Sweden) (Class B Stock) | | | 1,199 | | | | 19,160 | |
Komatsu Ltd. (Japan) | | | 2,500 | | | | 58,505 | |
MINEBEA MITSUMI, Inc. (Japan) | | | 900 | | | | 25,537 | |
MISUMI Group, Inc. (Japan) | | | 900 | | | | 36,967 | |
NGK Insulators Ltd. (Japan) | | | 18,400 | | | | 311,292 | |
Otis Worldwide Corp. | | | 46,100 | | | | 4,013,927 | |
Parker-Hannifin Corp. | | | 22,200 | | | | 7,062,264 | |
Rational AG (Germany) | | | 15 | | | | 15,353 | |
Schindler Holding AG (Switzerland) | | | 55 | | | | 14,712 | |
SKF AB (Sweden) (Class B Stock) | | | 1,085 | | | | 25,664 | |
SMC Corp. (Japan) | | | 200 | | | | 134,752 | |
Techtronic Industries Co. Ltd. (Hong Kong) | | | 4,000 | | | | 79,667 | |
Volvo AB (Sweden) (Class A Stock) | | | 612 | | | | 14,358 | |
| | | | | | | | |
| | |
| | | | | | | 48,868,180 | |
| | | | | | | | |
| | |
| Marine — 0.0% | | | | | | | | |
AP Moller - Maersk A/S (Denmark) (Class A Stock) | | | 9 | | | | 29,978 | |
AP Moller - Maersk A/S (Denmark) (Class B Stock) | | | 122 | | | | 437,683 | |
Kuehne + Nagel International AG (Switzerland) | | | 453 | | | | 146,178 | |
Nippon Yusen KK (Japan) | | | 500 | | | | 38,074 | |
SITC International Holdings Co. Ltd. (China) | | | 35,000 | | | | 126,674 | |
| | | | | | | | |
| | |
| | | | | | | 778,587 | |
| | | | | | | | |
| | |
| Media — 0.6% | | | | | | | | |
Comcast Corp. (Class A Stock) | | | 455,200 | | | | 22,910,216 | |
Dentsu Group, Inc. (Japan) | | | 700 | | | | 24,955 | |
Publicis Groupe SA (France) | | | 2,791 | | | | 187,938 | |
Schibsted ASA (Norway) (Class B Stock) | | | 276 | | | | 9,230 | |
ViacomCBS, Inc. (Class B Stock) | | | 214,000 | | | | 6,458,520 | |
Vivendi SE (France) | | | 2,072 | | | | 28,045 | |
| | | | | | | | |
| | | Shares | | | Value | |
|
| COMMON STOCKS (continued) | |
Media (cont’d.) | |
WPP PLC (United Kingdom) | | | 26,273 | | | $ | 397,465 | |
| | | | | | | | |
| | |
| | | | | | | 30,016,369 | |
| | | | | | | | |
Metals & Mining — 0.4% | | | | | | | | |
Anglo American PLC (South Africa) | | | 3,569 | | | | 145,976 | |
ArcelorMittal SA (Luxembourg) | | | 11,758 | | | | 376,250 | |
BHP Group Ltd. (Australia)(a) | | | 8,482 | | | | 256,424 | |
BHP Group PLC (Australia) | | | 4,079 | | | | 121,615 | |
BlueScope Steel Ltd. (Australia) | | | 21,685 | | | | 330,275 | |
Boliden AB (Sweden) | | | 814 | | | | 31,492 | |
Evraz PLC (Russia) | | | 1,553 | | | | 12,670 | |
Fortescue Metals Group Ltd. (Australia). | | | 5,007 | | | | 70,122 | |
Freeport-McMoRan, Inc. | | | 207,400 | | | | 8,654,802 | |
Glencore PLC (Australia)* | | | 29,055 | | | | 147,410 | |
Norsk Hydro ASA (Norway) | | | 3,960 | | | | 31,261 | |
Reliance Steel & Aluminum Co. | | | 34,700 | | | | 5,629,034 | |
Rio Tinto Ltd. (Australia) | | | 1,099 | | | | 80,255 | |
Rio Tinto PLC (Australia) | | | 5,287 | | | | 350,692 | |
South32 Ltd. (Australia) | | | 13,377 | | | | 39,230 | |
Steel Dynamics, Inc. | | | 52,000 | | | | 3,227,640 | |
voestalpine AG (Austria) | | | 338 | | | | 12,345 | |
| | | | | | | | |
| | |
| | | | | | | 19,517,493 | |
| | | | | | | | |
Multiline Retail — 0.1% | | | | | | | | |
Next PLC (United Kingdom) | | | 384 | | | | 42,272 | |
Target Corp. | | | 29,200 | | | | 6,758,048 | |
| | | | | | | | |
| | |
| | | | | | | 6,800,320 | |
| | | | | | | | |
Multi-Utilities — 0.2% | | | | | | | | |
E.ON SE (Germany) | | | 30,336 | | | | 421,269 | |
Engie SA (France) | | | 5,203 | | | | 77,053 | |
MDU Resources Group, Inc. | | | 84,400 | | | | 2,602,896 | |
Sempra Energy | | | 54,100 | | | | 7,156,348 | |
| | | | | | | | |
| | |
| | | | | | | 10,257,566 | |
| | | | | | | | |
Oil, Gas & Consumable Fuels — 2.1% | | | | | |
APA Corp. | | | 36,700 | | | | 986,863 | |
BP PLC (United Kingdom) | | | 118,543 | | | | 530,337 | |
Cheniere Energy, Inc. | | | 84,800 | | | | 8,600,416 | |
Chevron Corp. | | | 196,100 | | | | 23,012,335 | |
ConocoPhillips | | | 52,500 | | | | 3,789,450 | |
Coterra Energy, Inc. | | | 69,000 | | | | 1,311,000 | |
EOG Resources, Inc. | | | 239,100 | | | | 21,239,253 | |
Equinor ASA (Norway) | | | 10,826 | | | | 287,193 | |
Exxon Mobil Corp. | | | 645,300 | | | | 39,485,907 | |
Inpex Corp. (Japan) | | | 35,800 | | | | 311,536 | |
Lundin Energy AB (Sweden) | | | 9,040 | | | | 323,321 | |
Occidental Petroleum Corp. | | | 59,800 | | | | 1,733,602 | |
OMV AG (Austria) | | | 6,301 | | | | 358,326 | |
Repsol SA (Spain) | | | 4,092 | | | | 48,616 | |
Royal Dutch Shell PLC (Netherlands) (Class A Stock) | | | 11,898 | | | | 261,183 | |
TotalEnergies SE (France) | | | 360 | | | | 18,297 | |
| | | | | | | | |
| | |
| | | | | | | 102,297,635 | |
| | | | | | | | |
Paper & Forest Products — 0.0% | |
Oji Holdings Corp. (Japan) | | | 2,400 | | | | 11,631 | |
SEE NOTES TO FINANCIAL STATEMENTS.
A50
| | | | | | |
| | |
| | PSF PGIM FLEXIBLE MANAGED PORTFOLIO (CONTINUED) | | |
| | | | | | |
| |
| SCHEDULE OF INVESTMENTS | | as of December 31, 2021 |
| | | | | | | | |
| | | Shares | | | Value | |
|
| COMMON STOCKS (continued) | |
Paper & Forest Products (cont’d.) | |
Stora Enso OYJ (Finland) (Class R Stock) | | | 1,652 | | | $ | 30,275 | |
| | | | | | | | |
| | |
| | | | | | | 41,906 | |
| | | | | | | | |
Personal Products — 0.1% | | | | | | | | |
L’Oreal SA (France) | | | 717 | | | | 340,406 | |
Medifast, Inc. | | | 8,700 | | | | 1,822,041 | |
Unilever PLC (United Kingdom) | | | 13,246 | | | | 708,785 | |
| | | | | | | | |
| | |
| | | | | | | 2,871,232 | |
| | | | | | | | |
Pharmaceuticals — 3.0% | | | | | | | | |
AstraZeneca PLC (United Kingdom) | | | 1,493 | | | | 174,851 | |
Bayer AG (Germany) | | | 955 | | | | 51,115 | |
Bristol-Myers Squibb Co. | | | 352,400 | | | | 21,972,140 | |
Chugai Pharmaceutical Co. Ltd. (Japan) | | | 2,600 | | | | 84,479 | |
GlaxoSmithKline PLC (United Kingdom) | | | 28,503 | | | | 618,939 | |
Hikma Pharmaceuticals PLC (Jordan) | | | 504 | | | | 15,142 | |
Ipsen SA (France) | | | 3,341 | | | | 305,986 | |
Johnson & Johnson | | | 266,248 | | | | 45,547,046 | |
Merck & Co., Inc. | | | 412,100 | | | | 31,583,344 | |
Merck KGaA (Germany) | | | 1,345 | | | | 347,276 | |
Novartis AG (Switzerland) | | | 6,387 | | | | 560,977 | |
Novo Nordisk A/S (Denmark) (Class B Stock) | | | 5,424 | | | | 610,700 | |
Ono Pharmaceutical Co. Ltd. (Japan) | | | 1,100 | | | | 27,288 | |
Otsuka Holdings Co. Ltd. (Japan) | | | 6,600 | | | | 239,033 | |
Pfizer, Inc. | | | 598,800 | | | | 35,359,140 | |
Roche Holding AG (Switzerland) | | | 2,831 | | | | 1,176,585 | |
Sanofi (France) | | | 6,191 | | | | 623,386 | |
Sumitomo Dainippon Pharma Co. Ltd. (Japan) | | | 600 | | | | 6,911 | |
Takeda Pharmaceutical Co. Ltd. (Japan) | | | 5,600 | | | | 152,809 | |
Zoetis, Inc. | | | 39,000 | | | | 9,517,170 | |
| | | | | | | | |
| | |
| | | | | | | 148,974,317 | |
| | | | | | | | |
Professional Services — 0.1% | |
Benefit One, Inc. (Japan) | | | 700 | | | | 30,046 | |
Experian PLC (United Kingdom) | | | 2,668 | | | | 131,165 | |
Korn Ferry | | | 49,000 | | | | 3,710,770 | |
ManpowerGroup, Inc. | | | 21,500 | | | | 2,092,595 | |
Randstad NV (Netherlands) | | | 4,898 | | | | 335,570 | |
RELX PLC (United Kingdom) | | | 1,890 | | | | 61,482 | |
Wolters Kluwer NV (Netherlands) | | | 760 | | | | 89,507 | |
| | | | | | | | |
| | |
| | | | | | | 6,451,135 | |
| | | | | | | | |
Real Estate Management & Development — 0.1% | |
CBRE Group, Inc. (Class A Stock)* | | | 53,000 | | | | 5,751,030 | |
CK Asset Holdings Ltd. (Hong Kong) | | | 49,500 | | | | 311,758 | |
Daito Trust Construction Co. Ltd. (Japan) | | | 800 | | | | 91,696 | |
Daiwa House Industry Co. Ltd. (Japan) | | | 1,600 | | | | 46,018 | |
ESR Cayman Ltd. (China), 144A* | | | 5,600 | | | | 18,923 | |
Hang Lung Properties Ltd. (Hong Kong) | | | 6,000 | | | | 12,328 | |
| | | | | | | | |
| | | Shares | | | Value | |
|
| COMMON STOCKS (continued) | |
Real Estate Management & Development (cont’d.) | |
Henderson Land Development Co. Ltd. (Hong Kong) | | | 4,000 | | | $ | 17,025 | |
Hongkong Land Holdings Ltd. (Hong Kong) | | | 3,200 | | | | 16,635 | |
| | | | | | | | |
| | |
| | | | | | | 6,265,413 | |
| | | | | | | | |
Road & Rail — 0.2% | | | | | | | | |
AMERCO | | | 6,100 | | | | 4,430,003 | |
Union Pacific Corp. | | | 12,800 | | | | 3,224,704 | |
| | | | | | | | |
| | |
| | | | | | | 7,654,707 | |
| | | | | | | | |
Semiconductors & Semiconductor Equipment — 4.6% | |
Advanced Micro Devices, Inc.* | | | 30,500 | | | | 4,388,950 | |
Advantest Corp. (Japan) | | | 600 | | | | 56,556 | |
Analog Devices, Inc. | | | 21,000 | | | | 3,691,170 | |
Applied Materials, Inc. | | | 55,400 | | | | 8,717,744 | |
ASM International NV (Netherlands) | | | 134 | | | | 59,153 | |
ASML Holding NV (Netherlands) | | | 952 | | | | 762,571 | |
Broadcom, Inc. | | | 60,400 | | | | 40,190,764 | |
Cirrus Logic, Inc.* | | | 10,600 | | | | 975,412 | |
Disco Corp. (Japan) | | | 100 | | | | 30,443 | |
Intel Corp. | | | 424,250 | | | | 21,848,875 | |
MaxLinear, Inc.* | | | 18,300 | | | | 1,379,637 | |
Microchip Technology, Inc. | | | 75,800 | | | | 6,599,148 | |
NVIDIA Corp. | | | 250,600 | | | | 73,703,966 | |
NXP Semiconductors NV (China) | | | 60,800 | | | | 13,849,024 | |
QUALCOMM, Inc. | | | 216,500 | | | | 39,591,355 | |
Renesas Electronics Corp. (Japan)* | | | 3,600 | | | | 44,485 | |
STMicroelectronics NV (Singapore) | | | 6,353 | | | | 313,522 | |
SUMCO Corp. (Japan) | | | 1,000 | | | | 20,297 | |
Texas Instruments, Inc. | | | 66,800 | | | | 12,589,796 | |
| | | | | | | | |
| | |
| | | | | | | 228,812,868 | |
| | | | | | | | |
Software — 6.7% | | | | | | | | |
Adobe, Inc.* | | | 62,850 | | | | 35,639,721 | |
Autodesk, Inc.* | | | 13,900 | | | | 3,908,541 | |
Black Knight, Inc.* | | | 87,300 | | | | 7,236,297 | |
Check Point Software Technologies Ltd. (Israel)* | | | 300 | | | | 34,968 | |
Dassault Systemes SE (France) | | | 7,204 | | | | 429,563 | |
Dolby Laboratories, Inc. (Class A Stock) | | | 18,200 | | | | 1,733,004 | |
Manhattan Associates, Inc.* | | | 27,100 | | | | 4,213,779 | |
Microsoft Corp. | | | 663,800 | | | | 223,249,216 | |
Nemetschek SE (Germany) | | | 160 | | | | 20,437 | |
Oracle Corp. | | | 172,450 | | | | 15,039,364 | |
Paycom Software, Inc.* | | | 32,500 | | | | 13,493,675 | |
salesforce.com, Inc.* | | | 49,200 | | | | 12,503,196 | |
SAP SE (Germany) | | | 2,956 | | | | 417,556 | |
SS&C Technologies Holdings, Inc. | | | 106,200 | | | | 8,706,276 | |
Synopsys, Inc.* | | | 7,800 | | | | 2,874,300 | |
Trend Micro, Inc. (Japan)* | | | 400 | | | | 22,210 | |
VMware, Inc. (Class A Stock) | | | 8,519 | | | | 987,182 | |
| | | | | | | | |
| | |
| | | | | | | 330,509,285 | |
| | | | | | | | |
Specialty Retail — 1.4% | | | | | | | | |
Asbury Automotive Group, Inc.* | | | 82,200 | | | | 14,198,406 | |
AutoNation, Inc.*(a) | | | 98,700 | | | | 11,533,095 | |
SEE NOTES TO FINANCIAL STATEMENTS.
A51
| | | | | | |
| | |
| | PSF PGIM FLEXIBLE MANAGED PORTFOLIO (CONTINUED) | | |
| | | | | | |
| |
| SCHEDULE OF INVESTMENTS | | as of December 31, 2021 |
| | | | | | | | |
| | | Shares | | | Value | |
COMMON STOCKS (continued) | |
Specialty Retail (cont’d.) | | | | | | | | |
AutoZone, Inc.* | | | 2,800 | | | $ | 5,869,892 | |
Chow Tai Fook Jewellery Group Ltd. (China)* | | | 36,400 | | | | 65,460 | |
Foot Locker, Inc. | | | 134,700 | | | | 5,876,961 | |
Group 1 Automotive, Inc. | | | 25,800 | | | | 5,036,676 | |
Home Depot, Inc. (The) | | | 27,900 | | | | 11,578,779 | |
Industria de Diseno Textil SA (Spain) | | | 3,146 | | | | 102,027 | |
JD Sports Fashion PLC (United Kingdom) | | | 71,270 | | | | 209,918 | |
Kingfisher PLC (United Kingdom) | | | 68,169 | | | | 312,329 | |
Shimamura Co. Ltd. (Japan) | | | 3,600 | | | | 302,587 | |
TJX Cos., Inc. (The) | | | 185,900 | | | | 14,113,528 | |
USS Co. Ltd. (Japan) | | | 6,900 | | | | 107,763 | |
| | | | | | | | |
| | |
| | | | | | | 69,307,421 | |
| | | | | | | | |
Technology Hardware, Storage & Peripherals — 4.3% | |
Apple, Inc. | | | 1,150,700 | | | | 204,329,799 | |
Brother Industries Ltd. (Japan) | | | 700 | | | | 13,484 | |
Canon, Inc. (Japan) | | | 15,500 | | | | 377,152 | |
FUJIFILM Holdings Corp. (Japan) | | | 1,100 | | | | 81,428 | |
Seiko Epson Corp. (Japan) | | | 15,100 | | | | 271,779 | |
Western Digital Corp.* | | | 107,700 | | | | 7,023,117 | |
| | | | | | | | |
| | |
| | | | | | | 212,096,759 | |
| | | | | | | | |
Textiles, Apparel & Luxury Goods — 0.4% | |
Burberry Group PLC (United Kingdom) | | | 1,180 | | | | 28,959 | |
Capri Holdings Ltd.* | | | 186,300 | | | | 12,092,733 | |
Cie Financiere Richemont SA (Switzerland) (Class A Stock) | | | 3,086 | | | | 462,169 | |
EssilorLuxottica SA (France) | | | 815 | | | | 173,541 | |
Hermes International (France) | | | 270 | | | | 471,571 | |
Kering SA (France) | | | 79 | | | | 63,569 | |
LVMH Moet Hennessy Louis Vuitton SE (France) | | | 789 | | | | 652,557 | |
Moncler SpA (Italy) | | | 598 | | | | 43,407 | |
Pandora A/S (Denmark) | | | 270 | | | | 33,620 | |
Swatch Group AG (The) (Switzerland) | | | 84 | | | | 25,661 | |
Swatch Group AG (The) (registered shares) (Switzerland) | | | 140 | | | | 8,213 | |
Tapestry, Inc. | | | 99,200 | | | | 4,027,520 | |
| | | | | | | | |
| | |
| | | | | | | 18,083,520 | |
| | | | | | | | |
Tobacco — 0.3% | | | | | | | | |
Altria Group, Inc. | | | 278,350 | | | | 13,191,006 | |
British American Tobacco PLC (United Kingdom) | | | 14,575 | | | | 540,849 | |
Imperial Brands PLC (United Kingdom) | | | 2,561 | | | | 55,983 | |
Japan Tobacco, Inc. (Japan) | | | 18,500 | | | | 373,625 | |
Swedish Match AB (Sweden) | | | 37,516 | | | | 298,665 | |
| | | | | | | | |
| | |
| | | | | | | 14,460,128 | |
| | | | | | | | |
Trading Companies & Distributors — 0.0% | |
Ashtead Group PLC (United Kingdom) . | | | 2,415 | | | | 193,815 | |
Brenntag SE (Germany) | | | 3,293 | | | | 297,927 | |
Bunzl PLC (United Kingdom) | | | 957 | | | | 37,390 | |
Ferguson PLC | | | 2,196 | | | | 388,918 | |
ITOCHU Corp. (Japan) | | | 3,500 | | | | 107,114 | |
Marubeni Corp. (Japan) | | | 17,500 | | | | 170,680 | |
| | | | | | | | | | | | |
| | | | | | Shares | | | Value | |
COMMON STOCKS (continued) | | | | | |
Trading Companies & Distributors (cont’d.) | | | | | |
Mitsubishi Corp. (Japan) | | | | 4,900 | | | $ | 155,901 | |
Mitsui & Co. Ltd. (Japan) | | | | 18,600 | | | | 440,476 | |
Toyota Tsusho Corp. (Japan) | | | | 600 | | | | 27,680 | |
| | | | | | | | | | | | |
| | | |
| | | | | | | | | | | 1,819,901 | |
| | | | | | | | | | | | |
Wireless Telecommunication Services — 0.0% | | | | | |
KDDI Corp. (Japan) | | | | 8,500 | | | | 248,107 | |
SoftBank Group Corp. (Japan) | | | | 3,100 | | | | 147,088 | |
Vodafone Group PLC (United Kingdom) | | | | 80,317 | | | | 121,544 | |
| | | | | | | | | | | | |
| | | |
| | | | | | | | | | | 516,739 | |
| | | | | | | | | | | | |
TOTAL COMMON STOCKS
(cost $2,219,672,805) | | | | | | | | 3,274,629,036 | |
| | | | | | | | | | | | |
EXCHANGE-TRADED FUND — 0.0% | | | | | |
iShares MSCI EAFE ETF(a) | | | | 2,488 | | | | 195,756 | |
| | | | | | | | | | | | |
(cost $135,052) | | | | | | | | | |
PREFERRED STOCKS — 0.0% | | | | | | | | | |
Automobiles — 0.0% | | | | | | | | | |
Bayerische Motoren Werke AG (Germany) (PRFC) | | | | 151 | | | | 12,524 | |
| | | | | | | | | | | | |
Banks — 0.0% | | | | | | | | | | | | |
Citigroup Capital XIII, 6.499%(c), 3 Month LIBOR + 6.370%, Maturing 10/30/40 | | | | 22,000 | | | | 613,800 | |
| | | | | | | | | | | | |
Household Products — 0.0% | | | | | | | | | |
Henkel AG & Co. KGaA (Germany) (PRFC) | | | | 998 | | | | 80,600 | |
| | | | | | | | | | | | |
TOTAL PREFERRED STOCKS
(cost $643,185) | | | | | | | | 706,924 | |
| | | | | | | | | | | | |
| | | | | | | | | | | | | | | | |
Interest Rate | | Maturity
Date | | | | | | Principal
Amount
(000)# | | | | |
| | | | | | | | | | | | | | | | |
ASSET-BACKED SECURITIES — 5.8% | | | | | |
Automobiles — 1.7% | | | | | | | | | | | | | |
AmeriCredit Automobile Receivables Trust, | | | | | |
Series 2019-01, Class B | | | | | |
3.130% | | | 02/18/25 | | | | | | | | 1,000 | | | | 1,006,874 | |
Series 2019-01, Class C | | | | | | | | | | | | | |
3.360% | | | 02/18/25 | | | | | | | | 1,000 | | | | 1,022,485 | |
Series 2019-02, Class C | | | | | | | | | | | | | |
2.740% | | | 04/18/25 | | | | | | | | 2,000 | | | | 2,040,643 | |
Series 2019-03, Class C | | | | | | | | | | | | | |
2.320% | | | 07/18/25 | | | | | | | | 3,400 | | | | 3,448,473 | |
Series 2020-02, Class C | | | | | | | | | | | | | |
1.480% | | | 02/18/26 | | | | | | | | 600 | | | | 603,518 | |
Series 2020-03, Class C | | | | | | | | | | | | | |
1.060% | | | 08/18/26 | | | | | | | | 1,000 | | | | 997,480 | |
Series 2021-02, Class C | | | | | | | | | | | | | |
1.010% | | | 01/19/27 | | | | | | | | 1,300 | | | | 1,278,071 | |
Series 2021-03, Class C | | | | | | | | | | | | | |
1.410% | | | 08/18/27 | | | | | | | | 1,300 | | | | 1,289,033 | |
Avis Budget Rental Car Funding AESOP LLC, | | | | | |
Series 2018-02A, Class A, 144A | | | | | | | | | |
4.000% | | | 03/20/25 | | | | | | | | 1,600 | | | | 1,686,670 | |
SEE NOTES TO FINANCIAL STATEMENTS.
A52
| | | | | | |
| | |
| | PSF PGIM FLEXIBLE MANAGED PORTFOLIO (CONTINUED) | | |
| | | | | | |
| |
| SCHEDULE OF INVESTMENTS | | as of December 31, 2021 |
| | | | | | | | | | | | | | | | |
Interest Rate | | Maturity
Date | | | Principal Amount
(000)# | | | Value | |
| | | | | | | | | | | | |
| |
| ASSET-BACKED SECURITIES (continued) | | | | | |
Automobiles (cont’d.) | | | | | | | | | | | | | |
Series 2019-02A, Class A, 144A | | | | | |
3.350% | | | 09/22/25 | | | | | | | | 3,000 | | | $ | 3,141,781 | |
Series 2019-03A, Class A, 144A | | | | | |
2.360% | | | 03/20/26 | | | | | | | | 4,000 | | | | 4,088,734 | |
Series 2020-01A, Class A, 144A | | | | | |
2.330% | | | 08/20/26 | | | | | | | | 1,800 | | | | 1,842,958 | |
Series 2021-01A, Class A, 144A | | | | | |
1.380% | | | 08/20/27 | | | | | | | | 3,500 | | | | 3,436,920 | |
Series 2021-02A, Class A, 144A | | | | | |
1.660% | | | 02/20/28 | | | | | | | | 3,700 | | | | 3,666,330 | |
CarMax Auto Owner Trust, | | | | | |
Series 2021-02, Class C | | | | | |
1.340% | | | 02/16/27 | | | | | | | | 1,100 | | | | 1,088,689 | |
Series 2021-04, Class C | | | | | |
1.380% | | | 07/15/27 | | | | | | | | 800 | | | | 784,429 | |
Carvana Auto Receivables Trust, | | | | | | | | | | | | | |
Series 2021-P03, Class B | | | | | |
1.420% | | | 08/10/27 | | | | | | | | 100 | | | | 98,209 | |
Series 2021-P04, Class B | | | | | |
1.980% | | | 02/10/28 | | | | | | | | 300 | | | | 299,798 | |
Ford Auto Securitization Trust (Canada), | | | | | | | | | |
Series 2019-BA, Class A2, 144A | | | | | |
2.321% | | | 10/15/23 | | | | CAD | | | | 669 | | | | 531,728 | |
Series 2020-AA, Class A3, 144A | | | | | |
1.153% | | | 11/15/25 | | | | CAD | | | | 3,600 | | | | 2,817,560 | |
Ford Credit Auto Owner Trust, | | | | | | | | | | | | | |
Series 2018-01, Class A, 144A | | | | | |
3.190% | | | 07/15/31 | | | | | | | | 3,800 | | | | 4,003,394 | |
Series 2019-01, Class A, 144A | | | | | |
3.520% | | | 07/15/30 | | | | | | | | 5,000 | | | | 5,242,018 | |
Series 2020-01, Class A, 144A | | | | | |
2.040% | | | 08/15/31 | | | | | | | | 3,600 | | | | 3,664,845 | |
Series 2020-02, Class A, 144A | | | | | | | | | | | | | |
1.060% | | | 04/15/33 | | | | | | | | 4,500 | | | | 4,409,667 | |
Series 2021-02, Class B, 144A | | | | | | | | | | | | | |
1.910% | | | 05/15/34 | | | | | | | | 500 | | | | 496,586 | |
GM Financial Consumer Automobile Receivables Trust, | |
Series 2018-04, Class C | | | | | | | | | | | | | |
3.620% | | | 06/17/24 | | | | | | | | 500 | | | | 510,238 | |
GM Financial Revolving Receivables Trust, | | | | | | | | | |
Series 2021-01, Class B, 144A | | | | | | | | | | | | | |
1.490% | | | 06/12/34 | | | | | | | | 200 | | | | 195,928 | |
Hertz Vehicle Financing III LP, | | | | | | | | | | | | | |
Series 2021-02A, Class A, 144A | | | | | | | | | | | | | |
1.680% | | | 12/27/27 | | | | | | | | 1,900 | | | | 1,871,475 | |
Hertz Vehicle Financing LLC, | | | | | | | | | | | | | |
Series 2021-01A, Class A, 144A | | | | | | | | | | | | | |
1.210% | | | 12/26/25 | | | | | | | | 2,100 | | | | 2,079,281 | |
OneMain Direct Auto Receivables Trust, | | | | | | | | | |
Series 2018-01A, Class A, 144A | | | | | | | | | | | | | |
3.430% | | | 12/16/24 | | | | | | | | 154 | | | | 154,032 | |
Series 2019-01A, Class A, 144A | | | | | | | | | | | | | |
3.630% | | | 09/14/27 | | | | | | | | 6,300 | | | | 6,647,070 | |
Series 2021-01A, Class B, 144A | | | | | | | | | | | | | |
1.260% | | | 07/14/28 | | | | | | | | 2,600 | | | | 2,569,827 | |
Santander Drive Auto Receivables Trust, | | | | | | | | | |
Series 2020-02, Class C | | | | | | | | | | | | | |
1.460% | | | 09/15/25 | | | | | | | | 800 | | | | 803,739 | |
| | | | | | | | | | | | | | |
Interest Rate | | Maturity
Date | | | Principal Amount (000)# | | | Value | |
| | | | | | | | | | | |
|
| ASSET-BACKED SECURITIES (continued) | |
Automobiles (cont’d.) | | | | | | | | | | | |
Series 2020-03, Class C | | | | | | | | | | | |
1.120% | | | 01/15/26 | | | | | | 2,600 | | | $ | 2,607,570 | |
Series 2020-04, Class C | | | | | | | | | | | |
1.010% | | | 01/15/26 | | | | | | 1,600 | | | | 1,602,134 | |
Series 2021-01, Class C | | | | | | | | | | | |
0.750% | | | 02/17/26 | | | | | | 3,000 | | | | 2,996,961 | |
Series 2021-02, Class C | | | | | | | | | | | |
0.900% | | | 06/15/26 | | | | | | 2,200 | | | | 2,193,429 | |
Series 2021-02, Class D | | | | | | | | | | | |
1.350% | | | 07/15/27 | | | | | | 2,800 | | | | 2,782,812 | |
Series 2021-03, Class C | | | | | | | | | | | |
0.950% | | | 09/15/27 | | | | | | 2,900 | | | | 2,872,041 | |
Series 2021-04, Class C | | | | | | | | | | | |
1.260% | | | 02/16/27 | | | | | | 2,700 | | | | 2,683,542 | |
World Omni Select Auto Trust, | | | | | | | | | | | |
Series 2021-A, Class C | | | | | | | | | | | |
1.090% | | | 11/15/27 | | | | | | 600 | | | | 589,721 | |
| | | | | | | | | | | | | | |
| | | | | | | | | | | | | 86,146,693 | |
| | | | | | | | | | | | | | |
Collateralized Loan Obligations — 3.1% | |
Bain Capital Credit CLO Ltd. (Cayman Islands), | |
Series 2019-02A, Class AR, 144A, 3 Month LIBOR + 1.100% (Cap N/A, Floor 1.100%) | |
1.222%(c) | | | 10/17/32 | | | | | | 5,000 | | | | 4,998,077 | |
Balboa Bay Loan Funding Ltd. (Cayman Islands), | |
Series 2021-01A, Class A, 144A, 3 Month LIBOR + 1.200% (Cap N/A, Floor 1.200%) | |
1.334%(c) | | | 07/20/34 | | | | | | 3,750 | | | | 3,754,744 | |
Ballyrock CLO Ltd. (Cayman Islands), | |
Series 2016-01A, Class AR2, 144A, 3 Month LIBOR + 0.980% (Cap N/A, Floor 0.980%) | |
1.104%(c) | | | 10/15/28 | | | | | | 3,124 | | | | 3,121,922 | |
Benefit Street Partners CLO Ltd. (Cayman Islands), | |
Series 2013-IIA, Class A1R2, 144A, 3 Month LIBOR + 0.870% (Cap N/A, Floor 0.870%) | |
0.994%(c) | | | 07/15/29 | | | | | | 1,375 | | | | 1,374,509 | |
BNPP AM Euro CLO DAC (Ireland), | |
Series 2018-01A, Class AR, 144A, 3 Month EURIBOR + 0.600% (Cap N/A, Floor 0.600%) | |
0.600%(c) | | | 04/15/31 | | | EUR | | | 3,000 | | | | 3,403,041 | |
Brookside Mill CLO Ltd. (Cayman Islands), | |
Series 2013-01A, Class AR, 144A, 3 Month LIBOR + 0.820% (Cap N/A, Floor 0.000%) | |
0.942%(c) | | | 01/17/28 | | | | | | 458 | | | | 457,834 | |
Canyon Capital CLO Ltd. (Cayman Islands), | | | | | |
Series 2017-01A, Class AR, 144A, 3 Month LIBOR + 1.000% (Cap N/A, Floor 1.000%) | |
1.124%(c) | | | 07/15/30 | | | | | | 3,000 | | | | 2,999,336 | |
Carlyle Euro CLO DAC (Ireland), | |
Series 2021-02A, Class A1, 144A, 3 Month EURIBOR + 0.990% (Cap N/A, Floor 0.990%) | |
0.990%(c) | | | 10/15/35 | | | EUR | | | 5,000 | | | | 5,686,842 | |
Carlyle Global Market Strategies CLO Ltd. (Cayman Islands), | |
Series 2015-05A, Class A1RR, 144A, 3 Month LIBOR + 1.080% (Cap N/A, Floor 1.080%) | |
1.212%(c) | | | 01/20/32 | | | | | | 9,750 | | | | 9,746,655 | |
SEE NOTES TO FINANCIAL STATEMENTS.
A53
| | | | | | |
| | |
| | PSF PGIM FLEXIBLE MANAGED PORTFOLIO (CONTINUED) | | |
| | | | | | |
| |
| SCHEDULE OF INVESTMENTS | | as of December 31, 2021 |
| | | | | | | | | | | | | | | | |
Interest
Rate | | Maturity
Date | | | | | | Principal
Amount
(000)# | | | Value | |
| | | | | | | | | | | | | | | | |
| |
| ASSET-BACKED SECURITIES (continued) | | | | | |
Collateralized Loan Obligations (cont’d.) | | | | | |
CIFC Funding Ltd. (Cayman Islands), | | | | | |
Series 2014-05A, Class A1R2, 144A, 3 Month LIBOR + 1.200% (Cap N/A, Floor 1.200%) | |
1.322%(c) | | | 10/17/31 | | | | | | | | 9,750 | | | $ | 9,750,280 | |
Elevation CLO Ltd. (Cayman Islands), | | | | | |
Series 2017-06A, Class A1, 144A, 3 Month LIBOR + 1.280% (Cap N/A, Floor 0.000%) | |
1.404%(c) | | | 07/15/29 | | | | | | | | 500 | | | | 499,921 | |
Greenwood Park CLO Ltd. (Cayman Islands), | | | | | |
Series 2018-01A, Class A2, 144A, 3 Month LIBOR + 1.010% (Cap N/A, Floor 0.000%) | |
1.134%(c) | | | 04/15/31 | | | | | | | | 2,000 | | | | 1,998,886 | |
Greywolf CLO Ltd. (Cayman Islands), | | | | | |
Series 2018-01A, Class A1, 144A, 3 Month LIBOR + 1.030% (Cap N/A, Floor 0.000%) | |
1.155%(c) | | | 04/26/31 | | | | | | | | 4,000 | | | | 3,997,788 | |
HPS Loan Management Ltd. (Cayman Islands), | | | | | |
Series 15A-19, Class A1, 144A, 3 Month LIBOR + 1.320% (Cap N/A, Floor 1.320%) | |
1.448%(c) | | | 07/22/32 | | | | | | | | 3,750 | | | | 3,751,231 | |
Series 2015-06A, Class A1R, 144A, 3 Month LIBOR + 1.000% (Cap N/A, Floor 0.000%) | |
1.140%(c) | | | 02/05/31 | | | | | | | | 248 | | | | 248,241 | |
ICG US CLO Ltd. (Cayman Islands), | | | | | |
Series 2015-01A, Class A1R, 144A, 3 Month LIBOR + 1.140% (Cap N/A, Floor 1.140%) | |
1.264%(c) | | | 10/19/28 | | | | | | | | 8,316 | | | | 8,315,066 | |
Jamestown CLO Ltd. (Cayman Islands), | | | | | |
Series 2019-01A, Class A1, 144A, 3 Month LIBOR + 1.470% (Cap N/A, Floor 1.470%) | |
1.602%(c) | | | 04/20/32 | | | | | | | | 5,750 | | | | 5,752,686 | |
Series 2019-14A, Class A1AR, 144A, 3 Month LIBOR + 1.200% (Cap N/A, Floor 1.200%) | |
1.332%(c) | | | 10/20/34 | | | | | | | | 4,875 | | | | 4,875,908 | |
Jefferson Mill CLO Ltd. (Cayman Islands), | | | | | |
Series 2015-01A, Class AR, 144A, 3 Month LIBOR + 1.175% (Cap N/A, Floor 0.000%) | |
1.307%(c) | | | 10/20/31 | | | | | | | | 6,729 | | | | 6,726,666 | |
Madison Park Funding Ltd. (Cayman Islands), | | | | | |
Series 2012-10A, Class AR3, 144A, 3 Month LIBOR + 1.010% (Cap N/A, Floor 0.000%) | |
1.142%(c) | | | 01/20/29 | | | | | | | | 5,019 | | | | 5,016,252 | |
MidOcean Credit CLO (Cayman Islands), | | | | | |
Series 2014-03A, Class A1R, 144A, 3 Month LIBOR + 1.120% (Cap N/A, Floor 1.120%) | |
1.250%(c) | | | 04/21/31 | | | | | | | | 2,372 | | | | 2,371,550 | |
Northwoods Capital Ltd. (Cayman Islands), | | | | | |
Series 2017-15A, Class A1R, 144A, 3 Month LIBOR + 1.210% (Cap N/A, Floor 1.210%) | |
1.424%(c) | | | 06/20/34 | | | | | | | | 9,500 | | | | 9,503,056 | |
Octagon Investment Partners 31 LLC (Cayman Islands), | |
Series 2017-01A, Class AR, 144A, 3 Month LIBOR + 1.050% (Cap N/A, Floor 1.050%) | |
1.182%(c) | | | 07/20/30 | | | | | | | | 3,500 | | | | 3,499,293 | |
OZLM Ltd. (Cayman Islands), | | | | | |
Series 2015-11A, Class A1R, 144A, 3 Month LIBOR + 1.250% (Cap N/A, Floor 0.000%) | |
1.382%(c) | | | 10/30/30 | | | | | | | | 1,484 | | | | 1,484,884 | |
| | | | | | | | | | | | | | | | | | | | |
Interest
Rate | | Maturity
Date | | | | | | Principal
Amount
(000)# | | | Value | |
| | | | | | | | | | | | | | | | |
| |
| ASSET-BACKED SECURITIES (continued) | | | | | |
Collateralized Loan Obligations (cont’d.) | | | | | |
Palmer Square CLO Ltd. (Cayman Islands), | | | | | |
Series 2014-01A, Class A1R2, 144A, 3 Month LIBOR + 1.130% (Cap N/A, Floor 1.130%) | |
1.252%(c) | | | 01/17/31 | | | | | | | | | | | | 1,500 | | | $ | 1,500,083 | |
Series 2018-02A, Class A1A, 144A, 3 Month LIBOR + 1.100% (Cap N/A, Floor 0.000%) | |
1.222%(c) | | | 07/16/31 | | | | | | | | | | | | 2,350 | | | | 2,350,051 | |
Park Avenue Institutional Advisers CLO Ltd. (Cayman Islands), | | | | | |
Series 2018-01A, Class A1AR, 144A, 3 Month LIBOR + 1.000% (Cap N/A, Floor 1.000%) | |
1.132%(c) | | | 10/20/31 | | | | | | | | | | | | 8,750 | | | | 8,744,597 | |
Regatta Funding Ltd. (Cayman Islands), | | | | | | | | | |
Series 2016-01A, Class A1R2, 144A, 3 Month LIBOR + 1.150% (Cap N/A, Floor 1.150%) | |
1.364%(c) | | | 06/20/34 | | | | | | | | | | | | 5,500 | | | | 5,496,956 | |
Romark CLO Ltd. (Cayman Islands), | | | | | |
Series 2018-02A, Class A1, 144A, 3 Month LIBOR + 1.175% (Cap N/A, Floor 1.175%) | |
1.299%(c) | | | 07/25/31 | | | | | | | | | | | | 1,000 | | | | 1,000,000 | |
TCW CLO Ltd. (Cayman Islands), | | | | | |
Series 2021-02A, Class AS, 144A, 3 Month LIBOR + 1.180% (Cap N/A, Floor 1.180%) | |
1.305%(c) | | | 07/25/34 | | | | | | | | | | | | 6,750 | | | | 6,753,225 | |
Telos CLO Ltd. (Cayman Islands), | | | | | |
Series 2013-04A, Class AR, 144A, 3 Month LIBOR + 1.240% (Cap N/A, Floor 0.000%) | |
1.362%(c) | | | 01/17/30 | | | | | | | | | | | | 2,479 | | | | 2,479,734 | |
TICP CLO Ltd. (Cayman Islands), | | | | | |
Series 2018-03R, Class A, 144A, 3 Month LIBOR + 0.840% (Cap N/A, Floor 0.840%) | |
0.972%(c) | | | 04/20/28 | | | | | | | | | | | | 2,306 | | | | 2,305,141 | |
Toro European CLO DAC (Ireland), | | | | | |
Series 02A, Class ARR, 144A, 3 Month EURIBOR + 0.990% (Cap N/A, | |
Floor 0.990%) | | | | | | | | | | | | | | | | | |
0.990%(c) | | | 07/25/34 | | | | | | | | EUR | | | | 4,500 | | | | 5,078,965 | |
Trimaran Cavu Ltd. (Cayman Islands), | | | | | | | | | |
Series 2019-01A, Class A1, 144A, 3 Month LIBOR + 1.460% (Cap N/A, Floor 1.460%) | |
1.592%(c) | | | 07/20/32 | | | | | | | | | | | | 3,000 | | | | 3,004,490 | |
Venture CLO Ltd. (Cayman Islands), | | | | | |
Series 2015-21A, Class AR, 144A, 3 Month LIBOR + 0.880% (Cap N/A, Floor 0.000%) | |
1.004%(c) | | | 07/15/27 | | | | | | | | | | | | 281 | | | | 281,598 | |
Wellfleet CLO Ltd. (Cayman Islands), | | | | | |
Series 2017-03A, Class A1, 144A, 3 Month LIBOR + 1.150% (Cap N/A, Floor 1.150%) | |
1.272%(c) | | | 01/17/31 | | | | | | | | | | | | 2,750 | | | | 2,750,135 | |
Series 2018-01A, Class A, 144A, 3 Month LIBOR + 1.100% (Cap N/A, Floor 1.100%) | |
1.222%(c) | | | 07/17/31 | | | | | | | | | | | | 3,500 | | | | 3,496,517 | |
Series 2018-02A, Class A1, 144A, 3 Month LIBOR + 1.200% (Cap N/A, Floor 1.200%) | |
1.332%(c) | | | 10/20/31 | | | | | | | | | | | | 5,750 | | | | 5,747,159 | |
| | | | | | | | | | | | | | | | | | | | |
| | | | | |
| | | | | | | | | | | | | | | | | | | 154,323,319 | |
| | | | | | | | | | | | | | | | | | | | |
SEE NOTES TO FINANCIAL STATEMENTS.
A54
| | | | | | |
| | |
| | PSF PGIM FLEXIBLE MANAGED PORTFOLIO (CONTINUED) | | |
| | | | | | |
| |
| SCHEDULE OF INVESTMENTS | | as of December 31, 2021 |
| | | | | | | | | | | | | | | | |
Interest
Rate | | Maturity
Date | | | | | | Principal
Amount
(000)# | | | Value | |
| | | | | | | | | | | | | | | | |
|
| ASSET-BACKED SECURITIES (continued) | |
Consumer Loans — 0.2% | | | | | |
Lendmark Funding Trust, | | | | | |
Series 2019-02A, Class A, 144A | | | | | |
2.780% | | | 04/20/28 | | | | | | | | 3,300 | | | $ | 3,346,078 | |
OneMain Financial Issuance Trust, | | | | | |
Series 2020-01A, Class A, 144A | | | | | |
3.840% | | | 05/14/32 | | | | | | | | 1,200 | | | | 1,227,129 | |
Series 2020-02A, Class A, 144A | | | | | |
1.750% | | | 09/14/35 | | | | | | | | 2,100 | | | | 2,086,263 | |
Series 2021-01A, Class A2, 144A, 30 Day Average SOFR + 0.760% (Cap N/A, Floor 0.000%) | |
0.810%(c) | | | 06/16/36 | | | | | | | | 2,800 | | | | 2,801,394 | |
Oportun Funding XIV LLC, | | | | | |
Series 2021-A, Class A, 144A | | | | | |
1.210% | | | 03/08/28 | | | | | | | | 1,100 | | | | 1,097,509 | |
| | | | | | | | | | | | | | | | |
| | | | |
| | | | | | | | | | | | | | | 10,558,373 | |
| | | | | | | | | | | | | | | | |
Equipment — 0.2% | | | | | | | | | | | | | |
MMAF Equipment Finance LLC, | | | | | |
Series 2017-B, Class A5, 144A | | | | | |
2.720% | | | 06/15/40 | | | | | | | | 2,800 | | | | 2,873,708 | |
Series 2018-A, Class A5, 144A | | | | | |
3.610% | | | 03/10/42 | | | | | | | | 800 | | | | 837,412 | |
Series 2019-A, Class A5, 144A | | | | | |
3.080% | | | 11/12/41 | | | | | | | | 2,500 | | | | 2,599,474 | |
Series 2019-B, Class A5, 144A | | | | | |
2.290% | | | 11/12/41 | | | | | | | | 2,400 | | | | 2,460,975 | |
| | | | | | | | | | | | | | | | |
| | | | |
| | | | | | | | | | | | | | | 8,771,569 | |
| | | | | | | | | | | | | | | | |
Home Equity Loans — 0.0% | | | | | |
CDC Mortgage Capital Trust, | | | | | |
Series 2002-HE03, Class M1, 1 Month LIBOR + 1.650% (Cap N/A, Floor 1.650%) | |
1.752%(c) | | | 03/25/33 | | | | | | | | 17 | | | | 18,037 | |
| | | | | | | | | | | | | | | | |
Other — 0.1% | | | | | | | | | |
Home Partners of America Trust, | | | | | |
Series 2021-03, Class A, 144A | | | | | |
2.200% | | | 01/17/41 | | | | | | | | 1,850 | | | | 1,844,037 | |
TH MSR Issuer Trust, | | | | | | | | | | | | | |
Series 2019-FT01, Class A, 144A, 1 Month LIBOR + 2.800% (Cap N/A, Floor 2.800%) | |
2.892%(c) | | | 06/25/24 | | | | | | | | 3,250 | | | | 3,240,195 | |
| | | | | | | | | | | | | | | | |
| | | | |
| | | | | | | | | | | | | | | 5,084,232 | |
| | | | | | | | | | | | | | | | |
Residential Mortgage-Backed Securities — 0.1% | |
Legacy Mortgage Asset Trust, | | | | | |
Series 2019-GS02, Class A1, 144A | | | | | |
3.750% | | | 01/25/59 | | | | | | | | 464 | | | | 464,289 | |
Series 2019-GS04, Class A1, 144A | |
3.438% | | | 05/25/59 | | | | | | | | 994 | | | | 994,641 | |
Long Beach Mortgage Loan Trust, | | | | | |
Series 2004-02, Class M1, 1 Month LIBOR + 0.795% (Cap N/A, Floor 0.795%) | |
0.897%(c) | | | 06/25/34 | | | | | | | | 123 | | | | 122,166 | |
Mill City Mortgage Loan Trust, | |
Series 2017-03, Class A1, 144A | | | | | |
2.750%(cc) | | | 01/25/61 | | | | | | | | 723 | | | | 731,515 | |
| | | | | | | | | | | | | | | | | | | | |
Interest
Rate | | Maturity
Date | | | | | | Principal
Amount
(000)# | | | Value | |
| | | | | | | | | | | | | | | | |
|
| ASSET-BACKED SECURITIES (continued) | |
Residential Mortgage-Backed Securities (cont’d.) | |
TFS (Spain), | | | | | | | | | | | | | |
Series 2018-03, Class A1, 1 Month EURIBOR + 3.000% | |
3.000%(c) | | | 04/16/23 | | | | | | | | EUR | | | | 2,154 | | | $ | 2,207,171 | |
Towd Point Mortgage Trust, | | | | | | | | | |
Series 2017-05, Class A1, 144A, 1 Month LIBOR + 0.600% (Cap N/A, Floor 0.000%) | |
0.692%(c) | | | 02/25/57 | | | | | | | | | | | | 1,147 | | | | 1,146,730 | |
Series 2020-04, Class A1, 144A | |
1.750% | | | 10/25/60 | | | | | | | | | | | | 957 | | | | 954,549 | |
| | | | | | | | | | | | | | | | | | | | |
| | | | | |
| | | | | | | | | | | | | | | | | | | 6,621,061 | |
| | | | | | | | | | | | | | | | | | | | |
Student Loans — 0.4% | | | | | |
Commonbond Student Loan Trust, | | | | | |
Series 2017-BGS, Class A1, 144A | |
2.680% | | | 09/25/42 | | | | | | | | | | | | 923 | | | | 934,825 | |
Series 2018-AGS, Class A1, 144A | |
3.210% | | | 02/25/44 | | | | | | | | | | | | 695 | | | | 712,940 | |
Series 2018-CGS, Class A1, 144A | |
3.870% | | | 02/25/46 | | | | | | | | | | | | 218 | | | | 223,055 | |
Laurel Road Prime Student Loan Trust, | | | | | | | | | |
Series 2017-C, Class A2B, 144A | |
2.810% | | | 11/25/42 | | | | | | | | | | | | 306 | | | | 309,272 | |
Series 2018-B, Class A2FX, 144A | |
3.540% | | | 05/26/43 | | | | | | | | | | | | 585 | | | | 592,776 | |
Series 2019-A, Class A2FX, 144A | |
2.730% | | | 10/25/48 | | | | | | | | | | | | 490 | | | | 494,392 | |
Navient Private Education Refi Loan Trust, | |
Series 2018-A, Class A2, 144A | |
3.190% | | | 02/18/42 | | | | | | | | | | | | 1,038 | | | | 1,047,362 | |
Series 2018-CA, Class A2, 144A | |
3.520% | | | 06/16/42 | | | | | | | | | | | | 574 | | | | 582,691 | |
Series 2019-CA, Class A2, 144A | |
3.130% | | | 02/15/68 | | | | | | | | | | | | 1,299 | | | | 1,324,210 | |
Series 2020-BA, Class A2, 144A | |
2.120% | | | 01/15/69 | | | | | | | | | | | | 1,200 | | | | 1,212,845 | |
Pennsylvania Higher Education Assistance Agency, | |
Series 2021-01A, Class A, 144A, 1 Month LIBOR + 0.530% (Cap N/A, Floor 0.530%) | |
0.633%(c) | | | 05/25/70 | | | | | | | | | | | | 2,522 | | | | 2,524,115 | |
SoFi Professional Loan Program LLC, | |
Series 2019-A, Class A2FX, 144A | |
3.690% | | | 06/15/48 | | | | | | | | | | | | 1,086 | | | | 1,112,655 | |
Series 2019-B, Class A2FX, 144A | |
3.090% | | | 08/17/48 | | | | | | | | | | | | 1,270 | | | | 1,295,765 | |
Series 2019-C, Class A2FX, 144A | |
2.370% | | | 11/16/48 | | | | | | | | | | | | 1,908 | | | | 1,931,006 | |
SoFi Professional Loan Program Trust, | | | | | | | | | |
Series 2018-B, Class A2FX, 144A | |
3.340% | | | 08/25/47 | | | | | | | | | | | | 1,376 | | | | 1,399,766 | |
Series 2020-A, Class A2FX, 144A | |
2.540% | | | 05/15/46 | | | | | | | | | | | | 2,377 | | | | 2,419,479 | |
| | | | | | | | | | | | | | | | | | | | |
| | | | | |
| | | | | | | | | | | | | | | | | | | 18,117,154 | |
| | | | | | | | | | | | | | | | | | | | |
| | |
TOTAL ASSET-BACKED SECURITIES (cost $289,098,825) | | | | | | | | 289,640,438 | |
| | | | | | | | | | | | | | | | | | | | |
SEE NOTES TO FINANCIAL STATEMENTS.
A55
| | | | | | |
| | |
| | PSF PGIM FLEXIBLE MANAGED PORTFOLIO (CONTINUED) | | |
| | | | | | |
| |
| SCHEDULE OF INVESTMENTS | | as of December 31, 2021 |
| | | | | | | | | | | | | | |
| | | | | | | | Principal | | | | |
| Interest | | Maturity | | | | | Amount | | | | |
| Rate | | Date | | | | | (000)# | | | Value | |
| | | | | | | | | | | | | | |
|
COMMERCIAL MORTGAGE-BACKED SECURITIES — 5.0% | |
Arbor Multifamily Mortgage Securities Trust, | | | | | |
Series 2021-MF03, Class A3, 144A | |
2.168% | | 10/15/54 | | | | | | | 8,000 | | | $ | 8,083,281 | |
Series 2021-MF03, Class ASB, 144A | |
2.378% | | 10/15/54 | | | | | | | 3,800 | | | | 3,869,274 | |
Assurant Commercial Mortgage Trust, | |
Series 2016-01A, Class AS, 144A | |
3.172% | | 05/15/49 | | | | | | | 4,000 | | | | 4,111,328 | |
BANK, | | | | | | | | | | | | | | |
Series 2017-BNK04, Class A3 | | | | | |
3.362% | | 05/15/50 | | | | | | | 6,500 | | | | 6,904,578 | |
Series 2021-BN35, Class A3 | | | | | |
1.717% | | 06/15/64 | | | | | | | 4,900 | | | | 4,771,735 | |
Series 2021-BN35, Class ASB | |
2.067% | | 06/15/64 | | | | | | | 3,200 | | | | 3,208,916 | |
Barclays Commercial Mortgage Securities Trust, | |
Series 2018-C02, Class A4 | |
4.047% | | 12/15/51 | | | | | | | 5,400 | | | | 6,033,570 | |
Benchmark Mortgage Trust, | |
Series 2018-B03, Class A4 | | | | | |
3.761% | | 04/10/51 | | | | | | | 5,000 | | | | 5,420,236 | |
Series 2018-B08, Class A4 | |
3.963% | | 01/15/52 | | | | | | | 6,700 | | | | 7,309,358 | |
Series 2021-B24, Class A3 | |
2.010% | | 03/15/54 | | | | | | | 2,900 | | | | 2,912,352 | |
BXP Trust, | | | | | |
Series 2021-601L, Class A, 144A | |
2.618% | | 01/15/44 | | | | | | | 7,750 | | | | 7,889,799 | |
Cantor Commercial Real Estate Lending, | | | | | |
Series 2019-CF02, Class A3 | |
2.647% | | 11/15/52 | | | | | | | 8,000 | | | | 8,133,058 | |
Citigroup Commercial Mortgage Trust, | |
Series 2014-GC21, Class A4 | |
3.575% | | 05/10/47 | | | | | | | 1,098 | | | | 1,131,471 | |
Series 2014-GC23, Class A3 | | | | | |
3.356% | | 07/10/47 | | | | | | | 1,549 | | | | 1,596,926 | |
Series 2016-C01, Class A3 | | | | | |
2.944% | | 05/10/49 | | | | | | | 5,000 | | | | 5,158,049 | |
Series 2016-GC37, Class A3 | | | | | |
3.050% | | 04/10/49 | | | | | | | 5,047 | | | | 5,178,036 | |
Series 2017-P07, Class A3 | | | | | |
3.442% | | 04/14/50 | | | | | | | 5,500 | | | | 5,873,379 | |
Commercial Mortgage Trust, | | | | | |
Series 2014-CR18, Class A4 | |
3.550% | | 07/15/47 | | | | | | | 2,360 | | | | 2,434,819 | |
Series 2014-CR20, Class A3 | |
3.326% | | 11/10/47 | | | | | | | 4,525 | | | | 4,657,265 | |
Series 2015-CR27, Class A3 | |
3.349% | | 10/10/48 | | | | | | | 6,100 | | | | 6,329,162 | |
CSAIL Commercial Mortgage Trust, | |
Series 2015-C04, Class A3 | |
3.544% | | 11/15/48 | | | | | | | 2,979 | | | | 3,125,795 | |
Series 2017-C08, Class A3 | |
3.127% | | 06/15/50 | | | | | | | 5,300 | | | | 5,472,123 | |
FHLMC Multifamily Structured Pass-Through Certificates, | |
Series K020, Class X1, IO | |
1.333%(cc) | | 05/25/22 | | | | | | | 19,803 | | | | 38,279 | |
| | | | | | | | | | | | | | |
| | | | | | | | Principal | | | | |
| Interest | | Maturity | | | | | Amount | | | | |
| Rate | | Date | | | | | (000)# | | | Value | |
| | | | | | | | | | | | | | |
|
COMMERCIAL MORTGAGE-BACKED SECURITIES (continued) | |
Series K021, Class X1, IO | | | | | |
1.376%(cc) | | 06/25/22 | | | | | | | 5,918 | | | $ | 4,630 | |
Series K055, Class X1, IO | | | | | |
1.354%(cc) | | 03/25/26 | | | | | | | 13,339 | | | | 656,879 | |
Series K080, Class AM | | | | | |
3.986%(cc) | | 07/25/28 | | | | | | | 5,430 | | | | 6,163,057 | |
Series K157, Class A2 | | | | | |
3.990%(cc) | | 05/25/33 | | | | | | | 4,200 | | | | 4,888,825 | |
Series W5FX, Class AFX | | | | | |
3.214%(cc) | | 04/25/28 | | | | | | | 1,190 | | | | 1,294,341 | |
GS Mortgage Securities Corp. Trust, | | | | | |
Series 2021-RENT, Class A, 144A, 1 Month LIBOR + 0.700% (Cap N/A,Floor 0.700%) | |
0.803%(c) | | 11/21/35 | | | | | | | 1,550 | | | | 1,543,261 | |
GS Mortgage Securities Trust, | |
Series 2015-GC28, Class A4 | | | | | |
3.136% | | 02/10/48 | | | | | | | 3,876 | | | | 4,001,000 | |
Series 2015-GC32, Class A3 | | | | | |
3.498% | | 07/10/48 | | | | | | | 5,800 | | | | 6,072,654 | |
Series 2016-GS03, Class A3 | | | | | |
2.592% | | 10/10/49 | | | | | | | 5,387 | | | | 5,521,642 | |
Series 2016-GS04, Class A3 | | | | | |
3.178% | | 11/10/49 | | | | | | | 5,500 | | | | 5,721,464 | |
Series 2020-GSA02, Class A4 | | | | | |
1.721% | | 12/12/53 | | | | | | | 6,000 | | | | 5,780,914 | |
Series 2021-GSA03, Class A4 | | | | | |
2.369% | | 12/15/54 | | | | | | | 5,800 | | | | 5,815,095 | |
JPMBB Commercial Mortgage Securities Trust, | | | | | |
Series 2014-C25, Class A4A1 | | | | | |
3.408% | | 11/15/47 | | | | | | | 797 | | | | 825,046 | |
Series 2015-C27, Class A3A1 | | | | | |
2.920% | | 02/15/48 | | | | | | | 4,774 | | | | 4,909,088 | |
JPMorgan Chase Commercial Mortgage Securities Trust, | |
Series 2013-LC11, Class A4 | | | | | |
2.694% | | 04/15/46 | | | | | | | 634 | | | | 642,756 | |
MHC Commercial Mortgage Trust, | |
Series 2021-MHC, Class C, 144A, 1 Month LIBOR + 1.351% (Cap N/A, Floor 1.351%) | |
1.461%(c) | | 04/15/38 | | | | | | | 3,000 | | | | 2,993,425 | |
Morgan Stanley Bank of America Merrill Lynch Trust, | |
Series 2013-C08, Class A3 | | | | | |
2.863% | | 12/15/48 | | | | | | | 1,169 | | | | 1,176,147 | |
Morgan Stanley Capital I Trust, | |
Series 2016-BNK02, Class A3 | | | | | |
2.791% | | 11/15/49 | | | | | | | 3,000 | | | | 3,112,819 | |
Series 2016-UB11, Class A3 | | | | | |
2.531% | | 08/15/49 | | | | | | | 10,400 | | | | 10,617,952 | |
Series 2018-H04, Class A3 | | | | | |
4.043% | | 12/15/51 | | | | | | | 1,900 | | | | 2,106,412 | |
Series 2019-H07, Class A2 | | | | | |
2.492% | | 07/15/52 | | | | | | | 13,500 | | | | 13,708,514 | |
UBS Commercial Mortgage Trust, | |
Series 2017-C02, Class ASB | | | | | |
3.264% | | 08/15/50 | | | | | | | 3,500 | | | | 3,662,375 | |
Series 2017-C05, Class A4 | | | | | |
3.212% | | 11/15/50 | | | | | | | 6,750 | | | | 7,070,273 | |
SEE NOTES TO FINANCIAL STATEMENTS.
A56
| | | | | | |
| | |
| | PSF PGIM FLEXIBLE MANAGED PORTFOLIO (CONTINUED) | | |
| | | | | | |
| |
| SCHEDULE OF INVESTMENTS | | as of December 31, 2021 |
| | | | | | | | | | | | | | | | |
Interest
Rate | | Maturity Date | | | | | | Principal Amount (000)# | | | Value | |
| | | | | | | | | | | | | | | | |
|
| COMMERCIAL MORTGAGE-BACKED SECURITIES (continued) | |
Series 2018-C09, Class A3 | | | | | |
3.854% | | | 03/15/51 | | | | | | | | 2,500 | | | $ | 2,706,855 | |
Series 2018-C14, Class A3 | | | | | |
4.180% | | | 12/15/51 | | | | | | | | 4,100 | | | | 4,476,512 | |
UBS-Barclays Commercial Mortgage Trust, | |
Series 2012-C04, Class A4 | | | | | |
2.792% | | | 12/10/45 | | | | | | | | 1,700 | | | | 1,704,407 | |
Series 2013-C05, Class A3 | | | | | |
2.920% | | | 03/10/46 | | | | | | | | 703 | | | | 710,131 | |
Series 2013-C06, Class A3 | | | | | |
2.971% | | | 04/10/46 | | | | | | | | 1,686 | | | | 1,707,226 | |
Wells Fargo Commercial Mortgage Trust, | |
Series 2016-NXS06, Class A3 | | | | | |
2.642% | | | 11/15/49 | | | | | | | | 8,000 | | | | 8,279,808 | |
Series 2017-C38, Class A4 | | | | | |
3.190% | | | 07/15/50 | | | | | | | | 4,600 | | | | 4,894,128 | |
Series 2018-C48, Class A4 | | | | | |
4.037% | | | 01/15/52 | | | | | | | | 7,000 | | | | 7,762,061 | |
Series 2020-C58, Class A3 | | | | | |
1.810% | | | 07/15/53 | | | | | | | | 7,100 | | | | 6,905,213 | |
| | | | | | | | | | | | | | | | |
TOTAL COMMERCIAL MORTGAGE-BACKED SECURITIES
(cost $240,276,474) | | | | 247,077,699 | |
| | | | | | | | | | | | | | | | |
| |
| CORPORATE BONDS — 8.8% | | | | | |
Aerospace & Defense — 0.2% | | | | | |
Boeing Co. (The), | |
Sr. Unsec’d. Notes | | | | | |
2.196% | | | 02/04/26 | | | | | | | | 2,160 | | | | 2,159,662 | |
3.750% | | | 02/01/50 | (a) | | | | | | | 2,130 | | | | 2,207,128 | |
Embraer Netherlands Finance BV (Brazil), | |
Gtd. Notes | | | | | |
5.050% | | | 06/15/25 | | | | | | | | 906 | | | | 937,458 | |
Embraer Overseas Ltd. (Brazil), | |
Gtd. Notes, 144A | | | | | |
5.696% | | | 09/16/23 | | | | | | | | 950 | | | | 992,818 | |
Raytheon Technologies Corp., | |
Sr. Unsec’d. Notes | | | | | |
4.125% | | | 11/16/28 | | | | | | | | 1,270 | | | | 1,421,213 | |
| | | | | | | | | | | | | | | | |
| | | | |
| | | | | | | | | | | | | | | 7,718,279 | |
| | | | | | | | | | | | | | | | |
Agriculture — 0.1% | | | | | |
Altria Group, Inc., | |
Gtd. Notes | | | | | |
3.400% | | | 02/04/41 | | | | | | | | 2,545 | | | | 2,346,618 | |
BAT Capital Corp. (United Kingdom), | |
Gtd. Notes | | | | | |
3.557% | | | 08/15/27 | | | | | | | | 1,895 | | | | 1,989,174 | |
Vector Group Ltd., | |
Sr. Sec’d. Notes, 144A | | | | | |
5.750% | | | 02/01/29 | | | | | | | | 1,250 | | | | 1,215,959 | |
| | | | | | | | | | | | | | | | |
| | | | |
| | | | | | | | | | | | | | | 5,551,751 | |
| | | | | | | | | | | | | | | | |
Airlines — 0.1% | | | | | |
American Airlines 2015-1 Class A Pass-Through Trust, | |
Pass-Through Certificates | | | | | |
3.375% | | | 11/01/28 | | | | | | | | 2,205 | | | | 2,184,426 | |
| | | | | | | | | | | | | | | | |
Interest
Rate | | Maturity Date | | | | | | Principal Amount (000)# | | | Value | |
| | | | | | | | | | | | | | | | |
|
| CORPORATE BONDS (continued) | |
Airlines (cont’d.) | | | | | |
Continental Airlines 2012-2 Class A Pass-Through Trust, | |
Pass-Through Certificates | | | | | |
4.000% | | | 04/29/26 | | | | | | | | 424 | | | $ | 439,316 | |
Southwest Airlines Co., | |
Sr. Unsec’d. Notes | | | | | |
5.125% | | | 06/15/27 | | | | | | | | 905 | | | | 1,035,847 | |
United Airlines, Inc., | |
Sr. Sec’d. Notes, 144A | | | | | |
4.375% | | | 04/15/26 | | | | | | | | 840 | | | | 876,454 | |
4.625% | | | 04/15/29 | | | | | | | | 165 | | | | 171,131 | |
| | | | | | | | | | | | | | | | |
| | | | |
| | | | | | | | | | | | | | | 4,707,174 | |
| | | | | | | | | | | | | | | | |
Apparel — 0.0% | | | | | |
Wolverine World Wide, Inc., | |
Gtd. Notes, 144A | | | | | |
4.000% | | | 08/15/29 | | | | | | | | 725 | | | | 701,662 | |
| | | | | | | | | | | | | | | | |
Auto Manufacturers — 0.3% | | | | | |
Daimler Trucks Finance North America LLC (Germany), | |
Gtd. Notes, 144A | | | | | |
1.625% | | | 12/13/24 | | | | | | | | 5,350 | | | | 5,388,455 | |
Ford Motor Co., | |
Sr. Unsec’d. Notes | | | | | |
5.291% | | | 12/08/46 | | | | | | | | 1,220 | | | | 1,431,311 | |
Ford Motor Credit Co. LLC, | |
Sr. Unsec’d. Notes | | | | | |
2.900% | | | 02/16/28 | | | | | | | | 200 | | | | 200,944 | |
3.350% | | | 11/01/22 | | | | | | | | 4,205 | | | | 4,262,278 | |
General Motors Co., | |
Sr. Unsec’d. Notes | | | | | |
6.250% | | | 10/02/43 | | | | | | | | 980 | | | | 1,340,415 | |
6.600% | | | 04/01/36 | | | | | | | | 760 | | | | 1,026,236 | |
General Motors Financial Co., Inc., | |
Gtd. Notes | | | | | |
3.950% | | | 04/13/24 | | | | | | | | 2,800 | | | | 2,948,713 | |
| | | | | | | | | | | | | | | | |
| | | | |
| | | | | | | | | | | | | | | 16,598,352 | |
| | | | | | | | | | | | | | | | |
Banks — 2.6% | | | | | |
Banco Santander SA (Spain), | |
Sr. Unsec’d. Notes, 3 Month LIBOR + 1.120% | | | | | |
1.241%(c) | | | 04/12/23 | | | | | | | | 800 | | | | 808,007 | |
Sr. Unsec’d. Notes | | | | | |
1.849% | | | 03/25/26 | | | | | | | | 1,000 | | | | 994,347 | |
Bank of America Corp., | |
Jr. Sub. Notes, Series JJ | | | | | |
5.125%(ff) | | | 06/20/24 | (oo) | | | | | | | 1,665 | | | | 1,734,914 | |
Jr. Sub. Notes, Series MM | | | | | |
4.300%(ff) | | | 01/28/25 | (oo) | | | | | | | 1,440 | | | | 1,460,344 | |
Sr. Unsec’d. Notes, MTN | | | | | |
1.898%(ff) | | | 07/23/31 | | | | | | | | 2,600 | | | | 2,493,068 | |
2.496%(ff) | | | 02/13/31 | | | | | | | | 3,085 | | | | 3,096,175 | |
3.824%(ff) | | | 01/20/28 | | | | | | | | 955 | | | | 1,034,886 | |
4.125% | | | 01/22/24 | (a) | | | | | | | 4,830 | | | | 5,133,125 | |
4.271%(ff) | | | 07/23/29 | | | | | | | | 510 | | | | 568,539 | |
Sub. Notes, MTN | | | | | |
4.000% | | | 01/22/25 | | | | | | | | 2,000 | | | | 2,138,736 | |
4.450% | | | 03/03/26 | | | | | | | | 8,455 | | | | 9,316,835 | |
SEE NOTES TO FINANCIAL STATEMENTS.
A57
| | | | | | |
| | |
| | PSF PGIM FLEXIBLE MANAGED PORTFOLIO (CONTINUED) | | |
| | | | | | |
| |
| SCHEDULE OF INVESTMENTS | | as of December 31, 2021 |
| | | | | | | | | | | | | | | | |
Interest
Rate | | Maturity Date | | | | | | Principal Amount (000)# | | | Value | |
| | | | | | | | | | | | | | | | |
|
| CORPORATE BONDS (continued) | |
Banks (cont’d.) | | | | | |
Bank of America NA, | |
Sub. Notes | | | | | |
6.000% | | | 10/15/36 | | | | | | | | 410 | | | $ | 560,298 | |
Barclays PLC (United Kingdom), | |
Sr. Unsec’d. Notes | | | | | |
3.650% | | | 03/16/25 | | | | | | | | 850 | | | | 898,739 | |
3.932%(ff) | | | 05/07/25 | | | | | | | | 585 | | | | 615,734 | |
Sr. Unsec’d. Notes, MTN | | | | | |
4.972%(ff) | | | 05/16/29 | | | | | | | | 3,825 | | | | 4,376,830 | |
BNP Paribas SA (France), | |
Sr. Unsec’d. Notes, 144A | | | | | |
1.323%(ff) | | | 01/13/27 | | | | | | | | 1,800 | | | | 1,751,350 | |
2.219%(ff) | | | 06/09/26 | | | | | | | | 2,330 | | | | 2,353,873 | |
Citigroup, Inc., | |
Jr. Sub. Notes, Series V | | | | | |
4.700%(ff) | | | 01/30/25 | (oo) | | | | | | | 1,400 | | | | 1,423,554 | |
Sr. Unsec’d. Notes | | | | | |
2.561%(ff) | | | 05/01/32 | | | | | | | | 1,260 | | | | 1,267,186 | |
3.200% | | | 10/21/26 | | | | | | | | 1,870 | | | | 1,982,162 | |
3.700% | | | 01/12/26 | | | | | | | | 6,180 | | | | 6,681,290 | |
Sub. Notes | | | | | |
4.450% | | | 09/29/27 | | | | | | | | 5,965 | | | | 6,651,021 | |
4.750% | | | 05/18/46 | | | | | | | | 820 | | | | 1,014,989 | |
Credit Agricole SA (France), | |
Sr. Unsec’d. Notes, 144A | | | | | |
1.247%(ff) | | | 01/26/27 | | | | | | | | 1,495 | | | | 1,452,673 | |
Sr. Unsec’d. Notes, 144A, MTN | | | | | |
1.907%(ff) | | | 06/16/26 | | | | | | | | 1,160 | | | | 1,162,637 | |
Credit Suisse Group AG (Switzerland), | |
Sr. Unsec’d. Notes, 144A | | | | | |
2.193%(ff) | | | 06/05/26 | | | | | | | | 1,560 | | | | 1,569,723 | |
3.091%(ff) | | | 05/14/32 | | | | | | | | 885 | | | | 899,683 | |
4.282% | | | 01/09/28 | | | | | | | | 1,370 | | | | 1,490,141 | |
Deutsche Bank AG (Germany), | |
Sr. Unsec’d. Notes | | | | | |
2.129%(ff) | | | 11/24/26 | | | | | | | | 440 | | | | 439,444 | |
Sr. Unsec’d. Notes, Series D | | | | | |
5.000% | | | 02/14/22 | | | | | | | | 2,400 | | | | 2,410,908 | |
Discover Bank, | |
Sr. Unsec’d. Notes | | | | | |
4.250% | | | 03/13/26 | | | | | | | | 970 | | | | 1,059,340 | |
Goldman Sachs Group, Inc. (The), | |
Jr. Sub. Notes, Series O | | | | | |
5.300%(ff) | | | 11/10/26 | (oo) | | | | | | | 740 | | | | 803,742 | |
Sr. Unsec’d. Notes | | | | | |
3.500% | | | 01/23/25 | | | | | | | | 4,100 | | | | 4,324,778 | |
3.750% | | | 02/25/26 | | | | | | | | 1,010 | | | | 1,086,729 | |
3.814%(ff) | | | 04/23/29 | | | | | | | | 540 | | | | 587,743 | |
3.850% | | | 01/26/27 | | | | | | | | 2,910 | | | | 3,133,079 | |
Sub. Notes | | | | | |
6.750% | | | 10/01/37 | | | | | | | | 104 | | | | 147,464 | |
JPMorgan Chase & Co., | |
Jr. Sub. Notes, Series HH | | | | | |
4.600%(ff) | | | 02/01/25 | (oo) | | | | | | | 1,645 | | | | 1,681,487 | |
Jr. Sub. Notes, Series I, 3 Month LIBOR + 3.470% | | | | | |
3.599%(c) | | | 04/30/22 | (oo) | | | | | | | 978 | | | | 980,575 | |
| | | | | | | | | | | | | | | | |
Interest
Rate | | Maturity Date | | | | | | Principal Amount (000)# | | | Value | |
| | | | | | | | | | | | | | | | |
|
| CORPORATE BONDS (continued) | |
Banks (cont’d.) | | | | | |
Jr. Sub. Notes, Series II | | | | | |
4.000%(ff) | | | 04/01/25(a)(oo) | | | | | | | | 1,045 | | | $ | 1,051,001 | |
Sr. Unsec’d. Notes | | | | | |
3.782%(ff) | | | 02/01/28 | | | | | | | | 695 | | | | 752,927 | |
3.964%(ff) | | | 11/15/48 | | | | | | | | 3,250 | | | | 3,804,933 | |
4.005%(ff) | | | 04/23/29 | | | | | | | | 2,170 | | | | 2,397,415 | |
4.452%(ff) | | | 12/05/29 | | | | | | | | 3,350 | | | | 3,801,788 | |
Sub. Notes | | | | | |
3.875% | | | 09/10/24 | | | | | | | | 3,775 | | | | 4,017,490 | |
Morgan Stanley, | |
Jr. Sub. Notes, Series H, 3 Month LIBOR + 3.610% | | | | | |
3.734%(c) | | | 01/18/22(a)(oo) | | | | | | | | 840 | | | | 840,311 | |
Sr. Unsec’d. Notes, GMTN | | | | | |
2.239%(ff) | | | 07/21/32 | | | | | | | | 630 | | | | 617,233 | |
3.772%(ff) | | | 01/24/29 | | | | | | | | 8,775 | | | | 9,554,594 | |
3.875% | | | 01/27/26 | | | | | | | | 675 | | | | 731,789 | |
4.431%(ff) | | | 01/23/30 | | | | | | | | 515 | | | | 586,445 | |
Sr. Unsec’d. Notes, MTN | | | | | |
3.591%(ff) | | | 07/22/28 | | | | | | | | 1,255 | | | | 1,353,765 | |
Sub. Notes, GMTN | | | | | |
4.350% | | | 09/08/26 | | | | | | | | 3,825 | | | | 4,236,658 | |
Societe Generale SA (France), | |
Sr. Unsec’d. Notes, 144A | | | | | |
1.488%(ff) | | | 12/14/26 | | | | | | | | 4,400 | | | | 4,289,431 | |
State Bank of India (India), | |
Sr. Unsec’d. Notes, 144A | | | | | |
4.375% | | | 01/24/24 | | | | | | | | 1,925 | | | | 2,029,267 | |
Texas Capital Bank NA, | |
Sr. Unsec’d. Notes, 144A, 3 Month LIBOR + 4.500% | | | | | |
4.724%(c) | | | 09/30/24 | | | | | | | | 2,670 | | | | 2,673,345 | |
Wells Fargo & Co., | |
Sr. Unsec’d. Notes, MTN | | | | | |
2.572%(ff) | | | 02/11/31 | | | | | | | | 4,175 | | | | 4,261,452 | |
| | | | | | | | | | | | | | | | |
| | | | |
| | | | | | | | | | | | | | | 128,585,992 | |
| | | | | | | | | | | | | | | | |
Beverages — 0.2% | | | | | |
Anheuser-Busch Cos. LLC/Anheuser-Busch InBev Worldwide, Inc. (Belgium), | |
Gtd. Notes | | | | | |
4.900% | | | 02/01/46 | | | | | | | | 620 | | | | 785,338 | |
Anheuser-Busch InBev Worldwide, Inc. (Belgium), | |
Gtd. Notes | | | | | |
5.550% | | | 01/23/49 | | | | | | | | 450 | | | | 622,400 | �� |
8.000% | | | 11/15/39 | | | | | | | | 1,285 | | | | 2,081,572 | |
8.200% | | | 01/15/39 | | | | | | | | 250 | | | | 406,661 | |
Bacardi Ltd. (Bermuda), | |
Gtd. Notes, 144A | | | | | |
2.750% | | | 07/15/26 | | | | | | | | 3,975 | | | | 4,095,683 | |
Constellation Brands, Inc., | |
Gtd. Notes | | | | | |
4.250% | | | 05/01/23 | | | | | | | | 1,400 | | | | 1,460,176 | |
Sr. Unsec’d. Notes | | | | | |
2.250% | | | 08/01/31 | | | | | | | | 1,015 | | | | 992,094 | |
| | | | | | | | | | | | | | | | |
| | | | |
| | | | | | | | | | | | | | | 10,443,924 | |
| | | | | | | | | | | | | | | | |
SEE NOTES TO FINANCIAL STATEMENTS.
A58
| | | | | | |
| | |
| | PSF PGIM FLEXIBLE MANAGED PORTFOLIO (CONTINUED) | | |
| | | | | | |
| |
| SCHEDULE OF INVESTMENTS | | as of December 31, 2021 |
| | | | | | | | | | | | | | | | |
Interest
Rate | | Maturity Date | | | | | | Principal Amount (000)# | | | Value | |
| | | | | | | | | | | | | | | | |
|
| CORPORATE BONDS (continued) | |
Biotechnology — 0.1% | | | | | |
Amgen, Inc., | |
Sr. Unsec’d. Notes | | | | | |
2.800% | | | 08/15/41 | | | | | | | | 4,050 | | | $ | 3,917,841 | |
Regeneron Pharmaceuticals, Inc., | |
Sr. Unsec’d. Notes | | | | | |
2.800% | | | 09/15/50 | | | | | | | | 570 | | | | 535,499 | |
| | | | | | | | | | | | | | | | |
| | | | |
| | | | | | | | | | | | | | | 4,453,340 | |
| | | | | | | | | | | | | | | | |
Building Materials — 0.0% | | | | | | | | | |
Masonite International Corp., | |
Gtd. Notes, 144A | | | | | |
3.500% | | | 02/15/30 | | | | | | | | 875 | | | | 867,761 | |
Standard Industries, Inc., | |
Sr. Unsec’d. Notes, 144A | | | | | |
4.375% | | | 07/15/30 | (a) | | | | | | | 760 | | | | 776,203 | |
4.750% | | | 01/15/28 | | | | | | | | 700 | | | | 724,121 | |
| | | | | | | | | | | | | | | | |
| | | | |
| | | | | | | | | | | | | | | 2,368,085 | |
| | | | | | | | | | | | | | | | |
Chemicals — 0.1% | | | | | | | | | |
CF Industries, Inc., | |
Gtd. Notes | | | | | |
5.375% | | | 03/15/44 | | | | | | | | 1,015 | | | | 1,281,183 | |
Dow Chemical Co. (The), | |
Sr. Unsec’d. Notes | | | | | |
4.375% | | | 11/15/42 | | | | | | | | 95 | | | | 113,302 | |
5.250% | | | 11/15/41 | | | | | | | | 45 | | | | 58,140 | |
9.400% | | | 05/15/39 | | | | | | | | 155 | | | | 278,588 | |
NOVA Chemicals Corp. (Canada), | |
Sr. Unsec’d. Notes, 144A | | | | | |
4.875% | | | 06/01/24 | | | | | | | | 1,300 | | | | 1,348,074 | |
Nutrien Ltd. (Canada), | |
Sr. Unsec’d. Notes | | | | | |
3.150% | | | 10/01/22 | | | | | | | | 780 | | | | 789,758 | |
Sasol Financing USA LLC (South Africa), | |
Gtd. Notes | | | | | |
5.875% | | | 03/27/24 | | | | | | | | 700 | | | | 728,971 | |
6.500% | | | 09/27/28 | | | | | | | | 670 | | | | 725,646 | |
| | | | | | | | | | | | | | | | |
| | | | |
| | | | | | | | | | | | | | | 5,323,662 | |
| | | | | | | | | | | | | | | | |
Commercial Services — 0.1% | | | | | |
ERAC USA Finance LLC, | |
Gtd. Notes, 144A | | | | | |
4.200% | | | 11/01/46 | | | | | | | | 975 | | | | 1,151,437 | |
6.700% | | | 06/01/34 | | | | | | | | 420 | | | | 582,151 | |
7.000% | | | 10/15/37 | | | | | | | | 380 | | | | 560,617 | |
Massachusetts Institute of Technology, | |
Unsec’d. Notes | | | | | |
3.885% | | | 07/01/2116 | | | | | | | | 1,500 | | | | 1,880,371 | |
United Rentals North America, Inc., | |
Gtd. Notes | | | | | |
3.750% | | | 01/15/32 | | | | | | | | 325 | | | | 327,572 | |
4.875% | | | 01/15/28 | | | | | | | | 1,190 | | | | 1,250,409 | |
5.250% | | | 01/15/30 | | | | | | | | 385 | | | | 416,805 | |
| | | | | | | | | | | | | | | | |
| | | | |
| | | | | | | | | | | | | | | 6,169,362 | |
| | | | | | | | | | | | | | | | |
| | | | | | | | | | | | | | | | |
Interest
Rate | | Maturity Date | | | | | | Principal Amount (000)# | | | Value | |
| | | | | | | | | | | | | | | | |
|
| CORPORATE BONDS (continued) | |
Diversified Financial Services — 0.1% | | | | | |
BOC Aviation USA Corp. (Singapore), | |
Gtd. Notes, 144A, MTN | | | | | |
1.625% | | | 04/29/24 | | | | | | | | 670 | | | $ | 669,304 | |
CDP Financial, Inc. (Canada), | |
Gtd. Notes, 144A | | | | | |
3.150% | | | 07/24/24 | | | | | | | | 480 | | | | 506,031 | |
Discover Financial Services, | |
Sr. Unsec’d. Notes | | | | | |
3.850% | | | 11/21/22 | | | | | | | | 900 | | | | 923,964 | |
Nomura Holdings, Inc. (Japan), | |
Sr. Unsec’d. Notes | | | | | |
2.608% | | | 07/14/31 | | | | | | | | 2,055 | | | | 2,025,883 | |
OneMain Finance Corp., | |
Gtd. Notes | | | | | |
8.250% | | | 10/01/23 | | | | | | | | 1,600 | | | | 1,769,232 | |
Private Export Funding Corp., | |
U.S. Gov’t. Gtd. Notes, Series NN | | | | | |
3.250% | | | 06/15/25 | | | | | | | | 330 | | | | 349,504 | |
| | | | | | | | | | | | | | | | |
| | | | |
| | | | | | | | | | | | | | | 6,243,918 | |
| | | | | | | | | | | | | | | | |
Electric — 0.8% | | | | | |
Abu Dhabi National Energy Co. PJSC (United Arab Emirates), | |
Sr. Unsec’d. Notes, 144A, MTN | | | | | |
2.000% | | | 04/29/28 | | | | | | | | 525 | | | | 519,204 | |
Alfa Desarrollo SpA (Chile), | |
Sr. Sec’d. Notes, 144A | | | | | |
4.550% | | | 09/27/51 | | | | | | | | 630 | | | | 618,704 | |
Baltimore Gas & Electric Co., | |
Sr. Unsec’d. Notes | | | | | |
6.350% | | | 10/01/36 | | | | | | | | 550 | | | | 778,903 | |
Berkshire Hathaway Energy Co., | |
Sr. Unsec’d. Notes | | | | | |
5.950% | | | 05/15/37 | | | | | | | | 305 | | | | 411,150 | |
Calpine Corp., | |
Sr. Sec’d. Notes, 144A | | | | | |
3.750% | | | 03/01/31 | | | | | | | | 2,000 | | | | 1,929,111 | |
CenterPoint Energy Houston Electric LLC, | |
General Ref. Mortgage, Series K2 | | | | | |
6.950% | | | 03/15/33 | | | | | | | | 590 | | | | 810,366 | |
Commonwealth Edison Co., | |
First Mortgage, Series 123 | | | | | |
3.750% | | | 08/15/47 | | | | | | | | 1,610 | | | | 1,828,919 | |
Connecticut Light & Power Co. (The), | |
First Mortgage, Series A | | | | | |
2.050% | | | 07/01/31 | | | | | | | | 3,255 | | | | 3,219,135 | |
Consolidated Edison Co. of New York, Inc., | |
Sr. Unsec’d. Notes, Series 09-C | | | | | |
5.500% | | | 12/01/39 | | | | | | | | 220 | | | | 283,851 | |
Duke Energy Carolinas LLC, | |
First Mortgage | | | | | |
6.050% | | | 04/15/38 | | | | | | | | 550 | | | | 762,013 | |
First Ref. Mortgage | | | | | |
4.000% | | | 09/30/42 | | | | | | | | 570 | | | | 655,136 | |
El Paso Electric Co., | |
Sr. Unsec’d. Notes | | | | | |
6.000% | | | 05/15/35 | | | | | | | | 670 | | | | 877,337 | |
SEE NOTES TO FINANCIAL STATEMENTS.
A59
| | | | | | |
| | |
| | PSF PGIM FLEXIBLE MANAGED PORTFOLIO (CONTINUED) | | |
| | | | | | |
| |
| SCHEDULE OF INVESTMENTS | | as of December 31, 2021 |
| | | | | | | | | | | | | | | | |
Interest
Rate | | Maturity Date | | | | | | Principal Amount (000)# | | | Value | |
| | | | | | | | | | | | | | | | |
|
| CORPORATE BONDS (continued) | |
Electric (cont’d.) | | | | | |
Enel Finance International NV (Italy), | |
Gtd. Notes, 144A | | | | | |
2.250% | | | 07/12/31 | | | | | | | | 2,140 | | | $ | 2,072,962 | |
Engie Energia Chile SA (Chile), | |
Sr. Unsec’d. Notes, 144A | | | | | |
3.400% | | | 01/28/30 | | | | | | | | 400 | | | | 404,444 | |
Florida Power & Light Co., | |
First Mortgage | | | | | |
5.950% | | | 10/01/33 | | | | | | | | 295 | | | | 393,115 | |
Iberdrola International BV (Spain), | |
Gtd. Notes | | | | | |
6.750% | | | 09/15/33 | | | | | | | | 145 | | | | 196,510 | |
Indiana Michigan Power Co., | |
Sr. Unsec’d. Notes | | | | | |
3.850% | | | 05/15/28 | | | | | | | | 2,910 | | | | 3,216,824 | |
Israel Electric Corp. Ltd. (Israel), | |
Sr. Sec’d. Notes, 144A, GMTN | | | | | |
4.250% | | | 08/14/28 | | | | | | | | 470 | | | | 516,441 | |
Monongahela Power Co., | |
First Mortgage, 144A | | | | | |
4.100% | | | 04/15/24 | | | | | | | | 2,170 | | | | 2,284,769 | |
Northern States Power Co., | |
First Mortgage | | | | | |
3.600% | | | 09/15/47 | | | | | | | | 1,580 | | | | 1,766,531 | |
NRG Energy, Inc., | |
Gtd. Notes, 144A | | | | | |
3.875% | | | 02/15/32 | | | | | | | | 275 | | | | 270,500 | |
Sr. Sec’d. Notes, 144A | | | | | |
2.000% | | | 12/02/25 | | | | | | | | 320 | | | | 322,203 | |
2.450% | | | 12/02/27 | | | | | | | | 1,395 | | | | 1,384,049 | |
PECO Energy Co., | |
First Mortgage | | | | | |
2.800% | | | 06/15/50 | | | | | | | | 1,110 | | | | 1,089,863 | |
Public Service Electric & Gas Co., | |
First Mortgage, MTN | | | | | |
2.050% | | | 08/01/50 | | | | | | | | 1,005 | | | | 855,288 | |
3.700% | | | 05/01/28 | | | | | | | | 1,280 | | | | 1,415,133 | |
Sr. Sec’d. Notes, MTN | | | | | |
5.800% | | | 05/01/37 | | | | | | | | 535 | | | | 726,951 | |
Public Service Enterprise Group, Inc., | |
Sr. Unsec’d. Notes | | | | | |
1.600% | | | 08/15/30 | | | | | | | | 710 | | | | 658,843 | |
Puget Energy, Inc., | |
Sr. Sec’d. Notes | | | | | |
2.379% | | | 06/15/28 | | | | | | | | 1,115 | | | | 1,098,223 | |
San Diego Gas & Electric Co., | |
First Mortgage | | | | | |
4.150% | | | 05/15/48 | | | | | | | | 1,400 | | | | 1,672,446 | |
Southern California Edison Co., | |
First Ref. Mortgage | | | | | |
4.000% | | | 04/01/47 | | | | | | | | 580 | | | | 640,513 | |
First Ref. Mortgage, Series C | |
3.600% | | | 02/01/45 | | | | | | | | 860 | | | | 877,216 | |
Vistra Operations Co. LLC, | |
Gtd. Notes, 144A | | | | | |
5.000% | | | 07/31/27 | | | | | | | | 725 | | | | 752,616 | |
| | | | | | | | | | | | | | | | |
Interest
Rate | | Maturity Date | | | | | | Principal Amount (000)# | | | Value | |
| | | | | | | | | | | | | | | | |
|
| CORPORATE BONDS (continued) | |
Electric (cont’d.) | | | | | |
Sr. Sec’d. Notes, 144A | | | | | |
3.550% | | | 07/15/24 | | | | | | | | 2,135 | | | $ | 2,201,502 | |
Xcel Energy, Inc., | |
Sr. Unsec’d. Notes | | | | | |
4.800% | | | 09/15/41 | | | | | | | | 480 | | | | 586,768 | |
| | | | | | | | | | | | | | | | |
| | | | |
| | | | | | | | | | | | | | | 38,097,539 | |
| | | | | | | | | | | | | | | | |
Engineering & Construction — 0.1% | | | | | |
AECOM, | |
Gtd. Notes | | | | | |
5.125% | | | 03/15/27 | | | | | | | | 925 | | | | 1,006,893 | |
Mexico City Airport Trust (Mexico), | |
Sr. Sec’d. Notes, 144A | | | | | |
3.875% | | | 04/30/28 | | | | | | | | 700 | | | | 727,169 | |
5.500% | | | 07/31/47 | | | | | | | | 800 | | | | 800,861 | |
| | | | | | | | | | | | | | | | |
| | | | |
| | | | | | | | | | | | | | | 2,534,923 | |
| | | | | | | | | | | | | | | | |
Foods — 0.1% | | | | | |
Kraft Heinz Foods Co., | |
Gtd. Notes | | | | | |
4.875% | | | 10/01/49 | | | | | | | | 1,290 | | | | 1,624,755 | |
Lamb Weston Holdings, Inc., | |
Gtd. Notes, 144A | | | | | |
4.125% | | | 01/31/30 | | | | | | | | 500 | | | | 513,636 | |
4.375% | | | 01/31/32 | | | | | | | | 500 | | | | 515,844 | |
Mars, Inc., | |
Sr. Unsec’d. Notes, 144A | | | | | |
2.375% | | | 07/16/40 | | | | | | | | 660 | | | | 627,925 | |
Pilgrim’s Pride Corp., | |
Gtd. Notes, 144A | | | | | |
5.875% | | | 09/30/27 | | | | | | | | 1,625 | | | | 1,715,707 | |
| | | | | | | | | | | | | | | | |
| | | | |
| | | | | | | | | | | | | | | 4,997,867 | |
| | | | | | | | | | | | | | | | |
Gas — 0.1% | | | | | |
NiSource, Inc., | |
Sr. Unsec’d. Notes | | | | | |
1.700% | | | 02/15/31 | | | | | | | | 1,205 | | | | 1,127,607 | |
3.490% | | | 05/15/27 | (a) | | | | | | | 1,415 | | | | 1,521,729 | |
3.600% | | | 05/01/30 | | | | | | | | 1,270 | | | | 1,371,969 | |
| | | | | | | | | | | | | | | | |
| | | | |
| | | | | | | | | | | | | | | 4,021,305 | |
| | | | | | | | | | | | | | | | |
Healthcare-Products — 0.1% | | | | | |
DH Europe Finance II Sarl, | |
Gtd. Notes | | | | | |
1.350% | | | 09/18/39 | | | | EUR | | | | 1,635 | | | | 1,857,216 | |
Medtronic Global Holdings SCA, | |
Gtd. Notes | | | | | |
1.625% | | | 03/07/31 | | | | EUR | | | | 100 | | | | 123,535 | |
2.250% | | | 03/07/39 | | | | EUR | | | | 400 | | | | 519,520 | |
Mozart Debt Merger Sub, Inc., | |
Sr. Sec’d. Notes, 144A | | | | | |
3.875% | | | 04/01/29 | | | | | | | | 675 | | | | 672,652 | |
| | | | | | | | | | | | | | | | |
| | | | |
| | | | | | | | | | | | | | | 3,172,923 | |
| | | | | | | | | | | | | | | | |
SEE NOTES TO FINANCIAL STATEMENTS.
A60
| | | | | | |
| | |
| | PSF PGIM FLEXIBLE MANAGED PORTFOLIO (CONTINUED) | | |
| | | | | | |
| |
| SCHEDULE OF INVESTMENTS | | as of December 31, 2021 |
| | | | | | | | | | | | | | | | |
Interest
Rate | | Maturity Date | | | | | | Principal Amount (000)# | | | Value | |
| | | | | | | | | | | | | | | | |
|
| CORPORATE BONDS (continued) | |
Healthcare-Services — 0.1% | | | | | |
Aetna, Inc., | |
Sr. Unsec’d. Notes | | | | | |
6.625% | | | 06/15/36 | | | | | | | | 515 | | | $ | 735,150 | |
Anthem, Inc., | |
Sr. Unsec’d. Notes | | | | | |
4.625% | | | 05/15/42 | | | | | | | | 390 | | | | 485,656 | |
HCA, Inc., | |
Gtd. Notes | | | | | |
3.500% | | | 09/01/30 | | | | | | | | 250 | | | | 264,041 | |
5.375% | | | 02/01/25 | | | | | | | | 305 | | | | 335,124 | |
5.875% | | | 02/01/29 | | | | | | | | 525 | | | | 626,038 | |
Gtd. Notes, MTN | | | | | |
7.750% | | | 07/15/36 | | | | | | | | 450 | | | | 619,139 | |
Kaiser Foundation Hospitals, | |
Gtd. Notes | | | | | |
4.150% | | | 05/01/47 | | | | | | | | 940 | | | | 1,163,184 | |
Providence St. Joseph Health Obligated Group, | |
Unsec’d. Notes, Series 19A | | | | | |
2.532% | | | 10/01/29 | | | | | | | | 765 | | | | 789,565 | |
| | | | | | | | | | | | | | | | |
| | | | |
| | | | | | | | | | | | | | | 5,017,897 | |
| | | | | | | | | | | | | | | | |
Home Builders — 0.0% | | | | | |
Taylor Morrison Communities, Inc., | |
Gtd. Notes, 144A | | | | | |
5.875% | | | 06/15/27 | | | | | | | | 525 | | | | 588,888 | |
6.625% | | | 07/15/27 | | | | | | | | 700 | | | | 737,283 | |
Taylor Morrison Communities, Inc./Taylor Morrison Holdings II, Inc., | |
Gtd. Notes, 144A | | | | | |
5.625% | | | 03/01/24 | | | | | | | | 800 | | | | 854,251 | |
| | | | | | | | | | | | | | | | |
| | | | |
| | | | | | | | | | | | | | | 2,180,422 | |
| | | | | | | | | | | | | | | | |
Housewares — 0.0% | | | | | |
Newell Brands, Inc., | |
Sr. Unsec’d. Notes | | | | | |
4.700% | | | 04/01/26 | (a) | | | | | | | 1,695 | | | | 1,848,716 | |
| | | | | | | | | | | | | | | | |
Insurance — 0.1% | | | | | |
Liberty Mutual Group, Inc., | |
Gtd. Notes, 144A | | | | | |
3.951% | | | 10/15/50 | | | | | | | | 1,215 | | | | 1,348,050 | |
Lincoln National Corp., | |
Sr. Unsec’d. Notes | | | | | |
6.300% | | | 10/09/37 | | | | | | | | 772 | | | | 1,077,546 | |
Markel Corp., | |
Sr. Unsec’d. Notes | | | | | |
4.150% | | | 09/17/50 | | | | | | | | 410 | | | | 476,849 | |
5.000% | | | 03/30/43 | | | | | | | | 200 | | | | 242,344 | |
New York Life Insurance Co., | |
Sub. Notes, 144A | | | | | |
6.750% | | | 11/15/39 | | | | | | | | 660 | | | | 996,048 | |
Principal Financial Group, Inc., | |
Gtd. Notes | | | | | |
4.625% | | | 09/15/42 | | | | | | | | 130 | | | | 161,828 | |
Teachers Insurance & Annuity Association of America, | |
Sub. Notes, 144A | | | | | |
4.270% | | | 05/15/47 | | | | | | | | 1,450 | | | | 1,757,807 | |
| | | | | | | | | | | | | | | | |
Interest
Rate | | Maturity Date | | | | | | Principal Amount (000)# | | | Value | |
| | | | | | | | | | | | | | | | |
|
| CORPORATE BONDS (continued) | |
Insurance (cont’d.) | | | | | |
6.850% | | | 12/16/39 | | | | | | | | 124 | | | $ | 184,837 | |
| | | | | | | | | | | | | | | | |
| | | | |
| | | | | | | | | | | | | | | 6,245,309 | |
| | | | | | | | | | | | | | | | |
Lodging — 0.0% | | | | | |
Marriott International, Inc., | |
Sr. Unsec’d. Notes | | | | | |
3.250% | | | 09/15/22 | | | | | | | | 980 | | | | 989,720 | |
| | | | | | | | | | | | | | | | |
Media — 0.4% | |
CCO Holdings LLC/CCO Holdings Capital Corp., | |
Sr. Unsec’d. Notes, 144A | | | | | |
5.500% | | | 05/01/26 | | | | | | | | 750 | | | | 773,658 | |
Charter Communications Operating LLC/Charter Communications Operating Capital, | |
Sr. Sec’d. Notes | | | | | |
3.900% | | | 06/01/52 | | | | | | | | 580 | | | | 580,378 | |
4.800% | | | 03/01/50 | | | | | | | | 1,260 | | | | 1,412,429 | |
5.375% | | | 04/01/38 | | | | | | | | 1,950 | | | | 2,323,981 | |
6.384% | | | 10/23/35 | | | | | | | | 875 | | | | 1,133,420 | |
6.484% | | | 10/23/45 | | | | | | | | 1,386 | | | | 1,894,871 | |
Comcast Corp., | |
Gtd. Notes | | | | | |
3.950% | | | 10/15/25 | | | | | | | | 225 | | | | 245,988 | |
Gtd. Notes, 144A | | | | | |
2.887% | | | 11/01/51 | | | | | | | | 699 | | | | 676,244 | |
Cox Communications, Inc., | |
Sr. Unsec’d. Notes, 144A | | | | | |
2.600% | | | 06/15/31 | | | | | | | | 5,275 | | | | 5,276,404 | |
CSC Holdings LLC, | |
Gtd. Notes, 144A | | | | | |
4.500% | | | 11/15/31 | | | | | | | | 1,400 | | | | 1,383,932 | |
Time Warner Cable LLC, | |
Sr. Sec’d. Notes | | | | | |
5.500% | | | 09/01/41 | | | | | | | | 360 | | | | 436,099 | |
ViacomCBS, Inc., | |
Sr. Unsec’d. Notes | | | | | |
5.250% | | | 04/01/44 | | | | | | | | 1,450 | | | | 1,810,691 | |
| | | | | | | | | | | | | | | | |
| | | | |
| | | | | | | | | | | | | | | 17,948,095 | |
| | | | | | | | | | | | | | | | |
Mining — 0.1% | | | | | |
Southern Copper Corp. (Peru), | |
Sr. Unsec’d. Notes | | | | | |
6.750% | | | 04/16/40 | | | | | | | | 425 | | | | 596,105 | |
Yamana Gold, Inc. (Canada), | |
Gtd. Notes, 144A | | | | | |
2.630% | | | 08/15/31 | (a) | | | | | | | 3,050 | | | | 2,944,227 | |
| | | | | | | | | | | | | | | | |
| | | | |
| | | | | | | | | | | | | | | 3,540,332 | |
| | | | | | | | | | | | | | | | |
Miscellaneous Manufacturing — 0.0% | | | | | |
Amsted Industries, Inc., | |
Gtd. Notes, 144A | | | | | |
5.625% | | | 07/01/27 | | | | | | | | 1,200 | | | | 1,248,500 | |
| | | | | | | | | | | | | | | | |
Multi-National — 0.0% | | | | | |
Corp. Andina de Fomento (Supranational Bank), | |
Sr. Unsec’d. Notes | | | | | |
2.750% | | | 01/06/23 | | | | | | | | 315 | | | | 320,980 | |
SEE NOTES TO FINANCIAL STATEMENTS.
A61
| | | | | | |
| | |
| | PSF PGIM FLEXIBLE MANAGED PORTFOLIO (CONTINUED) | | |
| | | | | | |
| |
| SCHEDULE OF INVESTMENTS | | as of December 31, 2021 |
| | | | | | | | | | | | | | | | |
Interest
Rate | | Maturity Date | | | | | | Principal Amount (000)# | | | Value | |
| | | | | | | | | | | | | | | | |
|
| CORPORATE BONDS (continued) | |
Multi-National (cont’d.) | | | | | |
North American Development Bank (Supranational Bank), | |
Sr. Unsec’d. Notes | | | | | |
2.400% | | | 10/26/22 | | | | | | | | 289 | | | $ | 291,784 | |
| | | | | | | | | | | | | | | | |
| | | | |
| | | | | | | | | | | | | | | 612,764 | |
| | | | | | | | | | | | | | | | |
Office/Business Equipment — 0.1% | | | | | |
CDW LLC/CDW Finance Corp., | |
Gtd. Notes | | | | | |
2.670% | | | 12/01/26 | | | | | | | | 1,810 | | | | 1,857,341 | |
5.500% | | | 12/01/24 | | | | | | | | 700 | | | | 766,272 | |
| | | | | | | | | | | | | | | | |
| | | | |
| | | | | | | | | | | | | | | 2,623,613 | |
| | | | | | | | | | | | | | | | |
Oil & Gas — 0.4% | | | | | |
Antero Resources Corp., | |
Gtd. Notes | | | | | |
5.000% | | | 03/01/25 | | | | | | | | 1,400 | | | | 1,422,014 | |
Cenovus Energy, Inc. (Canada), | |
Sr. Unsec’d. Notes | | | | | |
5.400% | | | 06/15/47 | | | | | | | | 1,200 | | | | 1,493,542 | |
ConocoPhillips, | |
Gtd. Notes, 144A | | | | | |
4.875% | | | 10/01/47 | | | | | | | | 210 | | | | 277,262 | |
Devon Energy Corp., | |
Sr. Unsec’d. Notes | | | | | |
5.600% | | | 07/15/41 | | | | | | | | 300 | | | | 377,668 | |
Gazprom PJSC Via Gaz Capital SA (Russia), | |
Sr. Unsec’d. Notes, 144A | | | | | |
4.950% | | | 07/19/22 | | | | | | | | 350 | | | | 356,200 | |
6.510% | | | 03/07/22 | | | | | | | | 580 | | | | 585,983 | |
KazMunayGas National Co. JSC (Kazakhstan), | |
Sr. Unsec’d. Notes, 144A | | | | | |
4.750% | | | 04/24/25 | | | | | | | | 550 | | | | 597,939 | |
Lundin Energy Finance BV (Netherlands), | |
Gtd. Notes, 144A | | | | | |
3.100% | | | 07/15/31 | | | | | | | | 755 | | | | 762,998 | |
Occidental Petroleum Corp., | |
Sr. Unsec’d. Notes | | | | | |
4.264%(s) | | | 10/10/36 | | | | | | | | 2,000 | | | | 1,135,475 | |
6.450% | | | 09/15/36 | | | | | | | | 1,155 | | | | 1,472,671 | |
Ovintiv, Inc., | |
Gtd. Notes | | | | | |
6.500% | | | 08/15/34 | | | | | | | | 370 | | | | 475,724 | |
6.625% | | | 08/15/37 | | | | | | | | 275 | | | | 359,299 | |
Petrobras Global Finance BV (Brazil), | |
Gtd. Notes | | | | | |
5.600% | | | 01/03/31 | (a) | | | | | | | 1,237 | | | | 1,316,656 | |
Petroleos Mexicanos (Mexico), | |
Gtd. Notes | | | | | |
6.490% | | | 01/23/27 | | | | | | | | 471 | | | | 502,259 | |
6.500% | | | 03/13/27 | | | | | | | | 330 | | | | 352,012 | |
7.690% | | | 01/23/50 | | | | | | | | 2,146 | | | | 2,070,041 | |
Gtd. Notes, MTN | | | | | |
6.750% | | | 09/21/47 | | | | | | | | 373 | | | | 330,029 | |
6.875% | | | 08/04/26 | (a) | | | | | | | 670 | | | | 735,629 | |
Qatar Energy (Qatar), | |
Sr. Unsec’d. Notes, 144A | | | | | |
1.375% | | | 09/12/26 | | | | | | | | 2,159 | | | | 2,116,214 | |
| | | | | | | | | | | | | | | | |
Interest
Rate | | Maturity Date | | | | | | Principal Amount (000)# | | | Value | |
| | | | | | | | | | | | | | | | |
|
| CORPORATE BONDS (continued) | |
Oil & Gas (cont’d.) | | | | | |
2.250% | | | 07/12/31 | | | | | | | | 820 | | | $ | 812,408 | |
Sinopec Group Overseas Development 2018 Ltd. (China), | |
Gtd. Notes, 144A | | | | | |
3.680% | | | 08/08/49 | | | | | | | | 1,445 | | | | 1,548,380 | |
| | | | | | | | | | | | | | | | |
| | | | |
| | | | | | | | | | | | | | | 19,100,403 | |
| | | | | | | | | | | | | | | | |
Packaging & Containers — 0.1% | | | | | |
Berry Global, Inc., | |
Sr. Sec’d. Notes | | | | | |
1.570% | | | 01/15/26 | | | | | | | | 5,135 | | | | 5,025,890 | |
| | | | | | | | | | | | | | | | |
Pharmaceuticals — 0.7% | | | | | |
AbbVie, Inc., | |
Sr. Unsec’d. Notes | | | | | |
3.600% | | | 05/14/25 | | | | | | | | 1,175 | | | | 1,248,703 | |
4.250% | | | 11/21/49 | | | | | | | | 2,515 | | | | 3,019,480 | |
4.500% | | | 05/14/35 | | | | | | | | 1,910 | | | | 2,283,180 | |
4.550% | | | 03/15/35 | | | | | | | | 2,190 | | | | 2,618,300 | |
4.700% | | | 05/14/45 | | | | | | | | 1,460 | | | | 1,805,344 | |
Bayer US Finance II LLC (Germany), | |
Gtd. Notes, 144A | | | | | |
4.250% | | | 12/15/25 | | | | | | | | 1,600 | | | | 1,735,999 | |
Becton, Dickinson & Co., | |
Sr. Unsec’d. Notes | | | | | |
3.734% | | | 12/15/24 | | | | | | | | 130 | | | | 138,270 | |
Bristol-Myers Squibb Co., | |
Sr. Unsec’d. Notes | | | | | |
4.125% | | | 06/15/39 | | | | | | | | 410 | | | | 484,953 | |
5.000% | | | 08/15/45 | | | | | | | | 490 | | | | 652,529 | |
Cigna Corp., | |
Gtd. Notes | | | | | |
4.375% | | | 10/15/28 | | | | | | | | 9,285 | | | | 10,555,234 | |
CVS Health Corp., | |
Sr. Unsec’d. Notes | | | | | |
4.780% | | | 03/25/38 | | | | | | | | 3,810 | | | | 4,642,361 | |
5.125% | | | 07/20/45 | | | | | | | | 610 | | | | 793,151 | |
5.300% | | | 12/05/43 | | | | | | | | 250 | | | | 329,526 | |
Mylan, Inc., | |
Gtd. Notes | | | | | |
5.200% | | | 04/15/48 | | | | | | | | 1,375 | | | | 1,702,759 | |
5.400% | | | 11/29/43 | | | | | | | | 845 | | | | 1,046,238 | |
Organon & Co./Organon Foreign Debt Co-Issuer BV, | |
Sr. Sec’d. Notes, 144A | | | | | |
4.125% | | | 04/30/28 | | | | | | | | 1,325 | | | | 1,358,565 | |
Viatris, Inc., | |
Gtd. Notes | | | | | |
3.850% | | | 06/22/40 | | | | | | | | 470 | | | | 501,329 | |
Wyeth LLC, | |
Gtd. Notes | | | | | |
6.450% | | | 02/01/24 | | | | | | | | 60 | | | | 66,565 | |
| | | | | | | | | | | | | | | | |
| | | | | | | | | | | | | | | 34,982,486 | |
| | | | | | | | | | | | | | | | |
Pipelines — 0.5% | | | | | |
Boardwalk Pipelines LP, | |
Gtd. Notes | | | | | |
3.400% | | | 02/15/31 | | | | | | | | 1,625 | | | | 1,676,542 | |
SEE NOTES TO FINANCIAL STATEMENTS.
A62
| | | | | | |
| | |
| | PSF PGIM FLEXIBLE MANAGED PORTFOLIO (CONTINUED) | | |
| | | | | | |
| |
| SCHEDULE OF INVESTMENTS | | as of December 31, 2021 |
| | | | | | | | | | | | | | | | |
Interest
Rate | | Maturity Date | | | | | | Principal Amount (000)# | | | Value | |
| | | | | | | | | | | | | | | | |
|
| CORPORATE BONDS (continued) | |
Pipelines (cont’d.) | | | | | |
Eastern Gas Transmission & Storage, Inc., | |
Sr. Unsec’d. Notes, 144A | | | | | |
4.600% | | | 12/15/44 | | | | | | | | 65 | | | $ | 77,229 | |
Energy Transfer LP, | |
Sr. Unsec’d. Notes | | | | | |
4.950% | | | 06/15/28 | | | | | | | | 1,115 | | | | 1,257,317 | |
5.000% | | | 05/15/50 | | | | | | | | 1,435 | | | | 1,652,317 | |
6.125% | | | 12/15/45 | | | | | | | | 180 | | | | 224,706 | |
Energy Transfer LP/Regency Energy Finance Corp., | |
Sr. Unsec’d. Notes | | | | | |
5.000% | | | 10/01/22 | | | | | | | | 675 | | | | 687,939 | |
Enterprise Products Operating LLC, | |
Gtd. Notes | | | | | |
3.750% | | | 02/15/25 | (a) | | | | | | | 1,345 | | | | 1,432,137 | |
Kinder Morgan, Inc., | |
Gtd. Notes | | | | | |
3.600% | | | 02/15/51 | | | | | | | | 2,260 | | | | 2,285,385 | |
MPLX LP, | |
Sr. Unsec’d. Notes | | | | | |
4.000% | | | 02/15/25 | | | | | | | | 1,430 | | | | 1,524,538 | |
4.000% | | | 03/15/28 | | | | | | | | 1,980 | | | | 2,152,371 | |
4.875% | | | 06/01/25 | | | | | | | | 3,250 | | | | 3,556,493 | |
5.200% | | | 03/01/47 | | | | | | | | 40 | | | | 48,953 | |
5.500% | | | 02/15/49 | | | | | | | | 395 | | | | 505,144 | |
ONEOK Partners LP, | |
Gtd. Notes | | | | | |
6.650% | | | 10/01/36 | | | | | | | | 145 | | | | 190,572 | |
ONEOK, Inc., | |
Gtd. Notes | | | | | |
3.100% | | | 03/15/30 | | | | | | | | 5,205 | | | | 5,313,992 | |
4.500% | | | 03/15/50 | | | | | | | | 295 | | | | 327,387 | |
4.950% | | | 07/13/47 | | | | | | | | 935 | | | | 1,089,470 | |
Venture Global Calcasieu Pass LLC, | |
Sr. Sec’d. Notes, 144A | | | | | |
3.875% | | | 08/15/29 | | | | | | | | 115 | | | | 119,705 | |
4.125% | | | 08/15/31 | | | | | | | | 115 | | | | 122,706 | |
Western Midstream Operating LP, | |
Sr. Unsec’d. Notes | | | | | |
5.300% | | | 03/01/48 | | | | | | | | 125 | | | | 150,619 | |
Williams Cos., Inc. (The), | |
Sr. Unsec’d. Notes | | | | | |
4.850% | | | 03/01/48 | | | | | | | | 315 | | | | 383,467 | |
4.900% | | | 01/15/45 | | | | | | | | 1,000 | | | | 1,197,140 | |
5.100% | | | 09/15/45 | | | | | | | | 500 | | | | 617,236 | |
| | | | | | | | | | | | | | | | |
| | | | |
| | | | | | | | | | | | | | | 26,593,365 | |
| | | | | | | | | | | | | | | | |
Real Estate Investment Trusts (REITs) — 0.3% | | | | | |
Alexandria Real Estate Equities, Inc., | |
Gtd. Notes | | | | | |
2.000% | | | 05/18/32 | | | | | | | | 1,815 | | | | 1,742,418 | |
Corporate Office Properties LP, | |
Gtd. Notes | | | | | |
2.900% | | | 12/01/33 | | | | | | | | 1,345 | | | | 1,323,964 | |
GLP Capital LP/GLP Financing II, Inc., | |
Gtd. Notes | | | | | |
5.375% | | | 04/15/26 | | | | | | | | 1,050 | | | | 1,172,790 | |
| | | | | | | | | | | | | | | | |
Interest
Rate | | Maturity Date | | | | | | Principal Amount (000)# | | | Value | |
| | | | | | | | | | | | | | | | |
|
| CORPORATE BONDS (continued) | |
Real Estate Investment Trusts (REITs) (cont’d.) | | | | | |
Kimco Realty Corp., | |
Sr. Unsec’d. Notes | | | | | |
2.700% | | | 10/01/30 | | | | | | | | 3,480 | | | $ | 3,541,920 | |
MPT Operating Partnership LP/MPT Finance Corp., | |
Gtd. Notes | | | | | |
3.500% | | | 03/15/31 | (a) | | | | | | | 1,125 | | | | 1,139,095 | |
Public Storage, | |
Sr. Unsec’d. Notes | | | | | |
2.250% | | | 11/09/31 | | | | | | | | 1,530 | | | | 1,534,842 | |
Realty Income Corp., | |
Sr. Unsec’d. Notes | | | | | |
3.250% | | | 01/15/31 | | | | | | | | 3,235 | | | | 3,475,835 | |
| | | | | | | | | | | | | | | | |
| | | | |
| | | | | | | | | | | | | | | 13,930,864 | |
| | | | | | | | | | | | | | | | |
Retail — 0.2% | | | | | |
1011778 BC ULC/New Red Finance, Inc. (Canada), | |
Sr. Sec’d. Notes, 144A | | | | | |
3.875% | | | 01/15/28 | | | | | | | | 900 | | | | 911,242 | |
AutoZone, Inc., | |
Sr. Unsec’d. Notes | | | | | |
1.650% | | | 01/15/31 | | | | | | | | 770 | | | | 725,179 | |
Dollar Tree, Inc., | |
Sr. Unsec’d. Notes | | | | | |
4.000% | | | 05/15/25 | | | | | | | | 4,705 | | | | 5,056,717 | |
Gap, Inc. (The), | |
Gtd. Notes, 144A | | | | | |
3.625% | | | 10/01/29 | | | | | | | | 275 | | | | 271,986 | |
3.875% | | | 10/01/31 | | | | | | | | 275 | | | | 271,753 | |
Sally Holdings LLC/Sally Capital, Inc., | |
Gtd. Notes | | | | | |
5.625% | | | 12/01/25 | | | | | | | | 1,375 | | | | 1,404,642 | |
| | | | | | | | | | | | | | | | |
| | | | |
| | | | | | | | | | | | | | | 8,641,519 | |
| | | | | | | | | | | | | | | | |
Semiconductors — 0.1% | | | | | |
Broadcom, Inc., | |
Gtd. Notes, 144A | | | | | |
3.500% | | | 02/15/41 | | | | | | | | 510 | | | | 519,318 | |
Sr. Unsec’d. Notes, 144A | | | | | |
3.187% | | | 11/15/36 | | | | | | | | 5,175 | | | | 5,191,753 | |
| | | | | | | | | | | | | | | | |
| | | | |
| | | | | | | | | | | | | | | 5,711,071 | |
| | | | | | | | | | | | | | | | |
Software — 0.1% | | | | | |
Microsoft Corp., | |
Sr. Unsec’d. Notes | | | | | |
2.525% | | | 06/01/50 | | | | | | | | 1,425 | | | | 1,398,463 | |
ServiceNow, Inc., | |
Sr. Unsec’d. Notes | | | | | |
1.400% | | | 09/01/30 | | | | | | | | 2,055 | | | | 1,916,144 | |
| | | | | | | | | | | | | | | | |
| | | | |
| | | | | | | | | | | | | | | 3,314,607 | |
| | | | | | | | | | | | | | | | |
Telecommunications — 0.5% | | | | | |
AT&T, Inc., | |
Sr. Unsec’d. Notes | | | | | |
2.550% | | | 12/01/33 | | | | | | | | 1,216 | | | | 1,190,848 | |
3.100% | | | 02/01/43 | | | | | | | | 770 | | | | 745,721 | |
3.500% | | | 09/15/53 | | | | | | | | 5,308 | | | | 5,365,073 | |
3.650% | | | 09/15/59 | | | | | | | | 160 | | | | 161,510 | |
SEE NOTES TO FINANCIAL STATEMENTS.
A63
| | | | | | |
| | |
| | PSF PGIM FLEXIBLE MANAGED PORTFOLIO (CONTINUED) | | |
| | | | | | |
| |
| SCHEDULE OF INVESTMENTS | | as of December 31, 2021 |
| | | | | | | | | | | | | | | | |
Interest
Rate | | Maturity Date | | | | | | Principal Amount (000)# | | | Value | |
| | | | | | | | | | | | | | | | |
|
| CORPORATE BONDS (continued) | |
Telecommunications (cont’d.) | | | | | |
4.300% | | | 02/15/30 | | | | | | | | 615 | | | $ | 692,884 | |
Level 3 Financing, Inc., | |
Gtd. Notes | | | | | |
5.375% | | | 05/01/25 | | | | | | | | 1,900 | | | | 1,938,219 | |
Sr. Sec’d. Notes, 144A | | | | | |
3.400% | | | 03/01/27 | | | | | | | | 300 | | | | 309,752 | |
T-Mobile USA, Inc., | |
Sr. Sec’d. Notes | | | | | |
3.875% | | | 04/15/30 | | | | | | | | 8,000 | | | | 8,754,126 | |
Sr. Sec’d. Notes, 144A | | | | | |
2.700% | | | 03/15/32 | | | | | | | | 1,255 | | | | 1,263,830 | |
Verizon Communications, Inc., | |
Sr. Unsec’d. Notes | | | | | |
2.550% | | | 03/21/31 | | | | | | | | 1,600 | | | | 1,616,266 | |
2.650% | | | 11/20/40 | | | | | | | | 1,575 | | | | 1,494,905 | |
4.016% | | | 12/03/29 | | | | | | | | 1,900 | | | | 2,129,683 | |
4.125% | | | 08/15/46 | | | | | | | | 30 | | | | 34,813 | |
4.500% | | | 08/10/33 | | | | | | | | 1,205 | | | | 1,419,693 | |
| | | | | | | | | | | | | | | | |
| | | | |
| | | | | | | | | | | | | | | 27,117,323 | |
| | | | | | | | | | | | | | | | |
Transportation — 0.0% | | | | | |
Burlington Northern Santa Fe LLC, | |
Sr. Unsec’d. Notes | | | | | |
6.700% | | | 08/01/28 | | | | | | | | 670 | | | | 851,302 | |
CSX Corp., | |
Sr. Unsec’d. Notes | | | | | |
6.150% | | | 05/01/37 | | | | | | | | 715 | | | | 998,736 | |
Norfolk Southern Corp., | |
Sr. Unsec’d. Notes | | | | | |
5.590% | | | 05/17/25 | | | | | | | | 100 | | | | 112,491 | |
| | | | | | | | | | | | | | | | |
| | | | |
| | | | | | | | | | | | | | | 1,962,529 | |
| | | | | | | | | | | | | | | | |
TOTAL CORPORATE BONDS
(cost $413,756,815) | | | | 440,325,483 | |
| | | | | | | | | | | | | | | | |
| |
| MUNICIPAL BONDS — 0.4% | | | | | |
Alabama — 0.0% | | | | | | | | | | | | | |
Alabama Economic Settlement Authority, | |
Taxable, Revenue Bonds, Series B | | | | | |
4.263% | | | 09/15/32 | | | | | | | | 240 | | | | 266,198 | |
| | | | | | | | | | | | | | | | |
California — 0.2% | | | | | | | | | |
Bay Area Toll Authority, | |
Revenue Bonds, BABs, Series F2 | | | | | |
6.263% | | | 04/01/49 | | | | | | | | 1,325 | | | | 2,144,821 | |
Taxable, Revenue Bonds | | | | | |
2.574% | | | 04/01/31 | | | | | | | | 1,210 | | | | 1,259,045 | |
State of California, | |
General Obligation Unlimited, BABs | | | | | |
7.300% | | | 10/01/39 | | | | | | | | 1,270 | | | | 2,003,010 | |
General Obligation Unlimited, Taxable, BABs | |
7.500% | | | 04/01/34 | | | | | | | | 475 | | | | 732,481 | |
7.625% | | | 03/01/40 | | | | | | | | 215 | | | | 356,566 | |
7.550% | | | 04/01/39 | (a) | | | | | | | 245 | | | | 408,835 | |
| | | | | | | | | | | | | | | | |
| | | | |
| | | | | | | | | | | | | | | 6,904,758 | |
| | | | | | | | | | | | | | | | |
| | | | | | | | | | | | | | | | |
Interest
Rate | | Maturity Date | | | | | | Principal Amount (000)# | | | Value | |
| | | | | | | | | | | | | | | | |
|
| MUNICIPAL BONDS (continued) | |
Colorado — 0.0% | | | | | |
Regional Transportation District Sales Tax Revenue, | |
Revenue Bonds, BABs, Series B | | | | | |
5.844% | | | 11/01/50 | | | | | | | | 680 | | | $ | 1,075,335 | |
| | | | | | | | | | | | | | | | |
Illinois — 0.1% | | | | | |
Chicago O’Hare International Airport, | |
Revenue Bonds, BABs, Series B | | | | | |
6.395% | | | 01/01/40 | | | | | | | | 1,030 | | | | 1,540,341 | |
State of Illinois, | |
General Obligation Unlimited, Series D | | | | | |
5.000% | | | 11/01/22 | | | | | | | | 3,190 | | | | 3,311,312 | |
| | | | | | | | | | | | | | | | |
| | | | |
| | | | | | | | | | | | | | | 4,851,653 | |
| | | | | | | | | | | | | | | | |
New Jersey — 0.1% | | | | | |
New Jersey Turnpike Authority, | |
Taxable, Revenue Bonds, BABs, Series F | | | | | |
7.414% | | | 01/01/40 | | | | | | | | 1,070 | | | | 1,741,169 | |
| | | | | | | | | | | | | | | | |
New York — 0.0% | | | | | |
New York City Transitional Finance Authority Future Tax Secured Revenue, | |
Taxable, Revenue Bonds, BABs | | | | | |
5.767% | | | 08/01/36 | | | | | | | | 1,130 | | | | 1,409,121 | |
| | | | | | | | | | | | | | | | |
Ohio — 0.0% | | | | | |
Ohio State University (The), | |
Taxable, Revenue Bonds, BABs, Series C | | | | | |
4.910% | | | 06/01/40 | | | | | | | | 455 | | | | 605,311 | |
Ohio Water Development Authority Water Pollution Control Loan Fund, | |
Taxable, Revenue Bonds, BABs, Series B2 | | | | | |
4.879% | | | 12/01/34 | | | | | | | | 300 | | | | 349,775 | |
| | | | | | | | | | | | | | | | |
| | | | |
| | | | | | | | | | | | | | | 955,086 | |
| | | | | | | | | | | | | | | | |
Oregon — 0.0% | | | | | |
State of Oregon Department of Transportation, | |
Taxable, Revenue Bonds, BABs, Series A | | | | | |
5.834% | | | 11/15/34 | | | | | | | | 445 | | | | 597,598 | |
| | | | | | | | | | | | | | | | |
Pennsylvania — 0.0% | | | | | |
Pennsylvania Turnpike Commission, | |
Revenue Bonds, BABs, Series B | | | | | |
5.511% | | | 12/01/45 | | | | | | | | 550 | | | | 785,220 | |
| | | | | | | | | | | | | | | | |
Virginia — 0.0% | | | | | |
University of Virginia, | |
Taxable, Revenue Bonds, Series C | | | | | |
4.179% | | | 09/01/2117 | | | | | | | | 495 | | | | 679,592 | |
| | | | | | | | | | | | | | | | |
TOTAL MUNICIPAL BONDS
(cost $14,500,554) | | | | 19,265,730 | |
| | | | | | | | | | | | | | | | |
|
RESIDENTIAL MORTGAGE-BACKED
SECURITIES — 2.0% | |
Alternative Loan Trust, | |
Series 2004-18CB, Class 3A1 | | | | | |
5.250% | | | 09/25/35 | | | | | | | | 8 | | | | 8,240 | |
Banc of America Mortgage Trust, | |
Series 2005-A, Class 2A1 | | | | | |
2.509%(cc) | | | 02/25/35 | | | | | | | | 147 | | | | 151,767 | |
Bellemeade Re Ltd. (Bermuda), | |
Series 2019-03A, Class M1B, 144A, 1 Month LIBOR + 1.600% (Cap N/A, Floor 1.600%) | |
1.702%(c) | | | 07/25/29 | | | | | | | | 1,024 | | | | 1,023,983 | |
SEE NOTES TO FINANCIAL STATEMENTS.
A64
| | | | | | |
| | |
| | PSF PGIM FLEXIBLE MANAGED PORTFOLIO (CONTINUED) | | |
| | | | | | |
| |
| SCHEDULE OF INVESTMENTS | | as of December 31, 2021 |
| | | | | | | | | | | | | | | | |
Interest
Rate | | Maturity Date | | | | | | Principal Amount (000)# | | | Value | |
| | | | | | | | | | | | | | | | |
|
| RESIDENTIAL MORTGAGE-BACKED SECURITIES (continued) | |
Series 2020-04A, Class M2A, 144A, 1 Month LIBOR + 2.600% (Cap N/A, Floor 2.600%) | |
2.702%(c) | | | 06/25/30 | | | | | | | | 21 | | | $ | 21,340 | |
Series 2021-02A, Class M1A, 144A, 30 Day Average SOFR + 1.200% (Cap N/A, Floor 1.200%) | |
1.250%(c) | | | 06/25/31 | | | | | | | | 2,874 | | | | 2,866,939 | |
Series 2021-03A, Class A2, 144A, 30 Day Average SOFR + 1.000% (Cap N/A, Floor 1.000%) | |
1.050%(c) | | | 09/25/31 | | | | | | | | 2,100 | | | | 2,079,298 | |
Series 2021-03A, Class M1A, 144A, 30 Day Average SOFR + 1.000% (Cap N/A, Floor 1.000%) | |
1.050%(c) | | | 09/25/31 | | | | | | | | 1,600 | | | | 1,591,724 | |
Central Park Funding Trust, | |
Series 2021-01, Class PT, 144A, 1 Month LIBOR + 2.750% (Cap N/A, Floor 2.750%) | |
2.852%(c) | | | 08/29/22 | | | | | | | | 3,326 | | | | 3,316,877 | |
Chase Mortgage Finance Trust, | |
Series 2007-A01, Class 1A5 | | | | | |
2.326%(cc) | | | 02/25/37 | | | | | | | | 104 | | | | 104,830 | |
Credit Suisse Mortgage Trust, | |
Series 2018-RPL09, Class A, 144A | | | | | |
3.850%(cc) | | | 09/25/57 | | | | | | | | 853 | | | | 886,237 | |
Eagle Re Ltd. (Bermuda), | |
Series 2019-01, Class M1B, 144A, 1 Month LIBOR + 1.800% (Cap N/A, Floor 0.000%) | |
1.902%(c) | | | 04/25/29 | | | | | | | | 181 | | | | 180,469 | |
Series 2021-02, Class M1A, 144A, 30 Day Average SOFR + 1.550% (Cap N/A, Floor 1.550%) | |
1.600%(c) | | | 04/25/34 | | | | | | | | 5,460 | | | | 5,459,756 | |
Fannie Mae REMICS, | |
Series 2014-73, Class CZ | | | | | |
3.000% | | | 11/25/44 | | | | | | | | 1,504 | | | | 1,596,520 | |
FHLMC Structured Agency Credit Risk Debt Notes, | |
Series 2020-HQA05, Class M2, 144A, 30 Day Average SOFR + 2.600% (Cap N/A, Floor 0.000%) | |
2.650%(c) | | | 11/25/50 | | | | | | | | 2,741 | | | | 2,768,403 | |
FHLMC Structured Agency Credit Risk REMIC Trust, | |
Series 2020-HQA03, Class M2, 144A, 1 Month LIBOR + 3.600% (Cap N/A, Floor 0.000%) | |
3.703%(c) | | | 07/25/50 | | | | | | | | 372 | | | | 373,974 | |
Series 2020-HQA04, Class B1, 144A, 1 Month LIBOR + 5.250% (Cap N/A, Floor 0.000%) | |
5.353%(c) | | | 09/25/50 | | | | | | | | 225 | | | | 234,342 | |
Series 2021-DNA05, Class M1, 144A, 30 Day Average SOFR + 0.650% (Cap N/A, Floor 0.000%) | |
0.700%(c) | | | 01/25/34 | | | | | | | | 633 | | | | 632,952 | |
Series 2021-DNA05, Class M2, 144A, 30 Day Average SOFR + 1.650% (Cap N/A, Floor 0.000%) | |
1.700%(c) | | | 01/25/34 | | | | | | | | 310 | | | | 311,327 | |
Series 2021-HQA03, Class M1, 144A, 30 Day Average SOFR + 0.850% (Cap N/A, Floor 0.000%) | |
0.900%(c) | | | 09/25/41 | | | | | | | | 6,990 | | | | 6,986,778 | |
FHLMC Structured Agency Credit Risk Trust, | |
Series 2018-DNA03, Class M1, 144A, 1 Month LIBOR + 0.750% (Cap N/A, Floor 0.000%) | |
0.853%(c) | | | 09/25/48 | | | | | | | | 3 | | | | 3,258 | |
| | | | | | | | | | | | | | | | |
Interest
Rate | | Maturity Date | | | | | | Principal Amount (000)# | | | Value | |
| | | | | | | | | | | | | | | | |
|
| RESIDENTIAL MORTGAGE-BACKED SECURITIES (continued) | |
Freddie Mac REMICS, | |
Series 4117, Class ZC | |
3.000% | | | 10/15/42 | | | | | | | | 2,512 | | | $ | 2,653,263 | |
Series 4535, Class PA | |
3.000% | | | 03/15/44 | | | | | | | | 719 | | | | 738,474 | |
Series 4680, Class GZ | |
3.500% | | | 03/15/47 | | | | | | | | 3,504 | | | | 3,793,210 | |
Government National Mortgage Assoc., | |
Series 2015-124, Class VZ | |
3.500% | | | 09/20/45 | | | | | | | | 2,488 | | | | 2,708,277 | |
Series 2019-69, Class KB | |
3.000% | | | 06/20/49 | | | | | | | | 3,423 | | | | 3,666,442 | |
Home Re Ltd. (Bermuda), | |
Series 2019-01, Class M1, 144A, 1 Month LIBOR + 1.650% (Cap N/A, Floor 0.000%) | |
1.752%(c) | | | 05/25/29 | | | | | | | | 168 | | | | 168,281 | |
Series 2021-02, Class M1A, 144A, 30 Day Average SOFR + 1.250% (Cap N/A, Floor 0.000%) | |
1.300%(c) | | | 01/25/34 | | | | | | | | 1,380 | | | | 1,380,649 | |
JPMorgan Mortgage Trust, | |
Series 2007-A01, Class 4A1 | |
2.314%(cc) | | | 07/25/35 | | | | | | | | 39 | | | | 38,999 | |
Legacy Mortgage Asset Trust, | |
Series 2021-GS01, Class A1, 144A | |
1.892% | | | 10/25/66 | | | | | | | | 387 | | | | 386,714 | |
Mello Warehouse Securitization Trust, | |
Series 2020-01, Class A, 144A, 1 Month LIBOR + 0.900% (Cap N/A, Floor 0.900%) | |
1.002%(c) | | | 10/25/53 | | | | | | | | 1,815 | | | | 1,814,122 | |
Series 2021-01, Class A, 144A, 1 Month LIBOR + 0.700% (Cap N/A, Floor 0.700%) | |
0.789%(c) | | | 02/25/55 | | | | | | | | 2,400 | | | | 2,385,577 | |
MFA Trust, | |
Series 2021-RPL01, Class A1, 144A | |
1.131%(cc) | | | 07/25/60 | | | | | | | | 3,355 | | | | 3,297,735 | |
Mortgage Repurchase Agreement Financing Trust, | |
Series 2020-05, Class A1, 144A, 1 Month LIBOR + 1.000% (Cap N/A, Floor 0.000%) | |
1.101%(c) | | | 08/10/23 | | | | | | | | 1,570 | | | | 1,570,194 | |
Series 2021-01, Class A2, 144A, 1 Month LIBOR + 0.500% (Cap N/A, Floor 0.000%) | |
0.601%(c) | | | 03/10/22 | | | | | | | | 3,700 | | | | 3,700,302 | |
Series 2021-S01, Class A1, 144A, 1 Month LIBOR + 0.500% (Cap N/A, Floor 0.500%) | |
0.601%(c) | | | 09/10/22 | | | | | | | | 6,700 | | | | 6,698,628 | |
MRA Issuance Trust, | |
Series 2020-07, Class A, 144A, 1 Month LIBOR + 1.300% (Cap N/A, Floor 1.600%) | |
1.399%(c) | | | 09/15/22 | | | | | | | | 7,510 | | | | 7,495,931 | |
Series 2021-EBO06, Class A1X, 144A, 1 Month LIBOR + 1.600% (Cap N/A, Floor 1.600%) | |
1.699%(c) | | | 02/16/22 | | | | | | | | 4,433 | | | | 4,430,643 | |
MSG III Securitization Trust, | |
Series 2021-01, Class A, 144A, 1 Month LIBOR + 0.750% (Cap N/A, Floor 0.750%) | |
0.842%(c) | | | 06/25/54 | | | | | | | | 2,395 | | | | 2,393,261 | |
SEE NOTES TO FINANCIAL STATEMENTS.
A65
| | | | | | |
| | |
| | PSF PGIM FLEXIBLE MANAGED PORTFOLIO (CONTINUED) | | |
| | | | | | |
| |
| SCHEDULE OF INVESTMENTS | | as of December 31, 2021 |
| | | | | | | | | | | | | | | | |
Interest
Rate | | Maturity Date | | | | | | Principal Amount (000)# | | | Value | |
| | | | | | | | | | | | | | | | |
|
| RESIDENTIAL MORTGAGE-BACKED SECURITIES (continued) | |
Series 2021-01, Class B, 144A, 1 Month LIBOR + 0.900% (Cap N/A, Floor 0.900%) | |
0.992%(c) | | | 06/25/54 | | | | | | | | 385 | | | $ | 384,790 | |
Series 2021-01, Class C, 144A, 1 Month LIBOR + 1.100% (Cap N/A, Floor 1.100%) | |
1.192%(c) | | | 06/25/54 | | | | | | | | 330 | | | | 329,820 | |
Series 2021-01, Class D, 144A, 1 Month LIBOR + 1.300% (Cap N/A, Floor 1.300%) | |
1.392%(c) | | | 06/25/54 | | | | | | | | 135 | | | | 134,926 | |
New Residential Mortgage Loan Trust, | |
Series 2018-04A, Class A1S, 144A, 1 Month LIBOR + 0.750% (Cap N/A, Floor 0.750%) | |
0.853%(c) | | | 01/25/48 | | | | | | | | 364 | | | | 364,331 | |
Oaktown Re II Ltd. (Bermuda), | |
Series 2018-01A, Class M1, 144A, 1 Month LIBOR + 1.550% (Cap N/A, Floor 0.000%) | |
1.652%(c) | | | 07/25/28 | | | | | | | | 136 | | | | 136,325 | |
Oaktown Re III Ltd. (Bermuda), | |
Series 2019-01A, Class M1A, 144A, 1 Month LIBOR + 1.400% (Cap N/A, Floor 1.400%) | |
1.502%(c) | | | 07/25/29 | | | | | | | | 47 | | | | 47,401 | |
Oaktown Re VII Ltd. (Bermuda), | |
Series 2021-02, Class M1A, 144A, 30 Day Average SOFR + 1.600% (Cap N/A, Floor 1.600%) | |
1.650%(c) | | | 04/25/34 | | | | | | | | 1,300 | | | | 1,297,637 | |
PMT Credit Risk Transfer Trust, | |
Series 2020-02R, Class A, 144A, 1 Month LIBOR + 3.815% (Cap N/A, Floor 3.815%) | |
3.917%(c) | | | 12/25/22 | | | | | | | | 2,122 | | | | 2,126,971 | |
Series 2021-01R, Class A, 144A, 1 Month LIBOR + 2.900% (Cap N/A, Floor 2.900%) | |
3.002%(c) | | | 02/27/24 | | | | | | | | 3,384 | | | | 3,428,644 | |
Provident Funding Mortgage Warehouse Securitization Trust, | |
Series 2021-01, Class A, 144A, 1 Month LIBOR + 0.700% (Cap N/A, Floor 0.700%) | |
0.802%(c) | | | 02/25/55 | | | | | | | | 3,365 | | | | 3,347,068 | |
Seasoned Credit Risk Transfer Trust, | |
Series 2019-02, Class MA | |
3.500% | | | 08/25/58 | | | | | | | | 818 | | | | 853,189 | |
Station Place Securitization Trust, | |
Series 2021-04, Class A, 144A, 1 Month LIBOR + 0.900% (Cap N/A, Floor 0.900%) | |
1.002%(c) | | | 04/11/22 | | | | | | | | 3,700 | | | | 3,696,144 | |
Series 2021-08, Class A, 144A, 1 Month LIBOR + 0.800% (Cap N/A, Floor 0.800%) | |
0.902%(c) | | | 06/20/22 | | | | | | | | 2,910 | | | | 2,912,511 | |
Series 2021-WL01, Class A, 144A, 1 Month LIBOR + 0.650% (Cap N/A, Floor 0.650%) | |
0.752%(c) | | | 01/26/54 | | | | | | | | 947 | | | | 946,559 | |
Structured Adjustable Rate Mortgage Loan Trust, | |
Series 2004-01, Class 4A3 | |
2.431%(cc) | | | 02/25/34 | | | | | | | | 60 | | | | 60,269 | |
| | | | | | | | | | | | | | | | |
TOTAL RESIDENTIAL MORTGAGE-BACKED SECURITIES
(cost $100,089,214) | | | | 99,986,301 | |
| | | | | | | | | | | | | | | | |
| | | | | | | | | | | | | | | | |
Interest
Rate | | Maturity Date | | | | | | Principal Amount (000)# | | | Value | |
| | | | | | | | | | | | | | | | |
|
| SOVEREIGN BONDS — 0.6% | |
Abu Dhabi Government International Bond (United Arab Emirates), | |
Sr. Unsec’d. Notes, 144A | |
3.125% | | | 10/11/27 | (a) | | | | | | | 3,350 | | | $ | 3,598,768 | |
Bermuda Government International Bond (Bermuda), | |
Sr. Unsec’d. Notes, 144A | |
2.375% | | | 08/20/30 | | | | | | | | 710 | | | | 708,224 | |
Colombia Government International Bond (Colombia), | |
Sr. Unsec’d. Notes | |
4.000% | | | 02/26/24 | | | | | | | | 175 | | | | 180,611 | |
Export-Import Bank of India (India), | |
Sr. Unsec’d. Notes, 144A | |
3.875% | | | 02/01/28 | | | | | | | | 1,040 | | | | 1,112,086 | |
Finnvera OYJ (Finland), | |
Gov’t. Gtd. Notes, 144A, MTN | |
2.375% | | | 06/04/25 | | | | | | | | 400 | | | | 415,953 | |
Indonesia Government International Bond (Indonesia), | |
Sr. Unsec’d. Notes | |
3.375% | | | 07/30/25 | | | | EUR | | | | 1,500 | | | | 1,877,723 | |
Sr. Unsec’d. Notes, 144A, MTN | |
5.875% | | | 01/15/24 | | | | | | | | 950 | | | | 1,040,449 | |
Sr. Unsec’d. Notes, EMTN | |
2.150% | | | 07/18/24 | | | | EUR | | | | 2,100 | | | | 2,501,369 | |
Japan Finance Organization for Municipalities (Japan), | |
Sr. Unsec’d. Notes, 144A, MTN | |
2.125% | | | 10/25/23 | | | | | | | | 1,400 | | | | 1,429,586 | |
2.625% | | | 04/20/22 | | | | | | | | 2,000 | | | | 2,013,221 | |
3.000% | | | 03/12/24 | | | | | | | | 400 | | | | 416,987 | |
Panama Government International Bond (Panama), | |
Sr. Unsec’d. Notes | |
4.000% | | | 09/22/24 | | | | | | | | 305 | | | | 324,071 | |
4.500% | | | 04/16/50 | (a) | | | | | | | 475 | | | | 523,579 | |
Peruvian Government International Bond (Peru), | |
Sr. Unsec’d. Notes | |
2.783% | | | 01/23/31 | | | | | | | | 453 | | | | 451,035 | |
Qatar Government International Bond (Qatar), | |
Sr. Unsec’d. Notes, 144A | |
3.875% | | | 04/23/23 | | | | | | | | 1,105 | | | | 1,149,176 | |
5.103% | | | 04/23/48 | | | | | | | | 915 | | | | 1,236,933 | |
Romanian Government International Bond (Romania), | |
Sr. Unsec’d. Notes, EMTN | |
4.125% | | | 03/11/39 | | | | EUR | | | | 1,395 | | | | 1,699,250 | |
Saudi Government International Bond (Saudi Arabia), | |
Sr. Unsec’d. Notes, 144A, MTN | |
2.875% | | | 03/04/23 | | | | | | | | 1,785 | | | | 1,826,818 | |
4.000% | | | 04/17/25 | | | | | | | | 1,035 | | | | 1,115,017 | |
Tokyo Metropolitan Government (Japan), | |
Sr. Unsec’d. Notes, 144A | |
2.500% | | | 06/08/22 | | | | | | | | 1,800 | | | | 1,815,413 | |
3.250% | | | 06/01/23 | | | | | | | | 800 | | | | 826,804 | |
Uruguay Government International Bond (Uruguay), | |
Sr. Unsec’d. Notes | |
4.975% | | | 04/20/55 | (a) | | | | | | | 1,025 | | | | 1,345,316 | |
5.100% | | | 06/18/50 | (a) | | | | | | | 545 | | | | 722,507 | |
| | | | | | | | | | | | | | | | |
TOTAL SOVEREIGN BONDS
(cost $26,693,655) | | | | 28,330,896 | |
| | | | | | | | | | | | | | | | |
SEE NOTES TO FINANCIAL STATEMENTS.
A66
| | | | | | |
| | |
| | PSF PGIM FLEXIBLE MANAGED PORTFOLIO (CONTINUED) | | |
| | | | | | |
| |
| SCHEDULE OF INVESTMENTS | | as of December 31, 2021 |
| | | | | | | | | | | | | | | | |
Interest
Rate | | Maturity Date | | | | | | Principal Amount (000)# | | | Value | |
| | | | | | | | | | | | | | | | |
|
| U.S. GOVERNMENT AGENCY OBLIGATIONS — 5.0% | |
Federal Home Loan Bank | |
5.500% | | | 07/15/36 | (k) | | | | | | | 1,080 | | | $ | 1,560,722 | |
Federal Home Loan Mortgage Corp. | |
1.500% | | | 11/01/50 | | | | | | | | 1,816 | | | | 1,754,525 | |
2.000% | | | 01/01/32 | | | | | | | | 513 | | | | 527,133 | |
2.000% | | | 06/01/40 | | | | | | | | 1,260 | | | | 1,278,790 | |
2.000% | | | 10/01/40 | | | | | | | | 1,849 | | | | 1,876,673 | |
2.000% | | | 09/01/50 | | | | | | | | 3,629 | | | | 3,621,338 | |
2.000% | | | 10/01/50 | | | | | | | | 2,971 | | | | 2,964,508 | |
2.000% | | | 03/01/51 | | | | | | | | 1,404 | | | | 1,401,169 | |
2.500% | | | 03/01/30 | | | | | | | | 274 | | | | 284,955 | |
2.500% | | | 10/01/32 | | | | | | | | 559 | | | | 580,288 | |
2.500% | | | 03/01/51 | | | | | | | | 1,257 | | | | 1,296,605 | |
2.500% | | | 04/01/51 | | | | | | | | 9,857 | | | | 10,072,167 | |
2.500% | | | 10/01/51 | | | | | | | | 4,639 | | | | 4,739,968 | |
3.000% | | | 10/01/28 | | | | | | | | 183 | | | | 193,264 | |
3.000% | | | 06/01/29 | | | | | | | | 491 | | | | 516,928 | |
3.000% | | | 03/01/32 | | | | | | | | 616 | | | | 648,902 | |
3.000% | | | 01/01/37 | | | | | | | | 242 | | | | 254,854 | |
3.000% | | | 01/01/43 | | | | | | | | 503 | | | | 531,068 | |
3.000% | | | 07/01/43 | | | | | | | | 1,009 | | | | 1,064,733 | |
3.000% | | | 01/01/47 | | | | | | | | 2,565 | | | | 2,688,096 | |
3.000% | | | 02/01/50 | | | | | | | | 2,106 | | | | 2,188,738 | |
3.500% | | | 03/01/42 | | | | | | | | 243 | | | | 261,842 | |
3.500% | | | 06/01/42 | | | | | | | | 173 | | | | 186,633 | |
3.500% | | | 01/01/47 | | | | | | | | 448 | | | | 477,455 | |
3.500% | | | 02/01/47 | | | | | | | | 602 | | | | 642,195 | |
4.000% | | | 06/01/26 | | | | | | | | 224 | | | | 235,513 | |
4.000% | | | 09/01/26 | | | | | | | | 115 | | | | 121,251 | |
4.000% | | | 10/01/39 | | | | | | | | 473 | | | | 519,539 | |
4.000% | | | 12/01/40 | | | | | | | | 186 | | | | 204,368 | |
4.000% | | | 10/01/41 | | | | | | | | 189 | | | | 207,424 | |
4.000% | | | 01/01/42 | | | | | | | | 70 | | | | 77,384 | |
4.000% | | | 10/01/45 | | | | | | | | 215 | | | | 233,462 | |
4.500% | | | 09/01/39 | | | | | | | | 139 | | | | 153,750 | |
4.500% | | | 10/01/39 | | | | | | | | 770 | | | | 849,132 | |
4.500% | | | 12/01/39 | | | | | | | | 245 | | | | 270,718 | |
4.500% | | | 07/01/41 | | | | | | | | 81 | | | | 87,040 | |
4.500% | | | 07/01/41 | | | | | | | | 1,160 | | | | 1,285,175 | |
4.500% | | | 08/01/41 | | | | | | | | 119 | | | | 127,503 | |
4.500% | | | 08/01/41 | | | | | | | | 184 | | | | 200,398 | |
4.500% | | | 08/01/41 | | | | | | | | 204 | | | | 222,518 | |
4.500% | | | 10/01/41 | | | | | | | | 100 | | | | 107,035 | |
4.500% | | | 10/01/46 | | | | | | | | 138 | | | | 149,610 | |
4.500% | | | 12/01/47 | | | | | | | | 626 | | | | 675,235 | |
5.000% | | | 05/01/34 | | | | | | | | 13 | | | | 14,935 | |
5.000% | | | 05/01/34 | | | | | | | | 132 | | | | 149,347 | |
5.000% | | | 08/01/35 | | | | | | | | 13 | | | | 14,846 | |
5.000% | | | 09/01/35 | | | | | | | | 26 | | | | 29,492 | |
5.000% | | | 10/01/36 | | | | | | | | 21 | | | | 24,081 | |
5.000% | | | 05/01/37 | | | | | | | | 13 | | | | 14,652 | |
5.000% | | | 07/01/37 | | | | | | | | 232 | | | | 263,356 | |
5.000% | | | 09/01/38 | | | | | | | | 31 | | | | 34,931 | |
5.000% | | | 09/01/38 | | | | | | | | 32 | | | | 36,681 | |
5.000% | | | 09/01/38 | | | | | | | | 37 | | | | 42,222 | |
5.000% | | | 02/01/39 | | | | | | | | 12 | | | | 13,586 | |
5.000% | | | 06/01/39 | | | | | | | | 36 | | | | 40,535 | |
5.500% | | | 02/01/34 | | | | | | | | 29 | | | | 32,020 | |
| | | | | | | | | | | | | | |
Interest
Rate | | Maturity Date | | | | | Principal Amount (000)# | | | Value | |
| | | | | | | | | | | | | | |
|
| U.S. GOVERNMENT AGENCY OBLIGATIONS (continued) | |
5.500% | | 04/01/34 | | | | | | | 278 | | | $ | 307,840 | |
5.500% | | 06/01/34 | | | | | | | 56 | | | | 63,940 | |
5.500% | | 06/01/34 | | | | | | | 131 | | | | 149,008 | |
5.500% | | 05/01/37 | | | | | | | 29 | | | | 33,596 | |
5.500% | | 02/01/38 | | | | | | | 234 | | | | 268,382 | |
5.500% | | 05/01/38 | | | | | | | 43 | | | | 48,969 | |
5.500% | | 07/01/38 | | | | | | | 204 | | | | 233,762 | |
6.000% | | 03/01/32 | | | | | | | 125 | | | | 137,700 | |
6.000% | | 12/01/33 | | | | | | | 45 | | | | 49,840 | |
6.000% | | 07/01/36 | | | | | | | 3 | | | | 3,040 | |
6.000% | | 12/01/36 | | | | | | | 5 | | | | 5,901 | |
6.000% | | 05/01/37 | | | | | | | 8 | | | | 9,483 | |
6.000% | | 12/01/37 | | | | | | | 13 | | | | 14,616 | |
6.000% | | 01/01/38 | | | | | | | 3 | | | | 3,555 | |
6.000% | | 01/01/38 | | | | | | | 8 | | | | 8,689 | |
6.000% | | 01/01/38 | | | | | | | 146 | | | | 166,557 | |
6.000% | | 10/01/38 | | | | | | | 55 | | | | 63,826 | |
6.000% | | 08/01/39 | | | | | | | 26 | | | | 29,573 | |
6.750% | | 03/15/31 | | | | | | | 500 | | | | 716,780 | |
7.000% | | 01/01/31 | | | | | | | 15 | | | | 16,292 | |
7.000% | | 06/01/31 | | | | | | | 12 | | | | 12,419 | |
7.000% | | 09/01/31 | | | | | | | 2 | | | | 2,670 | |
7.000% | | 10/01/31 | | | | | | | 27 | | | | 30,044 | |
7.000% | | 10/01/32 | | | | | | | 27 | | | | 28,723 | |
Federal National Mortgage Assoc. | |
1.500% | | 10/01/50 | | | | | | | 430 | | | | 415,856 | |
1.500% | | 11/01/50 | | | | | | | 933 | | | | 901,898 | |
1.500% | | 12/01/50 | | | | | | | 5,144 | | | | 4,971,443 | |
2.000% | | 08/01/31 | | | | | | | 766 | | | | 787,760 | |
2.000% | | 02/01/41 | | | | | | | 2,531 | | | | 2,571,738 | |
2.000% | | 05/01/41 | | | | | | | 12,986 | | | | 13,195,155 | |
2.000% | | 08/01/50 | | | | | | | 1,290 | | | | 1,286,837 | |
2.000% | | 10/01/50 | | | | | | | 13,081 | | | | 13,052,002 | |
2.000% | | 02/01/51(k) | | | | | | | 13,534 | | | | 13,504,183 | |
2.000% | | 03/01/51 | | | | | | | 1,821 | | | | 1,817,102 | |
2.000% | | 05/01/51 | | | | | | | 1,521 | | | | 1,517,529 | |
2.500% | | 05/01/41 | | | | | | | 6,061 | | | | 6,258,186 | |
2.500% | | 10/01/43 | | | | | | | 578 | | | | 595,507 | |
2.500% | | 12/01/46 | | | | | | | 1,023 | | | | 1,049,950 | |
2.500% | | 03/01/50 | | | | | | | 788 | | | | 806,867 | |
2.500% | | 08/01/50 | | | | | | | 3,488 | | | | 3,562,430 | |
2.500% | | 12/01/50 | | | | | | | 392 | | | | 401,631 | |
2.500% | | 04/01/51 | | | | | | | 4,603 | | | | 4,701,421 | |
3.000% | | TBA(tt) | | | | | | | 1,500 | | | | 1,553,945 | |
3.000% | | TBA | | | | | | | 3,500 | | | | 3,620,539 | |
3.000% | | 02/01/27 | | | | | | | 762 | | | | 800,308 | |
3.000% | | 08/01/30 | | | | | | | 520 | | | | 546,871 | |
3.000% | | 11/01/36 | | | | | | | 1,079 | | | | 1,127,500 | |
3.000% | | 12/01/42 | | | | | | | 570 | | | | 601,948 | |
3.000% | | 12/01/42 | | | | | | | 795 | | | | 834,893 | |
3.000% | | 03/01/43 | | | | | | | 142 | | | | 150,109 | |
3.000% | | 11/01/46 | | | | | | | 138 | | | | 144,576 | |
3.000% | | 01/01/47 | | | | | | | 1,112 | | | | 1,166,610 | |
3.000% | | 02/01/47 | | | | | | | 780 | | | | 815,984 | |
3.000% | | 03/01/47 | | | | | | | 616 | | | | 646,053 | |
3.000% | | 11/01/49 | | | | | | | 651 | | | | 675,007 | |
3.000% | | 12/01/49 | | | | | | | 400 | | | | 417,088 | |
3.000% | | 12/01/49 | | | | | | | 550 | | | | 569,946 | |
SEE NOTES TO FINANCIAL STATEMENTS.
A67
| | | | | | |
| | |
| | PSF PGIM FLEXIBLE MANAGED PORTFOLIO (CONTINUED) | | |
| | | | | | |
| |
| SCHEDULE OF INVESTMENTS | | as of December 31, 2021 |
| | | | | | | | | | | | | | | | |
Interest
Rate | | Maturity Date | | | | | | Principal Amount (000)# | | | Value | |
| | | | | | | | | | | | | | | | |
|
| U.S. GOVERNMENT AGENCY OBLIGATIONS (continued) | |
3.000% | | | 02/01/50 | | | | | | | | 6,838 | | | $ | 7,086,140 | |
3.000% | | | 03/01/50 | | | | | | | | 476 | | | | 493,163 | |
3.500% | | | 07/01/31 | | | | | | | | 493 | | | | 522,618 | |
3.500% | | | 11/01/32 | | | | | | | | 262 | | | | 279,913 | |
3.500% | | | 02/01/33 | | | | | | | | 541 | | | | 572,735 | |
3.500% | | | 05/01/33 | | | | | | | | 766 | | | | 810,232 | |
3.500% | | | 06/01/39 | | | | | | | | 389 | | | | 419,669 | |
3.500% | | | 01/01/42 | | | | | | | | 2,661 | | | | 2,854,480 | |
3.500% | | | 05/01/42 | | | | | | | | 1,252 | | | | 1,343,543 | |
3.500% | | | 07/01/42 | | | | | | | | 478 | | | | 516,301 | |
3.500% | | | 08/01/42 | | | | | | | | 185 | | | | 200,185 | |
3.500% | | | 08/01/42 | | | | | | | | 487 | | | | 525,477 | |
3.500% | | | 09/01/42 | | | | | | | | 473 | | | | 510,988 | |
3.500% | | | 09/01/42 | | | | | | | | 914 | | | | 987,560 | |
3.500% | | | 11/01/42 | | | | | | | | 253 | | | | 271,530 | |
3.500% | | | 03/01/43 | | | | | | | | 1,869 | | | | 2,018,896 | |
3.500% | | | 04/01/43 | | | | | | | | 291 | | | | 314,789 | |
3.500% | | | 04/01/43 | | | | | | | | 678 | | | | 732,100 | |
3.500% | | | 07/01/43 | | | | | | | | 134 | | | | 144,559 | |
3.500% | | | 06/01/45 | | | | | | | | 2,458 | | | | 2,629,999 | |
3.500% | | | 07/01/46 | | | | | | | | 343 | | | | 364,915 | |
3.500% | | | 11/01/46 | | | | | | | | 674 | | | | 718,278 | |
3.500% | | | 09/01/47 | | | | | | | | 620 | | | | 657,621 | |
3.500% | | | 01/01/48 | | | | | | | | 6,299 | | | | 6,670,115 | |
3.500% | | | 05/01/48 | | | | | | | | 574 | | | | 605,809 | |
3.500% | | | 06/01/48 | | | | | | | | 3,016 | | | | 3,220,641 | |
4.000% | | | 12/01/36 | | | | | | | | 555 | | | | 601,915 | |
4.000% | | | 10/01/41 | | | | | | | | 1,579 | | | | 1,732,486 | |
4.000% | | | 07/01/44 | | | | | | | | 578 | | | | 634,966 | |
4.000% | | | 09/01/44 | | | | | | | | 922 | | | | 1,003,893 | |
4.000% | | | 10/01/46 | | | | | | | | 442 | | | | 476,763 | |
4.000% | | | 06/01/47 | | | | | | | | 436 | | | | 467,779 | |
4.000% | | | 09/01/47 | | | | | | | | 171 | | | | 183,064 | |
4.000% | | | 11/01/47 | | | | | | | | 540 | | | | 588,212 | |
4.000% | | | 11/01/47 | | | | | | | | 751 | | | | 804,576 | |
4.000% | | | 12/01/47 | | | | | | | | 2,358 | | | | 2,525,161 | |
4.000% | | | 03/01/49 | | | | | | | | 4,861 | | | | 5,164,848 | |
4.500% | | | 07/01/33 | | | | | | | | 30 | | | | 32,700 | |
4.500% | | | 08/01/33 | | | | | | | | 8 | | | | 9,259 | |
4.500% | | | 09/01/33 | | | | | | | | 24 | | | | 26,107 | |
4.500% | | | 10/01/33 | | | | | | | | 69 | | | | 76,027 | |
4.500% | | | 03/01/34 | | | | | | | | 20 | | | | 21,979 | |
4.500% | | | 01/01/35 | | | | | | | | 2 | | | | 1,721 | |
4.500% | | | 07/01/39 | | | | | | | | 469 | | | | 518,321 | |
4.500% | | | 08/01/39 | | | | | | | | 348 | | | | 384,334 | |
4.500% | | | 09/01/39 | | | | | | | | 208 | | | | 229,604 | |
4.500% | | | 12/01/39 | | | | | | | | 3 | | | | 3,013 | |
4.500% | | | 03/01/41 | | | | | | | | 780 | | | | 862,702 | |
4.500% | | | 07/01/42 | | | | | | | | 72 | | | | 79,003 | |
5.000% | | | 03/01/34 | | | | | | | | 140 | | | | 157,572 | |
5.000% | | | 04/01/35 | | | | | | | | 328 | | | | 370,022 | |
5.000% | | | 06/01/35 | | | | | | | | 79 | | | | 89,613 | |
5.000% | | | 07/01/35 | | | | | | | | 75 | | | | 84,187 | |
5.000% | | | 07/01/35 | | | | | | | | 76 | | | | 86,047 | |
5.000% | | | 09/01/35 | | | | | | | | 57 | | | | 64,628 | |
5.000% | | | 11/01/35 | | | | | | | | 65 | | | | 72,760 | |
5.000% | | | 02/01/36 | | | | | | | | 44 | | | | 49,721 | |
5.500% | | | 02/01/33 | | | | | | | | 78 | | | | 87,991 | |
| | | | | | | | | | | | | | |
Interest
Rate | | Maturity Date | | | | | Principal Amount (000)# | | | Value | |
| | | | | | | | | | | | | | |
|
| U.S. GOVERNMENT AGENCY OBLIGATIONS (continued) | |
5.500% | | 08/01/33 | | | | | | | 151 | | | $ | 168,911 | |
5.500% | | 10/01/33 | | | | | | | 35 | | | | 39,315 | |
5.500% | | 12/01/33 | | | | | | | 33 | | | | 37,157 | |
5.500% | | 12/01/34 | | | | | | | 87 | | | | 98,853 | |
5.500% | | 10/01/35 | | | | | | | 341 | | | | 383,955 | |
5.500% | | 03/01/36 | | | | | | | 46 | | | | 50,635 | |
5.500% | | 04/01/36 | | | | | | | 65 | | | | 72,374 | |
5.500% | | 01/01/37 | | | | | | | 42 | | | | 48,367 | |
5.500% | | 04/01/37 | | | | | | | 22 | | | | 24,612 | |
5.500% | | 05/01/37 | | | | | | | 129 | | | | 147,346 | |
5.500% | | 08/01/37 | | | | | | | 160 | | | | 181,872 | |
6.000% | | 10/01/33 | | | | | | | 159 | | | | 178,297 | |
6.000% | | 11/01/33 | | | | | | | 13 | | | | 14,761 | |
6.000% | | 11/01/33 | | | | | | | 20 | | | | 22,344 | |
6.000% | | 01/01/34 | | | | | | | 167 | | | | 190,143 | |
6.000% | | 02/01/34 | | | | | | | 67 | | | | 75,194 | |
6.000% | | 03/01/34 | | | | | | | 1 | | | | 1,552 | |
6.000% | | 03/01/34 | | | | | | | 10 | | | | 11,286 | |
6.000% | | 03/01/34 | | | | | | | 25 | | | | 27,138 | |
6.000% | | 11/01/34 | | | | | | | 19 | | | | 20,743 | |
6.000% | | 01/01/35 | | | | | | | 28 | | | | 30,914 | |
6.000% | | 01/01/35 | | | | | | | 74 | | | | 81,410 | |
6.000% | | 02/01/35 | | | | | | | 2 | | | | 2,142 | |
6.000% | | 02/01/35 | | | | | | | 98 | | | | 108,112 | |
6.000% | | 02/01/35 | | | | | | | 139 | | | | 159,875 | |
6.000% | | 04/01/35 | | | | | | | 11 | | | | 12,442 | |
6.000% | | 05/01/36 | | | | | | | 18 | | | | 20,539 | |
6.000% | | 06/01/36 | | | | | | | 13 | | | | 14,293 | |
6.000% | | 02/01/37 | | | | | | | 45 | | | | 52,453 | |
6.000% | | 06/01/37 | | | | | | | 17 | | | | 18,516 | |
6.000% | | 05/01/38 | | | | | | | 114 | | | | 132,607 | |
6.250% | | 05/15/29 | | | | | | | 950 | | | | 1,262,022 | |
6.500% | | 09/01/32 | | | | | | | 1 | | | | 1,025 | |
6.500% | | 09/01/32 | | | | | | | 12 | | | | 13,122 | |
6.500% | | 09/01/32 | | | | | | | 26 | | | | 29,263 | |
6.500% | | 09/01/32 | | | | | | | 31 | | | | 33,922 | |
6.500% | | 10/01/32 | | | | | | | 29 | | | | 32,778 | |
6.500% | | 04/01/33 | | | | | | | 36 | | | | 41,300 | |
6.500% | | 11/01/33 | | | | | | | 19 | | | | 21,826 | |
6.500% | | 01/01/34 | | | | | | | 20 | | | | 22,474 | |
6.500% | | 09/01/34 | | | | | | | 45 | | | | 49,707 | |
6.500% | | 09/01/36 | | | | | | | 101 | | | | 117,732 | |
6.500% | | 10/01/36 | | | | | | | 16 | | | | 18,654 | |
6.500% | | 11/01/36 | | | | | | | 34 | | | | 37,967 | |
6.500% | | 01/01/37 | | | | | | | 37 | | | | 40,569 | |
6.500% | | 01/01/37 | | | | | | | 93 | | | | 104,430 | |
6.500% | | 09/01/37 | | | | | | | 11 | | | | 13,352 | |
6.625% | | 11/15/30(k) | | | | | | | 550 | | | | 776,004 | |
7.000% | | 02/01/32 | | | | | | | 12 | | | | 13,556 | |
7.000% | | 05/01/32 | | | | | | | 10 | | | | 12,322 | |
7.000% | | 06/01/32 | | | | | | | 7 | | | | 7,867 | |
7.000% | | 07/01/32 | | | | | | | 36 | | | | 40,526 | |
7.125% | | 01/15/30(k) | | | | | | | 3,600 | | | | 5,102,766 | |
Government National Mortgage Assoc. | |
2.000% | | 03/20/51 | | | | | | | 1,827 | | | | 1,845,718 | |
2.500% | | TBA | | | | | | | 500 | | | | 512,031 | |
2.500% | | TBA | | | | | | | 1,000 | | | | 1,021,835 | |
2.500% | | 03/20/43 | | | | | | | 426 | | | | 440,964 | |
SEE NOTES TO FINANCIAL STATEMENTS.
A68
| | | | | | |
| | |
| | PSF PGIM FLEXIBLE MANAGED PORTFOLIO (CONTINUED) | | |
| | | | | | |
| |
| SCHEDULE OF INVESTMENTS | | as of December 31, 2021 |
| | | | | | | | | | | | | | | | |
Interest
Rate | | Maturity Date | | | | | | Principal Amount (000)# | | | Value | |
| | | | | | | | | | | | | | | | |
|
| U.S. GOVERNMENT AGENCY OBLIGATIONS (continued) | |
2.500% | | | 12/20/46 | | | | | | | | 411 | | | $ | 423,132 | |
2.500% | | | 05/20/51 | | | | | | | | 1,915 | | | | 1,963,656 | |
2.500% | | | 08/20/51 | | | | | | | | 1,181 | | | | 1,210,581 | |
3.000% | | | TBA | | | | | | | | 4,500 | | | | 4,655,937 | |
3.000% | | | 03/15/45 | | | | | | | | 461 | | | | 480,663 | |
3.000% | | | 11/20/45 | | | | | | | | 509 | | | | 531,246 | |
3.000% | | | 03/20/46 | | | | | | | | 3,111 | | | | 3,247,658 | |
3.000% | | | 07/20/46 | | | | | | | | 2,035 | | | | 2,124,378 | |
3.000% | | | 10/20/46 | | | | | | | | 677 | | | | 706,927 | |
3.000% | | | 12/20/46 | | | | | | | | 463 | | | | 483,120 | |
3.000% | | | 02/20/47 | | | | | | | | 1,005 | | | | 1,048,976 | |
3.000% | | | 12/20/49 | | | | | | | | 210 | | | | 217,406 | |
3.500% | | �� | 12/20/42 | | | | | | | | 990 | | | | 1,054,213 | |
3.500% | | | 05/20/43 | | | | | | | | 200 | | | | 213,642 | |
3.500% | | | 03/20/45 | | | | | | | | 646 | | | | 683,149 | |
3.500% | | | 04/20/45 | | | | | | | | 873 | | | | 923,809 | |
3.500% | | | 07/20/46 | | | | | | | | 3,069 | | | | 3,231,924 | |
3.500% | | | 06/20/49 | | | | | | | | 4,197 | | | | 4,374,558 | |
4.000% | | | 06/15/40 | | | | | | | | 76 | | | | 83,623 | |
4.000% | | | 05/20/41 | | | | | | | | 153 | | | | 165,365 | |
4.000% | | | 12/20/42 | | | | | | | | 364 | | | | 393,920 | |
4.000% | | | 08/20/44 | | | | | | | | 140 | | | | 151,202 | |
4.000% | | | 11/20/45 | | | | | | | | 683 | | | | 738,767 | |
4.000% | | | 12/20/45 | | | | | | | | 750 | | | | 811,957 | |
4.000% | | | 11/20/46 | | | | | | | | 164 | | | | 174,296 | |
4.000% | | | 09/20/47 | | | | | | | | 2,231 | | | | 2,371,799 | |
4.000% | | | 02/20/49 | | | | | | | | 1,305 | | | | 1,379,417 | |
4.000% | | | 01/20/50 | | | | | | | | 1,305 | | | | 1,376,125 | |
4.500% | | | 04/15/40 | | | | | | | | 270 | | | | 302,533 | |
4.500% | | | 01/20/41 | | | | | | | | 688 | | | | 764,438 | |
4.500% | | | 02/20/41 | | | | | | | | 414 | | | | 459,600 | |
4.500% | | | 06/20/44 | | | | | | | | 450 | | | | 498,280 | |
4.500% | | | 09/20/46 | | | | | | | | 244 | | | | 270,043 | |
4.500% | | | 11/20/46 | | | | | | | | 465 | | | | 514,443 | |
4.500% | | | 03/20/47 | | | | | | | | 385 | | | | 412,921 | |
4.500% | | | 05/20/48 | | | | | | | | 401 | | | | 426,959 | |
4.500% | | | 06/20/48 | | | | | | | | 524 | | | | 557,074 | |
4.500% | | | 08/20/48 | | | | | | | | 1,719 | | | | 1,820,113 | |
5.000% | | | 10/20/37 | | | | | | | | 81 | | | | 90,753 | |
5.000% | | | 04/20/45 | | | | | | | | 450 | | | | 507,839 | |
5.500% | | | 11/15/32 | | | | | | | | 36 | | | | 39,819 | |
5.500% | | | 02/15/33 | | | | | | | | 30 | | | | 34,466 | |
5.500% | | | 08/15/33 | | | | | | | | 49 | | | | 53,918 | |
5.500% | | | 08/15/33 | | | | | | | | 67 | | | | 73,616 | |
5.500% | | | 09/15/33 | | | | | | | | 38 | | | | 41,415 | |
5.500% | | | 09/15/33 | | | | | | | | 60 | | | | 66,596 | |
5.500% | | | 10/15/33 | | | | | | | | 54 | | | | 60,603 | |
5.500% | | | 12/15/33 | | | | | | | | 5 | | | | 5,897 | |
5.500% | | | 04/15/34 | | | | | | | | 180 | | | | 205,417 | |
5.500% | | | 07/15/35 | | | | | | | | 36 | | | | 41,960 | |
5.500% | | | 02/15/36 | | | | | | | | 90 | | | | 102,096 | |
6.000% | | | 02/15/33 | | | | | | | | 2 | | | | 1,819 | |
6.000% | | | 04/15/33 | | | | | | | | 13 | | | | 14,002 | |
6.000% | | | 09/15/33 | | | | | | | | 10 | | | | 11,463 | |
6.000% | | | 12/15/33 | | | | | | | | 26 | | | | 29,808 | |
6.000% | | | 12/15/33 | | | | | | | | 69 | | | | 75,896 | |
6.000% | | | 01/15/34 | | | | | | | | 12 | | | | 14,354 | |
6.000% | | | 01/15/34 | | | | | | | | 23 | | | | 25,597 | |
| | | | | | | | | | | | | | |
Interest
Rate | | Maturity Date | | | | | Principal Amount (000)# | | | Value | |
| | | | | | | | | | | | | | |
|
| U.S. GOVERNMENT AGENCY OBLIGATIONS (continued) | |
6.000% | | 06/20/34 | | | | | | | 47 | | | $ | 53,678 | |
6.000% | | 07/15/34 | | | | | | | 99 | | | | 115,091 | |
6.000% | | 10/15/34 | | | | | | | 112 | | | | 124,135 | |
6.500% | | 10/15/23 | | | | | | | —(r | ) | | | 292 | |
6.500% | | 12/15/23 | | | | | | | 1 | | | | 1,002 | |
6.500% | | 01/15/24 | | | | | | | —(r | ) | | | 447 | |
6.500% | | 01/15/24 | | | | | | | 1 | | | | 1,349 | |
6.500% | | 01/15/24 | | | | | | | 4 | | | | 4,129 | |
6.500% | | 01/15/24 | | | | | | | 5 | | | | 5,404 | |
6.500% | | 01/15/24 | | | | | | | 17 | | | | 18,536 | |
6.500% | | 02/15/24 | | | | | | | —(r | ) | | | 100 | |
6.500% | | 02/15/24 | | | | | | | —(r | ) | | | 128 | |
6.500% | | 02/15/24 | | | | | | | —(r | ) | | | 345 | |
6.500% | | 02/15/24 | | | | | | | 1 | | | | 1,013 | |
6.500% | | 02/15/24 | | | | | | | 1 | | | | 1,077 | |
6.500% | | 02/15/24 | | | | | | | 1 | | | | 1,121 | |
6.500% | | 02/15/24 | | | | | | | 3 | | | | 3,453 | |
6.500% | | 02/15/24 | | | | | | | 4 | | | | 4,261 | |
6.500% | | 02/15/24 | | | | | | | 4 | | | | 4,705 | |
6.500% | | 02/15/24 | | | | | | | 14 | | | | 15,590 | |
6.500% | | 04/15/24 | | | | | | | —(r | ) | | | 210 | |
6.500% | | 04/15/24 | | | | | | | 1 | | | | 625 | |
6.500% | | 04/15/24 | | | | | | | 1 | | | | 1,000 | |
6.500% | | 04/15/24 | | | | | | | 1 | | | | 1,031 | |
6.500% | | 04/15/24 | | | | | | | 4 | | | | 4,856 | |
6.500% | | 05/15/24 | | | | | | | 4 | | | | 4,116 | |
6.500% | | 05/15/24 | | | | | | | 7 | | | | 7,300 | |
6.500% | | 10/15/24 | | | | | | | 5 | | | | 5,351 | |
6.500% | | 12/15/30 | | | | | | | 5 | | | | 5,939 | |
6.500% | | 01/15/32 | | | | | | | 15 | | | | 16,506 | |
6.500% | | 02/15/32 | | | | | | | 12 | | | | 12,663 | |
6.500% | | 07/15/32 | | | | | | | 26 | | | | 28,435 | |
6.500% | | 08/15/32 | | | | | | | 4 | | | | 3,868 | |
6.500% | | 08/15/32 | | | | | | | 7 | | | | 7,740 | |
6.500% | | 08/15/32 | | | | | | | 24 | | | | 26,880 | |
6.500% | | 08/15/32 | | | | | | | 124 | | | | 141,954 | |
6.500% | | 06/15/35 | | | | | | | 22 | | | | 25,490 | |
6.500% | | 07/15/35 | | | | | | | 6 | | | | 6,864 | |
8.000% | | 01/15/24 | | | | | | | 3 | | | | 3,122 | |
8.000% | | 04/15/25 | | | | | | | 2 | | | | 1,709 | |
Tennessee Valley Authority, Sr. Unsec’d. Notes | |
1.500% | | 09/15/31 | | | | | | | 625 | | | | 612,000 | |
| | | | | | | | | | | | | | |
TOTAL U.S. GOVERNMENT AGENCY OBLIGATIONS
(cost $242,354,500) | | | | 246,549,184 | |
| | | | | | | | | | | | | | |
|
| U.S. TREASURY OBLIGATIONS — 0.4% | |
U.S. Treasury Bonds | | | | | | | | | |
1.750% | | 08/15/41 | | | | | | | 9,990 | | | | 9,679,373 | |
2.000% | | 11/15/41 | | | | | | | 3,045 | | | | 3,078,780 | |
2.000% | | 08/15/51 | | | | | | | 480 | | | | 490,050 | |
2.250% | | 05/15/41 | | | | | | | 2,145 | | | | 2,251,580 | |
U.S. Treasury Notes | | | | | | | | | |
3.125% | | 11/15/28(k) | | | | | | | 100 | | | | 111,187 | |
U.S. Treasury Strips Coupon | | | | | | | | | |
2.000% | | 08/15/39(k) | | | | | | | 3,780 | | | | 2,662,095 | |
2.228% | | 05/15/28(k) | | | | | | | 718 | | | | 655,287 | |
2.365%(s) | | 08/15/44 | | | | | | | 3,095 | | | | 1,932,078 | |
SEE NOTES TO FINANCIAL STATEMENTS.
A69
| | | | | | |
| | |
| | PSF PGIM FLEXIBLE MANAGED PORTFOLIO (CONTINUED) | | |
| | | | | | |
| |
| SCHEDULE OF INVESTMENTS | | as of December 31, 2021 |
| | | | | | | | | | | | | | | | |
Interest
Rate | | Maturity
Date | | | | | | Principal
Amount
(000)# | | | Value | |
|
| U.S. TREASURY OBLIGATIONS(continued) | |
2.395%(s) | | | 11/15/43 | | | | | | | | 1,156 | | | $ | 732,570 | |
| | | | | | | | | | | | | | | | |
TOTAL U.S. TREASURY OBLIGATIONS
(cost $21,188,147) | | | | 21,593,000 | |
| | | | | | | | | | | | | | | | |
TOTAL LONG-TERM INVESTMENTS
(cost $3,568,409,226) | | | | 4,668,300,447 | |
| | | | | | | | | | | | | | | | |
| | | | |
| | | | | | | | | Shares | | | | |
|
| SHORT-TERM INVESTMENTS — 7.1% | |
|
| AFFILIATED MUTUAL FUNDS — 7.1% | |
PGIM Core Ultra Short Bond Fund(wa) | | | | 303,840,636 | | | | 303,840,636 | |
PGIM Institutional Money Market Fund
(cost $45,448,021; includes $45,444,721 of cash collateral for securities on loan)(b)(wa) | | | | 45,547,739 | | | | 45,515,856 | |
| | | | | | | | | | | | | | | | |
TOTAL AFFILIATED MUTUAL FUNDS
(cost $349,288,657) | | | | 349,356,492 | |
| | | | | | | | | | | | | | | | |
| | | | |
Interest
Rate | | Maturity
Date | | | | | | Principal
Amount
(000)# | | | | |
|
| U.S. TREASURY OBLIGATION(k)(n) — 0.0% | |
U.S. Treasury Bills | | | | | | | | | | | | | |
0.043% | | | 03/17/22 | | | | | | | | 300 | | | | 299,966 | |
| | | | | | | | | | | | | | | | |
(cost $299,974) | | | | | | | | | | | | | |
|
| OPTIONS PURCHASED*~ — 0.0% | |
(cost $83,723) | | | | 36,239 | |
| | | | | | | | | | | | | | | | |
TOTAL SHORT-TERM INVESTMENTS
(cost $349,672,354) | | | | 349,692,697 | |
| | | | | | | | | | | | | | | | |
TOTAL INVESTMENTS, BEFORE OPTIONS
WRITTEN—101.0%
(cost $3,918,081,580) | | | | 5,017,993,144 | |
| | | | | | | | | | | | | | | | |
|
| OPTIONS WRITTEN*~ — (0.0)% | |
(premiums received $85,399) | | | | (109,666 | ) |
| | | | | | | | | | | | | | | | |
TOTAL INVESTMENTS, NET OF OPTIONS
WRITTEN—101.0%
(cost $3,917,996,181) | | | | 5,017,883,478 | |
Liabilities in excess of other assets(z) — (1.0)% | | | | (48,111,607 | ) |
| | | | | | | | | | | | | | | | |
| |
NET ASSETS — 100.0% | | | $ | 4,969,771,871 | |
| | | | | | | | | | | | | | | | |
See the Glossary for a list of the abbreviation(s) used in the annual report.
| * | Non-income producing security. |
| # | Principal or notional amount is shown in U.S. dollars unless otherwise stated. |
| ~ | See tables subsequent to the Schedule of Investments for options detail. |
| ^ | Indicates a Level 3 instrument. The aggregate value of Level 3 instruments is $4,877 and 0.0% of net assets. |
| (a) | All or a portion of security is on loan. The aggregate market value of such securities, including those sold and pending settlement, is $43,941,144; cash collateral of $45,444,721 (included in liabilities) was received with which the Portfolio purchased highly liquid short-term investments. In the event of significant appreciation in value of securities on loan on the last business day of the reporting period, the Portfolio may reflect a collateral value that is less than the market value of the loaned securities and such shortfall is remedied the following business day. |
| (b) | Represents security, or portion thereof, purchased with cash collateral received for securities on loan and includes dividend reinvestment. |
| (c) | Variable rate instrument. The interest rate shown reflects the rate in effect at December 31, 2021. |
| (cc) | Variable rate instrument. The rate shown is based on the latest available information as of December 31, 2021. Certain variable rate securities are not based on a published reference rate and spread but are determined by the issuer or agent and are based on current market conditions. These securities do not indicate a reference rate and spread in their description. |
| (ff) | Variable rate security. Security may be issued at a fixed coupon rate, which converts to a variable rate at a specified date. Rate shown is the rate in effect as of period end. |
| (k) | Represents security, or a portion thereof, segregated as collateral for centrally cleared/exchange-traded derivatives. |
| (n) | Rate shown reflects yield to maturity at purchased date. |
| (oo) | Perpetual security. Maturity date represents next call date. |
| (r) | Principal or notional amount is less than $500 par. |
| (s) | Represents zero coupon bond or principal only security. Rate represents yield to maturity at purchase date. |
| (tt) | All or partial principal amount represents “TBA” mortgage dollar rolls. The aggregate mortgage dollar roll principal amount of 1,500,000 is 0.0% of net assets. |
| (wa) | PGIM Investments LLC, the manager of the Portfolio, also serves as manager of the PGIM Core Ultra Short Bond Fund and PGIM Institutional Money Market Fund, if applicable. |
| (z) | Includes net unrealized appreciation/(depreciation) and/or market value of the below holdings which are excluded from the Schedule of Investments: |
Options Purchased:
OTC Swaptions
| | | | | | | | | | | | | | | | | | | | |
Description | | Call/
Put | | Counterparty | | Expiration
Date | | Strike | | Receive | | Pay | | Notional
Amount
(000)# | | | Value | |
CDX.NA.IG.37.V1, 12/20/26 | | Call | | BNP Paribas S.A. | | 02/16/22 | | 0.35% | | 1.00%(Q) | | CDX.NA.IG.37.V1(Q) | | | 9,830 | | | $ | — | |
SEE NOTES TO FINANCIAL STATEMENTS.
A70
| | | | | | |
| | |
| | PSF PGIM FLEXIBLE MANAGED PORTFOLIO (CONTINUED) | | |
| | | | | | |
| |
| SCHEDULE OF INVESTMENTS | | as of December 31, 2021 |
Options Purchased (continued):
OTC Swaptions
| | | | | | | | | | | | | | | | | | | | |
Description | | Call/
Put | | Counterparty | | Expiration
Date | | Strike | | Receive | | Pay | | Notional
Amount
(000)# | | | Value | |
CDX.NA.IG.37.V1, 12/20/26 | | Call | | Morgan Stanley & Co. International PLC | | 02/16/22 | | 0.35% | | 1.00%(Q) | | CDX.NA.IG.37.V1(Q) | | | 9,300 | | | $ | — | |
CDX.NA.IG.37.V1, 12/20/26 | | Call | | Morgan Stanley & Co. International PLC | | 02/16/22 | | 0.35% | | 1.00%(Q) | | CDX.NA.IG.37.V1(Q) | | | 9,250 | | | | — | |
CDX.NA.IG.37.V1, 12/20/26 | | Call | | Morgan Stanley & Co. International PLC | | 02/16/22 | | 0.35% | | 1.00%(Q) | | CDX.NA.IG.37.V1(Q) | | | 4,650 | | | | — | |
CDX.NA.IG.37.V1, 12/20/26 | | Call | | Morgan Stanley & Co. International PLC | | 02/16/22 | | 0.35% | | 1.00%(Q) | | CDX.NA.IG.37.V1(Q) | | | 14,120 | | | | — | |
CDX.NA.IG.37.V1, 12/20/26 | | Put | | BNP Paribas S.A. | | 02/16/22 | | 0.58% | | CDX.NA.IG.37.V1(Q) | | 1.00%(Q) | | | 9,830 | | | | 7,555 | |
CDX.NA.IG.37.V1, 12/20/26 | | Put | | Morgan Stanley & Co. International PLC | | 02/16/22 | | 0.58% | | CDX.NA.IG.37.V1(Q) | | 1.00%(Q) | | | 9,300 | | | | 7,148 | |
CDX.NA.IG.37.V1, 12/20/26 | | Put | | Morgan Stanley & Co. International PLC | | 02/16/22 | | 0.58% | | CDX.NA.IG.37.V1(Q) | | 1.00%(Q) | | | 9,250 | | | | 7,109 | |
CDX.NA.IG.37.V1, 12/20/26 | | Put | | Morgan Stanley & Co. International PLC | | 02/16/22 | | 0.58% | | CDX.NA.IG.37.V1(Q) | | 1.00%(Q) | | | 4,650 | | | | 3,574 | |
CDX.NA.IG.37.V1, 12/20/26 | | Put | | Morgan Stanley & Co. International PLC | | 02/16/22 | | 0.58% | | CDX.NA.IG.37.V1(Q) | | 1.00%(Q) | | | 14,120 | | | | 10,853 | |
| | | | | | | | | | | | | | | | | | | | |
Total Options Purchased (cost $83,723) | | | | | | | | $ | 36,239 | |
| | | | | | | | | | | | | | | | | | | | |
Options Written:
OTC Swaptions
| | | | | | | | | | | | | | | | | | | | |
Description | | Call/
Put | | Counterparty | | Expiration
Date | | Strike | | Receive | | Pay | | Notional
Amount
(000)# | | | Value | |
CDX.NA.IG.37.V1, 12/20/26 | | Call | | BNP Paribas S.A. | | 02/16/22 | | 0.53% | | CDX.NA.IG.37.V1(Q) | | 1.00%(Q) | | | 9,830 | | | $ | (19,952 | ) |
CDX.NA.IG.37.V1, 12/20/26 | | Call | | Morgan Stanley & Co. International PLC | | 02/16/22 | | 0.53% | | CDX.NA.IG.37.V1(Q) | | 1.00%(Q) | | | 9,300 | | | | (18,876 | ) |
CDX.NA.IG.37.V1, 12/20/26 | | Call | | Morgan Stanley & Co. International PLC | | 02/16/22 | | 0.53% | | CDX.NA.IG.37.V1(Q) | | 1.00%(Q) | | | 9,250 | | | | (18,774 | ) |
CDX.NA.IG.37.V1, 12/20/26 | | Call | | Morgan Stanley & Co. International PLC | | 02/16/22 | | 0.53% | | CDX.NA.IG.37.V1(Q) | | 1.00%(Q) | | | 4,650 | | | | (9,438 | ) |
CDX.NA.IG.37.V1, 12/20/26 | | Call | | Morgan Stanley & Co. International PLC | | 02/16/22 | | 0.53% | | CDX.NA.IG.37.V1(Q) | | 1.00%(Q) | | | 14,120 | | | | (28,659 | ) |
CDX.NA.IG.37.V1, 12/20/26 | | Put | | Morgan Stanley & Co. International PLC | | 02/16/22 | | 0.73% | | 1.00%(Q) | | CDX.NA.IG.37.V1(Q) | | | 9,250 | | | | (2,794 | ) |
CDX.NA.IG.37.V1, 12/20/26 | | Put | | BNP Paribas S.A. | | 02/16/22 | | 0.75% | | 1.00%(Q) | | CDX.NA.IG.37.V1(Q) | | | 9,830 | | | | (2,627 | ) |
CDX.NA.IG.37.V1, 12/20/26 | | Put | | Morgan Stanley & Co. International PLC | | 02/16/22 | | 0.75% | | 1.00%(Q) | | CDX.NA.IG.37.V1(Q) | | | 9,300 | | | | (2,485 | ) |
SEE NOTES TO FINANCIAL STATEMENTS.
A71
| | | | | | |
| | |
| | PSF PGIM FLEXIBLE MANAGED PORTFOLIO (CONTINUED) | | |
| | | | | | |
| |
| SCHEDULE OF INVESTMENTS | | as of December 31, 2021 |
Options Written (continued):
OTC Swaptions
| | | | | | | | | | | | | | | | | | | | |
Description | | Call/
Put | | Counterparty | | Expiration
Date | | Strike | | Receive | | Pay | | Notional
Amount
(000)# | | | Value | |
CDX.NA.IG.37.V1, 12/20/26 | | Put | | Morgan Stanley & Co. International PLC | | 02/16/22 | | 0.75% | | 1.00%(Q) | | CDX.NA.IG.37.V1(Q) | | | 4,650 | | | $ | (1,243 | ) |
CDX.NA.IG.37.V1, 12/20/26 | | Put | | Morgan Stanley & Co. International PLC | | 02/16/22 | | 0.75% | | 1.00%(Q) | | CDX.NA.IG.37.V1(Q) | | | 14,120 | | | | (3,774 | ) |
GS_21-PJ2A^ | | Put | | Goldman Sachs International | | 11/15/24 | | 0.50% | | 0.50%(M) | | GS_21-PJ2A(M) | | | 7,000 | | | | (392 | ) |
GS_21-PJA^ | | Put | | Goldman Sachs International | | 06/17/24 | | 0.25% | | 0.25%(M) | | GS_21-PJA(M) | | | 13,500 | | | | (652 | ) |
| | | | | |
Total Options Written (premiums received $85,399) | | | $ | (109,666 | ) |
| | | | | |
Futures contracts outstanding at December 31, 2021:
| | | | | | | | | | | | | | |
Number
of
Contracts | | Type | | Expiration
Date | | | Current
Notional
Amount | | | Value /
Unrealized
Appreciation
(Depreciation) | |
Long Positions: | |
| 439 | | 2 Year U.S. Treasury Notes | | | Mar. 2022 | | | $ | 95,777,454 | | | $ | (100,435 | ) |
| 354 | | 5 Year U.S. Treasury Notes | | | Mar. 2022 | | | | 42,825,702 | | | | 85,639 | |
| 299 | | 10 Year U.S. Treasury Notes | | | Mar. 2022 | | | | 39,010,156 | | | | 124,142 | |
| 163 | | 20 Year U.S. Treasury Bonds | | | Mar. 2022 | | | | 26,151,312 | | | | 121,940 | |
| 501 | | 30 Year U.S. Ultra Treasury Bonds | | | Mar. 2022 | | | | 98,759,625 | | | | 1,612,548 | |
| 8 | | Mini MSCI EAFE Index | | | Mar. 2022 | | | | 928,720 | | | | 16,034 | |
| 6 | | S&P 500 E-Mini Index | | | Mar. 2022 | | | | 1,427,550 | | | | 16,794 | |
| | | | | |
| | | | | | | | | | | | | 1,876,662 | |
| | | | | |
Short Positions: | |
| 15 | | 5 Year Euro-Bobl | | | Mar. 2022 | | | | 2,275,406 | | | | 19,285 | |
| 32 | | 10 Year Euro-Bund | | | Mar. 2022 | | | | 6,243,352 | | | | 104,477 | |
| 28 | | 10 Year U.S. Ultra Treasury Notes | | | Mar. 2022 | | | | 4,100,250 | | | | (70,191 | ) |
| 23 | | Euro Schatz Index | | | Mar. 2022 | | | | 2,933,562 | | | | 4,823 | |
| | | | | |
| | | | | | | | | | | | | 58,394 | |
| | | | | |
| | | | | | | | | | | | $ | 1,935,056 | |
| | | | | |
Forward foreign currency exchange contracts outstanding at December 31, 2021:
| | | | | | | | | | | | | | | | | | | | | | |
Sale
Contracts | | Counterparty | | Notional
Amount
(000) | | | Value at
Settlement
Date | | | Current
Value | | | Unrealized
Appreciation | | | Unrealized Depreciation | |
OTC Forward Foreign Currency Exchange Contracts: | |
Canadian Dollar, | | | | | | | | | | | | | | | | | | | | | | |
Expiring 01/19/22 | | Morgan Stanley & Co. International PLC | | CAD | 5,569 | | | $ | 4,462,841 | | | $ | 4,402,485 | | | $ | 60,356 | | | $ | — | |
Euro, | | | | | | | | | | | | | | | | | | | | | | |
Expiring 01/12/22 | | BNP Paribas S.A. | | EUR | 22,014 | | | | 24,813,099 | | | | 25,068,693 | | | | — | | | | (255,594 | ) |
| | | | | | | | | | | | | | | | | | | | | | |
| | | | | | | | $ | 29,275,940 | | | $ | 29,471,178 | | | $ | 60,356 | | | $ | (255,594 | ) |
| | | | | | | | | | | | | | | | | | | | | | |
SEE NOTES TO FINANCIAL STATEMENTS.
A72
| | | | | | |
| | |
| | PSF PGIM FLEXIBLE MANAGED PORTFOLIO (CONTINUED) | | |
| | | | | | |
| |
| SCHEDULE OF INVESTMENTS | | as of December 31, 2021 |
Credit default swap agreements outstanding at December 31, 2021:
| | | | | | | | | | | | | | | | | | | | | | | | | | | | | | |
Reference Entity/
Obligation | | Termination
Date | | | Fixed
Rate | | | Notional
Amount
(000)#(3) | | | Implied
Credit
Spread at
December 31,
2021(4) | | | Fair
Value | | | Upfront
Premiums
Paid
(Received) | | | Unrealized
Appreciation
(Depreciation) | | | Counterparty |
| | | | | | | | | | | | | | | | | | | | | | | | | | | | | | |
OTC Credit Default Swap Agreements on asset-backed and/or mortgage-backed securities - Sell Protection(2)^: |
GS_21-PJ2A | | | 01/14/22 | | | | 0.500%(M) | | | | 7,000 | | | | * | | | $ | 3,014 | | | $ | (654 | ) | | $ | 3,668 | | | Goldman Sachs International |
GS_21-PJA | | | 01/14/22 | | | | 0.250%(M) | | | | 13,500 | | | | * | | | | 2,907 | | | | (630 | ) | | | 3,537 | | | Goldman Sachs International |
| | | | | | | | | | | | | | | | | | | | | | | | | | | | | | |
| | | | | | | | | | | | | | | | | | $ | 5,921 | | | $ | (1,284 | ) | | $ | 7,205 | | | |
| | | | | | | | | | | | | | | | | | | | | | | | | | | | | | |
The Portfolio entered into credit default swaps (“CDS”) to provide a measure of protection against defaults or to take an active long or short position with respect to the likelihood of a particular issuer’s default or the reference entity’s credit soundness. CDS contracts generally trade based on a spread which represents the cost a protection buyer has to pay the protection seller. The protection buyer is said to be short the credit as the value of the contract rises the more the credit deteriorates. The value of the CDS contract increases for the protection buyer if the spread increases.
| (1) | If the Portfolio is a buyer of protection, it pays the fixed rate. When a credit event occurs, as defined under the terms of that particular swap agreement, the Portfolio will either (i) receive from the seller of protection an amount equal to the notional amount of the swap and make delivery of the referenced obligation or underlying securities comprising the referenced index or (ii) receive a net settlement amount in the form of cash or securities equal to the notional amount of the swap less the recovery value of the referenced obligation or underlying securities comprising the referenced index. |
| (2) | If the Portfolio is a seller of protection, it receives the fixed rate. When a credit event occurs, as defined under the terms of that particular swap agreement, the Portfolio will either (i) pay to the buyer of protection an amount equal to the notional amount of the swap and take delivery of the referenced obligation or underlying securities comprising the referenced index or (ii) pay a net settlement amount in the form of cash or securities equal to the notional amount of the swap less the recovery value of the referenced obligation or underlying securities comprising the referenced index. |
| (3) | Notional amount represents the maximum potential amount the Portfolio could be required to pay as a seller of credit protection or receive as a buyer of credit protection if a credit event occurs as defined under the terms of that particular swap agreement. |
| (4) | Implied credit spreads, represented in absolute terms, utilized in determining the fair value of credit default swap agreements where the Portfolio is the seller of protection as of the reporting date serve as an indicator of the current status of the payment/ performance risk and represent the likelihood of risk of default for the credit derivative. The implied credit spread of a particular referenced entity reflects the cost of buying/selling protection and may include up-front payments required to be made to enter into the agreement. Wider credit spreads represent a deterioration of the referenced entity’s credit soundness and a greater likelihood of risk of default or other credit event occurring as defined under the terms of the agreement. |
| * | When an implied credit spread is not available, reference the fair value of credit default swap agreements on credit indices and asset-backed securities. Where the Portfolio is the seller of protection, it serves as an indicator of the current status of the payment/performance risk and represents the likelihood of an expected liability (or profit) for the credit derivative should the notional amount of the swap agreement be closed/sold as of the reporting date. Increasing fair value in absolute terms, when compared to the notional amount of the swap, represents a deterioration of the referenced entity’s credit soundness and a greater likelihood of risk of default or other credit event occurring as defined under the terms of the agreement. |
Inflation swap agreements outstanding at December 31, 2021:
| | | | | | | | | | | | | | | | | | | | | | | | |
Notional
Amount
(000)# | | | Termination
Date | | | Fixed
Rate | | | Floating
Rate | | Value at
Trade Date | | | Value at
December 31,
2021 | | | Unrealized
Appreciation
(Depreciation) | |
| | Centrally Cleared Inflation Swap Agreements: | |
| | 7,460 | | | | 01/13/26 | | | | 2.152%(T) | | | U.S. CPI Urban Consumers NSA Index(2)(T) | | $ | — | | | $ | (617,244 | ) | | $ | (617,244 | ) |
| | 22,580 | | | | 02/02/26 | | | | 2.295%(T) | | | U.S. CPI Urban Consumers NSA Index(2)(T) | | | (62,535 | ) | | | (1,695,955 | ) | | | (1,633,420 | ) |
| | 11,175 | | | | 02/18/26 | | | | 2.370%(T) | | | U.S. CPI Urban Consumers NSA Index(2)(T) | | | — | | | | (785,792 | ) | | | (785,792 | ) |
| | | | | | | | | | | | | | | | | | | | | | | | |
| | | | | | | | | | | | | | $ | (62,535 | ) | | $ | (3,098,991 | ) | | $ | (3,036,456 | ) |
| | | | | | | | | | | | | | | | | | | | | | | | |
| (1) | The Portfolio pays the fixed rate and receives the floating rate. |
| (2) | The Portfolio pays the floating rate and receives the fixed rate. |
SEE NOTES TO FINANCIAL STATEMENTS.
A73
| | | | | | |
| | |
| | PSF PGIM FLEXIBLE MANAGED PORTFOLIO (CONTINUED) | | |
| | | | | | |
| |
| SCHEDULE OF INVESTMENTS | | as of December 31, 2021 |
Total return swap agreements outstanding at December 31, 2021:
| | | | | | | | | | | | | | | | | | | | | | | | | | |
Reference Entity | | Financing Rate | | Counterparty | | Termination
Date | | Long (Short)
Notional
Amount
(000)#(1) | | Fair Value | | Upfront
Premiums
Paid
(Received) | | Unrealized
Appreciation
(Depreciation)(2) |
OTC Total Return Swap Agreement: | | | | | | | | | | | | | | | | | | | | | | | | | | |
U.S. Treasury Bond(T) | | 1 Day USOIS +4bps(T) | | JP Morgan Chase
Bank, N.A. | | | | 2/22/22 | | | | | 18,765 | | | $55,129 | | | $ | — | | | | $ | 55,129 | |
| | | | | | | | | | | | | | | | | | | | | | | | | | |
| (1) | On a long total return swap, the Portfolio receives payments for any positive return on the reference entity (makes payments for any negative return) and pays the financing rate. On a short total return swap, the Portfolio makes payments for any positive return on the reference entity (receives payments for any negative return) and receives the financing rate. |
| (2) | Upfront/recurring fees or commissions, as applicable, are included in the net unrealized appreciation (depreciation). |
Balances Reported in the Statement of Assets and Liabilities for OTC Swap Agreements:
| | | | | | | | |
| | | Premiums Paid | | Premiums Received | | Unrealized
Appreciation | | Unrealized
Depreciation |
| | | | |
OTC Swap Agreements | | $— | | $(1,284) | | $62,334 | | $— |
Summary of Collateral for Centrally Cleared/Exchange-traded Derivatives:
Cash and securities segregated as collateral, including pending settlement for closed positions, to cover requirements for centrally cleared/exchange-traded derivatives are listed by broker as follows:
| | | | | | | | | | |
Broker | | Cash and/or Foreign Currency | | Securities Market Value |
Citigroup Global Markets, Inc. | | | $ | — | | | | $ | 6,366,586 | |
Goldman Sachs & Co. LLC | | | | — | | | | | 299,966 | |
| | | | | | | | | | |
Total | | | $ | — | | | | $ | 6,666,552 | |
| | | | | | | | | | |
Fair Value Measurements:
Various inputs are used in determining the value of the Portfolio’s investments. These inputs are summarized in the three broad levels listed below.
Level 1—unadjusted quoted prices generally in active markets for identical securities.
Level 2—quoted prices for similar securities, interest rates and yield curves, prepayment speeds, foreign currency exchange rates and other observable inputs.
Level 3—unobservable inputs for securities valued in accordance with Board approved fair valuation procedures.
The following is a summary of the inputs used as of December 31, 2021 in valuing such portfolio securities:
| | | | | | | | | | | | |
| | | Level 1 | | | Level 2 | | | Level 3 | |
Investments in Securities | | | | | | | | | | | | |
Assets | | | | | | | | | | | | |
Long-Term Investments | | | | | | | | | | | | |
Common Stocks | | $ | 3,225,089,433 | | | $ | 49,539,603 | | | $ | — | |
Exchange-Traded Fund | | | 195,756 | | | | — | | | | — | |
Preferred Stocks | | | 613,800 | | | | 93,124 | | | | — | |
Asset-Backed Securities | | | | | | | | | | | | |
Automobiles | | | — | | | | 86,146,693 | | | | — | |
Collateralized Loan Obligations | | | — | | | | 154,323,319 | | | | — | |
Consumer Loans | | | — | | | | 10,558,373 | | | | — | |
Equipment | | | — | | | | 8,771,569 | | | | — | |
Home Equity Loans | | | — | | | | 18,037 | | | | — | |
Other | | | — | | | | 5,084,232 | | | | — | |
Residential Mortgage-Backed Securities | | | — | | | | 6,621,061 | | | | — | |
Student Loans | | | — | | | | 18,117,154 | | | | — | |
Commercial Mortgage-Backed Securities | | | — | | | | 247,077,699 | | | | — | |
Corporate Bonds | | | — | | | | 440,325,483 | | | | — | |
Municipal Bonds | | | — | | | | 19,265,730 | | | | — | |
Residential Mortgage-Backed Securities | | | — | | | | 99,986,301 | | | | — | |
SEE NOTES TO FINANCIAL STATEMENTS.
A74
| | | | | | |
| | |
| | PSF PGIM FLEXIBLE MANAGED PORTFOLIO (CONTINUED) | | |
| | | | | | |
| |
| SCHEDULE OF INVESTMENTS | | as of December 31, 2021 |
| | | | | | | | | | | | |
| | | Level 1 | | | Level 2 | | | Level 3 | |
Investments in Securities (continued) | | | | | | | | | | | | |
Assets (continued) | | | | | | | | | | | | |
Long-Term Investments (continued) | | | | | | | | | | | | |
Sovereign Bonds | | $ | — | | | $ | 28,330,896 | | | $ | — | |
U.S. Government Agency Obligations | | | — | | | | 246,549,184 | | | | — | |
U.S. Treasury Obligations | | | — | | | | 21,593,000 | | | | — | |
Short-Term Investments | | | | | | | | | | | | |
Affiliated Mutual Funds | | | 349,356,492 | | | | — | | | | — | |
U.S. Treasury Obligation | | | — | | | | 299,966 | | | | — | |
Options Purchased | | | — | | | | 36,239 | | | | — | |
| | | | | | | | | | | | |
Total | | $ | 3,575,255,481 | | | $ | 1,442,737,663 | | | $ | — | |
| | | | | | | | | | | | |
| | | |
Liabilities | | | | | | | | | | | | |
Options Written | | $ | — | | | $ | (108,622 | ) | | $ | (1,044 | ) |
| | | | | | | | | | | | |
| | | |
| Other Financial Instruments* | | | | | | | | | | | | |
| | | |
| Assets | | | | | | | | | | | | |
Futures Contracts | | $ | 2,105,682 | | | $ | — | | | $ | — | |
OTC Forward Foreign Currency Exchange Contract | | | — | | | | 60,356 | | | | — | |
OTC Credit Default Swap Agreements | | | — | | | | — | | | | 5,921 | |
OTC Total Return Swap Agreement | | | — | | | | 55,129 | | | | — | |
| | | | | | | | | | | | |
Total | | $ | 2,105,682 | | | $ | 115,485 | | | | $ 5,921 | |
| | | | | | | | | | | | |
| | | |
| Liabilities | | | | | | | | | | | | |
Futures Contracts | | $ | (170,626 | ) | | $ | — | | | $ | — | |
OTC Forward Foreign Currency Exchange Contract | | | — | | | | (255,594 | ) | | | — | |
Centrally Cleared Inflation Swap Agreements | | | — | | | | (3,036,456 | ) | | | — | |
| | | | | | | | | | | | |
Total | | $ | (170,626 | ) | | $ | (3,292,050 | ) | | $ | — | |
| | | | | | | | | | | | |
| * | Other financial instruments are derivative instruments not reflected in the Schedule of Investments, such as futures, forwards and centrally cleared swap contracts, which are recorded at the unrealized appreciation (depreciation) on the instrument, and OTC swap contracts which are recorded at fair value. |
Industry Classification:
The industry classification of investments and liabilities in excess of other assets shown as a percentage of net assets as of December 31, 2021 were as follows (unaudited):
| | | | |
Affiliated Mutual Funds (0.9% represents investments purchased with collateral from securities on loan) | | | 7.1 | % |
Software | | | 6.8 | |
Commercial Mortgage-Backed Securities | | | 5.0 | |
U.S. Government Agency Obligations | | | 5.0 | |
Banks | | | 4.8 | |
Semiconductors & Semiconductor Equipment | | | 4.6 | |
Technology Hardware, Storage & Peripherals | | | 4.3 | |
Interactive Media & Services | | | 4.2 | |
Pharmaceuticals | | | 3.7 | |
Automobiles | | | 3.3 | |
IT Services | | | 3.1 | |
Collateralized Loan Obligations | | | 3.1 | |
Internet & Direct Marketing Retail | | | 2.3 | |
Health Care Equipment & Supplies | | | 2.2 | |
Residential Mortgage-Backed Securities | | | 2.1 | |
Oil, Gas & Consumable Fuels | | | 2.1 | |
Capital Markets | | | 2.0 | |
Hotels, Restaurants & Leisure | | | 1.8 | |
Chemicals | | | 1.7 | |
Health Care Providers & Services | | | 1.7 | |
Beverages | | | 1.6 | |
| | | | |
Insurance | | | 1.5 | % |
Aerospace & Defense | | | 1.5 | |
Entertainment | | | 1.4 | |
Specialty Retail | | | 1.4 | |
Life Sciences Tools & Services | | | 1.3 | |
Equity Real Estate Investment Trusts (REITs) | | | 1.2 | |
Biotechnology | | | 1.1 | |
Machinery | | | 1.0 | |
Media | | | 1.0 | |
Diversified Telecommunication Services | | | 0.9 | |
Food Products | | | 0.9 | |
Electrical Equipment | | | 0.9 | |
Electric | | | 0.8 | |
Diversified Financial Services | | | 0.7 | |
Electric Utilities | | | 0.6 | |
Sovereign Bonds | | | 0.6 | |
Consumer Finance | | | 0.6 | |
Industrial Conglomerates | | | 0.6 | |
Telecommunications | | | 0.5 | |
Pipelines | | | 0.5 | |
Food & Staples Retailing | | | 0.5 | |
Electronic Equipment, Instruments & Components | | | 0.5 | |
SEE NOTES TO FINANCIAL STATEMENTS.
A75
| | | | | | |
| | |
| | PSF PGIM FLEXIBLE MANAGED PORTFOLIO (CONTINUED) | | |
| | | | | | |
| |
| SCHEDULE OF INVESTMENTS | | as of December 31, 2021 |
Industry Classification (continued):
| | | | |
Distributors | | | 0.4 | % |
U.S. Treasury Obligations | | | 0.4 | |
Household Products | | | 0.4 | |
Metals & Mining | | | 0.4 | |
Municipal Bonds | | | 0.4 | |
Oil & Gas | | | 0.4 | |
Student Loans | | | 0.4 | |
Textiles, Apparel & Luxury Goods | | | 0.4 | |
Auto Manufacturers | | | 0.3 | |
Building Products | | | 0.3 | |
Independent Power & Renewable Electricity Producers | | | 0.3 | |
Communications Equipment | | | 0.3 | |
Tobacco | | | 0.3 | |
Real Estate Investment Trusts (REITs) | | | 0.3 | |
Air Freight & Logistics | | | 0.3 | |
Consumer Loans | | | 0.2 | |
Multi-Utilities | | | 0.2 | |
Energy Equipment & Services | | | 0.2 | |
Equipment | | | 0.2 | |
Retail | | | 0.2 | |
Road & Rail | | | 0.2 | |
Construction & Engineering | | | 0.1 | |
Multiline Retail | | | 0.1 | |
Professional Services | | | 0.1 | |
Real Estate Management & Development | | | 0.1 | |
Commercial Services | | | 0.1 | |
Semiconductors | | | 0.1 | |
Agriculture | | | 0.1 | |
Other | | | 0.1 | |
Packaging & Containers | | | 0.1 | |
Healthcare-Services | | | 0.1 | |
Foods | | | 0.1 | |
Household Durables | | | 0.1 | |
Airlines | | | 0.1 | |
Gas | | | 0.1 | |
| | | | |
Mining | | | 0.1 | % |
Commercial Services & Supplies | | | 0.1 | |
Healthcare-Products | | | 0.1 | |
Personal Products | | | 0.1 | |
Office/Business Equipment | | | 0.1 | |
Engineering & Construction | | | 0.1 | |
Building Materials | | | 0.0 | * |
Leisure Products | | | 0.0 | * |
Home Builders | | | 0.0 | * |
Transportation | | | 0.0 | * |
Housewares | | | 0.0 | * |
Trading Companies & Distributors | | | 0.0 | * |
Gas Utilities | | | 0.0 | * |
Construction Materials | | | 0.0 | * |
Miscellaneous Manufacturing | | | 0.0 | * |
Lodging | | | 0.0 | * |
Marine | | | 0.0 | * |
Apparel | | | 0.0 | * |
Multi-National | | | 0.0 | * |
Wireless Telecommunication Services | | | 0.0 | * |
Auto Components | | | 0.0 | * |
Containers & Packaging | | | 0.0 | * |
Exchange-Traded Fund | | | 0.0 | * |
Paper & Forest Products | | | 0.0 | * |
Options Purchased | | | 0.0 | * |
Home Equity Loans | | | 0.0 | * |
Diversified Consumer Services | | | 0.0 | * |
| | | | |
| | | 101.0 | |
Options Written | | | (0.0 | )* |
Liabilities in excess of other assets | | | (1.0 | ) |
| | | | |
| | | 100.0 | % |
| | | | |
Effects of Derivative Instruments on the Financial Statements and Primary Underlying Risk Exposure:
The Portfolio invested in derivative instruments during the reporting period. The primary types of risk associated with these derivative instruments are credit contracts risk, equity contracts risk, foreign exchange contracts risk and interest rate contracts risk. See the Notes to Financial Statements for additional detail regarding these derivative instruments and their risks. The effect of such derivative instruments on the Portfolio’s financial position and financial performance as reflected in the Statement of Assets and Liabilities and Statement of Operations is presented in the summary below.
Fair values of derivative instruments as of December 31, 2021 as presented in the Statement of Assets and Liabilities:
| | | | | | | | | | | | |
| | | Asset Derivatives | | | Liability Derivatives | |
Derivatives not accounted for as
hedging instruments, carried at fair
value | | Statement of Assets and Liabilities Location | | Fair
Value | | | Statement of Assets and Liabilities Location | | Fair
Value | |
Credit contracts | | — | | $ | — | | | Premiums received for OTC swap agreements | | $ | 1,284 | |
Credit contracts | | Unaffiliated investments | | | 36,239 | | | Options written outstanding, at value | | | 109,666 | |
Credit contracts | | Unrealized appreciation on OTC swap agreements | | | 7,205 | | | — | | | — | |
Equity contracts | | Due from/to broker-variation margin futures | | | 32,828 | * | | — | | | — | |
SEE NOTES TO FINANCIAL STATEMENTS.
A76
| | | | | | |
| | |
| | PSF PGIM FLEXIBLE MANAGED PORTFOLIO (CONTINUED) | | |
| | | | | | |
| |
| SCHEDULE OF INVESTMENTS | | as of December 31, 2021 |
| | | | | | | | | | | | |
| | | Asset Derivatives | | | Liability Derivatives | |
Derivatives not accounted for as
hedging instruments, carried at fair
value | | Statement of Assets and Liabilities Location | | Fair Value | | | Statement of Assets and Liabilities Location | | Fair
Value | |
Foreign exchange contracts | | Unrealized appreciation on OTC forward foreign currency exchange contracts | | $ | 60,356 | | | Unrealized depreciation on OTC forward foreign currency exchange contracts | | $ | 255,594 | |
Interest rate contracts | | Due from/to broker-variation margin futures | | | 2,072,854 | * | | Due from/to broker-variation margin futures | | | 170,626 | * |
Interest rate contracts | | — | | | — | | | Due from/to broker-variation margin swaps | | | 3,036,456 | * |
Interest rate contracts | | Unrealized appreciation on OTC swap agreements | | | 55,129 | | | — | | | — | |
| | | | | | | | | | | | |
| | | | $ | 2,264,611 | | | | | $ | 3,573,626 | |
| | | | | | | | | | | | |
| * | Includes cumulative appreciation (depreciation) as reported in the schedule of open futures and centrally cleared swap contracts. Only unsettled variation margin receivable (payable) is reported within the Statement of Assets and Liabilities. |
The effects of derivative instruments on the Statement of Operations for the year ended December 31, 2021 are as follows:
| | | | | | | | | | | | | | | | | | | | |
Amount of Realized Gain (Loss) on Derivatives Recognized in Income | |
Derivatives not accounted for as hedging instruments, carried at fair value | | Options
Purchased(1) | | | Options
Written | | | Futures | | | Forward
Currency
Contracts | | | Swaps | |
Credit contracts | | $ | — | | | $ | — | | | $ | — | | | $ | — | | | $ | 35,875 | |
Equity contracts | | | — | | | | — | | | | 441,332 | | | | — | | | | — | |
Foreign exchange contracts | | | — | | | | — | | | | — | | | | 1,175,957 | | | | — | |
Interest rate contracts | | | 432,633 | | | | (190,329 | ) | | | (9,196,191 | ) | | | — | | | | 89,545 | |
| | | | | | | | | | | | | | | | | | | | |
Total | | $ | 432,633 | | | $ | (190,329 | ) | | $ | (8,754,859 | ) | | $ | 1,175,957 | | | $ | 125,420 | |
| | | | | | | | | | | | | | | | | | | | |
| (1) | Included in net realized gain (loss) on investment transactions in the Statement of Operations. |
| | | | | | | | | | | | | | | | | | | | |
Change in Unrealized Appreciation (Depreciation) on Derivatives Recognized in Income | |
Derivatives not accounted for as hedging instruments, carried at fair value | | Options
Purchased(2) | | | Options
Written | | | Futures | | | Forward
Currency
Exchange
Contracts | | | Swaps | |
Credit contracts | | $ | (47,484 | ) | | $ | (24,267 | ) | | $ | — | | | $ | — | | | $ | 16,316 | |
Equity contracts | | | — | | | | — | | | | (11,647 | ) | | | — | | | | — | |
Foreign exchange contracts | | | — | | | | — | | | | — | | | | 299,096 | | | | — | |
Interest rate contracts | | | — | | | | — | | | | 2,766,717 | | | | — | | | | (2,530,296 | ) |
| | | | | | | | | | | | | | | | | | | | |
Total | | $ | (47,484 | ) | | $ | (24,267 | ) | | $ | 2,755,070 | | | $ | 299,096 | | | $ | (2,513,980 | ) |
| | | | | | | | | | | | | | | | | | | | |
| (2) | Included in net change in unrealized appreciation (depreciation) on investments in the Statement of Operations. |
For the year ended December 31, 2021, the Portfolio’s average volume of derivative activities is as follows:
| | | | | | | | |
Options Purchased(1) | | Options Written(2) | | Futures Contracts— Long Positions(2) | | Futures Contracts— Short Positions(2) | | Forward Foreign Currency Exchange Contracts— Purchased(3) |
| $49,330 | | $28,394,800 | | $286,165,914 | | $30,764,717 | | $10,258,468 |
SEE NOTES TO FINANCIAL STATEMENTS.
A77
| | | | | | |
| | |
| | PSF PGIM FLEXIBLE MANAGED PORTFOLIO (CONTINUED) | | |
| | | | | | |
| |
| SCHEDULE OF INVESTMENTS | | as of December 31, 2021 |
| | | | |
Forward Foreign
Currency Exchange
Contracts—Sold(3) | | | | Interest Rate
Swap
Agreements(2) |
$32,733,305 | | | | $10,175,855 |
| | | | |
Credit Default
Swap Agreements—
Sell Protection(2) | | Total Return
Swap
Agreements(2) | | Inflation Swap
Agreements(2) |
$12,780,000 | | $10,157,259 | | $35,210,000 |
| (2) | Notional Amount in USD. |
| (3) | Value at Settlement Date. |
Average volume is based on average quarter end balances as noted for the year ended December 31, 2021.
Financial Instruments/Transactions—Summary of Offsetting and Netting Arrangements:
The Portfolio invested in OTC derivatives and entered into financial instruments/transactions during the reporting period that are either offset in accordance with current requirements or are subject to enforceable master netting arrangements or similar agreements that permit offsetting. The information about offsetting and related netting arrangements for OTC derivatives and financial instruments/transactions where the legal right to set-off exists is presented in the summary below.
Offsetting of financial instrument/transaction assets and liabilities:
| | | | | | | | | | | | |
Description | | Gross Market
Value of
Recognized
Assets/(Liabilities) | | | Collateral
Pledged/(Received)(2) | | | Net
Amount | |
| | | |
Securities on Loan | | $ | 43,941,144 | | | $ | (43,941,144 | ) | | $ | — | |
| | | | | | | | | | | | |
Offsetting of OTC derivative assets and liabilities:
| | | | | | | | | | | | | | | | | | | | |
Counterparty | | Gross Amounts of
Recognized
Assets(1) | | | Gross Amounts of
Recognized
Liabilities(1) | | | Net Amounts of
Recognized
Assets/(Liabilities) | | | Collateral
Pledged/(Received)(2) | | | Net Amount | |
| | | | | |
BNP Paribas S.A. | | $ | 7,555 | | | $ | (278,173 | ) | | $ | (270,618 | ) | | $ | — | | | $ | (270,618 | ) |
Goldman Sachs International | | | 7,205 | | | | (2,328 | ) | | | 4,877 | | | | — | | | | 4,877 | |
JP Morgan Chase Bank, N.A. | | | 55,129 | | | | — | | | | 55,129 | | | | — | | | | 55,129 | |
Morgan Stanley & Co. International PLC | | | 89,040 | | | | (86,043 | ) | | | 2,997 | | | | — | | | | 2,997 | |
| | | | | | | | | | | | | | | | | | | | |
| | $ | 158,929 | | | $ | (366,544 | ) | | $ | (207,615 | ) | | $ | — | | | $ | (207,615 | ) |
| | | | | | | | | | | | | | | | | | | | |
| (1) | Includes unrealized appreciation/(depreciation) on swaps and forwards, premiums paid/(received) on swap agreements and market value of purchased and written options, as represented on the Statement of Assets and Liabilities. |
| (2) | Collateral amount disclosed by the Portfolio is limited to the market value of financial instruments/transactions and the Portfolio’s OTC derivative exposure by counterparty. |
SEE NOTES TO FINANCIAL STATEMENTS.
A78
| | | | | | |
| | |
| | PGIM FLEXIBLE MANAGED PORTFOLIO (CONTINUED) | | |
STATEMENT OF ASSETS AND LIABILITIES
as of December 31, 2021
| | | | |
ASSETS | | | | |
Investments at value, including securities on loan of $43,941,144: | | | | |
Unaffiliated investments (cost $3,568,792,923) | | $ | 4,668,636,652 | |
Affiliated investments (cost $349,288,657) | | | 349,356,492 | |
Foreign currency, at value (cost $730,356) | | | 721,778 | |
Cash | | | 642,849 | |
Dividends and interest receivable | | | 8,793,601 | |
Receivable for investments sold | | | 6,596,182 | |
Due from broker-variation margin futures | | | 926,540 | |
Tax reclaim receivable | | | 408,801 | |
Unrealized appreciation on OTC swap agreements | | | 62,334 | |
Unrealized appreciation on OTC forward foreign currency exchange contracts | | | 60,356 | |
Receivable for Portfolio shares sold | | | 48,148 | |
Due from broker-variation margin swaps | | | 36,915 | |
Receivable from affiliate | | | 2,041 | |
Prepaid expenses and other assets | | | 540,936 | |
| | | | |
Total Assets | | | 5,036,833,625 | |
| | | | |
LIABILITIES | | | | |
Payable to broker for collateral for securities on loan | | | 45,444,721 | |
Payable for investments purchased | | | 17,955,033 | |
Management fee payable | | | 2,503,087 | |
Payable for Portfolio shares purchased | | | 458,992 | |
Unrealized depreciation on OTC forward foreign currency exchange contracts | | | 255,594 | |
Accrued expenses and other liabilities | | | 208,641 | |
Payable to affiliate | | | 116,438 | |
Options written outstanding, at value (premiums received $85,399) | | | 109,666 | |
Due to broker-variation margin futures | | | 4,645 | |
Trustees’ fees payable | | | 2,280 | |
Premiums received for OTC swap agreements | | | 1,284 | |
Affiliated transfer agent fee payable | | | 980 | |
Distribution fee payable | | | 393 | |
| | | | |
Total Liabilities | | | 67,061,754 | |
| | | | |
NET ASSETS | | $ | 4,969,771,871 | |
| | | | |
Net assets were comprised of: | | | | |
Partners’ Equity | | $ | 4,969,771,871 | |
| | | | |
Class I: | | | | |
Net asset value and redemption price per share, $4,967,763,725 / 112,550,776 outstanding shares of beneficial interest | | $ | 44.14 | |
| | | | |
Class III: | | | | |
Net asset value and redemption price per share, $2,008,146 / 45,575 outstanding shares of beneficial interest | | $ | 44.06 | |
| | | | |
STATEMENT OF OPERATIONS
Year Ended December 31, 2021
| | | | |
NET INVESTMENT INCOME (LOSS) | | | | |
INCOME | | | | |
Unaffiliated dividend income (net of $238,337 foreign withholding tax, of which $58,563 is reimbursable by an affiliate) | | $ | 50,714,887 | |
Interest income (net of $658 foreign withholding tax) | | | 34,610,901 | |
Affiliated dividend income | | | 398,720 | |
Income from securities lending, net (including affiliated income of $26,839) | | | 27,774 | |
| | | | |
Total income | | | 85,752,282 | |
| | | | |
EXPENSES | | | | |
Management fee | | | 28,599,867 | |
Distribution fee—Class III | | | 1,467 | |
Custodian and accounting fees | | | 359,962 | |
Trustees’ fees | | | 69,731 | |
Shareholders’ reports | | | 60,140 | |
Audit fee | | | 48,700 | |
Legal fees and expenses | | | 39,426 | |
Transfer agent’s fees and expenses (including affiliated expense of $5,882) | | | 10,682 | |
Miscellaneous | | | 102,069 | |
| | | | |
Total expenses | | | 29,292,044 | |
| | | | |
NET INVESTMENT INCOME (LOSS) | | | 56,460,238 | |
| | | | |
| REALIZED AND UNREALIZED GAIN (LOSS) ON INVESTMENT AND FOREIGN CURRENCY TRANSACTIONS | | | | |
Net realized gain (loss) on: | | | | |
Investment transactions (including affiliated of $(976)) | | | 531,484,481 | |
Futures transactions | | | (8,754,859 | ) |
Forward currency contract transactions | | | 1,175,957 | |
Options written transactions | | | (190,329 | ) |
Swap agreements transactions | | | 125,420 | |
Foreign currency transactions | | | 83,023 | |
| | | | |
| | | 523,923,693 | |
| | | | |
Net change in unrealized appreciation (depreciation) on: | | | | |
Investments (including affiliated of $(11,193)) | | | 176,651,756 | |
Futures | | | 2,755,070 | |
Forward currency contracts | | | 299,096 | |
Options written | | | (24,267 | ) |
Swap agreements | | | (2,513,980 | ) |
Foreign currencies | | | (52,797 | ) |
| | | | |
| | | 177,114,878 | |
| | | | |
NET GAIN (LOSS) ON INVESTMENT AND FOREIGN CURRENCY TRANSACTIONS | | | 701,038,571 | |
| | | | |
NET INCREASE (DECREASE) IN NET ASSETS RESULTING FROM OPERATIONS | | $ | 757,498,809 | |
| | | | |
STATEMENTS OF CHANGES IN NET ASSETS
| | | | | | | | |
| | | Year Ended
December 31, 2021 | | | Year Ended
December 31, 2020 | |
INCREASE (DECREASE) IN NET ASSETS | | | | | | | | |
OPERATIONS | | | | | | | | |
Net investment income (loss) | | $ | 56,460,238 | | | $ | 68,485,087 | |
Net realized gain (loss) on investment and foreign currency transactions | | | 523,923,693 | | | | 127,363,770 | |
Net change in unrealized appreciation (depreciation) on investments and foreign currencies | | | 177,114,878 | | | | 196,025,655 | |
| | | | | | | | |
NET INCREASE (DECREASE) IN NET ASSETS RESULTING FROM OPERATIONS | | | 757,498,809 | | | | 391,874,512 | |
| | | | | | | | |
PORTFOLIO SHARE TRANSACTIONS | | | | | | | | |
Portfolio shares sold | | | 10,264,950 | | | | 8,597,942 | |
Portfolio shares purchased | | | (277,076,354 | ) | | | (249,244,194 | ) |
| | | | | | | | |
NET INCREASE (DECREASE) IN NET ASSETS FROM PORTFOLIO SHARE TRANSACTIONS | | | (266,811,404 | ) | | | (240,646,252 | ) |
| | | | | | | | |
TOTAL INCREASE (DECREASE) | | | 490,687,405 | | | | 151,228,260 | |
NET ASSETS: | | | | | | | | |
Beginning of year | | | 4,479,084,466 | | | | 4,327,856,206 | |
| | | | | | | | |
End of year | | $ | 4,969,771,871 | | | $ | 4,479,084,466 | |
| | | | | | | | |
SEE NOTES TO FINANCIAL STATEMENTS.
A79
| | | | | | |
| | |
| | PSF PGIM GOVERNMENT INCOME PORTFOLIO | | |
| | | | | | |
| |
| SCHEDULE OF INVESTMENTS | | as of December 31, 2021 |
| | | | | | | | | | | | | | |
Interest
Rate | | Maturity Date | | | | | Principal Amount (000)# | | | Value | |
| | | | | | | | | | | | | | |
| LONG-TERM INVESTMENTS — 98.0% | |
| ASSET-BACKED SECURITIES — 11.5% | |
Collateralized Loan Obligations | | | | | |
AGL Core CLO Ltd. (Cayman Islands), | |
Series 2019-02A, Class A1, 144A, 3 Month LIBOR + 1.390% (Cap N/A, Floor 1.390%) | |
1.522%(c) | | 04/20/32 | | | | | | | 1,000 | | | $ | 1,001,055 | |
Bain Capital Credit CLO Ltd. (Cayman Islands), | |
Series 2019-02A, Class AR, 144A, 3 Month LIBOR + 1.100% (Cap N/A, Floor 1.100%) | |
1.222%(c) | | 10/17/32 | | | | | | | 500 | | | | 499,808 | |
Balboa Bay Loan Funding Ltd. (Cayman Islands), | |
Series 2021-01A, Class A, 144A, 3 Month LIBOR + 1.200% (Cap N/A, Floor 1.200%) | |
1.334%(c) | | 07/20/34 | | | | | | | 3,000 | | | | 3,003,796 | |
Battalion CLO Ltd., | |
Series 2020-15A, Class A1, 144A, 3 Month LIBOR + 1.350% (Cap N/A, Floor 1.350%) | |
1.472%(c) | | 01/17/33 | | | | | | | 2,500 | | | | 2,500,716 | |
Elevation CLO Ltd. (Cayman Islands), | |
Series 2017-07A, Class A, 144A, 3 Month LIBOR + 1.220% (Cap N/A, Floor 0.000%) | |
1.344%(c) | | 07/15/30 | | | | | | | 2,000 | | | | 2,001,143 | |
Jamestown CLO Ltd. (Cayman Islands), | |
Series 2019-14A, Class A1AR, 144A, 3 Month LIBOR + 1.200% (Cap N/A, Floor 1.200%) | |
1.332%(c) | | 10/20/34 | | | | | | | 500 | | | | 500,093 | |
Octagon Investment Partners 45 Ltd. (Cayman Islands), | |
Series 2019-01A, Class A, 144A, 3 Month LIBOR + 1.330% (Cap N/A, Floor 1.330%) | |
1.454%(c) | | 10/15/32 | | | | | | | 2,250 | | | | 2,250,309 | |
OZLM Ltd. (Cayman Islands), | |
Series 2015-11A, Class A1R, 144A, 3 Month LIBOR + 1.250% (Cap N/A, Floor 0.000%) | |
1.382%(c) | | 10/30/30 | | | | | | | 3,709 | | | | 3,712,210 | |
Regatta Funding Ltd. (Cayman Islands), | |
Series 2016-01A, Class A1R2, 144A, 3 Month LIBOR + 1.150% (Cap N/A, Floor 1.150%) | |
|
1.364%(c) | | 06/20/34 | | | | | | | 3,250 | | | | 3,248,201 | |
TCW CLO Ltd. (Cayman Islands), | |
Series 2017-01A, Class A1RR, 144A, 3 Month LIBOR + 1.180% (Cap N/A, Floor 1.180%) | |
1.312%(c) | | 10/29/34 | | | | | | | 500 | | | | 500,000 | |
Trimaran Cavu Ltd. (Cayman Islands), | |
Series 2019-01A, Class A1, 144A, 3 Month LIBOR + 1.460% (Cap N/A, Floor 1.460%) | |
1.592%(c) | | 07/20/32 | | | | | | | 2,500 | | | | 2,503,741 | |
Venture CLO Ltd. (Cayman Islands), | |
Series 2021-43A, Class A1, 144A, 3 Month LIBOR + 1.240% (Cap N/A, Floor 1.240%) | |
1.364%(c) | | 04/15/34 | | | | | | | 2,250 | | | | 2,246,658 | |
Wellfleet CLO Ltd. (Cayman Islands), | |
Series 2017-02A, Class A1R, 144A, 3 Month LIBOR + 1.060% (Cap N/A, Floor 0.000%) | |
1.192%(c) | | 10/20/29 | | | | | | | 1,250 | | | | 1,250,100 | |
| | | | | | | | | | | | | | |
Interest
Rate | | Maturity Date | | | | | Principal Amount (000)# | | | Value | |
| | | | | | | | | | | | | | |
|
| ASSET-BACKED SECURITIES (continued) | |
Collateralized Loan Obligations (cont’d.) | |
Wind River CLO Ltd. (Cayman Islands), | |
Series 2016-01KRA, Class A1R2, 144A, 3 Month LIBOR + 1.210% (Cap N/A, Floor 1.210%) | |
1.334%(c) | | 10/15/34 | | | | | | | 500 | | | $ | 500,001 | |
| | | | | | | | | | | | | | |
TOTAL ASSET-BACKED SECURITIES
(cost $25,330,797) | | | | 25,717,831 | |
| | | | | | | | | | | | | | |
|
| COMMERCIAL MORTGAGE-BACKED SECURITIES — 6.2% | |
Barclays Commercial Mortgage Trust, | |
Series 2019-C04, Class A4 | |
2.661% | | 08/15/52 | | | | | | | 3,000 | | | | 3,074,105 | |
CD Mortgage Trust, | |
Series 2019-CD08, Class A3 | |
2.657% | | 08/15/57 | | | | | | | 4,000 | | | | 4,059,028 | |
Fannie Mae-Aces, | |
Series 2012-M02, Class A2 | |
2.717% | | 02/25/22 | | | | | | | —(r | ) | | | 302 | |
Series 2018-M14, Class A1 | |
3.581%(cc) | | 08/25/28 | | | | | | | 14 | | | | 14,077 | |
FHLMC Multifamily Structured Pass-Through Certificates, | |
Series K019, Class X1, IO | |
1.581%(cc) | | 03/25/22 | | | | | | | 11,587 | | | | 116 | |
Series K020, Class X1, IO | |
1.333%(cc) | | 05/25/22 | | | | | | | 7,236 | | | | 13,986 | |
Series K021, Class X1, IO | |
1.376%(cc) | | 06/25/22 | | | | | | | 8,107 | | | | 6,342 | |
Series K025, Class X1, IO | |
0.778%(cc) | | 10/25/22 | | | | | | | 23,335 | | | | 114,600 | |
Series K079, Class AM | |
3.930% | | 06/25/28 | | | | | | | 675 | | | | 765,976 | |
Series K085, Class AM | |
4.060%(cc) | | 10/25/28 | | | | | | | 380 | | | | 433,552 | |
Series K088, Class AM | |
3.761%(cc) | | 01/25/29 | | | | | | | 520 | | | | 587,987 | |
Series K091, Class AM | |
3.566% | | 03/25/29 | | | | | | | 850 | | | | 958,015 | |
Series K151, Class A3 | |
3.511% | | 04/25/30 | | | | | | | 400 | | | | 446,538 | |
Series K152, Class A2 | |
3.080% | | 01/25/31 | | | | | | | 140 | | | | 152,986 | |
Series K157, Class A2 | |
3.990%(cc) | | 05/25/33 | | | | | | | 1,700 | | | | 1,978,810 | |
Series KC03, Class A2 | |
3.499% | | 01/25/26 | | | | | | | 650 | | | | 677,920 | |
Series W5FX, Class AFX | |
3.214%(cc) | | 04/25/28 | | | | | | | 580 | | | | 630,855 | |
| | | | | | | | | | | | | | |
TOTAL COMMERCIAL MORTGAGE-BACKED SECURITIES
(cost $13,138,657) | | | | 13,915,195 | |
| | | | | | | | | | | | | | |
|
| CORPORATE BOND — 0.4% | |
Diversified Financial Services | |
Private Export Funding Corp., | |
U.S. Gov’t. Gtd. Notes, Series PP | |
1.400% | | 07/15/28 | | | | | | | 885 | | | | 863,259 | |
| | | | | | | | | | | | | | |
(cost $882,965) | |
SEE NOTES TO FINANCIAL STATEMENTS.
A80
| | | | | | |
| | |
| | PSF PGIM GOVERNMENT INCOME PORTFOLIO (CONTINUED) | | |
| | | | | | |
| |
| SCHEDULE OF INVESTMENTS | | as of December 31, 2021 |
| | | | | | | | | | | | | | |
Interest
Rate | | Maturity Date | | | | | Principal Amount (000)# | | | Value | |
| | | | | | | | | | | | | | |
|
| RESIDENTIAL MORTGAGE-BACKED SECURITIES — 0.1% | |
Government National Mortgage Assoc., | |
Series 2015-143, Class WA | |
4.000% | | 10/20/45 | | | | | | | 241 | | | $ | 258,272 | |
Merrill Lynch Mortgage Investors Trust, | |
Series 2003-E, Class A1, 1 Month LIBOR + 0.620% (Cap 11.750%, Floor 0.620%) | |
0.722%(c) | | 10/25/28 | | | | | | | 9 | | | | 8,460 | |
Structured Adjustable Rate Mortgage Loan Trust, | |
Series 2004-01, Class 4A3 | |
2.431%(cc) | | 02/25/34 | | | | | | | 34 | | | | 34,654 | |
| | | | | | | | | | | | | | |
TOTAL RESIDENTIAL MORTGAGE-BACKED SECURITIES
(cost $295,211) | | | | 301,386 | |
| | | | | | | | | | | | | | |
|
| U.S. GOVERNMENT AGENCY OBLIGATIONS — 39.2% | |
Federal Home Loan Bank | |
3.250% | | 11/16/28 | | | | | | | 1,025 | | | | 1,144,060 | |
Federal Home Loan Mortgage Corp. | |
1.500% | | 11/01/50 | | | | | | | 464 | | | | 448,281 | |
2.000% | | 01/01/32 | | | | | | | 150 | | | | 154,426 | |
2.000% | | 12/01/50 | | | | | | | 1,965 | | | | 1,961,180 | |
2.000% | | 05/01/51 | | | | | | | 516 | | | | 514,749 | |
2.500% | | 03/01/30 | | | | | | | 274 | | | | 284,955 | |
2.500% | | 11/01/46 | | | | | | | 296 | | | | 303,628 | |
2.500% | | 04/01/51 | | | | | | | 2,958 | | | | 3,022,017 | |
3.000% | | 06/01/29 | | | | | | | 196 | | | | 206,771 | |
3.000% | | 01/01/37 | | | | | | | 336 | | | | 353,155 | |
3.000% | | 06/01/45 | | | | | | | 160 | | | | 167,543 | |
3.000% | | 01/01/48 | | | | | | | 261 | | | | 271,793 | |
3.000% | | 10/01/49 | | | | | | | 93 | | | | 96,836 | |
3.500% | | 12/01/32 | | | | | | | 309 | | | | 326,503 | |
3.500% | | 07/01/42 | | | | | | | 285 | | | | 308,076 | |
3.500% | | 10/01/42 | | | | | | | 493 | | | | 530,916 | |
3.500% | | 08/01/43 | | | | | | | 546 | | | | 587,572 | |
3.500% | | 09/01/45 | | | | | | | 192 | | | | 205,456 | |
3.500% | | 10/01/45 | | | | | | | 172 | | | | 184,115 | |
3.500% | | 02/01/47 | | | | | | | 207 | | | | 221,257 | |
3.500% | | 07/01/47 | | | | | | | 356 | | | | 379,108 | |
3.500% | | 03/01/48 | | | | | | | 453 | | | | 479,092 | |
4.000% | | 06/01/26 | | | | | | | 19 | | | | 20,098 | |
4.000% | | 09/01/26 | | | | | | | 77 | | | | 80,834 | |
4.000% | | 09/01/40 | | | | | | | 148 | | | | 162,074 | |
4.000% | | 12/01/40 | | | | | | | 165 | | | | 180,456 | |
4.000% | | 12/01/40 | | | | | | | 186 | | | | 204,368 | |
4.000% | | 11/01/43 | | | | | | | 347 | | | | 381,345 | |
4.000% | | 09/01/48 | | | | | | | 9 | | | | 10,043 | |
4.500% | | 09/01/39 | | | | | | | 625 | | | | 691,873 | |
4.500% | | 08/01/48 | | | | | | | 195 | | | | 209,056 | |
5.000% | | 06/01/33 | | | | | | | 161 | | | | 180,346 | |
5.000% | | 05/01/34 | | | | | | | 89 | | | | 98,932 | |
5.500% | | 05/01/37 | | | | | | | 29 | | | | 33,596 | |
5.500% | | 02/01/38 | | | | | | | 100 | | | | 115,021 | |
5.500% | | 05/01/38 | | | | | | | 43 | | | | 48,969 | |
6.000% | | 09/01/34 | | | | | | | 44 | | | | 48,126 | |
6.000% | | 01/01/37 | | | | | | | 52 | | | | 59,996 | |
6.000% | | 09/01/38 | | | | | | | 30 | | | | 34,414 | |
6.000% | | 08/01/39 | | | | | | | 37 | | | | 42,459 | |
6.250% | | 07/15/32 | | | | | | | 30 | | | | 43,181 | |
| | | | | | | | | | | | | | |
Interest
Rate | | Maturity Date | | | | | Principal Amount (000)# | | | Value | |
| | | | | | | | | | | | | | |
|
| U.S. GOVERNMENT AGENCY OBLIGATIONS (continued) | |
6.500% | | 09/01/32 | | | | | | | 17 | | | $ | 19,054 | |
Federal Home Loan Mortgage Corp., MTN | |
1.899%(s) | | 11/15/38 | | | | | | | 600 | | | | 409,404 | |
Federal National Mortgage Assoc. | |
0.875% | | 08/05/30 | | | | | | | 250 | | | | 235,657 | |
1.500% | | 11/01/50 | | | | | | | 1,430 | | | | 1,382,381 | |
1.500% | | 12/01/50 | | | | | | | 910 | | | | 879,913 | |
2.000% | | 08/01/31 | | | | | | | 153 | | | | 157,552 | |
2.000% | | 05/01/36 | | | | | | | 905 | | | | 928,059 | |
2.000% | | 06/01/40 | | | | | | | 373 | | | | 378,873 | |
2.000% | | 07/01/40 | | | | | | | 399 | | | | 404,425 | |
2.000% | | 02/01/41 | | | | | | | 1,776 | | | | 1,804,665 | |
2.000% | | 05/01/41 | | | | | | | 2,102 | | | | 2,136,185 | |
2.000% | | 09/01/50 | | | | | | | 1,525 | | | | 1,521,251 | |
2.000% | | 10/01/50 | | | | | | | 1,721 | | | | 1,717,654 | |
2.000% | | 12/01/50 | | | | | | | 437 | | | | 436,188 | |
2.000% | | 02/01/51 | | | | | | | 3,890 | | | | 3,881,079 | |
2.000% | | 05/01/51 | | | | | | | 507 | | | | 505,843 | |
2.500% | | 06/01/28 | | | | | | | 894 | | | | 929,983 | |
2.500% | | 05/01/41 | | | | | | | 1,999 | | | | 2,064,218 | |
2.500% | | 02/01/43 | | | | | | | 108 | | | | 111,348 | |
2.500% | | 12/01/46 | | | | | | | 372 | | | | 381,800 | |
2.500% | | 01/01/50 | | | | | | | 805 | | | | 822,515 | |
2.500% | | 03/01/50 | | | | | | | 240 | | | | 245,560 | |
2.500% | | 05/01/50 | | | | | | | 994 | | | | 1,014,747 | |
2.500% | | 08/01/50 | | | | | | | 2,389 | | | | 2,439,910 | |
2.500% | | 09/01/50 | | | | | | | 1,819 | | | | 1,860,168 | |
2.500% | | 10/01/50 | | | | | | | 2,727 | | | | 2,784,956 | |
2.500% | | 04/01/51 | | | | | | | 1,267 | | | | 1,293,406 | |
2.500% | | 04/01/51 | | | | | | | 1,799 | | | | 1,837,569 | |
3.000% | | TBA | | | | | | | 750 | | | | 776,972 | |
3.000% | | TBA | | | | | | | 1,000 | | | | 1,034,440 | |
3.000% | | 02/01/31 | | | | | | | 384 | | | | 402,240 | |
3.000% | | 11/01/36 | | | | | | | 270 | | | | 281,875 | |
3.000% | | 03/01/43 | | | | | | | 437 | | | | 461,238 | |
3.000% | | 07/01/43 | | | | | | | 519 | | | | 548,259 | |
3.000% | | 07/01/43 | | | | | | | 680 | | | | 717,533 | |
3.000% | | 09/01/46 | | | | | | | 374 | | | | 392,211 | |
3.000% | | 11/01/46 | | | | | | | 165 | | | | 173,090 | |
3.000% | | 11/01/46 | | | | | | | 221 | | | | 230,399 | |
3.000% | | 11/01/46 | | | | | | | 940 | | | | 986,015 | |
3.000% | | 12/01/47 | | | | | | | 504 | | | | 531,176 | |
3.000% | | 02/01/50 | | | | | | | 219 | | | | 227,120 | |
3.000% | | 06/01/50 | | | | | | | 377 | | | | 392,556 | |
3.500% | | 07/01/31 | | | | | | | 493 | | | | 522,618 | |
3.500% | | 02/01/33 | | | | | | | 78 | | | | 82,772 | |
3.500% | | 06/01/39 | | | | | | | 156 | | | | 167,868 | |
3.500% | | 04/01/42 | | | | | | | 249 | | | | 268,695 | |
3.500% | | 06/01/42 | | | | | | | 394 | | | | 423,837 | |
3.500% | | 07/01/42 | | | | | | | 205 | | | | 221,816 | |
3.500% | | 07/01/42 | | | | | | | 478 | | | | 516,301 | |
3.500% | | 06/01/45 | | | | | | | 647 | | | | 691,977 | |
3.500% | | 07/01/46 | | | | | | | 218 | | | | 232,219 | |
3.500% | | 12/01/46 | | | | | | | 190 | | | | 202,902 | |
3.500% | | 12/01/46 | | | | | | | 464 | | | | 500,859 | |
3.500% | | 11/01/48 | | | | | | | 360 | | | | 381,359 | |
4.000% | | 09/01/40 | | | | | | | 601 | | | | 660,117 | |
4.000% | | 06/01/42 | | | | | | | 383 | | | | 418,987 | |
SEE NOTES TO FINANCIAL STATEMENTS.
A81
| | | | | | |
| | |
| | PSF PGIM GOVERNMENT INCOME PORTFOLIO (CONTINUED) | | |
| | | | | | |
| |
| SCHEDULE OF INVESTMENTS | | as of December 31, 2021 |
| | | | | | | | | | | | | | |
Interest
Rate | | Maturity Date | | | | | Principal Amount (000)# | | | Value | |
| | | | | | | | | | | | | | |
|
| U.S. GOVERNMENT AGENCY OBLIGATIONS (continued) | |
4.000% | | 09/01/44 | | | | | | | 230 | | | $ | 250,973 | |
4.000% | | 09/01/44 | | | | | | | 430 | | | | 471,384 | |
4.000% | | 04/01/45 | | | | | | | 241 | | | | 262,971 | |
4.000% | | 07/01/45 | | | | | | | 187 | | | | 203,367 | |
4.000% | | 10/01/45 | | | | | | | 290 | | | | 315,141 | |
4.000% | | 10/01/46 | | | | | | | 89 | | | | 95,773 | |
4.000% | | 02/01/47 | | | | | | | 80 | | | | 85,583 | |
4.000% | | 06/01/47 | | | | | | | 140 | | | | 149,689 | |
4.000% | | 07/01/47 | | | | | | | 149 | | | | 159,270 | |
4.000% | | 10/01/47 | | | | | | | 476 | | | | 509,272 | |
4.000% | | 11/01/47 | | | | | | | 119 | | | | 127,698 | |
4.000% | | 11/01/47 | | | | | | | 173 | | | | 185,748 | |
4.500% | | 05/01/40 | | | | | | | 508 | | | | 553,731 | |
4.500% | | 04/01/42 | | | | | | | 344 | | | | 380,447 | |
5.000% | | 12/01/31 | | | | | | | 23 | | | | 24,744 | |
5.000% | | 03/01/34 | | | | | | | 187 | | | | 210,096 | |
5.000% | | 06/01/35 | | | | | | | 79 | | | | 89,613 | |
5.000% | | 07/01/35 | | | | | | | 38 | | | | 43,023 | |
5.000% | | 05/01/36 | | | | | | | 53 | | | | 59,487 | |
5.500% | | 02/01/34 | | | | | | | 117 | | | | 131,926 | |
5.500% | | 09/01/34 | | | | | | | 154 | | | | 174,711 | |
5.500% | | 02/01/35 | | | | | | | 149 | | | | 166,960 | |
5.500% | | 06/01/35 | | | | | | | 32 | | | | 35,309 | |
5.500% | | 06/01/35 | | | | | | | 69 | | | | 75,408 | |
5.500% | | 09/01/35 | | | | | | | 33 | | | | 36,214 | |
5.500% | | 09/01/35 | | | | | | | 90 | | | | 99,507 | |
5.500% | | 10/01/35 | | | | | | | 140 | | | | 157,714 | |
5.500% | | 11/01/35 | | | | | | | 43 | | | | 46,952 | |
5.500% | | 11/01/35 | | | | | | | 110 | | | | 121,852 | |
5.500% | | 11/01/35 | | | | | | | 272 | | | | 310,322 | |
6.000% | | 12/01/33 | | | | | | | 9 | | | | 10,133 | |
6.000% | | 02/01/34 | | | | | | | 67 | | | | 75,195 | |
6.000% | | 08/01/34 | | | | | | | —(r | ) | | | 226 | |
6.000% | | 11/01/34 | | | | | | | —(r | ) | | | 318 | |
6.000% | | 01/01/35 | | | | | | | 5 | | | | 5,768 | |
6.000% | | 01/01/36 | | | | | | | 55 | | | | 60,609 | |
6.000% | | 05/01/38 | | | | | | | 25 | | | | 28,972 | |
6.500% | | 07/01/32 | | | | | | | 120 | | | | 136,486 | |
6.500% | | 08/01/32 | | | | | | | 52 | | | | 57,527 | |
6.500% | | 10/01/32 | | | | | | | 146 | | | | 168,039 | |
6.500% | | 10/01/37 | | | | | | | 76 | | | | 88,257 | |
6.625% | | 11/15/30 | | | | | | | 435 | | | | 613,749 | |
7.000% | | 12/01/31 | | | | | | | 30 | | | | 32,618 | |
7.000% | | 01/01/36 | | | | | | | 13 | | | | 14,946 | |
8.000% | | 10/01/23 | | | | | | | —(r | ) | | | 35 | |
8.000% | | 09/01/24 | | | | | | | 1 | | | | 536 | |
8.000% | | 11/01/24 | | | | | | | 1 | | | | 654 | |
8.000% | | 01/01/26 | | | | | | | —(r | ) | | | 49 | |
9.000% | | 02/01/25 | | | | | | | 3 | | | | 3,519 | |
9.000% | | 04/01/25 | | | | | | | 1 | | | | 1,540 | |
Government National Mortgage Assoc. | |
2.500% | | TBA | | | | | | | 1,500 | | | | 1,536,092 | |
2.500% | | 12/20/46 | | | | | | | 112 | | | | 115,400 | |
2.500% | | 05/20/51 | | | | | | | 479 | | | | 490,914 | |
3.000% | | TBA | | | | | | | 2,000 | | | | 2,069,305 | |
3.000% | | 03/15/45 | | | | | | | 553 | | | | 576,796 | |
3.000% | | 07/20/46 | | | | | | | 464 | | | | 484,045 | |
3.000% | | 09/20/46 | | | | | | | 500 | | | | 521,922 | |
| | | | | | | | | | | | | | |
Interest
Rate | | Maturity Date | | | | | Principal Amount (000)# | | | Value | |
| | | | | | | | | | | | | | |
|
| U.S. GOVERNMENT AGENCY OBLIGATIONS (continued) | |
3.000% | | 10/20/46 | | | | | | | 125 | | | $ | 130,727 | |
3.000% | | 04/20/47 | | | | | | | 577 | | | | 601,855 | |
3.000% | | 12/20/48 | | | | | | | 389 | | | | 404,858 | |
3.000% | | 04/20/49 | | | | | | | 359 | | | | 372,622 | |
3.000% | | 07/20/49 | | | | | | | 96 | | | | 99,851 | |
3.000% | | 12/20/49 | | | | | | | 403 | | | | 417,335 | |
3.500% | | 01/20/43 | | | | | | | 524 | | | | 561,202 | |
3.500% | | 04/20/43 | | | | | | | 247 | | | | 264,267 | |
3.500% | | 03/20/45 | | | | | | | 323 | | | | 341,574 | |
3.500% | | 04/20/45 | | | | | | | 262 | | | | 276,773 | |
3.500% | | 04/20/46 | | | | | | | 441 | | | | 465,486 | |
3.500% | | 07/20/46 | | | | | | | 649 | | | | 683,070 | |
3.500% | | 07/20/48 | | | | | | | 543 | | | | 568,711 | |
3.500% | | 11/20/48 | | | | | | | 142 | | | | 148,190 | |
3.500% | | 01/20/49 | | | | | | | 258 | | | | 271,148 | |
3.500% | | 05/20/49 | | | | | | | 487 | | | | 508,099 | |
4.000% | | 06/15/40 | | | | | | | 78 | | | | 85,199 | |
4.000% | | 08/20/46 | | | | | | | 269 | | | | 286,485 | |
4.000% | | 11/20/46 | | | | | | | 164 | | | | 174,296 | |
4.000% | | 09/20/47 | | | | | | | 227 | | | | 241,572 | |
4.000% | | 06/20/48 | | | | | | | 348 | | | | 368,368 | |
4.000% | | 02/20/49 | | | | | | | 323 | | | | 341,229 | |
4.500% | | 02/20/41 | | | | | | | 239 | | | | 265,677 | |
4.500% | | 03/20/41 | | | | | | | 202 | | | | 222,898 | |
4.500% | | 06/20/44 | | | | | | | 156 | | | | 172,448 | |
4.500% | | 09/20/46 | | | | | | | 182 | | | | 201,007 | |
4.500% | | 11/20/46 | | | | | | | 349 | | | | 385,832 | |
4.500% | | 01/20/47 | | | | | | | 43 | | | | 46,453 | |
5.000% | | 07/15/33 | | | | | | | 79 | | | | 90,479 | |
5.000% | | 09/15/33 | | | | | | | 150 | | | | 172,959 | |
5.000% | | 04/15/34 | | | | | | | 71 | | | | 79,786 | |
5.000% | | 10/20/48 | | | | | | | 71 | | | | 75,656 | |
5.500% | | 03/15/34 | | | | | | | 143 | | | | 164,136 | |
5.500% | | 03/15/36 | | | | | | | 38 | | | | 43,544 | |
6.500% | | 07/15/32 | | | | | | | 11 | | | | 11,660 | |
6.500% | | 08/15/32 | | | | | | | 1 | | | | 1,595 | |
6.500% | | 08/15/32 | | | | | | | 3 | | | | 3,179 | |
6.500% | | 08/15/32 | | | | | | | 10 | | | | 11,200 | |
6.500% | | 08/15/32 | | | | | | | 51 | | | | 58,392 | |
7.000% | | 05/15/23 | | | | | | | 1 | | | | 511 | |
7.000% | | 06/15/23 | | | | | | | —(r | ) | | | 314 | |
7.000% | | 06/15/23 | | | | | | | 1 | | | | 1,335 | |
7.000% | | 06/15/23 | | | | | | | 1 | | | | 1,409 | |
7.000% | | 07/15/23 | | | | | | | —(r | ) | | | 106 | |
7.000% | | 07/15/23 | | | | | | | 5 | | | | 4,519 | |
7.000% | | 08/15/23 | | | | | | | —(r | ) | | | 459 | |
7.000% | | 08/15/23 | | | | | | | 1 | | | | 1,110 | |
7.000% | | 09/15/23 | | | | | | | 1 | | | | 515 | |
7.000% | | 10/15/23 | | | | | | | —(r | ) | | | 301 | |
7.000% | | 10/15/23 | | | | | | | 1 | | | | 1,037 | |
7.000% | | 11/15/23 | | | | | | | 1 | | | | 1,139 | |
7.000% | | 11/15/23 | | | | | | | 3 | | | | 2,827 | |
7.000% | | 01/15/24 | | | | | | | 6 | | | | 5,631 | |
7.000% | | 05/15/24 | | | | | | | 8 | | | | 8,494 | |
7.000% | | 08/15/28 | | | | | | | 23 | | | | 25,651 | |
7.500% | | 12/15/25 | | | | | | | 1 | | | | 1,288 | |
7.500% | | 12/15/25 | | | | | | | 18 | | | | 18,797 | |
7.500% | | 02/15/26 | | | | | | | 4 | | | | 3,523 | |
SEE NOTES TO FINANCIAL STATEMENTS.
A82
| | | | | | |
| | |
| | PSF PGIM GOVERNMENT INCOME PORTFOLIO (CONTINUED) | | |
| | | | | | |
| |
| SCHEDULE OF INVESTMENTS | | as of December 31, 2021 |
| | | | | | | | | | | | | | |
Interest
Rate | | Maturity Date | | | | | Principal Amount (000)# | | | Value | |
| | | | | | | | | | | | | | |
|
| U.S. GOVERNMENT AGENCY OBLIGATIONS (continued) | |
8.500% | | 09/15/24 | | | | | | | 20 | | | $ | 20,786 | |
8.500% | | 04/15/25 | | | | | | | 2 | | | | 2,192 | |
Israel Government, USAID Bond, U.S. Gov’t. Gtd. Notes | |
5.500% | | 09/18/33 | | | | | | | 300 | | | | 412,400 | |
Resolution Funding Corp. Interest Strips, Bonds | |
2.197%(s) | | 01/15/30 | | | | | | | 140 | | | | 121,223 | |
3.624%(s) | | 04/15/30 | | | | | | | 500 | | | | 429,828 | |
Resolution Funding Corp. Principal Strips, Bonds | |
1.875%(s) | | 01/15/30 | | | | | | | 285 | | | | 248,170 | |
3.143%(s) | | 04/15/30 | | | | | | | 2,305 | | | | 1,994,705 | |
Tennessee Valley Authority, Sr. Unsec’d. Notes | |
0.750% | | 05/15/25 | | | | | | | 325 | | | | 320,608 | |
1.500% | | 09/15/31 | | | | | | | 50 | | | | 48,960 | |
2.875% | | 02/01/27 | | | | | | | 175 | | | | 187,415 | |
5.880% | | 04/01/36 | | | | | | | 230 | | | | 336,071 | |
6.750% | | 11/01/25 | | | | | | | 510 | | | | 614,313 | |
7.125% | | 05/01/30 | | | | | | | 530 | | | | 753,415 | |
| | | | | | | | | | | | | | |
TOTAL U.S. GOVERNMENT AGENCY OBLIGATIONS
(cost $85,980,398) | | | | 87,645,895 | |
| | | | | | | | | | | | | | |
|
| U.S. TREASURY OBLIGATIONS — 40.6% | |
U.S. Treasury Bonds | |
1.375% | | 11/15/40 | | | | | | | 6,870 | | | | 6,255,994 | |
2.000% | | 11/15/41 | | | | | | | 550 | | | | 556,102 | |
2.000% | | 08/15/51 | | | | | | | 440 | | | | 449,212 | |
2.250% | | 05/15/41 | | | | | | | 20,045 | | | | 21,040,986 | |
2.500% | | 02/15/46 | | | | | | | 1,415 | | | | 1,564,017 | |
2.500% | | 05/15/46 | | | | | | | 1,005 | | | | 1,111,467 | |
2.875% | | 05/15/43(k) | | | | | | | 1,515 | | | | 1,761,187 | |
3.625% | | 08/15/43 | | | | | | | 125 | | | | 162,207 | |
3.750% | | 11/15/43 | | | | | | | 3,645 | | | | 4,822,791 | |
U.S. Treasury Notes | |
0.125% | | 06/30/23 | | | | | | | 2,960 | | | | 2,939,766 | |
0.750% | | 05/31/26 | | | | | | | 2,125 | | | | 2,082,168 | |
0.875% | | 11/15/30 | | | | | | | 2,195 | | | | 2,087,308 | |
1.250% | | 04/30/28 | | | | | | | 7,905 | | | | 7,835,831 | |
1.250% | | 09/30/28 | | | | | | | 3,745 | | | | 3,702,284 | |
1.375% | | 11/15/31 | | | | | | | 530 | | | | 523,375 | |
1.500% | | 11/30/28 | | | | | | | 1,095 | | | | 1,099,620 | |
2.625% | | 02/15/29 | | | | | | | 2,380 | | | | 2,573,375 | |
3.125% | | 11/15/28 | | | | | | | 8,120 | | | | 9,028,425 | |
U.S. Treasury Strips Coupon | |
0.807%(s) | | 11/15/29 | | | | | | | 15 | | | | 13,294 | |
1.225%(s) | | 02/15/41 | | | | | | | 130 | | | | 87,623 | |
1.417%(s) | | 02/15/38 | | | | | | | 525 | | | | 383,722 | |
1.450%(s) | | 08/15/42 | | | | | | | 60 | | | | 39,059 | |
1.463%(s) | | 11/15/42 | | | | | | | 155 | | | | 100,459 | |
1.488%(s) | | 11/15/41 | | | | | | | 730 | | | | 481,886 | |
1.775%(s) | | 02/15/40 | | | | | | | 535 | | | | 370,905 | |
1.982%(s) | | 08/15/39 | | | | | | | 2,120 | | | | 1,493,027 | |
1.990%(s) | | 02/15/39 | | | | | | | 2,900 | | | | 2,064,664 | |
2.010%(s) | | 08/15/30 | | | | | | | 1,060 | | | | 925,388 | |
2.056%(s) | | 11/15/38 | | | | | | | 220 | | | | 157,721 | |
2.169%(s) | | 05/15/39 | | | | | | | 990 | | | | 700,348 | |
2.172%(s) | | 02/15/28(k) | | | | | | | 550 | | | | 504,109 | |
2.330%(s) | | 08/15/41 | | | | | | | 2,240 | | | | 1,489,163 | |
2.353%(s) | | 02/15/44 | | | | | | | 780 | | | | 491,400 | |
| | | | | | | | | | | | | | |
Interest
Rate | | Maturity Date | | | | | Principal Amount (000)# | | | Value | |
| | | | | | | | | | | | | | |
|
| U.S. TREASURY OBLIGATIONS (continued) | |
2.361%(s) | | 05/15/41 | | | | | | | 1,945 | | | $ | 1,302,466 | |
2.365%(s) | | 05/15/44 | | | | | | | 2,790 | | | | 1,752,687 | |
2.370%(s) | | 05/15/29 | | | | | | | 510 | | | | 456,271 | |
2.415%(s) | | 11/15/40 | | | | | | | 525 | | | | 356,672 | |
2.416%(s) | | 05/15/42 | | | | | | | 80 | | | | 52,356 | |
2.434%(s) | | 11/15/45 | | | | | | | 345 | | | | 209,897 | |
2.436%(s) | | 02/15/46 | | | | | | | 390 | | | | 236,300 | |
2.443%(s) | | 08/15/44 | | | | | | | 210 | | | | 131,094 | |
2.452%(s) | | 08/15/43 | | | | | | | 1,145 | | | | 729,982 | |
2.486%(s) | | 02/15/45 | | | | | | | 200 | | | | 123,320 | |
2.506%(s) | | 11/15/43 | | | | | | | 4,315 | | | | 2,734,463 | |
2.857%(s) | | 05/15/31 | | | | | | | 500 | | | | 429,492 | |
3.176%(s) | | 08/15/40 | | | | | | | 800 | | | | 546,062 | |
3.979%(s) | | 02/15/42(k) | | | | | | | 3,945 | | | | 2,590,139 | |
| | | | | | | | | | | | | | |
TOTAL U.S. TREASURY OBLIGATIONS
(cost $88,291,885) | | | | 90,550,084 | |
| | | | | | | | | | | | | | |
TOTAL LONG-TERM INVESTMENTS
(cost $213,919,913) | | | | 218,993,650 | |
| | | | | | | | | | | | | | |
| | | | |
| | | | | | | | Shares | | | | |
|
| SHORT-TERM INVESTMENT — 3.6% | |
|
| AFFILIATED MUTUAL FUND | |
PGIM Core Ultra Short Bond Fund
(cost $7,919,849)(wa) | | | | 7,919,849 | | | | 7,919,849 | |
| | | | | | | | | | | | | | |
TOTAL INVESTMENTS—101.6%
(cost $221,839,762) | | | | 226,913,499 | |
Liabilities in excess of other assets(z) — (1.6)% | | | | (3,536,441 | ) |
| | | | | | | | | | | | | | |
| |
NET ASSETS — 100.0% | | | $ | 223,377,058 | |
| | | | | | | | | | | | | | |
See the Glossary for a list of the abbreviation(s) used in the annual report.
| # | Principal or notional amount is shown in U.S. dollars unless otherwise stated. |
| (c) | Variable rate instrument. The interest rate shown reflects the rate in effect at December 31, 2021. |
| (cc) | Variable rate instrument. The rate shown is based on the latest available information as of December 31, 2021. Certain variable rate securities are not based on a published reference rate and spread but are determined by the issuer or agent and are based on current market conditions. These securities do not indicate a reference rate and spread in their description. |
| (k) | Represents security, or a portion thereof, segregated as collateral for centrally cleared/exchange-traded derivatives. |
| (r) | Principal or notional amount is less than $500 par. |
| (s) | Represents zero coupon bond or principal only security. Rate represents yield to maturity at purchase date. |
| (wa) | PGIM Investments LLC, the manager of the Portfolio, also serves as manager of the PGIM Core Ultra Short Bond Fund and PGIM Institutional Money Market Fund, if applicable. |
| (z) | Includes net unrealized appreciation/(depreciation) and/or market value of the below holdings which are excluded from the Schedule of Investments: |
SEE NOTES TO FINANCIAL STATEMENTS.
A83
| | | | | | |
| | |
| | PSF PGIM GOVERNMENT INCOME PORTFOLIO (CONTINUED) | | |
| | | | | | |
| |
| SCHEDULE OF INVESTMENTS | | as of December 31, 2021 |
Futures contracts outstanding at December 31, 2021:
| | | | | | | | | | | | |
Number of Contracts | | Type | | Expiration
Date | | Current
Notional
Amount | | | Value /
Unrealized
Appreciation
(Depreciation) | |
| | | | | | | | | | | | |
| Long Positions: | |
127 | | 2 Year U.S. Treasury Notes | | Mar. 2022 | | $ | 27,707,828 | | | | $ (28,815 | ) |
312 | | 5 Year U.S. Treasury Notes | | Mar. 2022 | | | 37,744,687 | | | | 114,812 | |
429 | | 10 Year U.S. Treasury Notes | | Mar. 2022 | | | 55,971,094 | | | | 347,517 | |
38 | | 30 Year U.S. Ultra Treasury Bonds | | Mar. 2022 | | | 7,490,750 | | | | 79,197 | |
| | | | | | | | | | | | |
| | | | | | | | | | | 512,711 | |
| | | | | | | | | | | | |
| Short Positions: | |
238 | | 10 Year U.S. Ultra Treasury Notes | | Mar. 2022 | | | 34,852,125 | | | | (597,201 | ) |
370 | | 20 Year U.S. Treasury Bonds | | Mar. 2022 | | | 59,361,875 | | | | (256,627 | ) |
| | | | | | | | | | | | |
| | | | | | | | | | | (853,828 | ) |
| | | | | | | | | | | | |
| | | | | | | | | | $ | (341,117 | ) |
| | | | | | | | | | | | |
Inflation swap agreements outstanding at December 31, 2021:
| | | | | | | | | | | | | | | | | | | | | | |
Notional
Amount
(000)# | | | Termination
Date | | | Fixed
Rate | | Floating Rate | | Value at
Trade Date | | | Value at
December 31,
2021 | | | Unrealized
Appreciation
(Depreciation) | |
| | | | | | | | | | | | | | | | | | | | | | |
| | Centrally Cleared Inflation Swap Agreements: | |
| | 1,940 | | | | 01/13/26 | | | 2.152%(T) | | U.S. CPI Urban Consumers NSA Index(2)(T) | | $ | — | | | $ | (160,517 | ) | | $ | (160,517 | ) |
| | 5,820 | | | | 02/02/26 | | | 2.295%(T) | | U.S. CPI Urban Consumers NSA Index(2)(T) | | | (15,977 | ) | | | (437,133 | ) | | | (421,156 | ) |
| | 2,910 | | | | 02/18/26 | | | 2.370%(T) | | U.S. CPI Urban Consumers NSA Index(2)(T) | | | — | | | | (204,622 | ) | | | (204,622 | ) |
| | | | | | | | | | | | | | | | | | | | | | |
| | | | | | | | | | | | $ | (15,977 | ) | | $ | (802,272 | ) | | $ | (786,295 | ) |
| | | | | | | | | | | | | | | | | | | | | | |
| (1) | The Portfolio pays the fixed rate and receives the floating rate. |
| (2) | The Portfolio pays the floating rate and receives the fixed rate. |
Summary of Collateral for Centrally Cleared/Exchange-traded Derivatives:
Cash and securities segregated as collateral, including pending settlement for closed positions, to cover requirements for centrally cleared/exchange-traded derivatives are listed by broker as follows:
| | | | | | | | | | |
Broker | | Cash and/or Foreign Currency | | Securities Market Value |
Citigroup Global Markets, Inc. | | | $ | — | | | | $ | 1,826,894 | |
| | | | | | | | | | |
Fair Value Measurements:
Various inputs are used in determining the value of the Portfolio’s investments. These inputs are summarized in the three broad levels listed below.
Level 1—unadjusted quoted prices generally in active markets for identical securities.
Level 2—quoted prices for similar securities, interest rates and yield curves, prepayment speeds, foreign currency exchange rates and other observable inputs.
Level 3—unobservable inputs for securities valued in accordance with Board approved fair valuation procedures.
The following is a summary of the inputs used as of December 31, 2021 in valuing such portfolio securities:
| | | | | | | | | | | | |
| | | Level 1 | | | Level 2 | | | Level 3 | |
Investments in Securities | | | | | | | | | | | | |
Assets | | | | | | | | | | | | |
Long-Term Investments | | | | | | | | | | | | |
Asset-Backed Securities | | | | | | | | | | | | |
Collateralized Loan Obligations | | $ | — | | | $ | 25,717,831 | | | $ | — | |
Commercial Mortgage-Backed Securities | | | — | | | | 13,915,195 | | | | — | |
Corporate Bond | | | — | | | | 863,259 | | | | — | |
Residential Mortgage-Backed Securities | | | — | | | | 301,386 | | | | — | |
U.S. Government Agency Obligations | | | — | | | | 87,645,895 | | | | — | |
U.S. Treasury Obligations | | | — | | | | 90,550,084 | | | | — | |
SEE NOTES TO FINANCIAL STATEMENTS.
A84
| | | | | | |
| | |
| | PSF PGIM GOVERNMENT INCOME PORTFOLIO (CONTINUED) | | |
| | | | | | |
| |
| SCHEDULE OF INVESTMENTS | | as of December 31, 2021 |
| | | | | | | | | | | | |
| | | Level 1 | | | Level 2 | | | Level 3 | |
Investments in Securities (continued) | | | | | | | | | | | | |
Assets (continued) | | | | | | | | | | | | |
Short-Term Investment | | | | | | | | | | | | |
Affiliated Mutual Fund | | $ | 7,919,849 | | | $ | — | | | $ | — | |
| | | | | | | | | | | | |
Total | | $ | 7,919,849 | | | $ | 218,993,650 | | | $ | — | |
| | | | | | | | | | | | |
| | | |
Other Financial Instruments* | | | | | | | | | | | | |
Assets | | | | | | | | | | | | |
Futures Contracts | | $ | 541,526 | | | $ | — | | | $ | — | |
| | | | | | | | | | | | |
| | | |
Liabilities | | | | | | | | | | | | |
Futures Contracts | | $ | (882,643 | ) | | $ | — | | | $ | — | |
Centrally Cleared Inflation Swap Agreements | | | — | | | | (786,295 | ) | | | — | |
| | | | | | | | | | | | |
Total | | $ | (882,643 | ) | | $ | (786,295 | ) | | $ | — | |
| | | | | | | | | | | | |
| * | Other financial instruments are derivative instruments not reflected in the Schedule of Investments, such as futures, forwards and centrally cleared swap contracts, which are recorded at the unrealized appreciation (depreciation) on the instrument, and OTC swap contracts which are recorded at fair value. |
Industry Classification:
The industry classification of investments and liabilities in excess of other assets shown as a percentage of net assets as of December 31, 2021 were as follows (unaudited):
| | | | |
U.S. Treasury Obligations | | | 40.6 | % |
U.S. Government Agency Obligations | | | 39.2 | |
Collateralized Loan Obligations | | | 11.5 | |
Commercial Mortgage-Backed Securities | | | 6.2 | |
Affiliated Mutual Fund | | | 3.6 | |
Diversified Financial Services | | | 0.4 | |
| | | | |
Residential Mortgage-Backed Securities | | | 0.1 | % |
| | | | |
| | | 101.6 | |
Liabilities in excess of other assets | | | (1.6 | ) |
| | | | |
| | | 100.0 | % |
| | | | |
Effects of Derivative Instruments on the Financial Statements and Primary Underlying Risk Exposure:
The Portfolio invested in derivative instruments during the reporting period. The primary type of risk associated with these derivative instruments is interest rate contracts risk. See the Notes to Financial Statements for additional detail regarding these derivative instruments and their risks. The effect of such derivative instruments on the Portfolio’s financial position and financial performance as reflected in the Statement of Assets and Liabilities and Statement of Operations is presented in the summary below.
Fair values of derivative instruments as of December 31, 2021 as presented in the Statement of Assets and Liabilities:
| | | | | | | | | | | | |
| | | Asset Derivatives | | | Liability Derivatives | |
Derivatives not accounted for as hedging instruments, carried at fair value | | Statement of Assets and Liabilities Location | | Fair
Value | | | Statement of Assets and Liabilities Location | | Fair
Value | |
Interest rate contracts | | Due from/to broker-variation margin futures | | $ | 541,526 | * | | Due from/to broker-variation margin futures | | $ | 882,643 | * |
Interest rate contracts | | — | | | — | | | Due from/to broker-variation margin swaps | | | 786,295 | * |
| | | | | | | | | | | | |
| | | | $ | 541,526 | | | | | $ | 1,668,938 | |
| | | | | | | | | | | | |
| * | Includes cumulative appreciation (depreciation) as reported in the schedule of open futures and centrally cleared swap contracts. Only unsettled variation margin receivable (payable) is reported within the Statement of Assets and Liabilities. |
The effects of derivative instruments on the Statement of Operations for the year ended December 31, 2021 are as follows:
| | | | | | | | | | | | | | | | |
Amount of Realized Gain (Loss) on Derivatives Recognized in Income | |
Derivatives not accounted for as hedging instruments, carried at fair value | | Options
Purchased(1) | | | Options
Written | | | Futures | | | Swaps | |
Interest rate contracts | | $ | 110,866 | | | $ | (48,216 | ) | | $ | 697,800 | | | $ | 201,040 | |
| | | | | | | | | | | | | | | | |
SEE NOTES TO FINANCIAL STATEMENTS.
A85
| | | | | | |
| | |
| | PSF PGIM GOVERNMENT INCOME PORTFOLIO (CONTINUED) | | |
| | | | | | |
| |
| SCHEDULE OF INVESTMENTS | | as of December 31, 2021 |
| (1) | Included in net realized gain (loss) on investment transactions in the Statement of Operations. |
| | | | | | | | |
Change in Unrealized Appreciation (Depreciation) on Derivatives Recognized in Income | |
Derivatives not accounted for as hedging instruments, carried at fair value | | Futures | | | Swaps | |
Interest rate contracts | | $ | (684,347 | ) | | $ | (837,686 | ) |
| | | | | | | | |
For the year ended December 31, 2021, the Portfolio’s average volume of derivative activities is as follows:
| | | | | | | | | | |
| | | Options
Purchased(1) | | Options
Written(2) | | Futures
Contracts—
Long
Positions(2) | | Futures
Contracts—
Short
Positions(2) | | |
| | $8,427 | | $9,000 | | $101,029,276 | | $76,958,188 | | |
| | | | | | | | | | |
| | | Inflation Swap
Agreements(2) | | | | | | Interest Rate Swap Agreements(2) | | |
| | $9,118,000 | | | | | | $2,474,000 | | |
| (2) | Notional Amount in USD. |
Average volume is based on average quarter end balances as noted for the year ended December 31, 2021.
SEE NOTES TO FINANCIAL STATEMENTS.
A86
| | | | | | |
| | |
| | PSF PGIM GOVERNMENT INCOME PORTFOLIO (CONTINUED) | | |
STATEMENT OF ASSETS AND LIABILITIES
as of December 31, 2021
| | | | |
| ASSETS | | | | |
Investments at value: | | | | |
Unaffiliated investments (cost $213,919,913) | | $ | 218,993,650 | |
Affiliated investments (cost $7,919,849) | | | 7,919,849 | |
Receivable for investments sold | | | 5,226,992 | |
Interest receivable | | | 566,209 | |
Receivable for Portfolio shares sold | | | 36,025 | |
Due from broker-variation margin swaps | | | 9,182 | |
Prepaid expenses | | | 2,049 | |
| | | | |
Total Assets | | | 232,753,956 | |
| | | | |
| LIABILITIES | | | | |
Payable for investments purchased | | | 9,045,212 | |
Due to broker-variation margin futures | | | 159,447 | |
Accrued expenses and other liabilities | | | 90,534 | |
Management fee payable | | | 76,365 | |
Payable for Portfolio shares purchased | | | 3,898 | |
Affiliated transfer agent fee payable | | | 980 | |
Trustees’ fees payable | | | 400 | |
Distribution fee payable | | | 62 | |
| | | | |
Total Liabilities | | | 9,376,898 | |
| | | | |
NET ASSETS | | $ | 223,377,058 | |
| | | | |
Net assets were comprised of: | | | | |
Partners’ Equity | | $ | 223,377,058 | |
| | | | |
Class I: | | | | |
Net asset value and redemption price per share, $223,050,897 / 15,876,046 outstanding shares of beneficial interest | | $ | 14.05 | |
| | | | |
Class III: | | | | |
Net asset value and redemption price per share, $326,161 / 23,249 outstanding shares of beneficial interest | | $ | 14.03 | |
| | | | |
STATEMENT OF OPERATIONS
Year Ended December 31, 2021
| | | | |
| NET INVESTMENT INCOME (LOSS) | | | | |
INCOME | | | | |
Interest income | | $ | 4,214,925 | |
Affiliated dividend income | | | 15,877 | |
Income from securities lending, net (including affiliated income of $3,172) | | | 3,902 | |
| | | | |
Total income | | | 4,234,704 | |
| | | | |
| EXPENSES | | | | |
Management fee | | | 926,396 | |
Distribution fee—Class III | | | 261 | |
Custodian and accounting fees | | | 52,783 | |
Audit fee | | | 37,000 | |
Shareholders’ reports | | | 25,433 | |
Legal fees and expenses | | | 20,574 | |
Trustees’ fees | | | 12,429 | |
Transfer agent’s fees and expenses (including affiliated expense of $5,882) | | | 10,682 | |
Miscellaneous | | | 21,160 | |
| | | | |
Total expenses | | | 1,106,718 | |
| | | | |
NET INVESTMENT INCOME (LOSS) | | | 3,127,986 | |
| | | | |
| REALIZED AND UNREALIZED GAIN (LOSS) ON INVESTMENT TRANSACTIONS | | | | |
Net realized gain (loss) on: | | | | |
Investment transactions (including affiliated of $(2,349)) | | | 336,526 | |
Futures transactions | | | 697,800 | |
Options written transactions | | | (48,216 | ) |
Swap agreements transactions | | | 201,040 | |
| | | | |
| | | 1,187,150 | |
| | | | |
Net change in unrealized appreciation (depreciation)on: | |
Investments | | | (10,379,487 | ) |
Futures | | | (684,347 | ) |
Swap agreements | | | (837,686 | ) |
| | | | |
| | | (11,901,520 | ) |
| | | | |
NET GAIN (LOSS) ON INVESTMENT TRANSACTIONS | | | (10,714,370 | ) |
| | | | |
NET INCREASE (DECREASE) IN NET ASSETS RESULTING FROM OPERATIONS | | $ | (7,586,384 | ) |
| | | | |
STATEMENTS OF CHANGES IN NET ASSETS
| | | | | | | | |
| | | Year Ended
December 31, 2021 | | | Year Ended
December 31, 2020 | |
INCREASE (DECREASE) IN NET ASSETS | | | | | | | | |
OPERATIONS | | | | | | | | |
Net investment income (loss) | | $ | 3,127,986 | | | $ | 3,887,409 | |
Net realized gain (loss) on investment transactions | | | 1,187,150 | | | | (1,986,929 | ) |
Net change in unrealized appreciation (depreciation) on investments | | | (11,901,520 | ) | | | 14,795,126 | |
| | | | | | | | |
NET INCREASE (DECREASE) IN NET ASSETS RESULTING FROM OPERATIONS | | | (7,586,384 | ) | | | 16,695,606 | |
| | | | | | | | |
PORTFOLIO SHARE TRANSACTIONS | | | | | | | | |
Portfolio shares sold | | | 3,780,217 | | | | 15,481,186 | |
Portfolio shares purchased | | | (19,045,491 | ) | | | (24,541,321 | ) |
| | | | | | | | |
NET INCREASE (DECREASE) IN NET ASSETS FROM PORTFOLIO SHARE TRANSACTIONS | | | (15,265,274 | ) | | | (9,060,135 | ) |
| | | | | | | | |
TOTAL INCREASE (DECREASE) | | | (22,851,658 | ) | | | 7,635,471 | |
NET ASSETS: | | | | | | | | |
Beginning of year | | | 246,228,716 | | | | 238,593,245 | |
| | | | | | | | |
End of year | | $ | 223,377,058 | | | $ | 246,228,716 | |
| | | | | | | | |
SEE NOTES TO FINANCIAL STATEMENTS.
A87
| | | | | | |
| | |
| | PSF PGIM GOVERNMENT MONEY MARKET PORTFOLIO | | |
| | | | | | |
| |
| SCHEDULE OF INVESTMENTS | | as of December 31, 2021 |
| | | | | | | | | | | | |
Interest
Rate | | Maturity Date | | | | Principal Amount (000)# | | | Value | |
| | | | | | | | | | | | |
|
| REPURCHASE AGREEMENTS — 40.0% | |
Bank of America Securities, Inc., 0.050%, dated 12/31/21, due 01/03/22 in the amount of $63,569,265 collateralized by FHLMC (coupon rate 2.220%, maturity date 07/13/40) and FNMA (coupon rate 0.000%, maturity date 03/17/31), with the aggregate value, including accrued interest, of $64,840,906 | | | 63,569 | | | $ | 63,569,000 | |
Canadian Imperial Bank of Commerce 0.055%, dated 07/28/21, due 01/28/22 in the amount of $10,002,811 collateralized by FHLMC (coupon rate 3.000%, maturity dates 02/01/40-03/01/43), FNMA (coupon rates 2.000%-4.000%, maturity dates 01/01/35-10/01/51) and GNMA (coupon rates 3.000%-3.500%, maturity dates 07/20/47-12/20/51), with the aggregate value, including accrued interest, of $10,202,478 | | | 10,000 | | | | 10,000,000 | |
Canadian Imperial Bank of Commerce, 0.055%, dated 12/23/21, due 02/23/22 in the amount of $25,002,368 collateralized by FHLMC (coupon rate 3.000%, maturity date 02/01/40), FNMA (coupon rates 2.000%-4.000%, maturity dates 05/01/47-05/01/51) and GNMA (coupon rate 3.000%, maturity date 04/20/51), with the aggregate value, including accrued interest, of $25,500,429 | | | 25,000 | | | | 25,000,000 | |
Goldman Sachs & Co., 0.055%, dated 12/28/21, due 01/04/22 in the amount of $40,000,428 collateralized by FHLMC (coupon rates 2.000%-3.500%, maturity dates 02/01/36-10/01/51), FNMA (coupon rates 3.000%-5.500%, maturity dates 11/01/25-10/01/41) and GNMA (coupon rates 3.000%-5.500%, maturity dates 07/15/23-12/20/51), with the aggregate value, including accrued interest, of $40,800,000 | | | 40,000 | | | | 40,000,000 | |
ING Financial Markets LLC 0.065%, dated 11/24/21, due 02/17/22 in the amount of $20,003,069 collateralized by FHLMC (coupon rates 1.500%-4.500%, maturity dates 11/01/29-10/01/51) and FNMA (coupon rates 1.500%-5.000%, maturity dates 08/01/34-01/01/57), with the aggregate value, including accrued interest, of $20,400,000 | | | 20,000 | | | | 20,000,000 | |
| | | | | | | | | | | | |
Interest
Rate | | Maturity Date | | | | Principal Amount (000)# | | | Value | |
| | | | | | | | | | | | |
|
| REPURCHASE AGREEMENTS (continued) | |
RBC Dominion Securities, Inc., 0.055%, dated 12/06/21, due 01/05/22 in the amount of $5,000,229 collateralized by FHLMC (coupon rate 2.500%, maturity date 12/01/51), FNMA (coupon rate 4.500%, maturity date 07/01/48), GNMA (coupon rates 2.000%-4.000%, maturity dates 11/20/43-10/20/51) and U.S. Treasury Securities (coupon rates 0.125%-3.375%, maturity dates 05/31/22-02/15/50), with the aggregate value, including accrued interest, of $5,100,018 | | | 5,000 | | | $ | 5,000,000 | |
RBC Dominion Securities, Inc., 0.055%, dated 12/07/21, due 01/10/22 in the amount of $10,000,519 collateralized by FHLMC (coupon rate 2.500%, maturity date 12/01/51), FNMA (coupon rates 3.000%-5.000%, maturity dates 04/01/38-01/01/50), GNMA (coupon rates 2.000%-4.500%, maturity dates 08/15/39-06/20/51) and U.S. Treasury Securities (coupon rates 0.000%-6.500%, maturity dates 03/31/22-02/15/50), with the aggregate value, including accrued interest, of $10,200,023 | | | 10,000 | | | | 10,000,000 | |
RBC Dominion Securities, Inc., 0.050%, dated 12/31/21, due 01/03/22 in the amount of $66,000,275 collateralized by FHLMC (coupon rate 3.000%, maturity date 10/01/49), FNMA (coupon rates 3.500%- 5.000%, maturity dates 10/01/40-06/01/49), GNMA (coupon rates 3.000%-4.500%, maturity dates 09/15/40-06/20/51) and U.S. Treasury Securities (coupon rates 0.000%-6.250%, maturity dates 02/28/22-02/15/50), with the aggregate value, including accrued interest, of $67,320,000 | | | 66,000 | | | | 66,000,000 | |
Standard Chartered Bank, 0.050%, dated 12/31/21, due 01/03/22 in the amount of $75,000,313 collateralized by FHLMC (coupon rate 2.000%, maturity date 07/01/51), FNMA (coupon rate 2.000%, maturity date 07/01/51) and U.S. Treasury Securities (coupon rate 2.250%, maturity date 02/15/27), with the aggregate value, including accrued interest, of $76,500,418 | | | 75,000 | | | | 75,000,000 | |
SEE NOTES TO FINANCIAL STATEMENTS.
A88
| | | | | | |
| | |
| | PSF PGIM GOVERNMENT MONEY MARKET PORTFOLIO (CONTINUED) | | |
| | | | | | |
| |
| SCHEDULE OF INVESTMENTS | | as of December 31, 2021 |
| | | | | | | | | | | | | | |
Interest
Rate | | Maturity Date | | | | | Principal Amount (000)# | | | Value | |
| | | | | | | | | | | | | | |
|
| REPURCHASE AGREEMENTS (continued) | |
TD Securities LLC, 0.050%, dated 12/31/21, due 01/03/22 in the amount of $33,000,138 collateralized by U.S. Treasury Securities (coupon rates 2.000%-2.250%, maturity dates 04/15/22-11/15/26), with the aggregate value, including accrued interest, of $33,660,078 | | | | 33,000 | | | $ | 33,000,000 | |
| | | | | | | | | | | | | | |
TOTAL REPURCHASE AGREEMENTS
(amortized cost $347,569,000) | | | | 347,569,000 | |
| | | | | | | | | | | | | | |
|
| U.S. GOVERNMENT AGENCY OBLIGATIONS — 18.0% | |
Federal Farm Credit Bank | |
0.140% | | 04/08/22 | | | | | | | 2,385 | | | | 2,385,000 | |
0.375% | | 04/08/22 | | | | | | | 375 | | | | 375,249 | |
Federal Farm Credit Bank, 1 Month LIBOR + 0.240% (Cap N/A, Floor 0.000%) | |
0.344%(c) | | 01/18/22 | | | | | | | 8,000 | | | | 8,001,052 | |
Federal Farm Credit Bank, SOFR + 0.030% (Cap N/A, Floor 0.000%) | |
0.080%(c) | | 05/13/22 | | | | | | | 20,000 | | | | 19,999,632 | |
Federal Farm Credit Bank, SOFR + 0.040% (Cap N/A, Floor 0.000%) | |
0.090%(c) | | 07/08/22 | | | | | | | 6,000 | | | | 5,999,843 | |
Federal Farm Credit Bank, SOFR + 0.070% (Cap N/A, Floor 0.000%) | |
0.120%(c) | | 02/17/22 | | | | | | | 7,000 | | | | 7,000,000 | |
Federal Home Loan Bank | |
0.035% | | 02/01/22 | | | | | | | 9,000 | | | | 8,999,877 | |
0.050% | | 01/25/22 | | | | | | | 13,000 | | | | 12,999,978 | |
0.050% | | 01/28/22 | | | | | | | 9,000 | | | | 9,000,000 | |
0.050% | | 02/18/22 | | | | | | | 17,500 | | | | 17,499,954 | |
0.050% | | 02/23/22 | | | | | | | 14,000 | | | | 13,999,877 | |
0.060% | | 03/29/22 | | | | | | | 12,500 | | | | 12,499,618 | |
0.060%(n) | | 04/22/22 | | | | | | | 9,000 | | | | 8,998,335 | |
0.065%(n) | | 03/25/22 | | | | | | | 18,000 | | | | 17,997,302 | |
Federal Home Loan Bank, SOFR + 0.060% (Cap N/A, Floor 0.000%) | |
0.110%(c) | | 02/11/22 | | | | | | | 6,000 | | | | 6,000,000 | |
Federal Home Loan Mortgage Corp. | |
2.375% | | 01/13/22 | | | | | | | 450 | | | | 450,339 | |
Federal National Mortgage Assoc. | |
1.375% | | 09/06/22 | | | | | | | 965 | | | | 973,398 | |
Federal National Mortgage Assoc., SOFR + 0.220% (Cap N/A, Floor 0.000%) | |
0.270%(c) | | 05/09/22 | | | | | | | 3,000 | | | | 3,002,241 | |
| | | | | | | | | | | | | | |
TOTAL U.S. GOVERNMENT AGENCY OBLIGATIONS
(amortized cost $156,181,695) | | | | 156,181,695 | |
| | | | | | | | | | | | | | |
| | | | | | | | | | | | | | |
Interest
Rate | | Maturity Date | | | | | Principal Amount (000)# | | | Value | |
| | | | | | | | | | | | | | |
|
| U.S. TREASURY OBLIGATIONS(n) — 46.2% | |
U.S. Cash Management Bills | |
0.051% | | 03/22/22 | | | | | | | 18,000 | | | $ | 17,997,980 | |
0.090% | | 04/19/22 | | | | | | | 12,000 | | | | 11,996,760 | |
0.097% | | 04/26/22 | | | | | | | 34,000 | | | | 33,989,474 | |
U.S. Treasury Bills | |
0.047% | | 02/22/22 | | | | | | | 22,000 | | | | 21,998,496 | |
0.048% | | 01/20/22 | | | | | | | 12,000 | | | | 11,999,696 | |
0.050% | | 02/08/22 | | | | | | | 12,000 | | | | 11,999,367 | |
0.051% | | 01/27/22 | | | | | | | 15,000 | | | | 14,999,453 | |
0.052% | | 02/01/22 | | | | | | | 17,000 | | | | 16,999,313 | |
0.053% | | 01/18/22 | | | | | | | 9,000 | | | | 8,999,777 | |
0.053% | | 02/03/22 | | | | | | | 9,000 | | | | 8,999,567 | |
0.053% | | 02/10/22 | | | | | | | 11,000 | | | | 10,999,358 | |
0.055% | | 03/17/22 | | | | | | | 25,000 | | | | 24,997,123 | |
0.056% | | 01/06/22 | | | | | | | 22,000 | | | | 21,999,829 | |
0.056% | | 03/01/22 | | | | | | | 17,000 | | | | 16,998,532 | |
0.058% | | 01/11/22 | | | | | | | 22,000 | | | | 21,999,645 | |
0.061% | | 03/10/22 | | | | | | | 51,500 | | | | 51,494,093 | |
0.066% | | 01/04/22 | | | | | | | 13,000 | | | | 12,999,928 | |
0.067% | | 03/24/22 | | | | | | | 59,000 | | | | 58,991,057 | |
0.083% | | 03/31/22 | | | | | | | 15,000 | | | | 14,996,941 | |
0.084% | | 05/26/22 | | | | | | | 6,000 | | | | 5,997,964 | |
| | | | | | | | | | | | | | |
TOTAL U.S. TREASURY OBLIGATIONS
(amortized cost $401,454,353) | | | | 401,454,353 | |
| | | | | | | | | | | | | | |
TOTAL INVESTMENTS—104.2%
(amortized cost $905,205,048) | | | | 905,205,048 | |
Liabilities in excess of other assets — (4.2)% | | | | (36,367,394 | ) |
| | | | | | | | | | | | | | |
NET ASSETS — 100.0% | | | $ | 868,837,654 | |
| | | | | | | | | | | | | | |
See the Glossary for a list of the abbreviation(s) used in the annual report.
| # | Principal amount is shown in U.S. dollars unless otherwise stated. |
| (c) | Variable rate instrument. The interest rate shown reflects the rate in effect at December 31, 2021. |
| (n) | Rate shown reflects yield to maturity at purchased date. |
Fair Value Measurements:
Various inputs are used in determining the value of the Portfolio’s investments. These inputs are summarized in the three broad levels listed below.
Level 1—unadjusted quoted prices generally in active markets for identical securities.
Level 2—quoted prices for similar securities, interest rates and yield curves, prepayment speeds, foreign currency exchange rates and other observable inputs.
Level 3—unobservable inputs for securities valued in accordance with Board approved fair valuation procedures.
SEE NOTES TO FINANCIAL STATEMENTS.
A89
| | | | | | |
| | |
| | PSF PGIM GOVERNMENT MONEY MARKET PORTFOLIO (CONTINUED) | | |
| | | | | | |
| |
| SCHEDULE OF INVESTMENTS | | as of December 31, 2021 |
The following is a summary of the inputs used as of December 31, 2021 in valuing such portfolio securities:
| | | | | | | | | | | | |
| | | Level 1 | | | Level 2 | | | Level 3 | |
Investments in Securities | | | | | | | | | | | | |
Assets | | | | | | | | | | | | |
Short-Term Investments | | | | | | | | | | | | |
Repurchase Agreements | | | $— | | | $ | 347,569,000 | | | | $— | |
U.S. Government Agency Obligations | | | — | | | | 156,181,695 | | | | — | |
U.S. Treasury Obligations | | | — | | | | 401,454,353 | | | | — | |
| | | | | | | | | | | | |
Total | | | $— | | | $ | 905,205,048 | | | | $— | |
| | | | | | | | | | | | |
Industry Classification:
The industry classification of investments and liabilities in excess of other assets shown as a percentage of net assets as of December 31, 2021 were as follows (unaudited):
| | | | |
U.S. Treasury Obligations | | | 46.2 | % |
Repurchase Agreements | | | 40.0 | |
U.S. Government Agency Obligations | | | 18.0 | |
| | | | |
| | | 104.2 | |
Liabilities in excess of other assets | | | (4.2 | ) |
| | | | |
| | | 100.0 | % |
| | | | |
Financial Instruments/Transactions—Summary of Offsetting and Netting Arrangements:
The Portfolio entered into financial instruments/transactions during the reporting period that are either offset in accordance with current requirements or are subject to enforceable master netting arrangements or similar agreements that permit offsetting. The information about offsetting and related netting arrangements for financial instruments/transactions where the legal right to set-off exists is presented in the summary below.
Offsetting of financial instrument/transaction assets and liabilities:
| | | | | | | | | | | | | | | | | |
Description | | Counterparty | | Gross Market Value of
Recognized
Assets/(Liabilities) | | Collateral
Pledged/(Received)(1) | | Net
Amount |
Repurchase Agreements | | Bank of America Securities, Inc. | | | $ | 63,569,000 | | | | $ | (63,569,000 | ) | | | $ | — | |
Repurchase Agreements | | Canadian Imperial Bank of Commerce | | | | 35,000,000 | | | | | (35,000,000 | ) | | | | — | |
Repurchase Agreements | | Goldman Sachs & Co. | | | | 40,000,000 | | | | | (40,000,000 | ) | | | | — | |
Repurchase Agreements | | ING Financial Markets LLC | | | | 20,000,000 | | | | | (20,000,000 | ) | | | | — | |
Repurchase Agreements | | RBC Dominion Securities, Inc. | | | | 81,000,000 | | | | | (81,000,000 | ) | | | | — | |
Repurchase Agreements | | Standard Chartered Bank | | | | 75,000,000 | | | | | (75,000,000 | ) | | | | — | |
Repurchase Agreements | | TD Securities LLC | | | | 33,000,000 | | | | | (33,000,000 | ) | | | | — | |
| | | | | | | | | | | | | | | | | |
| | | | | $ | 347,569,000 | | | | | | | | | | | |
| | | | | | | | | | | | | | | | | |
| (1) | Collateral amount disclosed by the Portfolio is limited to the market value of financial instruments/transactions. |
SEE NOTES TO FINANCIAL STATEMENTS.
A90
| | | | | | |
| | |
| | PSF PGIM GOVERNMENT MONEY MARKET PORTFOLIO (CONTINUED) | | |
STATEMENT OF ASSETS AND LIABILITIES
as of December 31, 2021
| | | | |
ASSETS | | | | |
Investments, at amortized cost which approximates fair value: | | $ | 557,636,048 | |
Repurchase Agreements (amortized cost $347,569,000) | | | 347,569,000 | |
Cash | | | 125 | |
Receivable for Portfolio shares sold | | | 2,244,862 | |
Interest receivable | | | 36,940 | |
Prepaid expenses | | | 6,379 | |
| | | | |
Total Assets | | | 907,493,354 | |
| | | | |
LIABILITIES | | | | |
Payable for investments purchased | | | 33,997,845 | |
Payable for Portfolio shares purchased | | | 4,540,828 | |
Accrued expenses and other liabilities | | | 69,264 | |
Management fee payable | | | 46,094 | |
Affiliated transfer agent fee payable | | | 980 | |
Trustees’ fees payable | | | 689 | |
| | | | |
Total Liabilities | | | 38,655,700 | |
| | | | |
NET ASSETS | | $ | 868,837,654 | |
| | | | |
Net assets were comprised of: | | | | |
Partners’ Equity | | $ | 868,837,654 | |
| | | | |
Class I: | | | | |
Net asset value and redemption price per share, $724,844,177 / 72,481,499 outstanding shares of beneficial interest | | $ | 10.00 | |
| | | | |
Class III: | | | | |
Net asset value and redemption price per share, $143,993,477 / 14,399,507 outstanding shares of beneficial interest | | $ | 10.00 | |
| | | | |
STATEMENT OF OPERATIONS
Year Ended December 31, 2021
| | | | |
NET INVESTMENT INCOME (LOSS) | | | | |
Interest income | | $ | 523,069 | |
| | | | |
EXPENSES | | | | |
Management fee | | | 2,598,650 | |
Distribution fee—Class III | | | 295,205 | |
Custodian and accounting fees | | | 81,876 | |
Shareholders’ reports | | | 29,824 | |
Audit fee | | | 26,800 | |
Legal fees and expenses | | | 23,765 | |
Trustees’ fees | | | 20,599 | |
Transfer agent’s fees and expenses (including affiliated expense of $5,882) | | | 10,682 | |
Miscellaneous | | | 20,213 | |
| | | | |
Total expenses | | | 3,107,614 | |
Less: Fee waivers and/or expense reimbursement | | | (2,289,340 | ) |
Less: Distribution fee waiver—Class III | | | (295,205 | ) |
| | | | |
Net expenses | | | 523,069 | |
| | | | |
NET INVESTMENT INCOME (LOSS) | | | — | |
| | | | |
| REALIZED AND UNREALIZED GAIN (LOSS) ON INVESTMENT TRANSACTIONS | | | | |
Net realized gain (loss) on investment transactions | | | 381,775 | |
| | | | |
NET INCREASE (DECREASE) IN NET ASSETS RESULTING FROM OPERATIONS | | $ | 381,775 | |
| | | | |
STATEMENTS OF CHANGES IN NET ASSETS
| | | | | | | | |
| | | Year Ended
December 31, 2021 | | | Year Ended
December 31, 2020 | |
INCREASE (DECREASE) IN NET ASSETS | | | | | | | | |
OPERATIONS | | | | | | | | |
Net investment income (loss) | | $ | — | | | $ | 1,764,735 | |
Net realized gain (loss) on investment transactions | | | 381,775 | | | | 27,206 | |
| | | | | | | | |
NET INCREASE (DECREASE) IN NET ASSETS RESULTING FROM OPERATIONS | | | 381,775 | | | | 1,791,941 | |
| | | | | | | | |
DISTRIBUTIONS | | | | | | | | |
Class I | | | (331,630 | ) | | | (1,791,854 | ) |
Class III | | | (50,145 | ) | | | (87 | ) |
| | | | | | | | |
| | | (381,775 | ) | | | (1,791,941 | ) |
| | | | | | | | |
PORTFOLIO SHARE TRANSACTIONS | | | | | | | | |
Portfolio shares sold | | | 1,118,916,318 | | | | 850,786,598 | |
Portfolio shares issued in reinvestment of distributions | | | 381,775 | | | | 1,791,941 | |
Portfolio shares purchased | | | (1,108,241,533 | ) | | | (594,349,211 | ) |
| | | | | | | | |
NET INCREASE (DECREASE) IN NET ASSETS FROM PORTFOLIO SHARE TRANSACTIONS | | | 11,056,560 | | | | 258,229,328 | |
| | | | | | | | |
TOTAL INCREASE (DECREASE) | | | 11,056,560 | | | | 258,229,328 | |
NET ASSETS: | | | | | | | | |
Beginning of year | | | 857,781,094 | | | | 599,551,766 | |
| | | | | | | | |
End of year | | $ | 868,837,654 | | | $ | 857,781,094 | |
| | | | | | | | |
SEE NOTES TO FINANCIAL STATEMENTS.
A91
| | | | | | |
| | |
| | PSF PGIM JENNISON BLEND PORTFOLIO | | |
| | | | | | |
| |
| SCHEDULE OF INVESTMENTS | | as of December 31, 2021 |
| | | | | | | | |
| | | Shares | | | Value | |
|
| LONG-TERM INVESTMENTS — 98.5% | |
| | |
| COMMON STOCKS | | | | | | | | |
Aerospace & Defense — 1.5% | | | | | | | | |
Airbus SE (France)* | | | 377,282 | | | $ | 48,325,778 | |
Raytheon Technologies Corp. | | | 555,791 | | | | 47,831,374 | |
| | | | | | | | |
| | |
| | | | | | | 96,157,152 | |
| | | | | | | | |
Air Freight & Logistics — 0.5% | |
FedEx Corp. | | | 124,863 | | | | 32,294,566 | |
| | | | | | | | |
Airlines — 0.6% | | | | | | | | |
Delta Air Lines, Inc.* | | | 889,049 | | | | 34,744,035 | |
| | | | | | | | |
Automobiles — 5.4% | | | | | | | | |
General Motors Co.* | | | 1,090,124 | | | | 63,913,970 | |
Tesla, Inc.* | | | 265,818 | | | | 280,911,146 | |
| | | | | | | | |
| | |
| | | | | | | 344,825,116 | |
| | | | | | | | |
Banks — 5.7% | | | | | | | | |
Bank of America Corp. | | | 1,916,922 | | | | 85,283,860 | |
Citigroup, Inc. | | | 770,439 | | | | 46,526,811 | |
JPMorgan Chase & Co. | | | 648,306 | | | | 102,659,255 | |
PNC Financial Services Group, Inc. (The) | | | 327,348 | | | | 65,639,821 | |
Truist Financial Corp. | | | 1,092,659 | | | | 63,975,184 | |
| | | | | | | | |
| | |
| | | | | | | 364,084,931 | |
| | | | | | | | |
Beverages — 0.7% | | | | | | | | |
PepsiCo, Inc. | | | 246,730 | | | | 42,859,468 | |
| | | | | | | | |
Biotechnology — 0.4% | | | | | | | | |
BioNTech SE (Germany), ADR*(a) | | | 105,488 | | | | 27,194,806 | |
| | | | | | | | |
Building Products — 1.4% | |
Johnson Controls International PLC | | | 1,097,751 | | | | 89,258,134 | |
| | | | | | | | |
Capital Markets — 2.3% | | | | | | | | |
Blackstone, Inc. | | | 442,855 | | | | 57,301,008 | |
Goldman Sachs Group, Inc. (The) | | | 239,754 | | | | 91,717,893 | |
| | | | | | | | |
| | |
| | | | | | | 149,018,901 | |
| | | | | | | | |
Chemicals — 1.5% | | | | | | | | |
Linde PLC (United Kingdom) | | | 279,016 | | | | 96,659,513 | |
| | | | | | | | |
Communications Equipment — 0.7% | |
Cisco Systems, Inc. | | | 692,428 | | | | 43,879,162 | |
| | | | | | | | |
Consumer Finance — 1.4% | | | | | | | | |
Capital One Financial Corp. | | | 359,878 | | | | 52,214,699 | |
SLM Corp.(a) | | | 1,809,677 | | | | 35,596,347 | |
| | | | | | | | |
| | |
| | | | | | | 87,811,046 | |
| | | | | | | | |
Containers & Packaging — 0.9% | |
Crown Holdings, Inc. | | | 519,634 | | | | 57,481,913 | |
| | | | | | | | |
Entertainment — 3.4% | | | | | | | | |
Netflix, Inc.* | | | 172,414 | | | | 103,869,090 | |
ROBLOX Corp. (Class A Stock)* | | | 168,626 | | | | 17,395,458 | |
Sea Ltd. (Taiwan), ADR* | | | 97,020 | | | | 21,704,344 | |
Spotify Technology SA* | | | 141,933 | | | | 33,216,580 | |
Walt Disney Co. (The)* | | | 275,798 | | | | 42,718,353 | |
| | | | | | | | |
| | |
| | | | | | | 218,903,825 | |
| | | | | | | | |
Food & Staples Retailing — 1.7% | | | | | | | | |
Costco Wholesale Corp. | | | 84,208 | | | | 47,804,882 | |
| | | | | | | | |
| | | Shares | | | Value | |
|
| COMMON STOCKS (continued) | |
Food & Staples Retailing (cont’d.) | |
Walmart, Inc. | | | 428,409 | | | $ | 61,986,498 | |
| | | | | | | | |
| | |
| | | | | | | 109,791,380 | |
| | | | | | | | |
Food Products — 0.9% | | | | | | | | |
Mondelez International, Inc. (Class A Stock) | | | 824,252 | | | | 54,656,150 | |
| | | | | | | | |
Health Care Equipment & Supplies — 1.3% | |
Abbott Laboratories | | | 592,655 | | | | 83,410,265 | |
| | | | | | | | |
Health Care Providers & Services — 1.4% | |
Cigna Corp. | | | 145,822 | | | | 33,485,106 | |
Laboratory Corp. of America Holdings* | | | 183,036 | | | | 57,511,741 | |
| | | | | | | | |
| | |
| | | | | | | 90,996,847 | |
| | | | | | | | |
Hotels, Restaurants & Leisure — 2.2% | |
Airbnb, Inc. (Class A Stock)* | | | 268,428 | | | | 44,690,578 | |
Chipotle Mexican Grill, Inc.* | | | 11,361 | | | | 19,861,868 | |
McDonald’s Corp. | | | 152,795 | | | | 40,959,756 | |
Royal Caribbean Cruises Ltd.*(a) | | | 460,855 | | | | 35,439,749 | |
| | | | | | | | |
| | |
| | | | | | | 140,951,951 | |
| | | | | | | | |
Household Durables — 0.6% | | | | | | | | |
D.R. Horton, Inc. | | | 356,928 | | | | 38,708,842 | |
| | | | | | | | |
Household Products — 0.6% | | | | | | | | |
Procter & Gamble Co. (The) | | | 239,033 | | | | 39,101,018 | |
| | | | | | | | |
Insurance — 2.6% | | | | | | | | |
Chubb Ltd. | | | 362,217 | | | | 70,020,168 | |
Marsh & McLennan Cos., Inc. | | | 294,913 | | | | 51,261,778 | |
MetLife, Inc. | | | 754,489 | | | | 47,148,017 | |
| | | | | | | | |
| | |
| | | | | | | 168,429,963 | |
| | | | | | | | |
Interactive Media & Services — 7.6% | |
Alphabet, Inc. (Class A Stock)* | | | 72,779 | | | | 210,843,674 | |
Alphabet, Inc. (Class C Stock)* | | | 36,305 | | | | 105,051,785 | |
Match Group, Inc.* | | | 372,568 | | | | 49,272,118 | |
Meta Platforms, Inc. (Class A Stock)* | | | 196,172 | | | | 65,982,452 | |
Snap, Inc. (Class A Stock)* | | | 1,107,114 | | | | 52,067,572 | |
| | | | | | | | |
| | |
| | | | | | | 483,217,601 | |
| | | | | | | | |
Internet & Direct Marketing Retail — 4.5% | |
Amazon.com, Inc.* | | | 64,540 | | | | 215,198,304 | |
MercadoLibre, Inc. (Argentina)* | | | 52,723 | | | | 71,091,693 | |
| | | | | | | | |
| | |
| | | | | | | 286,289,997 | |
| | | | | | | | |
IT Services — 8.3% | | | | | | | | |
Adyen NV (Netherlands), 144A* | | | 33,648 | | | | 88,473,409 | |
Affirm Holdings, Inc.* | | | 274,375 | | | | 27,591,150 | |
Block, Inc.* | | | 265,228 | | | | 42,836,974 | |
Mastercard, Inc. (Class A Stock) | | | 149,624 | | | | 53,762,896 | |
Okta, Inc.* | | | 130,067 | | | | 29,157,119 | |
PayPal Holdings, Inc.* | | | 202,411 | | | | 38,170,666 | |
Shopify, Inc. (Canada) (Class A Stock)* | | | 103,819 | | | | 142,999,253 | |
Snowflake, Inc. (Class A Stock)* | | | 123,517 | | | | 41,841,384 | |
Visa, Inc. (Class A Stock)(a) | | | 303,687 | | | | 65,812,010 | |
| | | | | | | | |
| | |
| | | | | | | 530,644,861 | |
| | | | | | | | |
Life Sciences Tools & Services — 1.0% | |
Danaher Corp. | | | 160,368 | | | | 52,762,676 | |
SEE NOTES TO FINANCIAL STATEMENTS.
A92
| | | | | | |
| | |
| | PSF PGIM JENNISON BLEND PORTFOLIO (CONTINUED) | | |
| | | | | | |
| |
| SCHEDULE OF INVESTMENTS | | as of December 31, 2021 |
| | | | | | | | |
| | | Shares | | | Value | |
|
| COMMON STOCKS (continued) | |
Life Sciences Tools & Services (cont’d.) | |
Sartorius Stedim Biotech (France) | | | 19,998 | | | $ | 10,983,208 | |
| | | | | | | | |
| | |
| | | | | | | 63,745,884 | |
| | | | | | | | |
Machinery — 1.3% | | | | | | | | |
Fortive Corp. | | | 478,194 | | | | 36,481,420 | |
Otis Worldwide Corp. | | | 500,961 | | | | 43,618,674 | |
| | | | | | | | |
| | |
| | | | | | | 80,100,094 | |
| | | | | | | | |
Multi-Utilities — 1.5% | | | | | | | | |
Dominion Energy, Inc. | | | 1,242,346 | | | | 97,598,702 | |
| | | | | | | | |
Oil, Gas & Consumable Fuels — 3.0% | |
ConocoPhillips | | | 2,686,941 | | | | 193,943,401 | |
| | | | | | | | |
Personal Products — 1.2% | | | | | | | | |
Estee Lauder Cos., Inc. (The) (Class A Stock) | | | 198,360 | | | | 73,432,872 | |
| | | | | | | | |
Pharmaceuticals — 4.0% | |
AstraZeneca PLC (United Kingdom), ADR | | | 1,257,634 | | | | 73,257,180 | |
Bristol-Myers Squibb Co. | | | 708,150 | | | | 44,153,153 | |
Eli Lilly & Co. | | | 507,322 | | | | 140,132,483 | |
| | | | | | | | |
| | |
| | | | | | | 257,542,816 | |
| | | | | | | | |
Road & Rail — 1.7% | | | | | | | | |
Uber Technologies, Inc.* | | | 1,243,956 | | | | 52,159,075 | |
Union Pacific Corp. | | | 234,271 | | | | 59,019,893 | |
| | | | | | | | |
| | |
| | | | | | | 111,178,968 | |
| | | | | | | | |
Semiconductors & Semiconductor Equipment — 7.0% | |
Broadcom, Inc. | | | 125,299 | | | | 83,375,208 | |
Lam Research Corp. | | | 77,295 | | | | 55,586,699 | |
NVIDIA Corp. | | | 632,016 | | | | 185,882,226 | |
NXP Semiconductors NV (China) | | | 232,467 | | | | 52,951,333 | |
QUALCOMM, Inc. | | | 362,013 | | | | 66,201,317 | |
| | | | | | | | |
| | |
| | | | | | | 443,996,783 | |
| | | | | | | | |
Software — 9.3% | | | | | | | | |
Adobe, Inc.* | | | 173,626 | | | | 98,456,360 | |
Atlassian Corp. PLC (Class A Stock)* | | | 155,792 | | | | 59,401,932 | |
Crowdstrike Holdings, Inc. (Class A Stock)* | | | 209,890 | | | | 42,974,978 | |
Microsoft Corp. | | | 772,910 | | | | 259,945,091 | |
salesforce.com, Inc.* | | | 344,818 | | | | 87,628,598 | |
Trade Desk, Inc. (The) (Class A Stock)* | | | 455,010 | | | | 41,697,116 | |
| | | | | | | | |
| | |
| | | | | | | 590,104,075 | |
| | | | | | | | |
Specialty Retail — 2.7% | | | | | | | | |
Home Depot, Inc. (The) | | | 100,952 | | | | 41,896,089 | |
Lowe’s Cos., Inc. | | | 222,027 | | | | 57,389,539 | |
Ross Stores, Inc. | | | 314,684 | | | | 35,962,088 | |
TJX Cos., Inc. (The) | | | 472,360 | | | | 35,861,571 | |
| | | | | | | | |
| | |
| | | | | | | 171,109,287 | |
| | | | | | | | |
| | | | | | | | |
| | | Shares | | | Value | |
|
| COMMON STOCKS (continued) | |
Technology Hardware, Storage & Peripherals — 4.5% | |
Apple, Inc. | | | 1,626,673 | | | $ | 288,848,325 | |
| | | | | | | | |
Textiles, Apparel & Luxury Goods — 2.7% | |
Lululemon Athletica, Inc.* | | | 95,147 | | | | 37,245,293 | |
LVMH Moet Hennessy Louis Vuitton SE (France) | | | 102,701 | | | | 84,940,703 | |
NIKE, Inc. (Class B Stock) | | | 306,299 | | | | 51,050,855 | |
| | | | | | | | |
| | |
| | | | | | | 173,236,851 | |
| | | | | | | | |
Trading Companies & Distributors — 0.5% | |
United Rentals, Inc.* | | | 86,509 | | | | 28,746,076 | |
| | | | | | | | |
TOTAL LONG-TERM INVESTMENTS
(cost $3,165,816,532) | | | | 6,284,955,577 | |
| | | | | | | | |
|
| SHORT-TERM INVESTMENTS — 3.4% | |
|
| AFFILIATED MUTUAL FUNDS | |
PGIM Core Ultra Short Bond Fund(wa) | | | 96,848,898 | | | | 96,848,898 | |
PGIM Institutional Money Market Fund (cost $123,999,170; includes $123,991,772 of cash collateral for securities
on loan)(b)(wa) | | | 124,304,592 | | | | 124,217,579 | |
| | | | | | | | |
TOTAL SHORT-TERM INVESTMENTS
(cost $220,848,068) | | | | 221,066,477 | |
| | | | | | | | |
TOTAL INVESTMENTS—101.9%
(cost $3,386,664,600) | | | | 6,506,022,054 | |
Liabilities in excess of other assets — (1.9)% | | | | (123,818,292 | ) |
| | | | | | | | |
| | |
NET ASSETS — 100.0% | | | | | | $ | 6,382,203,762 | |
| | | | | | | | |
See the Glossary for a list of the abbreviation(s) used in the annual report.
| * | Non-income producing security. |
| (a) | All or a portion of security is on loan. The aggregate market value of such securities, including those sold and pending settlement, is $120,973,545; cash collateral of $123,991,772 (included in liabilities) was received with which the Portfolio purchased highly liquid short-term investments. In the event of significant appreciation in value of securities on loan on the last business day of the reporting period, the Portfolio may reflect a collateral value that is less than the market value of the loaned securities and such shortfall is remedied the following business day. |
| (b) | Represents security, or portion thereof, purchased with cash collateral received for securities on loan and includes dividend reinvestment. |
| (wa) | PGIM Investments LLC, the manager of the Portfolio, also serves as manager of the PGIM Core Ultra Short Bond Fund and PGIM Institutional Money Market Fund, if applicable. |
Fair Value Measurements:
Various inputs are used in determining the value of the Portfolio’s investments. These inputs are summarized in the three broad levels listed below.
Level 1—unadjusted quoted prices generally in active markets for identical securities.
SEE NOTES TO FINANCIAL STATEMENTS.
A93
| | | | | | |
| | |
| | PSF PGIM JENNISON BLEND PORTFOLIO (CONTINUED) | | |
| | | | | | |
| |
| SCHEDULE OF INVESTMENTS | | as of December 31, 2021 |
Level 2—quoted prices for similar securities, interest rates and yield curves, prepayment speeds, foreign currency exchange rates and other observable inputs.
Level 3—unobservable inputs for securities valued in accordance with Board approved fair valuation procedures.
The following is a summary of the inputs used as of December 31, 2021 in valuing such portfolio securities:
| | | | | | | | | | | | |
| | | Level 1 | | | Level 2 | | | Level 3 | |
Investments in Securities | | | | | | | | | | | | |
Assets | | | | | | | | | | | | |
Long-Term Investments | | | | | | | | | | | | |
Common Stocks | | | | | | | | | | | | |
Aerospace & Defense | | $ | 47,831,374 | | | $ | 48,325,778 | | | $ | — | |
Air Freight & Logistics | | | 32,294,566 | | | | — | | | | — | |
Airlines | | | 34,744,035 | | | | — | | | | — | |
Automobiles | | | 344,825,116 | | | | — | | | | — | |
Banks | | | 364,084,931 | | | | — | | | | — | |
Beverages | | | 42,859,468 | | | | — | | | | — | |
Biotechnology | | | 27,194,806 | | | | — | | | | — | |
Building Products | | | 89,258,134 | | | | — | | | | — | |
Capital Markets | | | 149,018,901 | | | | — | | | | — | |
Chemicals | | | 96,659,513 | | | | — | | | | — | |
Communications Equipment | | | 43,879,162 | | | | — | | | | — | |
Consumer Finance | | | 87,811,046 | | | | — | | | | — | |
Containers & Packaging | | | 57,481,913 | | | | — | | | | — | |
Entertainment | | | 218,903,825 | | | | — | | | | — | |
Food & Staples Retailing | | | 109,791,380 | | | | — | | | | — | |
Food Products | | | 54,656,150 | | | | — | | | | — | |
Health Care Equipment & Supplies | | | 83,410,265 | | | | — | | | | — | |
Health Care Providers & Services | | | 90,996,847 | | | | — | | | | — | |
Hotels, Restaurants & Leisure | | | 140,951,951 | | | | — | | | | — | |
Household Durables | | | 38,708,842 | | | | — | | | | — | |
Household Products | | | 39,101,018 | | | | — | | | | — | |
Insurance | | | 168,429,963 | | | | — | | | | — | |
Interactive Media & Services | | | 483,217,601 | | | | — | | | | — | |
Internet & Direct Marketing Retail | | | 286,289,997 | | | | — | | | | — | |
IT Services | | | 442,171,452 | | | | 88,473,409 | | | | — | |
Life Sciences Tools & Services | | | 52,762,676 | | | | 10,983,208 | | | | — | |
Machinery | | | 80,100,094 | | | | — | | | | — | |
Multi-Utilities | | | 97,598,702 | | | | — | | | | — | |
Oil, Gas & Consumable Fuels | | | 193,943,401 | | | | — | | | | — | |
Personal Products | | | 73,432,872 | | | | — | | | | — | |
Pharmaceuticals | | | 257,542,816 | | | | — | | | | — | |
Road & Rail | | | 111,178,968 | | | | — | | | | — | |
Semiconductors & Semiconductor Equipment | | | 443,996,783 | | | | — | | | | — | |
Software | | | 590,104,075 | | | | — | | | | — | |
Specialty Retail | | | 171,109,287 | | | | — | | | | — | |
Technology Hardware, Storage & Peripherals | | | 288,848,325 | | | | — | | | | — | |
Textiles, Apparel & Luxury Goods | | | 88,296,148 | | | | 84,940,703 | | | | — | |
Trading Companies & Distributors | | | 28,746,076 | | | | — | | | | — | |
Short-Term Investments | | | | | | | | | | | | |
Affiliated Mutual Funds | | | 221,066,477 | | | | — | | | | — | |
| | | | | | | | | | | | |
Total | | $ | 6,273,298,956 | | | $ | 232,723,098 | | | $ | — | |
SEE NOTES TO FINANCIAL STATEMENTS.
A94
| | | | | | |
| | |
| | PSF PGIM JENNISON BLEND PORTFOLIO (CONTINUED) | | |
| | | | | | |
| |
| SCHEDULE OF INVESTMENTS | | as of December 31, 2021 |
Industry Classification:
The industry classification of investments and liabilities in excess of other assets shown as a percentage of net assets as of December 31, 2021 were as follows (unaudited):
| | | | |
Software | | | 9.3 | % |
IT Services | | | 8.3 | |
Interactive Media & Services | | | 7.6 | |
Semiconductors & Semiconductor Equipment | | | 7.0 | |
Banks | | | 5.7 | |
Automobiles | | | 5.4 | |
Technology Hardware, Storage & Peripherals | | | 4.5 | |
Internet & Direct Marketing Retail | | | 4.5 | |
Pharmaceuticals | | | 4.0 | |
Affiliated Mutual Funds (1.9% represents investments purchased with collateral from securities on loan) | | | 3.4 | |
Entertainment | | | 3.4 | |
Oil, Gas & Consumable Fuels | | | 3.0 | |
Textiles, Apparel & Luxury Goods | | | 2.7 | |
Specialty Retail | | | 2.7 | |
Insurance | | | 2.6 | |
Capital Markets | | | 2.3 | |
Hotels, Restaurants & Leisure | | | 2.2 | |
Road & Rail | | | 1.7 | |
Food & Staples Retailing | | | 1.7 | |
Multi-Utilities | | | 1.5 | |
Chemicals | | | 1.5 | |
Aerospace & Defense | | | 1.5 | |
| | | | |
Health Care Providers & Services | | | 1.4 | % |
Building Products | | | 1.4 | |
Consumer Finance | | | 1.4 | |
Health Care Equipment & Supplies | | | 1.3 | |
Machinery | | | 1.3 | |
Personal Products | | | 1.2 | |
Life Sciences Tools & Services | | | 1.0 | |
Containers & Packaging | | | 0.9 | |
Food Products | | | 0.9 | |
Communications Equipment | | | 0.7 | |
Beverages | | | 0.7 | |
Household Products | | | 0.6 | |
Household Durables | | | 0.6 | |
Airlines | | | 0.6 | |
Air Freight & Logistics | | | 0.5 | |
Trading Companies & Distributors | | | 0.5 | |
Biotechnology | | | 0.4 | |
| | | | |
| | | 101.9 | |
Liabilities in excess of other assets | | | (1.9 | ) |
| | | | |
| | | 100.0 | % |
| | | | |
Financial Instruments/Transactions—Summary of Offsetting and Netting Arrangements:
The Portfolio entered into financial instruments/transactions during the reporting period that are either offset in accordance with current requirements or are subject to enforceable master netting arrangements or similar agreements that permit offsetting. The information about offsetting and related netting arrangements for financial instruments/transactions where the legal right to set-off exists is presented in the summary below.
Offsetting of financial instrument/transaction assets and liabilities:
| | | | | | | | | | | | | | | |
Description | | Gross Market
Value of
Recognized
Assets/(Liabilities) | | Collateral
Pledged/(Received)(1) | | Net
Amount |
Securities on Loan | | | | $120,973,545 | | | | | $(120,973,545) | | | | | $— | |
| | | | | | | | | | | | | | | |
| (1) | Collateral amount disclosed by the Portfolio is limited to the market value of financial instruments/transactions. |
SEE NOTES TO FINANCIAL STATEMENTS.
A95
| | | | | | |
| | |
| | PSF PGIM JENNISON BLEND PORTFOLIO (CONTINUED) | | |
STATEMENT OF ASSETS AND LIABILITIES
as of December 31, 2021
| | | | |
ASSETS | | | | |
Investments at value, including securities on loan of $120,973,545: | | | | |
Unaffiliated investments (cost $3,165,816,532) | | $ | 6,284,955,577 | |
Affiliated investments (cost $220,848,068) | | | 221,066,477 | |
Cash | | | 44 | |
Dividends receivable | | | 2,292,513 | |
Tax reclaim receivable | | | 1,142,783 | |
Receivable for Portfolio shares sold | | | 6,285 | |
Prepaid expenses and other assets | | | 434,036 | |
| | | | |
Total Assets | | | 6,509,897,715 | |
| | | | |
LIABILITIES | | | | |
Payable to broker for collateral for securities on loan | | | 123,991,772 | |
Management fee payable | | | 2,410,583 | |
Payable to affiliate | | | 638,753 | |
Payable for Portfolio shares purchased | | | 495,812 | |
Accrued expenses and other liabilities | | | 152,160 | |
Trustees’ fees payable | | | 2,891 | |
Affiliated transfer agent fee payable | | | 980 | |
Distribution fee payable | | | 618 | |
Administration fee payable | | | 384 | |
| | | | |
Total Liabilities | | | 127,693,953 | |
| | | | |
NET ASSETS | | $ | 6,382,203,762 | |
| | | | |
Net assets were comprised of: | | | | |
Partners’ Equity | | $ | 6,382,203,762 | |
| | | | |
Class I: | | | | |
Net asset value and redemption price per share, $6,379,233,235 / 65,033,111 outstanding shares of beneficial interest | | $ | 98.09 | |
| | | | |
Class II: | | | | |
Net asset value and redemption price per share, $2,330,700 / 24,370 outstanding shares of beneficial interest | | $ | 95.64 | |
| | | | |
Class III: | | | | |
Net asset value and redemption price per share, $639,827 / 6,534 outstanding shares of beneficial interest | | $ | 97.92 | |
| | | | |
STATEMENT OF OPERATIONS
Year Ended December 31, 2021
| | | | |
NET INVESTMENT INCOME (LOSS) | | | | |
INCOME | | | | |
Unaffiliated dividend income (net of $342,821 foreign withholding tax) | | $ | 54,841,672 | |
Income from securities lending, net (including affiliated income of $162,842) | | | 194,587 | |
Affiliated dividend income | | | 76,374 | |
| | | | |
Total income | | | 55,112,633 | |
| | | | |
EXPENSES | | | | |
Management fee | | | 27,389,058 | |
Distribution fee—Class II | | | 5,469 | |
Distribution fee—Class III | | | 416 | |
Administration fee—Class II | | | 3,281 | |
Custodian and accounting fees | | | 318,672 | |
Trustees’ fees | | | 86,700 | |
Legal fees and expenses | | | 44,466 | |
Shareholders’ reports | | | 33,185 | |
Audit fee | | | 26,700 | |
Transfer agent’s fees and expenses (including affiliated expense of $5,882) | | | 10,682 | |
Miscellaneous | | | 99,977 | |
| | | | |
Total expenses | | | 28,018,606 | |
| | | | |
NET INVESTMENT INCOME (LOSS) | | | 27,094,027 | |
| | | | |
| REALIZED AND UNREALIZED GAIN (LOSS) ON INVESTMENT AND FOREIGN CURRENCY TRANSACTIONS | | | | |
Net realized gain (loss) on: | | | | |
Investment transactions (including affiliated of $14,239) | | | 458,065,389 | |
Foreign currency transactions | | | 15,172 | |
| | | | |
| | | 458,080,561 | |
| | | | |
Net change in unrealized appreciation (depreciation) on: | | | | |
Investments (including affiliated of $(59,699)) | | | 633,405,779 | |
Foreign currencies | | | (11,397 | ) |
| | | | |
| | | 633,394,382 | |
| | | | |
NET GAIN (LOSS) ON INVESTMENT AND FOREIGN CURRENCY TRANSACTIONS | | | 1,091,474,943 | |
| | | | |
NET INCREASE (DECREASE) IN NET ASSETS RESULTING FROM OPERATIONS | | $ | 1,118,568,970 | |
| | | | |
STATEMENTS OF CHANGES IN NET ASSETS
| | | | | | | | |
| | | Year Ended
December 31, 2021 | | | Year Ended
December 31, 2020 | |
INCREASE (DECREASE) IN NET ASSETS | | | | | | | | |
OPERATIONS | | | | | | | | |
Net investment income (loss) | | $ | 27,094,027 | | | $ | 38,294,761 | |
Net realized gain (loss) on investment and foreign currency transactions | | | 458,080,561 | | | | 537,155,668 | |
Net change in unrealized appreciation (depreciation) on investments and foreign currencies | | | 633,394,382 | | | | 719,957,876 | |
| | | | | | | | |
NET INCREASE (DECREASE) IN NET ASSETS RESULTING FROM OPERATIONS | | | 1,118,568,970 | | | | 1,295,408,305 | |
| | | | | | | | |
PORTFOLIO SHARE TRANSACTIONS | | | | | | | | |
Portfolio shares sold | | | 8,893,934 | | | | 10,494,011 | |
Portfolio shares purchased | | | (419,616,091 | ) | | | (344,263,770 | ) |
| | | | | | | | |
NET INCREASE (DECREASE) IN NET ASSETS FROM PORTFOLIO SHARE TRANSACTIONS | | | (410,722,157 | ) | | | (333,769,759 | ) |
| | | | | | | | |
TOTAL INCREASE (DECREASE) | | | 707,846,813 | | | | 961,638,546 | |
NET ASSETS: | | | | | | | | |
Beginning of year | | | 5,674,356,949 | | | | 4,712,718,403 | |
| | | | | | | | |
End of year | | $ | 6,382,203,762 | | | $ | 5,674,356,949 | |
| | | | | | | | |
SEE NOTES TO FINANCIAL STATEMENTS.
A96
| | | | | | |
| | |
| | PSF PGIM TOTAL RETURN BOND PORTFOLIO | | |
| | | | | | |
| |
| SCHEDULE OF INVESTMENTS | | as of December 31, 2021 |
| | | | | | | | | | | | | | | | |
| | | | | | | | | Principal | | | | |
| Interest | | Maturity | | | | | | Amount | | | | |
| Rate | | Date | | | | | | (000)# | | | Value | |
| | | | | | | | | | | | | | | | |
| |
| LONG-TERM INVESTMENTS — 99.3% | | | | | |
| |
| ASSET-BACKED SECURITIES — 22.7% | | | | | |
Automobiles — 0.9% | | | | | | | | | | | | | |
AmeriCredit Automobile Receivables Trust, | |
Series 2020-02, Class D | |
2.130% | | | 03/18/26 | | | | | | | | 300 | | | $ | 303,741 | |
Avis Budget Rental Car Funding AESOP LLC, | |
Series 2020-02A, Class A, 144A | |
2.020% | | | 02/20/27 | | | | | | | | 600 | | | | 606,377 | |
Exeter Automobile Receivables Trust, | |
Series 2020-03A, Class C | | | | | | | | | |
1.320% | | | 07/15/25 | | | | | | | | 300 | | | | 301,330 | |
Series 2020-03A, Class D | | | | | |
1.730% | | | 07/15/26 | | | | | | | | 200 | | | | 201,549 | |
Hertz Vehicle Financing III LP, | |
Series 2021-02A, Class A, 144A | |
1.680% | | | 12/27/27 | | | | | | | | 2,300 | | | | 2,265,470 | |
Series 2021-02A, Class B, 144A | |
2.120% | | | 12/27/27 | | | | | | | | 200 | | | | 198,039 | |
Hertz Vehicle Financing LLC, | |
Series 2021-01A, Class C, 144A | | | | | |
2.050% | | | 12/26/25 | | | | | | | | 100 | | | | 98,962 | |
JPMorgan Chase Bank, NA, | |
Series 2020-01, Class R, 144A | |
33.784% | | | 01/25/28 | | | | | | | | 761 | | | | 852,691 | |
Series 2020-02, Class D, 144A | |
1.487% | | | 02/25/28 | | | | | | | | 689 | | | | 688,345 | |
OneMain Direct Auto Receivables Trust, | |
Series 2019-01A, Class A, 144A | |
3.630% | | | 09/14/27 | | | | | | | | 3,500 | | | | 3,692,817 | |
Series 2019-01A, Class B, 144A | |
3.950% | | | 11/14/28 | | | | | | | | 800 | | | | 853,882 | |
Santander Drive Auto Receivables Trust, | |
Series 2020-02, Class D | | | | | |
2.220% | | | 09/15/26 | | | | | | | | 400 | | | | 405,827 | |
Series 2020-03, Class D | | | | | |
1.640% | | | 11/16/26 | | | | | | | | 1,400 | | | | 1,409,508 | |
| | | | | | | | | | | | | | | | |
| | | | | | | | | | | | | | | 11,878,538 | |
| | | | | | | | | | | | | | | | |
Collateralized Loan Obligations — 18.5% | | | | | |
Anchorage Credit Opportunities CLO Ltd. (Cayman Islands), | |
Series 2019-01A, Class A1, 144A, 3 Month LIBOR + 1.950% (Cap N/A, Floor 1.950%) | |
2.082%(c) | | | 01/20/32 | | | | | | | | 3,000 | | | | 3,004,123 | |
Ares European CLO DAC (Ireland), | |
Series 11A, Class A1R, 144A, 3 Month EURIBOR + 0.770% (Cap N/A, Floor 0.770%) | |
0.770%(c) | | | 04/15/32 | | | | EUR | | | | 10,000 | | | | 11,384,875 | |
Atrium (Cayman Islands), | | | | | |
Series 12A, Class AR, 144A, 3 Month LIBOR + 0.830% (Cap N/A, Floor 0.000%) | |
0.958%(c) | | | 04/22/27 | | | | | | | | 7,394 | | | | 7,392,039 | |
Bain Capital Credit CLO Ltd. (Cayman Islands), | | | | | |
Series 2019-02A, Class AR, 144A, 3 Month LIBOR + 1.100% (Cap N/A, Floor 1.100%) | |
1.222%(c) | | | 10/17/32 | | | | | | | | 3,500 | | | | 3,498,654 | |
Ballyrock CLO Ltd. (Cayman Islands), | |
Series 2016-01A, Class AR2, 144A, 3 Month LIBOR + 0.980% (Cap N/A, Floor 0.980%) | |
1.104%(c) | | | 10/15/28 | | | | | | | | 1,736 | | | | 1,734,401 | |
| | | | | | | | | | | | | | | | |
| | | | | | | | | Principal | | | | |
| Interest | | Maturity | | | | | | Amount | | | | |
| Rate | | Date | | | | | | (000)# | | | Value | |
| | | | | | | | | | | | | | | | |
|
| ASSET-BACKED SECURITIES (continued) | |
Collateralized Loan Obligations (cont’d.) | |
Battalion CLO Ltd., | | | | | | | | | | | | | |
Series 2018-12A, Class A1, 144A, 3 Month LIBOR + 1.070% (Cap N/A, Floor 1.070%) | |
1.228%(c) | | | 05/17/31 | | | | | | | | 3,000 | | | $ | 2,998,269 | |
Brookside Mill CLO Ltd. (Cayman Islands), | |
Series 2013-01A, Class BR, 144A, 3 Month LIBOR + 1.350% (Cap N/A, Floor 0.000%) | |
1.472%(c) | | | 01/17/28 | | | | | | | | 2,500 | | | | 2,501,367 | |
Carlyle Euro CLO DAC (Ireland), | |
Series 2021-02A, Class A1, 144A, 3 Month EURIBOR + 0.990% (Cap N/A, Floor 0.990%) | |
0.990%(c) | | | 10/15/35 | | | | EUR | | | | 6,500 | | | | 7,392,894 | |
Carlyle Euro CLO Ltd. (Ireland), | |
Series 2021-02A, Class A2B, 144A | |
2.100% | | | 10/15/35 | | | | EUR | | | | 6,250 | | | | 6,994,809 | |
Carlyle Global Market Strategies Euro CLO Ltd. (Ireland), | |
Series 2014-02A, Class AR1, 144A, 3 Month EURIBOR + 0.750% (Cap N/A, Floor 0.750%) | |
0.750%(c) | | | 11/15/31 | | | | EUR | | | | 10,000 | | | | 11,353,959 | |
Carlyle US CLO Ltd. (Cayman Islands), | |
Series 2017-04A, Class A1, 144A, 3 Month LIBOR + 1.180% (Cap N/A, Floor 0.000%) | |
1.304%(c) | | | 01/15/30 | | | | | | | | 4,000 | | | | 4,000,184 | |
CIFC Funding Ltd. (Cayman Islands), | |
Series 2013-03RA, Class A1, 144A, 3 Month LIBOR + 0.980% (Cap N/A, Floor 0.980%) | |
1.104%(c) | | | 04/24/31 | | | | | | | | 1,500 | | | | 1,499,165 | |
Series 2015-01A, Class ARR, 144A, 3 Month LIBOR + 1.110% (Cap N/A, Floor 1.110%) | |
1.238%(c) | | | 01/22/31 | | | | | | | | 3,750 | | | | 3,749,016 | |
Elevation CLO Ltd. (Cayman Islands), | |
Series 2014-02A, Class A1R, 144A, 3 Month LIBOR + 1.230% (Cap N/A, Floor 0.000%) | |
1.354%(c) | | | 10/15/29 | | | | | | | | 7,500 | | | | 7,500,138 | |
Series 2017-06A, Class A1, 144A, 3 Month LIBOR + 1.280% (Cap N/A, Floor 0.000%) | |
1.404%(c) | | | 07/15/29 | | | | | | | | 250 | | | | 249,961 | |
Series 2017-07A, Class A, 144A, 3 Month LIBOR + 1.220% (Cap N/A, Floor 0.000%) | |
1.344%(c) | | | 07/15/30 | | | | | | | | 5,250 | | | | 5,253,001 | |
Generate CLO Ltd. (Cayman Islands), | | | | | |
Series 02A, Class AR, 144A, 3 Month LIBOR + 1.150% (Cap N/A, Floor 0.000%) | |
1.278%(c) | | | 01/22/31 | | | | | | | | 2,000 | | | | 1,999,995 | |
Greenwood Park CLO Ltd. (Cayman Islands), | | | | | |
Series 2018-01A, Class A2, 144A, 3 Month LIBOR + 1.010% (Cap N/A, Floor 0.000%) | |
1.134%(c) | | | 04/15/31 | | | | | | | | 6,000 | | | | 5,996,658 | |
Greywolf CLO Ltd. (Cayman Islands), | | | | | |
Series 2018-01A, Class A1, 144A, 3 Month LIBOR + 1.030% (Cap N/A, Floor 0.000%) | |
1.155%(c) | | | 04/26/31 | | | | | | | | 3,500 | | | | 3,498,065 | |
Hayfin Emerald CLO (Ireland), | | | | | |
Series 05A, Class A, 144A, 3 Month EURIBOR + 1.100% (Cap N/A, Floor 1.100%) | |
1.100%(c) | | | 11/17/32 | | | | EUR | | | | 10,500 | | | | 11,958,697 | |
SEE NOTES TO FINANCIAL STATEMENTS.
A97
| | | | | | |
| | |
| | PSF PGIM TOTAL RETURN BOND PORTFOLIO (CONTINUED) | | |
| | | | | | |
| |
| SCHEDULE OF INVESTMENTS | | as of December 31, 2021 |
| | | | | | | | | | | | | | | | |
| | | | | | | | | Principal | | | | |
| Interest | | Maturity | | | | | | Amount | | | | |
| Rate | | Date | | | | | | (000)# | | | Value | |
| | | | | | | | | | | | | | | | |
|
ASSET-BACKED SECURITIES (continued) | |
Collateralized Loan Obligations (cont’d.) | |
HPS Loan Management Ltd. (Cayman Islands), | |
Series 15A-19, Class A1, 144A, 3 Month LIBOR + 1.320% (Cap N/A, Floor 1.320%) | |
1.448%(c) | | | 07/22/32 | | | | | | | | 4,000 | | | $ | 4,001,313 | |
Series 2015-06A, Class A1R, 144A, 3 Month LIBOR + 1.000% (Cap N/A, Floor 0.000%) | |
1.140%(c) | | | 02/05/31 | | | | | | | | 3,973 | | | | 3,971,856 | |
ICG US CLO Ltd. (Cayman Islands), | |
Series 2014-03A, Class A1RR, 144A, 3 Month LIBOR + 1.030% (Cap N/A, Floor 0.000%) | |
1.154%(c) | | | 04/25/31 | | | | | | | | 2,494 | | | | 2,491,815 | |
Jamestown CLO Ltd. (Cayman Islands), | |
Series 2019-14A, Class A1AR, 144A, 3 Month LIBOR + 1.200% (Cap N/A, Floor 1.200%) | |
1.332%(c) | | | 10/20/34 | | | | | | | | 6,625 | | | | 6,626,234 | |
Series 2019-14A, Class A2R, 144A | |
0.000%(cc) | | | 10/20/34 | | | | | | | | 6,750 | | | | 6,745,002 | |
Madison Park Funding Ltd. (Cayman Islands), | |
Series 2019-34A, Class AR, 144A, 3 Month LIBOR + 1.120% (Cap N/A, Floor 1.120%) | |
1.244%(c) | | | 04/25/32 | | | | | | | | 2,000 | | | | 1,998,583 | |
MidOcean Credit CLO (Cayman Islands), | |
Series 2014-03A, Class A1R, 144A, 3 Month LIBOR + 1.120% (Cap N/A, Floor 1.120%) | |
1.250%(c) | | | 04/21/31 | | | | | | | | 9,635 | | | | 9,634,421 | |
Mountain View CLO Ltd. (Cayman Islands), | |
Series 2015-09A, Class A1R, 144A, 3 Month LIBOR + 1.120% (Cap N/A, Floor 0.000%) | |
1.244%(c) | | | 07/15/31 | | | | | | | | 6,000 | | | | 5,995,358 | |
OCP CLO Ltd. (Cayman Islands), | |
Series 2020-18A, Class AR, 144A, 3 Month LIBOR + 1.090% (Cap N/A, Floor 1.090%) | |
1.222%(c) | | | 07/20/32 | | | | | | | | 5,000 | | | | 4,998,083 | |
OZLM Ltd. (Cayman Islands), | |
Series 2015-11A, Class A1R, 144A, 3 Month LIBOR + 1.250% (Cap N/A, Floor 0.000%) | |
1.382%(c) | | | 10/30/30 | | | | | | | | 1,236 | | | | 1,237,403 | |
Park Avenue Institutional Advisers CLO Ltd. (Cayman Islands), | |
Series 2019-02A, Class A1R, 144A, 3 Month LIBOR + 1.180% (Cap N/A, Floor 1.180%) | |
1.304%(c) | | | 10/15/34 | | | | | | | | 7,000 | | | | 6,995,927 | |
Romark WM-R Ltd. (Cayman Islands), | |
Series 2018-01A, Class A1, 144A, 3 Month LIBOR + 1.030% (Cap N/A, Floor 0.000%) | |
1.162%(c) | | | 04/20/31 | | | | | | | | 3,958 | | | | 3,955,721 | |
Shackleton CLO Ltd. (Cayman Islands), | |
Series 2014-05RA, Class A, 144A, 3 Month LIBOR + 1.100% (Cap N/A, Floor 0.000%) | |
1.244%(c) | | | 05/07/31 | | | | | | | | 4,955 | | | | 4,953,578 | |
Signal Peak CLO Ltd. (Cayman Islands), | |
Series 2018-05A, Class A, 144A, 3 Month LIBOR + 1.110% (Cap N/A, Floor 1.110%) | |
1.234%(c) | | | 04/25/31 | | | | | | | | 5,750 | | | | 5,748,439 | |
Sixth Street CLO Ltd. (Cayman Islands), | |
Series 2020-16A, Class A1A, 144A, 3 Month LIBOR + 1.320% (Cap N/A, Floor 1.320%) | |
1.452%(c) | | | 10/20/32 | | | | | | | | 12,500 | | | | 12,504,112 | |
| | | | | | | | | | | | | | | | |
| | | | | | | | | Principal | | | | |
| Interest | | Maturity | | | | | | Amount | | | | |
| Rate | | Date | | | | | | (000)# | | | Value | |
| | | | | | | | | | | | | | | | |
|
ASSET-BACKED SECURITIES (continued) | |
Collateralized Loan Obligations (cont’d.) | |
Sound Point CLO Ltd. (Cayman Islands), | |
Series 2013-01A, Class A1R, 144A, 3 Month LIBOR + 1.070% (Cap N/A, Floor 1.070%) | |
1.195%(c) | | | 01/26/31 | | | | | | | | 3,500 | | | $ | 3,499,091 | |
TCW CLO Ltd. (Cayman Islands), | |
Series 2017-01A, Class A1RR, 144A, 3 Month LIBOR + 1.180% (Cap N/A, Floor 1.180%) | |
1.312%(c) | | | 10/29/34 | | | | | | | | 3,000 | | | | 2,999,998 | |
Series 2017-01A, Class BRR, 144A | | | | | |
0.000%(cc) | | | 10/29/34 | | | | | | | | 4,000 | | | | 3,999,995 | |
Telos CLO Ltd. (Cayman Islands), | |
Series 2013-04A, Class AR, 144A, 3 Month LIBOR + 1.240% (Cap N/A, Floor 0.000%) | |
1.362%(c) | | | 01/17/30 | | | | | | | | 3,470 | | | | 3,471,627 | |
TICP CLO Ltd. (Cayman Islands), | |
Series 2017-09A, Class A, 144A, 3 Month LIBOR + 1.140% (Cap N/A, Floor 0.000%) | |
1.272%(c) | | | 01/20/31 | | | | | | | | 3,000 | | | | 3,000,002 | |
Toro European CLO DAC (Ireland), | |
Series 03A, Class ARR, 144A, 3 Month EURIBOR + 0.990% (Cap N/A, Floor 0.990%) | |
0.990%(c) | | | 07/15/34 | | | | | | | | EUR 8,000 | | | | 9,086,979 | |
Venture CLO Ltd. (Cayman Islands), | |
Series 2015-21A, Class AR, 144A, 3 Month LIBOR + 0.880% (Cap N/A, Floor 0.000%) | |
1.004%(c) | | | 07/15/27 | | | | | | | | 1,408 | | | | 1,407,991 | |
Voya CLO Ltd. (Cayman Islands), | |
Series 2013-01A, Class A1AR, 144A, 3 Month LIBOR + 1.210% (Cap N/A, Floor 0.000%) | |
1.334%(c) | | | 10/15/30 | | | | | | | | 7,469 | | | | 7,469,556 | |
Series 2013-02A, Class A1R, 144A, 3 Month LIBOR + 0.970% (Cap N/A, Floor 0.970%) | |
1.094%(c) | | | 04/25/31 | | | | | | | | 3,000 | | | | 2,997,465 | |
Wellfleet CLO Ltd. (Cayman Islands), | |
Series 2017-03A, Class A1, 144A, 3 Month LIBOR + 1.150% (Cap N/A, Floor 1.150%) | |
1.272%(c) | | | 01/17/31 | | | | | | | | 6,500 | | | | 6,500,320 | |
Series 2018-02A, Class A1, 144A, 3 Month LIBOR + 1.200% (Cap N/A, Floor 1.200%) | |
1.332%(c) | | | 10/20/31 | | | | | | | | 2,750 | | | | 2,748,641 | |
Wind River CLO Ltd. (Cayman Islands), | |
Series 2016-01KRA, Class A1R2, 144A, 3 Month LIBOR + 1.210% (Cap N/A, Floor 1.210%) | |
1.334%(c) | | | 10/15/34 | | | | | | | | 1,750 | | | | 1,750,002 | |
Zais CLO Ltd. (Cayman Islands), | |
Series 2018-01A, Class A, 144A, 3 Month LIBOR + 0.950% (Cap N/A, Floor 0.000%) | |
1.074%(c) | | | 04/15/29 | | | | | | | | 6,736 | | | | 6,731,324 | |
| | | | | | | | | | | | | | | | |
| | | | | | | | | | | | | | | 241,481,106 | |
| | | | | | | | | | | | | | | | |
|
Consumer Loans — 1.1% | |
Fairstone Financial Issuance Trust (Canada), | |
Series 2020-01A, Class A, 144A | |
2.509% | | | 10/20/39 | | | | | | | | CAD 400 | | | | 316,294 | |
Lending Funding Trust, | |
Series 2020-02A, Class A, 144A | |
2.320% | | | 04/21/31 | | | | | | | | 300 | | | | 300,403 | |
SEE NOTES TO FINANCIAL STATEMENTS.
A98
| | | | | | |
| | |
| | PSF PGIM TOTAL RETURN BOND PORTFOLIO (CONTINUED) | | |
| | | | | | |
| |
| SCHEDULE OF INVESTMENTS | | as of December 31, 2021 |
| | | | | | | | | | | | | | | | |
| | | | | | | | | Principal | | | | |
| Interest | | Maturity | | | | | | Amount | | | | |
| Rate | | Date | | | | | | (000)# | | | Value | |
| | | | | | | | | | | | | | | | |
|
ASSET-BACKED SECURITIES (continued) | |
Consumer Loans (cont’d.) | |
Lendmark Funding Trust, | |
Series 2019-01A, Class A, 144A | |
3.000% | | | 12/20/27 | | | | | | | | 2,000 | | | $ | 2,019,323 | |
Series 2019-02A, Class A, 144A | |
2.780% | | | 04/20/28 | | | | | | | | 1,000 | | | | 1,013,963 | |
Series 2021-01A, Class B, 144A | |
2.470% | | | 11/20/31 | | | | | | | | 100 | | | | 100,577 | |
Mariner Finance Issuance Trust, | |
Series 2019-AA, Class A, 144A | |
2.960% | | | 07/20/32 | | | | | | | | 700 | | | | 708,328 | |
Series 2020-AA, Class A, 144A | |
2.190% | | | 08/21/34 | | | | | | | | 500 | | | | 503,296 | |
OneMain Financial Issuance Trust, | |
Series 2018-01A, Class A, 144A | |
3.300% | | | 03/14/29 | | | | | | | | 260 | | | | 260,066 | |
Series 2020-01A, Class A, 144A | |
3.840% | | | 05/14/32 | | | | | | | | 1,000 | | | | 1,022,608 | |
Series 2020-02A, Class A, 144A | |
1.750% | | | 09/14/35 | | | | | | | | 1,500 | | | | 1,490,187 | |
Oportun Funding XIII LLC, | |
Series 2019-A, Class A, 144A | |
3.080% | | | 08/08/25 | | | | | | | | 1,400 | | | | 1,414,332 | |
Series 2019-A, Class D, 144A | |
6.220% | | | 08/08/25 | | | | | | | | 1,800 | | | | 1,826,239 | |
Oportun Funding XIV LLC, | |
Series 2021-A, Class B, 144A | |
1.760% | | | 03/08/28 | | | | | | | | 300 | | | | 299,297 | |
PNMAC GMSR Issuer Trust, | |
Series 2018-GT01, Class A, 144A, 1 Month LIBOR + 2.850% (Cap N/A, Floor 2.850%) | |
2.952%(c) | | | 02/25/23 | | | | | | | | 1,280 | | | | 1,283,231 | |
Series 2018-GT02, Class A, 144A, 1 Month LIBOR + 2.650% (Cap N/A, Floor 0.000%) | |
2.752%(c) | | | 08/25/25 | | | | | | | | 1,200 | | | | 1,201,289 | |
| | | | | | | | | | | | | | | | |
| | | | | | | | | | | | | | | 13,759,433 | |
| | | | | | | | | | | | | | | | |
Credit Cards — 0.2% | |
Citibank Credit Card Issuance Trust, | |
Series 2018-A07, Class A7 | |
3.960% | | | 10/13/30 | | | | | | | | 700 | | | | 802,421 | |
Newday Partnership Funding PLC (United Kingdom), | |
Series 2020-01A, Class A3, 144A, SONIA + 1.400% (Cap N/A, Floor 0.000%) | |
1.450%(c) | | | 11/15/28 | | | | GBP | | | | 1,625 | | | | 2,224,384 | |
| | | | | | | | | | | | | | | | |
| | | | | | | | | | | | | | | 3,026,805 | |
| | | | | | | | | | | | | | | | |
Home Equity Loans — 0.0% | |
Floating Rate Mortgage Pass-Through Certificates, | |
Series 2001-02, Class M3, 1 Month LIBOR + 2.925% (Cap N/A, Floor 2.925%) | |
3.027%(c) | | | 10/25/31 | | | | | | | | 182 | | | | 199,876 | |
Merrill Lynch Mortgage Investors Trust, | |
Series 2004-HE02, Class M1, 1 Month LIBOR + 1.200% (Cap N/A, Floor 1.200%) | |
1.302%(c) | | | 08/25/35 | | | | | | | | 97 | | | | 96,003 | |
| | | | | | | | | | | | | | | | |
| | | | | | | | | Principal | | | | |
| Interest | | Maturity | | | | | | Amount | | | | |
| Rate | | Date | | | | | | (000)# | | | Value | |
| | | | | | | | | | | | | | | | |
|
ASSET-BACKED SECURITIES (continued) | |
Home Equity Loans (cont’d.) | |
Morgan Stanley ABS Capital I, Inc. Trust, | |
Series 2003-HE03, Class M1, 1 Month LIBOR + 1.020% (Cap N/A, Floor 1.020%) | |
1.122%(c) | | | 10/25/33 | | | | | | | | 162 | | | $ | 162,417 | |
| | | | | | | | | | | | | | | | |
| | | | | | | | | | | | | | | 458,296 | |
| | | | | | | | | | | | | | | | |
Other — 0.2% | |
PNMAC FMSR Issuer Trust, | |
Series 2018-FT01, Class A, 144A, 1 Month LIBOR + 2.350% (Cap N/A, Floor 0.000%) | |
2.442%(c) | | | 04/25/23 | | | | | | | | 220 | | | | 219,659 | |
TH MSR Issuer Trust, | |
Series 2019-FT01, Class A, 144A, 1 Month LIBOR + 2.800% (Cap N/A, Floor 2.800%) | |
2.892%(c) | | | 06/25/24 | | | | | | | | 2,250 | | | | 2,243,212 | |
| | | | | | | | | | | | | | | | |
| | | | | | | | | | | | | | | 2,462,871 | |
| | | | | | | | | | | | | | | | |
Residential Mortgage-Backed Securities — 0.7% | |
Argent Securities, Inc., Asset-Backed Pass-Through Certificates, | |
Series 2004-W010, Class A2, 1 Month LIBOR + 0.780% (Cap N/A, Floor 0.780%) | |
0.872%(c) | | | 10/25/34 | | | | | | | | 618 | | | | 613,618 | |
European Residential Loan Securitisation (Ireland), | |
Series 2021-NPLA, Class A1, 144A | |
0.000%(cc) | | | 11/25/60 | | | | | | | | EUR 1,000 | | | | 1,122,697 | |
Legacy Mortgage Asset Trust, | |
Series 2019-GS02, Class A1, 144A | |
3.750% | | | 01/25/59 | | | | | | | | 567 | | | | 567,464 | |
Series 2019-GS04, Class A1, 144A | |
3.438% | | | 05/25/59 | | | | | | | | 1,060 | | | | 1,060,951 | |
Merrill Lynch Mortgage Investors Trust, | |
Series 2004-OPT01, Class A1A, 1 Month LIBOR + 0.520% (Cap N/A, Floor 0.520%) | |
0.622%(c) | | | 06/25/35 | | | | | | | | 233 | | | | 232,245 | |
Rathlin Residential DAC (Ireland), | |
Series 2021-01A, Class A, 144A, 1 Month EURIBOR + 2.000% | |
1.432%(c) | | | 09/27/75 | | | | | | | | EUR 1,622 | | | | 1,819,687 | |
TFS (Spain), | |
Series 2018-03, Class A1, 1 Month EURIBOR + 3.000% | |
3.000%(c) | | | 04/16/23 | | | | | | | | EUR 3,181 | | | | 3,258,909 | |
| | | | | | | | | | | | | | | | |
| | | | | | | | | | | | | | | 8,675,571 | |
| | | | | | | | | | | | | | | | |
Student Loans — 1.1% | |
Laurel Road Prime Student Loan Trust, | |
Series 2018-A, Class A, 144A | |
0.000% | | | 02/25/43 | | | | | | | | 2,980 | | | | 1,061,900 | |
Series 2018-C, Class A, 144A | |
1.344%(cc) | | | 08/25/43 | | | | | | | | 1,099 | | | | 1,124,588 | |
Series 2018-D, Class A, 144A | |
0.000%(cc) | | | 11/25/43 | | | | | | | | 1,091 | | | | 1,124,033 | |
Series 2019-A, Class R, 144A | |
0.000% | | | 10/25/48 | | | | | | | | 1,929 | | | | 357,894 | |
SoFi Alternative Trust, | |
Series 2019-B, Class PT, 144A | |
0.000%(cc) | | | 12/15/45 | | | | | | | | 2,678 | | | | 2,753,175 | |
Series 2019-D, Class 1PT, 144A | |
2.966%(cc) | | | 01/16/46 | | | | | | | | 2,286 | | | | 2,346,173 | |
SEE NOTES TO FINANCIAL STATEMENTS.
A99
| | | | | | |
| | |
| | PSF PGIM TOTAL RETURN BOND PORTFOLIO (CONTINUED) | | |
| | | | | | |
| |
| SCHEDULE OF INVESTMENTS | | as of December 31, 2021 |
| | | | | | | | | | | | | | | | |
Interest
Rate | | Maturity
Date | | | | | | Principal
Amount
(000)# | | | Value | |
| | | | | | | | | | | | | | | | |
|
| ASSET-BACKED SECURITIES (continued) | |
Student Loans (cont’d.) | |
Series 2019-F, Class PT1, 144A | |
3.932%(cc) | | | 02/15/45 | | | | | | | | 2,219 | | | $ | 2,252,661 | |
SoFi RR Funding II Trust, | | | | | | | | | | | | | |
Series 2019-01, Class A, 144A, 1 Month LIBOR + 2.250% (Cap N/A, Floor 1.250%) | |
2.352%(c) | | | 11/29/24 | | | | | | | | 2,022 | | | | 2,021,820 | |
SoFi RR Funding III Trust, | | | | | | | | | | | | | |
Series 2020-01, Class A, 144A, 1 Month LIBOR + 4.750% (Cap N/A, Floor 3.750%) | |
4.852%(c) | | | 11/29/24 | | | | | | | | 1,249 | | | | 1,247,949 | |
| | | | | | | | | | | | | | | | |
| | | | |
| | | | | | | | | | | | | | | 14,290,193 | |
| | | | | | | | | | | | | | | | |
TOTAL ASSET-BACKED SECURITIES
(cost $297,792,225) | | | | 296,032,813 | |
| | | | | | | | | | | | | | | | |
| | | |
| BANK LOANS — 1.1% | | | | | | | | | | | | | |
Airlines — 0.0% | | | | | | | | | | | | | |
United Airlines, Inc., | | | | | | | | | | | | | |
Class B Term Loan, 3 Month LIBOR + 3.750% | |
4.500%(c) | | | 04/21/28 | | | | | | | | 335 | | | | 335,791 | |
| | | | | | | | | | | | | | | | |
Chemicals — 0.0% | | | | | | | | | | | | | |
Axalta Coating Systems U.S. Holdings, Inc., | |
Term B-3 Dollar Loan, 3 Month LIBOR + 1.750% | |
1.974%(c) | | | 06/01/24 | | | | | | | | 346 | | | | 345,446 | |
Starfruit Finco BV (Netherlands), | | | | | | | | | | | | | |
Initial Dollar Term Loan, 1 Month LIBOR + 3.000% | |
3.102%(c) | | | 10/01/25 | | | | | | | | 156 | | | | 155,296 | |
| | | | | | | | | | | | | | | | |
| | | | |
| | | | | | | | | | | | | | | 500,742 | |
| | | | | | | | | | | | | | | | |
Commercial Services — 0.1% | | | | | | | | | | | | | |
Adtalem Global Education, Inc., | |
Term B Loan, 3 Month LIBOR + 4.500% | |
5.250%(c) | | | 08/12/28 | | | | | | | | 650 | | | | 650,948 | |
| | | | | | | | | | | | | | | | |
Computers — 0.1% | | | | | | | | | | | | | |
McAfee LLC, | |
Term B USD Loan, 1 Month LIBOR + 3.750% | |
3.852%(c) | | | 09/30/24 | | | | | | | | 259 | | | | 259,152 | |
| | | | | | | | | | | | | | | | |
Peraton Corp., | |
First Lien Term B Loan, 1 Month LIBOR + 3.750% | |
4.500%(c) | | | 02/01/28 | | | | | | | | 769 | | | | 769,187 | |
| | | | | | | | | | | | | | | | |
| | | | |
| | | | | | | | | | | | | | | 1,028,339 | |
| | | | | | | | | | | | | | | | |
Insurance — 0.1% | | | | | | | | | | | | | |
AmWINS Group, Inc., | |
Term Loan, 1 Month LIBOR + 2.250% | |
3.000%(c) | | | 02/19/28 | | | | | | | | 182 | | | | 180,642 | |
Asurion LLC, | | | | | | | | | | | | | | | | |
New B-7 Term Loan, 1 Month LIBOR + 3.000% (original cost $464,598; purchased 02/23/21)(f) | |
3.104%(c) | | | 11/03/24 | | | | | | | | 465 | | | | 462,757 | |
New B-9 Term Loan, 1 Month LIBOR + 3.250% (original cost $347,375; purchased 02/10/21)(f) | |
3.354%(c) | | | 07/31/27 | | | | | | | | 347 | | | | 344,842 | |
| | | | | | | | | | | | | | | | |
| | | | |
| | | | | | | | | | | | | | | 988,241 | |
| | | | | | | | | | | | | | | | |
| | | | | | | | | | | | | | | | |
Interest
Rate | | Maturity
Date | | | | | | Principal
Amount
(000)# | | | Value | |
| | | | | | | | | | | | | | | | |
| |
| BANK LOANS (continued) | | | | | |
Machinery-Construction & Mining — 0.0% | |
Vertiv Group Corp., | |
Term B Loan, 1 Month LIBOR + 2.750% | |
2.844%(c) | | | 03/02/27 | | | | | | | | 247 | | | $ | 244,988 | |
| | | | | | | | | | | | | | | | |
Media — 0.1% | | | | | | | | | | | | | | | | |
CSC Holdings LLC, | |
2017 Refinancing Term Loan, 3 Month LIBOR + 2.250% | |
2.360%(c) | | | 07/17/25 | | | | | | | | 347 | | | | 341,456 | |
September 2019 Term Loan, 3 Month LIBOR + 2.500% | |
2.610%(c) | | | 04/15/27 | | | | | | | | 774 | | | | 763,770 | |
Diamond Sports Group LLC, | |
Term Loan, 3 Month LIBOR + 3.250% | |
3.340%(c) | | | 08/24/26 | | | | | | | | 497 | | | | 229,010 | |
iHeartCommunications, Inc., | |
New Term Loan, 1 Month LIBOR + 3.000% | |
3.104%(c) | | | 05/01/26 | | | | | | | | 314 | | | | 311,380 | |
| | | | | | | | | | | | | | | | |
| | | | |
| | | | | | | | | | | | | | | 1,645,616 | |
| | | | | | | | | | | | | | | | |
Oil & Gas — 0.0% | | | | | | | | | | | | | |
Ascent Resources Utica Holdings LLC, | |
Second Lien Term Loan, 3 Month LIBOR + 9.000% | |
10.000%(c) | | | 11/01/25 | | | | | | | | 388 | | | | 418,555 | |
| | | | | | | | | | | | | | | | |
Pharmaceuticals — 0.2% | | | | | | | | | | | | | |
Change Healthcare Holdings LLC, | |
Closing Date Term Loan, 1 - 3 Month LIBOR + 2.500% | |
3.500%(c) | | | 03/01/24 | | | | | | | | 1,885 | | | | 1,882,416 | |
| | | | | | | | | | | | | | | | |
Real Estate Investment Trusts (REITs) — 0.0% | |
Blackstone Mortgage Trust, Inc., | |
Term Loan, 1 Month LIBOR + 2.250% | |
2.354%(c) | | | 04/23/26^ | | | | | | | | 495 | | | | 488,750 | |
| | | | | | | | | | | | | | | | |
Retail — 0.3% | | | | | | | | | | | | | | | | |
EG Group Ltd. (United Kingdom), | |
Additional Second Lien Loan Facility, 3 Month EURIBOR + 7.000% (Cap N/A, Floor 0.000%) | |
7.000%(c) | | | 04/30/27 | | | | EUR | | | | 3,500 | | | | 3,987,241 | |
| | | | | | | | | | | | | | | | |
Software — 0.1% | |
Dun & Bradstreet Corp., | |
Term Loan B, 1 Month LIBOR + 3.250% | |
3.352%(c) | | | 02/06/26 | | | | | | | | 765 | | | | 761,878 | |
| | | | | | | | | | | | | | | | |
Telecommunications — 0.1% | |
CenturyLink, Inc., | |
Term B Loan, 1 Month LIBOR + 2.250% | |
2.354%(c) | | | 03/15/27 | | | | | | | | 401 | | | | 396,300 | |
Digicel International Finance Ltd. (Saint Lucia), | |
First Lien Initial Term B Loan, 1 - 6 Month LIBOR + 3.250% | |
3.500%(c) | | | 05/27/24 | | | | | | | | 990 | | | | 960,595 | |
| | | | | | | | | | | | | | | | |
| | | | |
| | | | | | | | | | | | | | | 1,356,895 | |
| | | | | | | | | | | | | | | | |
TOTAL BANK LOANS | | | | | | | | | | | | | |
(cost $14,555,972) | | | | | | | | | | | | 14,290,400 | |
| | | | | | | | | | | | | | | | |
|
| COMMERCIAL MORTGAGE-BACKED SECURITIES — 12.8% | |
Banc of America Commercial Mortgage Trust, | |
Series 2016-UB10, Class A3 | |
2.903% | | | 07/15/49 | | | | | | | | 1,283 | | | | 1,322,213 | |
SEE NOTES TO FINANCIAL STATEMENTS.
A100
| | | | | | |
| | |
| | PSF PGIM TOTAL RETURN BOND PORTFOLIO (CONTINUED) | | |
| | | | | | |
| |
| SCHEDULE OF INVESTMENTS | | as of December 31, 2021 |
| | | | | | | | | | | | | | |
Interest
Rate | | Maturity
Date | | | | | Principal
Amount
(000)# | | | Value | |
| | | | | | | | | | | | | | |
|
| COMMERCIAL MORTGAGE-BACKED SECURITIES (continued) | |
BANK, | |
Series 2017-BNK05, Class A4 | |
3.131% | | 06/15/60 | | | | | | | 4,400 | | | $ | 4,645,458 | |
Series 2017-BNK06, Class A4 | |
3.254% | | 07/15/60 | | | | | | | 920 | | | | 972,436 | |
Series 2017-BNK08, Class A3 | |
3.229% | | 11/15/50 | | | | | | | 1,950 | | | | 2,068,470 | |
Series 2019-BN18, Class A3 | |
3.325% | | 05/15/62 | | | | | | | 1,500 | | | | 1,606,467 | |
Series 2020-BN29, Class A3 | |
1.742% | | 11/15/53 | | | | | | | 1,000 | | | | 968,498 | |
Barclays Commercial Mortgage Securities Trust, | | | | | |
Series 2016-ETC, Class A, 144A | | | | | |
2.937% | | 08/14/36 | | | | | | | 1,170 | | | | 1,181,104 | |
Series 2016-ETC, Class B, 144A | |
3.189% | | 08/14/36 | | | | | | | 510 | | | | 504,724 | |
Series 2016-ETC, Class C, 144A | |
3.391% | | 08/14/36 | | | | | | | 430 | | | | 413,304 | |
Series 2016-ETC, Class D, 144A | |
3.609%(cc) | | 08/14/36 | | | | | | | 1,560 | | | | 1,454,055 | |
Benchmark Mortgage Trust, | | | | | | | | | | | | |
Series 2019-B09, Class A4 | | | | | | | | | | | | |
3.751% | | 03/15/52 | | | | | | | 3,400 | | | | 3,706,314 | |
Series 2020-B18, Class A4 | |
1.672% | | 07/15/53 | | | | | | | 2,900 | | | | 2,780,541 | |
Series 2020-B21, Class A4 | |
1.704% | | 12/17/53 | | | | | | | 1,000 | | | | 956,685 | |
BX Commercial Mortgage Trust, | | | | | | | | | | | | |
Series 2019-XL, Class G, 144A, 1 Month LIBOR + 2.300% (Cap N/A, Floor 2.300%) | |
2.410%(c) | | 10/15/36 | | | | | | | 1,360 | | | | 1,348,939 | |
Series 2020-BXLP, Class F, 144A, 1 Month LIBOR + 2.000% (Cap N/A, Floor 2.000%) | |
2.110%(c) | | 12/15/36 | | | | | | | 1,253 | | | | 1,242,377 | |
Series 2020-BXLP, Class G, 144A, 1 Month LIBOR + 2.500% (Cap N/A, Floor 2.500%) | |
2.610%(c) | | 12/15/36 | | | | | | | 3,485 | | | | 3,445,469 | |
Series 2021-ACNT, Class E, 144A, 1 Month LIBOR + 2.197% (Cap N/A, Floor 2.197%) | |
2.307%(c) | | 11/15/26 | | | | | | | 3,350 | | | | 3,335,242 | |
Cantor Commercial Real Estate Lending, | |
Series 2019-CF02, Class A3 | |
2.647% | | 11/15/52 | | | | | | | 7,700 | | | | 7,828,069 | |
CD Mortgage Trust, | |
Series 2017-CD05, Class A3 | |
3.171% | | 08/15/50 | | | | | | | 3,500 | | | | 3,665,768 | |
CFK Trust, | |
Series 2020-MF02, Class A, 144A | |
2.387% | | 03/15/39 | | | | | | | 6,550 | | | | 6,582,468 | |
CityLine Commercial Mortgage Trust, | |
Series 2016-CLNE, Class B, 144A | |
2.778%(cc) | | 11/10/31 | | | | | | | 2,400 | | | | 2,428,025 | |
Series 2016-CLNE, Class C, 144A | |
2.778%(cc) | | 11/10/31 | | | | | | | 900 | | | | 906,266 | |
| | | | | | | | | | | | | | |
Interest Rate | | Maturity
Date | | | | | Principal
Amount
(000)# | | | Value | |
| | | | | | | | | | | | | | |
|
| COMMERCIAL MORTGAGE-BACKED SECURITIES (continued) | |
Cold Storage Trust, | | | | | | | | | | | | |
Series 2020-ICE05, Class E, 144A, 1 Month LIBOR + 2.766% (Cap N/A, Floor 2.833%) | |
2.875%(c) | | 11/15/37 | | | | | | | 1,327 | | | $ | 1,321,975 | |
Commercial Mortgage Trust, | |
Series 2014-UBS04, Class A4 | |
3.420% | | 08/10/47 | | | | | | | 3,200 | | | | 3,296,347 | |
Series 2015-DC01, Class A4 | |
3.078% | | 02/10/48 | | | | | | | 5,000 | | | | 5,091,550 | |
Series 2016-COR01, Class A3 | |
2.826% | | 10/10/49 | | | | | | | 2,474 | | | | 2,538,493 | |
Series 2017-COR02, Class A2 | |
3.239% | | 09/10/50 | | | | | | | 4,500 | | | | 4,721,346 | |
Credit Suisse Mortgage Capital Certificates, | |
Series 2019-ICE04, Class E, 144A, 1 Month LIBOR + 2.150% (Cap N/A, Floor 2.150%) | |
2.260%(c) | | 05/15/36 | | | | | | | 2,600 | | | | 2,597,468 | |
CSAIL Commercial Mortgage Trust, | |
Series 2019-C16, Class A2 | |
3.067% | | 06/15/52 | | | | | | | 1,200 | | | | 1,243,155 | |
DBGS Mortgage Trust, | |
Series 2018-BIOD, Class G, 144A, 1 Month LIBOR + 2.500% (Cap N/A, Floor 2.500%) | |
2.602%(c) | | 05/15/35 | | | | | | | 3,037 | | | | 3,015,494 | |
DBWF Mortgage Trust, | |
Series 2016-85T, Class D, 144A | |
3.808%(cc) | | 12/10/36 | | | | | | | 1,400 | | | | 1,408,735 | |
Deutsche Bank Commercial Mortgage Trust, | |
Series 2017-C06, Class A4 | |
3.071% | | 06/10/50 | | | | | | | 2,800 | | | | 2,956,462 | |
Eleven Madison Mortgage Trust, | |
Series 2015-11MD, Class C, 144A | |
3.555%(cc) | | 09/10/35 | | | | | | | 3,000 | | | | 3,065,949 | |
FHLMC Multifamily Structured Pass-Through Certificates, | |
Series K020, Class X1, IO | |
1.333%(cc) | | 05/25/22 | | | | | | | 22,468 | | | | 43,431 | |
Series K021, Class X1, IO | |
1.376%(cc) | | 06/25/22 | | | | | | | 13,538 | | | | 10,591 | |
Series K025, Class X1, IO | |
0.778%(cc) | | 10/25/22 | | | | | | | 9,451 | | | | 46,415 | |
Series K027, Class X1, IO | |
0.715%(cc) | | 01/25/23 | | | | | | | 119,665 | | | | 687,425 | |
Series K044, Class X1, IO | |
0.708%(cc) | | 01/25/25 | | | | | | | 77,827 | | | | 1,320,896 | |
Series K053, Class X1, IO | |
0.880%(cc)
| | 12/25/25 | | | | | | | 86,343 | | | | 2,624,381 | |
Series K055, Class X1, IO | |
1.354%(cc) | | 03/25/26 | | | | | | | 13,342 | | | | 656,996 | |
Series KG03, Class X1, IO | |
1.381%(cc) | | 06/25/30 | | | | | | | 29,350 | | | | 2,909,527 | |
GS Mortgage Securities Trust, | |
Series 2015-GC30, Class A3 | |
3.119% | | 05/10/50 | | | | | | | 2,935 | | | | 3,043,017 | |
Series 2017-GS06, Class A2 | |
3.164% | | 05/10/50 | | | | | | | 3,354 | | | | 3,500,379 | |
Series 2019-GC38, Class A3 | |
3.703% | | 02/10/52 | | | | | | | 5,800 | | | | 6,303,547 | |
SEE NOTES TO FINANCIAL STATEMENTS.
A101
| | | | | | |
| | |
| | PSF PGIM TOTAL RETURN BOND PORTFOLIO (CONTINUED) | | |
| | | | | | |
| |
| SCHEDULE OF INVESTMENTS | | as of December 31, 2021 |
| | | | | | | | | | | | | | | | |
Interest Rate | | Maturity Date | | | | | | Principal Amount (000)# | | | Value | |
| | | | | | | | | | | | | | | | |
|
COMMERCIAL MORTGAGE-BACKED SECURITIES (continued) | |
IMT Trust, | | | | | | | | | | | | | | | | |
Series 2017-APTS, Class AFX, 144A | | | | | |
3.478% | | | 06/15/34 | | | | | | | | 310 | | | $ | 321,694 | |
JPMDB Commercial Mortgage Securities Trust, | | | | | |
Series 2016-C02, Class A3A | | | | | |
2.881% | | | 06/15/49 | | | | | | | | 1,070 | | | | 1,099,203 | |
Series 2017-C05, Class A4 | | | | | |
3.414% | | | 03/15/50 | | | | | | | | 1,893 | | | | 1,963,503 | |
Series 2017-C07, Class A4 | | | | | |
3.147% | | | 10/15/50 | | | | | | | | 3,600 | | | | 3,768,984 | |
JPMorgan Chase Commercial Mortgage Securities Trust, | |
Series 2016-JP02, Class A3 | | | | | |
2.559% | | | 08/15/49 | | | | | | | | 1,726 | | | | 1,762,543 | |
Series 2018-AON, Class E, 144A | | | | | |
4.613%(cc) | | | 07/05/31 | | | | | | | | 5,875 | | | | 5,961,805 | |
Morgan Stanley Bank of America Merrill Lynch Trust, | |
Series 2012-C05, Class XA, IO, 144A | | | | | |
1.336%(cc) | | | 08/15/45 | | | | | | | | 30,255 | | | | 74,642 | |
Series 2013-C08, Class A3 | | | | | |
2.863% | | | 12/15/48 | | | | | | | | 1,324 | | | | 1,332,967 | |
Series 2013-C10, Class A3 | | | | | |
3.960%(cc) | | | 07/15/46 | | | | | | | | 3,950 | | | | 4,052,915 | |
Morgan Stanley Capital I Trust, | | | | | | | | | | | | | |
Series 2017-H01, Class A4 | | | | | |
3.259% | | | 06/15/50 | | | | | | | | 2,750 | | | | 2,897,161 | |
Series 2017-HR02, Class A3 | | | | | |
3.330% | | | 12/15/50 | | | | | | | | 5,500 | | | | 5,838,905 | |
Series 2019-L03, Class A3 | | | | | |
2.874% | | | 11/15/52 | | | | | | | | 1,200 | | | | 1,248,913 | |
Series 2019-MEAD, Class E, 144A | | | | | |
3.177%(cc) | | | 11/10/36 | | | | | | | | 575 | | | | 547,297 | |
Shops at Crystals Trust, | | | | | | | | | | | | | |
Series 2016-CSTL, Class A, 144A | | | | | |
3.126% | | | 07/05/36 | | | | | | | | 140 | | | | 143,895 | |
UBS Commercial Mortgage Trust, | | | | | | | | | | | | | |
Series 2017-C02, Class A3 | | | | | |
3.225% | | | 08/15/50 | | | | | | | | 3,280 | | | | 3,416,432 | |
Series 2017-C07, Class A3 | | | | | |
3.418% | | | 12/15/50 | | | | | | | | 5,600 | | | | 5,938,186 | |
Series 2018-C10, Class A3 | | | | | |
4.048% | | | 05/15/51 | | | | | | | | 2,200 | | | | 2,408,333 | |
Series 2019-C17, Class A3 | | | | | |
2.669% | | | 10/15/52 | | | | | | | | 2,000 | | | | 2,063,843 | |
UBS-Barclays Commercial Mortgage Trust, | | | | | |
Series 2013-C05, Class A3 | | | | | |
2.920% | | | 03/10/46 | | | | | | | | 830 | | | | 837,591 | |
Wells Fargo Commercial Mortgage Trust, | | | | | |
Series 2014-LC16,Class A4 | | | | | |
3.548% | | | 08/15/50 | | | | | | | | 3,542 | | | | 3,616,446 | |
Series 2016-C32, Class A3 | | | | | |
3.294% | | | 01/15/59 | | | | | | | | 2,116 | | | | 2,208,035 | |
Series 2016-C34, Class A3 | | | | | |
2.834% | | | 06/15/49 | | | | | | | | 2,500 | | | | 2,557,343 | |
Series 2016-C35, Class A3 | | | | | |
2.674% | | | 07/15/48 | | | | | | | | 4,600 | | | | 4,705,364 | |
Series 2017-C40, Class A3 | | | | | |
3.317% | | | 10/15/50 | | | | | | | | 1,370 | | | | 1,450,259 | |
| | | | | | | | | | | | | | | | |
Interest Rate | | Maturity Date | | | | | | Principal Amount (000)# | | | Value | |
| | | | | | | | | | | | | | | | |
|
COMMERCIAL MORTGAGE-BACKED SECURITIES (continued) | |
Series 2019-C54, Class A3 | | | | | |
2.892% | | | 12/15/52 | | | | | | | | 1,200 | | | $ | 1,250,480 | |
| | | | | | | | | | | | | | | | |
TOTAL COMMERCIAL MORTGAGE-BACKED SECURITIES
(cost $163,136,780) | | | | 167,233,210 | |
| | | | | | | | | | | | | | | | |
| |
| CORPORATE BONDS — 38.1% | | | | | |
Aerospace & Defense — 0.9% | | | | | | | | | | | | | |
BAE Systems PLC (United Kingdom), | | | | | |
Sr. Unsec’d. Notes, 144A | | | | | |
1.900% | | | 02/15/31 | | | | | | | | 2,770 | | | | 2,631,625 | |
3.400% | | | 04/15/30 | | | | | | | | 385 | | | | 410,573 | |
Boeing Co. (The), | | | | | | | | | | | | | |
Sr. Unsec’d. Notes | | | | | | | | | |
3.950% | | | 08/01/59 | | | | | | | | 1,450 | | | | 1,507,026 | |
Bombardier, Inc. (Canada), | | | | | | | | | | | | | |
Sr. Unsec’d. Notes, 144A | | | | | | | | | |
7.500% | | | 12/01/24 | | | | | | | | 1,600 | | | | 1,662,375 | |
7.500% | | | 03/15/25 | | | | | | | | 1,525 | | | | 1,552,788 | |
7.875% | | | 04/15/27 | (a) | | | | | | | 2,575 | | | | 2,670,251 | |
Raytheon Technologies Corp., | | | | | | | | | |
Sr. Unsec’d. Notes | | | | | | | | | | | | | | | | |
4.125% | | | 11/16/28 | | | | | | | | 1,115 | | | | 1,247,758 | |
| | | | | | | | | | | | | | | | |
| | | | |
| | | | | | | | | | | | | | | 11,682,396 | |
| | | | | | | | | | | | | | | | |
Agriculture — 0.2% | | | | | | | | | | | | | |
BAT Capital Corp. (United Kingdom), | | | | | |
Gtd. Notes | | | | | | | | | | | | | | | | |
2.259% | | | 03/25/28 | | | | | | | | 1,530 | | | | 1,492,575 | |
3.557% | | | 08/15/27 | | | | | | | | 1,425 | | | | 1,495,817 | |
| | | | | | | | | | | | | | | | |
| | | | |
| | | | | | | | | | | | | | | 2,988,392 | |
| | | | | | | | | | | | | | | | |
Airlines — 0.5% | | | | | | | | | | | | | |
American Airlines 2016-1 Class AA Pass-Through Trust, | |
Pass-Through Certificates | | | | | | | | | |
3.575% | | | 07/15/29 | | | | | | | | 1,398 | | | | 1,419,586 | |
Continental Airlines 2007-1 Class A Pass-Through Trust, | |
Pass-Through Certificates | | | | | | | | | |
5.983% | | | 10/19/23 | | | | | | | | 278 | | | | 281,054 | |
Southwest Airlines Co., | | | | | | | | | | | | | |
Sr. Unsec’d. Notes | | | | | | | | | |
5.125% | | | 06/15/27 | | | | | | | | 3,255 | | | | 3,725,618 | |
United Airlines 2007-1 Class A Pass-Through Trust, | |
Pass-Through Certificates | | | | | | | | | |
6.636% | | | 01/02/24 | | | | | | | | 362 | | | | 365,890 | |
United Airlines, Inc., | | | | | | | | | | | | | |
Sr. Sec’d. Notes, 144A | | | | | | | | | | | | | |
4.375% | | | 04/15/26 | | | | | | | | 815 | | | | 850,369 | |
4.625% | | | 04/15/29 | | | | | | | | 190 | | | | 197,060 | |
| | | | | | | | | | | | | | | | |
| | | | |
| | | | | | | | | | | | | | | 6,839,577 | |
| | | | | | | | | | | | | | | | |
Auto Manufacturers — 0.9% | | | | | | | | | | | | | |
Ford Motor Co., | | | | | | | | | | | | | | | | |
Sr. Unsec’d. Notes | | | | | | | | | | | | | | | | |
4.750% | | | 01/15/43 | | | | | | | | 1,125 | | | | 1,243,342 | |
5.291% | | | 12/08/46 | | | | | | | | 290 | | | | 340,230 | |
SEE NOTES TO FINANCIAL STATEMENTS.
A102
| | | | | | |
| | |
| | PSF PGIM TOTAL RETURN BOND PORTFOLIO (CONTINUED) | | |
| | | | | | |
| |
| SCHEDULE OF INVESTMENTS | | as of December 31, 2021 |
| | | | | | | | | | | | | | | | |
Interest Rate | | Maturity Date | | | | | | Principal Amount (000)# | | | Value | |
| | | | | | | | | | | | | | | | |
| |
| CORPORATE BONDS (continued) | | | | | |
Auto Manufacturers (cont’d.) | | | | | | | | | | | | | |
Ford Motor Credit Co. LLC, | | | | | | | | | | | | | |
Sr. Unsec’d. Notes | | | | | | | | | | | | | |
2.900% | | | 02/16/28 | | | | | | | | 275 | | | $ | 276,298 | |
3.350% | | | 11/01/22 | | | | | | | | 2,600 | | | | 2,635,415 | |
General Motors Co., | | | | | | | | | | | | | |
Sr. Unsec’d. Notes | | | | | | | | | | | | | |
4.875% | | | 10/02/23 | | | | | | | | 1,350 | | | | 1,434,154 | |
5.000% | | | 04/01/35 | | | | | | | | 1,365 | | | | 1,621,129 | |
5.150% | | | 04/01/38 | | | | | | | | 1,000 | | | | 1,203,627 | |
6.250% | | | 10/02/43 | | | | | | | | 1,455 | | | | 1,990,105 | |
6.600% | | | 04/01/36 | | | | | | | | 210 | | | | 283,565 | |
General Motors Financial Co., Inc., | |
Sr. Unsec’d. Notes | | | | | | | | | | | | | |
2.400% | | | 04/10/28 | | | | | | | | 1,025 | | | | 1,024,966 | |
| | | | | | | | | | | | | | | | |
| | | | |
| | | | | | | | | | | | | | | 12,052,831 | |
| | | | | | | | | | | | | | | | |
Auto Parts & Equipment — 0.2% | |
American Axle & Manufacturing, Inc., | |
Gtd. Notes | | | | | | | | | | | | | | | | |
6.500% | | | 04/01/27 | (a) | | | | | | | 670 | | | | 697,318 | |
Cooper-Standard Automotive, Inc., | |
Gtd. Notes, 144A | | | | | | | | | | | | | |
5.625% | | | 11/15/26 | (a) | | | | | | | 1,150 | | | | 948,034 | |
Dana Financing Luxembourg Sarl, | |
Gtd. Notes, 144A | | | | | | | | | | | | | |
5.750% | | | 04/15/25 | | | | | | | | 875 | | | | 897,962 | |
Dana, Inc., | | | | | | | | | | | | | | | | |
Sr. Unsec’d. Notes | | | | | | | | | | | | | |
5.375% | | | 11/15/27 | | | | | | | | 350 | | | | 367,494 | |
| | | | | | | | | | | | | | | | |
| | | | |
| | | | | | | | | | | | | | | 2,910,808 | |
| | | | | | | | | | | | | | | | |
Banks — 10.1% | | | | | | | | | | | | | | | | |
Banco Santander SA (Spain), | | | | | | | | | | | | | |
Sr. Unsec’d. Notes, 3 Month LIBOR + 1.120% | | | | | |
1.241%(c) | | | 04/12/23 | | | | | | | | 400 | | | | 404,004 | |
Sr. Unsec’d. Notes | | | | | | | | | | | | | |
1.849% | | | 03/25/26 | | | | | | | | 600 | | | | 596,608 | |
Sub. Notes | | | | | | | | | | | | | | | | |
2.749% | | | 12/03/30 | (a) | | | | | | | 1,000 | | | | 977,954 | |
Bank of America Corp., | | | | | | | | | | | | | |
Jr. Sub. Notes, Series JJ | | | | | | | | | | | | | |
5.125%(ff) | | | 06/20/24 | (oo) | | | | | | | 1,655 | | | | 1,724,494 | |
Jr. Sub. Notes, Series MM | | | | | | | | | | | | | |
4.300%(ff) | | | 01/28/25 | (oo) | | | | | | | 1,575 | | | | 1,597,251 | |
Sr. Unsec’d. Notes | | | | | | | | | | | | | |
2.687%(ff) | | | 04/22/32 | | | | | | | | 2,535 | | | | 2,574,923 | |
Sr. Unsec’d. Notes, GMTN | | | | | | | | | | | | | |
3.593%(ff) | | | 07/21/28 | (a) | | | | | | | 740 | | | | 796,485 | |
Sr. Unsec’d. Notes, MTN | | | | | | | | | | | | | |
3.824%(ff) | | | 01/20/28 | | | | | | | | 3,185 | | | | 3,451,427 | |
3.974%(ff) | | | 02/07/30 | | | | | | | | 685 | | | | 755,502 | |
4.078%(ff) | | | 04/23/40 | | | | | | | | 2,340 | | | | 2,683,981 | |
4.271%(ff) | | | 07/23/29 | | | | | | | | 910 | | | | 1,014,452 | |
Sr. Unsec’d. Notes, Series N | | | | | | | | | | | | | |
2.651%(ff) | | | 03/11/32 | | | | | | | | 5,020 | | | | 5,084,274 | |
Sub. Notes, MTN | | | | | | | | | | | | | |
4.000% | | | 01/22/25 | | | | | | | | 1,117 | | | | 1,194,484 | |
| | | | | | | | | | | | | | | | |
Interest Rate | | Maturity Date | | | | | | Principal Amount (000)# | | | Value | |
| | | | | | | | | | | | | | | | |
| |
| CORPORATE BONDS (continued) | | | | | |
Banks (cont’d.) | | | | | | | | | | | | | |
4.450% | | | 03/03/26 | | | | | | | | 1,735 | | | $ | 1,911,852 | |
Barclays PLC (United Kingdom), | | | | | | | | | | | | | |
Sr. Unsec’d. Notes | | | | | | | | | |
3.650% | | | 03/16/25 | | | | | | | | 700 | | | | 740,138 | |
3.932%(ff) | | | 05/07/25 | | | | | | | | 480 | | | | 505,218 | |
Sr. Unsec’d. Notes, MTN | | | | | |
4.972%(ff) | | | 05/16/29 | | | | | | | | 475 | | | | 543,528 | |
Sub. Notes | | | | | | | | | | | | | | | | |
4.836% | | | 05/09/28 | | | | | | | | 720 | | | | 791,503 | |
BNP Paribas SA (France), | | | | | | | | | | | | | |
Sr. Unsec’d. Notes, 144A | | | | | | | | | | | | | |
1.323%(ff) | | | 01/13/27 | | | | | | | | 710 | | | | 690,810 | |
1.904%(ff) | | | 09/30/28 | | | | | | | | 2,200 | | | | 2,151,331 | |
2.871%(ff) | | | 04/19/32 | | | | | | | | 1,815 | | | | 1,838,788 | |
3.375% | | | 01/09/25 | | | | | | | | 855 | | | | 898,962 | |
BPCE SA (France), | | | | | | | | | | | | | |
Sr. Unsec’d. Notes, 144A, MTN | |
3.500% | | | 10/23/27 | | | | | | | | 300 | | | | 317,370 | |
Sub. Notes, 144A, MTN | | | | | |
4.500% | | | 03/15/25 | | | | | | | | 1,120 | | | | 1,207,165 | |
4.875% | | | 04/01/26 | (a) | | | | | | | 380 | | | | 419,773 | |
Citigroup, Inc., | | | | | | | | | | | | | | | | |
Jr. Sub. Notes | | | | | |
3.875%(ff) | | | 02/18/26 | (oo) | | | | | | | 1,880 | | | | 1,881,776 | |
Jr. Sub. Notes, Series V | | | | | |
4.700%(ff) | | | 01/30/25 | (oo) | | | | | | | 1,435 | | | | 1,459,143 | |
Jr. Sub. Notes, Series W | | | | | |
4.000%(ff) | | | 12/10/25 | (oo) | | | | | | | 880 | | | | 885,801 | |
Sr. Unsec’d. Notes | | | | | |
2.561%(ff) | | | 05/01/32 | | | | | | | | 2,000 | | | | 2,011,406 | |
2.666%(ff) | | | 01/29/31 | | | | | | | | 1,225 | | | | 1,243,831 | |
3.200% | | | 10/21/26 | | | | | | | | 3,255 | | | | 3,450,234 | |
3.887%(ff) | | | 01/10/28 | | | | | | | | 1,710 | | | | 1,854,157 | |
8.125% | | | 07/15/39 | (a) | | | | | | | 580 | | | | 984,091 | |
Sub. Notes | | | | | |
4.450% | | | 09/29/27 | | | | | | | | 2,630 | | | | 2,932,470 | |
Credit Suisse Group AG (Switzerland), | |
Sr. Unsec’d. Notes, 144A | |
3.091%(ff) | | | 05/14/32 | | | | | | | | 1,695 | | | | 1,723,122 | |
Deutsche Bank AG (Germany), | |
Sr. Unsec’d. Notes, MTN | |
3.700% | | | 05/30/24 | | | | | | | | 159 | | | | 166,789 | |
Sr. Unsec’d. Notes, Series D | |
5.000% | | | 02/14/22 | | | | | | | | 1,350 | | | | 1,356,136 | |
Discover Bank, | | | | | | | | | | | | | | | | |
Sr. Unsec’d. Notes | |
3.450% | | | 07/27/26 | | | | | | | | 280 | | | | 296,614 | |
4.250% | | | 03/13/26 | (a) | | | | | | | 1,150 | | | | 1,255,918 | |
Goldman Sachs Group, Inc. (The), | |
Jr. Sub. Notes, Series U | |
3.650%(ff) | | | 08/10/26 | (oo) | | | | | | | 950 | | | | 939,585 | |
Sr. Unsec’d. Notes | |
2.383%(ff) | | | 07/21/32 | | | | | | | | 1,460 | | | | 1,437,679 | |
2.615%(ff) | | | 04/22/32 | | | | | | | | 4,695 | | | | 4,718,861 | |
3.272%(ff) | | | 09/29/25 | | | | | | | | 4,063 | | | | 4,261,955 | |
3.750% | | | 02/25/26 | | | | | | | | 125 | | | | 134,496 | |
3.814%(ff) | | | 04/23/29 | | | | | | | | 1,060 | | | | 1,153,718 | |
SEE NOTES TO FINANCIAL STATEMENTS.
A103
| | | | | | |
| | |
| | PSF PGIM TOTAL RETURN BOND PORTFOLIO (CONTINUED) | | |
| | | | | | |
| |
| SCHEDULE OF INVESTMENTS | | as of December 31, 2021 |
| | | | | | | | | | | | | | | | |
Interest Rate | | Maturity
Date | | | | | | Principal
Amount
(000)# �� | | | Value | |
| | | | | | | | | | | | | | | | |
| CORPORATE BONDS (continued) | | | | | |
Banks (cont’d.) | | | | | | | | | | | | | |
3.850% | | | 01/26/27 | | | | | | | | 1,765 | | | $ | 1,900,304 | |
HSBC Holdings PLC (United Kingdom), | |
Sr. Unsec’d. Notes | |
4.583%(ff) | | | 06/19/29 | | | | | | | | 1,000 | | | | 1,120,318 | |
JPMorgan Chase & Co., | |
Jr. Sub. Notes, Series FF | |
5.000%(ff) | | | 08/01/24 | (oo) | | | | | | | 1,000 | | | | 1,031,910 | |
Jr. Sub. Notes, Series HH | |
4.600%(ff) | | | 02/01/25 | (oo) | | | | | | | 1,940 | | | | 1,983,031 | |
Jr. Sub. Notes, Series I, 3 Month LIBOR +3.470% | |
3.599%(c) | | | 04/30/22 | (oo) | | | | | | | 2,998 | | | | 3,005,894 | |
Jr. Sub. Notes, Series II | |
4.000%(ff) | | | 04/01/25 | (a)(oo) | | | | | | | 1,350 | | | | 1,357,753 | |
Jr. Sub. Notes, Series KK | |
3.650%(ff) | | | 06/01/26 | (oo) | | | | | | | 1,850 | | | | 1,855,120 | |
Sr. Unsec’d. Notes | |
2.525%(ff) | | | 11/19/41 | | | | | | | | 2,330 | | | | 2,217,677 | |
2.545%(ff) | | | 11/08/32 | | | | | | | | 1,135 | | | | 1,142,689 | |
2.580%(ff) | | | 04/22/32 | | | | | | | | 1,735 | | | | 1,756,618 | |
2.950% | | | 10/01/26 | | | | | | | | 1,740 | | | | 1,837,752 | |
3.200% | | | 06/15/26 | (a) | | | | | | | 3,020 | | | | 3,206,527 | |
3.509%(ff) | | | 01/23/29 | | | | | | | | 1,435 | | | | 1,538,941 | |
3.782%(ff) | | | 02/01/28 | | | | | | | | 965 | | | | 1,045,431 | |
3.964%(ff) | | | 11/15/48 | | | | | | | | 985 | | | | 1,153,187 | |
4.005%(ff) | | | 04/23/29 | | | | | | | | 1,200 | | | | 1,325,760 | |
Sub. Notes | | | | | | | | | | | | | |
4.250% | | | 10/01/27 | | | | | | | | 420 | | | | 470,391 | |
Morgan Stanley, | |
Jr. Sub. Notes, Series H, 3 Month LIBOR +3.610% | |
3.734%(c) | | | 01/18/22 | (a)(oo) | | | | | | | 975 | | | | 975,361 | |
Sr. Unsec’d. Notes, GMTN | |
2.239%(ff) | | | 07/21/32 | | | | | | | | 4,270 | | | | 4,183,467 | |
3.772%(ff) | | | 01/24/29 | | | | | | | | 1,875 | | | | 2,041,580 | |
4.431%(ff) | | | 01/23/30 | | | | | | | | 1,340 | | | | 1,525,895 | |
Sr. Unsec’d. Notes, MTN | |
1.794%(ff) | | | 02/13/32 | | | | | | | | 915 | | | | 867,064 | |
2.511%(ff) | | | 10/20/32 | | | | | | | | 1,590 | | | | 1,588,459 | |
3.125% | | | 07/27/26 | | | | | | | | 2,725 | | | | 2,888,860 | |
Sub. Notes, GMTN | |
4.350% | | | 09/08/26 | | | | | | | | 750 | | | | 830,717 | |
State Street Corp., | | | | | | | | | | | | | |
Sub. Notes | |
2.200% | | | 03/03/31 | (a) | | | | | | | 4,130 | | | | 4,116,584 | |
Texas Capital Bank NA, | |
Sr. Unsec’d. Notes, 144A, 3 Month LIBOR +4.500% | |
4.724%(c) | | | 09/30/24 | | | | | | | | 3,340 | | | | 3,344,184 | |
UBS Group AG (Switzerland), | |
Sr. Unsec’d. Notes, 144A | |
2.859%(ff) | | | 08/15/23 | | | | | | | | 1,100 | | | | 1,113,103 | |
3.491% | | | 05/23/23 | | | | | | | | 2,970 | | | | 3,000,578 | |
UniCredit SpA (Italy), | | | | | | | | | | | | | |
Sr. Unsec’d. Notes, 144A | |
2.569%(ff) | | | 09/22/26 | | | | | | | | 685 | | | | 685,748 | |
3.127%(ff) | | | 06/03/32 | | | | | | | | 1,225 | | | | 1,209,608 | |
Wells Fargo &Co., | |
Sr. Unsec’d. Notes | |
3.068%(ff) | | | 04/30/41 | | | | | | | | 2,675 | | | | 2,736,729 | |
| | | | | | | | | | | | | | | | |
| Interest Rate | | Maturity
Date | | | | | | Principal
Amount
(000)# | | | Value | |
| | | | | | | | | | | | | | | | |
| CORPORATE BONDS (continued) | | | | | |
Banks (cont’d.) | | | | | | | | | | | | | |
Sr. Unsec’d. Notes, MTN | |
2.572%(ff) | | | 02/11/31 | | | | | | | | 3,500 | | | $ | 3,572,474 | |
| | | | | | | | | | | | | | | | |
| | | | |
| | | | | | | | | | | | | | | 131,649,773 | |
| | | | | | | | | | | | | | | | |
Beverages — 0.3% | | | | | | | | | | | | | |
Anheuser-Busch Cos. LLC/Anheuser-Busch InBev Worldwide, Inc. (Belgium), | |
Gtd. Notes | |
4.900% | | | 02/01/46 | | | | | | | | 1,880 | | | | 2,381,346 | |
Anheuser-Busch InBev Worldwide, Inc. (Belgium), | |
Gtd. Notes | |
5.550% | | | 01/23/49 | | | | | | | | 1,440 | | | | 1,991,679 | |
| | | | | | | | | | | | | | | | |
| | | | |
| | | | | | | | | | | | | | | 4,373,025 | |
| | | | | | | | | | | | | | | | |
Building Materials — 0.2% | |
Masco Corp., | |
Sr. Unsec’d. Notes | |
2.000% | | | 10/01/30 | | | | | | | | 925 | | | | 886,768 | |
Masonite International Corp., | |
Gtd. Notes, 144A | |
5.375% | | | 02/01/28 | (a) | | | | | | | 525 | | | | 551,618 | |
SRM Escrow Issuer LLC, | |
Sr. Sec’d. Notes, 144A | |
6.000% | | | 11/01/28 | (a) | | | | | | | 1,275 | | | | 1,360,929 | |
| | | | | | | | | | | | | | | | |
| | | | |
| | | | | | | | | | | | | | | 2,799,315 | |
| | | | | | | | | | | | | | | | |
Chemicals — 1.2% | | | | | | | | | | | | | |
Ashland LLC, | |
Gtd. Notes | |
6.875% | | | 05/15/43 | (a) | | | | | | | 1,400 | | | | 1,799,690 | |
Ashland Services BV, | |
Gtd. Notes | |
2.000% | | | 01/30/28 | | | | | | | EUR | 1,600 | | | | 1,853,558 | |
CF Industries, Inc., | |
Gtd. Notes | |
4.950% | | | 06/01/43 | | | | | | | | 675 | | | | 812,373 | |
5.375% | | | 03/15/44 | | | | | | | | 700 | | | | 883,574 | |
INEOS Quattro Finance 2 PLC (United Kingdom), | |
Sr. Sec’d. Notes, 144A | |
2.500% | | | 01/15/26 | | | | | | | EUR | 2,300 | | | | 2,602,996 | |
LYB International Finance BV, | |
Gtd. Notes | |
5.250% | | | 07/15/43 | | | | | | | | 1,000 | | | | 1,284,011 | |
Mosaic Co. (The), | |
Sr. Unsec’d. Notes | |
5.625% | | | 11/15/43 | | | | | | | | 155 | | | | 206,080 | |
NOVA Chemicals Corp. (Canada), | |
Sr. Unsec’d. Notes, 144A | |
4.875% | | | 06/01/24 | | | | | | | | 1,150 | | | | 1,192,527 | |
Nutrien Ltd. (Canada), | |
Sr. Unsec’d. Notes | |
4.900% | | | 06/01/43 | | | | | | | | 870 | | | | 1,105,976 | |
5.250% | | | 01/15/45 | | | | | | | | 305 | | | | 409,755 | |
Sasol Financing International Ltd. (South Africa), | |
Gtd. Notes | |
4.500% | | | 11/14/22 | | | | | | | | 1,525 | | | | 1,542,693 | |
SEE NOTES TO FINANCIAL STATEMENTS.
A104
| | | | | | |
| | |
| | PSF PGIM TOTAL RETURN BOND PORTFOLIO (CONTINUED) | | |
| | | | | | |
| |
| SCHEDULE OF INVESTMENTS | | as of December 31, 2021 |
| | | | | | | | | | | | | | | | |
| | | | | | | | | Principal | | | | |
| Interest | | Maturity | | | | | | Amount | | | | |
| Rate | | Date | | | | | | (000)# | | | Value | |
| | | | | | | | | | | | | | | | |
| |
| CORPORATE BONDS (continued) | | | | | |
Chemicals (cont’d.) | | | | | | | | | |
Sasol Financing USA LLC (South Africa), | | | | | |
Gtd. Notes | | | | | | | | | |
4.375% | | | 09/18/26 | | | | | | | | 460 | | | $ | 463,386 | |
5.875% | | | 03/27/24 | | | | | | | | 375 | | | | 390,520 | |
Sherwin-Williams Co. (The), | | | | | | | | | |
Sr. Unsec’d. Notes | | | | | | | | | |
3.450% | | | 08/01/25 | | | | | | | | 445 | | | | 473,643 | |
TPC Group, Inc., | | | | | |
Sr. Sec’d. Notes, 144A (original cost $ 450,000; purchased 07/19/19)(f) | |
10.500% | | | 08/01/24 | | | | | | | | 450 | | | | 325,876 | |
Sr. Sec’d. Notes, 144A (original cost $ 108,716; purchased 02/01/21)(f) | |
10.875% | | | 08/01/24 | | | | | | | | 111 | | | | 117,733 | |
| | | | | | | | | | | | | | | | |
| | | | |
| | | | | | | | | | | | | | | 15,464,391 | |
| | | | | | | | | | | | | | | | |
Commercial Services — 0.9% | | | | | |
Allied Universal Holdco LLC/Allied Universal Finance Corp./Atlas Luxco 4 Sarl, | |
Sr. Sec’d. Notes, 144A | | | | | |
4.625% | | | 06/01/28 | | | | | | | | 1,300 | | | | 1,276,176 | |
ERAC USA Finance LLC, | | | | | |
Gtd. Notes, 144A | | | | | | | | | |
6.700% | | | 06/01/34 | | | | | | | | 920 | | | | 1,275,187 | |
7.000% | | | 10/15/37 | | | | | | | | 770 | | | | 1,135,986 | |
Gartner, Inc., | | | | | | | | | |
Gtd. Notes, 144A | | | | | | | | | |
4.500% | | | 07/01/28 | (a) | | | | | | | 230 | | | | 240,216 | |
Loxam SAS (France), | | | | | |
Sr. Sub. Notes | | | | | | | | | |
4.500% | | | 04/15/27 | | | | | | | EUR | 1,650 | | | | 1,876,272 | |
Nexi SpA (Italy), | | | | | | | | | |
Sr. Unsec’d. Notes | | | | | | | | | |
2.125% | | | 04/30/29 | | | | | | | EUR | 2,640 | | | | 2,950,449 | |
United Rentals North America, Inc., | | | | | | | | | |
Gtd. Notes | | | | | | | | | |
3.750% | | | 01/15/32 | | | | | | | | 50 | | | | 50,396 | |
3.875% | | | 02/15/31 | | | | | | | | 200 | | | | 203,108 | |
4.875% | | | 01/15/28 | | | | | | | | 1,325 | | | | 1,392,262 | |
5.250% | | | 01/15/30 | (a) | | | | | | | 525 | | | | 568,370 | |
5.500% | | | 05/15/27 | (a) | | | | | | | 975 | | | | 1,013,552 | |
| | | | | | | | | | | | | | | | |
| | | | |
| | | | | | | | | | | | | | | 11,981,974 | |
| | | | | | | | | | | | | | | | |
Diversified Financial Services — 0.3% | | | | | |
Jefferies Group LLC, | | | | | | | | | |
Sr. Unsec’d. Notes | | | | | | | | | |
6.500% | | | 01/20/43 | | | | | | | | 555 | | | | 769,610 | |
Nationstar Mortgage Holdings, Inc., | | | | | |
Gtd. Notes, 144A | | | | | | | | | |
5.500% | | | 08/15/28 | | | | | | | | 880 | | | | 905,132 | |
6.000% | | | 01/15/27 | | | | | | | | 275 | | | | 286,238 | |
Nomura Holdings, Inc. (Japan), | | | | | |
Sr. Unsec’d. Notes | | | | | | | | | |
2.608% | | | 07/14/31 | | | | | | | | 515 | | | | 507,703 | |
OneMain Finance Corp., | | | | | |
Gtd. Notes | | | | | | | | | |
5.375% | | | 11/15/29 | (a) | | | | | | | 1,125 | | | | 1,223,292 | |
| | | | | | | | | | | | | | | | |
| | | | | | | | | Principal | | | | |
| Interest | | Maturity | | | | | | Amount | | | | |
| Rate | | Date | | | | | | (000)# | | | Value | |
| | | | | | | | | | | | | | | | |
| |
| CORPORATE BONDS (continued) | | | | | |
Diversified Financial Services (cont’d.) | | | | | |
Power Finance Corp. Ltd. (India), | | | | | |
Sr. Unsec’d. Notes, 144A, MTN | | | | | | | | | |
6.150% | | | 12/06/28 | (a) | | | | | | | 400 | | | $ | 472,454 | |
| | | | | | | | | | | | | | | | |
| | | | |
| | | | | | | | | | | | | | | 4,164,429 | |
| | | | | | | | | | | | | | | | |
Electric — 2.6% | | | | | | | | | |
Baltimore Gas & Electric Co., | |
Sr. Unsec’d. Notes | |
3.350% | | | 07/01/23 | | | | | | | | 550 | | | | 566,715 | |
Calpine Corp., | | | | | | | | | |
Sr. Unsec’d. Notes, 144A | | | | | | | | | | | | | |
4.625% | | | 02/01/29 | | | | | | | | 600 | | | | 594,838 | |
5.000% | | | 02/01/31 | (a) | | | | | | | 750 | | | | 757,285 | |
5.125% | | | 03/15/28 | | | | | | | | 1,700 | | | | 1,727,397 | |
Consolidated Edison Co. of New York, Inc., | | | | | |
Sr. Unsec’d. Notes, Series C | | | | | | | | | |
4.300% | | | 12/01/56 | | | | | | | | 235 | | | | 279,947 | |
Dominion Energy South Carolina, Inc., | | | | | |
First Mortgage | | | | | | | | | |
4.600% | | | 06/15/43 | | | | | | | | 2,025 | | | | 2,476,555 | |
El Paso Electric Co., | |
Sr. Unsec’d. Notes | | | | | | | | | | | | | |
6.000% | | | 05/15/35 | | | | | | | | 2,325 | | | | 3,044,490 | |
Eskom Holdings SOC Ltd. (South Africa), | | | | | |
Sr. Unsec’d. Notes, 144A | | | | | | | | | | | | | |
7.125% | | | 02/11/25 | | | | | | | | 390 | | | | 403,141 | |
FirstEnergy Transmission LLC, | |
Sr. Unsec’d. Notes, 144A | | | | | | | | | | | | | |
4.350% | | | 01/15/25 | (a) | | | | | | | 3,750 | | | | 4,001,386 | |
5.450% | | | 07/15/44 | | | | | | | | 280 | | | | 351,780 | |
Iberdrola International BV (Spain), | | | | | |
Gtd. Notes | | | | | | | | | |
6.750% | | | 09/15/33 | | | | | | | | 1,150 | | | | 1,558,527 | |
Israel Electric Corp. Ltd. (Israel), | | | | | |
Sr. Sec’d. Notes, 144A, GMTN | |
4.250% | | | 08/14/28 | | | | | | | | 680 | | | | 747,191 | |
Kentucky Utilities Co., | | | | | | | | | | | | | |
First Mortgage | | | | | | | | | |
4.375% | | | 10/01/45 | | | | | | | | 3,050 | | | | 3,633,428 | |
Narragansett Electric Co. (The), | | | | | |
Sr. Unsec’d. Notes, 144A | |
3.395% | | | 04/09/30 | | | | | | | | 1,050 | | | | 1,121,360 | |
NRG Energy, Inc., | | | | | | | | | | | | | |
Gtd. Notes, 144A | | | | | | | | | | | | | |
3.875% | | | 02/15/32 | | | | | | | | 425 | | | | 418,045 | |
5.250% | | | 06/15/29 | (a) | | | | | | | 375 | | | | 401,483 | |
Sr. Sec’d. Notes, 144A | | | | | | | | | | | | | |
2.000% | | | 12/02/25 | | | | | | | | 280 | | | | 281,927 | |
2.450% | | | 12/02/27 | | | | | | | | 1,210 | | | | 1,200,502 | |
Pacific Gas & Electric Co., | |
First Mortgage | | | | | | | | | |
4.550% | | | 07/01/30 | | | | | | | | 1,670 | | | | 1,811,379 | |
PacifiCorp, | | | | | | | | | | | | | | | | |
First Mortgage | | | | | | | | | |
3.300% | | | 03/15/51 | | | | | | | | 380 | | | | 397,577 | |
SEE NOTES TO FINANCIAL STATEMENTS.
A105
| | | | | | |
| | |
| | PSF PGIM TOTAL RETURN BOND PORTFOLIO (CONTINUED) | | |
| | | | | | |
| |
| SCHEDULE OF INVESTMENTS | | as of December 31, 2021 |
| | | | | | | | | | | | | | |
| | | | | | | | Principal | | | | |
| Interest | | Maturity | | | | | Amount | | | | |
| Rate | | Date | | | | | (000)# | | | Value | |
| | | | | | | | | | | | | | |
|
| CORPORATE BONDS (continued) | |
Electric (cont’d.) | |
Perusahaan Listrik Negara PT (Indonesia), | |
Sr. Unsec’d. Notes, 144A | | | | | | | | | | | |
1.875% | | | 11/05/31 | | | | | EUR | 324 | | | $ | 354,487 | |
Tucson Electric Power Co., | | | | | | | | | | | |
Sr. Unsec’d. Notes | |
4.000% | | | 06/15/50 | | | | | | 1,500 | | | | 1,746,547 | |
Vistra Corp., | | | | | | | | | | | |
Jr. Sub. Notes, 144A | | | | | | | | | | | |
7.000%(ff) | | | 12/15/26 | (oo) | | | | | 625 | | | | 634,117 | |
8.000%(ff) | | | 10/15/26 | (oo) | | | | | 2,075 | | | | 2,194,984 | |
Vistra Operations Co. LLC, | | | | | | | | | | | |
Gtd. Notes, 144A | | | | | | | | | | | |
5.000% | | | 07/31/27 | | | | | | 450 | | | | 467,141 | |
5.625% | | | 02/15/27 | | | | | | 600 | | | | 620,389 | |
Sr. Sec’d. Notes, 144A | | | | | | | | |
3.700% | | | 01/30/27 | | | | | | 2,000 | | | | 2,078,459 | |
| | | | | | | | | | | | | | |
| | | | |
| | | | | | | | | | | | | 33,871,077 | |
| | | | | | | | | | | | | | |
Electrical Components & Equipment — 0.1% | | | | | |
WESCO Distribution, Inc., | | | | | | | | | | | |
Gtd. Notes, 144A | | | | | | | | |
7.125% | | | 06/15/25 | | | | | | 575 | | | | 608,980 | |
7.250% | | | 06/15/28 | | | | | | 550 | | | | 604,737 | |
| | | | | | | | | | | | | | |
| | | | |
| | | | | | | | | | | | | 1,213,717 | |
| | | | | | | | | | | | | | |
Electronics — 0.1% | | | | | |
Sensata Technologies BV, | | | | | | | | |
Gtd. Notes, 144A | | | | | | | | |
5.000% | | | 10/01/25 | | | | | | 1,000 | | | | 1,085,602 | |
| | | | | | | | | | | | | | |
Engineering & Construction — 0.4% | |
Cellnex Telecom SA (Spain), | | | | | | | | |
Sr. Unsec’d. Notes, EMTN | | | | | | | | |
1.750% | | | 10/23/30 | | | | | | EUR 2,800 | | | | 3,065,203 | |
GMR Hyderabad International Airport Ltd. (India), | |
Sr. Sec’d. Notes, 144A | | | | | | | | |
4.250% | | | 10/27/27 | | | | | | 345 | | | | 334,066 | |
Mexico City Airport Trust (Mexico), | | | | | |
Sr. Sec’d. Notes, 144A | | | | | | | | | | | |
4.250% | | | 10/31/26 | | | | | | 605 | | | | 641,941 | |
5.500% | | | 07/31/47 | | | | | | 1,690 | | | | 1,691,818 | |
| | | | | | | | | | | | | | |
| | | | |
| | | | | | | | | | | | | 5,733,028 | |
| | | | | | | | | | | | | | |
Entertainment — 0.2% | | | | | |
AMC Entertainment Holdings, Inc., | | | | | |
Sec’d. Notes, 144A, Cash coupon 10.000% or PIK 12.000% or Cash coupon 5.000% and PIK 6.000% | |
10.000% | | | 06/15/26 | | | | | | 366 | | | | 361,984 | |
Caesars Entertainment, Inc., | | | | | |
Sr. Sec’d. Notes, 144A | | | | | | | | |
6.250% | | | 07/01/25 | | | | | | 860 | | | | 903,313 | |
Golden Entertainment, Inc., | | | | | |
Sr. Unsec’d. Notes, 144A | | | | | | | | |
7.625% | | | 04/15/26 | | | | | | 875 | | | | 916,132 | |
| | | | | | | | | | | | | | | | |
| | | | | | | | | Principal | | | | |
| Interest | | Maturity | | | | | | Amount | | | | |
| Rate | | Date | | | | | | (000)# | | | Value | |
| | | | | | | | | | | | | | | | |
|
| CORPORATE BONDS (continued) | |
Entertainment (cont’d.) | | | | | |
Penn National Gaming, Inc., | | | | | |
Sr. Unsec’d. Notes, 144A | | | | | | | | | |
5.625% | | | 01/15/27 | (a) | | | | | | | 800 | | | $ | 823,102 | |
| | | | | | | | | | | | | | | | |
| | | | |
| | | | | | | | | | | | | | | 3,004,531 | |
| | | | | | | | | | | | | | | | |
Environmental Control — 0.0% | |
Madison IAQ LLC, | | | | | | | | | | | | | |
Sr. Unsec’d. Notes, 144A | | | | | | | | | | | | | |
5.875% | | | 06/30/29 | | | | | | | | 275 | | | | 275,028 | |
| | | | | | | | | | | | | | | | |
Foods — 1.0% | |
Bellis Acquisition Co. PLC (United Kingdom), | | | | | |
Sr. Sec’d. Notes, 144A | | | | | | | | | | | | | |
3.250% | | | 02/16/26 | | | | | | | GBP | 3,100 | | | | 4,041,592 | |
Bellis Finco PLC (United Kingdom), | | | | | |
Sr. Unsec’d. Notes, 144A | | | | | | | | | | | | | |
4.000% | | | 02/16/27 | | | | | | | GBP | 1,600 | | | | 2,046,922 | |
JBS USA Food Co., | | | | | | | | | | | | | |
Gtd. Notes, 144A | | | | | | | | | | | | | |
5.750% | | | 01/15/28 | | | | | | | | 1,250 | | | | 1,306,447 | |
Kraft Heinz Foods Co., | | | | | |
Gtd. Notes | | | | | | | | | | | | | | | | |
4.625% | | | 10/01/39 | | | | | | | | 645 | | | | 758,026 | |
4.875% | | | 10/01/49 | | | | | | | | 1,325 | | | | 1,668,837 | |
Mars, Inc., | | | | | | | | | | | | | | | | |
Gtd. Notes, 144A | | | | | | | | | | | | | |
3.875% | | | 04/01/39 | | | | | | | | 440 | | | | 507,921 | |
4.200% | | | 04/01/59 | | | | | | | | 380 | | | | 485,882 | |
McCormick & Co., Inc., | | | | | | | | | | | | | |
Sr. Unsec’d. Notes | | | | | | | | | | | | | |
2.500% | | | 04/15/30 | | | | | | | | 2,000 | | | | 2,021,643 | |
| | | | | | | | | | | | | | | | |
| | | | |
| | | | | | | | | | | | | | | 12,837,270 | |
| | | | | | | | | | | | | | | | |
Gas — 0.3% | | | | | | | | | | | | | |
AmeriGas Partners LP/AmeriGas Finance Corp., | | | | | |
Sr. Unsec’d. Notes | | | | | | | | | | | | | |
5.875% | | | 08/20/26 | (a) | | | | | | | 1,100 | | | | 1,230,392 | |
NiSource, Inc., | |
Sr. Unsec’d. Notes | | | | | | | | | | | | | |
1.700% | | | 02/15/31 | (a) | | | | | | | 370 | | | | 346,236 | |
4.800% | | | 02/15/44 | | | | | | | | 300 | | | | 367,098 | |
Southern Co. Gas Capital Corp., | | | | | | | | | |
Gtd. Notes | | | | | | | | | | | | | | | | |
4.400% | | | 06/01/43 | | | | | | | | 1,050 | | | | 1,202,395 | |
| | | | | | | | | | | | | | | | |
| | | | |
| | | | | | | | | | | | | | | 3,146,121 | |
| | | | | | | | | | | | | | | | |
Healthcare-Products — 0.4% | | | | | |
DH Europe Finance II Sarl, | | | | | | | | | | | | | |
Gtd. Notes | | | | | | | | | | | | | |
1.350% | | | 09/18/39 | | | | | | | EUR | 1,275 | | | | 1,448,288 | |
Medtronic Global Holdings SCA, | | | | | | | | | |
Gtd. Notes | | | | | | | | | | | | | |
1.375% | | | 10/15/40 | | | | | | | EUR | 540 | | | | 612,934 | |
1.625% | | | 10/15/50 | | | | | | | EUR | 495 | | | | 564,365 | |
2.250% | | | 03/07/39 | | | | | | | EUR | 300 | | | | 389,640 | |
Mozart Debt Merger Sub, Inc., | | | | | |
Sr. Sec’d. Notes, 144A | | | | | | | | | | | | | |
3.875% | | | 04/01/29 | (a) | | | | | | | 325 | | | | 323,869 | |
SEE NOTES TO FINANCIAL STATEMENTS.
A106
| | | | | | |
| | |
| | PSF PGIM TOTAL RETURN BOND PORTFOLIO (CONTINUED) | | |
| | | | | | |
| |
| SCHEDULE OF INVESTMENTS | | as of December 31, 2021 |
| | | | | | | | | | | | | | | | |
| | | | | | | | | Principal | | | | |
| Interest | | Maturity | | | | | | Amount | | | | |
| Rate | | Date | | | | | | (000)# | | | Value | |
| | | | | | | | | | | | | | | | |
| |
| CORPORATE BONDS (continued) | | | | | |
Healthcare-Products (cont’d.) | | | | | | | | | |
Sr. Unsec’d. Notes, 144A | | | | | | | | | |
5.250% | | | 10/01/29 | | | | | | | | 225 | | | $ | 228,503 | |
Stryker Corp., | | | | | | | | | | | | | |
Sr. Unsec’d. Notes | | | | | | | | | |
2.125% | | | 11/30/27 | | | | | | | EUR | 510 | | | | 633,207 | |
Thermo Fisher Scientific, Inc., | | | | | | | | | |
Sr. Unsec’d. Notes, EMTN | | | | | | | | | |
1.500% | | | 10/01/39 | | | | | | | EUR | 600 | | | | 689,791 | |
1.875% | | | 10/01/49 | | | | | | | EUR | 425 | | | | 496,191 | |
| | | | | | | | | | | | | | | | |
| | | | |
| | | | | | | | | | | | | | | 5,386,788 | |
| | | | | | | | | | | | | | | | |
Healthcare-Services — 0.8% | | | | | |
Aetna, Inc., | | | | | | | | | | | | | | | | |
Sr. Unsec’d. Notes | | | | | |
6.750% | | | 12/15/37 | (a) | | | | | | | 1,900 | | | | 2,757,314 | |
Anthem, Inc., | | | | | | | | | | | | | |
Sr. Unsec’d. Notes | | | | | | | | | |
4.650% | | | 01/15/43 | | | | | | | | 385 | | | | 480,717 | |
HCA, Inc., | | | | | | | | | | | | | | | | |
Gtd. Notes | | | | | | | | | | | | | |
3.500% | | | 09/01/30 | (a) | | | | | | | 650 | | | | 686,506 | |
5.375% | | | 02/01/25 | | | | | | | | 825 | | | | 906,485 | |
5.875% | | | 02/01/29 | | | | | | | | 25 | | | | 29,811 | |
7.500% | | | 11/06/33 | | | | | | | | 500 | | | | 719,934 | |
Gtd. Notes, MTN | | | | | | | | | |
7.750% | | | 07/15/36 | | | | | | | | 500 | | | | 687,933 | |
Laboratory Corp. of America Holdings, | | | | | |
Sr. Unsec’d. Notes | | | | | |
3.250% | | | 09/01/24 | | | | | | | | 846 | | | | 885,580 | |
Tenet Healthcare Corp., | | | | | | | | | |
Sec’d. Notes, 144A | | | | | | | | | |
6.250% | | | 02/01/27 | (a) | | | | | | | 375 | | | | 388,049 | |
Sr. Sec’d. Notes, 144A | | | | | | | | | | | | | |
4.625% | | | 06/15/28 | | | | | | | | 285 | | | | 293,279 | |
4.875% | | | 01/01/26 | (a) | | | | | | | 650 | | | | 667,773 | |
5.125% | | | 11/01/27 | (a) | | | | | | | 600 | | | | 625,551 | |
UnitedHealth Group, Inc., | | | | | | | | | |
Sr. Unsec’d. Notes | | | | | | | | | |
3.050% | | | 05/15/41 | | | | | | | | 880 | | | | 918,942 | |
3.950% | | | 10/15/42 | | | | | | | | 220 | | | | 256,523 | |
| | | | | | | | | | | | | | | | |
| | | | |
| | | | | | | | | | | | | | | 10,304,397 | |
| | | | | | | | | | | | | | | | |
Home Builders — 0.2% | | | | | |
Taylor Morrison Communities, Inc., | | | | | |
Gtd. Notes, 144A | | | | | |
5.875% | | | 06/15/27 | | | | | | | | 875 | | | | 981,480 | |
6.625% | | | 07/15/27 | | | | | | | | 1,050 | | | | 1,105,925 | |
Sr. Unsec’d. Notes, 144A | | | | | | | | | |
5.125% | | | 08/01/30 | | | | | | | | 45 | | | | 49,770 | |
| | | | | | | | | | | | | | | | |
| | | | |
| | | | | | | | | | | | | | | 2,137,175 | |
| | | | | | | | | | | | | | | | |
Housewares — 0.1% | | | | | | | | | | | | | |
Newell Brands, Inc., | | | | | | | | | | | | | |
Sr. Unsec’d. Notes | | | | | | | | | | | | | |
4.875% | | | 06/01/25 | (a) | | | | | | | 670 | | | | 729,064 | |
| | | | | | | | | | | | | | | | |
| | | | | | | | | | | | | | |
| | | | | | | | Principal | | | | |
| Interest | | Maturity | | | | | Amount | | | | |
| Rate | | Date | | | | | (000)# | | | Value | |
| | | | | | | | | | | | | | |
| |
| CORPORATE BONDS (continued) | | | | | |
Insurance — 0.9% | | | | | | | | | | | |
American International Group, Inc., | | | | | |
Sr. Unsec’d. Notes | | | | | | | | | | | |
3.750% | | | 07/10/25 | | | | | | 2,110 | | | $ | 2,262,492 | |
4.500% | | | 07/16/44 | | | | | | 1,075 | | | | 1,324,966 | |
Liberty Mutual Finance Europe DAC, | | | | | |
Gtd. Notes, 144A | | | | | | | | | | | |
1.750% | | | 03/27/24 | | | | | EUR | 800 | | | | 943,272 | |
Liberty Mutual Group, Inc., | | | | | | | | | | | |
Gtd. Notes, 144A | | | | | | | | | | | |
3.951% | | | 10/15/50 | | | | | | 1,030 | | | | 1,142,791 | |
Lincoln National Corp., | | | | | | | | | | | |
Sr. Unsec’d. Notes | | | | | | | | | | | |
7.000% | | | 06/15/40 | | | | | | 405 | | | | 618,659 | |
Markel Corp., | | | | | | | | | | | | | | |
Sr. Unsec’d. Notes | | | | | | | | | | | |
4.150% | | | 09/17/50 | | | | | | 180 | | | | 209,349 | |
5.000% | | | 03/30/43 | | | | | | 350 | | | | 424,102 | |
Principal Financial Group, Inc., | | | | | | | | |
Gtd. Notes | | | | | | | | | | | | | | |
4.625% | | | 09/15/42 | | | | | | 150 | | | | 186,725 | |
Sompo International Holdings Ltd. (Bermuda), | | | | | |
Sr. Unsec’d. Notes | | | | | | | | | | | |
7.000% | | | 07/15/34 | | | | | | 1,350 | | | | 1,855,495 | |
Teachers Insurance & Annuity Association of America, | | | | | |
Sub. Notes, 144A | | | | | | | | | | | |
4.270% | | | 05/15/47 | | | | | | 2,310 | | | | 2,800,368 | |
6.850% | | | 12/16/39 | | | | | | 196 | | | | 292,162 | |
| | | | | | | | | | | | | | |
| | | | |
| | | | | | | | | | | | | 12,060,381 | |
| | | | | | | | | | | | | | |
Lodging — 0.4% | | | | | | | | | | | |
Marriott International, Inc., | | | | | | | | | | | |
Sr. Unsec’d. Notes | | | | | | | | | | | |
3.250% | | | 09/15/22 | | | | | | 1,325 | | | | 1,338,142 | |
Sr. Unsec’d. Notes, Series GG | | | | | |
3.500% | | | 10/15/32 | (a) | | | | | 1,825 | | | | 1,912,115 | |
MGM Resorts International, | | | | | | | | | | | |
Gtd. Notes | | | | | | | | | | | | | | |
4.750% | | | 10/15/28 | | | | | | 950 | | | | 982,781 | |
Sands China Ltd. (Macau), | | | | | | | | | | | |
Sr. Unsec’d. Notes | | | | | | | | | | | |
5.125% | | | 08/08/25 | | | | | | 400 | | | | 417,760 | |
| | | | | | | | | | | | | | |
| | | | |
| | | | | | | | | | | | | 4,650,798 | |
| | | | | | | | | | | | | | |
Media — 2.0% | | | | | | | | | | | | | | |
CCO Holdings LLC/CCO Holdings Capital Corp., | | | | | |
Sr. Unsec’d. Notes | | | | | | | | | | | |
4.500% | | | 05/01/32 | | | | | | 450 | | | | 463,885 | |
Sr. Unsec’d. Notes, 144A | | | | | | | | | | | |
5.375% | | | 06/01/29 | (a) | | | | | 975 | | | | 1,052,585 | |
5.500% | | | 05/01/26 | | | | | | 1,650 | | | | 1,702,047 | |
Charter Communications Operating LLC/Charter Communications Operating Capital, | |
Sr. Sec’d. Notes | | | | | | | | | | | |
3.900% | | | 06/01/52 | | | | | | 1,430 | | | | 1,430,931 | |
4.800% | | | 03/01/50 | | | | | | 875 | | | | 980,853 | |
6.384% | | | 10/23/35 | | | | | | 2,470 | | | | 3,199,483 | |
6.484% | | | 10/23/45 | | | | | | 1,125 | | | | 1,538,045 | |
SEE NOTES TO FINANCIAL STATEMENTS.
A107
| | | | | | |
| | |
| | PSF PGIM TOTAL RETURN BOND PORTFOLIO (CONTINUED) | | |
| | | | | | |
| |
| SCHEDULE OF INVESTMENTS | | as of December 31, 2021 |
| | | | | | | | | | | | | | | | |
Interest Rate | | Maturity
Date | | | | | | Principal
Amount
(000)# | | | Value | |
| | | | | | | | | | | | | | | | |
| |
| CORPORATE BONDS (continued) | | | | | |
Media (cont’d.) | | | | | | | | | |
Comcast Corp., | | | | | | | | | |
Gtd. Notes | | | | | | | | | | | | | | | | |
4.250% | | | 10/15/30 | (a) | | | | | | | 620 | | | $ | 715,586 | |
Gtd. Notes, 144A | | | | | | | | | | | | | |
2.937% | | | 11/01/56 | | | | | | | | 6 | | | | 5,715 | |
Cox Communications, Inc., | | | | | | | | | |
Sr. Unsec’d. Notes, 144A | | | | | |
3.150% | | | 08/15/24 | | | | | | | | 965 | | | | 1,005,692 | |
CSC Holdings LLC, | | | | | | | | | | | | | |
Gtd. Notes, 144A | | | | | | | | | | | | | |
3.375% | | | 02/15/31 | (a) | | | | | | | 1,000 | | | | 936,237 | |
5.500% | | | 04/15/27 | | | | | | | | 650 | | | | 672,114 | |
Sr. Unsec’d. Notes, 144A | | | | | | | | | |
4.625% | | | 12/01/30 | | | | | | | | 1,000 | | | | 946,183 | |
Diamond Sports Group LLC/Diamond Sports Finance Co., | |
Gtd. Notes, 144A | | | | | | | | | | | | | |
6.625% | | | 08/15/27 | (a) | | | | | | | 520 | | | | 145,401 | |
Sr. Sec’d. Notes, 144A | | | | | | | | | |
5.375% | | | 08/15/26 | (a) | | | | | | | 855 | | | | 426,326 | |
Discovery Communications LLC, | | | | | |
Gtd. Notes | | | | | | | | | | | | | | | | |
4.000% | | | 09/15/55 | | | | | | | | 1,229 | | | | 1,294,147 | |
5.300% | | | 05/15/49 | | | | | | | | 265 | | | | 335,059 | |
DISH DBS Corp., | | | | | | | | | | | | | |
Gtd. Notes | | | | | | | | | | | | | | | | |
7.375% | | | 07/01/28 | (a) | | | | | | | 400 | | | | 406,098 | |
NBCUniversal Media LLC, | | | | | | | | | |
Gtd. Notes | | | | | | | | | | | | | | | | |
4.450% | | | 01/15/43 | | | | | | | | 10 | | | | 12,050 | |
TCI Communications, Inc., | | | | | | | | | |
Sr. Unsec’d. Notes | | | | | | | | | | | | | |
7.875% | | | 02/15/26 | | | | | | | | 750 | | | | 934,537 | |
Univision Communications, Inc., | | | | | |
Sr. Sec’d. Notes, 144A | | | | | |
5.125% | | | 02/15/25 | (a) | | | | | | | 1,175 | | | | 1,186,735 | |
6.625% | | | 06/01/27 | | | | | | | | 975 | | | | 1,049,607 | |
Virgin Media Secured Finance PLC (United Kingdom), | |
Sr. Sec’d. Notes | | | | | | | | | |
4.125% | | | 08/15/30 | | | | GBP | | | | 900 | | | | 1,202,506 | |
4.250% | | | 01/15/30 | | | | GBP | | | | 800 | | | | 1,074,938 | |
Walt Disney Co. (The), | | | | | | | | | |
Gtd. Notes | | | | | | | | | | | | | | | | |
7.625% | | | 11/30/28 | | | | | | | | 500 | | | | 676,393 | |
Ziggo BV (Netherlands), | | | | | | | | | |
Sr. Sec’d. Notes | | | | | | | | | |
2.875% | | | 01/15/30 | | | | EUR | | | | 1,910 | | | | 2,163,925 | |
| | | | | | | | | | | | | | | | |
| | | | |
| | | | | | | | | | | | | | | 25,557,078 | |
| | | | | | | | | | | | | | | | |
Mining — 0.2% | | | | | | | | | |
Barrick Gold Corp. (Canada), | | | | | | | | | |
Sr. Unsec’d. Notes | | | | | | | | | | | | | |
5.250% | | | 04/01/42 | | | | | | | | 680 | | | | 880,819 | |
Barrick North America Finance LLC (Canada), | |
Gtd. Notes | | | | | | | | | | | | | | | | |
5.750% | | | 05/01/43 | | | | | | | | 410 | | | | 557,970 | |
| | | | | | | | | | | | | | | | |
Interest Rate | | Maturity
Date | | | | | | Principal
Amount
(000)# | | | Value | |
| | | | | | | | | | | | | | | | |
|
| CORPORATE BONDS (continued) | |
Mining (cont’d.) | | | | | |
Southern Copper Corp. (Peru), | |
Sr. Unsec’d. Notes | | | | | | | | | |
6.750% | | | 04/16/40 | | | | | | | | 295 | | | $ | 413,767 | |
| | | | | | | | | | | | | | | | |
| | | | |
| | | | | | | | | | | | | | | 1,852,556 | |
| | | | | | | | | | | | | | | | |
Multi-National — 0.2% | | | | | | | | | |
Corp. Andina de Fomento (Supranational Bank), | |
Sr. Unsec’d. Notes | | | | | | | | | | | | | |
4.375% | | | 06/15/22 | | | | | | | | 500 | | | | 508,056 | |
Inter-American Development Bank (Supranational Bank), | |
Unsec’d. Notes | | | | | | | | | | | | | | | | |
6.950% | | | 08/01/26 | | | | | | | | 1,500 | | | | 1,841,654 | |
| | | | | | | | | | | | | | | | |
| | | | |
| | | | | | | | | | | | | | | 2,349,710 | |
| | | | | | | | | | | | | | | | |
Oil & Gas — 2.5% | | | | | | | | | | | | | |
Antero Resources Corp., | | | | | | | | | |
Gtd. Notes, 144A | | | | | | | | | |
8.375% | | | 07/15/26 | (a) | | | | | | | 366 | | | | 416,658 | |
Ascent Resources Utica Holdings LLC/ARU Finance Corp., | |
Gtd. Notes, 144A | |
7.000% | | | 11/01/26 | | | | | | | | 350 | | | | 355,563 | |
9.000% | | | 11/01/27 | | | | | | | | 204 | | | | 273,123 | |
Sr. Unsec’d. Notes, 144A | | | | | | | | | |
8.250% | | | 12/31/28 | | | | | | | | 450 | | | | 469,610 | |
BP Capital Markets America, Inc., | |
Gtd. Notes | | | | | | | | | | | | | | | | |
2.772% | | | 11/10/50 | | | | | | | | 145 | | | | 136,484 | |
2.939% | | | 06/04/51 | | | | | | | | 1,835 | | | | 1,772,683 | |
Cenovus Energy, Inc. (Canada), | |
Sr. Unsec’d. Notes | | | | | | | | | |
3.750% | | | 02/15/52 | | | | | | | | 335 | | | | 337,512 | |
5.400% | | | 06/15/47 | | | | | | | | 1,000 | | | | 1,244,618 | |
Citgo Holding, Inc., | | | | | | | | | |
Sr. Sec’d. Notes, 144A | | | | | | | | | |
9.250% | | | 08/01/24 | (a) | | | | | | | 125 | | | | 125,578 | |
CITGO Petroleum Corp., | | | | | | | | | |
Sr. Sec’d. Notes, 144A | | | | | | | | | |
7.000% | | | 06/15/25 | | | | | | | | 800 | | | | 820,942 | |
Devon Energy Corp., | | | | | | | | | |
Sr. Unsec’d. Notes | | | | | | | | | |
5.600% | | | 07/15/41 | | | | | | | | 850 | | | | 1,070,059 | |
Ecopetrol SA (Colombia), | | | | | | | | | |
Sr. Unsec’d. Notes | | | | | | | | | |
5.875% | | | 09/18/23 | | | | | | | | 1,175 | | | | 1,245,839 | |
Endeavor Energy Resources LP/EER Finance, Inc., | |
Sr. Unsec’d. Notes, 144A | |
5.750% | | | 01/30/28 | | | | | | | | 1,300 | | | | 1,386,667 | |
Energean Israel Finance Ltd. (Israel), | | | | | |
Sr. Sec’d. Notes, 144A | | | | | |
4.500% | | | 03/30/24 | | | | | | | | 300 | | | | 301,941 | |
4.875% | | | 03/30/26 | | | | | | | | 52 | | | | 51,579 | |
5.375% | | | 03/30/28 | | | | | | | | 850 | | | | 837,661 | |
Gazprom PJSC Via Gaz Capital SA (Russia), | |
Sr. Unsec’d. Notes | |
4.950% | | | 07/19/22 | | | | | | | | 390 | | | | 396,909 | |
Sr. Unsec’d. Notes, 144A | | | | | | | | | |
6.510% | | | 03/07/22 | | | | | | | | 1,665 | | | | 1,682,176 | |
SEE NOTES TO FINANCIAL STATEMENTS.
A108
| | | | | | |
| | |
| | PSF PGIM TOTAL RETURN BOND PORTFOLIO (CONTINUED) | | |
| | | | | | |
| |
| SCHEDULE OF INVESTMENTS | | as of December 31, 2021 |
| | | | | | | | | | | | | | | | |
Interest Rate | | Maturity
Date | | | | | | Principal
Amount
(000)# | | | Value | |
| | | | | | | | | | | | | | | | |
| |
| CORPORATE BONDS (continued) | | | | | |
Oil & Gas (cont’d.) | | | | | | | | | |
KazMunayGas National Co. JSC (Kazakhstan), | |
Sr. Unsec’d. Notes, 144A | |
4.750% | | | 04/24/25 | | | | | | | | 1,160 | | | $ | 1,261,108 | |
4.750% | | | 04/19/27 | | | | | | | | 200 | | | | 221,005 | |
Lundin Energy Finance BV (Netherlands), | |
Gtd. Notes, 144A | |
3.100% | | | 07/15/31 | | | | | | | | 705 | | | | 712,469 | |
MEG Energy Corp. (Canada), | | | | | |
Gtd. Notes, 144A | | | | | |
7.125% | | | 02/01/27 | | | | | | | | 425 | | | | 452,615 | |
Occidental Petroleum Corp., | | | | | |
Sr. Unsec’d. Notes | | | | | |
6.450% | | | 09/15/36 | | | | | | | | 945 | | | | 1,204,912 | |
Ovintiv, Inc., | | | | | | | | | | | | | | | | |
Gtd. Notes | | | | | | | | | | | | | | | | |
6.625% | | | 08/15/37 | | | | | | | | 200 | | | | 261,309 | |
Petrobras Global Finance BV (Brazil), | |
Gtd. Notes | | | | | | | | | | | | | | | | |
5.600% | | | 01/03/31 | | | | | | | | 97 | | | | 103,246 | |
6.625% | | | 01/16/34 | | | | GBP | | | | 680 | | | | 1,017,806 | |
6.900% | | | 03/19/49 | | | | | | | | 612 | | | | 652,330 | |
7.375% | | | 01/17/27 | | | | | | | | 360 | | | | 418,122 | |
Petroleos Mexicanos (Mexico), | |
Gtd. Notes | | | | | | | | | | | | | | | | |
4.750% | | | 02/26/29 | | | | EUR | | | | 394 | | | | 442,479 | |
5.350% | | | 02/12/28 | | | | | | | | 157 | | | | 156,477 | |
6.350% | | | 02/12/48 | (a) | | | | | | | 840 | | | | 722,797 | |
6.490% | | | 01/23/27 | | | | | | | | 1,530 | | | | 1,631,542 | |
6.500% | | | 03/13/27 | | | | | | | | 1,753 | | | | 1,869,928 | |
6.500% | | | 01/23/29 | (a) | | | | | | | 700 | | | | 725,985 | |
6.840% | | | 01/23/30 | | | | | | | | 306 | | | | 317,314 | |
Gtd. Notes, EMTN | | | | | | | | | |
3.750% | | | 02/21/24 | | | | EUR | | | | 400 | | | | 467,394 | |
4.875% | | | 02/21/28 | | | | EUR | | | | 1,530 | | | | 1,745,041 | |
Pioneer Natural Resources Co., | |
Sr. Unsec’d. Notes | |
1.900% | | | 08/15/30 | | | | | | | | 2,085 | | | | 1,979,509 | |
Qatar Energy (Qatar), | | | | | |
Sr. Unsec’d. Notes, 144A | | | | | |
3.125% | | | 07/12/41 | | | | | | | | 640 | | | | 647,219 | |
Range Resources Corp., | | | | | | | | | |
Gtd. Notes | | | | | | | | | | | | | | | | |
9.250% | | | 02/01/26 | (a) | | | | | | | 1,200 | | | | 1,294,492 | |
Transocean, Inc., | | | | | |
Gtd. Notes, 144A | | | | | |
8.000% | | | 02/01/27 | | | | | | | | 675 | | | | 496,213 | |
Valero Energy Corp., | |
Sr. Unsec’d. Notes | |
2.150% | | | 09/15/27 | (a) | | | | | | | 830 | | | | 828,797 | |
| | | | | | | | | | | | | | | | |
| | | | |
| | | | | | | | | | | | | | | 32,555,711 | |
| | | | | | | | | | | | | | | | |
Oil & Gas Services — 0.1% | |
Cameron International Corp., | |
Gtd. Notes | | | | | | | | | | | | | | | | |
7.000% | | | 07/15/38 | | | | | | | | 450 | | | | 634,874 | |
| | | | | | | | | | | | | | | | |
| | | | | | | | | | | | | | | | |
Interest Rate | | Maturity
Date | | | | | | Principal
Amount
(000)# | | | Value | |
| | | | | | | | | | | | | | | | |
| |
| CORPORATE BONDS (continued) | | | | | |
Packaging & Containers — 0.5% | | | | | | | | | |
ARD Finance SA (Luxembourg), | |
Sr. Sec’d. Notes, Cash coupon 5.000% or PIK 5.750% | |
5.000% | | | 06/30/27 | | | | EUR | | | | 1,278 | | | $ | 1,492,553 | |
Silgan Holdings, Inc., | | | | | | | | | |
Gtd. Notes | | | | | | | | | | | | | | | | |
2.250% | | | 06/01/28 | | | | EUR | | | | 2,100 | | | | 2,372,689 | |
Verallia SA (France), | |
Gtd. Notes | | | | | | | | | | | | | | | | |
1.625% | | | 05/14/28 | | | | EUR | | | | 2,500 | | | | 2,912,833 | |
| | | | | | | | | | | | | | | | |
| | | | |
| | | | | | | | | | | | | | | 6,778,075 | |
| | | | | | | | | | | | | | | | |
Pharmaceuticals — 2.7% | | | | | | | | | |
AbbVie, Inc., | | | | | | | | | | | | | | | | |
Sr. Unsec’d. Notes | | | | | | | | | |
3.600% | | | 05/14/25 | | | | | | | | 1,020 | | | | 1,083,981 | |
4.050% | | | 11/21/39 | | | | | | | | 5,135 | | | | 5,886,278 | |
4.500% | | | 05/14/35 | | | | | | | | 1,715 | | | | 2,050,080 | |
4.550% | | | 03/15/35 | | | | | | | | 2,040 | | | | 2,438,965 | |
Bausch Health Americas, Inc., | | | | | |
Gtd. Notes, 144A | | | | | |
8.500% | | | 01/31/27 | | | | | | | | 320 | | | | 338,367 | |
Bausch Health Cos., Inc., | | | | | |
Gtd. Notes, 144A | | | | | |
5.000% | | | 01/30/28 | (a) | | | | | | | 430 | | | | 400,100 | |
5.000% | | | 02/15/29 | | | | | | | | 250 | | | | 221,875 | |
5.250% | | | 01/30/30 | | | | | | | | 300 | | | | 265,254 | |
5.250% | | | 02/15/31 | | | | | | | | 250 | | | | 220,577 | |
6.125% | | | 04/15/25 | | | | | | | | 265 | | | | 270,479 | |
6.250% | | | 02/15/29 | | | | | | | | 1,150 | | | | 1,094,251 | |
Bristol-Myers Squibb Co., | | | | | |
Sr. Unsec’d. Notes | | | | | |
4.125% | | | 06/15/39 | | | | | | | | 420 | | | | 496,781 | |
4.250% | | | 10/26/49 | | | | | | | | 210 | | | | 259,757 | |
5.000% | | | 08/15/45 | | | | | | | | 569 | | | | 757,733 | |
Cigna Corp., | | | | | | | | | | | | | | | | |
Gtd. Notes | | | | | | | | | | | | | | | | |
4.375% | | | 10/15/28 | | | | | | | | 1,320 | | | | 1,500,583 | |
4.500% | | | 02/25/26 | | | | | | | | 3,690 | | | | 4,088,673 | |
Sr. Unsec’d. Notes | | | | | | | | | |
3.200% | | | 03/15/40 | | | | | | | | 440 | | | | 454,446 | |
3.400% | | | 03/15/50 | | | | | | | | 265 | | | | 276,407 | |
3.400% | | | 03/15/51 | | | | | | | | 1,060 | | | | 1,114,380 | |
CVS Health Corp., | | | | | |
Sr. Unsec’d. Notes | | | | | |
1.875% | | | 02/28/31 | | | | | | | | 765 | | | | 734,032 | |
2.700% | | | 08/21/40 | | | | | | | | 480 | | | | 461,009 | |
4.780% | | | 03/25/38 | | | | | | | | 270 | | | | 328,986 | |
5.050% | | | 03/25/48 | | | | | | | | 655 | | | | 857,035 | |
5.125% | | | 07/20/45 | | | | | | | | 565 | | | | 734,639 | |
Mylan, Inc., | | | | | | | | | | | | | | | | |
Gtd. Notes | | | | | | | | | | | | | | | | |
5.200% | | | 04/15/48 | | | | | | | | 1,890 | | | | 2,340,519 | |
Shire Acquisitions Investments Ireland DAC, | |
Gtd. Notes | | | | | | | | | | | | | | | | |
3.200% | | | 09/23/26 | | | | | | | | 3,745 | | | | 3,973,645 | |
SEE NOTES TO FINANCIAL STATEMENTS.
A109
| | | | | | |
| | |
| | PSF PGIM TOTAL RETURN BOND PORTFOLIO (CONTINUED) | | |
| | | | | | |
| |
| SCHEDULE OF INVESTMENTS | | as of December 31, 2021 |
| | | | | | | | | | | | | | | | |
Interest Rate | | Maturity
Date | | | | | | Principal
Amount
(000)# | | | Value | |
| | | | | | | | | | | | | | | | |
|
| CORPORATE BONDS (continued) | |
Pharmaceuticals (cont’d.) | | | | | |
Takeda Pharmaceutical Co. Ltd. (Japan), | |
Sr. Unsec’d. Notes | | | | | | | | | |
3.025% | | | 07/09/40 | | | | | | | | 525 | | | $ | 528,657 | |
Utah Acquisition Sub, Inc., | | | | | |
Gtd. Notes | | | | | | | | | | | | | |
5.250% | | | 06/15/46 | | | | | | | | 185 | | | | 226,815 | |
Viatris, Inc., | | | | | | | | | | | | | | | | |
Gtd. Notes | | | | | | | | | | | | | |
4.000% | | | 06/22/50 | | | | | | | | 1,280 | | | | 1,368,449 | |
| | | | | | | | | | | | | | | | |
| | | | |
| | | | | | | | | | | | | | | 34,772,753 | |
| | | | | | | | | | | | | | | | |
Pipelines — 2.0% | | | | | |
Boardwalk Pipelines LP, | | | | | |
Gtd. Notes | | | | | | | | | | | | | |
3.400% | | | 02/15/31 | | | | | | | | 1,730 | | | | 1,784,872 | |
Energy Transfer LP, | | | | | | | | | |
Jr. Sub. Notes, Series G | | | | | | | | | |
7.125%(ff) | | | 05/15/30 | (oo) | | | | | | | 875 | | | | 892,841 | |
Jr. Sub. Notes, Series H | | | | | | | | | |
6.500%(ff) | | | 11/15/26 | (oo) | | | | | | | 1,325 | | | | 1,359,933 | |
Sr. Unsec’d. Notes | | | | | | | | | |
5.000% | | | 05/15/50 | | | | | | | | 280 | | | | 322,403 | |
5.150% | | | 03/15/45 | | | | | | | | 55 | | | | 62,411 | |
5.300% | | | 04/15/47 | | | | | | | | 120 | | | | 138,283 | |
5.400% | | | 10/01/47 | | | | | | | | 55 | | | | 64,868 | |
6.125% | | | 12/15/45 | | | | | | | | 90 | | | | 112,353 | |
6.250% | | | 04/15/49 | | | | | | | | 1,400 | | | | 1,830,822 | |
Enterprise Products Operating LLC, | | | | | |
Gtd. Notes | | | | | | | | | | | | | |
3.200% | | | 02/15/52 | | | | | | | | 870 | | | | 854,822 | |
3.700% | | | 01/31/51 | | | | | | | | 130 | | | | 136,837 | |
4.900% | | | 05/15/46 | | | | | | | | 2,110 | | | | 2,566,692 | |
Fermaca Enterprises S de RL de CV (Mexico), | |
Sr. Sec’d. Notes, 144A | | | | | |
6.375% | | | 03/30/38 | | | | | | | | 356 | | | | 410,662 | |
Kinder Morgan, Inc., | | | | | |
Gtd. Notes | | | | | | | | | | | | | |
3.250% | | | 08/01/50 | (a) | | | | | | | 782 | | | | 744,428 | |
3.600% | | | 02/15/51 | | | | | | | | 1,158 | | | | 1,171,007 | |
Magellan Midstream Partners LP, | | | | | |
Sr. Unsec’d. Notes | | | | | |
4.200% | | | 03/15/45 | | | | | | | | 1,000 | | | | 1,054,604 | |
MPLX LP, | | | | | | | | | |
Sr. Unsec’d. Notes | | | | | | | | | |
4.500% | | | 04/15/38 | | | | | | | | 970 | | | | 1,091,434 | |
5.200% | | | 03/01/47 | | | | | | | | 115 | | | | 140,739 | |
NGPL PipeCo LLC, | | | | | | | | | |
Sr. Unsec’d. Notes, 144A | | | | | | | | | |
4.875% | | | 08/15/27 | (a) | | | | | | | 225 | | | | 250,356 | |
ONEOK Partners LP, | | | | | | | | | |
Gtd. Notes | | | | | | | | | | | | | |
6.850% | | | 10/15/37 | | | | | | | | 1,250 | | | | 1,674,883 | |
ONEOK, Inc., | | | | | | | | | | | | | |
Gtd. Notes | | | | | | | | | | | | | |
4.500% | | | 03/15/50 | | | | | | | | 2,685 | | | | 2,979,772 | |
4.950% | | | 07/13/47 | | | | | | | | 450 | | | | 524,344 | |
| | | | | | | | | | | | | | | | |
Interest Rate | | Maturity
Date | | | | | | Principal
Amount
(000)# | | | Value | |
| | | | | | | | | | | | | | | | |
| |
| CORPORATE BONDS (continued) | | | | | |
Pipelines (cont’d.) | | | | | | | | | |
Phillips 66 Partners LP, | | | | | |
Sr. Unsec’d. Notes | | | | | |
4.680% | | | 02/15/45 | | | | | | | | 1,900 | | | $ | 2,228,382 | |
Tallgrass Energy Partners LP/Tallgrass Energy Finance Corp., | |
Gtd. Notes, 144A | |
7.500% | | | 10/01/25 | | | | | | | | 1,150 | | | | 1,246,089 | |
Venture Global Calcasieu Pass LLC, | |
Sr. Sec’d. Notes, 144A | |
3.875% | | | 08/15/29 | | | | | | | | 105 | | | | 109,296 | |
4.125% | | | 08/15/31 | | | | | | | | 105 | | | | 112,036 | |
Western Midstream Operating LP, | |
Sr. Unsec’d. Notes | |
5.450% | | | 04/01/44 | | | | | | | | 575 | | | | 686,997 | |
Williams Cos., Inc. (The), | |
Sr. Unsec’d. Notes | |
4.900% | | | 01/15/45 | | | | | | | | 1,200 | | | | 1,436,568 | |
| | | | | | | | | | | | | | | | |
| | | | |
| | | | | | | | | | | | | | | 25,988,734 | |
| | | | | | | | | | | | | | | | |
Real Estate — 0.1% | | | | | |
Greystar Real Estate Partners LLC, | | | | | |
Sr. Sec’d. Notes, 144A | | | | | |
5.750% | | | 12/01/25 | | | | | | | | 1,200 | | | | 1,220,924 | |
| | | | | | | | | | | | | | | | |
Real Estate Investment Trusts (REITs) — 0.7% | |
Brixmor Operating Partnership LP, | |
Sr. Unsec’d. Notes | |
4.050% | | | 07/01/30 | | | | | | | | 1,125 | | | | 1,235,317 | |
Diversified Healthcare Trust, | | | | | |
Gtd. Notes | | | | | | | | | | | | | | | | |
9.750% | | | 06/15/25 | | | | | | | | 1,000 | | | | 1,081,776 | |
MGM Growth Properties Operating Partnership LP/MGP Finance Co-Issuer, Inc., | |
Gtd. Notes, 144A | |
4.625% | | | 06/15/25 | | | | | | | | 405 | | | | 432,309 | |
MPT Operating Partnership LP/MPT Finance Corp., | |
Gtd. Notes | | | | | | | | | | | | | | | | |
0.993% | | | 10/15/26 | | | | EUR | | | | 675 | | | | 764,843 | |
3.500% | | | 03/15/31 | (a) | | | | | | | 1,100 | | | | 1,113,782 | |
Realty Income Corp., | | | | | |
Sr. Unsec’d. Notes | | | | | |
2.850% | | | 12/15/32 | | | | | | | | 525 | | | | 546,055 | |
Spirit Realty LP, | | | | | | | | | | | | | | | | |
Gtd. Notes | | | | | | | | | | | | | | | | |
2.700% | | | 02/15/32 | | | | | | | | 2,190 | | | | 2,172,465 | |
WP Carey, Inc., | | | | | | | | | |
Sr. Unsec’d. Notes | | | | | | | | | |
2.250% | | | 04/01/33 | | | | | | | | 1,930 | | | | 1,836,829 | |
| | | | | | | | | | | | | | | | |
| | | | |
| | | | | | | | | | | | | | | 9,183,376 | |
| | | | | | | | | | | | | | | | |
Retail — 0.6% | |
1011778 BC ULC/New Red Finance, Inc. (Canada), | |
Sec’d. Notes, 144A | | | | | | | | | |
4.000% | | | 10/15/30 | (a) | | | | | | | 1,525 | | | | 1,506,483 | |
At Home Group, Inc., | | | | | | | | | |
Sr. Sec’d. Notes, 144A | | | | | | | | | |
4.875% | | | 07/15/28 | | | | | | | | 275 | | | | 271,047 | |
SEE NOTES TO FINANCIAL STATEMENTS.
A110
| | | | | | |
| | |
| | PSF PGIM TOTAL RETURN BOND PORTFOLIO (CONTINUED) | | |
| | | | | | |
| |
| SCHEDULE OF INVESTMENTS | | as of December 31, 2021 |
| | | | | | | | | | | | | | | | |
Interest
Rate | | Maturity
Date | | | | | | Principal
Amount
(000)# | | | Value | |
| | | | | | | | | | | | | | | | |
| |
| CORPORATE BONDS (continued) | | | | | |
Retail (cont’d.) | | | | | | | | | | | | | | | | |
AutoZone, Inc., | | | | | | | | | | | | | | | | |
Sr. Unsec’d. Notes | | | | | | | | | | | | | |
1.650% | | | 01/15/31 | (a) | | | | | | | 335 | | | $ | 315,500 | |
Best Buy Co., Inc., | | | | | | | | | | | | | |
Sr. Unsec’d. Notes | | | | | | | | | | | | | |
1.950% | | | 10/01/30 | | | | | | | | 495 | | | | 475,928 | |
Dollar Tree, Inc., | | | | | | | | | | | | | |
Sr. Unsec’d. Notes | | | | | | | | | | | | | |
2.650% | | | 12/01/31 | | | | | | | | 1,340 | | | | 1,342,742 | |
eG Global Finance PLC (United Kingdom), | | | | | | | | | |
Sr. Sec’d. Notes | | | | | | | | | | | | | |
6.250% | | | 10/30/25 | | | | EUR | | | | 1,600 | | | | 1,869,295 | |
O’Reilly Automotive, Inc., | | | | | | | | | | | | | |
Sr. Unsec’d. Notes | | | | | | | | | | | | | |
1.750% | | | 03/15/31 | (a) | | | | | | | 2,115 | | | | 2,006,707 | |
Sally Holdings LLC/Sally Capital, Inc., | | | | | | | | | |
Gtd. Notes | | | | | | | | | | | | | | | | |
5.625% | | | 12/01/25 | | | | | | | | 454 | | | | 463,787 | |
| | | | | | | | | | | | | | | | |
| | | | | | | | | | | | | | | 8,251,489 | |
| | | | | | | | | | | | | | | | |
Savings & Loans — 0.1% | | | | | | | | | | | | | |
People’s United Financial, Inc., | | | | | | | | | | | | | |
Sr. Unsec’d. Notes | | | | | | | | | | | | | |
3.650% | | | 12/06/22 | (a) | | | | | | | 1,675 | | | | 1,706,057 | |
| | | | | | | | | | | | | | | | |
Semiconductors — 0.9% | | | | | | | | | | | | | |
Broadcom, Inc., | | | | | | | | | | | | | |
Sr. Unsec’d. Notes, 144A | | | | | | | | | | | | | |
3.137% | | | 11/15/35 | | | | | | | | 3,509 | | | | 3,527,274 | |
3.187% | | | 11/15/36 | | | | | | | | 4,000 | | | | 4,012,949 | |
3.419% | | | 04/15/33 | | | | | | | | 1,250 | | | | 1,304,963 | |
NXP BV/NXP Funding LLC (China), | | | | | | | | | |
Gtd. Notes, 144A | | | | | | | | | | | | | |
4.625% | | | 06/01/23 | | | | | | | | 2,675 | | | | 2,801,057 | |
| | | | | | | | | | | | | | | | |
| | | | | | | | | | | | | | | 11,646,243 | |
| | | | | | | | | | | | | | | | |
Software — 0.2% | | | | | | | | | | | | | | | | |
Boxer Parent Co., Inc., | | | | | | | | | | | | | |
Sec’d. Notes, 144A | | | | | | | | | | | | | |
9.125% | | | 03/01/26 | | | | | | | | 850 | | | | 887,700 | |
Microsoft Corp., | | | | | | | | | | | | | |
Sr. Unsec’d. Notes | | | | | | | | | | | | | |
2.525% | | | 06/01/50 | | | | | | | | 1,815 | | | | 1,781,199 | |
2.675% | | | 06/01/60 | | | | | | | | 435 | | | | 433,142 | |
| | | | | | | | | | | | | | | | |
| | | | | | | | | | | | | | | 3,102,041 | |
| | | | | | | | | | | | | | | | |
Telecommunications — 2.0% | | | | | | | | | | | | | |
AT&T, Inc., | | | | | | | | | | | | | | | | |
Sr. Unsec’d. Notes | | | | | | | | | | | | | |
2.550% | | | 12/01/33 | | | | | | | | 1,216 | | | | 1,190,848 | |
3.500% | | | 09/15/53 | | | | | | | | 4,881 | | | | 4,933,482 | |
3.550% | | | 09/15/55 | | | | | | | | 972 | | | | 973,795 | |
3.650% | | | 09/15/59 | | | | | | | | 65 | | | | 65,613 | |
4.300% | | | 02/15/30 | | | | | | | | 485 | | | | 546,421 | |
Digicel International Finance Ltd./Digicel International Holdings Ltd. | |
(Jamaica), | | | | | | | | | | | | | | | | |
Gtd. Notes, 144A, Cash coupon 6.000% and PIK 7.000% | |
13.000% | | | 12/31/25 | | | | | | | | 517 | | | | 531,837 | |
| | | | | | | | | | | | | | | | |
Interest
Rate | | Maturity
Date | | | | | | Principal
Amount
(000)# | | | Value | |
| | | | | | | | | | | | | | | | |
|
| CORPORATE BONDS (continued) | |
Telecommunications (cont’d.) | | | | | |
Sr. Sec’d. Notes, 144A | | | | | | | | | | | | | |
8.750% | | | 05/25/24 | | | | | | | | 200 | | | $ | 205,793 | |
8.750% | | | 05/25/24 | | | | | | | | 997 | | | | 1,024,410 | |
Digicel Ltd. (Jamaica), | | | | | | | | | | | | | |
Gtd. Notes, 144A | | | | | | | | | | | | | |
6.750% | | | 03/01/23 | | | | | | | | 500 | | | | 483,487 | |
Level 3 Financing, Inc., | | | | | | | | | | | | | |
Sr. Sec’d. Notes, 144A | | | | | | | | | | | | | |
3.400% | | | 03/01/27 | | | | | | | | 230 | | | | 237,476 | |
Lumen Technologies, Inc., | | | | | | | | | | | | | |
Sr. Unsec’d. Notes, Series P | | | | | | | | | | | | | |
7.600% | | | 09/15/39 | (a) | | | | | | | 850 | | | | 912,121 | |
Sprint Corp., | | | | | | | | | | | | | | | | |
Gtd. Notes | | | | | | | | | | | | | | | | |
7.625% | | | 02/15/25 | | | | | | | | 2,500 | | | | 2,879,951 | |
7.875% | | | 09/15/23 | | | | | | | | 2,000 | | | | 2,206,766 | |
T-Mobile USA, Inc., | | | | | | | | | | | | | |
Sr. Sec’d. Notes | | | | | | | | | | | | | | | | |
4.375% | | | 04/15/40 | | | | | | | | 425 | | | | 484,537 | |
4.500% | | | 04/15/50 | | | | | | | | 3,080 | | | | 3,608,692 | |
Verizon Communications, Inc., | | | | | | | | | | | | | |
Sr. Unsec’d. Notes | | | | | | | | | | | | | |
2.650% | | | 11/20/40 | | | | | | | | 3,285 | | | | 3,117,946 | |
3.400% | | | 03/22/41 | | | | | | | | 1,175 | | | | 1,233,119 | |
4.016% | | | 12/03/29 | | | | | | | | 120 | | | | 134,506 | |
4.500% | | | 08/10/33 | | | | | | | | 990 | | | | 1,166,386 | |
| | | | | | | | | | | | | | | | |
| | | | | | | | | | | | | | | 25,937,186 | |
| | | | | | | | | | | | | | | | |
Textiles — 0.0% | | | | | | | | | | | | | | | | |
Mohawk Industries, Inc., | | | | | | | | | | | | | |
Sr. Unsec’d. Notes | | | | | | | | | | | | | |
3.850% | | | 02/01/23 | | | | | | | | 294 | | | | 301,119 | |
| | | | | | | | | | | | | | | | |
Transportation — 0.0% | | | | | | | | | | | | | |
Lima Metro Line 2 Finance Ltd. (Peru), | |
Sr. Sec’d. Notes | | | | | | | | | | | | | | | | |
5.875% | | | 07/05/34 | | | | | | | | 100 | | | | 114,359 | |
| | | | | | | | | | | | | | | | |
Water — 0.1% | | | | | | | | | | | | | | | | |
American Water Capital Corp., | | | | | | | | | | | | | |
Sr. Unsec’d. Notes | | | | | | | | | | | | | |
3.450% | | | 05/01/50 | | | | | | | | 625 | | | | 670,961 | |
| | | | | | | | | | | | | | | | |
TOTAL CORPORATE BONDS | | | | | | | | | | | | | |
(cost $471,009,062) | | | | 495,965,134 | |
| | | | | | | | | | | | | | | | |
|
| MUNICIPAL BONDS — 1.8% | |
California — 0.4% | | | | | | | | | | | | | |
Bay Area Toll Authority, | | | | | | | | | | | | | |
Taxable, Revenue Bonds, BABs, Series S3 | | | | | |
6.907% | | | 10/01/50 | | | | | | | | 1,125 | | | | 1,988,346 | |
State of California, | | | | | | | | | | | | | |
General Obligation Unlimited, BABs | | | | | |
7.300% | | | 10/01/39 | | | | | | | | 1,550 | | | | 2,444,618 | |
General Obligation Unlimited, Taxable, BABs | | | | | |
7.625% | | | 03/01/40 | | | | | | | | 725 | | | | 1,202,373 | |
| | | | | | | | | | | | | | | | |
| | | | | | | | | | | | | | | 5,635,337 | |
| | | | | | | | | | | | | | | | |
SEE NOTES TO FINANCIAL STATEMENTS.
A111
| | | | | | |
| | |
| | PSF PGIM TOTAL RETURN BOND PORTFOLIO (CONTINUED) | | |
| | | | | | |
| |
| SCHEDULE OF INVESTMENTS | | as of December 31, 2021 |
| | | | | | | | | | | | | | | | |
Interest
Rate | | Maturity
Date | | | | | | Principal
Amount
(000)# | | | Value | |
| | | | | | | | | | | | | | | | |
| |
| MUNICIPAL BONDS (continued) | | | | | |
Colorado — 0.1% | | | | | |
Regional Transportation District Sales Tax Revenue, | | | | | |
Revenue Bonds, BABs, Series B | |
5.844% | | | 11/01/50 | | | | | | | | 770 | | | $ | 1,217,659 | |
| | | | | | | | | | | | | | | | |
Illinois — 0.4% | | | | | | | | | | | | | | | | |
Chicago O’Hare International Airport, | | | | | |
Revenue Bonds, BABs, Series B | | | | | |
6.395% | | | 01/01/40 | | | | | | | | 1,380 | | | | 2,063,758 | |
State of Illinois, | | | | | | | | | | | | | | | | |
General Obligation Unlimited, Series A | | | | | |
5.000% | | | 10/01/22 | | | | | | | | 20 | | | | 20,685 | |
General Obligation Unlimited, Series D | | | | | |
5.000% | | | 11/01/22 | | | | | | | | 2,650 | | | | 2,750,777 | |
| | | | | | | | | | | | | | | | |
| | | | | | | | | | | | | | | 4,835,220 | |
| | | | | | | | | | | | | | | | |
New Jersey — 0.4% | |
New Jersey Turnpike Authority, | | | | | | | | | | | | | |
Taxable, Revenue Bonds, BABs, Series A | | | | | |
7.102% | | | 01/01/41 | | | | | | | | 1,175 | | | | 1,855,733 | |
Taxable, Revenue Bonds, BABs, Series F | | | | | |
7.414% | | | 01/01/40 | | | | | | | | 2,050 | | | | 3,335,885 | |
| | | | | | | | | | | | | | | | |
| | | | | | | | | | | | | | | 5,191,618 | |
| | | | | | | | | | | | | | | | |
Ohio — 0.1% | | | | | | | | | | | | | | | | |
Ohio State University (The), | | | | | | | | | | | | | |
Taxable, Revenue Bonds, BABs, Series C | | | | | |
4.910% | | | 06/01/40 | | | | | | | | 695 | | | | 924,595 | |
| | | | | | | | | | | | | | | | |
Oregon — 0.1% | | | | | | | | | | | | | | | | |
State of Oregon Department of Transportation, | | | | | |
Taxable, Revenue Bonds, BABs, Series A | | | | | |
5.834% | | | 11/15/34 | | | | | | | | 615 | | | | 825,893 | |
| | | | | | | | | | | | | | | | |
Pennsylvania — 0.1% | | | | | | | | | | | | | |
Pennsylvania Turnpike Commission, | | | | | |
Revenue Bonds, BABs, Series B | | | | | |
5.511% | | | 12/01/45 | | | | | | | | 800 | | | | 1,142,137 | |
| | | | | | | | | | | | | | | | |
Puerto Rico — 0.2% | |
Puerto Rico Sales Tax Financing Corp. Sales Tax Revenue, | |
Revenue Bonds, Series A-1 | | | | | | | | | |
5.000% | | | 07/01/58 | | | | | | | | 1,710 | | | | 1,979,205 | |
| | | | | | | | | | | | | | | | |
Texas — 0.0% | | | | | | | | | | | | | | | | |
Texas Private Activity Bond Surface Transportation Corp., | |
Taxable, Revenue Bonds, Series B | | | | | | | | | |
3.922% | | | 12/31/49 | | | | | | | | 450 | | | | 503,078 | |
| | | | | | | | | | | | | | | | |
Virginia — 0.0% | | | | | | | | | | | | | | | | |
University of Virginia, | |
Taxable, Revenue Bonds, Series C | | | | | | | | | |
4.179% | | | 09/01/2117 | | | | | | | | 425 | | | | 583,488 | |
| | | | | | | | | | | | | | | | |
TOTAL MUNICIPAL BONDS | | | | | | | | | | | | | |
(cost $16,202,871) | | | | 22,838,230 | |
| | | | | | | | | | | | | | | | |
|
| RESIDENTIAL MORTGAGE-BACKED SECURITIES — 7.1% | |
Alternative Loan Trust, | |
Series 2004-18CB, Class 3A1 | | | | | | | | | | | | | |
5.250% | | | 09/25/35 | | | | | | | | 13 | | | | 12,909 | |
| | | | | | | | | | | | | | | | |
Interest
Rate | | Maturity
Date | | | | | | Principal
Amount
(000)# | | | Value | |
| | | | | | | | | | | | | | | | |
|
| RESIDENTIAL MORTGAGE-BACKED SECURITIES (continued) | |
Bellemeade Re Ltd. (Bermuda), | | | | | | | | | | | | | |
Series 2018-01A, Class M1B, 144A, 1 Month LIBOR + 1.600% (Cap N/A, | |
Floor 0.000%) | | | | | | | | | | | | | | | | |
1.702%(c) | | | 04/25/28 | | | | | | | | 115 | | | $ | 114,501 | |
Series 2018-03A, Class M1B, 144A, 1 Month LIBOR + 1.850% (Cap N/A, | |
Floor 1.850%) | | | | | | | | | | | | | | | | |
1.953%(c) | | | 10/25/28 | | | | | | | | 568 | | | | 567,551 | |
Series 2019-02A, Class M1B, 144A, 1 Month LIBOR + 1.450% (Cap N/A, | |
Floor 1.450%) | | | | | | | | | | | | | | | | |
1.552%(c) | | | 04/25/29 | | | | | | | | 268 | | | | 267,712 | |
Series 2019-04A, Class M1A, 144A, 1 Month LIBOR + 1.400% (Cap N/A, | |
Floor 1.400%) | | | | | | | | | | | | | | | | |
1.502%(c) | | | 10/25/29 | | | | | | | | 31 | | | | 30,640 | |
Series 2019-04A, Class M1B, 144A, 1 Month LIBOR + 2.000% (Cap N/A, | |
Floor 2.000%) | | | | | | | | | | | | | | | | |
2.102%(c) | | | 10/25/29 | | | | | | | | 700 | | | | 700,000 | |
Series 2020-02A, Class M1C, 144A, 1 Month LIBOR + 4.000% (Cap N/A, | |
Floor 4.000%) | | | | | | | | | | | | | | | | |
4.101%(c) | | | 08/26/30 | | | | | | | | 269 | | | | 270,957 | |
Series 2020-03A, Class M1A, 144A, 1 Month LIBOR + 2.000% (Cap N/A, | |
Floor 2.000%) | | | | | | | | | | | | | | | | |
2.102%(c) | | | 10/25/30 | | | | | | | | 85 | | | | 85,052 | |
Series 2020-03A, Class M1B, 144A, 1 Month LIBOR + 2.850% (Cap N/A, | |
Floor 2.850%) | | | | | | | | | | | | | | | | |
2.952%(c) | | | 10/25/30 | | | | | | | | 215 | | | | 215,982 | |
Series 2020-03A, Class M1C, 144A, 1 Month LIBOR + 3.700% (Cap N/A, | |
Floor 3.700%) | | | | | | | | | | | | | | | | |
3.802%(c) | | | 10/25/30 | | | | | | | | 275 | | | | 281,659 | |
Series 2021-03A, Class M1B, 144A, 30 Day Average SOFR + 1.400% | |
(Cap N/A, Floor 1.400%) | | | | | | | | | | | | | |
1.450%(c) | | | 09/25/31 | | | | | | | | 200 | | | | 198,744 | |
BVRT Financing Trust, | | | | | | | | | | | | | | | | |
Series 2021-04, Class F, 144A, SOFR + 2.000% | |
2.050%(c) | | | 09/12/26^ | | | | | | | | 3,677 | | | | 3,677,312 | |
Central Park Funding Trust, | | | | | | | | | | | | | |
Series 2021-01, Class PT, 144A, 1 Month LIBOR + 2.750% (Cap N/A, | |
Floor 2.750%) | | | | | | | | | | | | | | | | |
2.852%(c) | | | 08/29/22 | | | | | | | | 4,277 | | | | 4,264,556 | |
Citigroup Mortgage Loan Trust, | | | | | | | | | | | | | |
Series 2011-12, Class 3A2, 144A | |
2.911%(cc) | | | 09/25/47 | | | | | | | | 295 | | | | 284,139 | |
Connecticut Avenue Securities Trust, | | | | | | | | | | | | | |
Series 2019-R04, Class 2M2, 144A, 1 Month LIBOR + 2.100% (Cap N/A, | |
Floor 0.000%) | | | | | | | | | | | | | | | | |
2.202%(c) | | | 06/25/39 | | | | | | | | 79 | | | | 78,779 | |
Series 2019-R07, Class 1M2, 144A, 1 Month LIBOR + 2.100% (Cap N/A, | |
Floor 0.000%) | | | | | | | | | | | | | | | | |
2.203%(c) | | | 10/25/39 | | | | | | | | 203 | | | | 203,650 | |
Credit Suisse Mortgage Trust, | | | | | | | | | | | | | |
Series 2020-RPL05, Class A1, 144A | | | | | |
3.023%(cc) | | | 08/25/60 | | | | | | | | 411 | | | | 413,668 | |
Eagle Re Ltd. (Bermuda), | | | | | | | | | | | | | |
Series 2018-01, Class M1, 144A, 1 Month LIBOR + 1.700% (Cap N/A, | |
Floor 1.700%) | | | | | | | | | | | | | | | | |
1.802%(c) | | | 11/25/28 | | | | | | | | 585 | | | | 585,019 | |
SEE NOTES TO FINANCIAL STATEMENTS.
A112
| | | | | | |
| | |
| | PSF PGIM TOTAL RETURN BOND PORTFOLIO (CONTINUED) | | |
| | | | | | |
| |
| SCHEDULE OF INVESTMENTS | | as of December 31, 2021 |
| | | | | | | | | | | | | | | | |
Interest
Rate | | Maturity Date | | | | | | Principal Amount (000)# | | | Value | |
| | | | | | | | | | | | | | | | |
|
RESIDENTIAL MORTGAGE-BACKED SECURITIES
(continued) | |
Series 2019-01, Class M1B, 144A, 1 Month LIBOR + 1.800% (Cap N/A, Floor 0.000%) | |
1.902%(c) | | | 04/25/29 | | | | | | | | 180 | | | $ | 180,470 | |
Series 2020-02, Class M1C, 144A, 1 Month LIBOR + 4.500% (Cap N/A, Floor 0.000%) | |
4.602%(c) | | | 10/25/30 | | | | | | | | 176 | | | | 175,761 | |
Series 2021-01, Class M1B, 144A, 30 Day Average SOFR + 2.150% (Cap N/A, Floor 2.150%) | |
2.200%(c) | | | 10/25/33 | | | | | | | | 605 | | | | 607,431 | |
Series 2021-01, Class M1C, 144A, 30 Day Average SOFR + 2.700% (Cap N/A, Floor 2.700%) | |
2.750%(c) | | | 10/25/33 | | | | | | | | 940 | | | | 955,603 | |
Series 2021-02, Class M1C, 144A, 30 Day Average SOFR + 3.450% (Cap N/A, Floor 3.450%) | |
3.500%(c) | | | 04/25/34 | | | | | | | | 910 | | | | 909,910 | |
Fannie Mae Connecticut Avenue Securities, | |
Series 2017-C07, Class 1M2, 1 Month LIBOR + 2.400% (Cap N/A, Floor 2.400%) | |
2.502%(c) | | | 05/25/30 | | | | | | | | 456 | | | | 463,076 | |
Series 2018-C03, Class 1M2, 1 Month LIBOR + 2.150% (Cap N/A, Floor 2.150%) | |
2.253%(c) | | | 10/25/30 | | | | | | | | 286 | | | | 289,419 | |
Fannie Mae REMICS, | |
Series 2011-116, Class ZA | |
3.500% | | | 11/25/41 | | | | | | | | 2,066 | | | | 2,190,780 | |
Series 2012-34, Class EB | |
4.000% | | | 04/25/42 | | | | | | | | 1,575 | | | | 1,786,707 | |
FHLMC Structured Agency Credit Risk Debt Notes, | |
Series 2020-HQA05, Class B1, 144A, 30 Day Average SOFR + 4.000% (Cap N/A, Floor 0.000%) | |
4.050%(c) | | | 11/25/50 | | | | | | | | 900 | | | | 939,815 | |
Series 2020-HQA05, Class M2, 144A, 30 Day Average SOFR + 2.600% (Cap N/A, Floor 0.000%) | |
2.650%(c) | | | 11/25/50 | | | | | | | | 3,961 | | | | 4,001,351 | |
Series 2021-DNA02, Class B1, 144A, 30 Day Average SOFR + 3.400% (Cap N/A, Floor 0.000%) | |
3.450%(c) | | | 08/25/33 | | | | | | | | 3,035 | | | | 3,117,633 | |
Series 2021-DNA07, Class B1, 144A, 30 Day Average SOFR + 3.650% (Cap N/A, Floor 0.000%) | |
3.700%(c) | | | 11/25/41 | | | | | | | | 755 | | | | 766,749 | |
FHLMC Structured Agency Credit Risk REMIC Trust, | |
Series 2020-DNA02, Class M2, 144A, 1 Month LIBOR + 1.850% (Cap N/A, Floor 1.850%) | |
1.953%(c) | | | 02/25/50 | | | | | | | | 852 | | | | 855,283 | |
Series 2020-DNA03, Class B1, 144A, 1 Month LIBOR + 5.100% (Cap N/A, Floor 0.000%) | |
5.203%(c) | | | 06/25/50 | | | | | | | | 205 | | | | 211,461 | |
Series 2020-DNA03, Class M2, 144A, 1 Month LIBOR + 3.000% (Cap N/A, Floor 0.000%) | |
3.103%(c) | | | 06/25/50 | | | | | | | | 73 | | | | 72,933 | |
Series 2020-DNA04, Class B1, 144A, 1 Month LIBOR + 6.000% (Cap N/A, Floor 0.000%) | |
6.103%(c) | | | 08/25/50 | | | | | | | | 1,570 | | | | 1,651,705 | |
Series 2020-DNA04, Class M2, 144A, 1 Month LIBOR + 3.750% (Cap N/A, Floor 0.000%) | |
3.853%(c) | | | 08/25/50 | | | | | | | | 219 | | | | 219,655 | |
| | | | | | | | | | | | | | | | |
Interest Rate | | Maturity Date | | | | | | Principal Amount (000)# | | | Value | |
| | | | | | | | | | | | | | | | |
|
RESIDENTIAL MORTGAGE-BACKED SECURITIES
(continued) | |
Series 2020-DNA05, Class B1, 144A, 30 Day Average SOFR + 4.800% (Cap N/A, Floor 0.000%) | |
4.850%(c) | | | 10/25/50 | | | | | | | | 670 | | | $ | 709,287 | |
Series 2020-DNA05, Class M2, 144A, 30 Day Average SOFR + 2.800% (Cap N/A, Floor 0.000%) | |
2.850%(c) | | | 10/25/50 | | | | | | | | 354 | | | | 357,021 | |
Series 2020-HQA02, Class M2, 144A, 1 Month LIBOR + 3.100% (Cap N/A, Floor 0.000%) | |
3.203%(c) | | | 03/25/50 | | | | | | | | 58 | | | | 58,263 | |
Series 2020-HQA03, Class M2, 144A, 1 Month LIBOR + 3.600% (Cap N/A, Floor 0.000%) | |
3.703%(c) | | | 07/25/50 | | | | | | | | 526 | | | | 527,892 | |
Series 2020-HQA04, Class B1, 144A, 1 Month LIBOR + 5.250% (Cap N/A, Floor 0.000%) | |
5.353%(c) | | | 09/25/50 | | | | | | | | 320 | | | | 333,287 | |
Series 2020-HQA04, Class M2, 144A, 1 Month LIBOR + 3.150% (Cap N/A, Floor 0.000%) | |
3.253%(c) | | | 09/25/50 | | | | | | | | 73 | | | | 73,193 | |
Series 2021-DNA05, Class B1, 144A, 30 Day Average SOFR + 3.050% (Cap N/A, Floor 0.000%) | |
3.100%(c) | | | 01/25/34 | | | | | | | | 590 | | | | 592,600 | |
Series 2021-DNA05, Class M2, 144A, 30 Day Average SOFR + 1.650% (Cap N/A, Floor 0.000%) | |
1.700%(c) | | | 01/25/34 | | | | | | | | 390 | | | | 391,670 | |
Series 2021-HQA01, Class M2, 144A, 30 Day Average SOFR + 2.250% (Cap N/A, Floor 0.000%) | |
2.300%(c) | | | 08/25/33 | | | | | | | | 4,200 | | | | 4,227,781 | |
Series 2021-HQA03, Class B1, 144A, 30 Day Average SOFR + 3.350% (Cap N/A, Floor 0.000%) | |
3.400%(c) | | | 09/25/41 | | | | | | | | 540 | | | | 537,311 | |
Series 2021-HQA03, Class M2, 144A, 30 Day Average SOFR + 2.100% (Cap N/A, Floor 0.000%) | |
2.150%(c) | | | 09/25/41 | | | | | | | | 1,020 | | | | 1,019,363 | |
Series 2021-HQA04, Class B1, 144A, 30 Day Average SOFR + 3.750% (Cap N/A, Floor 0.000%) | |
3.800%(c) | | | 12/25/41 | | | | | | | | 260 | | | | 261,464 | |
Series 2021-HQA04, Class M2, 144A, 30 Day Average SOFR + 2.350% (Cap N/A, Floor 0.000%) | |
2.400%(c) | | | 12/25/41 | | | | | | | | 700 | | | | 701,753 | |
FHLMC Structured Agency Credit Risk Trust, | |
Series 2018-DNA03, Class M1, 144A, 1 Month LIBOR + 0.750% (Cap N/A, Floor 0.000%) | |
0.853%(c) | | | 09/25/48 | | | | | | | | 3 | | | | 2,881 | |
Series 2019-DNA01, Class M2, 144A, 1 Month LIBOR + 2.650% (Cap N/A, Floor 0.000%) | |
2.753%(c) | | | 01/25/49 | | | | | | | | 222 | | | | 224,319 | |
Freddie Mac REMICS, | |
Series 4289, Class WZ | |
3.000% | | | 01/15/44 | | | | | | | | 802 | | | | 844,605 | |
Series 4768, Class GA | |
3.500% | | | 09/15/45 | | | | | | | | 723 | | | | 747,227 | |
Series 4768, Class VB | |
3.500% | | | 06/15/38 | | | | | | | | 182 | | | | 183,078 | |
Series 4939, Class KT | |
3.000% | | | 07/15/48 | | | | | | | | 651 | | | | 672,218 | |
SEE NOTES TO FINANCIAL STATEMENTS.
A113
| | | | | | |
| | |
| | PSF PGIM TOTAL RETURN BOND PORTFOLIO (CONTINUED) | | |
| | | | | | |
| |
| SCHEDULE OF INVESTMENTS | | as of December 31, 2021 |
| | | | | | | | | | | | | | | | |
Interest
Rate | | Maturity
Date | | | | | | Principal
Amount
(000)# | | | Value | |
| | | | | | | | | | | | | | | | |
|
RESIDENTIAL MORTGAGE-BACKED SECURITIES
(continued) | |
GCAT Asset-Backed Notes, | |
Series 2021-01, Class A1, 144A | |
2.487% | | | 11/25/49 | | | | | | | | 3,639 | | | $ | 3,631,841 | |
GSMSC Resecuritization Trust, | |
Series 2015-03R, Class 1A2, 144A, 1 Month LIBOR + 0.140% (Cap N/A, Floor 0.140%) | |
0.243%(c) | | | 01/26/37 | | | | | | | | 315 | | | | 313,203 | |
Home Re Ltd. (Bermuda), | |
Series 2018-01, Class M1, 144A, 1 Month LIBOR + 1.600% (Cap N/A, Floor 0.000%) | |
1.702%(c) | | | 10/25/28 | | | | | | | | 151 | | | | 150,927 | |
Series 2019-01, Class M1, 144A, 1 Month LIBOR + 1.650% (Cap N/A, Floor 0.000%) | |
1.752%(c) | | | 05/25/29 | | | | | | | | 179 | | | | 179,316 | |
Series 2020-01, Class M1B, 144A, 1 Month LIBOR + 3.250% (Cap N/A, Floor 3.250%) | |
3.352%(c) | | | 10/25/30 | | | | | | | | 348 | | | | 349,043 | |
Series 2020-01, Class M1C, 144A, 1 Month LIBOR + 4.150% (Cap N/A, Floor 4.150%) | |
4.252%(c) | | | 10/25/30 | | | | | | | | 200 | | | | 202,357 | |
Series 2021-02, Class M1B, 144A, 30 Day Average SOFR + 1.600% (Cap N/A, Floor 0.000%) | |
1.650%(c) | | | 01/25/34 | | | | | | | | 530 | | | | 528,689 | |
Series 2021-02, Class M1C, 144A, 30 Day Average SOFR + 2.800% (Cap N/A, Floor 0.000%) | |
2.850%(c) | | | 01/25/34 | | | | | | | | 815 | | | | 808,927 | |
Legacy Mortgage Asset Trust, | |
Series 2019-GS06, Class A1, 144A | |
3.000% | | | 06/25/59 | | | | | | | | 503 | | | | 503,539 | |
Series 2020-GS01, Class A1, 144A | |
2.882% | | | 10/25/59 | | | | | | | | 1,120 | | | | 1,123,675 | |
Series 2020-SL01, Class A, 144A | |
2.734% | | | 01/25/60 | | | | | | | | 730 | | | | 733,617 | |
MRA Issuance Trust, | |
Series 2020-07, Class A, 144A, 1 Month LIBOR + 1.300% (Cap N/A, Floor 1.600%) | |
1.399%(c) | | | 09/15/22 | | | | | | | | 11,580 | | | | 11,558,306 | |
Series 2021-09, 144A, 1 Month LIBOR + 1.300% | |
1.404%(c) | | | 07/15/22^ | | | | | | | | 6,100 | | | | 6,100,000 | |
Series 2021-EBO03, Class A1X, 144A, 1 Month LIBOR + 1.750% (Cap N/A, Floor 1.750%) | |
1.849%(c) | | | 03/31/23 | | | | | | | | 3,430 | | | | 3,434,617 | |
Series 2021-EBO03, Class A2, 144A, 1 Month LIBOR + 2.750% (Cap N/A, Floor 2.750%) | |
2.849%(c) | | | 03/31/23 | | | | | | | | 3,600 | | | | 3,605,592 | |
Series 2021-EBO06, Class A1X, 144A, 1 Month LIBOR + 1.600% (Cap N/A, Floor 1.600%) | |
1.699%(c) | | | 02/16/22 | | | | | | | | 4,433 | | | | 4,430,643 | |
New Residential Mortgage Loan Trust, | |
Series 2018-04A, Class A1S, 144A, 1 Month LIBOR + 0.750% (Cap N/A, Floor 0.750%) | |
0.853%(c) | | | 01/25/48 | | | | | | | | 596 | | | | 596,177 | |
Oaktown Re II Ltd. (Bermuda), | |
Series 2018-01A, Class M1, 144A, 1 Month LIBOR + 1.550% (Cap N/A, Floor 0.000%) | |
1.652%(c) | | | 07/25/28 | | | | | | | | 103 | | | | 103,277 | |
| | | | | | | | | | | | | | | | |
Interest
Rate | | Maturity
Date | | | | | | Principal
Amount
(000)# | | | Value | |
| | | | | | | | | | | | | | | | |
|
RESIDENTIAL MORTGAGE-BACKED SECURITIES
(continued) | |
Oaktown Re III Ltd. (Bermuda), | |
Series 2019-01A, Class M1A, 144A, 1 Month LIBOR + 1.400% (Cap N/A, Floor 1.400%) | |
1.502%(c) | | | 07/25/29 | | | | | | | | 46 | | | $ | 46,393 | |
Oaktown Re V Ltd. (Bermuda), | |
Series 2020-02A, Class M1B, 144A, 1 Month LIBOR + 3.600% (Cap N/A, Floor 3.600%) | |
3.702%(c) | | | 10/25/30 | | | | | | | | 225 | | | | 225,420 | |
Oaktown Re VII Ltd. (Bermuda), | |
Series 2021-02, Class M1B, 144A, 30 Day Average SOFR + 2.900% (Cap N/A, Floor 2.900%) | |
2.950%(c) | | | 04/25/34 | | | | | | | | 900 | | | | 892,530 | |
Radnor Re Ltd. (Bermuda), | |
Series 2018-01, Class M1, 144A, 1 Month LIBOR + 1.400% (Cap N/A, Floor 0.000%) | |
1.502%(c) | | | 03/25/28 | | | | | | | | 27 | | | | 27,094 | |
Series 2018-01, Class M2, 144A, 1 Month LIBOR + 2.700% (Cap N/A, Floor 0.000%) | |
2.802%(c) | | | 03/25/28 | | | | | | | | 360 | | | | 360,000 | |
Series 2020-01, Class M1A, 144A, 1 Month LIBOR + 0.950% (Cap N/A, Floor 0.950%) | |
1.052%(c) | | | 01/25/30 | | | | | | | | 500 | | | | 496,349 | |
Series 2020-01, Class M1B, 144A, 1 Month LIBOR + 1.450% (Cap N/A, Floor 1.450%) | |
1.552%(c) | | | 01/25/30 | | | | | | | | 1,500 | | | | 1,475,422 | |
Series 2020-02, Class M1C, 144A, 1 Month LIBOR + 4.600% (Cap N/A, Floor 4.600%) | |
4.702%(c) | | | 10/25/30 | | | | | | | | 144 | | | | 144,009 | |
Series 2021-02, Class M1A, 144A, 30 Day Average SOFR + 1.850% (Cap N/A, Floor 1.850%) | |
1.898%(c) | | | 11/25/31 | | | | | | | | 770 | | | | 770,905 | |
Series 2021-02, Class M1B, 144A, 30 Day Average SOFR + 3.700% (Cap N/A, Floor 3.700%) | |
3.748%(c) | | | 11/25/31 | | | | | | | | 900 | | | | 906,698 | |
Station Place Securitization Trust, | |
Series 2021-08, Class A, 144A, 1 Month LIBOR + 0.800% (Cap N/A, Floor 0.800%) | |
0.902%(c) | | | 06/20/22 | | | | | | | | 3,410 | | | | 3,412,943 | |
Structured Adjustable Rate Mortgage Loan Trust, | |
Series 2004-01, Class 4A3 | |
2.431%(cc) | | | 02/25/34 | | | | | | | | 209 | | | | 210,940 | |
Series 2004-18, Class 3A1 | |
2.413%(cc) | | | 12/25/34 | | | | | | | | 1,311 | | | | 1,317,564 | |
ZH Trust, | |
Series 2021-01, Class A, 144A | |
2.253% | | | 02/18/27 | | | | | | | | 410 | | | | 407,276 | |
| | | | | | | | | | | | | | | | |
TOTAL RESIDENTIAL MORTGAGE-BACKED
SECURITIES | |
(cost $92,594,627) | | | | 93,161,074 | |
| | | | | | | | | | | | | | | | |
|
| SOVEREIGN BONDS — 3.2% | |
1MDB Global Investments Ltd. (Malaysia), | |
Sr. Unsec’d. Notes | |
4.400% | | | 03/09/23 | | | | | | | | 2,000 | | | | 2,009,507 | |
Bermuda Government International Bond (Bermuda), | |
Sr. Unsec’d. Notes, 144A | |
2.375% | | | 08/20/30 | | | | | | | | 570 | | | | 568,575 | |
SEE NOTES TO FINANCIAL STATEMENTS.
A114
| | | | | | |
| | |
| | PSF PGIM TOTAL RETURN BOND PORTFOLIO (CONTINUED) | | |
| | | | | | |
| |
| SCHEDULE OF INVESTMENTS | | as of December 31, 2021 |
| | | | | | | | | | | | | | | | |
Interest
Rate | | Maturity
Date | | | | | | Principal
Amount
(000)# | | | Value | |
| | | | | | | | | | | | | | | | |
| |
| SOVEREIGN BONDS (continued) | | | | | |
Brazil Minas SPE via State of Minas Gerais (Brazil), | |
Gov’t. Gtd. Notes | |
5.333% | | | 02/15/28 | | | | | | | | 1,124 | | | $ | 1,170,683 | |
Brazilian Government International Bond (Brazil), | |
Sr. Unsec’d. Notes | |
4.500% | | | 05/30/29 | | | | | | | | 725 | | | | 742,511 | |
Colombia Government International Bond (Colombia), | |
Sr. Unsec’d. Notes | |
4.500% | | | 01/28/26 | | | | | | | | 250 | | | | 261,818 | |
Dominican Republic International Bond (Dominican Republic), | |
Sr. Unsec’d. Notes, 144A | |
6.000% | | | 07/19/28 | | | | | | | | 575 | | | | 642,795 | |
Egypt Government International Bond (Egypt), | |
Sr. Unsec’d. Notes, 144A, MTN | |
4.750% | | | 04/16/26 | | | | EUR | | | | 300 | | | | 330,269 | |
Hellenic Republic Government International Bond (Greece), | |
Sr. Unsec’d. Notes | |
5.200% | | | 07/17/34 | | | | EUR | | | | 1,500 | | | | 2,308,678 | |
Hungary Government International Bond (Hungary), | |
Sr. Unsec’d. Notes | |
5.375% | | | 03/25/24 | | | | | | | | 290 | | | | 315,281 | |
Sr. Unsec’d. Notes, 144A | |
3.125% | | | 09/21/51 | | | | | | | | 370 | | | | 364,333 | |
Indonesia Government International Bond (Indonesia), | |
Sr. Unsec’d. Notes | |
1.100% | | | 03/12/33 | | | | EUR | | | | 410 | | | | 450,338 | |
1.450% | | | 09/18/26 | | | | EUR | | | | 375 | | | | 441,494 | |
3.375% | | | 07/30/25 | | | | EUR | | | | 3,125 | | | | 3,911,923 | |
Sr. Unsec’d. Notes, EMTN | |
3.750% | | | 06/14/28 | | | | EUR | | | | 1,250 | | | | 1,653,141 | |
Japan Bank for International Cooperation (Japan), | |
Gov’t. Gtd. Notes | |
2.500% | | | 05/23/24 | | | | | | | | 1,000 | | | | 1,035,447 | |
Japan Finance Organization for Municipalities (Japan), | |
Sr. Unsec’d. Notes, 144A | |
3.375% | | | 09/27/23 | | | | | | | | 600 | | | | 625,411 | |
Sr. Unsec’d. Notes, 144A, MTN | |
1.750% | | | 09/05/24 | | | | | | | | 600 | | | | 609,386 | |
2.625% | | | 04/20/22 | | | | | | | | 1,000 | | | | 1,006,610 | |
3.000% | | | 03/12/24 | | | | | | | | 600 | | | | 625,481 | |
Lithuania Government International Bond (Lithuania), | |
Sr. Unsec’d. Notes | |
6.625% | | | 02/01/22 | | | | | | | | 1,000 | | | | 1,004,618 | |
Panama Government International Bond (Panama), | |
Sr. Unsec’d. Notes | |
3.750% | | | 03/16/25 | | | | | | | | 450 | | | | 476,833 | |
Qatar Government International Bond (Qatar), | |
Sr. Unsec’d. Notes, 144A | |
5.103% | | | 04/23/48 | | | | | | | | 780 | | | | 1,054,435 | |
Republic of Italy Government International Bond (Italy), | |
Sr. Unsec’d. Notes | |
2.875% | | | 10/17/29 | | | | | | | | 200 | | | | 204,462 | |
Sr. Unsec’d. Notes, EMTN | |
6.000% | | | 08/04/28 | | | | GBP | | | | 1,995 | | | | 3,366,824 | |
Sr. Unsec’d. Notes, MTN | |
5.375% | | | 06/15/33 | | | | | | | | 4,730 | | | | 5,853,690 | |
| | | | | | | | | | | | | | | | |
Interest
Rate | | Maturity
Date | | | | | | Principal
Amount
(000)# | | | Value | |
| | | | | | | | | | | | | | | | |
| |
| SOVEREIGN BONDS (continued) | | | | | |
Romanian Government International Bond (Romania), | |
Sr. Unsec’d. Notes, 144A, MTN | |
3.875% | | | 10/29/35 | | | | EUR | | | | 1,156 | | | $ | 1,425,574 | |
Sr. Unsec’d. Notes, EMTN | |
3.875% | | | 10/29/35 | | | | EUR | | | | 940 | | | | 1,159,204 | |
4.125% | | | 03/11/39 | | | | EUR | | | | 254 | | | | 309,397 | |
Saudi Government International Bond (Saudi Arabia), | |
Sr. Unsec’d. Notes, 144A, MTN | |
4.000% | | | 04/17/25 | | | | | | | | 675 | | | | 727,185 | |
Serbia International Bond (Serbia), | |
Sr. Unsec’d. Notes | |
1.500% | | | 06/26/29 | | | | EUR | | | | 442 | | | | 487,033 | |
3.125% | | | 05/15/27 | | | | EUR | | | | 237 | | | | 287,597 | |
Sr. Unsec’d. Notes, 144A | |
1.650% | | | 03/03/33 | | | | EUR | | | | 610 | | | | 646,164 | |
2.125% | | | 12/01/30 | | | | | | | | 1,435 | | | | 1,345,720 | |
Tokyo Metropolitan Government (Japan), | |
Sr. Unsec’d. Notes, 144A | |
2.500% | | | 06/08/22 | | | | | | | | 600 | | | | 605,138 | |
Ukraine Government International Bond (Ukraine), | |
Sr. Unsec’d. Notes | |
7.750% | | | 09/01/22 | | | | | | | | 920 | | | | 911,660 | |
8.994% | | | 02/01/24 | | | | | | | | 200 | | | | 199,493 | |
Sr. Unsec’d. Notes, 144A | |
4.375% | | | 01/27/30 | | | | EUR | | | | 1,090 | | | | 996,984 | |
7.750% | | | 09/01/22 | | | | | | | | 930 | | | | 921,569 | |
8.994% | | | 02/01/24 | | | | | | | | 200 | | | | 199,493 | |
9.750% | | | 11/01/28 | | | | | | | | 400 | | | | 404,824 | |
Uruguay Government International Bond (Uruguay), | |
Sr. Unsec’d. Notes | |
4.975% | | | 04/20/55 | | | | | | | | 500 | | | | 656,252 | |
| | | | | | | | | | | | | | | | |
TOTAL SOVEREIGN BONDS | |
(cost $40,260,435) | | | | 42,317,830 | |
| | | | | | | | | | | | | | | | |
|
| U.S. GOVERNMENT AGENCY OBLIGATIONS — 1.7% | |
Federal Home Loan Mortgage Corp. | |
3.500% | | | 02/01/47 | | | | | | | | 952 | | | | 1,013,976 | |
5.500% | | | 10/01/33 | | | | | | | | 442 | | | | 505,098 | |
5.500% | | | 06/01/34 | | | | | | | | 3 | | | | 3,887 | |
6.000% | | | 11/01/33 | | | | | | | | 68 | | | | 75,218 | |
6.000% | | | 05/01/34 | | | | | | | | 46 | | | | 51,095 | |
6.000% | | | 06/01/34 | | | | | | | | 70 | | | | 76,946 | |
6.250% | | | 07/15/32 | (k) | | | | | | | 830 | | | | 1,194,669 | |
6.500% | | | 07/01/32 | | | | | | | | 10 | | | | 10,716 | |
6.500% | | | 07/01/32 | | | | | | | | 16 | | | | 18,160 | |
6.500% | | | 08/01/32 | | | | | | | | 23 | | | | 25,605 | |
6.500% | | | 08/01/32 | | | | | | | | 24 | | | | 26,582 | |
6.500% | | | 08/01/32 | | | | | | | | 26 | | | | 28,574 | |
6.500% | | | 09/01/32 | | | | | | | | 28 | | | | 31,268 | |
6.500% | | | 09/01/32 | | | | | | | | 76 | | | | 83,707 | |
6.750% | | | 03/15/31 | | | | | | | | 600 | | | | 860,136 | |
Federal National Mortgage Assoc. | |
2.500% | | | TBA | | | | | | | | 6,000 | | | | 6,121,435 | |
3.000% | | | TBA | | | | | | | | 5,000 | | | | 5,172,199 | |
4.500% | | | 08/01/40 | | | | | | | | 1,087 | | | | 1,201,745 | |
5.500% | | | 02/01/33 | | | | | | | | 6 | | | | 6,375 | |
5.500% | | | 02/01/33 | | | | | | | | 9 | | | | 9,993 | |
5.500% | | | 03/01/33 | | | | | | | | 15 | | | | 17,339 | |
SEE NOTES TO FINANCIAL STATEMENTS.
A115
| | | | | | |
| | |
| | PSF PGIM TOTAL RETURN BOND PORTFOLIO (CONTINUED) | | |
| | | | | | |
| |
| SCHEDULE OF INVESTMENTS | | as of December 31, 2021 |
| | | | | | | | | | | | | | | | |
Interest
Rate | | Maturity
Date | | | | | | Principal
Amount
(000)# | | | Value | |
| | | | | | | | | | | | | | | | |
U.S. GOVERNMENT AGENCY OBLIGATIONS (continued) | |
5.500% | | | 03/01/33 | | | | | | | | 25 | | | $ | 28,190 | |
5.500% | | | 03/01/33 | | | | | | | | 28 | | | | 32,153 | |
5.500% | | | 04/01/33 | | | | | | | | 3 | | | | 3,901 | |
5.500% | | | 04/01/33 | | | | | | | | 17 | | | | 19,425 | |
5.500% | | | 04/01/33 | | | | | | | | 21 | | | | 23,561 | |
5.500% | | | 04/01/33 | | | | | | | | 24 | | | | 26,690 | |
5.500% | | | 07/01/33 | | | | | | | | 15 | | | | 16,373 | |
5.500% | | | 07/01/33 | | | | | | | | 21 | | | | 23,207 | |
5.500% | | | 08/01/33 | | | | | | | | 14 | | | | 15,813 | |
5.500% | | | 02/01/34 | | | | | | | | 19 | | | | 21,823 | |
5.500% | | | 04/01/34 | | | | | | | | 14 | | | | 15,739 | |
5.500% | | | 06/01/34 | | | | | | | | 26 | | | | 28,832 | |
6.000% | | | 10/01/33 | | | | | | | | 2 | | | | 1,743 | |
6.000% | | | 10/01/33 | | | | | | | | 175 | | | | 195,967 | |
6.000% | | | 03/01/34 | | | | | | | | 49 | | | | 54,275 | |
6.000% | | | 02/01/35 | | | | | | | | 132 | | | | 151,978 | |
6.000% | | | 11/01/36 | | | | | | | | 30 | | | | 34,278 | |
6.250% | | | 05/15/29 | (k) | | | | | | | 535 | | | | 710,718 | |
6.500% | | | 08/01/32 | | | | | | | | 73 | | | | 80,523 | |
6.500% | | | 09/01/32 | | | | | | | | 76 | | | | 84,806 | |
6.500% | | | 09/01/32 | | | | | | | | 112 | | | | 128,921 | |
6.500% | | | 10/01/32 | | | | | | | | 51 | | | | 57,226 | |
6.500% | | | 04/01/33 | | | | | | | | 92 | | | | 106,217 | |
6.500% | | | 11/01/33 | | | | | | | | 3 | | | | 3,199 | |
6.625% | | | 11/15/30 | (k) | | | | | | | 530 | | | | 747,786 | |
7.000% | | | 05/01/32 | | | | | | | | 51 | | | | 53,972 | |
7.000% | | | 06/01/32 | | | | | | | | 4 | | | | 4,432 | |
7.125% | | | 01/15/30 | | | | | | | | 785 | | | | 1,112,687 | |
Government National Mortgage Assoc. | | | | | | | | | |
3.500% | | | 01/20/48 | | | | | | | | 149 | | | | 156,575 | |
4.000% | | | 02/20/49 | | | | | | | | 323 | | | | 341,229 | |
5.500% | | | 01/15/33 | | | | | | | | 40 | | | | 45,905 | |
5.500% | | | 02/15/33 | | | | | | | | 24 | | | | 26,536 | |
5.500% | | | 05/15/33 | | | | | | | | 106 | | | | 116,728 | |
5.500% | | | 05/15/33 | | | | | | | | 155 | | | | 170,671 | |
5.500% | | | 06/15/33 | | | | | | | | 159 | | | | 177,606 | |
5.500% | | | 09/15/33 | | | | | | | | 52 | | | | 57,260 | |
5.500% | | | 07/15/35 | | | | | | | | 36 | | | | 41,960 | |
6.000% | | | 12/15/32 | | | | | | | | 82 | | | | 95,728 | |
6.000% | | | 11/15/33 | | | | | | | | 31 | | | | 35,971 | |
6.000% | | | 01/15/34 | | | | | | | | 7 | | | | 8,097 | |
6.000% | | | 06/20/34 | | | | | | | | 210 | | | | 241,549 | |
6.000% | | | 11/15/34 | | | | | | | | 289 | | | | 332,363 | |
6.500% | | | 09/15/32 | | | | | | | | 31 | | | | 34,490 | |
6.500% | | | 09/15/32 | | | | | | | | 111 | | | | 122,322 | |
6.500% | | | 09/15/32 | | | | | | | | 127 | | | | 140,083 | |
6.500% | | | 11/15/33 | | | | | | | | 82 | | | | 90,329 | |
| | | | | | | | | | | | | | | | |
TOTAL U.S. GOVERNMENT AGENCY OBLIGATIONS
(cost $21,888,485) | | | | 22,554,560 | |
| | | | | | | | | | | | | | | | |
U.S. TREASURY OBLIGATIONS — 10.0% | |
U.S. Treasury Bonds | |
1.750% | | | 08/15/41 | | | | | | | | 1,190 | | | | 1,152,998 | |
2.000% | | | 11/15/41 | | | | | | | | 3,185 | | | | 3,220,334 | |
2.000% | | | 08/15/51 | | | | | | | | 11,765 | | | | 12,011,330 | |
2.250% | | | 05/15/41 | (h) | | | | | | | 65,845 | | | | 69,116,673 | |
2.500% | | | 02/15/46 | (k) | | | | | | | 2,650 | | | | 2,929,078 | |
2.500% | | | 05/15/46 | (k) | | | | | | | 965 | | | | 1,067,230 | |
| | | | | | | | | | | | |
Interest
Rate | | Maturity
Date | | | Principal
Amount
(000)# | | | Value | |
| | | | | | | | | | | | |
U.S. TREASURY OBLIGATIONS (continued) | |
3.000% | | | 05/15/45 | (k) | | | 4,065 | | | $ | 4,866,567 | |
3.000% | | | 02/15/48 | | | | 13,300 | | | | 16,246,781 | |
3.125% | | | 02/15/43 | (k) | | | 3,095 | | | | 3,731,893 | |
3.625% | | | 08/15/43 | | | | 725 | | | | 940,801 | |
U.S. Treasury Strips Coupon | | | | | | | | | |
1.467%(s) | | | 11/15/41 | | | | 500 | | | | 330,059 | |
2.056%(s) | | | 11/15/38 | | | | 130 | | | | 93,199 | |
2.071%(s) | | | 08/15/41 | | | | 150 | | | | 99,721 | |
2.208%(s) | | | 05/15/39 | | | | 3,425 | | | | 2,422,920 | |
2.335%(s) | | | 08/15/44 | | | | 2,500 | | | | 1,560,644 | |
2.364%(s) | | | 05/15/45 | | | | 3,420 | | | | 2,101,964 | |
2.377%(s) | | | 08/15/45 | | | | 1,250 | | | | 765,625 | |
2.387%(s) | | | 05/15/43 | | | | 4,015 | | | | 2,567,404 | |
2.395%(s) | | | 11/15/43 | | | | 619 | | | | 392,267 | |
2.423%(s) | | | 11/15/40 | | | | 430 | | | | 292,131 | |
2.423%(s) | | | 05/15/44 | | | | 7,225 | | | | 4,538,768 | |
3.176%(s) | | | 08/15/40 | | | | 120 | | | | 81,909 | |
| | | | | | | | | | | | |
TOTAL U.S. TREASURY OBLIGATIONS
(cost $129,128,676) | | | | | | | | | | | 130,530,296 | |
| | | | | | | | | | | | |
| | | |
| | | | | | Shares | | | | |
COMMON STOCKS — 0.6% | | | | | | | | | |
Gas Utilities — 0.1% | | | | | | | | | | | | |
Ferrellgas Partners LP (Class B Stock) | | | | 6,372 | | | | 1,529,280 | |
| | | | | | | | | | | | |
Oil, Gas & Consumable Fuels — 0.5% | | | | | | | | | | | | |
Chesapeake Energy Corp.(a) | | | | 89,905 | | | | 5,800,670 | |
Chesapeake Energy Corp. Backstop Commitment | | | | | | | 517 | | | | 33,357 | |
| | | | | | | | | | | | |
| | | | | | | | | | | 5,834,027 | |
| | | | | | | | | | | | |
| | | |
| TOTAL COMMON STOCKS | | | | | | | | | | | | |
(cost $3,076,094) | | | | 7,363,307 | |
| | | | | | | | | | | | |
| | | |
| PREFERRED STOCKS — 0.2% | | | | | | | | | | | | |
Banks — 0.1% | | | | | | | | | | | | |
Citigroup Capital XIII, 6.499%(c), 3 Month LIBOR + 6.370%, Maturing 10/30/40 | | | | | | | 45,000 | | | | 1,255,500 | |
| | | | | | | | | | | | |
Capital Markets — 0.1% | | | | | | | | | | | | |
State Street Corp., 5.350%(c), 3 Month LIBOR + 3.709%, Series G, Maturing 03/15/26(oo) | | | | | | | 35,000 | | | | 1,001,350 | |
| | | | | | | | | | | | |
| | | |
| TOTAL PREFERRED STOCKS | | | | | | | | | | | | |
(cost $2,000,000) | | | | 2,256,850 | |
| | | | | | | | | | | | |
| | | |
| | | | | | Units | | | | |
| | | |
| WARRANTS* — 0.0% | | | | | | | | | | | | |
Chemicals | | | | | | | | | | | | |
TPC Group, Inc., expiring 08/01/24(original cost $0; purchased 02/02/21)^(f) | | | | | | | 315,256 | | | | 1,482 | |
| | | | | | | | | | | | |
(cost $0) | | | | | | | | | | | | |
| | | |
| TOTAL LONG-TERM INVESTMENTS | | | | | | | | | | | | |
(cost $1,251,645,227) | | | | 1,294,545,186 | |
| | | | | | | | | | | | |
SEE NOTES TO FINANCIAL STATEMENTS.
A116
| | | | | | |
| | |
| | PSF PGIM TOTAL RETURN BOND PORTFOLIO (CONTINUED) | | |
| | | | | | |
| |
| SCHEDULE OF INVESTMENTS | | as of December 31, 2021 |
| | | | | | | | |
| | | Shares | | | Value | |
| | | | | | | | |
|
| SHORT-TERM INVESTMENTS — 3.8% | |
|
| AFFILIATED MUTUAL FUNDS — 3.8% | |
PGIM Core Ultra Short Bond Fund(wa) | | | 10,819,602 | | | $ | 10,819,602 | |
PGIM Institutional Money Market Fund | | | | | | | | |
(cost $38,604,596; includes | | | | | | | | |
$38,601,996 of cash collateral for securities on loan)(b)(wa) | | | 38,642,600 | | | | 38,615,550 | |
| | | | | | | | |
| |
| TOTAL AFFILIATED MUTUAL FUNDS | | | | | |
(cost $49,424,198) | | | | | | | 49,435,152 | |
| | | | | | | | |
| |
| OPTIONS PURCHASED*~ — 0.0% | | | | | |
(cost $313,287) | | | | | | | 123,654 | |
| | | | | | | | |
| | |
| TOTAL SHORT-TERM INVESTMENTS | | | | | | | | |
(cost $49,737,485) | | | | | | | 49,558,806 | |
| | | | | | | | |
|
| TOTAL INVESTMENTS, BEFORE OPTIONS WRITTEN—103.1% | |
(cost $1,301,382,712) | | | | | | | 1,344,103,992 | |
| | | | | | | | |
| |
| OPTIONS WRITTEN*~ — (0.0)% | | | | | |
(premiums received $450,898) | | | | | | | (426,979 | ) |
| | | | | | | | |
| |
| TOTAL INVESTMENTS,NET OF OPTIONS WRITTEN—103.1% | | | | | |
(cost $1,300,931,814) | | | | | | | 1,343,677,013 | |
Liabilities in excess of other assets(z) — (3.1)% | | | | (40,616,547 | ) |
| | | | | | | | |
| | |
| NET ASSETS — 100.0% | | | | | | $ | 1,303,060,466 | |
| | | | | | | | |
See the Glossary for a list of the abbreviation(s) used in the annual report.
| * | Non-income producing security. |
| # | Principal or notional amount is shown in U.S. dollars unless otherwise stated. |
| ~ | See tables subsequent to the Schedule of Investments for options detail. |
| ^ | Indicates a Level 3 instrument. The aggregate value of Level 3 instruments is $10,251,657 and 0.8% of net assets. |
| (a) | All or a portion of security is on loan. The aggregate market value of such securities, including those sold and pending settlement, is $37,900,820; cash collateral of $38,601,996 (included in liabilities) was received with which the Portfolio purchased highly liquid short-term investments. In the event of significant appreciation in value of securities on loan on the last business day of the reporting period, the Portfolio may reflect a collateral value that is less than the market value of the loaned securities and such shortfall is remedied the following business day. |
| (b) | Represents security, or portion thereof, purchased with cash collateral received for securities on loan and includes dividend reinvestment. (c) Variable rate instrument. The interest rate shown reflects the rate in effect at December 31, 2021. |
| (cc) | Variable rate instrument. The rate shown is based on the latest available information as of December 31, 2021. Certain variable rate securities are not based on a published reference rate and spread but are determined by the issuer or agent and are based on current market conditions. These securities do not indicate a reference rate and spread in their description. |
| (f) | Indicates a restricted security that is acquired in unregistered, private sales from the issuing company or from an affiliate of the issuer and is considered restricted as to disposition under federal securities law; the aggregate original cost of such securities is $1,370,689. The aggregate value of $1,252,690 is 0.1% of net assets. |
| (ff) | Variable rate security. Security may be issued at a fixed coupon rate, which converts to a variable rate at a specified date. Rate shown is the rate in effect as of period end. |
| (h) | Represents security, or a portion thereof, segregated as collateral for OTC derivatives. |
| (k) | Represents security, or a portion thereof, segregated as collateral for centrally cleared/exchange-traded derivatives. |
| (oo) | Perpetual security. Maturity date represents next call date. (s) Represents zero coupon bond or principal only security. Rate represents yield to maturity at purchase date. |
| (wa) | PGIM Investments LLC, the manager of the Portfolio, also serves as manager of the PGIM Core Ultra Short Bond Fund and PGIM Institutional Money Market Fund, if applicable. |
| (z) | Includes net unrealized appreciation/(depreciation) and/or market value of the below holdings which are excluded from the Schedule of Investments: |
Options Purchased:
OTC Swaptions
| | | | | | | | | | | | | | | | | | | | | | | | | | | | |
| | | | | | | | | | | | | | | | | | | Notional | | | | |
| | | Call/ | | | | | Expiration | | | | | | | | | | | Amount | | | | |
| Description | | Put | | | Counterparty | | Date | | | Strike | | | Receive | | | Pay | | (000)# | | | Value | |
| CDX.NA.IG.37.V1, | | | | | | | | | | | | | | | | | | | | | | | | | | | | |
| 12/20/26 | | | Call | | | BNP Paribas S.A. | | | 01/19/22 | | | | 0.35% | | | | 1.00% | (Q) | | CDX.NA.IG.37.V1(Q) | | | 13,850 | | | $ | — | |
| CDX.NA.IG.37.V1, | | | | | | Goldman Sachs | | | | | | | | | | | | | | | | | | | | | | |
| 12/20/26 | | | Call | | | International | | | 01/19/22 | | | | 0.35% | | | | 1.00% | (Q) | | CDX.NA.IG.37.V1(Q) | | | 3,760 | | | | — | |
| | | | | | Morgan Stanley & | | | | | | | | | | | | | | | | | | | | | | |
| CDX.NA.IG.37.V1, | | | | | | Co. International | | | | | | | | | | | | | | | | | | | | | | |
| 12/20/26 | | | Call | | | PLC | | | 01/19/22 | | | | 0.35% | | | | 1.00% | (Q) | | CDX.NA.IG.37.V1(Q) | | | 3,760 | | | | — | |
SEE NOTES TO FINANCIAL STATEMENTS.
A117
| | | | | | |
| | |
| | PSF PGIM TOTAL RETURN BOND PORTFOLIO (CONTINUED) | | |
| | | | | | |
| |
| SCHEDULE OF INVESTMENTS | | as of December 31, 2021 |
Options Purchased (continued):
OTC Swaptions
| | | | | | | | | | | | | | | | | | | | |
Description | | Call/
Put | | Counterparty | | Expiration
Date | | Strike | | Receive | | Pay | | Notional
Amount
(000)# | | | Value | |
CDX.NA.IG.37.V1,
12/20/26 | | Call | | Barclays Bank PLC | | 02/16/22 | | 0.35% | | 1.00%(Q) | | CDX.NA.IG.37.V1(Q) | | | 3,760 | | | $ | — | |
CDX.NA.IG.37.V1,
12/20/26 | | Call | | BNP Paribas S.A. | | 02/16/22 | | 0.35% | | 1.00%(Q) | | CDX.NA.IG.37.V1(Q) | | | 26,950 | | | | — | |
CDX.NA.IG.37.V1,
12/20/26 | | Call | | Deutsche Bank AG | | 02/16/22 | | 0.35% | | 1.00%(Q) | | CDX.NA.IG.37.V1(Q) | | | 3,760 | | | | — | |
CDX.NA.IG.37.V1,
12/20/26 | | Call | | Morgan Stanley & Co. International PLC | | 02/16/22 | | 0.35% | | 1.00%(Q) | | CDX.NA.IG.37.V1(Q) | | | 1,930 | | | | — | |
CDX.NA.IG.37.V1,
12/20/26 | | Call | | Morgan Stanley & Co. International PLC | | 02/16/22 | | 0.35% | | 1.00%(Q) | | CDX.NA.IG.37.V1(Q) | | | 25,950 | | | | — | |
CDX.NA.IG.37.V1,
12/20/26 | | Call | | Morgan Stanley & Co. International PLC | | 02/16/22 | | 0.35% | | 1.00%(Q) | | CDX.NA.IG.37.V1(Q) | | | 25,900 | | | | — | |
CDX.NA.IG.37.V1,
12/20/26 | | Call | | Morgan Stanley & Co. International PLC | | 02/16/22 | | 0.35% | | 1.00%(Q) | | CDX.NA.IG.37.V1(Q) | | | 12,980 | | | | — | |
CDX.NA.IG.37.V1,
12/20/26 | | Call | | Morgan Stanley & Co. International PLC | | 02/16/22 | | 0.35% | | 1.00%(Q) | | CDX.NA.IG.37.V1(Q) | | | 38,740 | | | | — | |
CDX.NA.IG.37.V1,
12/20/26 | | Call | | Barclays Bank PLC | | 03/16/22 | | 0.35% | | 1.00%(Q) | | CDX.NA.IG.37.V1(Q) | | | 1,930 | | | | — | |
CDX.NA.IG.37.V1,
12/20/26 | | Call | | Goldman Sachs International | | 03/16/22 | | 0.35% | | 1.00%(Q) | | CDX.NA.IG.37.V1(Q) | | | 1,930 | | | | — | |
CDX.NA.HY.37.V1,
12/20/26 | | Put | | Morgan Stanley & Co. International PLC | | 02/16/22 | | $100.50 | | CDX.NA.HY.37.V1(Q) | | 5.00%(Q) | | | 3,700 | | | | 3,280 | |
CDX.NA.IG.37.V1,
12/20/26 | | Put | | BNP Paribas S.A. | | 01/19/22 | | 0.55% | | CDX.NA.IG.37.V1(Q) | | 1.00%(Q) | | | 13,850 | | | | 4,756 | |
CDX.NA.IG.37.V1,
12/20/26 | | Put | | Morgan Stanley & Co. International PLC | | 01/19/22 | | 0.55% | | CDX.NA.IG.37.V1(Q) | | 1.00%(Q) | | | 3,760 | | | | 1,291 | |
CDX.NA.IG.37.V1,
12/20/26 | | Put | | Goldman Sachs International | | 01/19/22 | | 0.58% | | CDX.NA.IG.37.V1(Q) | | 1.00%(Q) | | | 3,760 | | | | 914 | |
CDX.NA.IG.37.V1,
12/20/26 | | Put | | Deutsche Bank AG | | 02/16/22 | | 0.55% | | CDX.NA.IG.37.V1(Q) | | 1.00%(Q) | | | 3,760 | | | | 3,521 | |
CDX.NA.IG.37.V1,
12/20/26 | | Put | | Morgan Stanley & Co. International PLC | | 02/16/22 | | 0.55% | | CDX.NA.IG.37.V1(Q) | | 1.00%(Q) | | | 1,930 | | | | 1,807 | |
CDX.NA.IG.37.V1,
12/20/26 | | Put | | Barclays Bank PLC | | 02/16/22 | | 0.58% | | CDX.NA.IG.37.V1(Q) | | 1.00%(Q) | | | 3,760 | | | | 2,890 | |
CDX.NA.IG.37.V1,
12/20/26 | | Put | | BNP Paribas S.A. | | 02/16/22 | | 0.58% | | CDX.NA.IG.37.V1(Q) | | 1.00%(Q) | | | 26,950 | | | | 20,714 | |
CDX.NA.IG.37.V1,
12/20/26 | | Put | | Morgan Stanley & Co. International PLC | | 02/16/22 | | 0.58% | | CDX.NA.IG.37.V1(Q) | | 1.00%(Q) | | | 25,950 | | | | 19,945 | |
CDX.NA.IG.37.V1,
12/20/26 | | Put | | Morgan Stanley & Co. International PLC | | 02/16/22 | | 0.58% | | CDX.NA.IG.37.V1(Q) | | 1.00%(Q) | | | 25,900 | | | | 19,907 | |
CDX.NA.IG.37.V1,
12/20/26 | | Put | | Morgan Stanley & Co. International PLC | | 02/16/22 | | 0.58% | | CDX.NA.IG.37.V1(Q) | | 1.00%(Q) | | | 12,980 | | | | 9,976 | |
CDX.NA.IG.37.V1,
12/20/26 | | Put | | Morgan Stanley & Co. International PLC | | 02/16/22 | | 0.58% | | CDX.NA.IG.37.V1(Q) | | 1.00%(Q) | | | 38,740 | | | | 29,775 | |
SEE NOTES TO FINANCIAL STATEMENTS.
A118
| | | | | | |
| | |
| | PSF PGIM TOTAL RETURN BOND PORTFOLIO (CONTINUED) | | |
| | | | | | |
| |
| SCHEDULE OF INVESTMENTS | | as of December 31, 2021 |
Options Purchased (continued):
OTC Swaptions
| | | | | | | | | | | | | | | | | | | | | | | | | | | | | | |
Description | | Call/
Put | | | Counterparty | | Expiration
Date | | | Strike | | | Receive | | | Pay | | | Notional
Amount
(000)# | | | Value | |
CDX.NA.IG.37.V1,
12/20/26 | | | Put | | | Barclays Bank
PLC | | | 03/16/22 | | | | 0.58 | % | | | CDX.NA.IG.37.V1 | (Q) | | | 1.00 | %(Q) | | | 1,930 | | | $ | 2,439 | |
CDX.NA.IG.37.V1,
12/20/26 | | | Put | | | Goldman Sachs
International | | | 03/16/22 | | | | 0.58 | % | | | CDX.NA.IG.37.V1 | (Q) | | | 1.00 | %(Q) | | | 1,930 | | | | 2,439 | |
| | | | | | | | | | | | | | | | | | | | | | | | | | | | | | |
Total Options Purchased (cost $313,287) | | | | | | | | | | | $ | 123,654 | |
| | | | | | | | | | | | | | | | | | | | | | | | | | | | | | |
Options Written:
OTC Swaptions
| | | | | | | | | | | | | | | | | | | | |
Description | | Call/
Put | | Counterparty | | Expiration
Date | | Strike | | Receive | | Pay | | Notional
Amount
(000)# | | | Value | |
CDX.NA.IG.37.V1, 12/20/26 | | Call | | BNP Paribas
S.A. | | 01/19/22 | | 0.50% | | CDX.NA.IG.37.V1(Q) | | 1.00%(Q) | | | 13,850 | | | $ | (12,232 | ) |
CDX.NA.IG.37.V1, 12/20/26 | | Call | | Goldman
Sachs
International | | 01/19/22 | | 0.50% | | CDX.NA.IG.37.V1(Q) | | 1.00%(Q) | | | 3,760 | | | | (3,321 | ) |
CDX.NA.IG.37.V1, 12/20/26 | | Call | | Morgan
Stanley & Co.
International
PLC | | 01/19/22 | | 0.50% | | CDX.NA.IG.37.V1(Q) | | 1.00%(Q) | | | 3,760 | | | | (3,321 | ) |
CDX.NA.IG.37.V1, 12/20/26 | | Call | | Barclays Bank
PLC | | 02/16/22 | | 0.50% | | CDX.NA.IG.37.V1(Q) | | 1.00%(Q) | | | 3,760 | | | | (4,425 | ) |
CDX.NA.IG.37.V1, 12/20/26 | | Call | | Deutsche
Bank AG | | 02/16/22 | | 0.50% | | CDX.NA.IG.37.V1(Q) | | 1.00%(Q) | | | 3,760 | | | | (4,425 | ) |
CDX.NA.IG.37.V1, 12/20/26 | | Call | | Morgan
Stanley & Co.
International
PLC | | 02/16/22 | | 0.50% | | CDX.NA.IG.37.V1(Q) | | 1.00%(Q) | | | 1,930 | | | | (2,271 | ) |
CDX.NA.IG.37.V1, 12/20/26 | | Call | | BNP Paribas
S.A. | | 02/16/22 | | 0.53% | | CDX.NA.IG.37.V1(Q) | | 1.00%(Q) | | | 26,950 | | | | (54,699 | ) |
CDX.NA.IG.37.V1, 12/20/26 | | Call | | Morgan
Stanley & Co.
International
PLC | | 02/16/22 | | 0.53% | | CDX.NA.IG.37.V1(Q) | | 1.00%(Q) | | | 25,950 | | | | (52,670 | ) |
CDX.NA.IG.37.V1, 12/20/26 | | Call | | Morgan
Stanley & Co.
International
PLC | | 02/16/22 | | 0.53% | | CDX.NA.IG.37.V1(Q) | | 1.00%(Q) | | | 25,900 | | | | (52,568 | ) |
CDX.NA.IG.37.V1, 12/20/26 | | Call | | Morgan
Stanley & Co.
International
PLC | | 02/16/22 | | 0.53% | | CDX.NA.IG.37.V1(Q) | | 1.00%(Q) | | | 12,980 | | | | (26,345 | ) |
CDX.NA.IG.37.V1, 12/20/26 | | Call | | Morgan
Stanley & Co.
International
PLC | | 02/16/22 | | 0.53% | | CDX.NA.IG.37.V1(Q) | | 1.00%(Q) | | | 38,740 | | | | (78,629 | ) |
CDX.NA.IG.37.V1, 12/20/26 | | Call | | Barclays Bank
PLC | | 03/16/22 | | 0.53% | | CDX.NA.IG.37.V1(Q) | | 1.00%(Q) | | | 1,930 | | | | (4,212 | ) |
CDX.NA.IG.37.V1, 12/20/26 | | Call | | Goldman
Sachs
International | | 03/16/22 | | 0.53% | | CDX.NA.IG.37.V1(Q) | | 1.00%(Q) | | | 1,930 | | | | (4,212 | ) |
CDX.NA.HY.37.V1, 12/20/26 | | Put | | Morgan
Stanley & Co.
International
PLC | | 04/20/22 | | $103.50 | | 5.00%(Q) | | CDX.NA.HY.37.V1(Q) | | | 3,700 | | | | (21,849 | ) |
SEE NOTES TO FINANCIAL STATEMENTS.
A119
| | | | | | |
| | |
| | PSF PGIM TOTAL RETURN BOND PORTFOLIO (CONTINUED) | | |
| | | | | | |
| |
| SCHEDULE OF INVESTMENTS | | as of December 31, 2021 |
Options Written (continued):
OTC Swaptions
| | | | | | | | | | | | | | | | | | | | | | | | | | | | | | | | |
Description | | Call/
Put | | | Counterparty | | Expiration
Date | | | Strike | | | Receive | | Pay | | | Notional
Amount
(000)# | | | Value | |
CDX.NA.IG.37.V1,
12/20/26 | | | Put | | | BNP Paribas
S.A. | | | 01/19/22 | | | | 0.70 | % | | 1.00%(Q) | | | CDX.NA.IG.37.V1(Q) | | | | | | | | 13,850 | | | $ | (1,177 | ) |
CDX.NA.IG.37.V1,
12/20/26 | | | Put | | | Morgan
Stanley & Co.
International
PLC | | | 01/19/22 | | | | 0.70 | % | | 1.00%(Q) | | | CDX.NA.IG.37.V1(Q) | | | | | | | | 3,760 | | | | (320 | ) |
CDX.NA.IG.37.V1,
12/20/26 | | | Put | | | Goldman
Sachs
International | | | 01/19/22 | | | | 0.75 | % | | 1.00%(Q) | | | CDX.NA.IG.37.V1(Q) | | | | | | | | 3,760 | | | | (249 | ) |
CDX.NA.IG.37.V1,
12/20/26 | | | Put | | | Deutsche
Bank AG | | | 02/16/22 | | | | 0.70 | % | | 1.00%(Q) | | | CDX.NA.IG.37.V1(Q) | | | | | | | | 3,760 | | | | (1,303 | ) |
CDX.NA.IG.37.V1,
12/20/26 | | | Put | | | Morgan
Stanley & Co.
International
PLC | | | 02/16/22 | | | | 0.70 | % | | 1.00%(Q) | | | CDX.NA.IG.37.V1(Q) | | | | | | | | 1,930 | | | | (669 | ) |
CDX.NA.IG.37.V1,
12/20/26 | | | Put | | | Morgan
Stanley & Co.
International
PLC | | | 02/16/22 | | | | 0.73 | % | | 1.00%(Q) | | | CDX.NA.IG.37.V1(Q) | | | | | | | | 25,900 | | | | (7,823 | ) |
CDX.NA.IG.37.V1,
12/20/26 | | | Put | | | Barclays Bank
PLC | | | 02/16/22 | | | | 0.75 | % | | 1.00%(Q) | | | CDX.NA.IG.37.V1(Q) | | | | | | | | 3,760 | | | | (1,005 | ) |
CDX.NA.IG.37.V1,
12/20/26 | | | Put | | | BNP Paribas
S.A. | | | 02/16/22 | | | | 0.75 | % | | 1.00%(Q) | | | CDX.NA.IG.37.V1(Q) | | | | | | | | 26,950 | | | | (7,202 | ) |
CDX.NA.IG.37.V1,
12/20/26 | | | Put | | | Morgan
Stanley & Co.
International
PLC | | | 02/16/22 | | | | 0.75 | % | | 1.00%(Q) | | | CDX.NA.IG.37.V1(Q) | | | | | | | | 25,950 | | | | (6,935 | ) |
CDX.NA.IG.37.V1,
12/20/26 | | | Put | | | Morgan
Stanley & Co.
International
PLC | | | 02/16/22 | | | | 0.75 | % | | 1.00%(Q) | | | CDX.NA.IG.37.V1(Q) | | | | | | | | 12,980 | | | | (3,469 | ) |
CDX.NA.IG.37.V1,
12/20/26 | | | Put | | | Morgan
Stanley & Co.
International
PLC | | | 02/16/22 | | | | 0.75 | % | | 1.00%(Q) | | | CDX.NA.IG.37.V1(Q) | | | | | | | | 38,740 | | | | (10,353 | ) |
CDX.NA.IG.37.V1,
12/20/26 | | | Put | | | Barclays Bank
PLC | | | 03/16/22 | | | | 0.78 | % | | 1.00%(Q) | | | CDX.NA.IG.37.V1(Q) | | | | | | | | 1,930 | | | | (971 | ) |
CDX.NA.IG.37.V1,
12/20/26 | | | Put | | | Goldman
Sachs
International | | | 03/16/22 | | | | 0.78 | % | | 1.00%(Q) | | | CDX.NA.IG.37.V1(Q) | | | | | | | | 1,930 | | | | (971 | ) |
GS_21-PJ2A^ | | | Put | | | Goldman
Sachs
International | | | 11/15/24 | | | | 0.50 | % | | 0.50%(M) | | | GS_21-PJ2A(M) | | | | | | | | 7,830 | | | | (438 | ) |
GS_21-PJA†† ^ | | | Put | | | Goldman
Sachs
International | | | 06/17/24 | | | | 0.25 | % | | 0.25%(M) | | | GS_21-PJA(M) | | | | | | | | 15,090 | | | | (728 | ) |
iTraxx.XO.36.V1,
12/20/26 | | | Put | | | Morgan
Stanley & Co.
International
PLC | | | 01/19/22 | | | | 5.00 | % | | 5.00%(Q) | | | iTraxx.XO.36.V1(Q) | | | | EUR | | | | 2,930 | | | | (451 | ) |
iTraxx.XO.36.V1,
12/20/26 | | | Put | | | Barclays Bank
PLC | | | 09/21/22 | | | | 8.00 | % | | 5.00%(Q) | | | iTraxx.XO.36.V1(Q) | | | | EUR | | | | 10,000 | | | | (36,395 | ) |
iTraxx.XO.36.V1,
12/20/26^ | | | Put | | | Barclays Bank
PLC | | | 09/21/22 | | | | 9.00 | % | | 5.00%(Q) | | | iTraxx.XO.36.V1(Q) | | | | EUR | | | | 5,710 | | | | (21,341 | ) |
| | | | | | | | | | | | | | | | | | | | | | | | | | | | | | | | |
Total Options Written (premiums received $ 450,898) | | | | | | | | | | | | | | $ | (426,979 | ) |
| | | | | | | | | | | | | | | | | | | | | | | | | | | | | | | | |
†† The value of the contract, GS_21-PJA, is derived from a pool of senior prime jumbo mortgages
SEE NOTES TO FINANCIAL STATEMENTS.
A120
| | | | | | |
| | |
| | PSF PGIM TOTAL RETURN BOND PORTFOLIO (CONTINUED) | | |
| | | | | | |
| |
| SCHEDULE OF INVESTMENTS | | as of December 31, 2021 |
Futures contracts outstanding at December 31, 2021:
| | | | | | | | | | | | | | | | |
Number
of
Contracts | | | Type | | Expiration
Date | | | Current
Notional
Amount | | | Value /
Unrealized
Appreciation
(Depreciation) | |
| | | | | | | | | | | | | | | | |
| | Long Positions: | | | | | | | | | | | | |
| | 2,077 | | | 5 Year U.S. Treasury Notes | | | Mar. 2022 | | | $ | 251,268,315 | | | $ | 701,001 | |
| | 662 | | | 10 Year U.S. Treasury Notes | | | Mar. 2022 | | | | 86,370,313 | | | | 244,437 | |
| | 238 | | | 10 Year U.S. Ultra Treasury Notes | | | Mar. 2022 | | | | 34,852,125 | | | | 245,499 | |
| | 351 | | | 30 Year U.S. Ultra Treasury Bonds | | | Mar. 2022 | | | | 69,190,875 | | | | 1,089,908 | |
| | | | | | | | | | | | | | | | |
| | | | | | | | | | | | | | | 2,280,845 | |
| | | | | | | | | | | | | | | | |
| | Short Positions: | | | | | | | | | | | | |
| | 1,546 | | | 2 Year U.S. Treasury Notes | | | Mar. 2022 | | | | 337,293,720 | | | | 297,423 | |
| | 103 | | | 5 Year Euro-Bobl | | | Mar. 2022 | | | | 15,624,455 | | | | 132,423 | |
| | 164 | | | 10 Year Euro-Bund | | | Mar. 2022 | | | | 31,997,178 | | | | 531,595 | |
| | 221 | | | 20 Year U.S. Treasury Bonds | | | Mar. 2022 | | | | 35,456,688 | | | | (145,794 | ) |
| | 69 | | | Euro Schatz Index | | | Mar. 2022 | | | | 8,800,685 | | | | 14,011 | |
| | | | | | | | | | | | | | | | |
| | | | | | | | | | | | | | | 829,658 | |
| | | | | | | | | | | | | | | | |
| | | | | | | | | | | | | | $ | 3,110,503 | |
| | | | | | | | | | | | | | | | |
Forward foreign currency exchange contracts outstanding at December 31, 2021:
| | | | | | | | | | | | | | | | | | | | |
Purchase
Contracts | | Counterparty | | Notional
Amount (000) | | Value at
Settlement
Date | | | Current
Value | | | Unrealized
Appreciation | | | Unrealized Depreciation | |
OTC Forward Foreign Currency Exchange Contracts: | |
Brazilian Real,
Expiring 02/02/22 | | Citibank, N.A. | | BRL 7,229 | | $ | 1,280,617 | | | $ | 1,287,818 | | | $ | 7,201 | | | $ | — | |
Chilean Peso, Expiring 03/16/22 | | Morgan Stanley & Co. International PLC | | CLP 834,869 | | | 978,342 | | | | 968,585 | | | | — | | | | (9,757 | ) |
Euro,
Expiring 01/12/22 | | Goldman Sachs International | | EUR 564 | | | 639,755 | | | | 642,363 | | | | 2,608 | | | | — | |
Hungarian Forint,
Expiring 01/19/22 | | Goldman Sachs International | | HUF 201,022 | | | 645,312 | | | | 618,445 | | | | — | | | | (26,867 | ) |
Mexican Peso,
Expiring 03/16/22 | | Morgan Stanley & Co. International PLC | | MXN 7,990 | | | 368,214 | | | | 385,051 | | | | 16,837 | | | | — | |
Expiring 03/16/22 | | Morgan Stanley & Co. International PLC | | MXN 7,990 | | | 368,588 | | | | 385,052 | | | | 16,464 | | | | — | |
New Zealand Dollar,
Expiring 01/19/22 | | Goldman Sachs International | | NZD 1,620 | | | 1,162,690 | | | | 1,109,606 | | | | — | | | | (53,084 | ) |
Polish Zloty,
Expiring 01/19/22 | | Goldman Sachs International | | PLN 2,565 | | | 645,312 | | | | 635,764 | | | | — | | | | (9,548 | ) |
| | | | | | | | | | | | | | | | | | | | |
| | | | | | $ | 6,088,830 | | | $ | 6,032,684 | | | | 43,110 | | | | (99,256 | ) |
| | | | | | | | | | | | | | | | | | | | |
| | | | | | | | | | | | | | | | | | | | |
| | | | | | | | | | | | | | | | | | | | |
Sale
Contracts | | Counterparty | | Notional
Amount (000) | | Value at
Settlement
Date | | | Current
Value | | | Unrealized
Appreciation | | | Unrealized
Depreciation | |
OTC Forward Foreign Currency Exchange Contracts: | |
Australian Dollar,
Expiring 01/12/22 | | Citibank, N.A. | | AUD 559 | | $ | 404,333 | | | $ | 406,977 | | | $ | — | | | $ | (2,644 | ) |
British Pound,
Expiring 01/12/22 | | HSBC Bank PLC | | GBP 10,998 | | | 14,717,190 | | | | 14,885,716 | | | | — | | | | (168,526 | ) |
Euro,
Expiring 01/12/22 | | BNP Paribas S.A. | | EUR 100,381 | | | 113,145,061 | | | | 114,310,543 | | | | — | | | | (1,165,482 | ) |
South African Rand,
Expiring 03/16/22 | | Barclays Bank PLC | | ZAR 6,822 | | | 426,130 | | | | 423,562 | | | | 2,568 | | | | — | |
SEE NOTES TO FINANCIAL STATEMENTS.
A121
| | | | | | |
| | |
| | PSF PGIM TOTAL RETURN BOND PORTFOLIO (CONTINUED) | | |
| | | | | | |
| |
| SCHEDULE OF INVESTMENTS | | as of December 31, 2021 |
Forward foreign currency exchange contracts outstanding at December 31, 2021 (continued):
| | | | | | | | | | | | | | | | | | |
Sale Contracts | | Counterparty | | Notional
Amount
(000) | | | Value at Settlement Date | | Current Value | | Unrealized
Appreciation | | | Unrealized
Depreciation | |
OTC Forward Foreign Currency Exchange Contracts (cont’d.): | | | | | | | | |
South African Rand (cont’d.), Expiring 03/16/22 | | The Toronto-Dominion Bank | | | ZAR 4,710 | | | $ 291,935 | | $ 292,398 | | $ | — | | | $ | (463 | ) |
| | | | | | | | | | | | | | | | | | |
| | | | | | | | $ 128,984,649 | | $ 130,319,196 | | | 2,568 | | | | (1,337,115 | ) |
| | | | | | | | | | | | | | | | | | |
| | | | | | | | | | | | | | | | | | |
| | | | | | | | | | $ | 45,678 | | | $ | (1,436,371 | ) |
| | | | | | | | | | | | | | | | | | |
Credit default swap agreements outstanding at December 31, 2021:
| | | | | | | | | | | | | | | | | | | | | | | | | | | | | | | | | | | | |
Reference Entity/ Obligation | | Termination
Date | | | Fixed
Rate | | | Notional
Amount
(000)#(3) | | | Implied
Credit Spread at December 31, 2021(4) | | | Fair
Value | | | Upfront
Premiums Paid (Received) | | | | | | Unrealized
Appreciation (Depreciation) | | | Counterparty | |
| | | | | | | | | | | | | | | | | | | | | | | | | | | | | | | | | | | | |
OTC Credit Default Swap Agreements on asset-backed and/or mortgage-backed securities - Sell Protection(2)^: | |
GS_21-PJ2A | | | 01/14/22 | | | | 0.500%(M) | | | | 7,830 | | | | * | | | $ | 3,372 | | | $ | (731 | ) | | | | | | $ | 4,103 | | | | Goldman Sachs International | |
GS_21-PJA†† | | | 01/14/22 | | | | 0.250%(M) | | | | 15,090 | | | | * | | | | 3,248 | | | | (705 | ) | | | | | | | 3,953 | | | | Goldman Sachs International | |
| | | | | | | | | | | | | | | | | | | | | | | | | | | | | | | | | | | | |
| | | | | | | | | | | | | | | | | | $ | 6,620 | | | $ | (1,436 | ) | | | | | | $ | 8,056 | | | | | |
| | | | | | | | | | | | | | | | | | | | | | | | | | | | | | | | | | | | |
†† The value of the contract, GS_21-PJA, is derived from a pool of senior prime jumbo mortgages
| | | | | | | | | | | | | | | | | | | | | | | | |
Reference Entity/ Obligation | | Termination Date | | | Fixed Rate | | Notional Amount (000)#(3) | | | Fair Value | | | Upfront Premiums Paid (Received) | | | Unrealized Appreciation (Depreciation) | | | Counterparty |
|
|
|
| | | | | | | | | | | | | | | | | | | | | | | | |
OTC Credit Default Swap Agreements on corporate and/or sovereign issues - Buy Protection(1): |
Republic of France | | | 12/20/26 | | | 0.250%(Q) | | | 1,635 | | | $ | (3,852 | ) | | $ | (3,201 | ) | | $ | (651 | ) | | Deutsche Bank AG |
United Mexican States | | | 06/20/23 | | | 1.000%(Q) | | | 665 | | | | (7,193 | ) | | | 1,433 | | | | (8,626 | ) | | Citibank, N.A. |
United Mexican States | | | 06/20/23 | | | 1.000%(Q) | | | 655 | | | | (7,085 | ) | | | 3,576 | | | | (10,661 | ) | | Citibank, N.A. |
United Mexican States | | | 06/20/23 | | | 1.000%(Q) | | | 220 | | | | (2,380 | ) | | | 1,345 | | | | (3,725 | ) | | Citibank, N.A. |
United Mexican States | | | 06/20/23 | | | 1.000%(Q) | | | 220 | | | | (2,380 | ) | | | 1,235 | | | | (3,615 | ) | | Citibank, N.A. |
United Mexican States | | | 06/20/23 | | | 1.000%(Q) | | | 215 | | | | (2,325 | ) | | | 436 | | | | (2,761 | ) | | Citibank, N.A. |
United Mexican States | | | 06/20/23 | | | 1.000%(Q) | | | 115 | | | | (1,243 | ) | | | 248 | | | | (1,491 | ) | | Citibank, N.A. |
United Mexican States | | | 12/20/24 | | | 1.000%(Q) | | | 160 | | | | (2,500 | ) | | | 669 | | | | (3,169 | ) | | Citibank, N.A. |
United Mexican States | | | 12/20/24 | | | 1.000%(Q) | | | 130 | | | | (2,031 | ) | | | 651 | | | | (2,682 | ) | | Citibank, N.A. |
| | | | | | | | | | | | | | | | | | | | | | | | |
| | | | | | | | | | | | $ | (30,989 | ) | | $ | 6,392 | | | $ | (37,381 | ) | | |
| | | | | | | | | | | | | | | | | | | | | | | | |
| | | | | | | | | | | | | | | | | | | | | | | | | | | | | | | | |
Reference Entity/
Obligation | | Termination Date | | | Fixed Rate | | | Notional Amount (000)#(3) | | | Implied Credit Spread at December 31, 2021(4) | | | Fair Value | | | Upfront Premiums Paid (Received) | | | Unrealized Appreciation (Depreciation) | | | Counterparty | |
| | | | | | | | | | | | | | | | | | | | | | | | | | | | | | | | |
| |
| OTC Credit Default Swap Agreements on corporate and/or sovereign issues - Sell Protection(2): | | | | | |
Petroleos Mexicanos | | | 06/20/23 | | | | 1.000%(Q) | | | | 2,205 | | | | 1.518 | % | | $ | (16,018 | ) | | $ | (21,804 | ) | | $ | 5,786 | | | | Credit Suisse International | |
Petroleos Mexicanos | | | 06/20/23 | | | | 1.000%(Q) | | | | 550 | | | | 1.518 | % | | | (3,996 | ) | | | (10,529 | ) | | | 6,533 | | | | Citibank,N.A. | |
Petroleos Mexicanos | | | 06/20/23 | | | | 1.000%(Q) | | | | 545 | | | | 1.518 | % | | | (3,959 | ) | | | (12,524 | ) | | | 8,565 | | | | Citibank,N.A. | |
Petroleos Mexicanos | | | 06/20/23 | | | | 1.000%(Q) | | | | 185 | | | | 1.518 | % | | | (1,344 | ) | | | (4,357 | ) | | | 3,013 | | | | Citibank,N.A. | |
Petroleos Mexicanos | | | 06/20/23 | | | | 1.000%(Q) | | | | 185 | | | | 1.518 | % | | | (1,344 | ) | | | (4,278 | ) | | | 2,934 | | | | Citibank,N.A. | |
Petroleos Mexicanos | | | 06/20/23 | | | | 1.000%(Q) | | | | 180 | | | | 1.518 | % | | | (1,308 | ) | | | (3,462 | ) | | | 2,154 | | | | Citibank,N.A. | |
Petroleos Mexicanos | | | 06/20/23 | | | | 1.000%(Q) | | | | 90 | | | | 1.518 | % | | | (654 | ) | | | (1,722 | ) | | | 1,068 | | | | Citibank,N.A. | |
Petroleos Mexicanos | | | 12/20/24 | | | | 1.000%(Q) | | | | 160 | | | | 2.184 | % | | | (5,402 | ) | | | (8,966 | ) | | | 3,564 | | | | Citibank,N.A. | |
Petroleos Mexicanos | | | 12/20/24 | | | | 1.000%(Q) | | | | 130 | | | | 2.184 | % | | | (4,389 | ) | | | (7,370 | ) | | | 2,981 | | | | Citibank,N.A. | |
Republic of France | | | 12/20/26 | | | | 0.250%(Q) | | | | 1,635 | | | | 0.204 | % | | | 3,852 | | | | 12,670 | | | | (8,818 | ) | | | Deutsche Bank AG | |
SEE NOTES TO FINANCIAL STATEMENTS.
A122
| | | | | | |
| | |
| | PSF PGIM TOTAL RETURN BOND PORTFOLIO (CONTINUED) | | |
| | | | | | |
| |
| SCHEDULE OF INVESTMENTS | | as of December 31, 2021 |
Credit default swap agreements outstanding at December 31, 2021 (continued):
| | | | | | | | | | | | | | | | | | | | | | | | | | | | |
Reference Entity/
Obligation | | Termination
Date | | | Fixed
Rate | | Notional
Amount
(000)#(3) | | | Implied
Credit
Spread at
December 31,
2021(4) | | | Fair
Value | | | Upfront
Premiums
Paid
(Received) | | | Unrealized
Appreciation
(Depreciation) | | | Counterparty |
| | | | | | | | | | | | | | | | | | | | | | | | | | | | |
OTC Credit Default Swap Agreements on corporate and/or sovereign issues - Sell Protection(2)(cont’d.): |
Republic of Italy | | | 09/20/22 | | | 1.000%(Q) | | | 815 | | | | 0.228 | % | | $ | 4,857 | | | $ | 5,463 | | | $ | (606 | ) | | Bank of America, N.A. |
Republic of Italy | | | 09/20/23 | | | 1.000%(Q) | | | 815 | | | | 0.399 | % | | | 8,740 | | | | 12,291 | | | | (3,551 | ) | | Bank of America, N.A. |
State of Illinois | | | 06/20/24 | | | 1.000%(Q) | | | 580 | | | | 0.800 | % | | | 3,002 | | | | (3,628 | ) | | | 6,630 | | | Citibank, N.A. |
| | | | | | | | | | | | | | | | | | | | | | | | | | | | |
| | | | | | | | | | | | | | | | $ | (17,963 | ) | | $ | (48,216 | ) | | $ | 30,253 | | | |
| | | | | | | | | | | | | | | | | | | | | | | | | | | | |
| | | | | | | | | | | | | | | | | | | | | | | | |
Reference Entity/
Obligation | | Termination
Date | | | Fixed Rate | | | Notional
Amount
(000)#(3) | | | Value at
Trade Date | | | Value at
December 31,
2021 | | | Unrealized
Appreciation
(Depreciation) | |
| | | | | | | | | | | | | | | | | | | | | | | | |
Centrally Cleared Credit Default Swap Agreement on credit indices - Buy Protection(1): | | | | | | | | | | | | | |
CDX.NA.IG.37.V1 | | | 12/20/26 | | | | 1.000%(Q) | | | | 80 | | | $ | (1,901 | ) | | $ | (1,980 | ) | | $ | (79 | ) |
| | | | | | | | | | | | | | | | | | | | | | | | |
The Portfolio entered into credit default swaps (“CDS”) to provide a measure of protection against defaults or to take an active long or short position with respect to the likelihood of a particular issuer’s default or the reference entity’s credit soundness. CDS contracts generally trade based on a spread which represents the cost a protection buyer has to pay the protection seller. The protection buyer is said to be short the credit as the value of the contract rises the more the credit deteriorates. The value of the CDS contract increases for the protection buyer if the spread increases.
| (1) | If the Portfolio is a buyer of protection, it pays the fixed rate. When a credit event occurs, as defined under the terms of that particular swap agreement, the Portfolio will either (i) receive from the seller of protection an amount equal to the notional amount of the swap and make delivery of the referenced obligation or underlying securities comprising the referenced index or (ii) receive a net settlement amount in the form of cash or securities equal to the notional amount of the swap less the recovery value of the referenced obligation or underlying securities comprising the referenced index. |
| (2) | If the Portfolio is a seller of protection, it receives the fixed rate. When a credit event occurs, as defined under the terms of that particular swap agreement, the Portfolio will either (i) pay to the buyer of protection an amount equal to the notional amount of the swap and take delivery of the referenced obligation or underlying securities comprising the referenced index or (ii) pay a net settlement amount in the form of cash or securities equal to the notional amount of the swap less the recovery value of the referenced obligation or underlying securities comprising the referenced index. |
| (3) | Notional amount represents the maximum potential amount the Portfolio could be required to pay as a seller of credit protection or receive as a buyer of credit protection if a credit event occurs as defined under the terms of that particular swap agreement. |
| (4) | Implied credit spreads, represented in absolute terms, utilized in determining the fair value of credit default swap agreements where the Portfolio is the seller of protection as of the reporting date serve as an indicator of the current status of the payment/ performance risk and represent the likelihood of risk of default for the credit derivative. The implied credit spread of a particular referenced entity reflects the cost of buying/selling protection and may include up-front payments required to be made to enter into the agreement. Wider credit spreads represent a deterioration of the referenced entity’s credit soundness and a greater likelihood of risk of default or other credit event occurring as defined under the terms of the agreement. |
| * | When an implied credit spread is not available, reference the fair value of credit default swap agreements on credit indices and asset-backed securities. Where the Portfolio is the seller of protection, it serves as an indicator of the current status of the payment/performance risk and represents the likelihood of an expected liability (or profit) for the credit derivative should the notional amount of the swap agreement be closed/sold as of the reporting date. Increasing fair value in absolute terms, when compared to the notional amount of the swap, represents a deterioration of the referenced entity’s credit soundness and a greater likelihood of risk of default or other credit event occurring as defined under the terms of the agreement. |
Inflation swap agreements outstanding at December 31, 2021:
| | | | | | | | | | | | | | | | | | |
Notional Amount
(000)# | | Termination
Date | | Fixed Rate | | Floating
Rate | | Value at
Trade Date | | | Value at
December 31,
2021 | | | Unrealized
Appreciation
(Depreciation) | |
| | | | | | | | | | | | | | | | | | |
Centrally Cleared Inflation Swap Agreements: | | | | | | | | | | | | |
1,990 | | 01/12/26 | | 2.185%(T) | | U.S. CPI Urban Consumers NSA Index(2)(T) | | | $— | | | | $ (161,184) | | | | $ (161,184) | |
SEE NOTES TO FINANCIAL STATEMENTS.
A123
| | | | | | |
| | |
| | PSF PGIM TOTAL RETURN BOND PORTFOLIO (CONTINUED) | | |
| | | | | | |
| |
| SCHEDULE OF INVESTMENTS | | as of December 31, 2021 |
Inflation swap agreements outstanding at December 31, 2021 (continued):
| | | | | | | | | | | | | | | | | | | | | | | | |
Notional Amount (000)# | | | Termination
Date | | | Fixed
Rate | | | Floating Rate | | Value at
Trade Date | | | Value at
December 31,
2021 | | | Unrealized
Appreciation
(Depreciation) | |
| | | | | | | | | | | | | | | | | | | | | | | | |
| | Centrally Cleared Inflation Swap Agreements (cont’d): | |
| | 1,130 | | | | 01/13/31 | | | | 2.229%(T) | | | U.S.CPI Urban Consumers NSA Index(2)(T) | | $ | — | | | $ | (112,669 | ) | | $ | (112,669 | ) |
| | 3,400 | | | | 01/13/31 | | | | 2.230%(T) | | | U.S.CPI Urban Consumers NSA Index(2)(T) | | | — | | | | (338,634 | ) | | | (338,634 | ) |
| | 2,430 | | | | 04/07/31 | | | | 2.469%(T) | | | U.S.CPI Urban Consumers NSA Index(2)(T) | | | — | | | | (173,249 | ) | | | (173,249 | ) |
| | 830 | | | | 04/09/31 | | | | 2.435%(T) | | | U.S.CPI Urban Consumers NSA Index(2)(T) | | | — | | | | (62,172 | ) | | | (62,172 | ) |
| | 1,670 | | | | 04/09/31 | | | | 2.447%(T) | | | U.S.CPI Urban Consumers NSA Index(2)(T) | | | — | | | | (122,796 | ) | | | (122,796 | ) |
| | 1,705 | | | | 04/13/31 | | | | 2.445%(T) | | | U.S.CPI Urban Consumers NSA Index(2)(T) | | | — | | | | (125,627 | ) | | | (125,627 | ) |
| | 1,030 | | | | 04/13/31 | | | | 2.450%(T) | | | U.S.CPI Urban Consumers NSA Index(2)(T) | | | — | | | | (75,325 | ) | | | (75,325 | ) |
| | 1,040 | | | | 04/14/31 | | | | 2.450%(T) | | | U.S.CPI Urban Consumers NSA Index(2)(T) | | | — | | | | (75,906 | ) | | | (75,906 | ) |
| | 1,010 | | | | 04/15/31 | | | | 2.460%(T) | | | U.S.CPI Urban Consumers NSA Index(2)(T) | | | — | | | | (72,550 | ) | | | (72,550 | ) |
| | 1,945 | | | | 04/15/31 | | | | 2.465%(T) | | | U.S.CPI Urban Consumers NSA Index(2)(T) | | | — | | | | (138,641 | ) | | | (138,641 | ) |
| | | | | | | | | | | | | | | | | | | | | | | | |
| | | | | | | | | | | | | | $ | — | | | $ | (1,458,753 | ) | | $ | (1,458,753 | ) |
| | | | | | | | | | | | | | | | | | | | | | | | |
| (1) | The Portfolio pays the fixed rate and receives the floating rate |
| (2) | The Portfolio pays the floating rate and receives the fixed rate |
Interest rate swap agreements outstanding at December 31, 2021:
| | | | | | | | | | | | | | | | | | | | | | | | | | |
Notional Amount (000)# | | | Termination Date | | | Fixed Rate | | | Floating Rate | | Value at Trade Date | | | Value at
December 31,
2021 | | | Unrealized
Appreciation
(Depreciation) | |
| | | | | | | | | | | | | | | | | | | | | | | |
Centrally Cleared Interest Rate Swap Agreements: | | | | | | | | | | | | |
| BRL | | | 12,664 | | | | 01/02/25 | | | | 5.902%(T) | | | 1 Day BROIS(2)(T) | | | $ — | | | $ | (196,171 | ) | | $ | (196,171 | ) |
| BRL | | | 23,370 | | | | 01/02/25 | | | | 6.343%(T) | | | 1 Day BROIS(2)(T) | | | — | | | | (416,956 | ) | | | (416,956 | ) |
| BRL | | | 25,186 | | | | 01/02/25 | | | | 6.343%(T) | | | 1 Day BROIS(2)(T) | | | — | | | | (450,758 | ) | | | (450,758 | ) |
| BRL | | | 39,452 | | | | 01/02/25 | | | | 6.359%(T) | | | 1 Day BROIS(2)(T) | | | — | | | | (703,013 | ) | | | (703,013 | ) |
| BRL | | | 7,043 | | | | 01/02/25 | | | | 6.670%(T) | | | 1 Day BROIS(2)(T) | | | — | | | | (58,995 | ) | | | (58,995 | ) |
| BRL | | | 18,662 | | | | 01/02/25 | | | | 6.670%(T) | | | 1 Day BROIS(2)(T) | | | — | | | | (156,937 | ) | | | (156,937 | ) |
| BRL | | | 8,496 | | | | 01/04/27 | | | | 6.845%(T) | | | 1 Day BROIS(2)(T) | | | — | | | | (216,592 | ) | | | (216,592 | ) |
| BRL | | | 8,006 | | | | 01/04/27 | | | | 6.890%(T) | | | 1 Day BROIS(2)(T) | | | — | | | | (200,989 | ) | | | (200,989 | ) |
| BRL | | | 14,270 | | | | 01/04/27 | | | | 6.890%(T) | | | 1 Day BROIS(2)(T) | | | — | | | | (359,105 | ) | | | (359,105 | ) |
| CLP | | | 180,000 | | | | 01/25/26 | | | | 1.634%(S) | | | 1 Day CLOIS(2)(S) | | | — | | | | (29,178 | ) | | | (29,178 | ) |
| CLP | | | 3,000,000 | | | | 01/20/28 | | | | 2.090%(S) | | | 1 Day CLOIS(2)(S) | | | — | | | | (606,160 | ) | | | (606,160 | ) |
| CLP | | | 3,181,000 | | | | 01/22/29 | | | | 2.292%(S) | | | 1 Day CLOIS(2)(S) | | | — | | | | (684,988 | ) | | | (684,988 | ) |
| COP | | | 3,909,000 | | | | 02/18/25 | | | | 4.505%(Q) | | | 1 Day COOIS(2)(Q) | | | — | | | | (38,711 | ) | | | (38,711 | ) |
| COP | | | 6,724,755 | | | | 02/21/25 | | | | 4.565%(Q) | | | 1 Day COOIS(2)(Q) | | | — | | | | (64,195 | ) | | | (64,195 | ) |
| COP | | | 18,811,000 | | | | 02/03/26 | | | | 3.080%(Q) | | | 1 Day COOIS(2)(Q) | | | — | | | | (507,291 | ) | | | (507,291 | ) |
| COP | | | 2,761,000 | | | | 02/18/30 | | | | 5.072%(Q) | | | 1 Day COOIS(2)(Q) | | | — | | | | (51,706 | ) | | | (51,706 | ) |
| COP | | | 1,932,000 | | | | 02/18/30 | | | | 5.081%(Q) | | | 1 Day COOIS(2)(Q) | | | — | | | | (35,886 | ) | | | (35,886 | ) |
| COP | | | 4,156,000 | | | | 02/24/30 | | | | 5.078%(Q) | | | 1 Day COOIS(2)(Q) | | | — | | | | (78,124 | ) | | | (78,124 | ) |
| GBP | | | 635 | | | | 05/08/23 | | | | 0.950%(A) | | | 1 Day SONIA(1)(A) | | | (14,468 | ) | | | (5,146 | ) | | | 9,322 | |
| GBP | | | 3,946 | | | | 05/08/26 | | | | 1.000%(A) | | | 1 Day SONIA(1)(A) | | | (184,608 | ) | | | (18,017 | ) | | | 166,591 | |
| GBP | | | 977 | | | | 10/22/28 | | | | 0.680%(A) | | | 1 Day SONIA(1)(A) | | | — | | | | 25,167 | | | | 25,167 | |
| GBP | | | 2,100 | | | | 05/08/30 | | | | 1.100%(A) | | | 1 Day SONIA(1)(A) | | | (145,549 | ) | | | (50,711 | ) | | | 94,838 | |
| GBP | | | 767 | | | | 05/08/31 | | | | 1.150%(A) | | | 1 Day SONIA(2)(A) | | | 45,732 | | | | 25,660 | | | | (20,072 | ) |
| GBP | | | 230 | | | | 05/08/34 | | | | 1.200%(A) | | | 1 Day SONIA(1)(A) | | | (9,088 | ) | | | (11,852 | ) | | | (2,764 | ) |
| HUF | | | 99,000 | | | | 02/13/30 | | | | 1.595%(A) | | | 6 Month BUBOR(2)(S) | | | — | | | | (57,831 | ) | | | (57,831 | ) |
| HUF | | | 1,171,000 | | | | 02/14/30 | | | | 1.605%(A) | | | 6 Month BUBOR(2)(S) | | | — | | | | (681,676 | ) | | | (681,676 | ) |
| HUF | | | 340,000 | | | | 02/18/30 | | | | 1.803%(A) | | | 6 Month BUBOR(2)(S) | | | — | | | | (182,064 | ) | | | (182,064 | ) |
| MXN | | | 36,985 | | | | 03/19/26 | | | | 6.050%(M) | | | 28 Day Mexican Interbank Rate(2)(M) | | | (73 | ) | | | (90,289 | ) | | | (90,216 | ) |
| MXN | | | 51,300 | | | | 01/12/28 | | | | 5.020%(M) | | | 28 Day Mexican Interbank Rate(2)(M) | | | (34 | ) | | | (299,991 | ) | | | (299,957 | ) |
| MXN | | | 7,310 | | | | 01/03/31 | | | | 5.550%(M) | | | 28 Day Mexican Interbank Rate(2)(M) | | | (30 | ) | | | (46,939 | ) | | | (46,909 | ) |
| MXN | | | 20,460 | | | | 01/13/31 | | | | 5.460%(M) | | | 28 Day Mexican Interbank Rate(2)(M) | | | (25 | ) | | | (138,152 | ) | | | (138,127 | ) |
| MXN | | | 72,900 | | | | 01/15/31 | | | | 5.450%(M) | | | 28 Day Mexican Interbank Rate(2)(M) | | | (90 | ) | | | (494,898 | ) | | | (494,808 | ) |
| MXN | | | 19,550 | | | | 01/03/33 | | | | 5.715%(M) | | | 28 Day Mexican Interbank Rate(2)(M) | | | (31 | ) | | | (138,628 | ) | | | (138,597 | ) |
| MXN | | | 5,485 | | | | 12/28/35 | | | | 6.000%(M) | | | 28 Day Mexican Interbank Rate(2)(M) | | | (32 | ) | | | (41,992 | ) | | | (41,960 | ) |
| NZD | | | 2,100 | | | | 02/14/30 | | | | 1.522%(S) | | | 3 Month BBR(2)(Q) | | | — | | | | (108,940 | ) | | | (108,940 | ) |
| NZD | | | 1,220 | | | | 01/19/31 | | | | 1.090%(S) | | | 3 Month BBR(2)(Q) | | | — | | | | (101,532 | ) | | | (101,532 | ) |
| NZD | | | 4,670 | | | | 01/19/31 | | | | 1.096%(S) | | | 3 Month BBR(2)(Q) | | | 1,928 | | | | (386,938 | ) | | | (388,866 | ) |
SEE NOTES TO FINANCIAL STATEMENTS.
A124
| | | | | | |
| | |
| | PSF PGIM TOTAL RETURN BOND PORTFOLIO (CONTINUED) | | |
| | | | | | |
| |
| SCHEDULE OF INVESTMENTS | | as of December 31, 2021 |
| | | | | | | | | | | | | | | | | | | | | | | | | | | | | | | | | | |
Notional Amount (000)# | | | Termination
Date | | | Fixed
Rate | | | Floating Rate | | Value at
Trade Date | | | | | | Value at
December 31,
2021 | | | | | | Unrealized
Appreciation
(Depreciation) | |
Centrally Cleared Interest Rate Swap Agreements (cont’d.): | | | | | | | | | | | | | | | | | | | | |
| NZD | | | 1,630 | | | | 01/26/31 | | | | 1.097%(S) | | | 3 Month BBR(2)(Q) | | $ | — | | | | | | | $ | (135,256 | ) | | | | | | $ | (135,256 | ) |
| NZD | | | 2,495 | | | | 03/22/31 | | | | 1.920%(S) | | | 3 Month BBR(2)(Q) | | | — | | | | | | | | (91,686 | ) | | | | | | | (91,686 | ) |
| PLN | | | 1,060 | | | | 01/19/31 | | | | 1.200%(A) | | | 6 Month WIBOR(2)(S) | | | 543 | | | | | | | | (44,469 | ) | | | | | | | (45,012 | ) |
| PLN | | | 17,070 | | | | 01/21/31 | | | | 1.170%(A) | | | 6 Month WIBOR(2)(S) | | | (14,188 | ) | | | | | | | (727,052 | ) | | | | | | | (712,864 | ) |
| PLN | | | 6,250 | | | | 03/16/31 | | | | 1.760%(A) | | | 6 Month WIBOR(2)(S) | | | 4,318 | | | | | | | | (188,729 | ) | | | | | | | (193,047 | ) |
| PLN | | | 3,220 | | | | 08/02/31 | | | | 1.650%(A) | | | 6 Month WIBOR(2)(S) | | | — | | | | | | | | (116,150 | ) | | | | | | | (116,150 | ) |
| ZAR | | | 19,600 | | | | 02/11/30 | | | | 7.481%(Q) | | | 3 Month JIBAR(2)(Q) | | | (1,010 | ) | | | | | | | 36,955 | | | | | | | | 37,965 | |
| ZAR | | | 36,800 | | | | 02/28/30 | | | | 7.500%(Q) | | | 3 Month JIBAR(2)(Q) | | | (9,462 | ) | | | | | | | 66,136 | | | | | | | | 75,598 | |
| ZAR | | | 19,800 | | | | 03/02/30 | | | | 7.625%(Q) | | | 3 Month JIBAR(2)(Q) | | | 459 | | | | | | | | 44,863 | | | | | | | | 44,404 | |
| ZAR | | | 22,200 | | | | 03/12/30 | | | | 7.840%(Q) | | | 3 Month JIBAR(2)(Q) | | | (170 | ) | | | | | | | 67,591 | | | | | | | | 67,761 | |
| ZAR | | | 14,700 | | | | 03/12/30 | | | | 7.900%(Q) | | | 3 Month JIBAR(2)(Q) | | | (118 | ) | | | | | | | 48,276 | | | | | | | | 48,394 | |
| ZAR | | | 58,300 | | | | 03/18/30 | | | | 10.650%(Q) | | | 3 Month JIBAR(2)(Q) | | | — | | | | | | | | 307,032 | | | | | | | | 307,032 | |
| ZAR | | | 6,400 | | | | 03/27/30 | | | | 9.150%(Q) | | | 3 Month JIBAR(2)(Q) | | | (111 | ) | | | | | | | 52,059 | | | | | | | | 52,170 | |
| ZAR | | | 12,600 | | | | 04/01/30 | | | | 8.600%(Q) | | | 3 Month JIBAR(2)(Q) | | | (45 | ) | | | | | | | 84,203 | | | | | | | | 84,248 | |
| ZAR | | | 29,700 | | | | 04/03/30 | | | | 9.300%(Q) | | | 3 Month JIBAR(2)(Q) | | | (503 | ) | | | | | | | 283,770 | | | | | | | | 284,273 | |
| ZAR | | | 61,200 | | | | 07/07/30 | | | | 7.040%(Q) | | | 3 Month JIBAR(2)(Q) | | | (1,469 | ) | | | | | | | (1,801 | ) | | | | | | | (332 | ) |
| ZAR | | | 26,100 | | | | 01/15/31 | | | | 6.765%(Q) | | | 3 Month JIBAR(2)(Q) | | | (45,525 | ) | | | | | | | (44,662 | ) | | | | | | | 863 | |
| ZAR | | | 21,000 | | | | 03/18/31 | | | | 7.660%(Q) | | | 3 Month JIBAR(2)(Q) | | | 16,339 | | | | | | | | 34,550 | | | | | | | | 18,211 | |
| ZAR | | | 11,100 | | | | 10/28/31 | | | | 7.780%(Q) | | | 3 Month JIBAR(2)(Q) | | | (3,167 | ) | | | | | | | 24,122 | | | | | | | | 27,289 | |
| | | | | | | | | | | | | | | | | | | | | | | | | | | | | | | | | | |
| | | | | | | | | | | | | | | | $ | (360,477 | ) | | | | | | $ | (7,960,772 | ) | | | | | | $ | (7,600,295 | ) |
| | | | | | | | | | | | | | | | | | | | | | | | | | | | | | | | | | |
| (1) | The Portfolio pays the fixed rate and receives the floating rate |
| (2) | The Portfolio pays the floating rate and receives the fixed rate |
Total return swap agreements outstanding at December 31, 2021:
| | | | | | | | | | | | | | | | | | | | | | | | | | | | | | | | |
Reference Entity | | Financing Rate | | Counterparty | | Termination
Date | | Long (Short)
Notional
Amount
(000)#(1) | | Fair
Value | | Upfront
Premiums
Paid
(Received) | | Unrealized
Appreciation
(Depreciation)(2) |
OTC Total Return Swap Agreement: | | | | | | | | | | | | | | | | | | | | | | | | | | | | | | | | |
U.S. Treasury Bonds(T) | | 1 Day USOIS +4.5 bps(T) | | |
| Goldman Sachs
International |
| | | | 2/03/22 | | | | | 4,046 | | | | $ | 14,951 | | | | $ | — | | | | $ | 14,951 | |
| | | | | | | | | | | | | | | | | | | | | | | | | | | | | | | | |
| (1) | On a long total return swap, the Portfolio receives payments for any positive return on the reference entity (makes payments for any negative return) and pays the financing rate. On a short total return swap, the Portfolio makes payments for any positive return on the reference entity (receives payments for any negative return) and receives the financing rate. |
| (2) | Upfront/recurring fees or commissions, as applicable, are included in the net unrealized appreciation (depreciation). |
Balances Reported in the Statement of Assets and Liabilities for OTC Swap Agreements:
| | | | | | | | |
| | | Premiums Paid | | Premiums Received | | Unrealized
Appreciation | | Unrealized
Depreciation |
OTC Swap Agreements | | $40,017 | | $(83,277) | | $66,235 | | $(50,356) |
Summary of Collateral for Centrally Cleared/Exchange-traded Derivatives:
Cash and securities segregated as collateral, including pending settlement for closed positions, to cover requirements for centrally cleared/exchange-traded derivatives are listed by broker as follows:
| | | | | | | | | | |
Broker | | Cash and/or Foreign Currency | | Securities Market Value |
Citigroup Global Markets, Inc. | | | $ | — | | | | $ | 11,647,628 | |
| | | | | | | | | | |
Fair Value Measurements:
Various inputs are used in determining the value of the Portfolio’s investments. These inputs are summarized in the three broad levels listed below.
Level 1—unadjusted quoted prices generally in active markets for identical securities.
SEE NOTES TO FINANCIAL STATEMENTS.
A125
| | | | | | |
| | |
| | PSF PGIM TOTAL RETURN BOND PORTFOLIO (CONTINUED) | | |
| | | | | | |
| |
| SCHEDULE OF INVESTMENTS | | as of December 31, 2021 |
Level 2—quoted prices for similar securities, interest rates and yield curves, prepayment speeds, foreign currency exchange rates and other observable inputs.
Level 3—unobservable inputs for securities valued in accordance with Board approved fair valuation procedures.
The following is a summary of the inputs used as of December 31, 2021 in valuing such portfolio securities:
| | | | | | | | | | | | |
| | | Level 1 | | | Level 2 | | | Level 3 | |
Investments in Securities | | | | | | | | | | | | |
Assets | | | | | | | | | | | | |
Long-Term Investments | | | | | | | | | | | | |
Asset-Backed Securities | | | | | | | | | | | | |
Automobiles | | $ | — | | | $ | 11,878,538 | | | $ | — | |
Collateralized Loan Obligations | | | — | | | | 241,481,106 | | | | — | |
Consumer Loans | | | — | | | | 13,759,433 | | | | — | |
Credit Cards | | | — | | | | 3,026,805 | | | | — | |
Home Equity Loans | | | — | | | | 458,296 | | | | — | |
Other | | | — | | | | 2,462,871 | | | | — | |
Residential Mortgage-Backed Securities | | | — | | | | 8,675,571 | | | | — | |
Student Loans | | | — | | | | 14,290,193 | | | | — | |
Bank Loans | | | — | | | | 13,801,650 | | | | 488,750 | |
Commercial Mortgage-Backed Securities | | | — | | | | 167,233,210 | | | | — | |
Corporate Bonds | | | — | | | | 495,965,134 | | | | — | |
Municipal Bonds | | | — | | | | 22,838,230 | | | | — | |
Residential Mortgage-Backed Securities | | | — | | | | 83,383,762 | | | | 9,777,312 | |
Sovereign Bonds | | | — | | | | 42,317,830 | | | | — | |
U.S. Government Agency Obligations | | | — | | | | 22,554,560 | | | | — | |
U.S. Treasury Obligations | | | — | | | | 130,530,296 | | | | — | |
Common Stocks | | | 5,800,670 | | | | 1,562,637 | | | | — | |
Preferred Stocks | | | 2,256,850 | | | | — | | | | — | |
Warrants | | | — | | | | — | | | | 1,482 | |
Short-Term Investments | | | | | | | | | | | | |
Affiliated Mutual Funds | | | 49,435,152 | | | | — | | | | — | |
Options Purchased | | | — | | | | 123,654 | | | | — | |
| | | | | | | | | | | | |
Total | | $ | 57,492,672 | | | $ | 1,276,343,776 | | | $ | 10,267,544 | |
| | | | | | | | | | | | |
Liabilities | | | | | | | | | | | | |
Options Written | | $ | — | | | $ | (404,472 | ) | | $ | (22,507 | ) |
| | | | | | | | | | | | |
| | | |
Other Financial Instruments* | | | | | | | | | | | | |
Assets | | | | | | | | | | | | |
Futures Contracts | | $ | 3,256,297 | | | $ | — | | | $ | — | |
OTC Forward Foreign Currency Exchange Contracts | | | — | | | | 45,678 | | | | — | |
OTC Credit Default Swap Agreements | | | — | | | | 20,451 | | | | 6,620 | |
Centrally Cleared Interest Rate Swap Agreements | | | — | | | | 1,344,126 | | | | — | |
OTC Total Return Swap Agreement | | | — | | | | 14,951 | | | | — | |
| | | | | | | | | | | | |
Total | | $ | 3,256,297 | | | $ | 1,425,206 | | | $ | 6,620 | |
| | | | | | | | | | | | |
| | | |
Liabilities | | | | | | | | | | | | |
Futures Contracts | | $ | (145,794 | ) | | $ | — | | | $ | — | |
OTC Forward Foreign Currency Exchange Contracts | | | — | | | | (1,436,371 | ) | | | — | |
Centrally Cleared Credit Default Swap Agreement | | | — | | | | (79 | ) | | | — | |
OTC Credit Default Swap Agreements | | | — | | | | (69,403 | ) | | | — | |
Centrally Cleared Inflation Swap Agreements | | | — | | | | (1,458,753 | ) | | | — | |
Centrally Cleared Interest Rate Swap Agreements | | | — | | | | (8,944,421 | ) | | | — | |
| | | | | | | | | | | | |
Total | | $ | (145,794 | ) | | $ | (11,909,027 | ) | | $ | — | |
| | | | | | | | | | | | |
| * | Other financial instruments are derivative instruments not reflected in the Schedule of Investments, such as futures, forwards and centrally cleared swap contracts, which are recorded at the unrealized appreciation (depreciation) on the instrument, and OTC swap contracts which are recorded at fair value. |
Industry Classification:
The industry classification of investments and liabilities in excess of other assets shown as a percentage of net assets as of December 31, 2021 were as follows (unaudited):
SEE NOTES TO FINANCIAL STATEMENTS.
A126
| | | | | | |
| | |
| | PSF PGIM TOTAL RETURN BOND PORTFOLIO (CONTINUED) | | |
| | | | | | |
| |
| SCHEDULE OF INVESTMENTS | | as of December 31, 2021 |
Industry Classification (continued):
| | | | |
Collateralized Loan Obligations | | | 18.5 | % |
Commercial Mortgage-Backed Securities | | | 12.8 | |
Banks | | | 10.2 | |
U.S. Treasury Obligations | | | 10.0 | |
Residential Mortgage-Backed Securities | | | 7.8 | |
Affiliated Mutual Funds (3.0% represents investments purchased with collateral from securities on loan) | | | 3.8 | |
Sovereign Bonds | | | 3.2 | |
Pharmaceuticals | | | 2.9 | |
Electric | | | 2.6 | |
Oil & Gas | | | 2.5 | |
Telecommunications | | | 2.1 | |
Media | | | 2.1 | |
Pipelines | | | 2.0 | |
Municipal Bonds | | | 1.8 | |
U.S. Government Agency Obligations | | | 1.7 | |
Chemicals | | | 1.2 | |
Student Loans | | | 1.1 | |
Consumer Loans | | | 1.1 | |
Insurance | | | 1.0 | |
Foods | | | 1.0 | |
Commercial Services | | | 1.0 | |
Retail | | | 0.9 | |
Auto Manufacturers | | | 0.9 | |
Automobiles | | | 0.9 | |
Aerospace & Defense | | | 0.9 | |
Semiconductors | | | 0.9 | |
Healthcare-Services | | | 0.8 | |
Real Estate Investment Trusts (REITs) | | | 0.7 | |
Airlines | | | 0.5 | |
Packaging & Containers | | | 0.5 | |
Oil, Gas & Consumable Fuels | | | 0.5 | |
Engineering & Construction | | | 0.4 | |
Healthcare-Products | | | 0.4 | |
Lodging | | | 0.4 | |
Beverages | | | 0.3 | |
| | | | |
Diversified Financial Services | | | 0.3 | % |
Software | | | 0.3 | |
Gas | | | 0.3 | |
Credit Cards | | | 0.2 | |
Entertainment | | | 0.2 | |
Agriculture | | | 0.2 | |
Auto Parts & Equipment | | | 0.2 | |
Building Materials | | | 0.2 | |
Other | | | 0.2 | |
Multi-National | | | 0.2 | |
Home Builders | | | 0.2 | |
Mining | | | 0.2 | |
Savings & Loans | | | 0.1 | |
Gas Utilities | | | 0.1 | |
Real Estate | | | 0.1 | |
Electrical Components & Equipment | | | 0.1 | |
Electronics | | | 0.1 | |
Computers | | | 0.1 | |
Capital Markets | | | 0.1 | |
Housewares | | | 0.1 | |
Water | | | 0.1 | |
Oil & Gas Services | | | 0.1 | |
Home Equity Loans | | | 0.0 | * |
Textiles | | | 0.0 | * |
Environmental Control | | | 0.0 | * |
Machinery-Construction & Mining | | | 0.0 | * |
Options Purchased | | | 0.0 | * |
Transportation | | | 0.0 | * |
| | | | |
| | | 103.1 | |
Options Written | | | (0.0 | )* |
Liabilities in excess of other assets | | | (3.1 | ) |
| | | | |
| | | 100.0 | % |
| | | | |
Effects of Derivative Instruments on the Financial Statements and Primary Underlying Risk Exposure:
The Portfolio invested in derivative instruments during the reporting period. The primary types of risk associated with these derivative instruments are credit contracts risk, foreign exchange contracts risk and interest rate contracts risk. See the Notes to Financial Statements for additional detail regarding these derivative instruments and their risks. The effect of such derivative instruments on the Portfolio’s financial position and financial performance as reflected in the Statement of Assets and Liabilities and Statement of Operations is presented in the summary below.
Fair values of derivative instruments as of December 31, 2021 as presented in the Statement of Assets and Liabilities:
| | | | | | | | | | | | |
Derivatives not accounted for as hedging instruments, carried at fair value | | Asset Derivatives | | | Liability Derivatives | |
| | Statement of Assets and Liabilities Location | | Fair
Value | | | Statement of Assets and Liabilities Location | | Fair
Value | |
Credit contracts | | — | | $ | — | | | Due from/to broker-variation margin swaps | | $ | 79 | * |
Credit contracts | | Premiums paid for OTC swap agreements | | | 40,017 | | | Premiums received for OTC swap agreements | | | 83,277 | |
Credit contracts | | Unaffiliated investments | | | 123,654 | | | Options written outstanding, at value | | | 426,979 | |
Credit contracts | | Unrealized appreciation on OTC swap agreements | | | 51,284 | | | Unrealized depreciation on OTC swap agreements | | | 50,356 | |
SEE NOTES TO FINANCIAL STATEMENTS.
A127
| | | | | | |
| | |
| | PSF PGIM TOTAL RETURN BOND PORTFOLIO (CONTINUED) | | |
| | | | | | |
| |
| SCHEDULE OF INVESTMENTS | | as of December 31, 2021 |
| | | | | | | | | | | | |
Derivatives not accounted for as hedging instruments, carried at fair value | | Asset Derivatives | | | Liability Derivatives | |
| | Statement of
Assets and
Liabilities Location | | Fair
Value | | | Statement of
Assets and
Liabilities Location | | Fair
Value | |
Foreign exchange contracts | | Unrealized appreciation on OTC forward foreign currency exchange contracts | | $ | 45,678 | | | Unrealized depreciation on OTC forward foreign currency exchange contracts | | $ | 1,436,371 | |
Interest rate contracts | | Due from/to broker-variation margin futures | | | 3,256,297 | * | | Due from/to broker-variation margin futures | | | 145,794 | * |
Interest rate contracts | | Due from/to broker-variation margin swaps | | | 1,344,126 | * | | Due from/to broker-variation margin swaps | | | 10,403,174 | * |
Interest rate contracts | | Unrealized appreciation on OTC swap agreements | | | 14,951 | | | — | | | — | |
| | | | | | | | | | | | |
| | | | $ | 4,876,007 | | | | | $ | 12,546,030 | |
| | | | | | | | | | | | |
| * | Includes cumulative appreciation (depreciation) as reported in the schedule of open futures and centrally cleared swap contracts. Only unsettled variation margin receivable (payable) is reported within the Statement of Assets and Liabilities. |
The effects of derivative instruments on the Statement of Operations for the year ended December 31, 2021 are as follows:
| | | | | | | | | | | | | | | | | | | | |
Amount of Realized Gain (Loss) on Derivatives Recognized in Income | |
Derivatives not accounted for as hedging instruments, carried at fair value | | Options
Purchased(1) | | | Options
Written | | | Futures | | | Forward
& Cross
Currency
Exchange
Contracts | | | Swaps | |
Credit contracts | | $ | (277,252 | ) | | $ | 343,700 | | | $ | — | | | $ | — | | | $ | (156,999 | ) |
Foreign exchange contracts | | | — | | | | — | | | | — | | | | 6,960,540 | | | | — | |
Interest rate contracts | | | — | | | | — | | | | (19,517,452 | ) | | | — | | | | 346,965 | |
| | | | | | | | | | | | | | | | | | | | |
Total | | $ | (277,252 | ) | | $ | 343,700 | | | $ | (19,517,452 | ) | | $ | 6,960,540 | | | $ | 189,966 | |
| | | | | | | | | | | | | | | | | | | | |
| (1) | Included in net realized gain (loss) on investment transactions in the Statement of Operations |
| | | | | | | | | | | | | | | | | | | | |
Change in Unrealized Appreciation (Depreciation) on Derivatives Recognized in Income | |
Derivatives not accounted for as hedging instruments, carried at fair value | | Options
Purchased(2) | | | Options
Written | | | Futures | | | Forward
& Cross
Currency
Exchange
Contracts | | | Swaps | |
Credit contracts | | $ | (189,633 | ) | | $ | 23,919 | | | $ | — | | | $ | — | | | $ | (550,548 | ) |
Foreign exchange contracts | | | — | | | | — | | | | — | | | | 677,992 | | | | — | |
Interest rate contracts | | | — | | | | — | | | | 4,865,014 | | | | — | | | | (11,973,911 | ) |
| | | | | | | | | | | | | | | | | | | | |
Total | | $ | (189,633 | ) | | $ | 23,919 | | | $ | 4,865,014 | | | $ | 677,992 | | | $ | (12,524,459 | ) |
| | | | | | | | | | | | | | | | | | | | |
| (2) | Included in net change in unrealized appreciation (depreciation) on investments in the Statement of Operations |
For the year ended December 31, 2021, the Portfolio’s average volume of derivative activities is as follows:
| | | | | | | | |
Options Purchased(1) | | Options Written(2) | | Futures Contracts— Long Positions(2) | | Futures Contracts— Short Positions(2) | | Forward Foreign Currency Exchange
Contracts— Purchased(3) |
| $113,972 | | $117,699,078 | | $449,574,338 | | $534,128,135 | | $59,967,667 |
SEE NOTES TO FINANCIAL STATEMENTS.
A128
| | | | | | |
| | |
| | PSF PGIM TOTAL RETURN BOND PORTFOLIO (CONTINUED) | | |
| | | | | | |
| |
| SCHEDULE OF INVESTMENTS | | as of December 31, 2021 |
| | | | | | |
Forward Foreign
Currency Exchange
Contracts—Sold(3) | | Cross
Currency
Exchange
Contracts(4) | | Interest Rate
Swap
Agreements(2) | | Credit Default
Swap Agreements—
Buy Protection(2) |
| $157,642,823 | | $3,166 | | $133,794,993 | | $38,525,530 |
| | | | |
Credit Default
Swap Agreements—
Sell Protection(2) | | Total Return
Swap
Agreements(2) | | Inflation Swap
Agreements(2) |
| $29,091,000 | | $1,349,566 | | $12,212,000 |
| (2) | Notional Amount in USD. |
| (3) | Value at Settlement Date. |
Average volume is based on average quarter end balances as noted for the year ended December 31, 2021.
Financial Instruments/Transactions—Summary of Offsetting and Netting Arrangements:
The Portfolio invested in OTC derivatives and entered into financial instruments/transactions during the reporting period that are either offset in accordance with current requirements or are subject to enforceable master netting arrangements or similar agreements that permit offsetting. The information about offsetting and related netting arrangements for OTC derivatives and financial instruments/transactions where the legal right to set-off exists is presented in the summary below.
Offsetting of financial instrument/transaction assets and liabilities:
| | | | | | | | | | | | | | |
Description | | Gross Market
Value of
Recognized
Assets/(Liabilities) | | | Collateral
Pledged/(Received)(2) | | | Net
Amount | |
Securities on Loan | | $ | 37,900,820 | | | $ | (37,900,820 | ) | | $ | — | |
| | | | | | | | | | | | |
Offsetting of OTC derivative assets and liabilities:
| | | | | | | | | | | | | | | | | | | | |
Counterparty | | Gross Amounts of
Recognized
Assets(1) | | | Gross Amounts of
Recognized
Liabilities(1) | | | Net Amounts of
Recognized
Assets/(Liabilities) | | | Collateral
Pledged/(Received)(2) | | | Net Amount | |
Bank of America, N.A. | | $ | 17,754 | | | $ | (4,157 | ) | | $ | 13,597 | | | $ | (13,402 | ) | | $ | 195 | |
Barclays Bank PLC | | | 7,897 | | | | (68,349 | ) | | | (60,452 | ) | | | — | | | | (60,452 | ) |
BNP Paribas S.A. | | | 25,470 | | | | (1,240,792 | ) | | | (1,215,322 | ) | | | 962,343 | | | | (252,979 | ) |
Citibank, N.A. | | | 54,236 | | | | (96,210 | ) | | | (41,974 | ) | | | — | | | | (41,974 | ) |
Credit Suisse International | | | 5,786 | | | | (21,804 | ) | | | (16,018 | ) | | | 16,018 | | | | — | |
Deutsche Bank AG | | | 16,191 | | | | (18,398 | ) | | | (2,207 | ) | | | — | | | | (2,207 | ) |
Goldman Sachs International | | | 28,968 | | | | (100,854 | ) | | | (71,886 | ) | | | — | | | | (71,886 | ) |
HSBC Bank PLC | | | — | | | | (168,526 | ) | | | (168,526 | ) | | | — | | | | (168,526 | ) |
Morgan Stanley & Co. International PLC | | | 119,282 | | | | (277,430 | ) | | | (158,148 | ) | | | — | | | | (158,148 | ) |
The Toronto-Dominion Bank | | | — | | | | (463 | ) | | | (463 | ) | | | — | | | | (463 | ) |
| | | | | | | | | | | | | | | | | | | | |
| | $ | 275,584 | | | $ | (1,996,983 | ) | | $ | (1,721,399 | ) | | $ | 964,959 | | | $ | (756,440 | ) |
| | | | | | | | | | | | | | | | | | | | |
| (1) | Includes unrealized appreciation/(depreciation) on swaps and forwards, premiums paid/(received) on swap agreements and market value of purchased and written options, as represented on the Statement of Assets and Liabilities. |
| (2) | Collateral amount disclosed by the Portfolio is limited to the market value of financial instruments/transactions and the Portfolio’s OTC derivative exposure by counterparty. |
SEE NOTES TO FINANCIAL STATEMENTS.
A129
| | | | | | |
| | |
| | PSF PGIM TOTAL RETURN BOND PORTFOLIO (CONTINUED) | | |
STATEMENT OF ASSETS AND LIABILITIES
as of December 31, 2021
| | | | |
ASSETS | | | | |
Investments at value, including securities on loan of $37,900,820: | | | | |
Unaffiliated investments (cost $1,251,958,514) | | $ | 1,294,668,840 | |
Affiliated investments (cost $49,424,198) | | | 49,435,152 | |
Foreign currency, at value (cost $1,404,501) | | | 1,414,485 | |
Cash | | | 660,987 | |
Dividends and interest receivable | | | 8,326,669 | |
Receivable for investments sold | | | 5,113,072 | |
Due from broker-variation margin futures | | | 597,506 | |
Receivable for Portfolio shares sold | | | 485,401 | |
Due from broker-variation margin swaps | | | 91,546 | |
Unrealized appreciation on OTC swap agreements | | | 66,235 | |
Unrealized appreciation on OTC forward foreign currency exchange contracts | | | 45,678 | |
Premiums paid for OTC swap agreements | | | 40,017 | |
Prepaid expenses and other assets | | | 72,136 | |
| | | | |
Total Assets | | | 1,361,017,724 | |
| | | | |
LIABILITIES | | | | |
Payable to broker for collateral for securities on loan | | | 38,601,996 | |
Payable for investments purchased | | | 16,654,287 | |
Unrealized depreciation on OTC forward foreign currency exchange contracts | | | 1,436,371 | |
Management fee payable | | | 443,562 | |
Options written outstanding, at value (premiums received $450,898) | | | 426,979 | |
Accrued expenses and other liabilities | | | 158,575 | |
Payable for Portfolio shares purchased | | | 98,939 | |
Premiums received for OTC swap agreements | | | 83,277 | |
Unrealized depreciation on OTC swap agreements | | | 50,356 | |
Distribution fee payable | | | 1,096 | |
Affiliated transfer agent fee payable | | | 980 | |
Trustees’ fees payable | | | 840 | |
| | | | |
Total Liabilities | | | 57,957,258 | |
| | | | |
NET ASSETS | | $ | 1,303,060,466 | |
| | | | |
Net assets were comprised of: | | | | |
Partners’ Equity | | $ | 1,303,060,466 | |
| | | | |
Class I: | | | | |
Net asset value and redemption price per share, $1,297,574,696 / 82,849,854 outstanding shares of beneficial interest | | $ | 15.66 | |
| | | | |
Class III: | | | | |
Net asset value and redemption price per share, $5,485,770 / 350,850 outstanding shares of beneficial interest | | $ | 15.64 | |
| | | | |
STATEMENT OF OPERATIONS
Year Ended December 31, 2021
| | | | |
NET INVESTMENT INCOME (LOSS) | | | | |
INCOME | | | | |
Interest income (net of $13,287 foreign withholding tax) | | $ | 38,125,747 | |
Unaffiliated dividend income (net of $43 foreign withholding tax) | | | 222,643 | |
Affiliated dividend income | | | 40,278 | |
Income from securities lending, net (including affiliated income of $26,283) | | | 40,094 | |
| | | | |
Total income | | | 38,428,762 | |
| | | | |
EXPENSES | | | | |
Management fee | | | 5,173,336 | |
Distribution fee—Class III | | | 4,040 | |
Custodian and accounting fees | | | 118,543 | |
Audit fee | | | 57,100 | |
Shareholders’ reports | | | 33,438 | |
Legal fees and expenses | | | 29,096 | |
Trustees’ fees | | | 25,880 | |
Transfer agent’s fees and expenses (including affiliated expense of $5,882) | | | 10,682 | |
Miscellaneous | | | 39,620 | |
| | | | |
Total expenses | | | 5,491,735 | |
| | | | |
NET INVESTMENT INCOME (LOSS) | | | 32,937,027 | |
| | | | |
REALIZED AND UNREALIZED GAIN (LOSS) ON INVESTMENT AND FOREIGN CURRENCY TRANSACTIONS | | | | |
Net realized gain (loss) on: | | | | |
Investment transactions (including affiliated of $(6,817)) | | | 13,851,537 | |
Futures transactions | | | (19,517,452 | ) |
Forward and cross currency contract transactions | | | 6,960,540 | |
Options written transactions | | | 343,700 | |
Swap agreements transactions | | | 189,966 | |
Foreign currency transactions | | | 473,171 | |
| | | | |
| | | 2,301,462 | |
| | | | |
Net change in unrealized appreciation (depreciation) on: | | | | |
Investments (including affiliated of $(3,038)) | | | (37,356,416 | ) |
Futures | | | 4,865,014 | |
Forward and cross currency contracts | | | 677,992 | |
Options written | | | 23,919 | |
Swap agreements | | | (12,524,459 | ) |
Foreign currencies | | | 130,539 | |
| | | | |
| | | (44,183,411 | ) |
| | | | |
NET GAIN (LOSS) ON INVESTMENT AND FOREIGN CURRENCY TRANSACTIONS | | | (41,881,949 | ) |
| | | | |
NET INCREASE (DECREASE) IN NET ASSETS RESULTING FROM OPERATIONS | | $ | (8,944,922 | ) |
| | | | |
STATEMENTS OF CHANGES IN NET ASSETS
| | | | | | | | |
| | | Year Ended
December 31, 2021 | | | Year Ended
December 31, 2020 | |
INCREASE (DECREASE) IN NET ASSETS | | | | | | | | |
OPERATIONS | | | | | | | | |
Net investment income (loss) | | $ | 32,937,027 | | | $ | 36,939,115 | |
Net realized gain (loss) on investment and foreign currency transactions | | | 2,301,462 | | | | (715,016 | ) |
Net change in unrealized appreciation (depreciation) on investments and foreign currencies | | | (44,183,411 | ) | | | 64,021,649 | |
| | | | | | | | |
NET INCREASE (DECREASE) IN NET ASSETS RESULTING FROM OPERATIONS | | | (8,944,922 | ) | | | 100,245,748 | |
| | | | | | | | |
PORTFOLIO SHARE TRANSACTIONS | | | | | | | | |
Portfolio shares sold | | | 111,700,386 | | | | 108,389,140 | |
Portfolio shares purchased | | | (92,303,055 | ) | | | (106,131,559 | ) |
| | | | | | | | |
NET INCREASE (DECREASE) IN NET ASSETS FROM PORTFOLIO SHARE TRANSACTIONS | | | 19,397,331 | | | | 2,257,581 | |
| | | | | | | | |
TOTAL INCREASE (DECREASE) | | | 10,452,409 | | | | 102,503,329 | |
NET ASSETS: | | | | | | | | |
Beginning of year | | | 1,292,608,057 | | | | 1,190,104,728 | |
| | | | | | | | |
End of year | | $ | 1,303,060,466 | | | $ | 1,292,608,057 | |
| | | | | | | | |
SEE NOTES TO FINANCIAL STATEMENTS.
A130
| | | | | | |
| | |
| | PSF STOCK INDEX PORTFOLIO | | |
| | | | | | |
| |
| SCHEDULE OF INVESTMENTS | | as of December 31, 2021 |
| | | | | | | | |
| | | Shares | | | Value | |
LONG-TERM INVESTMENTS — 97.9% | |
|
| COMMON STOCKS — 97.3% | |
Aerospace & Defense — 1.3% | |
Boeing Co. (The)* | | | 96,736 | | | $ | 19,474,892 | |
General Dynamics Corp. | | | 40,860 | | | | 8,518,084 | |
Howmet Aerospace, Inc. | | | 67,292 | | | | 2,141,904 | |
Huntington Ingalls Industries, Inc. | | | 7,000 | | | | 1,307,180 | |
L3Harris Technologies, Inc. | | | 35,080 | | | | 7,480,459 | |
Lockheed Martin Corp. | | | 43,058 | | | | 15,303,244 | |
Northrop Grumman Corp. | | | 26,266 | | | | 10,166,781 | |
Raytheon Technologies Corp. | | | 262,048 | | | | 22,551,851 | |
Textron, Inc. | | | 38,950 | | | | 3,006,940 | |
TransDigm Group, Inc.* | | | 9,130 | | | | 5,809,236 | |
| | | | | | | | |
| | |
| | | | | | | 95,760,571 | |
| | | | | | | | |
Air Freight & Logistics — 0.6% | | | | | | | | |
C.H. Robinson Worldwide, Inc.(a) | | | 22,900 | | | | 2,464,727 | |
Expeditors International of Washington,
Inc. | | | 29,500 | | | | 3,961,555 | |
FedEx Corp. | | | 42,740 | | | | 11,054,274 | |
United Parcel Service, Inc. (Class B
Stock) | | | 127,700 | | | | 27,371,218 | |
| | | | | | | | |
| | |
| | | | | | | 44,851,774 | |
| | | | | | | | |
Airlines — 0.2% | | | | | | | | |
Alaska Air Group, Inc.* | | | 21,900 | | | | 1,140,990 | |
American Airlines Group, Inc.*(a) | | | 112,300 | | | | 2,016,908 | |
Delta Air Lines, Inc.* | | | 112,100 | | | | 4,380,868 | |
Southwest Airlines Co.* | | | 103,137 | | | | 4,418,389 | |
United Airlines Holdings, Inc.* | | | 56,500 | | | | 2,473,570 | |
| | | | | | | | |
| | |
| | | | | | | 14,430,725 | |
| | | | | | | | |
Auto Components — 0.1% | | | | | | | | |
Aptiv PLC*(a) | | | 47,400 | | | | 7,818,630 | |
BorgWarner, Inc.(a) | | | 41,600 | | | | 1,874,912 | |
| | | | | | | | |
| | |
| | | | | | | 9,693,542 | |
| | | | | | | | |
Automobiles — 2.5% | | | | | | | | |
Ford Motor Co. | | | 685,459 | | | | 14,236,984 | |
General Motors Co.* | | | 253,600 | | | | 14,868,568 | |
Tesla, Inc.*(a) | | | 142,340 | | | | 150,422,065 | |
| | | | | | | | |
| | |
| | | | | | | 179,527,617 | |
| | | | | | | | |
Banks — 3.9% | | | | | | | | |
Bank of America Corp. | | | 1,260,182 | | | | 56,065,497 | |
Citigroup, Inc. | | | 354,022 | | | | 21,379,389 | |
Citizens Financial Group, Inc. | | | 74,600 | | | | 3,524,850 | |
Comerica, Inc. | | | 23,250 | | | | 2,022,750 | |
Fifth Third Bancorp | | | 119,849 | | | | 5,219,424 | |
First Republic Bank | | | 31,400 | | | | 6,484,414 | |
Huntington Bancshares, Inc. | | | 255,675 | | | | 3,942,509 | |
JPMorgan Chase & Co. | | | 520,295 | | | | 82,388,713 | |
KeyCorp | | | 163,000 | | | | 3,770,190 | |
M&T Bank Corp. | | | 22,600 | | | | 3,470,908 | |
People’s United Financial, Inc. | | | 73,100 | | | | 1,302,642 | |
PNC Financial Services Group, Inc.
(The) | | | 73,993 | | | | 14,837,076 | |
Regions Financial Corp.(a) | | | 166,412 | | | | 3,627,782 | |
Signature Bank | | | 10,600 | | | | 3,428,782 | |
SVB Financial Group* | | | 10,260 | | | | 6,958,742 | |
| | | | | | | | |
| | | Shares | | | Value | |
COMMON STOCKS (continued) | |
Banks (cont’d.) | |
Truist Financial Corp. | | | 233,626 | | | $ | 13,678,802 | |
U.S. Bancorp | | | 235,681 | | | | 13,238,202 | |
Wells Fargo & Co. | | | 698,276 | | | | 33,503,282 | |
Zions Bancorp NA | | | 27,400 | | | | 1,730,584 | |
| | | | | | | | |
| | |
| | | | | | | 280,574,538 | |
| | | | | | | | |
Beverages — 1.4% | |
Brown-Forman Corp. (Class B Stock) | | | 32,025 | | | | 2,333,342 | |
Coca-Cola Co. (The) | | | 680,350 | | | | 40,283,523 | |
Constellation Brands, Inc. (Class A
Stock) | | | 29,400 | | | | 7,378,518 | |
Molson Coors Beverage Co. (Class B
Stock)(a) | | | 33,400 | | | | 1,548,090 | |
Monster Beverage Corp.* | | | 65,800 | | | | 6,319,432 | |
PepsiCo, Inc. | | | 241,994 | | | | 42,036,778 | |
| | | | | | | | |
| | |
| | | | | | | 99,899,683 | |
| | | | | | | | |
Biotechnology — 1.7% | |
AbbVie, Inc. | | | 309,489 | | | | 41,904,810 | |
Amgen, Inc. | | | 99,194 | | | | 22,315,674 | |
Biogen, Inc.* | | | 25,755 | | | | 6,179,140 | |
Gilead Sciences, Inc. | | | 220,000 | | | | 15,974,200 | |
Incyte Corp.* | | | 32,900 | | | | 2,414,860 | |
Moderna, Inc.* | | | 61,800 | | | | 15,695,964 | |
Regeneron Pharmaceuticals, Inc.* | | | 18,510 | | | | 11,689,435 | |
Vertex Pharmaceuticals, Inc.* | | | 44,560 | | | | 9,785,376 | |
| | | | | | | | |
| | |
| | | | | | | 125,959,459 | |
| | | | | | | | |
Building Products — 0.5% | |
A.O. Smith Corp. | | | 23,500 | | | | 2,017,475 | |
Allegion PLC | | | 15,833 | | | | 2,096,922 | |
Carrier Global Corp. | | | 151,567 | | | | 8,220,994 | |
Fortune Brands Home & Security, Inc. | | | 23,800 | | | | 2,544,220 | |
Johnson Controls International PLC | | | 124,415 | | | | 10,116,184 | |
Masco Corp. | | | 42,930 | | | | 3,014,545 | |
Trane Technologies PLC | | | 41,600 | | | | 8,404,448 | |
| | | | | | | | |
| | |
| | | | | | | 36,414,788 | |
| | | | | | | | |
Capital Markets — 2.9% | | | | | | | | |
Ameriprise Financial, Inc. | | | 19,650 | | | | 5,927,619 | |
Bank of New York Mellon Corp. (The) | | | 133,049 | | | | 7,727,486 | |
BlackRock, Inc. | | | 25,000 | | | | 22,889,000 | |
Cboe Global Markets, Inc. | | | 18,500 | | | | 2,412,400 | |
Charles Schwab Corp. (The) | | | 263,200 | | | | 22,135,120 | |
CME Group, Inc. | | | 62,810 | | | | 14,349,573 | |
FactSet Research Systems, Inc. | | | 6,600 | | | | 3,207,666 | |
Franklin Resources, Inc.(a) | | | 48,900 | | | | 1,637,661 | |
Goldman Sachs Group, Inc. (The) | | | 59,320 | | | | 22,692,866 | |
Intercontinental Exchange, Inc. | | | 98,690 | | | | 13,497,831 | |
Invesco Ltd. | | | 59,200 | | | | 1,362,784 | |
MarketAxess Holdings, Inc. | | | 6,600 | | | | 2,714,382 | |
Moody’s Corp. | | | 28,320 | | | | 11,061,226 | |
Morgan Stanley | | | 251,278 | | | | 24,665,448 | |
MSCI, Inc. | | | 14,400 | | | | 8,822,736 | |
Nasdaq, Inc. | | | 20,500 | | | | 4,305,205 | |
Northern Trust Corp. | | | 36,500 | | | | 4,365,765 | |
Raymond James Financial, Inc. | | | 32,250 | | | | 3,237,900 | |
S&P Global, Inc. | | | 42,180 | | | | 19,906,007 | |
SEE NOTES TO FINANCIAL STATEMENTS.
A131
| | | | | | |
| | |
| | PSF STOCK INDEX PORTFOLIO (CONTINUED) | | |
| | | | | | |
| |
| SCHEDULE OF INVESTMENTS | | as of December 31, 2021 |
| | | | | | | | |
| | | Shares | | | Value | |
|
| COMMON STOCKS (continued) | |
|
Capital Markets (cont’d.) | |
State Street Corp. | | | 64,075 | | | $ | 5,958,975 | |
T. Rowe Price Group, Inc.(a) | | | 39,400 | | | | 7,747,616 | |
| | | | | | | | |
| | |
| | | | | | | 210,625,266 | |
| | | | | | | | |
Chemicals — 1.7% | | | | | | | | |
Air Products & Chemicals, Inc. | | | 38,700 | | | | 11,774,862 | |
Albemarle Corp. | | | 20,500 | | | | 4,792,285 | |
Celanese Corp. | | | 19,100 | | | | 3,209,946 | |
CF Industries Holdings, Inc. | | | 37,600 | | | | 2,661,328 | |
Corteva, Inc. | | | 128,356 | | | | 6,068,672 | |
Dow, Inc. | | | 129,522 | | | | 7,346,488 | |
DuPont de Nemours, Inc. | | | 90,756 | | | | 7,331,270 | |
Eastman Chemical Co. | | | 23,800 | | | | 2,877,658 | |
Ecolab, Inc. | | | 43,700 | | | | 10,251,583 | |
FMC Corp. | | | 22,250 | | | | 2,445,052 | |
International Flavors & Fragrances, Inc. | | | 44,540 | | | | 6,709,951 | |
Linde PLC (United Kingdom) | | | 90,300 | | | | 31,282,629 | |
LyondellBasell Industries NV (Class A
Stock) | | | 45,900 | | | | 4,233,357 | |
Mosaic Co. (The) | | | 64,200 | | | | 2,522,418 | |
PPG Industries, Inc. | | | 41,600 | | | | 7,173,504 | |
Sherwin-Williams Co. (The) | | | 42,300 | | | | 14,896,368 | |
| | | | | | | | |
| | |
| | | | | | | 125,577,371 | |
| | | | | | | | |
Commercial Services & Supplies — 0.4% | |
Cintas Corp. | | | 15,400 | | | | 6,824,818 | |
Copart, Inc.* | | | 37,300 | | | | 5,655,426 | |
Republic Services, Inc. | | | 36,835 | | | | 5,136,641 | |
Rollins, Inc. | | | 39,825 | | | | 1,362,413 | |
Waste Management, Inc. | | | 67,830 | | | | 11,320,827 | |
| | | | | | | | |
| | |
| | | | | | | 30,300,125 | |
| | | | | | | | |
Communications Equipment — 0.9% | |
Arista Networks, Inc.* | | | 39,200 | | | | 5,635,000 | |
Cisco Systems, Inc. | | | 738,175 | | | | 46,778,150 | |
F5, Inc.* | | | 10,500 | | | | 2,569,455 | |
Juniper Networks, Inc. | | | 57,400 | | | | 2,049,754 | |
Motorola Solutions, Inc. | | | 29,627 | | | | 8,049,656 | |
| | | | | | | | |
| | |
| | | | | | | 65,082,015 | |
| | | | | | | | |
Construction & Engineering — 0.0% | |
Quanta Services, Inc. | | | 25,000 | | | | 2,866,500 | |
| | | | | | | | |
Construction Materials — 0.1% | |
Martin Marietta Materials, Inc. | | | 11,000 | | | | 4,845,720 | |
Vulcan Materials Co. | | | 23,200 | | | | 4,815,856 | |
| | | | | | | | |
| | |
| | | | | | | 9,661,576 | |
| | | | | | | | |
Consumer Finance — 0.5% | |
American Express Co. | | | 109,800 | | | | 17,963,280 | |
Capital One Financial Corp. | | | 74,569 | | | | 10,819,216 | |
Discover Financial Services | | | 51,305 | | | | 5,928,806 | |
Synchrony Financial | | | 95,830 | | | | 4,445,554 | |
| | | | | | | | |
| | |
| | | | | | | 39,156,856 | |
| | | | | | | | |
Containers & Packaging — 0.3% | |
Amcor PLC | | | 269,300 | | | | 3,234,293 | |
Avery Dennison Corp. | | | 14,500 | | | | 3,140,265 | |
Ball Corp. | | | 56,900 | | | | 5,477,763 | |
| | | | | | | | |
| | | Shares | | | Value | |
|
| COMMON STOCKS (continued) | |
|
| Containers & Packaging (cont’d.) | |
International Paper Co. | | | 67,967 | | | $ | 3,193,090 | |
Packaging Corp. of America | | | 16,700 | | | | 2,273,705 | |
Sealed Air Corp. | | | 26,020 | | | | 1,755,569 | |
Westrock Co. | | | 46,361 | | | | 2,056,574 | |
| | | | | | | | |
| | |
| | | | | | | 21,131,259 | |
| | | | | | | | |
Distributors — 0.1% | | | | | | | | |
Genuine Parts Co. | | | 24,925 | | | | 3,494,485 | |
LKQ Corp. | | | 46,900 | | | | 2,815,407 | |
Pool Corp. | | | 7,020 | | | | 3,973,320 | |
| | | | | | | | |
| | |
| | | | | | | 10,283,212 | |
| | | | | | | | |
Diversified Financial Services — 1.3% | |
Berkshire Hathaway, Inc. (Class B
Stock)* | | | 322,210 | | | | 96,340,790 | |
| | | | | | | | |
Diversified Telecommunication Services — 1.0% | |
AT&T, Inc. | | | 1,249,871 | | | | 30,746,827 | |
Lumen Technologies, Inc.(a) | | | 161,343 | | | | 2,024,855 | |
Verizon Communications, Inc. | | | 724,638 | | | | 37,652,190 | |
| | | | | | | | |
| | |
| | | | | | | 70,423,872 | |
| | | | | | | | |
Electric Utilities — 1.6% | |
Alliant Energy Corp. | | | 43,700 | | | | 2,686,239 | |
American Electric Power Co., Inc. | | | 88,140 | | | | 7,841,816 | |
Duke Energy Corp. | | | 134,448 | | | | 14,103,595 | |
Edison International | | | 66,000 | | | | 4,504,500 | |
Entergy Corp. | | | 35,000 | | | | 3,942,750 | |
Evergy, Inc. | | | 39,700 | | | | 2,723,817 | |
Eversource Energy | | | 60,100 | | | | 5,467,898 | |
Exelon Corp. | | | 170,773 | | | | 9,863,848 | |
FirstEnergy Corp. | | | 95,080 | | | | 3,954,377 | |
NextEra Energy, Inc. | | | 343,500 | | | | 32,069,160 | |
NRG Energy, Inc. | | | 43,000 | | | | 1,852,440 | |
Pinnacle West Capital Corp. | | | 19,600 | | | | 1,383,564 | |
PPL Corp. | | | 134,500 | | | | 4,043,070 | |
Southern Co. (The) | | | 185,500 | | | | 12,721,590 | |
Xcel Energy, Inc. | | | 93,895 | | | | 6,356,692 | |
| | | | | | | | |
| | |
| | | | | | | 113,515,356 | |
| | | | | | | | |
Electrical Equipment — 0.5% | |
AMETEK, Inc. | | | 40,500 | | | | 5,955,120 | |
Eaton Corp. PLC | | | 69,661 | | | | 12,038,814 | |
Emerson Electric Co. | | | 104,400 | | | | 9,706,068 | |
Generac Holdings, Inc.* | | | 11,100 | | | | 3,906,312 | |
Rockwell Automation, Inc.(a) | | | 20,320 | | | | 7,088,632 | |
| | | | | | | | |
| | |
| | | | | | | 38,694,946 | |
| | | | | | | | |
Electronic Equipment, Instruments & Components — 0.7% | |
Amphenol Corp. (Class A Stock) | | | 104,800 | | | | 9,165,808 | |
CDW Corp. | | | 23,800 | | | | 4,873,764 | |
Corning, Inc. | | | 134,500 | | | | 5,007,435 | |
IPG Photonics Corp.* | | | 6,300 | | | | 1,084,482 | |
Keysight Technologies, Inc.* | | | 32,400 | | | | 6,690,924 | |
TE Connectivity Ltd. | | | 57,300 | | | | 9,244,782 | |
Teledyne Technologies, Inc.* | | | 8,129 | | | | 3,551,479 | |
Trimble, Inc.* | | | 43,900 | | | | 3,827,641 | |
SEE NOTES TO FINANCIAL STATEMENTS.
A132
| | | | | | |
| | |
| | PSF STOCK INDEX PORTFOLIO (CONTINUED) | | |
| | | | | | |
| |
| SCHEDULE OF INVESTMENTS | | as of December 31, 2021 |
| | | | | | | | |
| | | Shares | | | Value | |
|
| COMMON STOCKS (continued) | |
Electronic Equipment, Instruments & Components (cont’d.) | |
Zebra Technologies Corp. (Class A Stock)* | | | 9,380 | | | $ | 5,582,976 | |
| | | | | | | | |
| | |
| | | | | | | 49,029,291 | |
| | | | | | | | |
Energy Equipment & Services — 0.2% | | | | | | | | |
Baker Hughes Co. | | | 153,048 | | | | 3,682,335 | |
Halliburton Co. | | | 155,000 | | | | 3,544,850 | |
Schlumberger NV | | | 244,298 | | | | 7,316,725 | |
| | | | | | | | |
| | |
| | | | | | | 14,543,910 | |
| | | | | | | | |
Entertainment — 1.6% | | | | | | | | |
Activision Blizzard, Inc. | | | 136,400 | | | | 9,074,692 | |
Electronic Arts, Inc. | | | 49,700 | | | | 6,555,430 | |
Live Nation Entertainment, Inc.* | | | 23,700 | | | | 2,836,653 | |
Netflix, Inc.* | | | 77,530 | | | | 46,707,173 | |
Take-Two Interactive Software, Inc.* | | | 20,100 | | | | 3,572,172 | |
Walt Disney Co. (The)* | | | 318,072 | | | | 49,266,172 | |
| | | | | | | | |
| | |
| | | | | | | 118,012,292 | |
| | | | | | | | |
Equity Real Estate Investment Trusts (REITs) — 2.6% | |
Alexandria Real Estate Equities, Inc. | | | 24,680 | | | | 5,502,653 | |
American Tower Corp. | | | 79,700 | | | | 23,312,250 | |
AvalonBay Communities, Inc. | | | 24,418 | | | | 6,167,743 | |
Boston Properties, Inc.(a) | | | 25,100 | | | | 2,891,018 | |
Crown Castle International Corp. | | | 75,600 | | | | 15,780,744 | |
Digital Realty Trust, Inc. | | | 49,700 | | | | 8,790,439 | |
Duke Realty Corp. | | | 66,700 | | | | 4,378,188 | |
Equinix, Inc. | | | 15,775 | | | | 13,343,126 | |
Equity Residential | | | 59,800 | | | | 5,411,900 | |
Essex Property Trust, Inc. | | | 11,470 | | | | 4,040,078 | |
Extra Space Storage, Inc. | | | 23,500 | | | | 5,328,155 | |
Federal Realty Investment Trust | | | 12,300 | | | | 1,676,736 | |
Healthpeak Properties, Inc. | | | 94,400 | | | | 3,406,896 | |
Host Hotels & Resorts, Inc.* | | | 124,926 | | | | 2,172,463 | |
Iron Mountain, Inc.(a) | | | 50,730 | | | | 2,654,701 | |
Kimco Realty Corp. | | | 106,500 | | | | 2,625,225 | |
Mid-America Apartment Communities, Inc. | | | 20,200 | | | | 4,634,688 | |
Prologis, Inc. | | | 129,228 | | | | 21,756,826 | |
Public Storage | | | 26,750 | | | | 10,019,480 | |
Realty Income Corp. | | | 99,100 | | | | 7,094,569 | |
Regency Centers Corp. | | | 26,600 | | | | 2,004,310 | |
SBA Communications Corp. | | | 19,030 | | | | 7,403,051 | |
Simon Property Group, Inc. | | | 57,461 | | | | 9,180,544 | |
UDR, Inc. | | | 50,900 | | | | 3,053,491 | |
Ventas, Inc. | | | 69,904 | | | | 3,573,492 | |
Vornado Realty Trust | | | 28,057 | | | | 1,174,466 | |
Welltower, Inc. | | | 76,200 | | | | 6,535,674 | |
Weyerhaeuser Co. | | | 130,530 | | | | 5,375,225 | |
| | | | | | | | |
| | |
| | | | | | | 189,288,131 | |
| | | | | | | | |
Food & Staples Retailing — 1.4% | | | | | | | | |
Costco Wholesale Corp. | | | 77,332 | | | | 43,901,376 | |
Kroger Co. (The) | | | 118,900 | | | | 5,381,414 | |
Sysco Corp. | | | 89,400 | | | | 7,022,370 | |
Walgreens Boots Alliance, Inc. | | | 125,400 | | | | 6,540,864 | |
Walmart, Inc. | | | 249,600 | | | | 36,114,624 | |
| | | | | | | | |
| | |
| | | | | | | 98,960,648 | |
| | | | | | | | |
| | | | | | | | |
| | | Shares | | | Value | |
|
| COMMON STOCKS (continued) | |
Food Products — 0.8% | | | | | | | | |
Archer-Daniels-Midland Co. | | | 97,738 | | | $ | 6,606,112 | |
Campbell Soup Co.(a) | | | 35,800 | | | | 1,555,868 | |
Conagra Brands, Inc. | | | 84,000 | | | | 2,868,600 | |
General Mills, Inc.(a) | | | 105,700 | | | | 7,122,066 | |
Hershey Co. (The) | | | 25,500 | | | | 4,933,485 | |
Hormel Foods Corp. | | | 48,800 | | | | 2,381,928 | |
J.M. Smucker Co. (The) | | | 19,000 | | | | 2,580,580 | |
Kellogg Co.(a) | | | 44,600 | | | | 2,873,132 | |
Kraft Heinz Co. (The) | | | 124,137 | | | | 4,456,518 | |
Lamb Weston Holdings, Inc. | | | 25,700 | | | | 1,628,866 | |
McCormick & Co., Inc.(a) | | | 43,400 | | | | 4,192,874 | |
Mondelez International, Inc. (Class A Stock) | | | 246,711 | | | | 16,359,406 | |
Tyson Foods, Inc. (Class A Stock) | | | 51,600 | | | | 4,497,456 | |
| | | | | | | | |
| | |
| | | | | | | 62,056,891 | |
| | | | | | | | |
Gas Utilities — 0.0% | | | | | | | | |
Atmos Energy Corp. | | | 23,200 | | | | 2,430,664 | |
| | | | | | | | |
Health Care Equipment & Supplies — 2.9% | |
Abbott Laboratories | | | 309,625 | | | | 43,576,622 | |
ABIOMED, Inc.* | | | 7,900 | | | | 2,837,443 | |
Align Technology, Inc.* | | | 12,820 | | | | 8,425,048 | |
Baxter International, Inc. | | | 87,700 | | | | 7,528,168 | |
Becton, Dickinson & Co. | | | 50,149 | | | | 12,611,471 | |
Boston Scientific Corp.* | | | 248,699 | | | | 10,564,734 | |
Cooper Cos., Inc. (The)(a) | | | 8,630 | | | | 3,615,452 | |
DENTSPLY SIRONA, Inc. | | | 38,200 | | | | 2,131,178 | |
Dexcom, Inc.* | | | 16,980 | | | | 9,117,411 | |
Edwards Lifesciences Corp.* | | | 109,350 | | | | 14,166,292 | |
Hologic, Inc.* | | | 44,500 | | | | 3,406,920 | |
IDEXX Laboratories, Inc.* | | | 14,880 | | | | 9,797,885 | |
Intuitive Surgical, Inc.* | | | 62,380 | | | | 22,413,134 | |
Medtronic PLC | | | 235,628 | | | | 24,375,717 | |
ResMed, Inc. | | | 25,500 | | | | 6,642,240 | |
STERIS PLC | | | 17,500 | | | | 4,259,675 | |
Stryker Corp. | | | 58,670 | | | | 15,689,531 | |
Teleflex, Inc. | | | 8,200 | | | | 2,693,536 | |
Zimmer Biomet Holdings, Inc. | | | 36,686 | | | | 4,660,589 | |
| | | | | | | | |
| | |
| | | | | | | 208,513,046 | |
| | | | | | | | |
Health Care Providers & Services — 2.7% | |
AmerisourceBergen Corp. | | | 26,400 | | | | 3,508,296 | |
Anthem, Inc. | | | 42,580 | | | | 19,737,533 | |
Cardinal Health, Inc. | | | 50,375 | | | | 2,593,809 | |
Centene Corp.* | | | 102,268 | | | | 8,426,883 | |
Cigna Corp. | | | 58,032 | | | | 13,325,888 | |
CVS Health Corp. | | | 231,099 | | | | 23,840,173 | |
DaVita, Inc.* | | | 11,700 | | | | 1,330,992 | |
HCA Healthcare, Inc. | | | 41,900 | | | | 10,764,948 | |
Henry Schein, Inc.* | | | 24,300 | | | | 1,883,979 | |
Humana, Inc. | | | 22,500 | | | | 10,436,850 | |
Laboratory Corp. of America Holdings* | | | 16,800 | | | | 5,278,728 | |
McKesson Corp. | | | 27,107 | | | | 6,737,987 | |
Quest Diagnostics, Inc. | | | 21,500 | | | | 3,719,715 | |
UnitedHealth Group, Inc. | | | 164,930 | | | | 82,817,950 | |
SEE NOTES TO FINANCIAL STATEMENTS.
A133
| | | | | | |
| | |
| | PSF STOCK INDEX PORTFOLIO (CONTINUED) | | |
| | | | | | |
| |
| SCHEDULE OF INVESTMENTS | | as of December 31, 2021 |
| | | | | | | | |
| | | Shares | | | Value | |
| | |
| COMMON STOCKS (continued) | | | | | | | | |
Health Care Providers & Services (cont’d.) | | | | | | | | |
Universal Health Services, Inc. (Class B Stock) | | | 12,800 | | | $ | 1,659,648 | |
| | | | | | | | |
| | |
| | | | | | | 196,063,379 | |
| | | | | | | | |
Health Care Technology — 0.1% | | | | | | | | |
Cerner Corp. | | | 51,300 | | | | 4,764,231 | |
| | | | | | | | |
Hotels, Restaurants & Leisure — 1.9% | | | | | | | | |
Booking Holdings, Inc.* | | | 7,180 | | | | 17,226,471 | |
Caesars Entertainment, Inc.* | | | 37,600 | | | | 3,516,728 | |
Carnival Corp.*(a) | | | 140,700 | | | | 2,830,884 | |
Chipotle Mexican Grill, Inc.* | | | 4,910 | | | | 8,583,907 | |
Darden Restaurants, Inc. | | | 22,650 | | | | 3,411,996 | |
Domino’s Pizza, Inc.(a) | | | 6,400 | | | | 3,611,712 | |
Expedia Group, Inc.*(a) | | | 25,600 | | | | 4,626,432 | |
Hilton Worldwide Holdings, Inc.* | | | 48,800 | | | | 7,612,312 | |
Las Vegas Sands Corp.* | | | 59,700 | | | | 2,247,108 | |
Marriott International, Inc. (Class A Stock)* | | | 47,823 | | | | 7,902,273 | |
McDonald’s Corp. | | | 130,810 | | | | 35,066,237 | |
MGM Resorts International | | | 68,200 | | | | 3,060,816 | |
Norwegian Cruise Line Holdings
Ltd.*(a) | | | 64,200 | | | | 1,331,508 | |
Penn National Gaming, Inc.*(a) | | | 28,800 | | | | 1,493,280 | |
Royal Caribbean Cruises Ltd.*(a) | | | 38,900 | | | | 2,991,410 | |
Starbucks Corp. | | | 206,600 | | | | 24,166,002 | |
Wynn Resorts Ltd.* | | | 18,400 | | | | 1,564,736 | |
Yum! Brands, Inc. | | | 51,800 | | | | 7,192,948 | |
| | | | | | | | |
| | |
| | | | | | | 138,436,760 | |
| | | | | | | | |
Household Durables — 0.4% | | | | | | | | |
D.R. Horton, Inc. | | | 57,000 | | | | 6,181,650 | |
Garmin Ltd. | | | 26,700 | | | | 3,635,739 | |
Lennar Corp. (Class A Stock) | | | 47,600 | | | | 5,529,216 | |
Mohawk Industries, Inc.* | | | 9,600 | | | | 1,748,928 | |
Newell Brands, Inc.(a) | | | 65,749 | | | | 1,435,958 | |
NVR, Inc.* | | | 570 | | | | 3,368,056 | |
PulteGroup, Inc. | | | 44,285 | | | | 2,531,331 | |
Whirlpool Corp.(a) | | | 10,567 | | | | 2,479,652 | |
| | | | | | | | |
| | |
| | | | | | | 26,910,530 | |
| | | | | | | | |
Household Products — 1.4% | | | | | | | | |
Church & Dwight Co., Inc. | | | 42,800 | | | | 4,387,000 | |
Clorox Co. (The) | | | 21,700 | | | | 3,783,612 | |
Colgate-Palmolive Co. | | | 147,600 | | | | 12,596,184 | |
Kimberly-Clark Corp. | | | 58,788 | | | | 8,401,981 | |
Procter & Gamble Co. (The) | | | 424,176 | | | | 69,386,710 | |
| | | | | | | | |
| | |
| | | | | | | 98,555,487 | |
| | | | | | | | |
Independent Power & Renewable Electricity Producers — 0.0% | |
AES Corp. (The) | | | 116,500 | | | | 2,830,950 | |
| | | | | | | | |
Industrial Conglomerates — 1.0% | | | | | | | | |
3M Co. | | | 101,270 | | | | 17,988,590 | |
General Electric Co. | | | 192,255 | | | | 18,162,330 | |
Honeywell International, Inc. | | | 120,650 | | | | 25,156,731 | |
Roper Technologies, Inc. | | | 18,500 | | | | 9,099,410 | |
| | | | | | | | |
| | |
| | | | | | | 70,407,061 | |
| | | | | | | | |
| | | | | | | | |
| | | Shares | | | Value | |
| | |
| COMMON STOCKS (continued) | | | | | | | | |
Insurance — 1.7% | | | | | | | | |
Aflac, Inc. | | | 106,600 | | | $ | 6,224,374 | |
Allstate Corp. (The) | | | 50,228 | | | | 5,909,324 | |
American International Group, Inc. | | | 145,329 | | | | 8,263,407 | |
Aon PLC (Class A Stock)(a) | | | 39,425 | | | | 11,849,578 | |
Arthur J. Gallagher & Co. | | | 36,200 | | | | 6,142,054 | |
Assurant, Inc. | | | 10,500 | | | | 1,636,530 | |
Brown & Brown, Inc. | | | 41,100 | | | | 2,888,508 | |
Chubb Ltd. | | | 75,430 | | | | 14,581,373 | |
Cincinnati Financial Corp. | | | 26,028 | | | | 2,965,370 | |
Everest Re Group Ltd. | | | 6,900 | | | | 1,890,048 | |
Globe Life, Inc.(a) | | | 16,175 | | | | 1,515,921 | |
Hartford Financial Services Group, Inc. (The) | | | 59,600 | | | | 4,114,784 | |
Lincoln National Corp. | | | 29,763 | | | | 2,031,623 | |
Loews Corp. | | | 35,326 | | | | 2,040,430 | |
Marsh & McLennan Cos., Inc. | | | 88,500 | | | | 15,383,070 | |
MetLife, Inc. | | | 125,180 | | | | 7,822,498 | |
Principal Financial Group, Inc. | | | 43,300 | | | | 3,131,889 | |
Progressive Corp. (The) | | | 102,400 | | | | 10,511,360 | |
Travelers Cos., Inc. (The) | | | 43,098 | | | | 6,741,820 | |
W.R. Berkley Corp. | | | 24,600 | | | | 2,026,794 | |
Willis Towers Watson PLC | | | 22,700 | | | | 5,391,023 | |
| | | | | | | | |
| | |
| | | | | | | 123,061,778 | |
| | | | | | | | |
Interactive Media & Services — 6.1% | | | | | | | | |
Alphabet, Inc. (Class A Stock)* | | | 52,629 | | | | 152,468,318 | |
Alphabet, Inc. (Class C Stock)* | | | 48,920 | | | | 141,554,423 | |
Match Group, Inc.* | | | 49,600 | | | | 6,559,600 | |
Meta Platforms, Inc. (Class A Stock)* | | | 414,020 | | | | 139,255,627 | |
Twitter, Inc.* | | | 140,000 | | | | 6,050,800 | |
| | | | | | | | |
| | |
| | | | | | | 445,888,768 | |
| | | | | | | | |
Internet & Direct Marketing Retail — 3.7% | | | | | |
Amazon.com, Inc.* | | | 76,320 | | | | 254,476,829 | |
eBay, Inc. | | | 112,300 | | | | 7,467,950 | |
Etsy, Inc.* | | | 22,200 | | | | 4,860,468 | |
| | | | | | | | |
| | |
| | | | | | | 266,805,247 | |
| | | | | | | | |
IT Services — 4.4% | | | | | | | | |
Accenture PLC (Class A Stock) | | | 110,600 | | | | 45,849,230 | |
Akamai Technologies, Inc.* | | | 28,500 | | | | 3,335,640 | |
Automatic Data Processing, Inc. | | | 73,660 | | | | 18,163,083 | |
Broadridge Financial Solutions, Inc. | | | 20,400 | | | | 3,729,528 | |
Cognizant Technology Solutions Corp. (Class A Stock) | | | 91,800 | | | | 8,144,496 | |
DXC Technology Co.* | | | 43,950 | | | | 1,414,751 | |
EPAM Systems, Inc.* | | | 9,940 | | | | 6,644,393 | |
Fidelity National Information Services, Inc. | | | 106,600 | | | | 11,635,390 | |
Fiserv, Inc.* | | | 104,100 | | | | 10,804,539 | |
FleetCor Technologies, Inc.* | | | 14,200 | | | | 3,178,528 | |
Gartner, Inc.* | | | 14,400 | | | | 4,814,208 | |
Global Payments, Inc. | | | 50,863 | | | | 6,875,660 | |
International Business Machines Corp. | | | 157,025 | | | | 20,987,961 | |
Jack Henry & Associates, Inc. | | | 12,900 | | | | 2,154,171 | |
Mastercard, Inc. (Class A Stock) | | | 151,900 | | | | 54,580,708 | |
Paychex, Inc. | | | 56,250 | | | | 7,678,125 | |
PayPal Holdings, Inc.* | | | 205,700 | | | | 38,790,906 | |
SEE NOTES TO FINANCIAL STATEMENTS.
A134
| | | | | | |
| | |
| | PSF STOCK INDEX PORTFOLIO (CONTINUED) | | |
| | | | | | |
| |
| SCHEDULE OF INVESTMENTS | | as of December 31, 2021 |
| | | | | | | | |
| | | Shares | | | Value | |
| |
COMMON STOCKS (continued) | | | | | |
IT Services (cont’d.) | | | | | | | | |
VeriSign, Inc.* | | | 17,100 | | | $ | 4,340,322 | |
Visa, Inc. (Class A Stock)(a) | | | 293,400 | | | | 63,582,714 | |
| | | | | | | | |
| | |
| | | | | | | 316,704,353 | |
| | | | | | | | |
Leisure Products — 0.0% | | | | | | | | |
Hasbro, Inc.(a) | | | 22,950 | | | | 2,335,851 | |
| | | | | | | | |
Life Sciences Tools & Services — 2.0% | | | | | |
Agilent Technologies, Inc. | | | 52,982 | | | | 8,458,576 | |
Bio-Rad Laboratories, Inc. (Class A Stock)* | | | 3,760 | | | | 2,840,943 | |
Bio-Techne Corp. | | | 6,880 | | | | 3,559,299 | |
Charles River Laboratories International, Inc.* | | | 8,900 | | | | 3,353,342 | |
Danaher Corp. | | | 111,300 | | | | 36,618,813 | |
Illumina, Inc.* | | | 27,360 | | | | 10,408,839 | |
IQVIA Holdings, Inc.* | | | 33,500 | | | | 9,451,690 | |
Mettler-Toledo International, Inc.* | | | 4,050 | | | | 6,873,701 | |
PerkinElmer, Inc. | | | 22,100 | | | | 4,443,426 | |
Thermo Fisher Scientific, Inc. | | | 68,980 | | | | 46,026,215 | |
Waters Corp.* | | | 10,600 | | | | 3,949,560 | |
West Pharmaceutical Services, Inc. | | | 13,000 | | | | 6,097,130 | |
| | | | | | | | |
| | |
| | | | | | | 142,081,534 | |
| | | | | | | | |
Machinery — 1.5% | | | | | | | | |
Caterpillar, Inc. | | | 94,600 | | | | 19,557,604 | |
Cummins, Inc. | | | 25,000 | | | | 5,453,500 | |
Deere & Co. | | | 49,450 | | | | 16,955,911 | |
Dover Corp. | | | 25,400 | | | | 4,612,640 | |
Fortive Corp. | | | 62,800 | | | | 4,791,012 | |
IDEX Corp. | | | 13,400 | | | | 3,166,688 | |
Illinois Tool Works, Inc.(a) | | | 50,075 | | | | 12,358,510 | |
Ingersoll Rand, Inc. | | | 71,337 | | | | 4,413,620 | |
Otis Worldwide Corp. | | | 74,583 | | | | 6,493,942 | |
PACCAR, Inc. | | | 60,628 | | | | 5,351,027 | |
Parker-Hannifin Corp. | | | 22,687 | | | | 7,217,188 | |
Pentair PLC(a) | | | 28,907 | | | | 2,111,078 | |
Snap-on, Inc.(a) | | | 9,400 | | | | 2,024,572 | |
Stanley Black & Decker, Inc. | | | 28,635 | | | | 5,401,134 | |
Westinghouse Air Brake Technologies Corp. | | | 32,812 | | | | 3,022,313 | |
Xylem, Inc.(a) | | | 31,600 | | | | 3,789,472 | |
| | | | | | | | |
| | |
| | | | | | | 106,720,211 | |
| | | | | | | | |
Media — 1.0% | | | | | | | | |
Charter Communications, Inc. (Class A Stock)* | | | 21,650 | | | | 14,115,151 | |
Comcast Corp. (Class A Stock) | | | 798,092 | | | | 40,167,970 | |
Discovery, Inc. (Class A Stock)*(a) | | | 29,900 | | | | 703,846 | |
Discovery, Inc. (Class C Stock)*(a) | | | 52,100 | | | | 1,193,090 | |
DISH Network Corp. (Class A Stock)* | | | 43,175 | | | | 1,400,597 | |
Fox Corp. (Class A Stock) | | | 56,166 | | | | 2,072,525 | |
Fox Corp. (Class B Stock) | | | 25,766 | | | | 883,001 | |
Interpublic Group of Cos., Inc. (The)(a) | | | 68,262 | | | | 2,556,412 | |
News Corp. (Class A Stock) | | | 67,925 | | | | 1,515,407 | |
News Corp. (Class B Stock) | | | 21,400 | | | | 481,500 | |
Omnicom Group, Inc.(a) | | | 37,300 | | | | 2,732,971 | |
| | | | | | | | |
| | | Shares | | | Value | |
| |
COMMON STOCKS (continued) | | | | | |
Media (cont’d.) | | | | | | | | |
ViacomCBS, Inc. (Class B Stock)(a) | | | 104,966 | | | $ | 3,167,874 | |
| | | | | | | | |
| | |
| | | | | | | 70,990,344 | |
| | | | | | | | |
Metals & Mining — 0.3% | | | | | | | | |
Freeport-McMoRan, Inc. | | | 257,012 | | | | 10,725,111 | |
Newmont Corp. | | | 139,703 | | | | 8,664,380 | |
Nucor Corp. | | | 50,100 | | | | 5,718,915 | |
| | | | | | | | |
| | |
| | | | | | | 25,108,406 | |
| | | | | | | | |
Multiline Retail — 0.5% | | | | | | | | |
Dollar General Corp. | | | 41,300 | | | | 9,739,779 | |
Dollar Tree, Inc.* | | | 39,447 | | | | 5,543,092 | |
Target Corp. | | | 85,468 | | | | 19,780,714 | |
| | | | | | | | |
| | |
| | | | | | | 35,063,585 | |
| | | | | | | | |
Multi-Utilities — 0.7% | | | | | | | | |
Ameren Corp. | | | 44,900 | | | | 3,996,549 | |
CenterPoint Energy, Inc. | | | 110,110 | | | | 3,073,170 | |
CMS Energy Corp. | | | 50,700 | | | | 3,298,035 | |
Consolidated Edison, Inc. | | | 61,900 | | | | 5,281,308 | |
Dominion Energy, Inc. | | | 141,240 | | | | 11,095,815 | |
DTE Energy Co. | | | 33,700 | | | | 4,028,498 | |
NiSource, Inc. | | | 67,500 | | | | 1,863,675 | |
Public Service Enterprise Group, Inc. | | | 88,300 | | | | 5,892,259 | |
Sempra Energy | | | 55,854 | | | | 7,388,367 | |
WEC Energy Group, Inc. | | | 55,176 | | | | 5,355,934 | |
| | | | | | | | |
| | |
| | | | | | | 51,273,610 | |
| | | | | | | | |
Oil, Gas & Consumable Fuels — 2.4% | | | | | |
APA Corp. | | | 63,550 | | | | 1,708,860 | |
Chevron Corp. | | | 337,759 | | | | 39,636,019 | |
ConocoPhillips | | | 230,861 | | | | 16,663,547 | |
Coterra Energy, Inc. | | | 142,100 | | | | 2,699,900 | |
Devon Energy Corp.(a) | | | 110,300 | | | | 4,858,715 | |
Diamondback Energy, Inc. | | | 29,600 | | | | 3,192,360 | |
EOG Resources, Inc. | | | 102,400 | | | | 9,096,192 | |
Exxon Mobil Corp. | | | 741,004 | | | | 45,342,035 | |
Hess Corp. | | | 48,375 | | | | 3,581,201 | |
Kinder Morgan, Inc. | | | 341,343 | | | | 5,413,700 | |
Marathon Oil Corp. | | | 135,594 | | | | 2,226,453 | |
Marathon Petroleum Corp. | | | 107,787 | | | | 6,897,290 | |
Occidental Petroleum Corp. | | | 155,428 | | | | 4,505,858 | |
ONEOK, Inc. | | | 77,740 | | | | 4,568,002 | |
Phillips 66 | | | 76,364 | | | | 5,533,335 | |
Pioneer Natural Resources Co. | | | 39,700 | | | | 7,220,636 | |
Valero Energy Corp. | | | 71,600 | | | | 5,377,876 | |
Williams Cos., Inc. (The) | | | 211,700 | | | | 5,512,668 | |
| | | | | | | | |
| | |
| | | | | | | 174,034,647 | |
| | | | | | | | |
Personal Products — 0.2% | | | | | | | | |
Estee Lauder Cos., Inc. (The) (Class A Stock) | | | 40,600 | | | | 15,030,120 | |
| | | | | | | | |
Pharmaceuticals — 3.6% | | | | | | | | |
Bristol-Myers Squibb Co. | | | 388,140 | | | | 24,200,529 | |
Catalent, Inc.* | | | 30,000 | | | | 3,840,900 | |
Eli Lilly & Co. | | | 139,000 | | | | 38,394,580 | |
Johnson & Johnson | | | 460,796 | | | | 78,828,372 | |
Merck & Co., Inc. | | | 442,103 | | | | 33,882,774 | |
SEE NOTES TO FINANCIAL STATEMENTS.
A135
| | | | | | |
| | |
| | PSF STOCK INDEX PORTFOLIO (CONTINUED) | | |
| | | | | | |
| |
| SCHEDULE OF INVESTMENTS | | as of December 31, 2021 |
| | | | | | | | |
| | | Shares | | | Value | |
| |
COMMON STOCKS (continued) | | | | | |
Pharmaceuticals (cont’d.) | | | | |
Organon & Co. | | | 43,790 | | | $ | 1,333,405 | |
Pfizer, Inc. | | | 982,423 | | | | 58,012,078 | |
Viatris, Inc. | | | 209,894 | | | | 2,839,866 | |
Zoetis, Inc. | | | 82,900 | | | | 20,230,087 | |
| | | | | | | | |
| | |
| | | | | | | 261,562,591 | |
| | | | | | | | |
Professional Services — 0.4% | | | | | | | | |
Equifax, Inc. | | | 21,300 | | | | 6,236,427 | |
IHS Markit Ltd. | | | 69,600 | | | | 9,251,232 | |
Jacobs Engineering Group, Inc. | | | 22,800 | | | | 3,174,444 | |
Leidos Holdings, Inc. | | | 24,600 | | | | 2,186,940 | |
Nielsen Holdings PLC | | | 61,800 | | | | 1,267,518 | |
Robert Half International, Inc. | | | 19,500 | | | | 2,174,640 | |
Verisk Analytics, Inc. | | | 28,200 | | | | 6,450,186 | |
| | | | | | | | |
| | |
| | | | | | | 30,741,387 | |
| | | | | | | | |
Real Estate Management & Development — 0.1% | |
CBRE Group, Inc. (Class A Stock)* | | | 58,600 | | | | 6,358,686 | |
| | | | | | | | |
Road & Rail — 0.9% | | | | |
CSX Corp. | | | 389,716 | | | | 14,653,322 | |
J.B. Hunt Transport Services, Inc.(a) | | | 14,700 | | | | 3,004,680 | |
Norfolk Southern Corp. | | | 43,300 | | | | 12,890,843 | |
Old Dominion Freight Line, Inc. | | | 16,250 | | | | 5,823,675 | |
Union Pacific Corp. | | | 114,100 | | | | 28,745,213 | |
| | | | | | | | |
| | |
| | | | | | | 65,117,733 | |
| | | | | | | | |
Semiconductors & Semiconductor Equipment — 6.2% | |
Advanced Micro Devices, Inc.* | | | 211,400 | | | | 30,420,460 | |
Analog Devices, Inc. | | | 93,944 | | | | 16,512,537 | |
Applied Materials, Inc. | | | 158,100 | | | | 24,878,616 | |
Broadcom, Inc. | | | 72,040 | | | | 47,936,136 | |
Enphase Energy, Inc.* | | | 23,600 | | | | 4,317,384 | |
Intel Corp. | | | 711,900 | | | | 36,662,850 | |
KLA Corp. | | | 26,600 | | | | 11,440,926 | |
Lam Research Corp. | | | 24,660 | | | | 17,734,239 | |
Microchip Technology, Inc. | | | 97,100 | | | | 8,453,526 | |
Micron Technology, Inc. | | | 195,800 | | | | 18,238,770 | |
Monolithic Power Systems, Inc. | | | 7,600 | | | | 3,749,308 | |
NVIDIA Corp. | | | 437,560 | | | | 128,690,772 | |
NXP Semiconductors NV (China) | | | 46,600 | | | | 10,614,548 | |
Qorvo, Inc.* | | | 19,286 | | | | 3,016,138 | |
QUALCOMM, Inc. | | | 196,050 | | | | 35,851,663 | |
Skyworks Solutions, Inc.(a) | | | 29,100 | | | | 4,514,574 | |
SolarEdge Technologies, Inc.* | | | 9,200 | | | | 2,581,244 | |
Teradyne, Inc. | | | 28,600 | | | | 4,676,958 | |
Texas Instruments, Inc. | | | 161,700 | | | | 30,475,599 | |
Xilinx, Inc. | | | 43,400 | | | | 9,202,102 | |
| | | | | | | | |
| | |
| | | | | | | 449,968,350 | |
| | | | | | | | |
Software — 9.3% | | | | | | | | |
Adobe, Inc.* | | | 83,295 | | | | 47,233,263 | |
ANSYS, Inc.* | | | 15,300 | | | | 6,137,136 | |
Autodesk, Inc.* | | | 38,470 | | | | 10,817,379 | |
Cadence Design Systems, Inc.* | | | 48,600 | | | | 9,056,610 | |
Ceridian HCM Holding, Inc.* | | | 24,000 | | | | 2,507,040 | |
Citrix Systems, Inc. | | | 21,600 | | | | 2,043,144 | |
Fortinet, Inc.* | | | 23,800 | | | | 8,553,720 | |
Intuit, Inc. | | | 49,560 | | | | 31,877,983 | |
| | | | | | | | |
| | | Shares | | | Value | |
COMMON STOCKS (continued) | | | | | |
Software (cont’d.) | | | | | | | | |
Microsoft Corp. | | | 1,313,780 | | | $ | 441,850,490 | |
NortonLifeLock, Inc. | | | 100,811 | | | | 2,619,070 | |
Oracle Corp. | | | 282,295 | | | | 24,618,947 | |
Paycom Software, Inc.* | | | 8,400 | | | | 3,487,596 | |
PTC, Inc.* | | | 18,600 | | | | 2,253,390 | |
salesforce.com, Inc.* | | | 171,400 | | | | 43,557,882 | |
ServiceNow, Inc.* | | | 34,830 | | | | 22,608,501 | |
Synopsys, Inc.* | | | 26,800 | | | | 9,875,800 | |
Tyler Technologies, Inc.* | | | 7,180 | | | | 3,862,481 | |
| | | | | | | | |
| | |
| | | | | | | 672,960,432 | |
| | | | | | | | |
Specialty Retail — 2.4% | | | | | | | | |
Advance Auto Parts, Inc. | | | 11,060 | | | | 2,653,073 | |
AutoZone, Inc.* | | | 3,670 | | | | 7,693,751 | |
Bath & Body Works, Inc. | | | 46,096 | | | | 3,217,040 | |
Best Buy Co., Inc. | | | 38,825 | | | | 3,944,620 | |
CarMax, Inc.* | | | 28,500 | | | | 3,711,555 | |
Gap, Inc. (The) | | | 37,387 | | | | 659,880 | |
Home Depot, Inc. (The) | | | 185,769 | | | | 77,095,993 | |
Lowe’s Cos., Inc. | | | 123,175 | | | | 31,838,274 | |
O’Reilly Automotive, Inc.* | | | 12,010 | | | | 8,481,822 | |
Ross Stores, Inc. | | | 62,500 | | | | 7,142,500 | |
TJX Cos., Inc. (The) | | | 210,800 | | | | 16,003,936 | |
Tractor Supply Co. | | | 20,000 | | | | 4,772,000 | |
Ulta Beauty, Inc.* | | | 9,570 | | | | 3,946,094 | |
| | | | | | | | |
| | |
| | | | | | | 171,160,538 | |
| | | | | | | | |
Technology Hardware, Storage & Peripherals — 7.0% | |
Apple, Inc. | | | 2,727,320 | | | | 484,290,213 | |
Hewlett Packard Enterprise Co.(a) | | | 228,166 | | | | 3,598,178 | |
HP, Inc. | | | 201,766 | | | | 7,600,525 | |
NetApp, Inc. | | | 39,100 | | | | 3,596,809 | |
Seagate Technology Holdings PLC(a) | | | 35,900 | | | | 4,055,982 | |
Western Digital Corp.* | | | 54,568 | | | | 3,558,379 | |
| | | | | | | | |
| | |
| | | | | | | 506,700,086 | |
| | | | | | | | |
Textiles, Apparel & Luxury Goods — 0.6% | | | | | |
NIKE, Inc. (Class B Stock) | | | 223,700 | | | | 37,284,079 | |
PVH Corp. | | | 12,400 | | | | 1,322,460 | |
Ralph Lauren Corp. | | | 8,500 | | | | 1,010,310 | |
Tapestry, Inc. | | | 49,000 | | | | 1,989,400 | |
Under Armour, Inc. (Class A Stock)* | | | 32,700 | | | | 692,913 | |
Under Armour, Inc. (Class C Stock)*(a) | | | 36,103 | | | | 651,298 | |
VF Corp. | | | 57,144 | | | | 4,184,084 | |
| | | | | | | | |
| | |
| | | | | | | 47,134,544 | |
| | | | | | | | |
Tobacco — 0.6% | | | | | | | | |
Altria Group, Inc. | | | 322,200 | | | | 15,269,058 | |
Philip Morris International, Inc. | | | 272,200 | | | | 25,859,000 | |
| | | | | | | | |
| | |
| | | | | | | 41,128,058 | |
| | | | | | | | |
Trading Companies & Distributors — 0.2% | | | | | |
Fastenal Co.(a) | | | 100,300 | | | | 6,425,218 | |
United Rentals, Inc.* | | | 12,740 | | | | 4,233,374 | |
W.W. Grainger, Inc. | | | 7,620 | | | | 3,948,989 | |
| | | | | | | | |
| | |
| | | | | | | 14,607,581 | |
| | | | | | | | |
SEE NOTES TO FINANCIAL STATEMENTS.
A136
| | | | | | |
| | |
| | PSF STOCK INDEX PORTFOLIO (CONTINUED) | | |
| | | | | | |
| |
| SCHEDULE OF INVESTMENTS | | as of December 31, 2021 |
| | | | | | | | |
| | | Shares | | | Value | |
|
| COMMON STOCKS (continued) | |
Water Utilities — 0.1% | | | | | | | | |
American Water Works Co.,Inc. | | | 31,700 | | | $ | 5,986,862 | |
| | | | | | | | |
Wireless Telecommunication Services — 0.2% | |
T-Mobile US, Inc.* | | | 102,600 | | | | 11,899,548 | |
| | | | | | | | |
TOTAL COMMON STOCKS
(cost $1,571,003,884) | | | | | | | 7,061,999,962 | |
| | | | | | | | |
EXCHANGE-TRADED FUNDS — 0.6% | |
iShares Core S&P 500 ETF | | | 77,600 | | | | 37,014,424 | |
SPDR S&P 500 ETF Trust | | | 17,000 | | | | 8,074,320 | |
| | | | | | | | |
TOTAL EXCHANGE-TRADED FUNDS
(cost $31,637,094) | | | | 45,088,744 | |
| | | | | | | | |
TOTAL LONG-TERM INVESTMENTS
(cost $1,602,640,978) | | | | 7,107,088,706 | |
| | | | | | | | |
|
| SHORT-TERM INVESTMENTS — 5.6% | |
|
| AFFILIATED MUTUAL FUNDS — 5.5% | |
PGIM Core Ultra Short Bond Fund(wa) | | | 144,567,480 | | | | 144,567,480 | |
PGIM Institutional Money Market Fund
(cost $254,977,818; includes
$254,962,200 of cash collateral for securities on loan)(b)(wa) | | | 255,293,920 | | | | 255,115,214 | |
| | | | | | | | |
TOTAL AFFILIATED MUTUAL FUNDS
(cost $399,545,298) | | | | 399,682,694 | |
| | | | | | | | |
| | | | | | | | | | | | |
Interest
Rate | | Maturity
Date | | | Principal Amount (000)# | | | | |
| | | | | | | | | | | | |
|
U.S. TREASURY OBLIGATION(k)(n) — 0.1% | |
U.S. Treasury Bills | | | | | |
| 0.040% | | | 03/17/22 | | | | 7,400 | | | | 7,399,171 | |
| | | | | | | | | | | | |
(cost $7,399,386) | | | | | | | | | |
TOTAL SHORT-TERM INVESTMENTS
(cost $406,944,684) | | | | 407,081,865 | |
| | | | | | | | | | | | |
TOTAL INVESTMENTS—103.5%
(cost $2,009,585,662) | | | | 7,514,170,571 | |
Liabilities in excess of other assets(z) — (3.5)% | | | | (253,005,928 | ) |
| | | | | | | | | | | | |
| |
NET ASSETS — 100.0% | | | $ | 7,261,164,643 | |
| | | | | | | | | | | | |
See the Glossary for a list of the abbreviation(s) used in the annual report.
| * | Non-income producing security. |
| # | Principal amount is shown in U.S. dollars unless otherwise stated. |
| (a) | All or a portion of security is on loan. The aggregate market value of such securities, including those sold and pending settlement, is $248,092,556; cash collateral of $254,962,200 (included in liabilities) was received with which the Portfolio purchased highly liquid short-term investments. In the event of significant appreciation in value of securities on loan on the last business day of the reporting period, the Portfolio may reflect a collateral value that is less than the market value of the loaned securities and such shortfall is remedied the following business day. |
| (b) | Represents security, or portion thereof, purchased with cash collateral received for securities on loan and includes dividend reinvestment. |
| (k) | Represents security, or a portion thereof, segregated as collateral for centrally cleared/exchange-traded derivatives. |
| (n) | Rate shown reflects yield to maturity at purchased date. |
| (wa) | PGIM Investments LLC, the manager of the Portfolio, also serves as manager of the PGIM Core Ultra Short Bond Fund and PGIM Institutional Money Market Fund, if applicable. |
| (z) | Includes net unrealized appreciation/(depreciation) and/or market value of the below holdings which are excluded from the Schedule of Investments: |
Futures contracts outstanding at December 31, 2021:
| | | | | | | | | | | | | | |
Number of Contracts | | Type | | Expiration
Date | | | Current
Notional
Amount | | | Value / Unrealized
Appreciation
(Depreciation) | |
| | | | | | | | | | | | | | |
Long Position: | | | | | | | | | | | | |
| 629 | | S&P 500 E-Mini Index | | | Mar. 2022 | | | | $149,654,825 | | | $ | 1,824,910 | |
| | | | | | | | | | | | | | |
Summary of Collateral for Centrally Cleared/Exchange-traded Derivatives:
Cash and securities segregated as collateral, including pending settlement for closed positions, to cover requirements for centrally cleared/exchange-traded derivatives are listed by broker as follows:
SEE NOTES TO FINANCIAL STATEMENTS.
A137
| | | | | | |
| | |
| | PSF STOCK INDEX PORTFOLIO (CONTINUED) | | |
| | | | | | |
| |
| SCHEDULE OF INVESTMENTS | | as of December 31, 2021 |
| | | | | | | | | | |
Broker | | Cash and/or Foreign Currency | | Securities Market Value |
UBS Securities LLC | | | $ | — | | | | $ | 7,399,171 | |
| | | | | | | | | | |
Fair Value Measurements:
Various inputs are used in determining the value of the Portfolio’s investments. These inputs are summarized in the three broad levels listed below.
Level 1—unadjusted quoted prices generally in active markets for identical securities.
Level 2—quoted prices for similar securities, interest rates and yield curves, prepayment speeds, foreign currency exchange rates and other observable inputs.
Level 3—unobservable inputs for securities valued in accordance with Board approved fair valuation procedures.
The following is a summary of the inputs used as of December 31, 2021 in valuing such portfolio securities:
| | | | | | | | | | | | |
| | | Level 1 | | | Level 2 | | | Level 3 | |
Investments in Securities | | | | | | | | | | | | |
Assets | | | | | | | | | | | | |
Long-Term Investments | | | | | | | | | | | | |
Common Stocks | | | | | | | | | | | | |
Aerospace & Defense | | $ | 95,760,571 | | | $ | — | | | $ | — | |
Air Freight & Logistics | | | 44,851,774 | | | | — | | | | — | |
Airlines | | | 14,430,725 | | | | — | | | | — | |
Auto Components | | | 9,693,542 | | | | — | | | | — | |
Automobiles | | | 179,527,617 | | | | — | | | | — | |
Banks | | | 280,574,538 | | | | — | | | | — | |
Beverages | | | 99,899,683 | | | | — | | | | — | |
Biotechnology | | | 125,959,459 | | | | — | | | | — | |
Building Products | | | 36,414,788 | | | | — | | | | — | |
Capital Markets | | | 210,625,266 | | | | — | | | | — | |
Chemicals | | | 125,577,371 | | | | — | | | | — | |
Commercial Services & Supplies | | | 30,300,125 | | | | — | | | | — | |
Communications Equipment | | | 65,082,015 | | | | — | | | | — | |
Construction & Engineering | | | 2,866,500 | | | | — | | | | — | |
Construction Materials | | | 9,661,576 | | | | — | | | | — | |
Consumer Finance | | | 39,156,856 | | | | — | | | | — | |
Containers & Packaging | | | 21,131,259 | | | | — | | | | — | |
Distributors | | | 10,283,212 | | | | — | | | | — | |
Diversified Financial Services | | | 96,340,790 | | | | — | | | | — | |
Diversified Telecommunication Services | | | 70,423,872 | | | | — | | | | — | |
Electric Utilities | | | 113,515,356 | | | | — | | | | — | |
Electrical Equipment | | | 38,694,946 | | | | — | | | | — | |
Electronic Equipment, Instruments & Components | | | 49,029,291 | | | | — | | | | — | |
Energy Equipment & Services | | | 14,543,910 | | | | — | | | | — | |
Entertainment | | | 118,012,292 | | | | — | | | | — | |
Equity Real Estate Investment Trusts (REITs) | | | 189,288,131 | | | | — | | | | — | |
Food & Staples Retailing | | | 98,960,648 | | | | — | | | | — | |
Food Products | | | 62,056,891 | | | | — | | | | — | |
Gas Utilities | | | 2,430,664 | | | | — | | | | — | |
Health Care Equipment & Supplies | | | 208,513,046 | | | | — | | | | — | |
Health Care Providers & Services | | | 196,063,379 | | | | — | | | | — | |
Health Care Technology | | | 4,764,231 | | | | — | | | | — | |
Hotels, Restaurants & Leisure | | | 138,436,760 | | | | — | | | | — | |
Household Durables | | | 26,910,530 | | | | — | | | | — | |
Household Products | | | 98,555,487 | | | | — | | | | — | |
Independent Power & Renewable Electricity Producers | | | 2,830,950 | | | | — | | | | — | |
Industrial Conglomerates | | | 70,407,061 | | | | — | | | | — | |
Insurance | | | 123,061,778 | | | | — | | | | — | |
Interactive Media & Services | | | 445,888,768 | | | | — | | | | — | |
Internet & Direct Marketing Retail | | | 266,805,247 | | | | — | | | | — | |
IT Services | | | 316,704,353 | | | | — | | | | — | |
Leisure Products | | | 2,335,851 | | | | — | | | | — | |
Life Sciences Tools & Services | | | 142,081,534 | | | | — | | | | — | |
SEE NOTES TO FINANCIAL STATEMENTS.
A138
| | | | | | |
| | |
| | PSF STOCK INDEX PORTFOLIO (CONTINUED) | | |
| | | | | | |
| |
| SCHEDULE OF INVESTMENTS | | as of December 31, 2021 |
| | | | | | | | | | | | |
| | | Level 1 | | | Level 2 | | | Level 3 | |
Investments in Securities (continued) | | | | | | | | | | | | |
Assets (continued) | | | | | | | | | | | | |
Long-Term Investments (continued) | | | | | | | | | | | | |
Common Stocks (continued) | | | | | | | | | | | | |
Machinery | | $ | 106,720,211 | | | $ | — | | | $ | — | |
Media | | | 70,990,344 | | | | — | | | | — | |
Metals & Mining | | | 25,108,406 | | | | — | | | | — | |
Multiline Retail | | | 35,063,585 | | | | — | | | | — | |
Multi-Utilities | | | 51,273,610 | | | | — | | | | — | |
Oil, Gas & Consumable Fuels | | | 174,034,647 | | | | — | | | | — | |
Personal Products | | | 15,030,120 | | | | — | | | | — | |
Pharmaceuticals | | | 261,562,591 | | | | — | | | | — | |
Professional Services | | | 30,741,387 | | | | — | | | | — | |
Real Estate Management & Development | | | 6,358,686 | | | | — | | | | — | |
Road & Rail | | | 65,117,733 | | | | — | | | | — | |
Semiconductors & Semiconductor Equipment | | | 449,968,350 | | | | — | | | | — | |
Software | | | 672,960,432 | | | | — | | | | — | |
Specialty Retail | | | 171,160,538 | | | | — | | | | — | |
Technology Hardware, Storage & Peripherals | | | 506,700,086 | | | | — | | | | — | |
Textiles, Apparel & Luxury Goods | | | 47,134,544 | | | | — | | | | — | |
Tobacco | | | 41,128,058 | | | | — | | | | — | |
Trading Companies & Distributors | | | 14,607,581 | | | | — | | | | — | |
Water Utilities | | | 5,986,862 | | | | — | | | | — | |
Wireless Telecommunication Services | | | 11,899,548 | | | | — | | | | — | |
Exchange-Traded Funds | | | 45,088,744 | | | | — | | | | — | |
Short-Term Investments | | | | | | | | | | | | |
Affiliated Mutual Funds | | | 399,682,694 | | | | — | | | | — | |
U.S. Treasury Obligation | | | — | | | | 7,399,171 | | | | — | |
| | | | | | | | | | | | |
Total | | $ | 7,506,771,400 | | | $ | 7,399,171 | | | $ | — | |
| | | | | | | | | | | | |
| | | |
Other Financial Instruments* Assets | | | | | | | | | | | | |
Futures Contracts | | $ | 1,824,910 | | | $ | — | | | $ | — | |
| | | | | | | | | | | | |
| * | Other financial instruments are derivative instruments not reflected in the Schedule of Investments, such as futures, forwards and centrally cleared swap contracts, which are recorded at the unrealized appreciation (depreciation) on the instrument, and OTC swap contracts which are recorded at fair value. |
Industry Classification:
The industry classification of investments and liabilities in excess of other assets shown as a percentage of net assets as of December 31, 2021 were as follows (unaudited):
| | | | |
Software | | | 9.3 | % |
Technology Hardware, Storage & Peripherals | | | 7.0 | |
Semiconductors & Semiconductor Equipment | | | 6.2 | |
Interactive Media & Services | | | 6.1 | |
Affiliated Mutual Funds (3.5% represents investments purchased with collateral from securities on loan) | | | 5.5 | |
IT Services | | | 4.4 | |
Banks | | | 3.9 | |
Internet & Direct Marketing Retail | | | 3.7 | |
Pharmaceuticals | | | 3.6 | |
Capital Markets | | | 2.9 | |
Health Care Equipment & Supplies | | | 2.9 | |
Health Care Providers & Services | | | 2.7 | |
Equity Real Estate Investment Trusts (REITs) | | | 2.6 | |
Automobiles | | | 2.5 | |
Oil, Gas & Consumable Fuels | | | 2.4 | |
Specialty Retail | | | 2.4 | |
Life Sciences Tools & Services | | | 2.0 | |
| | | | |
Hotels, Restaurants & Leisure | | | 1.9 | % |
Biotechnology | | | 1.7 | |
Chemicals | | | 1.7 | |
Insurance | | | 1.7 | |
Entertainment | | | 1.6 | |
Electric Utilities | | | 1.6 | |
Machinery | | | 1.5 | |
Beverages | | | 1.4 | |
Food & Staples Retailing | | | 1.4 | |
Household Products | | | 1.4 | |
Diversified Financial Services | | | 1.3 | |
Aerospace & Defense | | | 1.3 | |
Media | | | 1.0 | |
Diversified Telecommunication Services | | | 1.0 | |
Industrial Conglomerates | | | 1.0 | |
Road & Rail | | | 0.9 | |
Communications Equipment | | | 0.9 | |
Food Products | | | 0.8 | |
SEE NOTES TO FINANCIAL STATEMENTS.
A139
| | | | | | |
| | |
| | PSF STOCK INDEX PORTFOLIO (CONTINUED) | | |
| | | | | | |
| |
| SCHEDULE OF INVESTMENTS | | as of December 31, 2021 |
Industry Classification (continued):
| | | | |
Multi-Utilities | | | 0.7 | % |
Electronic Equipment, Instruments & Components | | | 0.7 | |
Textiles, Apparel & Luxury Goods | | | 0.6 | |
Exchange-Traded Funds | | | 0.6 | |
Air Freight & Logistics | | | 0.6 | |
Tobacco | | | 0.6 | |
Consumer Finance | | | 0.5 | |
Electrical Equipment | | | 0.5 | |
Building Products | | | 0.5 | |
Multiline Retail | | | 0.5 | |
Professional Services | | | 0.4 | |
Commercial Services & Supplies | | | 0.4 | |
Household Durables | | | 0.4 | |
Metals & Mining | | | 0.3 | |
Containers & Packaging | | | 0.3 | |
Personal Products | | | 0.2 | |
Trading Companies & Distributors | | | 0.2 | |
Energy Equipment & Services | | | 0.2 | |
Airlines | | | 0.2 | |
| | | | |
Wireless Telecommunication Services | | | 0.2 | % |
Distributors | | | 0.1 | |
Auto Components | | | 0.1 | |
Construction Materials | | | 0.1 | |
U.S. Treasury Obligation | | | 0.1 | |
Real Estate Management & Development | | | 0.1 | |
Water Utilities | | | 0.1 | |
Health Care Technology | | | 0.1 | |
Construction & Engineering | | | 0.0 | * |
Independent Power & Renewable Electricity Producers | | | 0.0 | * |
Gas Utilities | | | 0.0 | * |
Leisure Products | | | 0.0 | * |
| | | | |
| | | 103.5 | |
Liabilities in excess of other assets | | | (3.5 | ) |
| | | | |
| |
| | | 100.0 | % |
| | | | |
* Less than +/- 0.05% | | | | |
Effects of Derivative Instruments on the Financial Statements and Primary Underlying Risk Exposure:
The Portfolio invested in derivative instruments during the reporting period. The primary type of risk associated with these derivative instruments is equity contracts risk. See the Notes to Financial Statements for additional detail regarding these derivative instruments and their risks. The effect of such derivative instruments on the Portfolio’s financial position and financial performance as reflected in the Statement of Assets and Liabilities and Statement of Operations is presented in the summary below.
Fair values of derivative instruments as of December 31, 2021 as presented in the Statement of Assets and Liabilities:
| | | | | | | | |
| | | Asset Derivatives | | Liability Derivatives |
Derivatives not accounted for as hedging instruments, carried at fair value | | Statement of Assets and
Liabilities Location | | Fair
Value | | Statement of
Assets and
Liabilities Location | | Fair
Value |
Equity contracts | | Due from/to broker-variation margin futures | | $1,824,910* | | — | | $— |
| | | | | | | | |
| * | Includes cumulative appreciation (depreciation) as reported in the schedule of open futures and centrally cleared swap contracts. Only unsettled variation margin receivable (payable) is reported within the Statement of Assets and Liabilities. |
The effects of derivative instruments on the Statement of Operations for the year ended December 31, 2021 are as follows:
| | |
Amount of Realized Gain (Loss) on Derivatives Recognized in Income |
Derivatives not accounted for as hedging instruments, carried at fair value | | Futures |
Equity contracts | | $33,523,532 |
| | |
| | |
Change in Unrealized Appreciation (Depreciation) on Derivatives Recognized in Income |
Derivatives not accounted for as hedging instruments, carried at fair value | | Futures |
Equity contracts | | $(519,167) |
| | |
SEE NOTES TO FINANCIAL STATEMENTS.
A140
| | | | | | |
| | |
| | PSF STOCK INDEX PORTFOLIO (CONTINUED) | | |
| | | | | | |
| |
| SCHEDULE OF INVESTMENTS | | as of December 31, 2021 |
For the year ended December 31, 2021, the Portfolio’s average volume of derivative activities is as follows:
|
Futures Contracts— Long Positions(1) |
$129,616,616 |
| (1) | Notional Amount in USD. |
Average volume is based on average quarter end balances as noted for the year ended December 31, 2021.
Financial Instruments/Transactions—Summary of Offsetting and Netting Arrangements:
The Portfolio entered into financial instruments/transactions during the reporting period that are either offset in accordance with current requirements or are subject to enforceable master netting arrangements or similar agreements that permit offsetting. The information about offsetting and related netting arrangements for financial instruments/transactions where the legal right to set-off exists is presented in the summary below.
Offsetting of financial instrument/transaction assets and liabilities:
| | | | | | | | | | | | | | | |
Description | | Gross Market
Value of
Recognized
Assets/(Liabilities) | | Collateral
Pledged/(Received)(1) | | Net
Amount |
Securities on Loan | | | $ | 248,092,556 | | | | $ | (248,092,556 | ) | | | $ | — | |
| | | | | | | | | | | | | | | |
| (1) | Collateral amount disclosed by the Portfolio is limited to the market value of financial instruments/transactions. |
SEE NOTES TO FINANCIAL STATEMENTS.
A141
| | | | | | |
| | |
| | PSF STOCK INDEX PORTFOLIO (CONTINUED) | | |
| | | | |
|
STATEMENT OF ASSETS AND LIABILITIES as of December 31, 2021 | |
| |
| ASSETS | | | | |
Investments at value, including securities on loan of $248,092,556: | | | | |
Unaffiliated investments (cost $1,610,040,364) | | $ | 7,114,487,877 | |
Affiliated investments (cost $399,545,298) | | | 399,682,694 | |
Cash | | | 36,332 | |
Dividends receivable | | | 4,272,874 | |
Receivable for Portfolio shares sold | | | 905,109 | |
Receivable for investments sold | | | 230,854 | |
Tax reclaim receivable | | | 79,841 | |
Prepaid expenses | | | 670,003 | |
| | | | |
Total Assets | | | 7,520,365,584 | |
| | | | |
| LIABILITIES | | | | |
Payable to broker for collateral for securities on loan | | | 254,962,200 | |
Management fee payable | | | 1,678,040 | |
Payable for investments purchased | | | 1,094,705 | |
Payable for Portfolio shares purchased | | | 884,336 | |
Due to broker-variation margin futures | | | 432,438 | |
Accrued expenses and other liabilities | | | 141,878 | |
Distribution fee payable | | | 3,214 | |
Trustees’ fees payable | | | 3,150 | |
Affiliated transfer agent fee payable | | | 980 | |
| | | | |
Total Liabilities | | | 259,200,941 | |
| | | | |
| NET ASSETS | | $ | 7,261,164,643 | |
| | | | |
Net assets were comprised of: | | | | |
Partners’ Equity | | $ | 7,261,164,643 | |
| | | | |
| Class I: | | | | |
Net asset value and redemption price per share, $7,244,396,171 / 64,423,330 outstanding shares of beneficial interest | | $ | 112.45 | |
| | | | |
| Class III: | | | | |
Net asset value and redemption price per share, $16,768,472 / 149,371 outstanding shares of beneficial interest | | $ | 112.26 | |
| | | | |
| | | | |
|
STATEMENT OF OPERATIONS Year Ended December 31, 2021 | |
| |
| NET INVESTMENT INCOME (LOSS) | | | | |
| INCOME | | | | |
Unaffiliated dividend income (net of $105,441 foreign withholding tax) | | $ | 86,556,304 | |
Affiliated dividend income | | | 167,751 | |
Income from securities lending, net (including affiliated income of $143,230) | | | 156,149 | |
Interest income | | | 3,377 | |
| | | | |
Total income | | | 86,883,581 | |
| | | | |
| EXPENSES | | | | |
Management fee | | | 18,080,511 | |
Distribution fee—Class III | | | 12,797 | |
Custodian and accounting fees | | | 327,337 | |
Shareholders’ reports | | | 153,965 | |
Trustees’ fees | | | 91,570 | |
Legal fees and expenses | | | 45,784 | |
Audit fee | | | 32,000 | |
Transfer agent’s fees and expenses (including affiliated expense of $5,882) | | | 10,682 | |
Miscellaneous | | | 130,871 | |
| | | | |
Total expenses | | | 18,885,517 | |
| | | | |
| NET INVESTMENT INCOME (LOSS) | | | 67,998,064 | |
| | | | |
| REALIZED AND UNREALIZED GAIN (LOSS) ON INVESTMENT TRANSACTIONS | | | | |
Net realized gain (loss) on: | | | | |
Investment transactions (including affiliated of $(47,221)) | | | 46,636,257 | |
Futures transactions | | | 33,523,532 | |
| | | | |
| | | 80,159,789 | |
| | | | |
Net change in unrealized appreciation (depreciation) on: | | | | |
Investments (including affiliated of $(11,492)) | | | 1,444,496,751 | |
Futures | | | (519,167 | ) |
| | | | |
| | | 1,443,977,584 | |
| | | | |
| NET GAIN (LOSS) ON INVESTMENT TRANSACTIONS | | | 1,524,137,373 | |
| | | | |
NET INCREASE (DECREASE) IN NET ASSETS RESULTING FROM OPERATIONS | | $ | 1,592,135,437 | |
| | | | |
STATEMENTS OF CHANGES IN NET ASSETS
| | | | | | | | | | |
| | | Year Ended
December 31, 2021 | | Year Ended
December 31, 2020 |
| INCREASE (DECREASE) IN NET ASSETS | | | | | | | | | | |
| OPERATIONS | | | | | | | | | | |
Net investment income (loss) | | | $ | 67,998,064 | | | | $ | 72,019,778 | |
Net realized gain (loss) on investment transactions | | | | 80,159,789 | | | | | 59,543,856 | |
Net change in unrealized appreciation (depreciation) on investments | | | | 1,443,977,584 | | | | | 725,481,123 | |
| | | | | | | | | | |
NET INCREASE (DECREASE) IN NET ASSETS RESULTING FROM OPERATIONS | | | | 1,592,135,437 | | | | | 857,044,757 | |
| | | | | | | | | | |
| PORTFOLIO SHARE TRANSACTIONS | | | | | | | | | | |
Portfolio shares sold | | | | 325,130,065 | | | | | 296,701,054 | |
Portfolio shares purchased | | | | (276,298,925 | ) | | | | (290,448,745 | ) |
| | | | | | | | | | |
NET INCREASE (DECREASE) IN NET ASSETS FROM PORTFOLIO SHARE TRANSACTIONS | | | | 48,831,140 | | | | | 6,252,309 | |
| | | | | | | | | | |
| TOTAL INCREASE (DECREASE) | | | | 1,640,966,577 | | | | | 863,297,066 | |
| NET ASSETS: | | | | | | | | | | |
Beginning of year | | | | 5,620,198,066 | | | | | 4,756,901,000 | |
| | | | | | | | | | |
End of year | | | $ | 7,261,164,643 | | | | $ | 5,620,198,066 | |
| | | | | | | | | | |
SEE NOTES TO FINANCIAL STATEMENTS.
A142
Financial Highlights
PSF Global Portfolio—Class I
| | | | | | | | | | | | | | | | | | | | |
| | | Year Ended December 31, | |
| | | 2021 | | | 2020 | | | 2019 | | | 2018 | | | 2017 | |
Per Share Operating Performance(a): | | | | | | | | | | | | | | | | | | | | |
Net Asset Value, beginning of year | | $ | 48.06 | | | $ | 41.49 | | | $ | 31.83 | | | $ | 34.33 | | | $ | 27.50 | |
| | | | | | | | | | | | | | | | | | | | |
Income (Loss) From Investment Operations: | | | | | | | | | | | | | | | | | | | | |
Net investment income (loss) | | | 0.46 | | | | 0.41 | | | | 0.52 | | | | 0.47 | | | | 0.42 | |
| Net realized and unrealized gain (loss) on investment and foreign currency transactions | | | 8.30 | | | | 6.16 | | | | 9.14 | | | | (2.99 | ) | | | 6.41 | |
| | | | | | | | | | | | | | | | | | | | |
Total from investment operations | | | 8.76 | | | | 6.57 | | | | 9.66 | | | | (2.52 | ) | | | 6.83 | |
| | | | | | | | | | | | | | | | | | | | |
Capital Contributions | | | — | | | | — | | | | — | (b)(c) | | | 0.02 | (b) | | | — | |
| | | | | | | | | | | | | | | | | | | | |
Net Asset Value, end of year | | $ | 56.82 | | | $ | 48.06 | | | $ | 41.49 | | | $ | 31.83 | | | $ | 34.33 | |
| | | | | | | | | | | | | | | | | | | | |
Total Return(d) | | | 18.23 | % | | | 15.84 | % | | | 30.39 | %(e) | | | (7.28 | )%(f) | | | 24.84 | % |
Ratios/Supplemental Data: | | | | | | | | | | | | | | | | | | | | |
Net assets, end of year (in millions) | | $ | 1,518.5 | | | $ | 1,377.0 | | | $ | 1,263.7 | | | $ | 1,006.6 | | | $ | 1,132.9 | |
Average net assets (in millions) | | $ | 1,472.2 | | | $ | 1,190.6 | | | $ | 1,157.5 | | | $ | 1,139.9 | | | $ | 1,051.8 | |
Ratios to average net assets(g): | | | | | | | | | | | | | | | | | | | | |
Expenses after waivers and/or expense reimbursement | | | 0.74 | % | | | 0.76 | % | | | 0.77 | % | | | 0.77 | % | | | 0.79 | % |
Expenses before waivers and/or expense reimbursement | | | 0.78 | % | | | 0.80 | % | | | 0.80 | % | | | 0.80 | % | | | 0.81 | % |
Net investment income (loss) | | | 0.86 | % | | | 1.01 | % | | | 1.41 | % | | | 1.33 | % | | | 1.34 | % |
Portfolio turnover rate(h) | | | 21 | % | | | 34 | % | | | 26 | % | | | 28 | % | | | 33 | % |
PSF Global Portfolio—Class III
| | | | | |
| | | April 26, 2021(i)
through December 31,
2021 |
Per Share Operating Performance(a): | | | | | |
Net Asset Value, beginning of period | | | $ | 53.13 | |
| | | | | |
Income (Loss) From Investment Operations: | | | | | |
Net investment income (loss) | | | | 0.15 | |
Net realized and unrealized gain (loss) on investment and foreign currency transactions | | | | 3.44 | |
| | | | | |
Total from investment operations | | | | 3.59 | |
| | | | | |
Net Asset Value, end of period | | | $ | 56.72 | |
| | | | | |
Total Return(d) | | | | 6.76 | % |
Ratios/Supplemental Data: | | | | | |
Net assets, end of period (in millions) | | | $ | 0.2 | |
Average net assets (in millions) | | | $ | 0.1 | |
Ratios to average net assets(g): | | | | | |
Expenses after waivers and/or expense reimbursement | | | | 0.99 | %(j) |
Expenses before waivers and/or expense reimbursement | | | | 1.03 | %(j) |
Net investment income (loss) | | | | 0.40 | %(j) |
Portfolio turnover rate(h) | | | | 21 | % |
| (a) | Calculated based on average shares outstanding during the period. |
| (b) | Represents payment received by the Portfolio, from Prudential, in connection with excess foreign withholding tax withheld on dividends and interest from certain countries due to the Portfolio’s tax status as a partnership. |
| (c) | Amount rounds to zero. |
| (d) | Total return is calculated assuming a purchase of a share on the first day and a sale on the last day of each period reported and includes reinvestment of dividends and distributions, if any, and does not reflect the effect of insurance contract charges. Total return does not reflect expenses associated with the separate account such as administrative fees, account charges and surrender charges which, if reflected, would reduce the total returns for all periods shown. Performance figures may reflect fee waivers and/or expense reimbursements. In the absence of fee waivers and/or expense reimbursements, the total return would be lower. Past performance is no guarantee of future results. Total returns may reflect adjustments to conform to GAAP. Total returns for periods less than one full year are not annualized. |
| (e) | Total return for the year includes the impact of the capital contribution, which was not material to the total return. |
| (f) | Total return for the year includes the impact of the capital contribution. Excluding the capital contribution, the total return would have been (7.34)%. |
| (g) | Does not include expenses of the underlying funds in which the Portfolio invests. |
| (h) | The Portfolio’s portfolio turnover rate is calculated in accordance with regulatory requirements, without regard to transactions involving short-term investments, certain derivatives and in-kind transactions (if any). If such transactions were included, the Portfolio’s portfolio turnover rate may be higher. |
| (i) | Commencement of offering. |
| (j) | Annualized, with the exception of certain non-recurring expenses. |
SEE NOTES TO FINANCIAL STATEMENTS.
B1
Financial Highlights
PSF PGIM 50/50 Balanced Portfolio—Class I
| | | | | | | | | | | | | | | | | | | | |
| | | Year Ended December 31, | |
| | | 2021 | | | 2020 | | | 2019 | | | 2018 | | | 2017 | |
Per Share Operating Performance(a): | | | | | | | | | | | | | | | | | | | | |
Net Asset Value, beginning of year | | $ | 34.99 | | | $ | 31.40 | | | $ | 26.50 | | | $ | 27.17 | | | $ | 24.18 | |
| | | | | | | | | | | | | | | | | | | | |
Income (Loss) From Investment Operations: | | | | | | | | | | | | | | | | | | | | |
Net investment income (loss) | | | 0.40 | | | | 0.50 | | | | 0.59 | | | | 0.53 | | | | 0.45 | |
| Net realized and unrealized gain (loss) on investment and foreign currency transactions | | | 4.28 | | | | 3.09 | | | | 4.31 | | | | (1.20 | ) | | | 2.54 | |
| | | | | | | | | | | | | | | | | | | | |
Total from investment operations | | | 4.68 | | | | 3.59 | | | | 4.90 | | | | (0.67 | ) | | | 2.99 | |
| | | | | | | | | | | | | | | | | | | | |
Capital Contributions | | | — | | | | — | | | | — | (b)(c) | | | — | (b)(c) | | | — | |
| | | | | | | | | | | | | | | | | | | | |
Net Asset Value, end of year | | $ | 39.67 | | | $ | 34.99 | | | $ | 31.40 | | | $ | 26.50 | | | $ | 27.17 | |
| | | | | | | | | | | | | | | | | | | | |
Total Return(d) | | | 13.38 | % | | | 11.43 | % | | | 18.49 | %(e) | | | (2.47 | )%(e) | | | 12.37 | % |
Ratios/Supplemental Data: | | | | | | | | | | | | | | | | | | | | |
Net assets, end of year (in millions) | | $ | 2,896 | | | $ | 2,710 | | | $ | 2,597 | | | $ | 2,370 | | | $ | 2,595 | |
Average net assets (in millions) | | $ | 2,800 | | | $ | 2,540 | | | $ | 2,506 | | | $ | 2,535 | | | $ | 2,535 | |
Ratios to average net assets(f): | | | | | | | | | | | | | | | | | | | | |
Expenses after waivers and/or expense reimbursement | | | 0.57 | % | | | 0.58 | % | | | 0.59 | % | | | 0.59 | % | | | 0.58 | % |
Expenses before waivers and/or expense reimbursement | | | 0.57 | % | | | 0.58 | % | | | 0.59 | % | | | 0.59 | % | | | 0.58 | % |
Net investment income (loss) | | | 1.06 | % | | | 1.58 | % | | | 2.02 | % | | | 1.94 | % | | | 1.75 | % |
Portfolio turnover rate(g)(h) | | | 69 | % | | | 75 | % | | | 90 | % | | | 101 | % | | | 136 | % |
PSF PGIM 50/50 Balanced Portfolio—Class III
| | | | | |
| | | April 26, 2021(i) through December 31, 2021 |
Per Share Operating Performance(a): | | | | | |
Net Asset Value, beginning of period | | | $ | 36.75 | |
| | | | | |
Income (Loss) From Investment Operations: | | | | | |
Net investment income (loss) | | | | 0.21 | |
Net realized and unrealized gain (loss) on investment and foreign currency transactions | | | | 2.64 | |
| | | | | |
Total from investment operations | | | | 2.85 | |
| | | | | |
Net Asset Value, end of period | | | $ | 39.60 | |
| | | | | |
Total Return(d) | | | | 7.76 | % |
Ratios/Supplemental Data: | | | | | |
Net assets, end of period (in millions) | | | $ | 3 | |
Average net assets (in millions) | | | $ | 1 | |
Ratios to average net assets(f): | | | | | |
Expenses after waivers and/or expense reimbursement | | | | 0.81 | %(j) |
Expenses before waivers and/or expense reimbursement | | | | 0.81 | %(j) |
Net investment income (loss) | | | | 0.76 | %(j) |
Portfolio turnover rate(g)(h) | | | | 69 | % |
| (a) | Calculated based on average shares outstanding during the period. |
| (b) | Represents payment received by the Portfolio, from Prudential, in connection with excess foreign withholding tax withheld on dividends and interest from certain countries due to the Portfolio’s tax status as a partnership. |
| (c) | Amount rounds to zero. |
| (d) | Total return is calculated assuming a purchase of a share on the first day and a sale on the last day of each period reported and includes reinvestment of dividends and distributions, if any, and does not reflect the effect of insurance contract charges. Total return does not reflect expenses associated with the separate account such as administrative fees, account charges and surrender charges which, if reflected, would reduce the total returns for all periods shown. Performance figures may reflect fee waivers and/or expense reimbursements. In the absence of fee waivers and/or expense reimbursements, the total return would be lower. Past performance is no guarantee of future results. Total returns may reflect adjustments to conform to GAAP. Total returns for periods less than one full year are not annualized. |
| (e) | Total return for the year includes the impact of the capital contribution, which was not material to the total return. |
| (f) | Does not include expenses of the underlying funds in which the Portfolio invests. |
| (g) | The Portfolio accounts for mortgage dollar roll transactions, when applicable, as purchases and sales which, as a result, can increase its portfolio turnover rate. |
| (h) | The Portfolio’s portfolio turnover rate is calculated in accordance with regulatory requirements, without regard to transactions involving short-term investments, certain derivatives and in-kind transactions (if any). If such transactions were included, the Portfolio’s portfolio turnover rate may be higher. |
| (i) | Commencement of offering. |
| (j) | Annualized, with the exception of certain non-recurring expenses. |
SEE NOTES TO FINANCIAL STATEMENTS.
B2
Financial Highlights
PSF PGIM Flexible Managed Portfolio—Class I
| | | | | | | | | | | | | | | | | | | | |
| | | Year Ended December 31, | |
| | | 2021 | | | 2020 | | | 2019 | | | 2018 | | | 2017 | |
Per Share Operating Performance(a): | | | | | | | | | | | | | | | | | | | | |
Net Asset Value, beginning of year | | $ | 37.61 | | | $ | 34.32 | | | $ | 28.63 | | | $ | 29.88 | | | $ | 25.99 | |
| | | | | | | | | | | | | | | | | | | | |
Income (Loss) From Investment Operations: | | | | | | | | | | | | | | | | | | | | |
Net investment income (loss) | | | 0.49 | | | | 0.56 | | | | 0.61 | | | | 0.53 | | | | 0.45 | |
| Net realized and unrealized gain (loss) on investment and foreign currency transactions | | | 6.04 | | | | 2.73 | | | | 5.08 | | | | (1.78 | ) | | | 3.44 | |
| | | | | | | | | | | | | | | | | | | | |
Total from investment operations | | | 6.53 | | | | 3.29 | | | | 5.69 | | | | (1.25 | ) | | | 3.89 | |
| | | | | | | | | | | | | | | | | | | | |
Capital Contributions | | | — | | | | — | | | | — | (b)(c) | | | — | (b)(c) | | | — | |
| | | | | | | | | | | | | | | | | | | | |
Net Asset Value, end of year | | $ | 44.14 | | | $ | 37.61 | | | $ | 34.32 | | | $ | 28.63 | | | $ | 29.88 | |
| | | | | | | | | | | | | | | | | | | | |
Total Return(d) | | | 17.36 | % | | | 9.59 | % | | | 19.87 | %(e) | | | (4.18 | )%(e) | | | 14.97 | % |
Ratios/Supplemental Data: | | | | | | | | | | | | | | | | | | | | |
Net assets, end of year (in millions) | | $ | 4,968 | | | $ | 4,479 | | | $ | 4,328 | | | $ | 3,834 | | | $ | 4,230 | |
Average net assets (in millions) | | $ | 4,766 | | | $ | 4,171 | | | $ | 4,127 | | | $ | 4,157 | | | $ | 4,043 | |
Ratios to average net assets(f): | | | | | | | | | | | | | | | | | | | | |
Expenses after waivers and/or expense reimbursement | | | 0.61 | % | | | 0.62 | % | | | 0.63 | % | | | 0.63 | % | | | 0.62 | % |
Expenses before waivers and/or expense reimbursement | | | 0.61 | % | | | 0.62 | % | | | 0.63 | % | | | 0.63 | % | | | 0.62 | % |
Net investment income (loss) | | | 1.18 | % | | | 1.64 | % | | | 1.92 | % | | | 1.75 | % | | | 1.62 | % |
Portfolio turnover rate(g)(h) | | | 119 | % | | | 120 | % | | | 125 | % | | | 139 | % | | | 175 | % |
PSF PGIM Flexible Managed Portfolio—Class III
| | | | | |
| | | April 26, 2021(i) through December 31, 2021 |
Per Share Operating Performance(a): | | | | | |
Net Asset Value, beginning of period | | | $ | 40.73 | |
| | | | | |
Income (Loss) From Investment Operations: | | | | | |
Net investment income (loss) | | | | 0.26 | |
Net realized and unrealized gain (loss) on investment and foreign currency transactions | | | | 3.07 | |
| | | | | |
Total from investment operations | | | | 3.33 | |
| | | | | |
Net Asset Value, end of period | | | $ | 44.06 | |
| | | | | |
Total Return(d) | | | | 8.18 | % |
Ratios/Supplemental Data: | | | | | |
Net assets, end of period (in millions) | | | $ | 2 | |
Average net assets (in millions) | | | $ | 1 | |
Ratios to average net assets(f): | | | | | |
Expenses after waivers and/or expense reimbursement | | | | 0.86 | %(j) |
Expenses before waivers and/or expense reimbursement | | | | 0.86 | %(j) |
Net investment income (loss) | | | | 0.86 | %(j) |
Portfolio turnover rate(g)(h) | | | | 119 | % |
| (a) | Calculated based on average shares outstanding during the period. |
| (b) | Represents payment received by the Portfolio, from Prudential, in connection with excess foreign withholding tax withheld on dividends and interest from certain countries due to the Portfolio’s tax status as a partnership. |
| (c) | Amount rounds to zero. |
| (d) | Total return is calculated assuming a purchase of a share on the first day and a sale on the last day of each period reported and includes reinvestment of dividends and distributions, if any, and does not reflect the effect of insurance contract charges. Total return does not reflect expenses associated with the separate account such as administrative fees, account charges and surrender charges which, if reflected, would reduce the total returns for all periods shown. Performance figures may reflect fee waivers and/or expense reimbursements. In the absence of fee waivers and/or expense reimbursements, the total return would be lower. Past performance is no guarantee of future results. Total returns may reflect adjustments to conform to GAAP. Total returns for periods less than one full year are not annualized. |
| (e) | Total return for the year includes the impact of the capital contribution, which was not material to the total return. |
| (f) | Does not include expenses of the underlying funds in which the Portfolio invests. |
| (g) | The Portfolio accounts for mortgage dollar roll transactions, when applicable, as purchases and sales which, as a result, can increase its portfolio turnover rate. |
| (h) | The Portfolio’s portfolio turnover rate is calculated in accordance with regulatory requirements, without regard to transactions involving short-term investments, certain derivatives and in-kind transactions (if any). If such transactions were included, the Portfolio’s portfolio turnover rate may be higher. |
| (i) | Commencement of offering. |
| (j) | Annualized, with the exception of certain non-recurring expenses. |
SEE NOTES TO FINANCIAL STATEMENTS.
B3
Financial Highlights
PSF PGIM Government Income Portfolio—Class I
| | | | | | | | | | | | | | | | | | | | |
| | | Year Ended December 31, | |
| | | 2021 | | | 2020 | | | 2019 | | | 2018 | | | 2017 | |
Per Share Operating Performance(a): | | | | | | | | | | | | | | | | | | | | |
Net Asset Value, beginning of year | | $ | 14.51 | | | $ | 13.54 | | | $ | 12.70 | | | $ | 12.62 | | | $ | 12.26 | |
| | | | | | | | | | | | | | | | | | | | |
Income (Loss) From Investment Operations: | | | | | | | | | | | | | | | | | | | | |
Net investment income (loss) | | | 0.19 | | | | 0.23 | | | | 0.31 | | | | 0.28 | | | | 0.23 | |
| Net realized and unrealized gain (loss) on investment transactions | | | (0.65 | ) | | | 0.74 | | | | 0.53 | | | | (0.20 | ) | | | 0.13 | |
| | | | | | | | | | | | | | | | | | | | |
Total from investment operations | | | (0.46 | ) | | | 0.97 | | | | 0.84 | | | | 0.08 | | | | 0.36 | |
| | | | | | | | | | | | | | | | | | | | |
Capital Contributions | | | — | | | | — | | | | — | | | | — | (b)(c) | | | — | |
| | | | | | | | | | | | | | | | | | | | |
Net Asset Value, end of year | | $ | 14.05 | | | $ | 14.51 | | | $ | 13.54 | | | $ | 12.70 | | | $ | 12.62 | |
| | | | | | | | | | | | | | | | | | | | |
Total Return(d) | | | (3.17 | )% | | | 7.16 | % | | | 6.61 | % | | | 0.63 | %(e) | | | 2.94 | % |
Ratios/Supplemental Data: | | | | | | | | | | | | | | | | | | | | |
Net assets, end of year (in millions) | | $ | 223.1 | | | $ | 246.2 | | | $ | 238.6 | | | $ | 221.1 | | | $ | 244.1 | |
Average net assets (in millions) | | $ | 231.5 | | | $ | 246.6 | | | $ | 234.6 | | | $ | 230.5 | | | $ | 252.4 | |
Ratios to average net assets(f): | | | | | | | | | | | | | | | | | | | | |
Expenses after waivers and/or expense reimbursement | | | 0.48 | % | | | 0.51 | % | | | 0.52 | % | | | 0.51 | % | | | 0.53 | % |
Expenses before waivers and/or expense reimbursement | | | 0.48 | % | | | 0.51 | % | | | 0.52 | % | | | 0.51 | % | | | 0.53 | % |
Net investment income (loss) | | | 1.35 | % | | | 1.58 | % | | | 2.34 | % | | | 2.28 | % | | | 1.84 | % |
Portfolio turnover rate(g)(h) | | | 222 | % | | | 150 | % | | | 269 | % | | | 284 | % | | | 495 | % |
PSF PGIM Government Income Portfolio—Class III
| | | | | |
| | | April 26, 2021(i)
through December 31,
2021 |
Per Share Operating Performance(a): | | | | | |
Net Asset Value, beginning of period | | | $ | 14.17 | |
| | | | | |
Income (Loss) From Investment Operations: | | | | | |
Net investment income (loss) | | | | 0.11 | |
Net realized and unrealized gain (loss) on investment transactions | | | | (0.25 | ) |
| | | | | |
Total from investment operations | | | | (0.14 | ) |
| | | | | |
Net Asset Value, end of period | | | $ | 14.03 | |
| | | | | |
Total Return(d) | | | | (0.99 | )% |
Ratios/Supplemental Data: | | | | | |
Net assets, end of period (in millions) | | | $ | 0.3 | |
Average net assets (in millions) | | | $ | 0.2 | |
Ratios to average net assets(f): | | | | | |
Expenses after waivers and/or expense reimbursement | | | | 0.68 | %(j) |
Expenses before waivers and/or expense reimbursement | | | | 0.68 | %(j) |
Net investment income (loss) | | | | 1.09 | %(j) |
Portfolio turnover rate(g)(h) | | | | 222 | % |
| (a) | Calculated based on average shares outstanding during the period. |
| (b) | Represents payment received by the Portfolio, from Prudential, in connection with excess foreign withholding tax withheld on dividends and interest from certain countries due to the Portfolio’s tax status as a partnership. |
| (c) | Amount rounds to zero. |
| (d) | Total return is calculated assuming a purchase of a share on the first day and a sale on the last day of each period reported and includes reinvestment of dividends and distributions, if any, and does not reflect the effect of insurance contract charges. Total return does not reflect expenses associated with the separate account such as administrative fees, account charges and surrender charges which, if reflected, would reduce the total returns for all periods shown. Performance figures may reflect fee waivers and/or expense reimbursements. In the absence of fee waivers and/or expense reimbursements, the total return would be lower. Past performance is no guarantee of future results. Total returns may reflect adjustments to conform to GAAP. Total returns for periods less than one full year are not annualized. |
| (e) | Total return for the year includes the impact of the capital contribution, which was not material to the total return. |
| (f) | Does not include expenses of the underlying funds in which the Portfolio invests. |
| (g) | The Portfolio accounts for mortgage dollar roll transactions, when applicable, as purchases and sales which, as a result, can increase its portfolio turnover rate. |
| (h) | The Portfolio’s portfolio turnover rate is calculated in accordance with regulatory requirements, without regard to transactions involving short-term investments, certain derivatives and in-kind transactions (if any). If such transactions were included, the Portfolio’s portfolio turnover rate may be higher. |
| (i) | Commencement of offering. |
| (j) | Annualized, with the exception of certain non-recurring expenses. |
SEE NOTES TO FINANCIAL STATEMENTS.
B4
Financial Highlights
PSF PGIM Government Money Market Portfolio—Class I
| | | | | | | | | | | | | | | | | | | | |
| | | Year Ended December 31, | |
| | | 2021 | | | 2020 | | | 2019 | | | 2018 | | | 2017 | |
Per Share Operating Performance(a): | | | | | | | | | | | | | | | | | | | | |
Net Asset Value, beginning of year | | $ | 10.00 | | | $ | 10.00 | | | $ | 10.00 | | | $ | 10.00 | | | $ | 10.00 | |
| | | | | | | | | | | | | | | | | | | | |
Income (Loss) From Investment Operations: | | | | | | | | | | | | | | | | | | | | |
Net investment income (loss) and realized gains (losses) | | | — | (b) | | | 0.03 | | | | 0.19 | | | | 0.15 | | | | 0.06 | |
Less Dividends and Distributions | | | — | (b) | | | (0.03 | ) | | | (0.19 | ) | | | (0.15 | ) | | | (0.06 | ) |
| | | | | | | | | | | | | | | | | | | | |
Net Asset Value, end of year | | $ | 10.00 | | | $ | 10.00 | | | $ | 10.00 | | | $ | 10.00 | | | $ | 10.00 | |
| | | | | | | | | | | | | | | | | | | | |
Total Return(c) | | | 0.04 | % | | | 0.30 | % | | | 1.92 | % | | | 1.53 | % | | | 0.56 | % |
Ratios/Supplemental Data: | | | | | | | | | | | | | | | | | | | | |
Net assets, end of year (in millions) | | $ | 725 | | | $ | 792 | | | $ | 600 | | | $ | 536 | | | $ | 560 | |
Average net assets (in millions) | | $ | 748 | | | $ | 667 | | | $ | 563 | | | $ | 560 | | | $ | 665 | |
Ratios to average net assets(d): | | | | | | | | | | | | | | | | | | | | |
Expenses after waivers and/or expense reimbursement | | | 0.06 | % | | | 0.21 | % | | | 0.35 | % | | | 0.35 | % | | | 0.35 | % |
Expenses before waivers and/or expense reimbursement | | | 0.32 | % | | | 0.34 | % | | | 0.35 | % | | | 0.35 | % | | | 0.35 | % |
Net investment income (loss) | | | — | % | | | 0.26 | % | | | 1.88 | % | | | 1.52 | % | | | 0.55 | % |
PSF PGIM Government Money Market Portfolio—Class III
| | | | | | | | | | | | | | |
| | | | | | | Year Ended December 31,
2021 | | May 18, 2020(e)
through December 31,
2020 |
Per Share Operating Performance(a): | | | | | | | | | | | | | | |
Net Asset Value, beginning of period | | | | | | | $ | 10.00 | | | | $ | 10.00 | |
| | | | | | | | | | | | | | |
Income (Loss) From Investment Operations: | | | | | | | | | | | | | | |
Net investment income (loss) and realized gains (losses) | | | | | | | | — | (b) | | | | — | (b) |
Less Dividends and Distributions: | | | | | | | | — | (b) | | | | — | (b) |
| | | | | | | | | | | | | | |
Net Asset Value, end of period | | | | | | | $ | 10.00 | | | | $ | 10.00 | |
| | | | | | | | | | | | | | |
Total Return(c) | | | | | | | | 0.04 | % | | | | — | %(b) |
Ratios/Supplemental Data: | | | | | | | | | | | | | | |
Net assets, end of period (in millions) | | | | | | | $ | 144 | | | | $ | 66 | |
Average net assets (in millions) | | | | | | | $ | 118 | | | | $ | 34 | |
Ratios to average net assets(d): | | | | | | | | | | | | | | |
Expenses after waivers and/or expense reimbursement | | | | | | | | 0.06 | % | | | | 0.13 | %(f) |
Expenses before waivers and/or expense reimbursement | | | | | | | | 0.58 | % | | | | 0.58 | %(f) |
Net investment income (loss) | | | | | | | | — | % | | | | — | %(b)(f) |
| (a) | Calculated based on average shares outstanding during the period. |
| (b) | Amount rounds to zero. |
| (c) | Total return is calculated assuming a purchase of a share on the first day and a sale on the last day of each period reported and includes reinvestment of dividends and distributions, if any, and does not reflect the effect of insurance contract charges. Total return does not reflect expenses associated with the separate account such as administrative fees, account charges and surrender charges which, if reflected, would reduce the total returns for all periods shown. Performance figures may reflect fee waivers and/or expense reimbursements. In the absence of fee waivers and/or expense reimbursements, the total return would be lower. Past performance is no guarantee of future results. Total returns may reflect adjustments to conform to GAAP. Total returns for periods less than one full year are not annualized. |
| (d) | Does not include expenses of the underlying funds in which the Portfolio invests. |
| (e) | Commencement of offering. |
SEE NOTES TO FINANCIAL STATEMENTS.
B5
Financial Highlights
PSF PGIM Jennison Blend Portfolio—Class I
| | | | | | | | | | | | | | | | | | | | |
| | | Year Ended December 31, | |
| | | 2021 | | | 2020 | | | 2019 | | | 2018 | | | 2017 | |
Per Share Operating Performance(a): | | | | | | | | | | | | | | | | | | | | |
Net Asset Value, beginning of year | | $ | 81.50 | | | $ | 63.18 | | | $ | 49.02 | | | $ | 51.52 | | | $ | 40.96 | |
| | | | | | | | | | | | | | | | | | | | |
Income (Loss) From Investment Operations: | | | | | | | | | | | | | | | | | | | | |
Net investment income (loss) | | | 0.40 | | | | 0.53 | | | | 0.66 | | | | 0.53 | | | | 0.41 | |
| Net realized and unrealized gain (loss) on investment and foreign currency transactions | | | 16.19 | | | | 17.79 | | | | 13.50 | | | | (3.07 | ) | | | 10.15 | |
| | | | | | | | | | | | | | | | | | | | |
Total from investment operations | | | 16.59 | | | | 18.32 | | | | 14.16 | | | | (2.54 | ) | | | 10.56 | |
| | | | | | | | | | | | | | | | | | | | |
Capital Contributions | | | — | | | | — | | | | — | (b)(c) | | | 0.04 | (b) | | | — | |
| | | | | | | | | | | | | | | | | | | | |
Net Asset Value, end of year | | $ | 98.09 | | | $ | 81.50 | | | $ | 63.18 | | | $ | 49.02 | | | $ | 51.52 | |
| | | | | | | | | | | | | | | | | | | | |
Total Return(d) | | | 20.36 | % | | | 29.00 | % | | | 28.89 | %(e) | | | (4.85 | )%(f) | | | 25.78 | % |
Ratios/Supplemental Data: | | | | | | | | | | | | | | | | | | | | |
Net assets, end of year (in millions) | | $ | 6,379.2 | | | $ | 5,672.4 | | | $ | 4,711.0 | | | $ | 3,919.6 | | | $ | 4,415.6 | |
Average net assets (in millions) | | $ | 6,084.1 | | | $ | 4,776.8 | | | $ | 4,406.8 | | | $ | 4,497.1 | | | $ | 4,098.8 | |
Ratios to average net assets(g): | | | | | | | | | | | | | | | | | | | | |
Expenses after waivers and/or expense reimbursement | | | 0.46 | % | | | 0.47 | % | | | 0.47 | % | | | 0.47 | % | | | 0.47 | % |
Expenses before waivers and/or expense reimbursement | | | 0.46 | % | | | 0.47 | % | | | 0.47 | % | | | 0.47 | % | | | 0.47 | % |
Net investment income (loss) | | | 0.45 | % | | | 0.80 | % | | | 1.16 | % | | | 0.98 | % | | | 0.89 | % |
Portfolio turnover rate(h) | | | 29 | % | | | 62 | % | | | 43 | % | | | 37 | % | | | 55 | % |
PSF PGIM Jennison Blend Portfolio—Class II
| | | | | | | | | | | | | | | | | | | | |
| | | Year Ended December 31, | |
| | | 2021 | | | 2020 | | | 2019 | | | 2018 | | | 2017 | |
Per Share Operating Performance(a): | | | | | | | | | | | | | | | | | | | | |
Net Asset Value, beginning of year | | $ | 79.78 | | | $ | 62.09 | | | $ | 48.37 | | | $ | 51.04 | | | $ | 40.74 | |
| | | | | | | | | | | | | | | | | | | | |
Income (Loss) From Investment Operations: | | | | | | | | | | | | | | | | | | | | |
Net investment income (loss) | | | 0.04 | | | | 0.26 | | | | 0.43 | | | | 0.32 | | | | 0.23 | |
| Net realized and unrealized gain (loss) on investment and foreign currency transactions | | | 15.82 | | | | 17.43 | | | | 13.29 | | | | (3.03 | ) | | | 10.07 | |
| | | | | | | | | | | | | | | | | | | | |
Total from investment operations | | | 15.86 | | | | 17.69 | | | | 13.72 | | | | (2.71 | ) | | | 10.30 | |
| | | | | | | | | | | | | | | | | | | | |
Capital Contributions | | | — | | | | — | | | | — | (b)(c) | | | 0.04 | (b) | | | — | |
| | | | | | | | | | | | | | | | | | | | |
Net Asset Value, end of year | | $ | 95.64 | | | $ | 79.78 | | | $ | 62.09 | | | $ | 48.37 | | | $ | 51.04 | |
| | | | | | | | | | | | | | | | | | | | |
Total Return(d) | | | 19.88 | % | | | 28.49 | % | | | 28.36 | %(e) | | | (5.23 | )%(f) | | | 25.28 | % |
Ratios/Supplemental Data: | | | | | | | | | | | | | | | | | | | | |
Net assets, end of year (in millions) | | $ | 2.3 | | | $ | 2.0 | | | $ | 1.7 | | | $ | 1.5 | | | $ | 1.7 | |
Average net assets (in millions) | | $ | 2.2 | | | $ | 1.7 | | | $ | 1.6 | | | $ | 1.8 | | | $ | 1.8 | |
Ratios to average net assets(g): | | | | | | | | | | | | | | | | | | | | |
Expenses after waivers and/or expense reimbursement | | | 0.86 | % | | | 0.87 | % | | | 0.87 | % | | | 0.87 | % | | | 0.87 | % |
Expenses before waivers and/or expense reimbursement | | | 0.86 | % | | | 0.87 | % | | | 0.87 | % | | | 0.87 | % | | | 0.87 | % |
Net investment income (loss) | | | 0.04 | % | | | 0.40 | % | | | 0.76 | % | | | 0.59 | % | | | 0.50 | % |
Portfolio turnover rate(h) | | | 29 | % | | | 62 | % | | | 43 | % | | | 37 | % | | | 55 | % |
SEE NOTES TO FINANCIAL STATEMENTS.
B6
Financial Highlights
PSF PGIM Jennison Blend Portfolio—Class III
| | | | | |
| | | April 26, 2021(i)
through December 31,
2021 |
Per Share Operating Performance(a): | | | | | |
Net Asset Value, beginning of period | | | $ | 87.74 | |
| | | | | |
Income (Loss) From Investment Operations: | | | | | |
Net investment income (loss) | | | | 0.12 | |
Net realized and unrealized gain (loss) on investment and foreign currency transactions | | | | 10.06 | |
| | | | | |
Total from investment operations | | | | 10.18 | |
| | | | | |
Net Asset Value, end of period | | | $ | 97.92 | |
| | | | | |
Total Return(d) | | | | 11.60 | % |
Ratios/Supplemental Data: | | | | | |
Net assets, end of period (in millions) | | | $ | 0.6 | |
Average net assets (in millions) | | | $ | 0.2 | |
Ratios to average net assets(g): | | | | | |
Expenses after waivers and/or expense reimbursement | | | | 0.70 | %(j) |
Expenses before waivers and/or expense reimbursement | | | | 0.70 | %(j) |
Net investment income (loss) | | | | 0.18 | %(j) |
Portfolio turnover rate(h) | | | | 29 | % |
| (a) | Calculated based on average shares outstanding during the period. |
| (b) | Represents payment received by the Portfolio, from Prudential, in connection with the failure to timely compensate the Portfolio for the excess foreign withholding tax withheld on dividends and interest from certain countries due to the Portfolio’s tax status as a partnership. |
| (c) | Amount rounds to zero. |
| (d) | Total return is calculated assuming a purchase of a share on the first day and a sale on the last day of each period reported and includes reinvestment of dividends and distributions, if any, and does not reflect the effect of insurance contract charges. Total return does not reflect expenses associated with the separate account such as administrative fees, account charges and surrender charges which, if reflected, would reduce the total returns for all periods shown. Performance figures may reflect fee waivers and/or expense reimbursements. In the absence of fee waivers and/or expense reimbursements, the total return would be lower. Past performance is no guarantee of future results. Total returns may reflect adjustments to conform to GAAP. Total returns for periods less than one full year are not annualized. |
| (e) | Total return for the year includes the impact of the capital contribution, which was not material to the total return. |
| (f) | Total return for the year includes the impact of the capital contribution. Excluding the capital contribution, the total return would have been (4.93)% and (5.31)% for Class I and Class II, respectively. |
| (g) | Does not include expenses of the underlying funds in which the Portfolio invests. |
| (h) | The Portfolio’s portfolio turnover rate is calculated in accordance with regulatory requirements, without regard to transactions involving short-term investments, certain derivatives and in-kind transactions (if any). If such transactions were included, the Portfolio’s portfolio turnover rate may be higher. |
| (i) | Commencement of offering. |
| (j) | Annualized, with the exception of certain non-recurring expenses. |
SEE NOTES TO FINANCIAL STATEMENTS.
B7
Financial Highlights
PSF PGIM Total Return Bond Portfolio—Class I
| | | | | | | | | | | | | | | | | | | | |
| | | Year Ended December 31, | |
| | | 2021 | | | 2020 | | | 2019 | | | 2018 | | | 2017 | |
Per Share Operating Performance(a): | | | | | | | | | | | | | | | | | | | | |
Net Asset Value, beginning of year | | $ | 15.78 | | | $ | 14.55 | | | $ | 13.12 | | | $ | 13.14 | | | $ | 12.28 | |
| | | | | | | | | | | | | | | | | | | | |
Income (Loss) From Investment Operations: | | | | | | | | | | | | | | | | | | | | |
Net investment income (loss) | | | 0.40 | | | | 0.45 | | | | 0.49 | | | | 0.45 | | | | 0.42 | |
| Net realized and unrealized gain (loss) on investment and foreign currency transactions | | | (0.52 | ) | | | 0.78 | | | | 0.94 | | | | (0.48 | ) | | | 0.44 | |
| | | | | | | | | | | | | | | | | | | | |
Total from investment operations | | | (0.12 | ) | | | 1.23 | | | | 1.43 | | | | (0.03 | ) | | | 0.86 | |
| | | | | | | | | | | | | | | | | | | | |
Capital Contributions | | | — | | | | — | | | | — | | | | 0.01 | (b) | | | — | |
| | | | | | | | | | | | | | | | | | | | |
Net Asset Value, end of year | | $ | 15.66 | | | $ | 15.78 | | | $ | 14.55 | | | $ | 13.12 | | | $ | 13.14 | |
| | | | | | | | | | | | | | | | | | | | |
Total Return(c) | | | (0.76 | )% | | | 8.45 | % | | | 10.90 | % | | | (0.15 | )%(d) | | | 7.00 | % |
Ratios/Supplemental Data: | | | | | | | | | | | | | | | | | | | | |
Net assets, end of year (in millions) | | $ | 1,298 | | | $ | 1,293 | | | $ | 1,190 | | | $ | 1,123 | | | $ | 1,145 | |
Average net assets (in millions) | | $ | 1,292 | | | $ | 1,235 | | | $ | 1,166 | | | $ | 1,132 | | | $ | 1,123 | |
Ratios to average net assets(e): | | | | | | | | | | | | | | | | | | | | |
Expenses after waivers and/or expense reimbursement | | | 0.42 | % | | | 0.43 | % | | | 0.44 | % | | | 0.44 | % | | | 0.44 | % |
Expenses before waivers and/or expense reimbursement | | | 0.42 | % | | | 0.43 | % | | | 0.44 | % | | | 0.44 | % | | | 0.44 | % |
Net investment income (loss) | | | 2.55 | % | | | 2.99 | % | | | 3.53 | % | | | 3.44 | % | | | 3.28 | % |
Portfolio turnover rate(f) | | | 49 | % | | | 35 | % | | | 48 | % | | | 51 | % | | | 71 | % |
PSF PGIM Total Return Bond Portfolio—Class III
| | | | | |
| | | April 26, 2021(g)
through December 31,
2021 |
Per Share Operating Performance(a): | | | | | |
Net Asset Value, beginning of period | | | $ | 15.35 | |
| | | | | |
Income (Loss) From Investment Operations: | | | | | |
Net investment income (loss) | | | | 0.24 | |
Net realized and unrealized gain (loss) on investment and foreign currency transactions | | | | 0.05 | (h) |
| | | | | |
Total from investment operations | | | | 0.29 | |
| | | | | |
Net Asset Value, end of period | | | $ | 15.64 | |
| | | | | |
Total Return(c) | | | | 1.89 | % |
Ratios/Supplemental Data: | | | | | |
Net assets, end of period (in millions) | | | $ | 5 | |
Average net assets (in millions) | | | $ | 2 | |
Ratios to average net assets(e): | | | | | |
Expenses after waivers and/or expense reimbursement | | | | 0.66 | %(i) |
Expenses before waivers and/or expense reimbursement | | | | 0.66 | %(i) |
Net investment income (loss) | | | | 2.24 | %(i) |
Portfolio turnover rate(f) | | | | 49 | % |
| (a) | Calculated based on average shares outstanding during the period. |
| (b) | Represents payment received by the Portfolio, from Prudential, in connection with excess foreign withholding tax withheld on dividends and interest from certain countries due to the Portfolio’s tax status as a partnership. |
| (c) | Total return is calculated assuming a purchase of a share on the first day and a sale on the last day of each period reported and includes reinvestment of dividends and distributions, if any, and does not reflect the effect of insurance contract charges. Total return does not reflect expenses associated with the separate account such as administrative fees, account charges and surrender charges which, if reflected, would reduce the total returns for all periods shown. Performance figures may reflect fee waivers and/or expense reimbursements. In the absence of fee waivers and/or expense reimbursements, the total return would be lower. Past performance is no guarantee of future results. Total returns may reflect adjustments to conform to GAAP. Total returns for periods less than one full year are not annualized. |
| (d) | Total return for the year includes the impact of the capital contribution. Excluding the capital contribution, the total return would have been (0.23)%. |
| (e) | Does not include expenses of the underlying funds in which the Portfolio invests. |
| (f) | The Portfolio’s portfolio turnover rate is calculated in accordance with regulatory requirements, without regard to transactions involving short-term investments, certain derivatives and in-kind transactions (if any). If such transactions were included, the Portfolio’s portfolio turnover rate may be higher. |
| (g) | Commencement of offering. |
| (h) | The per share amount of realized and unrealized gain (loss) on investments does not directly correlate to the amounts reported in the Statement of Operations due to the timing of portfolio share transactions in relation to fluctuating market values. |
| (i) | Annualized, with the exception of certain non-recurring expenses. |
SEE NOTES TO FINANCIAL STATEMENTS.
B8
Financial Highlights
PSF Stock Index Portfolio—Class I
| | | | | | | | | | | | | | | | | | | | |
| | | Year Ended December 31, | |
| | | 2021 | | | 2020 | | | 2019 | | | 2018 | | | 2017 | |
Per Share Operating Performance(a): | | | | | | | | | | | | | | | | | | | | |
Net Asset Value, beginning of year | | $ | 87.66 | | | $ | 74.24 | | | $ | 56.64 | | | $ | 59.38 | | | $ | 50.70 | |
| | | | | | | | | | | | | | | | | | | | |
Income (Loss) From Investment Operations: | | | | | | | | | | | | | | | | | | | | |
Net investment income (loss) | | | 1.06 | | | | 1.12 | | | | 1.12 | | | | 1.00 | | | | 0.92 | |
| Net realized and unrealized gain (loss) on investment transactions | | | 23.73 | | | | 12.30 | | | | 16.48 | | | | (3.74 | ) | | | 9.75 | |
| | | | | | | | | | | | | | | | | | | | |
Total from investment operations | | | 24.79 | | | | 13.42 | | | | 17.60 | | | | (2.74 | ) | | | 10.67 | |
| | | | | | | | | | | | | | | | | | | | |
Less Dividends and Distributions | | | — | | | | — | | | | — | | | | — | | | | (1.99 | ) |
| | | | | | | | | | | | | | | | | | | | |
Net Asset Value, end of year | | $ | 112.45 | | | $ | 87.66 | | | $ | 74.24 | | | $ | 56.64 | | | $ | 59.38 | |
| | | | | | | | | | | | | | | | | | | | |
Total Return(b) | | | 28.28 | % | | | 18.08 | % | | | 31.07 | % | | | (4.61 | )% | | | 21.46 | % |
Ratios/Supplemental Data: | | | | | | | | | | | | | | | | | | | | |
Net assets, end of year (in millions) | | $ | 7,244 | | | $ | 5,620 | | | $ | 4,757 | | | $ | 3,672 | | | $ | 3,928 | |
Average net assets (in millions) | | $ | 6,427 | | | $ | 4,802 | | | $ | 4,298 | | | $ | 4,051 | | | $ | 3,630 | |
Ratios to average net assets(c): | | | | | | | | | | | | | | | | | | | | |
Expenses after waivers and/or expense reimbursement | | | 0.29 | % | | | 0.31 | % | | | 0.31 | % | | | 0.31 | % | | | 0.32 | % |
Expenses before waivers and/or expense reimbursement | | | 0.29 | % | | | 0.31 | % | | | 0.31 | % | | | 0.31 | % | | | 0.32 | % |
Net investment income (loss) | | | 1.06 | % | | | 1.50 | % | | | 1.69 | % | | | 1.63 | % | | | 1.69 | % |
Portfolio turnover rate(d) | | | 2 | % | | | 4 | % | | | 3 | % | | | 4 | % | | | 4 | % |
PSF Stock Index Portfolio—Class III
| | | | | |
| | | April 26, 2021(e) through December 31, 2021 |
Per Share Operating Performance(a): | | | | | |
Net Asset Value, beginning of period | | | $ | 97.90 | |
| | | | | |
Income (Loss) From Investment Operations: | | | | | |
Net investment income (loss) | | | | 0.54 | |
Net realized and unrealized gain (loss) on investment transactions | | | | 13.82 | |
| | | | | |
Total from investment operations | | | | 14.36 | |
| | | | | |
Net Asset Value, end of period | | | $ | 112.26 | |
| | | | | |
Total Return(b) | | | | 14.67 | % |
Ratios/Supplemental Data: | | | | | |
Net assets, end of period (in millions) | | | $ | 17 | |
Average net assets (in millions) | | | $ | 7 | |
Ratios to average net assets(c): | | | | | |
Expenses after waivers and/or expense reimbursement | | | | 0.54 | %(f) |
Expenses before waivers and/or expense reimbursement | | | | 0.54 | %(f) |
Net investment income (loss) | | | | 0.74 | %(f) |
Portfolio turnover rate(d) | | | | 2 | % |
| (a) | Calculated based on average shares outstanding during the period. |
| (b) | Total return is calculated assuming a purchase of a share on the first day and a sale on the last day of each period reported and includes reinvestment of dividends and distributions, if any, and does not reflect the effect of insurance contract charges. Total return does not reflect expenses associated with the separate account such as administrative fees, account charges and surrender charges which, if reflected, would reduce the total returns for all periods shown. Performance figures may reflect fee waivers and/or expense reimbursements. In the absence of fee waivers and/or expense reimbursements, the total return would be lower. Past performance is no guarantee of future results. Total returns may reflect adjustments to conform to GAAP. Total returns for periods less than one full year are not annualized. |
| (c) | Does not include expenses of the underlying funds in which the Portfolio invests. |
| (d) | The Portfolio’s portfolio turnover rate is calculated in accordance with regulatory requirements, without regard to transactions involving short-term investments, certain derivatives and in-kind transactions (if any). If such transactions were included, the Portfolio’s portfolio turnover rate may be higher. |
| (e) | Commencement of offering. |
| (f) | Annualized, with the exception of certain non-recurring expenses. |
SEE NOTES TO FINANCIAL STATEMENTS.
B9
NOTES TO FINANCIAL STATEMENTS OF
THE PRUDENTIAL SERIES FUND
The Prudential Series Fund (“Series Fund”), a Delaware statutory trust, is registered under the Investment Company Act of 1940, as amended (“1940 Act”), as an open-end management investment company. The Series Fund is currently composed of 17 Portfolios (each, a “Portfolio” and collectively, the “Portfolios”). The information presented in these financial statements pertains to the 8 Portfolios listed below together with their investment objectives. Each Portfolio is a diversified portfolio for purposes of the 1940 Act.
PSF Global Portfolio (formerly known as, Global Portfolio): Long-term growth of capital.
PSF PGIM 50/50 Balanced Portfolio (formerly known as, Conservative Balanced Portfolio): Total investment return consistent with a conservatively managed diversified portfolio.
PSF PGIM Flexible Managed Portfolio (formerly known as, Flexible Managed Portfolio): Total return consistent with an aggressively managed diversified portfolio.
PSF PGIM Government Income Portfolio (formerly known as, Government Income Portfolio): High level of income over the long-term consistent with the preservation of capital.
PSF PGIM Government Money Market Portfolio (formerly known as, Government Money Market Portfolio): Maximum current income consistent with the stability of capital and maintenance of liquidity.
PSF PGIM Jennison Blend Portfolio (formerly known as, Equity Portfolio): Long-term growth of capital.
PSF PGIM Total Return Bond Portfolio (formerly known as, Diversified Bond Portfolio): High level of income over a longer term while providing reasonable safety of capital.
PSF Stock Index Portfolio (formerly known as, Stock Index Portfolio): Achieve investment results that generally correspond to the performance of publicly traded common stocks.
The Series Fund follows the investment company accounting and reporting guidance of the Financial Accounting Standards Board (“FASB”) Accounting Standard Codification (“ASC”) Topic 946 Financial Services — Investment Companies. The following is a summary of significant accounting policies followed by the Series Fund in the preparation of its financial statements. The policies conform to U.S. generally accepted accounting principles (“GAAP”). The Series Fund and the Portfolios consistently follow such policies in the preparation of their financial statements.
Securities Valuation: Each Portfolio holds securities and other assets and liabilities that are fair valued as of the close of each day (generally, 4:00 PM Eastern time) the New York Stock Exchange (“NYSE”) is open for trading. As described in further detail below, the Portfolios’ investments are valued daily based on a number of factors, including the type of investment and whether market quotations are readily available. The Series Fund’s Board of Trustees (the “Board”) has adopted valuation procedures for security valuation under which fair valuation responsibilities have been delegated to PGIM Investments LLC (“PGIM Investments” or the “Manager”). Pursuant to the Board’s delegation, the Manager has established a Valuation Committee responsible for supervising the fair valuation of portfolio securities and other assets and liabilities. The valuation procedures permit a Portfolio to utilize independent pricing vendor services, quotations from market makers, and alternative valuation methods when market quotations are either not readily available or not deemed representative of fair value. Fair value is the price that would be received to sell an asset or paid to transfer a liability in an orderly transaction between market participants on the measurement date. A record of the Valuation Committee’s actions is subject to the Board’s review at its first quarterly meeting following the quarter in which such actions take place.
For the fiscal reporting year-end, securities and other assets and liabilities were fair valued at the close of the last U.S. business day. Trading in certain foreign securities may occur when the NYSE is closed (including weekends and holidays). Because such foreign securities trade in markets that are open on weekends and U.S. holidays, the values of some of the Portfolios’ foreign investments may change on days when investors cannot purchase or redeem Portfolio shares.
C1
Various inputs determine how the Portfolios’ investments are valued, all of which are categorized according to the three broad levels (Level 1, 2, or 3) detailed in the Schedule of Investments and referred to herein as the “fair value hierarchy” in accordance with FASB ASC Topic 820 - Fair Value Measurement.
Common or preferred stocks, exchange-traded funds and derivative instruments, if applicable, that are traded on a national securities exchange are valued at the last sale price as of the close of trading on the applicable exchange where the security principally trades. Securities traded via NASDAQ are valued at the NASDAQ official closing price. To the extent these securities are valued at the last sale price or NASDAQ official closing price, they are classified as Level 1 in the fair value hierarchy. In the event that no sale or official closing price on valuation date exists, these securities are generally valued at the mean between the last reported bid and ask prices, or at the last bid price in the absence of an ask price. These securities are classified as Level 2 in the fair value hierarchy.
Foreign equities traded on foreign securities exchanges are generally valued using pricing vendor services that provide model prices derived using adjustment factors based on information such as local closing price, relevant general and sector indices, currency fluctuations, depositary receipts, and futures, as applicable. Securities valued using such model prices are classified as Level 2 in the fair value hierarchy. The models generate an evaluated adjustment factor for each security, which is applied to the local closing price to adjust it for post closing market movements up to the time each Portfolio is valued. Utilizing that evaluated adjustment factor, the vendor provides an evaluated price for each security. If the vendor does not provide an evaluated price, securities are valued in accordance with exchange-traded common and preferred stock valuation policies discussed above.
Investments in open-end funds (other than exchange-traded funds) are valued at their net asset values as of the close of the NYSE on the date of valuation. These securities are classified as Level 1 in the fair value hierarchy since they may be purchased or sold at their net asset values on the date of valuation.
Fixed income securities traded in the OTC market are generally classified as Level 2 in the fair value hierarchy. Such fixed income securities are typically valued using the market approach which generally involves obtaining data from an approved independent third-party vendor source. The Portfolios utilize the market approach as the primary method to value securities when market prices of identical or comparable instruments are available. The third-party vendors’ valuation techniques used to derive the evaluated bid price are based on evaluating observable inputs, including but not limited to, yield curves, yield spreads, credit ratings, deal terms, tranche level attributes, default rates, cash flows, prepayment speeds, broker/dealer quotations and reported trades. Certain Level 3 securities are also valued using the market approach when obtaining a single broker quote or when utilizing transaction prices for identical securities that have been used in excess of five business days. During the reporting period, there were no changes to report with respect to the valuation approach and/or valuation techniques discussed above.
The Government Money Market Portfolio values all of its securities of sufficient credit quality at amortized cost, which approximates fair value. The amortized cost method involves valuing a security at its cost on the date of purchase and thereafter assuming a constant amortization to maturity of the difference between the principal amount due at maturity and cost. These securities are categorized as Level 2 of the fair value hierarchy.
Bank loans are generally valued at prices provided by approved independent pricing vendors. The pricing vendors utilize broker/dealer quotations and provide prices based on the average of such quotations. Bank loans valued using such vendor prices are generally classified as Level 2 in the fair value hierarchy. Bank loans valued based on a single broker quote or at the original transaction price in excess of five business days are classified as Level 3 in the fair value hierarchy.
OTC and centrally cleared derivative instruments are generally classified as Level 2 in the fair value hierarchy. Such derivative instruments are typically valued using the market approach and/or income approach which generally involves obtaining data from an approved independent third-party vendor source. The Portfolios utilize the market approach when quoted prices in broker-dealer markets are available but also include consideration of alternative valuation approaches, including the income approach. In the absence of reliable market quotations, the income approach is typically utilized for purposes of valuing derivatives such as interest rate swaps based on a discounted cash flow analysis whereby the value of the instrument is equal to the present value of its future cash inflows or outflows. Such analysis includes projecting future cash flows and determining the discount rate (including the present value factors that affect the discount rate) used to discount the future cash flows. In addition, the third-party vendors’ valuation techniques used to derive the evaluated derivative price is based on evaluating observable inputs, including but not limited to, underlying asset prices, indices, spreads, interest rates and exchange rates. Certain derivatives may be classified as Level 3 when valued using the market approach by
C2
obtaining a single broker quote or when utilizing unobservable inputs in the income approach. During the reporting period, there were no changes to report with respect to the valuation approach and/or valuation techniques discussed above.
Securities and other assets that cannot be priced according to the methods described above are valued based on pricing methodologies approved by the Board. In the event that unobservable inputs are used when determining such valuations, the securities will be classified as Level 3 in the fair value hierarchy. Altering one or more unobservable inputs may result in a significant change to a Level 3 security’s fair value measurement.
When determining the fair value of securities, some of the factors influencing the valuation include: the nature of any restrictions on disposition of the securities; assessment of the general liquidity of the securities; the issuer’s financial condition and the markets in which it does business; the cost of the investment; the size of the holding and the capitalization of the issuer; the prices of any recent transactions or bids/offers for such securities or any comparable securities; any available analyst media or other reports or information deemed reliable by the Manager regarding the issuer or the markets or industry in which it operates. Using fair value to price securities may result in a value that is different from a security’s most recent closing price and from the price used by other unaffiliated mutual funds to calculate their net asset values.
Foreign Currency Translation: The books and records of the Portfolios are maintained in U.S. dollars. Foreign currency amounts are translated into U.S. dollars on the following basis:
(i) market value of investment securities, other assets and liabilities — at the exchange rate as of the valuation date;
(ii) purchases and sales of investment securities, income and expenses — at the rates of exchange prevailing on the respective dates of such transactions.
Although the net assets of the Portfolios are presented at the foreign exchange rates and market values at the close of the period, the Portfolios do not generally isolate that portion of the results of operations arising as a result of changes in the foreign exchange rates from the fluctuations arising from changes in the market prices of long-term portfolio securities held at the end of the period. Similarly, the Portfolios do not isolate the effect of changes in foreign exchange rates from the fluctuations arising from changes in the market prices of long-term portfolio securities sold during the period. Accordingly, holding period unrealized and realized foreign currency gains (losses) are included in the reported net change in unrealized appreciation (depreciation) on investments and net realized gains (losses) on investment transactions on the Statements of Operations. Notwithstanding the above, the Portfolios do isolate the effect of fluctuations in foreign currency exchange rates when determining the gain (loss) upon the sale or maturity of foreign currency denominated debt obligations; such amounts are included in net realized gains (losses) on foreign currency transactions.
Additionally, net realized gains (losses) on foreign currency transactions represent net foreign exchange gains (losses) from the disposition of holdings of foreign currencies, currency gains (losses) realized between the trade and settlement dates on investment transactions, and the difference between the amounts of interest, dividends and foreign withholding taxes recorded on the Portfolios’ books and the U.S. dollar equivalent amounts actually received or paid. Net unrealized currency gains (losses) arise from valuing foreign currency denominated assets and liabilities (other than investments) at period end exchange rates.
Forward and Cross Currency Contracts: A forward currency contract is a commitment to purchase or sell a foreign currency at a future date at a negotiated forward rate. Certain Portfolios entered into forward currency contracts, as defined in the prospectus, in order to hedge their exposure to changes in foreign currency exchange rates on their foreign portfolio holdings or on specific receivables and payables denominated in a foreign currency and to gain exposures to certain currencies. The contracts are valued daily at current forward exchange rates and any unrealized gain (loss) is included in net unrealized appreciation or depreciation on forward and cross currency contracts. Gain (loss) is realized on the settlement date of the contract equal to the difference between the settlement value of the original and negotiated forward contracts. This gain (loss), if any, is included in net realized gain (loss) on forward and cross currency contract transactions. Risks may arise upon entering into these contracts from the potential inability of the counterparties to meet the terms of their contracts. Forward currency contracts involve risks from currency exchange rate and credit risk in excess of the amounts reflected on the Statement of Assets and Liabilities. The Portfolios’ maximum risk of loss from counterparty credit risk is the net value of the cash flows to be received from the counterparty at the end of the contract’s life. A cross currency contract is a forward contract where a specified amount of one foreign currency will be exchanged for a specified amount of another foreign currency.
C3
Options: Certain Portfolios purchased and/or wrote options in order to hedge against adverse market movements or fluctuations in value caused by changes in prevailing interest rates, value of equities or foreign currency exchange rates with respect to securities or financial instruments which the Portfolio currently owns or intends to purchase. The Portfolios may also use options to gain additional market exposure. The Portfolios’ principal reason for writing options is to realize, through receipt of premiums, a greater current return than would be realized on the underlying security alone. When the Portfolio purchases an option, it pays a premium and an amount equal to that premium is recorded as an asset. When the Portfolio writes an option, it receives a premium and an amount equal to that premium is recorded as a liability. The asset or liability is adjusted daily to reflect the current market value of the option. If an option expires unexercised, the Portfolio realizes a gain (loss) to the extent of the premium received or paid. If an option is exercised, the premium received or paid is recorded as an adjustment to the proceeds from the sale or the cost of the purchase in determining whether the Portfolio has realized a gain (loss). The difference between the premium and the amount received or paid at the closing of a purchase or sale transaction is also treated as a realized gain (loss). Gain (loss) on purchased options is included in net realized gain (loss) on investment transactions. Gain (loss) on written options is presented separately as net realized gain (loss) on options written transactions.
The Portfolio, as writer of an option, may have no control over whether the underlying securities or financial instruments may be sold (called) or purchased (put). As a result, the Portfolio bears the market risk of an unfavorable change in the price of the security or financial instrument underlying the written option. The Portfolio, as purchaser of an OTC option, bears the risk of the potential inability of the counterparties to meet the terms of their contracts. With exchange-traded options contracts, there is minimal counterparty credit risk to the Portfolio since the exchanges’ clearinghouse acts as counterparty to all exchange-traded options and guarantees the options contracts against default.
When a Portfolio writes an option on a swap, an amount equal to any premium received by the Portfolio is recorded as a liability and is subsequently adjusted to the current market value of the written option on the swap. If a call option on a swap is exercised, the Portfolio becomes obligated to pay a fixed interest rate (noted as the strike price) and receive a variable interest rate on a notional amount. If a put option on a swap is exercised, the Portfolio becomes obligated to pay a variable interest rate and receive a fixed interest rate (noted as the strike price) on a notional amount. Premiums received from writing options on swaps that expire or are exercised are treated as realized gains upon the expiration or exercise of such options on swaps. The risk associated with writing put and call options on swaps is that the Portfolio will be obligated to be party to a swap agreement if an option on a swap is exercised.
Financial Futures Contracts: A financial futures contract is an agreement to purchase (long) or sell (short) an agreed amount of securities at a set price for delivery on a future date. Upon entering into a financial futures contract, the Portfolios are required to pledge to the broker an amount of cash and/or other assets equal to a certain percentage of the contract amount. This amount is known as the “initial margin.” Subsequent payments, known as “variation margin,” are made or received by the Portfolios each day, depending on the daily fluctuations in the value of the underlying security. Such variation margin is recorded for financial statement purposes on a daily basis as unrealized gain (loss). When the contract expires or is closed, the gain (loss) is realized and is presented in the Statement of Operations as net realized gain (loss) on futures transactions.
Certain Portfolios invested in financial futures contracts in order to hedge their existing portfolio securities, or securities the Portfolios intend to purchase, against fluctuations in value caused by changes in prevailing interest rates. Should interest rates move unexpectedly, the Portfolios may not achieve the anticipated benefits of the financial futures contracts and may realize a loss. The use of futures transactions involves the risk of imperfect correlation in movements in the price of futures contracts, interest rates and the underlying hedged assets. Since futures contracts are exchange-traded, there is minimal counterparty credit risk to the Portfolios since the exchanges’ clearinghouse acts as counterparty to all exchange-traded futures and guarantees the futures contracts against default.
Swap Agreements: Certain Portfolios entered into certain types of swap agreements detailed in the disclosures below. A swap agreement is an agreement to exchange the return generated by one instrument for the return generated by another instrument. Swap agreements are negotiated in the OTC market and may be executed either directly with a counterparty (“OTC-traded”) or through a central clearing facility, such as a registered exchange. Swap agreements are valued daily at current market value and any change in value is included in the net unrealized appreciation or depreciation on swap agreements. Centrally cleared swaps pay or receive an amount known as “variation margin”, based on daily changes in the valuation of the swap contract. For
C4
OTC-traded, upfront premiums paid and received are shown as swap premiums paid and swap premiums received in the Statement of Assets and Liabilities. Risk of loss may exceed amounts recognized on the Statement of Assets and Liabilities. Swap agreements outstanding at period end, if any, are listed on the Schedule of Investments.
Interest Rate Swaps: Interest rate swaps represent an agreement between counterparties to exchange cash flows based on the difference between two interest rates, applied to a notional principal amount for a specified period. Certain Portfolios are subject to interest rate risk exposure in the normal course of pursuing their investment objective. Certain Portfolios used interest rate swaps to maintain their ability to generate steady cash flow by receiving a stream of fixed rate payments or to increase exposure to prevailing market rates by receiving floating rate payments. The Portfolios’ maximum risk of loss from counterparty credit risk is the discounted net present value of the cash flows to be received from the counterparty over the contract’s remaining life.
Inflation Swaps: Certain Portfolios entered into inflation swap agreements to protect against fluctuations in inflation rates. Inflation swaps are characterized by one party paying a fixed rate in exchange for a floating rate that is derived from an inflation index, such as the Consumer Price Index or UK Retail Price Index. Inflation swaps subject the Portfolios to interest rate risk.
Credit Default Swaps (“CDS”): CDS involve one party (the protection buyer) making a stream of payments to another party (the protection seller) in exchange for the right to receive a specified payment in the event of a default or as a result of a default (collectively a “credit event”) for the referenced entity (typically corporate issues or sovereign issues of an emerging country) on its obligation; or in the event of a write-down, principal shortfall, interest shortfall or default of all or part of the referenced entities comprising a credit index.
Certain Portfolios are subject to credit risk in the normal course of pursuing their investment objectives, and as such, have entered into CDS contracts to provide a measure of protection against defaults or to take an active long or short position with respect to the likelihood of a particular issuer’s default or the reference entity’s credit soundness. CDS contracts generally trade based on a spread which represents the cost a protection buyer has to pay the protection seller. The protection buyer is said to be short the credit as the value of the contract rises the more the credit deteriorates. The value of the CDS contract increases for the protection buyer if the spread increases. A Portfolio’s maximum risk of loss from counterparty credit risk for purchased CDS is the inability of the counterparty to honor the contract up to the notional value due to a credit event.
As a seller of protection on credit default swap agreements, the Portfolio generally receives an agreed upon payment from the buyer of protection throughout the term of the swap, provided no credit event occurs. As the seller, the Portfolio effectively increases its investment risk because, in addition to its total net assets, the Portfolio may be subject to investment exposure on the notional amount of the swap.
The maximum amount of the payment that the Portfolio, as a seller of protection, could be required to make under a credit default swap agreement would be equal to the notional amount of the underlying security or index contract as a result of a credit event. This potential amount will be partially offset by any recovery values of the respective referenced obligations, or net amounts received from the settlement of buy protection credit default swap agreements which the Portfolio entered into for the same referenced entity or index. As a buyer of protection, the Portfolio generally receives an amount up to the notional value of the swap if a credit event occurs.
Implied credit spreads, represented in absolute terms, utilized in determining the market value of credit default swap agreements where the Portfolio is the seller of protection as of period end are disclosed in the footnotes to the Schedule of Investments, if applicable. These spreads serve as indicators of the current status of the payment/performance risk and represent the likelihood of default risk for the credit derivative. The implied credit spread of a particular referenced entity reflects the cost of buying/selling protection and may include upfront payments required to enter into the agreement. Wider credit spreads and increased market value in absolute terms, when compared to the notional amount of the swap, represent a deterioration of the referenced entity’s credit soundness and a greater likelihood of risk of default or other credit event occurring as defined under the terms of the agreement.
Total Return Swaps: In a total return swap, one party receives payments based on the market value of the security or the commodity involved, or total return of a specific referenced asset, such as an equity, index or bond, and in return pays a defined amount. Certain Portfolios are subject to risk exposures associated with the referenced asset in the normal course of pursuing their investment objectives. Certain Portfolios entered into total return swaps to manage their exposure to a security or an index. The Portfolios’ maximum risk of loss from counterparty credit risk is the change in the value of the security, in favor of the Portfolio, from the point of entering into the contract.
C5
Bank Loans: Certain Portfolios invested in bank loans. Bank loans include fixed and floating rate loans that are privately negotiated between a corporate borrower and one or more financial institutions, including, but not limited to, term loans, revolvers, and other instruments issued in the bank loan market. The Portfolios acquire interests in loans directly (by way of assignment from the selling institution) and/or indirectly (by way of the purchase of a participation interest from the selling institution). Under a bank loan assignment, the Portfolios generally will succeed to all the rights and obligations of an assigning lending institution and become a lender under the loan agreement with the relevant borrower in connection with that loan. Under a bank loan participation, the Portfolios generally will have a contractual relationship only with the lender, not with the relevant borrower. As a result, the Portfolios generally will have the right to receive payments of principal, interest, and any fees to which they are entitled only from the lender selling the participation and only upon receipt by the lender of the payments from the relevant borrower. The Portfolios may not directly benefit from the collateral supporting the debt obligation in which they have purchased the participation. As a result, the Portfolios will assume the credit risk of both the borrower and the institution selling the participation to the Portfolios.
Repurchase Agreements: Certain Portfolios entered into repurchase agreements. In connection with transactions in repurchase agreements with United States financial institutions, it is each Portfolio’s policy that its custodian or designated subcustodians under triparty repurchase agreements, as the case may be, take possession of the underlying collateral securities, the value of which exceeds the principal amount of the repurchase transactions, including accrued interest. To the extent that any repurchase transaction exceeds one business day, the value of the collateral is marked-to-market on a daily basis to ensure the adequacy of the collateral. If the seller defaults and the value of the collateral declines or, if bankruptcy proceedings are commenced with respect to the seller of the security, realization of the collateral by the Portfolio may be delayed or limited.
Mortgage-Backed and Asset-Backed Securities: Mortgage-backed securities are pass-through securities, meaning that principal and interest payments made by the borrower on the underlying mortgages are passed through to the Portfolio. Asset-backed securities directly or indirectly represent a participation interest in, or are secured by and payable from, a stream of payments generated by particular assets such as motor vehicle or credit card receivables. Asset-backed securities may be classified as pass-through certificates or collateralized obligations, such as collateralized bond obligations, collateralized loan obligations and other similarly structured securities. The value of mortgage-backed and asset-backed securities varies with changes in interest rates and may be affected by changes in credit quality or value of the mortgage loans or other assets that support the securities.
Stripped mortgage-backed securities are usually structured with two classes that receive different proportions of the interest (“IO”) and principal (“PO”) distributions on a pool of mortgage assets. Payments received for IOs are included in interest income on the Statements of Operations. Because no principal will be received at the maturity of an IO, adjustments are made to the cost of the security on a monthly basis until maturity. These adjustments are included in interest income on the Statements of Operations. Payments received for POs are treated as reductions to the cost and par value of the securities.
Master Netting Arrangements: The Series Fund, on behalf of certain Portfolios, is subject to various Master Agreements, or netting arrangements, with select counterparties. These are agreements which a subadviser may have negotiated and entered into on behalf of all or a portion of a Portfolio. For multi-sleeve Portfolios, different subadvisers who manage their respective sleeve, may enter into such agreements with the same counterparty and are disclosed separately for each sleeve when presenting information about offsetting and related netting arrangements for OTC derivatives. A master netting arrangement between the Portfolio and the counterparty permits the Portfolio to offset amounts payable by the Portfolio to the same counterparty against amounts to be received; and by the receipt of collateral from the counterparty by the Portfolios to cover the Portfolios’ exposure to the counterparty. However, there is no assurance that such mitigating factors are easily enforceable. In addition to master netting arrangements, the right to set-off exists when all the conditions are met such that each of the parties owes the other determinable amounts, the reporting party has the right to set-off the amount owed with the amount owed by the other party, the reporting party intends to set-off and the right of set-off is enforceable by law.
The Series Fund, on behalf of certain Portfolios, is a party to International Swaps and Derivatives Association, Inc. (“ISDA”) Master Agreements with certain counterparties that govern OTC derivative and foreign exchange contracts entered into from time to time. The Master Agreements may contain provisions regarding, among other things, the parties’ general obligations, representations, agreements, collateral requirements, events of default and early termination. With respect to certain counterparties, in accordance with the terms of the Master
C6
Agreements, collateral posted to the Portfolio is held in a segregated account by the Portfolio’s custodian and with respect to those amounts which can be sold or re-pledged, are presented in the Schedule of Investments. Collateral pledged by the Portfolio is segregated by the Portfolio’s custodian and identified in the Schedule of Investments. Collateral can be in the form of cash or debt securities issued by the U.S. Government or related agencies or other securities as agreed to by the Portfolio and the applicable counterparty. Collateral requirements are determined based on the Portfolio’s net position with each counterparty. Termination events applicable to the Portfolio may occur upon a decline in the Portfolio’s net assets below a specified threshold over a certain period of time. Termination events applicable to counterparties may occur upon a decline in the counterparty’s long-term and short-term credit ratings below a specified level. In each case, upon occurrence, the other party may elect to terminate early and cause settlement of all derivative and foreign exchange contracts outstanding, including the payment of any losses and costs resulting from such early termination, as reasonably determined by the terminating party. Any decision by one or more of the Portfolio’s counterparties to elect early termination could impact the Portfolio’s future derivative activity.
In addition to each instrument’s primary underlying risk exposure (e.g. interest rate, credit, equity or foreign exchange, etc.), swap agreements involve, to varying degrees, elements of credit, market and documentation risk. Such risks involve the possibility that no liquid market for these agreements will exist, the counterparty to the agreement may default on its obligation to perform or disagree on the contractual terms of the agreement, and changes in net interest rates will be unfavorable. In connection with these agreements, securities in a portfolio may be identified or received as collateral from the counterparty in accordance with the terms of the respective swap agreements to provide or receive assets of value and to serve as recourse in the event of default or bankruptcy/ insolvency of either party. Such OTC derivative agreements include conditions which, when materialized, give the counterparty the right to cause an early termination of the transactions under those agreements. Any election by the counterparty for early termination of the contract(s) may impact the amounts reported on financial statements.
Short sales and OTC contracts, including forward foreign currency exchange contracts, swaps, forward rate agreements and written options involve elements of both market and credit risk in excess of the amounts reflected on the Statement of Assets and Liabilities, if applicable. Such risks may be mitigated by engaging in master netting arrangements.
Warrants and Rights: Certain Portfolios held warrants and rights acquired either through a direct purchase or pursuant to corporate actions. Warrants and rights entitle the holder to buy a proportionate amount of common stock, or such other security that the issuer may specify, at a specific price and time through the expiration dates. Such warrants and rights are held as long positions by the Portfolios until exercised, sold or expired. Warrants and rights are valued at fair value in accordance with the Board approved fair valuation procedures.
Payment-In-Kind: Certain fixed income Portfolios invested in the open market or received pursuant to debt restructuring, securities that pay-in-kind (PIK) the interest due on such debt instruments. The PIK interest, computed at the contractual rate specified, is added to the existing principal balance of the debt when issued bonds have same terms as the bond or recorded as a separate bond when terms are different from the existing debt, and is recorded as interest income.
Delayed-Delivery Transactions: Certain Portfolios purchased or sold securities on a when-issued or delayed-delivery and forward commitment basis. These transactions involve a commitment by the Portfolio to purchase or sell securities for a predetermined price or yield, with payment and delivery taking place beyond the customary settlement period. When delayed-delivery purchases are outstanding, the Portfolio will set aside and maintain an amount of liquid assets sufficient to meet the purchase price in a segregated account until the settlement date. When purchasing a security on a delayed-delivery basis, the Portfolio assumes the rights and risks of ownership of the security, including the risk of price and yield fluctuations, and takes such fluctuations into account when determining its net asset value. The Portfolio may dispose of or renegotiate a delayed-delivery transaction subsequent to establishment, and may sell when-issued securities before they are delivered, which may result in a realized gain (loss). When selling a security on a delayed-delivery basis, the Portfolio forfeits its eligibility to realize future gains (losses) with respect to the security.
Securities Lending: Certain Portfolios lend their portfolio securities to banks and broker-dealers. The loans are secured by collateral at least equal to the market value of the securities loaned. Collateral pledged by each borrower is invested in an affiliated money market fund and is marked to market daily, based on the previous day’s market value, such that the value of the collateral exceeds the value of the loaned securities. In the event of significant appreciation in value of securities on loan on the last business day of the reporting period, the financial statements may reflect a collateral value that is less than the market value of the loaned securities. Such shortfall
C7
is remedied as described above. Loans are subject to termination at the option of the borrower or the Portfolio. Upon termination of the loan, the borrower will return to the Portfolio securities identical to the loaned securities. The remaining maturities of the securities lending transactions are considered overnight and continuous. Should the borrower of the securities fail financially, the Portfolio has the right to repurchase the securities in the open market using the collateral.
The Portfolio recognizes income, net of any rebate and securities lending agent fees, for lending its securities in the form of fees or interest on the investment of any cash received as collateral. The borrower receives all interest and dividends from the securities loaned and such payments are passed back to the lender in amounts equivalent thereto, which are reflected in interest income or unaffiliated dividend income based on the nature of the payment on the Statement of Operations. The Portfolio also continues to recognize any unrealized gain (loss) in the market price of the securities loaned and on the change in the value of the collateral invested that may occur during the term of the loan. In addition, realized gain (loss) is recognized on changes in the value of the collateral invested upon liquidation of the collateral. Net earnings from securities lending are disclosed in the Statement of Operations.
Mortgage Dollar Rolls: Certain Portfolios entered into mortgage dollar rolls in which the Portfolios sell mortgage securities for delivery in the current month, realizing a gain (loss), and simultaneously enter into contracts to repurchase somewhat similar (same type, coupon and maturity) securities on a specified future date. During the roll period, the Portfolios forgo principal and interest paid on the securities. The Portfolios are compensated by the interest earned on the cash proceeds of the initial sale and by the lower repurchase price at the future date. The difference between the sale proceeds and the lower repurchase price is recorded as a realized gain on investment transactions. The Portfolios maintain a segregated account, the dollar value of which is at least equal to its obligations, with respect to dollar rolls. The Portfolios are subject to the risk that the market value of the securities the Portfolios are obligated to repurchase under the agreement may decline below the repurchase price.
Equity and Mortgage Real Estate Investment Trusts (collectively REITs): Certain Portfolios invested in REITs, which report information on the source of their distributions annually. Based on current and historical information, a portion of distributions received from REITs during the period is estimated to be dividend income, capital gain or return of capital and recorded accordingly. When material, these estimates are adjusted periodically when the actual source of distributions is disclosed by the REITs.
Securities Transactions and Net Investment Income: Securities transactions are recorded on the trade date. Realized gains (losses) from investment and currency transactions are calculated on the specific identification method. Dividend income is recorded on the ex-date, or for certain foreign securities, when the Portfolios become aware of such dividends. Interest income, including amortization of premium and accretion of discount on debt securities, as required, is recorded on the accrual basis. Expenses are recorded on an accrual basis, which may require the use of certain estimates by management that may differ from actual. For Portfolios with multiple classes of shares, net investment income or loss (other than administration and distribution fees which are charged directly to the respective class) and unrealized and realized gains (losses) are allocated daily to each class of shares based upon the relative proportion of adjusted net assets of each class at the beginning of the day.
Taxes: For federal income tax purposes, each Portfolio is treated as a separate taxpaying entity. Each Portfolio is treated as a partnership for tax purposes. No provision has been made in the financial statements for U.S. federal, state, or local taxes, as any tax liability arising from operations of the Portfolios is the responsibility of the Portfolio’s shareholders (participating insurance companies). Each Portfolio is not generally subject to entity-level taxation. Shareholders of each Portfolio are subject to taxes on their distributive share of partnership items. Withholding taxes on foreign dividends, interest and capital gains are accrued in accordance with each Portfolio’s understanding of the applicable country’s tax rules and regulations. Such taxes are accrued net of reclaimable amounts, at the time the related income/gain is recorded taking into account any agreements in place with Prudential Financial, Inc. (“Prudential”) as referenced below. Each Portfolio generally attempts to manage its diversification in a manner that supports the diversification requirements of the underlying separate accounts.
Distributions: Distributions, if any, from each Portfolio are made in cash and automatically reinvested in additional shares of the Portfolio. The Government Money Market Portfolio declares and reinvests distributions, if any, daily. Distributions are recorded on the ex-date.
Estimates: The preparation of financial statements requires management to make estimates and assumptions that affect the reported amounts and disclosures in the financial statements. Actual results could differ from those estimates.
C8
3. Agreements
The Series Fund, on behalf of the Portfolios, has a management agreement with the Manager. Pursuant to this agreement, the Manager has responsibility for all investment management services and supervises the subadviser’s performance of such services.
The Manager has entered into subadvisory agreements with each of PGIM, Inc., which provides subadvisory services to the Portfolios through its business unit PGIM Fixed Income (“PFI”), PGIM Limited, Jennison Associates LLC (“Jennison”) (a wholly-owned subsidiary of PGIM, Inc.), BrownAdvisory LLC (“Brown”), LSVAsset Management (“LSV”), PGIM Quantitative Solutions LLC (formerly known as QMA LLC) (“PGIM Quantitative Solutions”) (a wholly-owned subsidiary of PGIM, Inc.), T. Rowe Price Associates, Inc. (“T. Rowe”) and William Blair & Co. LLC (“William Blair”) (collectively, the “subadviser”), under which each provides investment advisory services for certain Portfolios of the Series Fund. The Manager pays for the services of the subadviser, cost of compensation officers of the Portfolio, occupancy and certain clerical and administrative expenses of the Portfolios. The Portfolios bear all other costs and expenses.
The management fee paid to the Manager is accrued daily and payable monthly, using the value of each Portfolio’s average daily net assets, at the respective annual rates specified below.
| | | | | | | | | | |
Portfolio | | Management Fee | | Effective
Management Fee,
Net of Waiver,
if Applicable |
| | |
PSF Global Portfolio | | 0.75% | | | | 0.71 | %* |
PSF PGIM 50/50 Balanced Portfolio | | 0.55 | | | | 0.55 | |
PSF PGIM Flexible Managed Portfolio | | 0.60 | | | | 0.60 | |
PSF PGIM Government Income Portfolio | | 0.40 | | | | 0.40 | |
PSF PGIM Government Money Market Portfolio | | 0.30 | | | | 0.04 | **** |
PSF PGIM Jennison Blend Portfolio | | 0.45 | | | | 0.45 | |
PSF PGIM Total Return Bond Portfolio | | 0.40 | | | | 0.40 | |
PSF Stock Index Portfolio | | 0.30% up to $4 billion | | | | | |
| | 0.25% over $4 billion | | | | 0.28 | |
| * | The Manager has contractually agreed, through June 30, 2022, to waive a portion of its management fee equal to an annual rate of 0.0363% of the average daily net assets of the Portfolio. |
| **** | The Manager has voluntarily agreed to limit the management fee of the Government Money Market Portfolio such that the 1-day yield of the Portfolio, excluding realized gain (loss) on investment transactions, does not fall below 0.00%. The waiver/reimbursement is voluntary and may be modified or terminated by the Manager at any time without notice. During the year ended December 31, 2021, the Manager has reimbursed the Portfolio as a result of this voluntary agreement in the amount of $2,289,340, 0.26% of the Government Money Market Portfolio’s averaged daily net assets. |
At December 31, 2021, the subadvisers that provide investment advisory services to the Portfolios are listed directly below. Where more than one subadviser is listed, each subadviser provides services to a segment of the Portfolio:
| | |
Portfolio | | Subadviser(s) |
| |
| PSF Global Portfolio | | Brown; LSV; PGIM Quantitative Solutions; T. Rowe & William Blair |
| PSF PGIM 50/50 Balanced Portfolio | | PFI; PGIM Limited & PGIM Quantitative Solutions |
| PSF PGIM Flexible Managed Portfolio | | PFI; PGIM Limited & PGIM Quantitative Solutions |
| PSF PGIM Government Income Portfolio | | PFI |
| PSF PGIM Government Money Market Portfolio | | PFI |
| PSF PGIM Jennison Blend Portfolio | | Jennison |
| PSF PGIM Total Return Bond Portfolio | | PFI & PGIM Limited |
PSF Stock Index Portfolio | | PGIM Quantitative Solutions |
C9
The Series Fund, on behalf of the Portfolios, has a distribution agreement, pursuant to Rule 12b-1 under the 1940 Act, with Prudential Investment Management Services LLC (“PIMS”), which acts as the distributor of the Class I, Class II and Class III shares of the Portfolios. The Portfolios compensate PIMS for distributing and servicing the Portfolios’ Class II and Class III shares pursuant to a plan of distribution (the “Class II Plan” and “Class III Plan”, together, the Plans), regardless of expenses actually incurred by PIMS. The distribution fees are accrued daily and payable monthly. No distribution or service fees are paid to PIMS as distributor of the Class I shares of the Portfolios. Pursuant to the Plans, the Class II and Class III shares of each Portfolio compensate PIMS for distribution-related activities at an annual rate of 0.25% of the average daily net assets of the Class II and Class III shares. In order to support the Portfolio’s income yield, PIMS has voluntarily undertaken to waive the distribution and service (12b-1) fees of the Government Money Market Portfolio Class III shares, respectively, such that the 1-day income yield (excluding capital gain (loss)) does not fall below 0.00%.
The Series Fund has an administration agreement with the Manager, which acts as the administrator of the Class II shares of the Portfolios. The administration fee paid to the Manager is accrued daily and payable monthly, at the annual rate of 0.15% of the average daily net assets of the Class II shares.
The Series Fund, on behalf of the Portfolios, has entered into brokerage commission recapture agreements with certain registered broker-dealers. Under the brokerage commission recapture program, a portion of the commission is returned to the Portfolio on whose behalf the trades were made. Commission recapture is paid solely to those Portfolios generating the applicable trades. Such amounts are included within realized gain (loss) on investment transactions presented in the Statement of Operations. For the year ended December 31, 2021, brokerage commission recaptured under these agreements was as follows:
| | | | |
Portfolio | | Amount | |
| |
PSF Global Portfolio | | $ | 34,687 | |
PSF PGIM Jennison Blend Portfolio | | | 93,993 | |
PIMS, PGIM Investments, PGIM, Inc., PGIM Limited, PGIM Quantitative Solutions LLC and Jennison are indirect, wholly-owned subsidiaries of Prudential.
4. Other Transactions with Affiliates
a.) Related Parties
Prudential Mutual Fund Services LLC (“PMFS”), an affiliate of PGIM Investments and an indirect, wholly-owned subsidiary of Prudential, serves as the transfer agent of the Portfolios. The transfer agent’s fees and expenses in the Statement of Operations include certain out-of-pocket expenses paid to non-affiliates, where applicable.
The Portfolios may invest their overnight sweep cash in the PGIM Core Ultra Short Bond Fund (the “Core Fund”) and their securities lending cash collateral in the PGIM Institutional Money Market Fund (the “Money Market Fund”), each a series of Prudential Investment Portfolios 2, registered under the 1940 Act and managed by PGIM Investments. The Portfolios may also invest in the PGIM Core Short-Term Bond Fund, pursuant to an exemptive order received from the Securities Exchange Commission (“SEC”), a series of Prudential Investment Portfolios 2 (together with PGIM Core Ultra Short Bond Fund, the “Core Funds”) registered under the 1940 Act and managed by PGIM Investments. PGIM Investments and/or its affiliates are paid fees or reimbursed for providing their services to the Core Fund and the Money Market Fund. In addition to the realized and unrealized gains on investments in the Core Funds and Money Market Fund, earnings from such investments are disclosed on the Statement of Operations as “Affiliated dividend income” and “Income from securities lending, net”, respectively.
Certain Portfolios may enter into certain securities purchase or sale transactions under Board approved Rule 17a-7 procedures. Rule 17a-7 is an exemptive rule under the 1940 Act, that subject to certain conditions, permits purchase and sale transactions among affiliated investment companies, or between an investment company and a person that is affiliated solely by reason of having a common (or affiliated) investment adviser, common directors/trustees, and/or common officers. For the year ended December 31, 2021, no 17a-7 transactions were entered into by the Portfolios.
b.) Foreign Withholding Tax Reclaims
The Portfolios are considered partnerships for tax purposes rather than regulated investment companies (RICs). As a result of their partnership status, the Portfolios are subject to higher foreign withholding tax rates on dividend
C10
and interest income in certain foreign jurisdictions and/or are subject to delays in repayment of taxes withheld by certain foreign jurisdictions (collectively, “excess withholding tax”).
Prudential instituted a process in consultation with the Series Fund’s independent trustees to reimburse the affected Portfolios for any excess withholding tax on the first business day following the pay-date of the applicable dividend or interest income event regardless of whether the excess withholding tax is due to timing differences (i.e., jurisdictions in which the Portfolio was subject to a higher withholding tax rate due to its tax status which is reclaimable) or permanent detriments (i.e., jurisdictions in which the Portfolio was subject to a higher withholding tax rate due to its tax status which is not reclaimable) resulting from the Portfolios’ partnership tax status.
In cases in which the excess withholding tax is due to timing differences and is reclaimable from the foreign jurisdiction, the affected Portfolios have the ability to recover the excess withholding tax withheld by filing a reclaim with the relevant foreign tax authority. To avoid a Portfolio receiving and retaining a duplicate payment for the same excess withholding tax, payments received by an applicable Portfolio from a foreign tax authority for reclaims for which a Portfolio previously received reimbursement from Prudential will be payable to Prudential. Pending tax reclaim amounts due to Prudential for excess withholding tax which Prudential previously paid to the Portfolios are reported as “Payable to affiliate” on the “Statement of Assets and Liabilities” and any amounts accrued but not yet reimbursed by Prudential for excess withholding tax is recorded as “Receivable from affiliate” on the Statement of Assets and Liabilities. The full amount of tax reclaims due to a Portfolio, inclusive of timing differences and routine tax reclaims for foreign jurisdictions where the Portfolios do not incur an excess withholding tax is included as “Tax reclaim receivable” on the “Statement of Assets and Liabilities.” To the extent that there are costs associated with the filing of any reclaim attributable to excess withholding tax, those costs are borne by Prudential.
The following amounts have been paid by Prudential for excess withholding taxes related to permanent tax detriments as described above for certain countries due to the Portfolios’ status as partnerships for tax purposes.
| | | | | | |
Portfolio | | 2021 Payments | | | |
PSF Global Portfolio | | | $253,438 | |
PSF PGIM 50/50 Balanced Portfolio | | | 23,037 | |
PSF PGIM Flexible Managed Portfolio | | | 58,563 | |
The following amounts have been paid by Prudential for excess withholding taxes related to timing differences as described above for certain countries due to the Portfolios’ status as partnerships for tax purposes.
| | | | | | |
Portfolio | | 2021 Payments | | | |
PSF Global Portfolio | | | $ 79,084 | |
PSF PGIM 50/50 Balanced Portfolio | | | 13,928 | |
PSF PGIM Jennison Blend Portfolio | | | 116,956 | |
5. Portfolio Securities
The aggregate cost of purchases and proceeds from sales of portfolio securities (excluding short-term investments and U.S. Government securities) for the year ended December 31, 2021, were as follows:
| | | | | | | | |
Portfolio | | Cost of
Purchases | | | Proceeds
from Sales | |
| | |
PSF Global Portfolio | | $ | 301,194,312 | | | $ | 395,220,909 | |
PSF PGIM 50/50 Balanced Portfolio | | | 1,643,412,230 | | | | 1,825,051,828 | |
PSF PGIM Flexible Managed Portfolio | | | 5,296,904,428 | | | | 5,572,887,440 | |
PSF PGIM Government Income Portfolio | | | 432,848,251 | | | | 466,507,148 | |
PSF PGIM Jennison Blend Portfolio | | | 1,729,577,717 | | | | 2,164,483,647 | |
PSF PGIM Total Return Bond Portfolio | | | 474,073,462 | | | | 542,499,635 | |
PSF Stock Index Portfolio | | | 250,788,093 | | | | 129,100,095 | |
A summary of the cost of purchases and proceeds from sales of shares of affiliated mutual funds for the year ended December 31, 2021, is presented as follows:
C11
| | | | | | | | | | | | | | | | | | | | | | | | | | | | | | | | | | | |
| PSF Global Portfolio | | | | | | | | | | | | | | | | | | | | | | | | | | |
| | | | | | | |
Value, Beginning of Year | | Cost of
Purchases | | Proceeds
from Sales | | Change in
Unrealized
Gain
(Loss) | | Realized
Gain
(Loss) | | Value,
End of Year | | Shares,
End of Year | | Income |
| | |
Short-Term Investments - Affiliated Mutual Funds: | | | | | | | | | | | |
| | | | | |
PGIM Core Ultra Short Bond Fund(1)(wa) | | | | | | | | | | | | | | | | | | | | | | | | | | |
| | | | | | | |
$ 26,392,925 | | | $ | 241,332,695 | | | | $ | 234,082,933 | | | | $ | — | | | | $ | — | | | | $ | 33,642,687 | | | | | 33,642,687 | | | | $ | 37,078 | |
| |
PGIM Institutional Money Market Fund(1)(b)(wa) | | | | | | |
17,555,978 | | | | 357,102,274 | | | | | 356,876,177 | | | | | (1,128 | ) | | | | (7,918 | ) | | | | 17,773,029 | | | | | 17,785,479 | | | | | 18,308 | (2) |
| | | | | | | | | | | | | | | | | | | | | | | | | | | | | | | | | | | |
| | | | | | | |
$ 43,948,903 | | | $ | 598,434,969 | | | | $ | 590,959,110 | | | | $ | (1,128 | ) | | | $ | (7,918 | ) | | | $ | 51,415,716 | | | | | | | | | $ | 55,386 | |
| | | | | | | | | | | | | | | | | | | | | | | | | | | | | | | | | | | |
| | | | |
| PSF PGIM 50/50 Balanced Portfolio | | | | | | | | | | | | | | | | | | | | | |
Value, Beginning of Year | | Cost of
Purchases | | Proceeds
from Sales | | Change in
Unrealized
Gain
(Loss) | | Realized
Gain
(Loss) | | Value,
End of Year | | Shares,
End
of Year | | Income |
| | | | |
| Short-Term Investments - Affiliated Mutual Funds: | | | | | | | | | | | | | | | | | | | | | |
| | | | |
PGIM Core Ultra Short Bond Fund(1)(wa) | | | | | | | | | | | | | | | | | | | | | |
$ 386,462,547 | | | $ | 628,786,523 | | | | $ | 651,850,559 | | | | $ | — | | | | $ | — | | | | $ | 363,398,511 | | | | | 363,398,511 | | | | $ | 484,263 | |
| | | | |
PGIM Institutional Money Market Fund(1)(b)(wa) | | | | | | | | | | | | | | | | | | | | | |
72,964,955 | | | | 436,845,054 | | | | | 474,266,423 | | | | | (23,300 | ) | | | | 12,763 | | | | | 35,533,049 | | | | | 35,557,940 | | | | | 33,122 | (2) |
| | | | | | | | | | | | | | | | | | | | | | | | | | | | | | | | | | | |
$ 459,427,502 | | | $ | 1,065,631,577 | | | | $ | 1,126,116,982 | | | | $ | (23,300 | ) | | | $ | 12,763 | | | | $ | 398,931,560 | | | | | | | | | $ | 517,385 | |
| | | | | | | | | | | | | | | | | | | | | | | | | | | | | | | | | | | |
| | | |
| PSF PGIM Flexible Managed Portfolio | | | | | | | | | | | | | | | | |
Value, Beginning of Year | | Cost of
Purchases | | Proceeds
from Sales | | Change in
Unrealized
Gain
(Loss) | | Realized
Gain
(Loss) | | Value, End of Year | | Shares, End of Year | | Income |
| | | | |
| Short-Term Investments - Affiliated Mutual Funds: | | | | | | | | | | | | | | | | | | | | | |
| | | | |
PGIM Core Ultra Short Bond Fund(1)(wa) | | | | | | | | | | | | | | | | | | | | | |
| | | | | | | |
$ 353,385,879 | | | $ | 1,060,514,449 | | | | $ | 1,110,059,692 | | | | $ | — | | | | $ | — | | | | $ | 303,840,636 | | | | | 303,840,636 | | | | $ | 398,720 | |
| | | | |
PGIM Institutional Money Market Fund(1)(b)(wa) | | | | | | | | | | | | | | | | | | | | | |
| | | | | | | |
41,097,233 | | | | 442,581,663 | | | | | 438,150,871 | | | | | (11,193 | ) | | | | (976 | ) | | | | 45,515,856 | | | | | 45,547,739 | | | | | 26,839 | (2) |
| | | | | | | | | | | | | | | | | | | | | | | | | | | | | | | | | | | |
| | | | | | | |
$ 394,483,112 | | | $ | 1,503,096,112 | | | | $ | 1,548,210,563 | | | | $ | (11,193 | ) | | | $ | (976 | ) | | | $ | 349,356,492 | | | | | | | | | $ | 425,559 | |
| | | | | | | | | | | | | | | | | | | | | | | | | | | | | | | | | | | |
| | | |
| PSF PGIM Government Income Portfolio | | | | | | | | | | | | | | | | |
Value, Beginning of Year | | Cost of Purchases | | Proceeds from Sales | | Change in Unrealized Gain (Loss) | | Realized Gain (Loss) | | Value, End of Year | | Shares, End of Year | | Income |
| | | |
| Short-Term Investments - Affiliated Mutual Funds: | | | | | | | | | | | | | | | | |
| | | |
PGIM Core Ultra Short Bond Fund(1)(wa) | | | | | | | | | | | | | | | | |
| | | | | | | |
$ 33,734,048 | | | $ | 101,496,786 | | | | $ | 127,310,985 | | | | $ | — | | | | $ | — | | | | $ | 7,919,849 | | | | | 7,919,849 | | | | $ | 15,877 | |
| | | |
PGIM Institutional Money Market Fund(1)(b)(wa) | | | | | | | | | | | | | | | | |
| | | | | | | |
— | | | | 70,452,299 | | | | | 70,449,950 | | | | | — | | | | | (2,349 | ) | | | | — | | | | | — | | | | | 3,172 | (2) |
| | | | | | | | | | | | | | | | | | | | | | | | | | | | | | | | | | | |
| | | | | | | |
$ 33,734,048 | | | $ | 171,949,085 | | | | $ | 197,760,935 | | | | $ | — | | | | $ | (2,349 | ) | | | $ | 7,919,849 | | | | | | | | | $ | 19,049 | |
| | | | | | | | | | | | | | | | | | | | | | | | | | | | | | | | | | | |
C12
| | | | | | | | | | | | | | | | | | | | | | | | | | | | |
| PSF PGIM Jennison Blend Portfolio | | | | | | | | | | | | | |
| | | | | | | |
Value, Beginning of Year | | Cost of Purchases | | | Proceeds from Sales | | | Change in Unrealized Gain (Loss) | | | Realized Gain (Loss) | | | Value, End of Year | | | Shares, End of Year | | | Income | |
| | | |
| Short-Term Investments - Affiliated Mutual Funds: | | | | | | | | | | | | | |
| | | |
PGIM Core Ultra Short Bond Fund(1)(wa) | | | | | | | | | | | | | |
| | | | | | | |
$ 34,536,497 | | $ | 889,364,039 | | | $ | 827,051,638 | | | $ | — | | | $ | — | | | $ | 96,848,898 | | | | 96,848,898 | | | $ | 76,374 | |
| | | |
PGIM Institutional Money Market Fund(1)(b)(wa) | | | | | | | | | | | | | |
509,328,849 | | | 1,981,119,237 | | | | 2,366,185,047 | | | | (59,699 | ) | | | 14,239 | | | | 124,217,579 | | | | 124,304,592 | | | | 162,842(2 | ) |
| | | | | | | | | | | | | | | | | | | | | | | | | | | | |
| | | | | | | |
$ 543,865,346 | | $ | 2,870,483,276 | | | $ | 3,193,236,685 | | | $ | (59,699 | ) | | $ | 14,239 | | | $ | 221,066,477 | | | | | | | $ | 239,216 | |
| | | | | | | | | | | | | | | | | | | | | | | | | | | | |
| | | | |
| PSF PGIM Total Return Bond Portfolio | | | | | | | | | | | | | | | | | |
Value, Beginning of Year | | Cost of
Purchases | | | Proceeds
from Sales | | | Change in
Unrealized
Gain
(Loss) | | | Realized
Gain
(Loss) | | | Value,
End of Year | | | Shares,
End
of Year | | | Income | |
| | |
| Short-Term Investments - Affiliated Mutual Funds: | | | | | | | | | |
| |
PGIM Core Ultra Short Bond Fund(1)(wa) | | | | | |
$ 14,079,089 | | $ | 404,090,685 | | | $ | 407,350,172 | | | $ | — | | | $ | — | | | $ | 10,819,602 | | | | 10,819,602 | | | $ | 40,278 | |
| |
PGIM Institutional Money Market Fund(1)(b)(wa) | | | | | |
44,065,963 | | | 246,205,328 | | | | 251,645,886 | | | | (3,038 | ) | | | (6,817 | ) | | | 38,615,550 | | | | 38,642,600 | | | | 26,283(2 | ) |
| | | | | | | | | | | | | | | | | | | | | | | | | | | | |
| | | | | | | |
$ 58,145,052 | | $ | 650,296,013 | | | $ | 658,996,058 | | | $ | (3,038 | ) | | $ | (6,817 | ) | | $ | 49,435,152 | | | | | | | $ | 66,561 | |
| | | | | | | | | | | | | | | | | | | | | | | | | | | | |
|
| PSF Stock Index Portfolio | |
Value, Beginning of Year | | Cost of Purchases | | | Proceeds from Sales | | | Change in Unrealized Gain (Loss) | | | Realized Gain (Loss) | | | Value, End of Year | | | Shares, End of Year | | | Income | |
|
| Short-Term Investments - Affiliated Mutual Funds: | |
|
PGIM Core Ultra Short Bond Fund(1)(wa) | |
$ 110,777,275 | | $ | 265,283,153 | | | $ | 231,492,948 | | | $ | — | | | $ | — | | | $ | 144,567,480 | | | | 144,567,480 | | | $ | 167,751 | |
|
PGIM Institutional Money Market Fund(1)(b)(wa) | |
215,854,846 | | | 2,710,551,206 | | | | 2,671,232,125 | | | | (11,492 | ) | | | (47,221 | ) | | | 255,115,214 | | | | 255,293,920 | | | | 143,230 | (2) |
| | | | | | | | | | | | | | | | | | | | | | | | | | | | |
| | | | | | | |
$ 326,632,121 | | $ | 2,975,834,359 | | | $ | 2,902,725,073 | | | $ | (11,492 | ) | | $ | (47,221 | ) | | $ | 399,682,694 | | | | | | | $ | 310,981 | |
| | | | | | | | | | | | | | | | | | | | | | | | | | | | |
| (1) | The Fund did not have any capital gain distributions during the reporting period. |
| (2) | The amount, or a portion thereof, represents the affiliated securities lending income shown on the Statement of Operations. |
| (b) | Represents security, or portion thereof, purchased with cash collateral received for securities on loan and includes dividend reinvestment. |
| (wa) | PGIM Investments LLC, the manager of the Portfolio, also serves as manager of the PGIM Core Ultra Short Bond Fund and PGIM Institutional Money Market Fund, if applicable. |
6. Tax Information
All Portfolios are treated as partnerships for federal income tax purposes. The character of the cash distributions, if any, made by the partnerships is generally classified as nontaxable return of capital distributions.After each fiscal year each shareholder of record will receive information regarding their distributive allocable share of the partnership’s income, gains, losses and deductions.
With respect to the Portfolios, book cost of assets differs from tax cost of assets as a result of each Portfolio’s adoption of a mark-to-market method of accounting for tax purposes. Under this method, tax cost of assets will approximate fair market value.
The Manager has analyzed the Portfolios’ tax positions taken on federal, state and local income tax returns for all open tax years and has concluded that no provision for income tax is required in the Portfolios’ financial statements for the current reporting period. Since tax authorities can examine previously filed tax returns, the Portfolios’ U.S. federal and state tax returns for each of the four fiscal years up to the most recent fiscal year ended December 31, 2021 are subject to such review.
C13
7. Borrowings
The Series Fund, on behalf of the Portfolios, (excluding the Government Money Market Portfolio), along with other affiliated registered investment companies (the “Participating Funds”), is a party to a Syndicated Credit Agreement (“SCA”) with a group of banks. The purpose of the SCA is to provide an alternative source of temporary funding for capital share redemptions. The table below provides details of the current SCA in effect at the reporting period-end as well as the prior SCA.
| | | | |
| | Current SCA | | Prior SCA |
Term of Commitment | | 10/1/2021 –9/29/2022 | | 10/2/2020 – 9/30/2021 |
Total Commitment | | $1,200,000,000 | | $1,200,000,000 |
| Annualized Commitment Fee on the Unused Portion of the SCA | | 0.15% | | 0.15% |
| Annualized Interest Rate on Borrowings | | 1.20% plus the higher of
(1) the effective federal
funds rate, (2) the
one-month LIBOR rate or
(3) zero percent | | 1.30% plus the higher of
(1) the effective federal
funds rate, (2) the
one-month LIBOR rate or
(3) zero percent |
Certain affiliated registered investment companies that are parties to the SCA include portfolios that are subject to a predetermined mathematical formula used to manage certain benefit guarantees offered under variable annuity contracts. The formula may result in large scale asset flows into and out of these portfolios. Consequently, these portfolios may be more likely to utilize the SCA for purposes of funding redemptions. It may be possible for those portfolios to fully exhaust the committed amount of the SCA, thereby requiring the Manager to allocate available funding per a Board-approved methodology designed to treat the Participating Funds in the SCA equitably.
The following Portfolio utilized the SCA during the year ended December 31, 2021. The average balance outstanding is for the number of days the Portfolio utilized the credit facility.
| | | | | | | | | | | | | | |
Portfolio | | Average
Balance
Outstanding | | | Weighted
Average
Interest Rates | | Number
of Days
Outstanding | | Maximum
Balance
Outstanding | | | Balance
Outstanding at
December 31, 2021 |
| | | | | |
| PSF Global Portfolio | | $ | 29,831,667 | | | 1.41% | | 3 | | $ | 40,063,000 | | | $— |
8. Capital and Ownership
The Agreement and Declaration of Trust permits the Trust’s Board of Trustees to issue multiple classes of shares, and within each class, an unlimited number of shares of beneficial interest of the Portfolios. The Portfolios offer Class I shares and certain Portfolios offer Class II and/or Class III shares. All share classes are not subject to any sales charge or redemption charge and are sold at the net asset value of the Portfolio. Class I and Class III shares are sold only to certain separate accounts of Prudential to fund benefits under certain variable life insurance and variable annuity contracts (“contracts”). Class II shares are sold only to separate accounts of non-Prudential insurance companies as investment options under certain contracts. Class I shares are also offered to separate accounts of non-affiliated insurers for which Prudential or its affiliates administer and/or reinsure the variable life insurance or variable annuity contracts issued in connection with the separate accounts. The separate accounts invest in shares of the Portfolios through subaccounts that correspond to the Portfolios. The separate accounts will redeem shares of the Portfolios to the extent necessary to provide benefits under the contracts or for such other purposes as may be consistent with the contracts.
As of December 31, 2021, the following number of shares of the Portfolios were owned of record directly or by other Portfolios as part of their investments by insurance affiliates of Prudential.
| | | | | | | | |
| Portfolio | | Number of Shares | | Percentage of Outstanding Shares |
PSF Global Portfolio–Class I | | | 26,726,710 | | | | | 100.0% |
PSF Global Portfolio–Class III | | | 3,297 | | | | | 100.0 |
PSF PGIM 50/50 Balanced Portfolio–Class I | | | 73,017,679 | | | | | 100.0 |
PSF PGIM 50/50 Balanced Portfolio–Class III | | | 67,274 | | | | | 100.0 |
PSF PGIM Flexible Managed Portfolio–Class I | | | 112,550,776 | | | | | 100.0 |
C14
| | | | | | | | |
| Portfolio | | Number of Shares | | Percentage of Outstanding Shares |
PSF PGIM Flexible Managed Portfolio–Class III | | | 45,575 | | | | | 100.0% |
PSF PGIM Government Income Portfolio–Class I | | | 15,876,046 | | | | | 100.0 |
PSF PGIM Government Income Portfolio–Class III | | | 23,249 | | | | | 100.0 |
PSF PGIM Government Money Market Portfolio–Class I | | | 72,451,658 | | | | | 99.9 |
PSF PGIM Government Money Market Portfolio–Class III | | | 14,399,507 | | | | | 100.0 |
PSF PGIM Jennison Blend Portfolio–Class I | | | 65,033,111 | | | | | 100.0 |
PSF PGIM Jennison Blend Portfolio–Class III | | | 6,534 | | | | | 100.0 |
PSF PGIM Total Return Bond Portfolio–Class I | | | 81,637,086 | | | | | 98.5 |
PSF PGIM Total Return Bond Portfolio–Class III | | | 350,850 | | | | | 100.0 |
PSF Stock Index Portfolio–Class I | | | 64,423,330 | | | | | 100.0 |
PSF Stock Index Portfolio–Class III | | | 149,371 | | | | | 100.0 |
The following number of shareholders of record, each holding greater than 5% of the Portfolio, held the following percentage of outstanding shares, on behalf of multiple beneficial owners:
| | | | | | | | |
| | | |
| | | Affiliated | | Unaffiliated |
| | | | | |
| Portfolio | | Number of
Shareholders | | Percentage of
Outstanding Shares | | Number of
Shareholders | | Percentage of
Outstanding Shares |
| | | | | |
PSF Global Portfolio | | 2 | | 97.6% | | — | | —% |
| | | | | |
PSF PGIM 50/50 Balanced Portfolio | | 3 | | 100.0 | | — | | — |
| | | | | |
PSF PGIM Flexible Managed Portfolio | | 3 | | 100.0 | | — | | — |
| | | | | |
PSF PGIM Government Income Portfolio | | 2 | | 98.4 | | — | | — |
| | | | | |
PSF PGIM Government Money Market Portfolio | | 4 | | 99.9 | | — | | — |
| | | | | |
PSF PGIM Jennison Blend Portfolio | | 3 | | 99.9 | | — | | — |
| | | | | |
PSF PGIM Total Return Bond Portfolio | | 3 | | 98.5 | | — | | — |
| | | | | |
PSF Stock Index Portfolio | | 3 | | 100.0 | | — | | — |
Transactions in shares of beneficial interest of the Portfolios were as follows:
PSF Global Portfolio
| | | | | | | | |
Class I: | | Shares | | | Amount | |
Year ended December 31, 2021: | | | | | | | | |
Portfolio shares sold | | | 331,454 | | | $ | 17,649,681 | |
Portfolio shares purchased | | | (2,257,822 | ) | | | (119,301,279 | ) |
| | | | | | | | |
Net increase (decrease) in shares outstanding | | | (1,926,368 | ) | | $ | (101,651,598 | ) |
| | | | | | | | |
Year ended December 31, 2020: | | | | | | | | |
Portfolio shares sold | | | 386,642 | | | $ | 15,803,644 | |
Portfolio shares purchased | | | (2,188,536 | ) | | | (86,119,207 | ) |
| | | | | | | | |
Net increase (decrease) in shares outstanding | | | (1,801,894 | ) | | $ | (70,315,563 | ) |
| | | | | | | | |
| | |
Class III: | | | | | | |
Period ended December 31, 2021*: | | | | | | | | |
Portfolio shares sold | | | 3,343 | | | $ | 183,467 | |
Portfolio shares purchased | | | (46 | ) | | | (2,584 | ) |
| | | | | | | | |
Net increase (decrease) in shares outstanding | | | 3,297 | | | $ | 180,883 | |
| | | | | | | | |
| * | Commencement of offering was April 26, 2021. |
C15
PSF PGIM 50/50 Balanced Portfolio
| | | | | | | | |
Class I: | | Shares | | | Amount | |
Year ended December 31, 2021: | | | | | | | | |
Portfolio shares sold | | | 382,552 | | | $ | 14,110,839 | |
Portfolio shares purchased | | | (4,825,082 | ) | | | (179,267,581 | ) |
| | | | | | | | |
Net increase (decrease) in shares outstanding | | | (4,442,530 | ) | | $ | (165,156,742 | ) |
| | | | | | | | |
Year ended December 31, 2020: | | | | | | | | |
Portfolio shares sold | | | 401,718 | | | $ | 12,730,292 | |
Portfolio shares purchased | | | (5,642,700 | ) | | | (179,703,549 | ) |
| | | | | | | | |
Net increase (decrease) in shares outstanding | | | (5,240,982 | ) | | $ | (166,973,257 | ) |
| | | | | | | | |
Class III: | | | | | | |
Period ended December 31, 2021*: | | | | | | | | |
Portfolio shares sold | | | 67,888 | | | $ | 2,606,087 | |
Portfolio shares purchased | | | (614 | ) | | | (23,805 | ) |
| | | | | | | | |
Net increase (decrease) in shares outstanding | | | 67,274 | | | $ | 2,582,282 | |
| | | | | | | | |
| * | Commencement of offering was April 26, 2021. |
PSF PGIM Flexible Managed Portfolio
| | | | | | | | |
Class I: | | Shares | | | Amount | |
Year ended December 31, 2021: | | | | | | | | |
Portfolio shares sold | | | 205,431 | | | $ | 8,283,511 | |
Portfolio shares purchased | | | (6,737,839 | ) | | | (277,035,778 | ) |
| | | | | | | | |
Net increase (decrease) in shares outstanding | | | (6,532,408 | ) | | $ | (268,752,267 | ) |
| | | | | | | | |
Year ended December 31, 2020: | | | | | | | | |
Portfolio shares sold | | | 273,315 | | | $ | 8,597,942 | |
Portfolio shares purchased | | | (7,294,813 | ) | | | (249,244,194 | ) |
| | | | | | | | |
Net increase (decrease) in shares outstanding | | | (7,021,498 | ) | | $ | (240,646,252 | ) |
| | | | | | | | |
Class III: | | | | | | |
| | |
Period ended December 31, 2021*: | | | | | | | | |
Portfolio shares sold | | | 46,517 | | | $ | 1,981,439 | |
Portfolio shares purchased | | | (942) | | | | (40,576 | ) |
| | | | | | | | |
Net increase (decrease) in shares outstanding | | | 45,575 | | | $ | 1,940,863 | |
| | | | | | | | |
| * | Commencement of offering was April 26, 2021. |
PSF PGIM Government Income Portfolio
| | | | | | | | |
Class I: | | Shares | | | Amount | |
| | |
Year ended December 31, 2021: | | | | | | | | |
Portfolio shares sold | | | 241,234 | | | $ | 3,421,573 | |
Portfolio shares purchased | | | (1,340,149 | ) | | | (19,017,186 | ) |
| | | | | | | | |
Net increase (decrease) in shares outstanding | | | (1,098,915 | ) | | $ | (15,595,613 | ) |
| | | | | | | | |
|
Year ended December 31, 2020: | |
Portfolio shares sold | | | 1,083,338 | | | $ | 15,481,186 | |
Portfolio shares purchased | | | (1,725,391 | ) | | | (24,541,321 | ) |
| | | | | | | | |
Net increase (decrease) in shares outstanding | | | (642,053 | ) | | $ | (9,060,135 | ) |
| | | | | | | | |
C16
| | | | | | | | |
Class III: | | | Shares | | | | Amount | |
| | |
Period ended December 31, 2021*: | | | | | | | | |
Portfolio shares sold | | | 25,257 | | | $ | 358,644 | |
Portfolio shares purchased | | | (2,008 | ) | | | (28,305 | ) |
| | | | | | | | |
Net increase (decrease) in shares outstanding | | | 23,249 | | | $ | 330,339 | |
| | | | | | | | |
| * | Commencement of offering was April 26, 2021. |
PSF PGIM Government Money Market Portfolio
| | | | | | | | |
Class I: | | Shares | | | Amount | |
| | |
Year ended December 31, 2021: | | | | | | | | |
Portfolio shares sold | | | 81,112,748 | | | $ | 811,127,478 | |
Shares issued in reinvestment of dividends and distributions | | | 33,163 | | | | 331,630 | |
Portfolio shares purchased | | | (87,878,545 | ) | | | (878,785,449 | ) |
| | | | | | | | |
Net increase (decrease) in shares outstanding | | | (6,732,634 | ) | | $ | (67,326,341 | ) |
| | | | | | | | |
| | |
Year ended December 31, 2020: | | | | | | | | |
Portfolio shares sold | | | 70,339,155 | | | $ | 703,391,553 | |
Shares issued in reinvestment of dividends and distributions | | | 179,185 | | | | 1,791,854 | |
Portfolio shares purchased | | | (51,256,624 | ) | | | (512,566,244 | ) |
| | | | | | | | |
Net increase (decrease) in shares outstanding | | | 19,261,716 | | | $ | 192,617,163 | |
| | | | | | | | |
| |
Class III: | | | |
| | |
Year ended December 31, 2021: | | | | | | | | |
Portfolio shares sold | | | 30,778,884 | | | $ | 307,788,840 | |
Shares issued in reinvestment of dividends and distributions | | | 5,015 | | | | 50,145 | |
Portfolio shares purchased | | | (22,945,609 | ) | | | (229,456,084 | ) |
| | | | | | | | |
Net increase (decrease) in shares outstanding | | | 7,838,290 | | | $ | 78,382,901 | |
| | | | | | | | |
| | |
Period ended December 31, 2020*: | | | | | | | | |
Portfolio shares sold | | | 14,739,505 | | | $ | 147,395,045 | |
Shares issued in reinvestment of dividends and distributions | | | 9 | | | | 87 | |
Portfolio shares purchased | | | (8,178,297 | ) | | | (81,782,967 | ) |
| | | | | | | | |
Net increase (decrease) in shares outstanding | | | 6,561,217 | | | $ | 65,612,165 | |
| | | | | | | | |
| * | Commencement of offering was May 18, 2020. |
PSF PGIM Jennison Blend Portfolio
| | | | | | | | |
Class I: | | Shares | | | Amount | |
Year ended December 31, 2021: | | | | | | | | |
Portfolio shares sold | | | 90,980 | | | $ | 8,234,342 | |
Portfolio shares purchased | | | (4,653,123 | ) | | | (419,514,499 | ) |
| | | | | | | | |
Net increase (decrease) in shares outstanding | | | (4,562,143 | ) | | $ | (411,280,157 | ) |
| | | | | | | | |
Year ended December 31, 2020: | | | | | | | | |
Portfolio shares sold | | | 181,520 | | | $ | 10,472,312 | |
Portfolio shares purchased | | | (5,150,263 | ) | | | (344,048,385 | ) |
| | | | | | | | |
Net increase (decrease) in shares outstanding | | | (4,968,743 | ) | | $ | (333,576,073 | ) |
| | | | | | | | |
C17
| | | | | | | | |
Class II: | | Shares | | | Amount | |
Year ended December 31, 2021: | | | | | | | | |
Portfolio shares sold | | | 61 | | | $ | 5,684 | |
Portfolio shares purchased | | | (789 | ) | | | (70,000 | ) |
| | | | | | | | |
Net increase (decrease) in shares outstanding | | | (728 | ) | | $ | (64,316 | ) |
| | | | | | | | |
Year ended December 31, 2020: | | | | | | | | |
Portfolio shares sold | | | 278 | | | $ | 21,699 | |
Portfolio shares purchased | | | (3,338 | ) | | | (215,385 | ) |
| | | | | | | | |
Net increase (decrease) in shares outstanding | | | (3,060 | ) | | $ | (193,686 | ) |
| | | | | | | | |
Class III: | | | | | | |
Period ended December 31, 2021*: | | | | | | | | |
Portfolio shares sold | | | 6,859 | | | $ | 653,908 | |
Portfolio shares purchased | | | (325 | ) | | | (31,592 | ) |
| | | | | | | | |
Net increase (decrease) in shares outstanding | | | 6,534 | | | $ | 622,316 | |
| | | | | | | | |
| * | Commencement of offering was April 26, 2021. |
PSF PGIM Total Return Bond Portfolio
| | | | | | | | |
Class I: | | Shares | | | Amount | |
Year ended December 31, 2021: | | | | | | | | |
Portfolio shares sold | | | 6,877,466 | | | $ | 106,051,566 | |
Portfolio shares purchased | | | (5,936,458 | ) | | | (92,126,262 | ) |
| | | | | | | | |
| | |
Net increase (decrease) in shares outstanding | | | 941,008 | | | $ | 13,925,304 | |
| | | | | | | | |
| | |
Year ended December 31, 2020: | | | | | | | | |
Portfolio shares sold | | | 7,159,168 | | | $ | 108,389,140 | |
Portfolio shares purchased | | | (7,041,212 | ) | | | (106,131,559 | ) |
| | | | | | | | |
| | |
Net increase (decrease) in shares outstanding | | | 117,956 | | | $ | 2,257,581 | |
| | | | | | | | |
| | |
Class III: | | | | | | |
| | |
Period ended December 31, 2021*: | | | | | | | | |
Portfolio shares sold | | | 362,146 | | | $ | 5,648,820 | |
Portfolio shares purchased | | | (11,296 | ) | | | (176,793 | ) |
| | | | | | | | |
| | |
Net increase (decrease) in shares outstanding | | | 350,850 | | | $ | 5,472,027 | |
| | | | | | | | |
| * | Commencement of offering was April 26, 2021. |
PSF Stock Index Portfolio
| | | | | | | | |
Class I: | | Shares | | | Amount | |
Year ended December 31, 2021: | | | | | | | | |
Portfolio shares sold | | | 3,091,067 | | | $ | 309,426,880 | |
Portfolio shares purchased | | | (2,782,213 | ) | | | (276,133,548 | ) |
| | | | | | | | |
Net increase (decrease) in shares outstanding | | | 308,854 | | | $ | 33,293,332 | |
| | | | | | | | |
| | |
Year ended December 31, 2020: | | | | | | | | |
Portfolio shares sold | | | 3,906,549 | | | $ | 296,701,054 | |
Portfolio shares purchased | | | (3,862,546 | ) | | | (290,448,745 | ) |
| | | | | | | | |
Net increase (decrease) in shares outstanding | | | 44,003 | | | $ | 6,252,309 | |
| | | | | | | | |
C18
| | | | | | | | |
Class III: | | Shares | | | Amount | |
Period ended December 31, 2021: | | | | | | | | |
Portfolio shares sold | | | 150,911 | | | $ | 15,703,185 | |
Portfolio shares purchased | | | (1,540 | ) | | | (165,377 | ) |
| | | | | | | | |
Net increase (decrease) in shares outstanding | | | 149,371 | | | $ | 15,537,808 | |
| | | | | | | | |
| * | Commencement of offering was April 26, 2021. |
9. Risks of Investing in the Portfolios
The Portfolios’ risks include, but are not limited to, some or all of the risks discussed below. For further information on the risks applicable to any given Portfolio, please refer to the Prospectus and Statement of Additional Information of that Portfolio.
Adjustable and Floating-Rate Securities Risk: The value of adjustable and floating-rate securities may lag behind the value of fixed-rate securities when interest rates change. Variable and floating-rate bonds are subject to credit risk, market risk and interest rate risk. In addition, the absence of an active market for these securities could make it difficult for the Portfolio to dispose of them if the issuer defaults.
Asset-Backed and/or Mortgage-Backed Securities Risk: Asset-backed and mortgage-backed securities are fixed income securities that represent an interest in an underlying pool of assets, such as credit card receivables or, in the case of mortgage-backed securities, mortgage loans. Like fixed income securities, asset-backed and mortgage-backed securities are subject to interest rate risk, liquidity risk, and credit risk, which may be heightened in connection with investments in loans to “subprime” borrowers. Certain asset-backed and mortgage-backed securities are subject to the risk that those obligations will be repaid sooner than expected or later than expected, either of which may result in lower-than-expected returns. Mortgage-backed securities, because they are backed by mortgage loans, are also subject to risks related to real estate, and securities backed by private-issued mortgages may experience higher rates of default on the underlying mortgages than securities backed by government-issued mortgages.
Blend Style Risk: The Portfolio’s blend investment style may subject the Portfolio to risks of both value and growth investing. The portion of the Portfolio’s portfolio that makes investments pursuant to a growth strategy may be subject to above-average fluctuations as a result of seeking high-quality stocks with good future growth prospects. The portion of the Portfolio’s portfolio that makes investments pursuant to a value strategy may be subject to the risk that the market may not recognize a security’s intrinsic value for long periods of time or that a stock judged to be undervalued may actually be appropriately priced. Issuers of value stocks may have experienced adverse business developments or may be subject to special risks that have caused the stock to be out of favor. If the Portfolio’s assessment of market conditions or a company’s value is inaccurate, the Portfolio could suffer losses or produce poor performance relative to other funds. Historically, growth stocks have performed best during later stages of economic expansion and value stocks have performed best during periods of economic recovery. Therefore, both styles may over time go in and out of favor with the markets. At times when a style is out of favor, that portion of the portfolio may lag the other portion of the portfolio, which may cause the overall Portfolio to underperform the market in general, its benchmark and other mutual funds. Growth and value stocks have historically produced similar long-term results, though each category has periods when it outperforms the other.
Credit Risk: This is the risk that the issuer, the guarantor or the insurer of a fixed income security, or the counterparty to a contract, may be unable or unwilling to make timely principal and interest payments, or to otherwise honor its obligations. Additionally, fixed income securities could lose value due to a loss of confidence in the ability of the issuer, guarantor, insurer or counterparty to pay back debt. The lower the credit quality of a bond, the more sensitive it is to credit risk.
Derivatives Risk: A derivative is a financial contract, the value of which depends upon, or is derived from, the value of one or more underlying investments, such as an asset, reference rate, or index. The use of derivatives is a highly specialized activity that involves a variety of risks in addition to and greater than those associated with investing directly in securities, including the risk that: the party on the other side of a derivative transaction will be unable to honor its financial obligation; leverage created by investing in derivatives may result in losses to the Portfolio; derivatives may be difficult or impossible for the Portfolio to buy or sell at an opportune time or price, and may be difficult to terminate or otherwise offset; derivatives used for hedging may reduce or magnify losses but also may
C19
reduce or eliminate gains; and the price of commodity-linked derivatives may be more volatile than the prices of traditional equity and debt securities.
Economic and Market Events Risk: Events in the U.S. and global financial markets, including actions taken by the U.S. Federal Reserve or foreign central banks to stimulate or stabilize economic growth, may at times result in periods of unusually high volatility in a market or a segment of a market, which could negatively impact performance. Reduced liquidity in credit and fixed income markets could adversely affect issuers worldwide.
Equity Securities Risk: The value of a particular stock or equity-related security held by the Portfolio could fluctuate, perhaps greatly, in response to a number of factors, such as changes in the issuer’s financial condition or the value of the equity markets or a sector of those markets. Such events may result in losses to the Portfolio. In addition, due to decreases in liquidity, the Portfolio may be unable to sell its securities holdings within a reasonable time at the price it values the security or at any price.
Expense Risk: The actual cost of investing in the Portfolio may be higher than the expenses shown in the “Annual Portfolio Operating Expenses” table in the Portfolio’s prospectus for a variety of reasons, including, for example, if the Portfolio’s average net assets decrease.
Fixed Income Securities Risk: Investment in fixed income securities involves a variety of risks, including that: an issuer or guarantor of a security will be unable or unwilling to pay obligations when due; due to decreases in liquidity, the Portfolio may be unable to sell its securities holdings within a reasonable time at the price it values the security or at any price; and the Portfolio’s investment may decrease in value when interest rates rise. Volatility in interest rates and in fixed income markets may increase the risk that the Portfolio’s investment in fixed income securities will go down in value. Risks associated with changing interest rates are currently heightened because any increase or decrease may be sudden and significant, with unpredictable effects on the markets and the Portfolio’s investments. Changes in interest rates may also affect the liquidity of the Portfolio’s investments in fixed income securities.
Focus Risk: The Portfolio focuses or may focus its investments in particular countries, regions, industries, sectors, markets, or types of investments and may accumulate large positions in such areas. As a result, the Portfolio’s performance may be more sensitive to a small group of related holdings and adverse developments in such areas than a portfolio more broadly invested, although the increasing interconnectivity between economies and financial markets throughout the world increases the likelihood that events or conditions in one country or region will adversely impact markets or issuers in other countries or regions.
Foreign Investment Risk: Investments in foreign securities generally involve more risk than investments in securities of U.S. issuers, including: changes in currency exchange rates may affect the value of foreign securities held by the Portfolio; foreign markets generally are more volatile than, and generally are not subject to regulatory requirements comparable to, U.S. markets; foreign financial reporting standards usually differ from those in the U.S.; foreign exchanges are often less liquid than U.S. markets; political or social developments may adversely affect the value of foreign securities; foreign holdings may be subject to special taxation and limitations on repatriating investment proceeds; and certain events in foreign markets may adversely affect foreign and domestic issuers, including interruptions in the global supply chain, natural disasters and outbreaks of infectious diseases.
High Yield Risk: Investments in fixed income securities rated below investment grade and unrated securities of similar credit quality (i.e., high yield securities or junk bonds) may be more sensitive to interest rate, credit, call and liquidity risks than investments in investment grade securities, and have predominantly speculative characteristics.
Index Tracking Risk: The Portfolio’s ability to track the performance and/or holdings and weightings of an index with a high degree of correlation may be affected by, among other things, transaction costs and shareholder purchases and redemptions.
Interest Rate Risk: The value of your investment may go down when interest rates rise.Arise in interest rates tends to have a greater impact on the prices of longer term or duration securities. When interest rates fall, the issuers of debt obligations may prepay principal more quickly than expected, and the Portfolio may be required to reinvest the proceeds at a lower interest rate. This is referred to as “prepayment risk.” When interest rates rise, debt obligations may be repaid more slowly than expected, and the value of the Portfolio’s holdings may fall sharply. This is referred to as “extension risk.” The Portfolio currently faces a heightened level of interest rate risk because interest rates in the U.S. are at or near historic lows. Interest rates may begin to increase in the future, possibly
C20
suddenly and significantly, with unpredictable effects on the markets and the Portfolio’s investments. The Portfolio may lose money if short-term or long-term interest rates rise sharply or in a manner not anticipated by the subadviser.
Investment Style Risk: Securities held by the Portfolio as a result of a particular investment style, such as growth or value, tend to perform differently (i.e., better or worse than other segments of, or the overall, stock market) depending on market and economic conditions and investor sentiment. At times when the investment style is out of favor, the Portfolio may underperform other funds that invest in similar asset classes but use different investment styles.
Large Company Risk: Large-capitalization stocks as a group could fall out of favor with the market, causing the Portfolio to underperform investments that focus on small- or medium-capitalization stocks. Larger, more established companies may be slow to respond to challenges and may grow more slowly than smaller companies.
Liquidity and Valuation Risk: The Portfolio may hold one or more securities for which there are no or few buyers and sellers or the securities are subject to limitations on transfer. The Portfolio may be unable to sell those portfolio holdings at the desired time or price, and may have difficulty determining the value of such securities for the purpose of determining the Portfolio’s net asset value. In such cases, investments owned by the Portfolio may be valued at fair value pursuant to guidelines established by the Trust’s Board of Trustees. No assurance can be given that the fair value prices accurately reflect the value of the security. The Portfolio is subject to a liquidity risk management program, which limits the ability of the Portfolio to invest in illiquid investments.
Market and Management Risk: Markets in which the Portfolio invests may experience volatility and go down in value, and possibly sharply and unpredictably. Investment techniques, risk analyses and investment strategies, which may include quantitative models or methods, used by a subadviser in making investment decisions for the Portfolio are subject to human error and may not produce the intended or desired results. The value of the Portfolio’s investments may be negatively affected by the occurrence of domestic or global events, including war, terrorism, environmental disasters, natural disasters or events, political or civil instability, and public health emergencies (such as the spread of infectious diseases, pandemics, or epidemics), among others. Such events may reduce consumer demand or economic output, result in market closures, travel restrictions or quarantines, and significantly adversely impact the economy. There is no guarantee that the investment objective of the Portfolio will be achieved.
Market Capitalization Risk: Investing in issuers within the same market capitalization category carries the risk that the category may be out of favor due to current market conditions or investor sentiment. Because the Portfolio may invest a portion of its assets in securities issued by small-cap companies, it is likely to be more volatile than a portfolio that focuses on securities issued by larger companies. Small-sized companies often have less experienced management, narrower product lines, more limited financial resources, and less publicly available information than larger companies. In addition, smaller companies are typically more sensitive to changes in overall economic conditions and their securities may be difficult to trade.
Portfolio Turnover Risk: A Subadviser generally does not consider the length of time a Portfolio has held a particular security in making investment decisions. In fact, a Subadviser may engage in active and frequent trading on behalf of a Portfolio—that is, frequent trading of its securities—in order to take advantage of new investment opportunities or yield differentials. A Portfolio’s turnover rate may be higher than that of other mutual funds due to a Subadviser’s investment strategies and the above-referenced asset transfer programs. Portfolio turnover generally involves some expense to a Portfolio, including brokerage commissions or dealer mark-ups and other transaction costs on the sale of securities and reinvestment in other securities.
Prepayment or Call Risk: Prepayment or call risk is the risk that issuers will prepay fixed-rate obligations held by the Portfolio when interest rates fall, forcing a Portfolio to reinvest in obligations with lower interest rates than the original obligations. Mortgage-related securities and asset-backed securities are particularly subject to prepayment risk.
Quantitative Model Risk: The Portfolio and certain Underlying Portfolios, if applicable, may use quantitative models as part of its investment process. Securities or other investments selected using quantitative methods may perform differently from the market as a whole or from their expected performance for many reasons, including factors used in building the quantitative analytical framework, the weights placed on each factor, and changing sources of market returns. There can be no assurance that these methodologies will produce the desired results or enable the Portfolio to achieve its objective. A given model may be more effective with certain instruments or
C21
strategies than others, and there can be no assurance that any model can identify and incorporate all factors that will affect an investment’s price or performance.
Real Estate Risk: Investments in real estate investment trusts (REITs) and real estate-linked derivative instruments are subject to risks similar to those associated with direct ownership of real estate. Poor performance by the manager of the REIT and adverse changes to or inability to qualify with favorable tax laws will adversely affect the Portfolio. In addition, some REITs have limited diversification because they invest in a limited number of properties, a narrow geographic area, or a single type of property.
Regulatory Risk: The Portfolio is subject to a variety of laws and regulations which govern its operations. The Portfolio is subject to regulation by the SEC, and depending on the Portfolio, the Commodity Futures Trading Commission. Similarly, the businesses and other issuers of the securities and other instruments in which the Portfolio invests are also subject to considerable regulation. Changes in laws and regulations may materially impact the Portfolio, a security, business, sector or market.
U.S. Government Securities Risk: U.S. Government securities may be adversely affected by changes in interest rates, a default by, or decline in the credit quality of, the U.S. Government, and may not be backed by the full faith and credit of the U.S. Government.
Yield Risk: The amount of income received by a Portfolio will go up or down depending on day-to-day variations in short-term interest rates, and when interest rates are very low, the Portfolio’s expenses could absorb all or a significant portion of the Portfolio’s income. If interest rates increase, the Portfolio’s yield may not increase proportionately. For example, the Portfolio’s investment manager may discontinue any temporary voluntary fee limitation.
10. Recent Accounting Pronouncement and Regulatory Developments
In March 2020, the FASB issued Accounting Standard Update (“ASU”) No. 2020-04, which provides optional guidance for applying GAAP to contract modifications, hedging relationships and other transactions affected by the reference rate reform if certain criteria are met. ASU 2020-04 is elective and is effective on March 12, 2020 through December 31, 2022. Management does not expect ASU 2020-04 to have a material impact on the financial statements.
On December 3, 2020, the SEC announced that it voted to adopt a new rule that establishes an updated regulatory framework for fund valuation practices (the “Rule”). The Rule, in part, provides (i) a framework for determining fair value in good faith and (ii) provides for a fund Board’s assignment of its responsibility for the execution of valuation-related activities to a fund’s investment adviser. Further, the SEC is rescinding previously issued guidance on related issues. The Rule took effect on March 8, 2021, with a compliance date of September 8, 2022. Management is currently evaluating the Rule and its impact to the Portfolios.
11. Subsequent Event
On September 20-22, 2021, the Board of the Advanced Series Trust and the Prudential Series Fund approved the reorganization (the “Reorganization”) of AST BlackRock Corporate Bond Portfolio, AST PIMCO Corporate Bond Portfolio, AST Prudential Corporate Bond Portfolio, AST T. Rowe Price Corporate Bond Portfolio and AST Western Asset Corporate Bond Portfolio (the “Target Portfolios”) into PSF PGIM Total Return Bond Portfolio (the “Acquiring Portfolio”). The shareholders of the Target Portfolios approved the Reorganization at a meeting on January 5, 2022 and the Reorganization took place at the close of business on February 11, 2022.
C22
Report of Independent Registered Public Accounting Firm
To the Board of Trustees of Prudential Series Fund and Shareholders of PSF Global Portfolio, PSF PGIM 50/50 Balanced Portfolio, PSF PGIM Flexible Managed Portfolio, PSF PGIM Government Income Portfolio, PSF PGIM Government Money Market Portfolio, PSF PGIM Jennison Blend Portfolio, PSF PGIM Total Return Bond Portfolio and PSF Stock Index Portfolio
Opinions on the Financial Statements
We have audited the accompanying statements of assets and liabilities, including the schedules of investments, of PSF Global Portfolio, PSF PGIM 50/50 Balanced Portfolio, PSF PGIM Flexible Managed Portfolio, PSF PGIM Government Income Portfolio, PSF PGIM Government Money Market Portfolio, PSF PGIM Jennison Blend Portfolio, PSF PGIM Total Return Bond Portfolio and PSF Stock Index Portfolio (eight of the portfolios constituting Prudential Series Fund, hereafter collectively referred to as the “Portfolios”) as of December 31, 2021, the related statements of operations for the year ended December 31, 2021, the statements of changes in net assets for each of the two years in the period ended December 31, 2021, including the related notes, and the financial highlights for each of the periods indicated therein ended on or subsequent to December 31, 2020 (collectively referred to as the “financial statements”). In our opinion, the financial statements present fairly, in all material respects, the financial position of each of the Portfolios as of December 31, 2021, the results of each of their operations for the year then ended, and the changes in each of their net assets for each of the two years in the period ended December 31, 2021 and each of the financial highlights for each of the periods indicated therein ended on or subsequent to December 31, 2020 in conformity with accounting principles generally accepted in the United States of America.
The financial statements of the Portfolios as of and for the year ended December 31, 2019 and the financial highlights for each of the periods ended on or prior to December 31, 2019 (not presented herein, other than the financial highlights) were audited by other auditors whose reports dated February 14, 2020 expressed unqualified opinions on those financial statements and financial highlights.
Basis for Opinions
These financial statements are the responsibility of the Portfolios’ management. Our responsibility is to express an opinion on the Portfolios’ financial statements based on our audits. We are a public accounting firm registered with the Public Company Accounting Oversight Board (United States) (PCAOB) and are required to be independent with respect to the Portfolios in accordance with the U.S. federal securities laws and the applicable rules and regulations of the Securities and Exchange Commission and the PCAOB.
We conducted our audits of these financial statements in accordance with the standards of the PCAOB. Those standards require that we plan and perform the audit to obtain reasonable assurance about whether the financial statements are free of material misstatement, whether due to error or fraud.
Our audits included performing procedures to assess the risks of material misstatement of the financial statements, whether due to error or fraud, and performing procedures that respond to those risks. Such procedures included examining, on a test basis, evidence regarding the amounts and disclosures in the financial statements. Our audits also included evaluating the accounting principles used and significant estimates made by management, as well as evaluating the overall presentation of the financial statements. Our procedures included confirmation of securities owned as of December 31, 2021 by correspondence with the custodian, transfer agent and brokers; when replies were not received from brokers, we performed other auditing procedures. We believe that our audits provide a reasonable basis for our opinions.
/s/PricewaterhouseCoopers LLP
New York, New York
February 17, 2022
We have served as the auditor of one or more investment companies in the Prudential Insurance Portfolios complex since 2020.
D1
INFORMATION ABOUT TRUSTEES AND OFFICERS
Information about the Trustees and the officers of the Trust is set forth below.Trustees who are not deemed to be “interested persons” of the Trust, as defined in the 1940 Act, are referred to as “Independent Trustees.” Trustees who are deemed to be “interested persons” of the Trust are referred to as “Interested Trustees.” The Trustees oversee the operations of the Trust and appoint officers who are responsible for day-to-day business decisions based on policies set by the Board.
| | | | | | |
| | | | |
| Independent Trustees | | | | | | |
Name
Year of Birth
No. of Portfolios Overseen | | Principal Occupation(s) During Past Five Years | | Other Directorships Held | | Length of Board Service |
Susan Davenport Austin
1967
No. of Portfolios Overseen: 90 | | Chief Financial Officer of Grace Church School (Since September 2019); President, Candide Business Advisors, Inc. (Since 2011); formerly Senior Managing Director of Brock Capital (2014-2019); formerly Vice Chairman (2013 -2017), Senior Vice President and Chief Financial Officer (2007-2012) and Vice President of Strategic Planning and Treasurer (2002-2007) of Sheridan Broadcasting Corporation; formerly President of Sheridan Gospel Network (2004-2014). | | Director of NextEra Energy Partners, LP (NYSE: NEP) (Since February 2015); Member of the Board of Directors, Hubbard Radio, LLC (Since 2011); formerly Chairman (2011-2014), formerly Presiding Director (2014-2017) and currently a Member (2007-present) of the Board of Directors, Broadcast Music, Inc.; formerly Member of the Board of Directors, The MacDowell Colony (2010 - 2021). | | Since February 2011 |
Sherry S. Barrat
1949
No. of Portfolios Overseen: 90 | | Formerly Vice Chairman of Northern Trust Corporation (financial services and banking institution) (2011–June 2012); formerly President, Personal Financial Services, Northern Trust Corporation (2006-2010); formerly Chairman &CEO, Western US Region, Northern Trust Corporation (1999-2005); formerly President &CEO, Palm Beach/Martin County Region, Northern Trust. | | Lead Director of NextEra Energy,Inc. (NYSE: NEE) (since May 2020); Director of NextEra Energy,Inc. (since 1998); Director of Arthur J. Gallagher &Company (Since July 2013). | | Since January 2013 |
Jessica M. Bibliowicz
1959
No. of Portfolios Overseen: 90 | | Chairman of the Board of Fellows of Weill Cornell Medicine (since 2014); Formerly Chief Executive Officer (1999-2013) of National Financial Partners (independent distributor of financial services products). | | Formerly Director (2006-2019) of The Asia Pacific Fund, Inc.; Formerly Director of Sotheby’s (2014-2019) (auction house and art-related finance). | | Since September 2014 |
Kay Ryan Booth
1950
No. of Portfolios Overseen: 90 | | Trinity Investors (Since September 2014); formerly,Managing Director of Cappello Waterfield &Co. LLC (2011-2014); formerly Vice Chair,Global Research, J.P.Morgan (financial services and investment banking institution) (June 2008 – January 2009); formerly Global Director of Equity Research, Bear Stearns &Co., Inc. (financial services and investment banking institution) (1995-2008); formerly Associate Director of Equity Research, Bear Stearns &Co., Inc. (1987-1995). | | None. | | Since January 2013 |
Stephen M. Chipman
1961
No. of Portfolios Overseen: 90 | | Formerly Group Managing Director,International Expansion and Regional Managing Director,Americas of Vistra (June 2018 –June 2019); formerly Chief Executive Officer and Director of Radius (2016-2018); formerly Senior Vice Chairman (January 2015-October 2015) and Chief Executive Officer (January 2010-December 2014) of Grant Thornton LLP. | | Chairman of the Board of Auxadi Holdco, S.L. (Since February 2022); Non-Executive Director of Auxadi Holdco, S.L (Since November 2020); Non-Executive Director of Stout (Since January 2020); Formerly Non-Executive Director of Clyde &Co. (January 2020 – June 2021); Formerly Non-Executive Chairman (September 2019 – January 2021) of Litera Microsystems. | | Since January 2018 |
Robert F. Gunia
1946
No. of Portfolios Overseen: 90 | | Director of ICI Mutual Insurance Company (June 2020 -present; June 2016-June 2019; June 2012-June 2015); formerly Chief Administrative Officer (September 1999-September 2009) and Executive Vice President (December 1996-September 2009) of PGIM Investments LLC; formerly Executive Vice President (March 1999-September 2009) and Treasurer (May 2000-September 2009) of Prudential Mutual Fund Services LLC; formerly President (April 1999-December 2008) and Executive Vice President and Chief Operating Officer (December 2008-December 2009) of Prudential Investment Management Services LLC; formerly Chief Administrative Officer,Executive Vice President and Director (May 2003-September 2009) of AST Investment Services, Inc. | | Formerly Director (1989-2019) of The Asia Pacific Fund, Inc. | | Since July 2003 |
E1
| | | | | | |
| | | | |
| Independent Trustees | | | | | | |
| | | | |
Name Year of Birth No. of Portfolios Overseen | | Principal Occupation(s) During Past Five Years | | Other Directorships Held | | Length of Board Service |
| | | | |
Thomas M. O’Brien 1950 No. of Portfolios Overseen: 90 | | Chairman, Chief Executive Officer and President of Sterling Bancorp (Since June 2020); Chairman, Chief Executive Officer and President of Sterling Bank and Trust, F.S.B.; Formerly Vice Chairman of Emigrant Bank and President of its Naples Commercial Finance Division (October 2018–March 2020); formerly Director, President and CEO Sun Bancorp, Inc. N.A. (NASDAQ: SNBC) and Sun National Bank (July 2014-February 2018); formerly Consultant, Valley National Bancorp, Inc. and Valley National Bank (January 2012-June 2012); formerly President and COO (November 2006-April 2017) and CEO (April 2007-December 2011) of State Bancorp, Inc. and State Bank; formerly Vice Chairman (January 1997-April 2000) of North Fork Bank; formerly President and Chief Executive Officer (December 1984-December 1996) of North Side Savings Bank; formerly President and Chief Executive Officer (May 2000-June 2006) Atlantic Bank of New York. | | Formerly Director, Sun Bancorp, Inc. N.A. (NASDAQ: SNBC) and Sun National Bank (July 2014-February 2018); formerly Director, BankUnited, Inc. and BankUnited N.A. (NYSE: BKU) (May 2012-April 2014); formerly Director (April 2008-January 2012) of Federal Home Loan Bank of New York; formerly Director (December 1996-May 2000) of North Fork Bancorporation, Inc.; formerly Director (May 2000-April 2006) of Atlantic Bank of New York; Director (November 2006 –January 2012) of State Bancorp, Inc. (NASDAQ: STBC) and State Bank of Long Island. | | Since July 2003 |
| | | | | | |
| | | | |
| Interested Trustee | | | | | | |
| | | | |
Timothy S. Cronin 1965 Number of Portfolios Overseen: 90 | | Vice President of Prudential Annuities (Since May 2003); Senior Vice President of PGIM Investments LLC (Since May 2009); Chief Investment Officer and Strategist of Prudential Annuities (Since January 2004); Director of Investment & Research Strategy (Since February 1998); President of AST Investment Services, Inc. (Since March 2006). | | None. | | Since October 2009 |
| | | | |
| | | |
| Trust Officers(a) | | | | |
| | | |
Name Year of Birth Position with the Trust | | Principal Occupation(s) During the Past Five Years | | Length of Service as Trust Officer |
| | | |
Ken Allen 1969 Vice President | | Vice President of Investment Management (since December 2009). | | Since June 2019 |
| | | |
Claudia DiGiacomo 1974 Chief Legal Officer and Assistant Secretary | | Chief Legal Officer, Executive Vice President and Secretary of PGIM Investments LLC (since August 2020); Chief Legal Officer of Prudential Mutual Fund Services LLC (since August 2020); Chief Legal Officer of PIFM Holdco, LLC (since August 2020); Vice President and Corporate Counsel (since January 2005) of Prudential; and Corporate Counsel of AST Investment Services, Inc. (since August 2020); formerly Vice President and Assistant Secretary of PGIM Investments LLC (2005-2020); formerly Associate at Sidley Austin Brown & Wood LLP (1999-2004). | | Since December 2005 |
| | | |
Andrew R. French 1962 Secretary | | Vice President (since December 2018 - present) of PGIM Investments LLC; formerly, Vice President and Corporate Counsel (2010-2018) of Prudential; formerly Director and Corporate Counsel (2006-2010) of Prudential; Vice President and Assistant Secretary (since January 2007) of PGIM Investments LLC; Vice President and Assistant Secretary (since January 2007) of Prudential Mutual Fund Services LLC. | | Since October 2006 |
| | | |
Melissa Gonzalez 1980 Assistant Secretary | | Vice President and Corporate Counsel (since September 2018) of Prudential; Vice President and Assistant Secretary (since August 2020) of PGIM Investments LLC; formerly Director and Corporate Counsel (March 2014-September 2018) of Prudential. | | Since March 2019 |
| | | |
Patrick E. McGuinness 1986 Assistant Secretary | | Vice President and Assistant Secretary (since August 2020) of PGIM Investments LLC; Director and Corporate Counsel (since February 2017) of Prudential; and Corporate Counsel (2012 – 2017) of IIL, Inc. | | Since June 2020 |
| | | |
Debra Rubano 1975 Assistant Secretary | | Vice President and Corporate Counsel (since November 2020) of Prudential; formerly Director and Senior Counsel of Allianz Global Investors U.S. Holdings LLC (2010-2020) and Assistant Secretary of numerous funds in the Allianz fund complex (2015-2020). | | Since March 2021 |
| | | |
Dino Capasso 1974 Chief Compliance Officer | | Chief Compliance Officer (July 2019-Present) of PGIM Investments LLC; Chief Compliance Officer (July 2019-Present) of the PGIM Funds, Target Funds, Advanced Series Trust, The Prudential Series Fund, Prudential’s Gibraltar Fund, Inc., PGIM Global High Yield Fund, Inc., and PGIM High Yield Bond Fund, Inc.; Vice President and Deputy Chief Compliance Officer (June 2017-2019) of PGIM Investments LLC; formerly, Senior Vice President and Senior Counsel (January 2016-June 2017), and Vice President and Counsel (February 2012-December 2015) of Pacific Investment Management Company LLC. | | Since March 2018 |
E2
| | | | |
| | | |
| Trust Officers(a) | | | | |
| | | |
Name Year of Birth Position with the Trust | | Principal Occupation(s) During the Past Five Years | | Length of Service as Trust Officer |
| | | |
Jonathan Corbett 1983 Anti-Money Laundering Compliance Officer | | Vice President, Corporate Compliance, Global Compliance Programs and Compliance Risk Management (since August 2019) of Prudential; formerly, Vice President and Head of Key Risk Areas Compliance (March 2016 to July 2019), Chief Privacy Officer (March 2016 to July 2019) and head of Global Financial Crimes Unit (April 2014 to March 2016) at MetLife. | | Since October 2021 |
| | | |
Christian J. Kelly 1975 Treasurer and Principal Financial and Accounting Officer | | Vice President, Head of Fund Administration of PGIM Investments LLC (since November 2018); formerly, Director of Fund Administration of Lord Abbett & Co. LLC (2009-2018), Treasurer and Principal Accounting Officer of the Lord Abbett Family of Funds (2017-2018); Director of Accounting, Avenue Capital Group (2008-2009); Senior Manager, Investment Management Practice of Deloitte & Touche LLP (1998-2007). | | Since January 2019 |
| | | |
Lana Lomuti 1967 Assistant Treasurer | | Vice President (since 2007) and Director (2005-2007), within PGIM Investments Fund Administration; formerly Assistant Treasurer (December 2007-February 2014) of The Greater China Fund, Inc. | | Since April 2014 |
| | | |
Russ Shupak 1973 Assistant Treasurer | | Vice President (since 2017) and Director (2013-2017), within PGIM Investments Fund Administration. | | Since October 2019 |
| | | |
Deborah Conway 1969 Assistant Treasurer | | Vice President (since 2017) and Director (2007-2017), within PGIM Investments Fund Administration. | | Since October 2019 |
| | | |
Elyse M. McLaughlin 1974 Assistant Treasurer | | Vice President (since 2017) and Director (2011-2017), within PGIM Investments Fund Administration. | | Since October 2019 |
| | | |
Alina Srodecka, CPA 1966 Assistant Treasurer | | Vice President of Tax at Prudential Financial, Inc. (Since August 2007); formerly Director of Tax at MetLife (January 2003 – May 2006); formerly Tax Manager at Deloitte & Touché (October 1997 – January 2003); formerly Staff Accountant at Marsh & McLennan (May 1994 – May 1997). | | Since June 2017 |
(a) Excludes Mr. Cronin, an Interested Trustee who also serves as President and Principal Executive Officer.
Explanatory Notes to Tables:
Trustees are deemed to be “Interested,” as defined in the 1940 Act, by reason of their affiliation with PGIM Investments and/or an affiliate of PGIM Investments. Timothy S. Cronin is an Interested Trustee because he is employed by an affiliate of the Manager.
Unless otherwise noted, the address of all Trustees and Officers is c/o PGIM Investments LLC, 655 Broad Street, Newark, New Jersey 07102.
There is no set term of office for Trustees or Officers. The Independent Trustees have adopted a retirement policy, which calls for the retirement of Trustees on December 31 of the year in which they reach the age of 78, provided that the Board may extend the retirement age on a year-by-year basis for a Trustee.
As used in the Officer’s table, “Prudential” means The Prudential Insurance Company of America
“Other Directorships Held” includes all directorships of companies required to register or file reports with the SEC under the 1934 Act (that is, “public companies”) or other investment companies registered under the 1940 Act.
“No. of Portfolios Overseen” includes all investment companies managed by PGIM Investments and/or ASTIS that are overseen by the Trustee. The investment companies for which PGIM Investments and/or ASTIS serves as Manager include The Prudential Variable Contract Accounts, The Prudential Series Fund, Advanced Series Trust, Prudential’s Gibraltar Fund, Inc., the PGIM Funds, the PGIM High Yield Bond Fund, Inc., PGIM Global High Yield Fund, Inc. and PGIM Short Duration High Yield Opportunities Fund.
E3
| | |

The Prudential Insurance Company of America 751 Broad Street Newark, NJ 07102-3714 | | 
|
©2022 Prudential Financial, Inc. and its related entities. PGIM Investments, the Prudential logo, the Rock symbol, and Bring Your Challenges are service marks of Prudential Financial, Inc. and its related entities, registered in many jurisdictions worldwide.
MD.RS.011
Item 2 – Code of Ethics — See Exhibit (a)
As of the end of the period covered by this report, the registrant has adopted a code of ethics (the “Section 406 Standards for Investment Companies – Ethical Standards for Principal Executive and Financial Officers”) that applies to the registrant’s Principal Executive Officer and Principal Financial Officer; the registrant’s Principal Financial Officer also serves as the Principal Accounting Officer.
The registrant hereby undertakes to provide any person, without charge, upon request, a copy of the code of ethics. To request a copy of the code of ethics, contact the registrant 800-225-1852, and ask for a copy of the Section 406 Standards for Investment Companies - Ethical Standards for Principal Executive and Financial Officers.
Item 3 – Audit Committee Financial Expert –
The registrant’s Board has determined that Keith F. Hartstein, member of the Board’s Audit Committee is an “audit committee financial expert,” and that he is “independent,” for purposes of this item.
Item 4 – Principal Accountant Fees and Services –
(a) Audit Fees
For the fiscal years ended December 31, 2021 and December 31, 2020, PricewaterhouseCoopers LLP (“PwC”), the Registrant’s principal accountant, billed the Registrant $24,000 and $24,000 respectively, for professional services rendered for the audit of the Registrant’s annual financial statements or services that are normally provided in connection with statutory and regulatory filings.
(b) Audit-Related Fees
For the fiscal years ended December 31, 2021 and December 31, 2020, PwC did not bill the Registrant for audit-related services.
For the fiscal year ended December 31, 2020, fees of $4,952 were billed to the Registrant for services rendered by KPMG LLP (the Registrant’s prior principal accountant) in connection with the auditor transition.
(c) Tax Fees
For the fiscal years ended December 31, 2021 and December 31, 2020: none.
(d) All Other Fees
For the fiscal years ended December 31, 2021 and December 31, 2020: none.
(e) (1) Audit Committee Pre-Approval Policies and Procedures
THE PGIM MUTUAL FUNDS
AUDIT COMMITTEE POLICY
on
Pre-Approval of Services Provided by the Independent
Accountants
The Audit Committee of each PGIM Mutual Fund is charged with the responsibility to monitor the independence of the Fund’s independent accountants. As part of this responsibility, the Audit Committee must pre-approve the independent accounting firm’s engagement to render audit and/or permissible non-audit services, as required by law. In evaluating a proposed engagement of the independent accountants, the Audit Committee will assess the effect that the engagement might reasonably be expected to have on the accountant’s independence. The Committee’s evaluation will be based on:
| | • | | a review of the nature of the professional services expected to be provided, |
| | • | | a review of the safeguards put into place by the accounting firm to safeguard independence, and |
| | • | | periodic meetings with the accounting firm. |
Policy for Audit and Non-Audit Services Provided to the Funds
On an annual basis, the scope of audits for each Fund, audit fees and expenses, and audit-related and non-audit services (and fees proposed in respect thereof) proposed to be performed by the Fund’s independent accountants will be presented by the Treasurer and the independent accountants to the Audit Committee for review and, as appropriate, approval prior to the initiation of such services.
Such presentation shall be accompanied by confirmation by both the Treasurer and the independent accountants that the proposed
non-audit services will not adversely affect the independence of the independent accountants. Such proposed non-audit services shall be described in sufficient detail to enable the Audit Committee to assess the appropriateness of such services and fees, and the compatibility of the provision of such services with the auditor’s independence. The Committee shall receive periodic reports on the progress of the audit and other services which are approved by the Committee or by the Committee Chair pursuant to authority delegated in this Policy.
The categories of services enumerated under “Audit Services”, “Audit-related Services”, and “Tax Services” are intended to provide guidance to the Treasurer and the independent accountants as to those categories of services which the Committee believes are generally consistent with the independence of the independent accountants and which the Committee (or the Committee Chair) would expect upon the presentation of specific proposals to pre-approve. The enumerated categories are not intended as an exclusive list of audit, audit-related or tax services, which the Committee (or the Committee Chair) would consider for pre-approval.
Audit Services
The following categories of audit services are considered to be consistent with the role of the Fund’s independent accountants:
| | • | | Annual Fund financial statement audits |
| | • | | Seed audits (related to new product filings, as required) |
| | • | | SEC and regulatory filings and consents |
Audit-related Services
The following categories of audit-related services are considered to be consistent with the role of the Fund’s independent accountants:
| | • | | Accounting consultations |
| | • | | Fund merger support services |
| | • | | Agreed Upon Procedure Reports |
| | • | | Other Internal Control Reports |
Individual audit-related services that fall within one of these categories (except for fund merger support services) and are not presented to the Audit Committee as part of the annual pre-approval process are subject to an authorized pre-approval by the Audit Committee so long as the estimated fee for those services does not exceed $30,000. Any services provided under such pre-approval will be reported to the Audit Committee at its next regular meeting. Should the amount of such services exceed $30,000 any additional fees will be subject to pre-approval by the Committee Chair (or any other Committee member on whom this responsibility has been delegated). Fees related to fund merger support services are subject to a separate authorized pre-approval by the Audit Committee with fees determined on a per occurrence and merger complexity basis.
Tax Services
The following categories of tax services are considered to be consistent with the role of the Fund’s independent accountants:
| | • | | Tax compliance services related to the filing or amendment of the following: |
| | • | | Federal, state and local income tax compliance; and, |
| | • | | Sales and use tax compliance |
| | • | | Timely RIC qualification reviews |
| | • | | Tax distribution analysis and planning |
| | • | | Tax authority examination services |
| | • | | Tax appeals support services |
| | • | | Accounting methods studies |
| | • | | Fund merger support services |
| | • | | Tax consulting services and related projects |
Individual tax services that fall within one of these categories and are not presented to the Audit Committee as part of the annual pre-approval process are subject to an authorized pre-approval by the Audit Committee so long as the estimated fee for those services does not exceed $30,000. Any services provided under such pre-approval will be reported to the Audit Committee at its next regular meeting. Should the amount of such services exceed $30,000 any additional fees will be subject to pre-approval by the Committee Chair (or any other Committee member on whom this responsibility has been delegated).
Other Non-Audit Services
Certain non-audit services that the independent accountants are legally permitted to render will be subject to pre-approval by the Committee or by one or more Committee members to whom the Committee has delegated this authority and who will report to the full Committee any pre-approval decisions made pursuant to this Policy. Non-audit services presented for pre-approval pursuant to this paragraph will be accompanied by a confirmation from both the Treasurer and the independent accountants that the proposed services will not adversely affect the independence of the independent accountants.
Proscribed Services
The Fund’s independent accountants will not render services in the following categories of non-audit services:
| | • | | Bookkeeping or other services related to the accounting records or financial statements of the Fund |
| | • | | Financial information systems design and implementation |
| | • | | Appraisal or valuation services, fairness opinions, or contribution-in-kind reports |
| | • | | Internal audit outsourcing services |
| | • | | Management functions or human resources |
| | • | | Broker or dealer, investment adviser, or investment banking services |
| | • | | Legal services and expert services unrelated to the audit |
| | • | | Any other service that the Public Company Accounting Oversight Board determines, by regulation, is impermissible. |
Pre-approval of Non-Audit Services Provided to Other Entities Within the PGIM Fund Complex
Certain non-audit services provided to PGIM Investments LLC or any of its affiliates that also provide ongoing services to the PGIM Mutual Funds will be subject to pre-approval by the Audit Committee. The only non-audit services provided to these entities that will require pre-approval are those related directly to the operations and financial reporting of the Funds. Individual projects that are not presented to the Audit Committee as part of the annual pre-approval process will be subject to pre-approval by the Committee Chair (or any other Committee member on whom this responsibility has been delegated) so long as the estimated fee for those services does not exceed $30,000. Services presented for pre-approval pursuant to this paragraph will be accompanied by a confirmation from both the Treasurer and the independent accountants that the proposed services will not adversely affect the independence of the independent accountants.
Although the Audit Committee will not pre-approve all services provided to PGIM Investments LLC and its affiliates, the Committee will receive an annual report from the Fund’s independent accounting firm showing the aggregate fees for all services provided to PGIM Investments and its affiliates.
(e) (2) Percentage of services referred to in 4(b) – 4(d) that were approved by the audit committee –
For the fiscal years ended December 31, 2021 and December 31, 2020, 100% of the services referred to in Item 4(b) was approved by the audit committee.
(f) Percentage of hours expended attributable to work performed by other than full time employees of principal accountant if greater than 50%.
The percentage of hours expended on the principal accountant’s engagement to audit the registrant’s financial statements for the most recent fiscal year that were attributed to work performed by persons other than the principal accountant’s full-time, permanent employees was 0%.
(g) Non-Audit Fees
The aggregate non-audit fees billed by the Registrant’s principal accountant for services rendered to the registrant’s investment adviser and any entity controlling, controlled by, or under common control with the investment adviser that provides ongoing services to the registrant for the fiscal years ended December 31, 2021 and December 31, 2020 was $0 and $0, respectively.
(h) Principal Accountant’s Independence
Not applicable as the Registrant’s principal accountant has not provided non-audit services to the registrant’s investment adviser and any entity controlling, controlled by, or under common control with the investment adviser that provides ongoing services to the registrant that were not pre-approved pursuant to Rule 2-01(c)(7)(ii) of Regulation S-X.
Item 5 – Audit Committee of Listed Registrants – Not applicable.
| Item 6 – | Schedule of Investments – The schedule is included as part of the report to shareholders filed under Item 1 of this Form. |
| Item 7 – | Disclosure of Proxy Voting Policies and Procedures for Closed-End Management Investment Companies – Not applicable. |
Item 8 – Portfolio Managers of Closed-End Management Investment Companies – Not applicable.
| Item 9 – | Purchases of Equity Securities by Closed-End Management Investment Company and Affiliated Purchasers – Not applicable. |
Item 10 – Submission of Matters to a Vote of Security Holders – There have been no material changes to these procedures.
Item 11 – Controls and Procedures
| | (a) | It is the conclusion of the registrant’s principal executive officer and principal financial officer that the effectiveness of the registrant’s current disclosure controls and procedures (such disclosure controls and procedures having been evaluated within 90 days of the date of this filing) provide reasonable assurance that the information required to be disclosed by the registrant has been recorded, processed, summarized and reported within the time period specified in the Commission’s rules and forms and that the information required to be disclosed by the registrant has been accumulated and communicated to the registrant’s principal executive officer and principal financial officer in order to allow timely decisions regarding required disclosure. |
| | (b) | There has been no significant change in the registrant’s internal control over financial reporting that occurred during the registrant’s most recent fiscal quarter of the period covered by this report that has materially affected, or is likely to materially affect, the registrant’s internal control over financial reporting. |
Item 12 – Controls and Procedures - Disclosure of Securities Lending Activities for Closed-End Management Investment Companies – Not applicable.
Item 13 – Exhibits
SIGNATURES
Pursuant to the requirements of the Securities Exchange Act of 1934 and the Investment Company Act of 1940, the registrant has duly caused this report to be signed on its behalf by the undersigned, thereunto duly authorized.
Registrant: The Prudential Variable Contract Account-10
| | |
| By: | | /s/ Andrew R. French |
| | Andrew R. French |
| | Secretary |
| |
| Date: | | February 24, 2022 |
Pursuant to the requirements of the Securities Exchange Act of 1934 and the Investment Company Act of 1940, this report has been signed below by the following persons on behalf of the registrant and in the capacities and on the dates indicated.
| | |
| By: | | /s/ Stuart S. Parker |
| | Stuart S. Parker |
| | President and Principal Executive Officer |
| |
| Date: | | February 24, 2022 |
| |
| By: | | /s/ Christian J. Kelly |
| | Christian J. Kelly |
| | Treasurer and Principal Financial and Accounting Officer |
| |
| Date: | | February 24, 2022 |