A. CATHERINE NGO President & Chief Executive Officer First QuarterDAVID 2020 S. MORIMOTO EarningsExecutive Supplement Vice President & Chief Financial Officer AUGUST 2018 April 22, 2020 1
FORWARD LOOKING STATEMENTS This document may contain forward-looking statements concerning: projections of revenues, expenses, income or loss, earnings or loss per share, capital expenditures, the payment or nonpayment of dividends, capital position, net interest margin or other financial items; statements of plans, objectives and expectations of Central Pacific Financial Corp. or its management or Board of Directors, including those relating to business plans, use of capital resources, products or services and regulatory developments and regulatory actions; statements of future economic performance including anticipated performance results from our RISE2020 initiative; or any statements of the assumptions underlying or relating to any of the foregoing. Words such as "believes," "plans," "anticipates," "expects," "intends," "forecasts," "hopes," "targeting," "continue," "remain," "will," "should," "estimates," "may" and other similar expressions are intended to identify forward- looking statements but are not the exclusive means of identifying such statements. While we believe that our forward-looking statements and the assumptions underlying them are reasonably based, such statements and assumptions are by their nature subject to risks and uncertainties, and thus could later prove to be inaccurate or incorrect. Accordingly, actual results could differ materially from those statements or projections for a variety of reasons, including, but not limited to: the adverse effects of the COVID-19 pandemic virus on local, national and international economies, including, but not limited to, the adverse impact on tourism and construction in the State of Hawaii, our borrowers, customers, third-party contractors, vendors and employees as well as the effects of government programs and initiatives in response to COVID-19; the increase in inventory or adverse conditions in the real estate market and deterioration in the construction industry; adverse changes in the financial performance and/or condition of our borrowers and, as a result, increased loan delinquency rates, deterioration in asset quality, and losses in our loan portfolio; our ability to successfully implement our RISE2020 initiative; the impact of local, national, and international economies and events (including natural disasters such as wildfires, volcanic eruptions, hurricanes, tsunamis, storms, earthquakes and pandemic virus and disease, including COVID-19) on the Company's business and operations and on tourism, the military, and other major industries operating within the Hawaii market and any other markets in which the Company does business; deterioration or malaise in domestic economic conditions, including any destabilization in the financial industry and deterioration of the real estate market, as well as the impact of declining levels of consumer and business confidence in the state of the economy in general and in financial institutions in particular; changes in estimates of future reserve requirements based upon the periodic review thereof under relevant regulatory and accounting requirements; the impact of the Dodd-Frank Wall Street Reform and Consumer Protection Act (the "Dodd-Frank Act"), changes in capital standards, other regulatory reform and federal and state legislation, including but not limited to regulations promulgated by the Consumer Financial Protection Bureau (the "CFPB"), government-sponsored enterprise reform, and any related rules and regulations which affect our business operations and competitiveness; the costs and effects of legal and regulatory developments, including legal proceedings or regulatory or other governmental inquiries and proceedings and the resolution thereof, the results of regulatory examinations or reviews and the effect of, and our ability to comply with, any regulatory orders or actions we are or may become subject to; ability to successfully implement our initiatives to lower our efficiency ratio; the effects of and changes in trade, monetary and fiscal policies and laws, including the interest rate policies of the Board of Governors of the Federal Reserve System (the "FRB" or the "Federal Reserve"); inflation, interest rate, securities market and monetary fluctuations, including the anticipated replacement of the London Interbank Offered Rate ("LIBOR") Index and the impact on our loans and debt which are tied to that index; negative trends in our market capitalization and adverse changes in the price of the Company's common stock; political instability; acts of war or terrorism; pandemic virus and disease, including COVID-19; changes in consumer spending, borrowings and savings habits; failure to maintain effective internal control over financial reporting or disclosure controls and procedures; cybersecurity and data privacy breaches and the consequence therefrom; the ability to address deficiencies in our internal controls over financial reporting or disclosure controls and procedures; technological changes and developments; changes in the competitive environment among financial holding companies and other financial service providers; the effect of changes in accounting policies and practices, as may be adopted by the regulatory agencies, as well as the Public Company Accounting Oversight Board, the Financial Accounting Standards Board ("FASB") and other accounting standard setters and the cost and resources required to implement such changes; our ability to attract and retain key personnel; changes in our organization, compensation and benefit plans; and our success at managing the risks involved in the foregoing items. For further information with respect to factors that could cause actual results to materially differ from the expectations or projections stated in the forward-looking statements, please see the Company's publicly available Securities and Exchange Commission filings, including the Company's Form 10-K for the last fiscal year and, in particular, the discussion of "Risk Factors" set forth therein. We urge investors to consider all of these factors carefully in evaluating the forward-looking statements contained in this Form 8-K. Forward-looking statements speak only as of the date on which such statements are made. We undertake no obligation to update any forward-looking statements to reflect events or circumstances after the date on which such statement is made, or to reflect the occurrence of unanticipated events except as required by law. 2
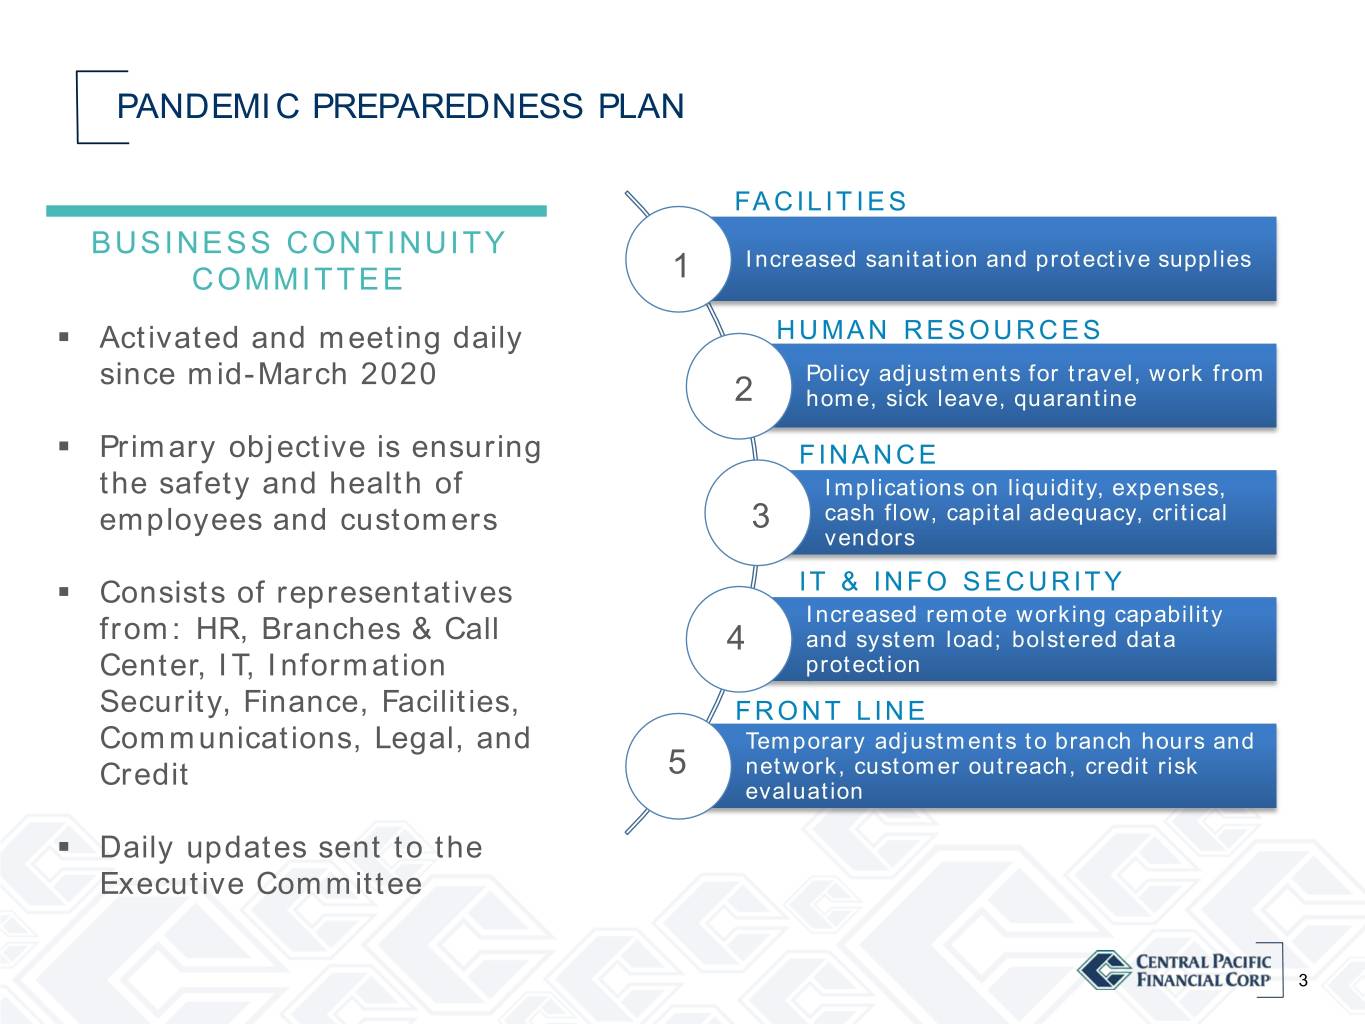
PANDEMIC PREPAREDNESS PLAN FACILITIES BUSINESS CONTINUITY Increased sanitation and protective supplies COMMITTEE 1 . Activated and meeting daily HUMAN RESOURCES since mid-March 2020 Policy adjustments for travel, work from 2 home, sick leave, quarantine . Primary objective is ensuring FINANCE the safety and health of Implications on liquidity, expenses, employees and customers 3 cash flow, capital adequacy, critical vendors . Consists of representatives IT & INFO SECURITY Increased remote working capability from: HR, Branches & Call 4 and system load; bolstered data Center, IT, Information protection Security, Finance, Facilities, FRONT LINE Communications, Legal, and Temporary adjustments to branch hours and Credit 5 network, customer outreach, credit risk evaluation . Daily updates sent to the Executive Committee 3

SUPPORTING OUR EMPLOYEES . All banking . Approximately •Closed 13 of 35 services operating 70% of all branches normally employees are setup on VPN •Smaller footprint . Exceptional client branches closed service and •IT systems and for increased outreach ongoing VPN capacity social distancing increased . Employee •Protective absentee rate WORK REMOTE •Collaboration equipment (face normal and stable tools enable shields, masks) CURRENTSTATUS continued work provided for productivity branch staff FRONT LINE FRONT WORKERS 4
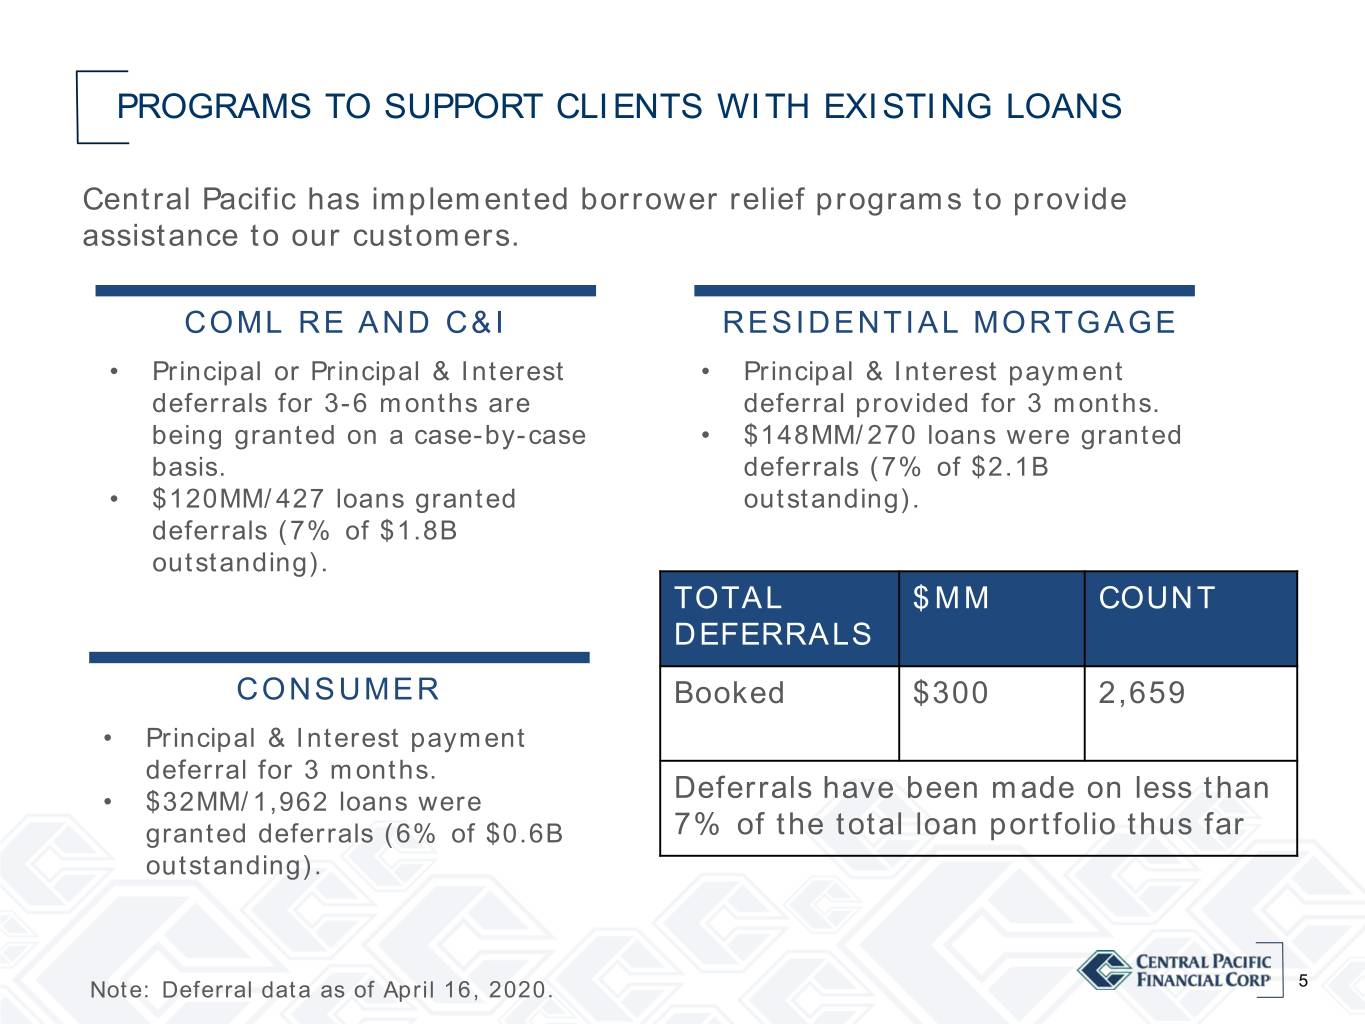
PROGRAMS TO SUPPORT CLIENTS WITH EXISTING LOANS Central Pacific has implemented borrower relief programs to provide assistance to our customers. COML RE AND C&I RESIDENTIAL MORTGAGE • Principal or Principal & Interest • Principal & Interest payment deferrals for 3-6 months are deferral provided for 3 months. being granted on a case-by-case • $148MM/270 loans were granted basis. deferrals (7% of $2.1B • $120MM/427 loans granted outstanding). deferrals (7% of $1.8B outstanding). TOTAL $MM COUNT DEFERRALS CONSUMER Booked $300 2,659 • Principal & Interest payment deferral for 3 months. • $32MM/1,962 loans were Deferrals have been made on less than granted deferrals (6% of $0.6B 7% of the total loan portfolio thus far outstanding). Note: Deferral data as of April 16, 2020. 5

SPECIAL LOAN PROGRAMS SBA PAYCHECK PROTECTION PROGRAM (PPP) As of 4/16/20: • Total approved by SBA: 4,215 / $487MM • Total funded: 88 loans / $12.5MM • Average loan size: $0.1MM Central Pacific is also participating in the SBA Disaster LSBA and EIDL loan programs. EMPLOYMENT DISRUPTION LOAN PROGRAM Offered to furloughed or unemployed existing customers in amounts between $1,000-8,000, for 1-2 year terms. As of 4/16/20: • Total applications: 85 / $0.5MM • Total approved: 16 /$0.1MM 6

OTHER PROGRAMS TO HELP CUSTOMERS CHANGES MADE TO ALLOW CUSTOMERS TO QUICKLY & CONVENIENTLY ACCESS FUNDS ATM - Waived non-CPB ATM fees CDs – Waived early withdrawal fee Debit Cards – Raised spending cap limits to $10,000 Mobile Deposits – Increased limits to $10,000 daily 7
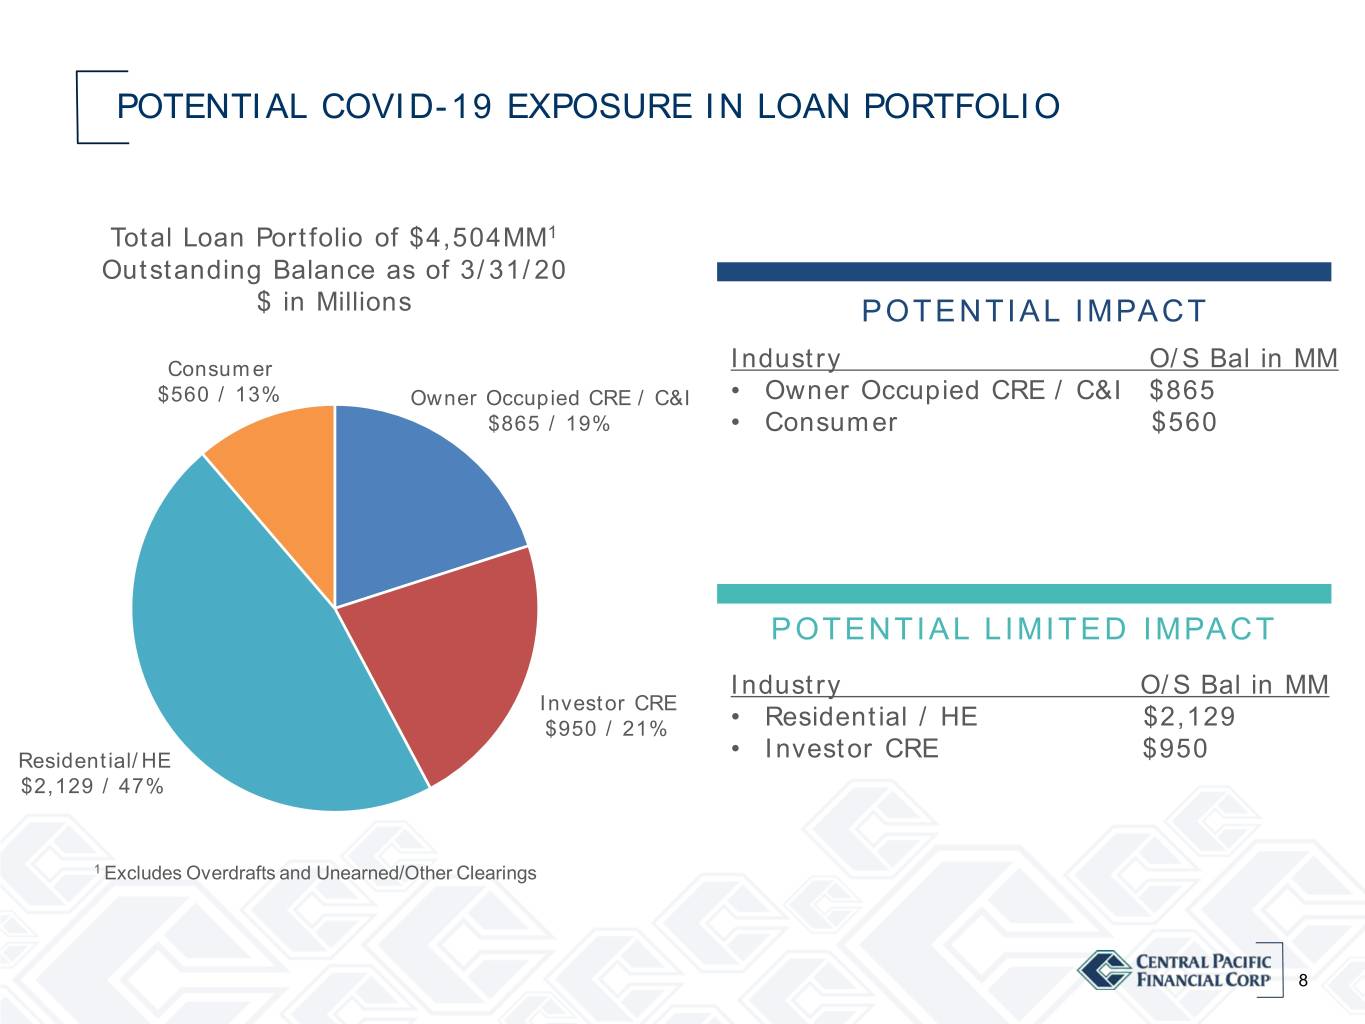
POTENTIAL COVID-19 EXPOSURE IN LOAN PORTFOLIO Total Loan Portfolio of $4,504MM1 Outstanding Balance as of 3/31/20 $ in Millions POTENTIAL IMPACT Consumer Industry O/S Bal in MM $560 / 13% Owner Occupied CRE / C&I • Owner Occupied CRE / C&I $865 $865 / 19% • Consumer $560 POTENTIAL LIMITED IMPACT Industry O/S Bal in MM Investor CRE $950 / 21% • Residential / HE $2,129 Residential/HE • Investor CRE $950 $2,129 / 47% 1 Excludes Overdrafts and Unearned/Other Clearings 8
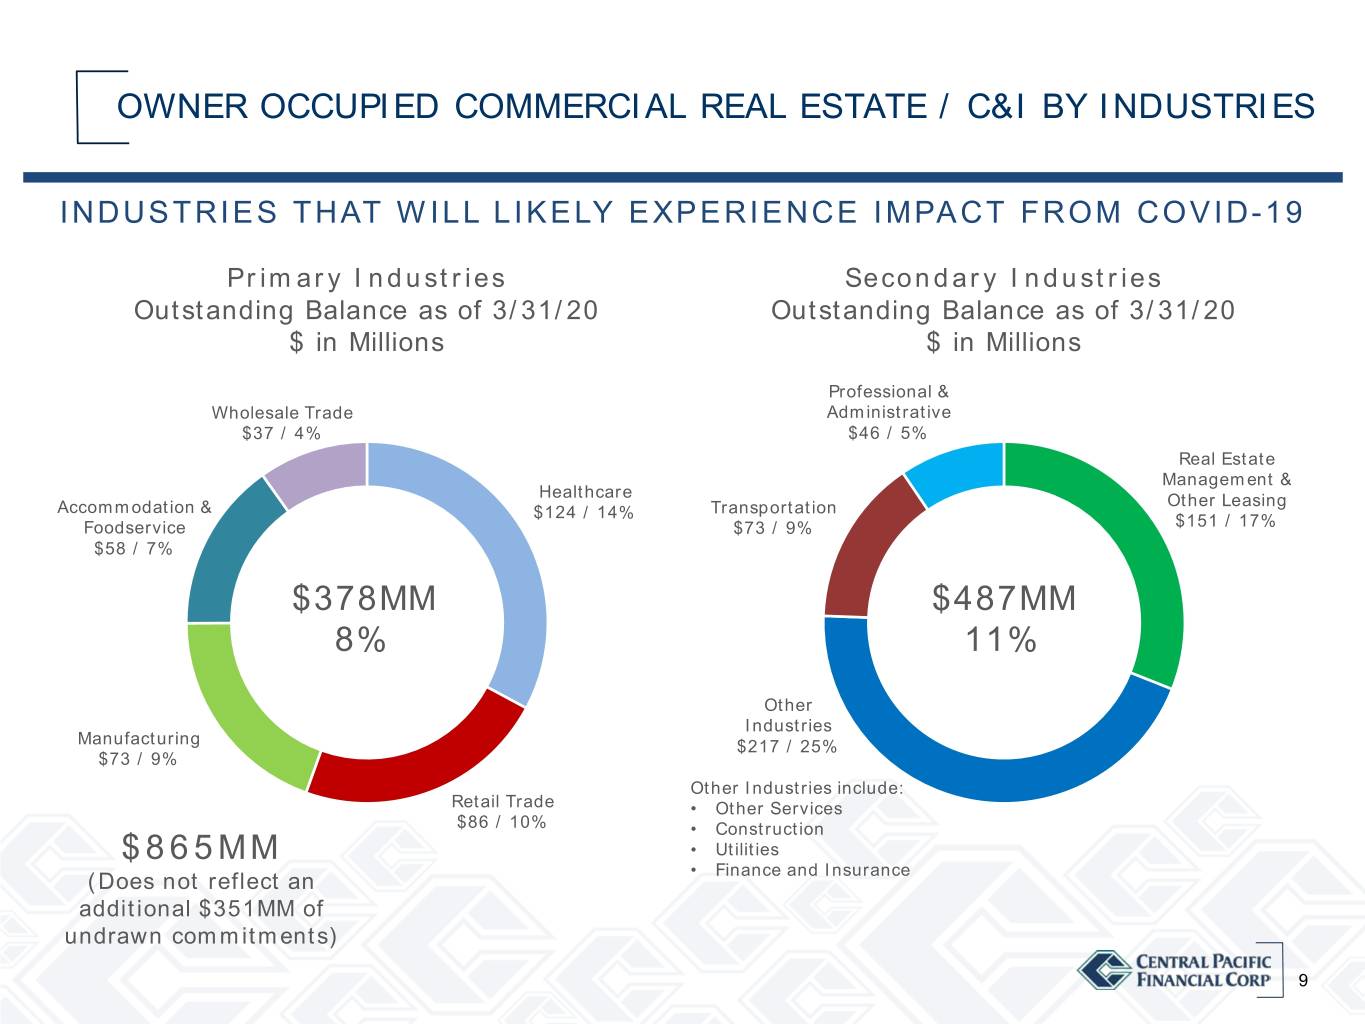
OWNER OCCUPIED COMMERCIAL REAL ESTATE / C&I BY INDUSTRIES INDUSTRIES THAT WILL LIKELY EXPERIENCE IMPACT FROM COVID-19 Primary Industries Secondary Industries Outstanding Balance as of 3/31/20 Outstanding Balance as of 3/31/20 $ in Millions $ in Millions Professional & Wholesale Trade Administrative $37 / 4% $46 / 5% Real Estate Management & Healthcare Other Leasing Accommodation & $124 / 14% Transportation Foodservice $73 / 9% $151 / 17% $58 / 7% $378MM $487MM 8% 11% Other Industries Manufacturing $217 / 25% $73 / 9% Other Industries include: Retail Trade • Other Services $86 / 10% • Construction $865MM • Utilities • Finance and Insurance (Does not reflect an additional $351MM of undrawn commitments) 9

O/O AND C&I - PRIMARY AND SECONDARY INDUSTRIES PRIMARY INDUSTRIES - $378MM OUTSTANDING LOAN BALANCE Healthcare: dentists, physicians, social services, nursing and $124MM / 77% Utilization residential care homes, child day care Retail Trade: supermarkets, food, beverage, hardware, new and used $86MM / 76% Utilization car dealers, gas stations Manufacturing: food, beverage, paper, transportation equipment, $73MM / 78% Utilization electrical equipment Accommodation & Foodservice: hotels, bed and breakfast, full-service $58MM / 79% Utilization restaurants, limited service restaurants, caterers Wholesale Trade: food, beverage, general line grocery, stationery and $37MM / $63% Utilization office supplies, motor vehicle parts and supplies SECONDARY INDUSTRIES - $487MM OUTSTANDING LOAN BALANCE Other Industries: construction, utilities, finance, insurance $217MM / 61% Utilization R/E Management & Other Leasing: property management, $151MM / 83% Utilization appraisers, commercial & industrial equipment leasing Transportation: water freight, air freight, commercial trucking $73MM / 77% Utilization Professional & Administrative: attorneys, accountants, waste $46MM / 56% Utilization management, engineering services, administrative management 10

CONSUMER LOAN PORTFOLIO Outstanding Balance as of 3/31/20 Loan Portfolio Details $ in Millions • Auto Hawaii $218MM Mainland $71MM Personal Loans & Lines $271 / 48% • Personal Loans & Lines Auto Hawaii $150MM $289 / 52% Mainland $121MM • Hawaii Consumer WA FICO 737 • Mainland Consumer WA FICO 758 $560MM (Does not reflect an additional $96MM of undrawn commitments) 11
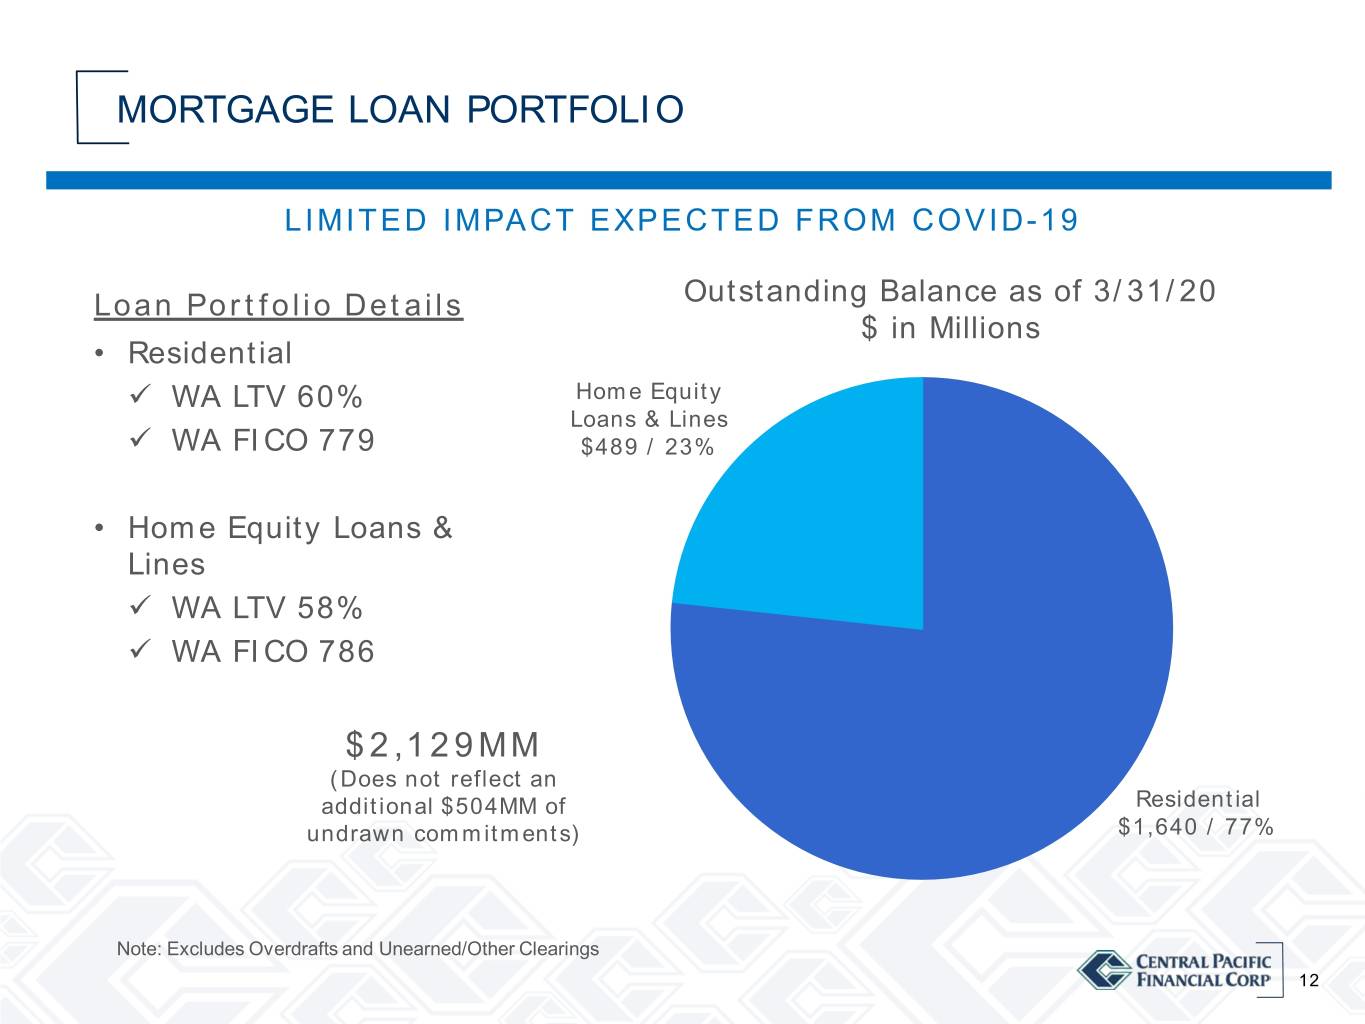
MORTGAGE LOAN PORTFOLIO LIMITED IMPACT EXPECTED FROM COVID-19 Loan Portfolio Details Outstanding Balance as of 3/31/20 $ in Millions • Residential WA LTV 60% Home Equity Loans & Lines WA FICO 779 $489 / 23% • Home Equity Loans & Lines WA LTV 58% WA FICO 786 $2,129MM (Does not reflect an additional $504MM of Residential undrawn commitments) $1,640 / 77% Note: Excludes Overdrafts and Unearned/Other Clearings 12
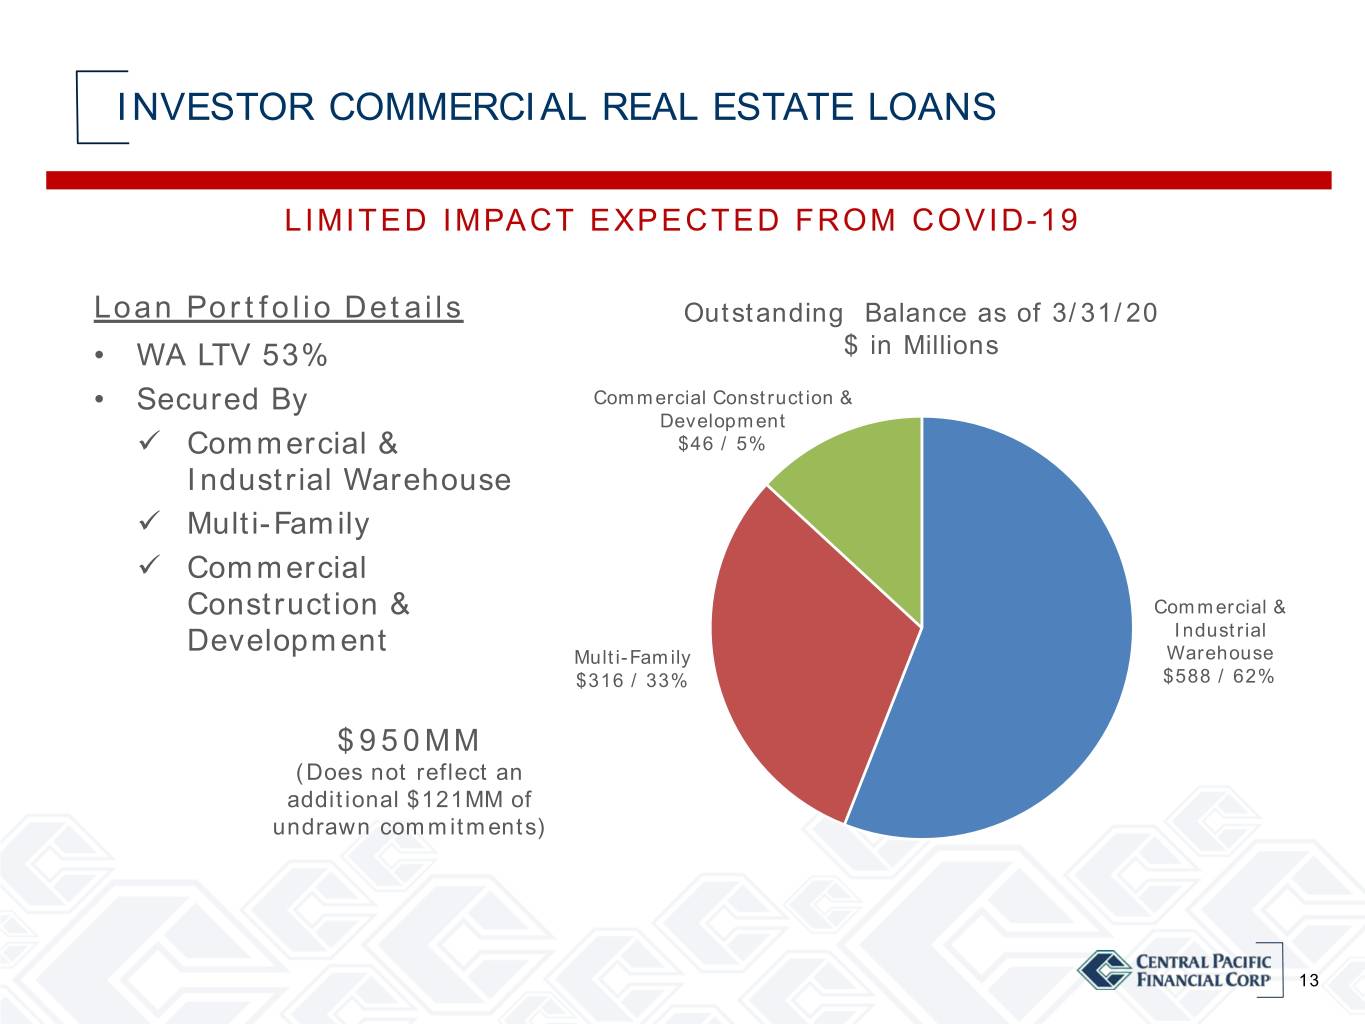
INVESTOR COMMERCIAL REAL ESTATE LOANS LIMITED IMPACT EXPECTED FROM COVID-19 Loan Portfolio Details Outstanding Balance as of 3/31/20 • WA LTV 53% $ in Millions • Secured By Commercial Construction & Development Commercial & $46 / 5% Industrial Warehouse Multi-Family Commercial Construction & Commercial & Development Industrial Multi-Family Warehouse $316 / 33% $588 / 62% $950MM (Does not reflect an additional $121MM of undrawn commitments) 13

LOANS RATED SPECIAL MENTION Outstanding Balance as of 3/31/20 Credit Risk Management $ in Millions Approach Other • Strong asset quality prior $9 / 8% Healthcare to COVID-19 $6 / 6% Real Estate Rental & Leasing • After COVID-19, additional $33 / 30% monitoring with frequent Accommodation $10 / 9% high-touch • Assessment for risk rating migration based on: Management strength Foodservice and actions taken $14 / 13% Business cash burn Access to cash liquidity Retail Trade Payment deferral $19 / 17% Wholesale Trade Application of Federal $18 / 16% $109MM support programs of which $65MM was attributed to COVID-19 14

FIRST QUARTER 2020 HIGHLIGHTS • Quarterly results impacted by Net Income $8 Million new CECL accounting standard and declining economic conditions Diluted EPS $0.29 • Pre-tax, Pre-provision earnings remained strong Pre-Tax, $21 Million Pre-Provision • Solid liquidity and capital; Earnings balance sheet well positioned • Committed to supporting our Loan Growth +$63 Million +1.4% employees, customers and community Net Interest 3.43% Margin 15

COMMUNITY SUPPORT To support local restaurants and families during this challenging time, Central Pacific Bank Foundation subsidized the cost of take out meals purchased from local restaurants. Central Pacific Bank Foundation contributed $300,000 to the campaign and additional initiatives to support the community during the pandemic are planned. 16
A. CATHERINE NGO President & Chief Executive Officer DAVIDAPPENDIX S. MORIMOTO Executive Vice President & Chief Financial Officer AUGUST 2018 17

STRONG CREDIT METRICS Allowance for Credit Losses Delinquencies (ACL) Past Due 90+ Days $65 1.90% CECL 0.50% $5 $60 1.70% $55 0.40% $4 Incurred Loss Method 1.50% $50 0.30% $3 1.30% $45 $40 1.10% 0.20% $2 $35 0.90% $30 0.10% $1 0.70% $25 0.00% $0 0.50% $20 1Q19 2Q19 3Q19 4Q19 1Q20 1Q19 2Q19 3Q19 4Q19 1Q20 Delinquencies in $ Millions (right) ACL in $ Millions (right) ACL/Total Loans (left) Delinquency Ratio (left) Non Performing Loans Net Charge-Offs 0.50% $5 0.50% $5 0.40% $4 0.40% $4 0.30% $3 0.30% $3 0.20% $2 0.20% $2 0.10% $1 0.10% $1 0.00% $0 0.00% $0 1Q19 2Q19 3Q19 4Q19 1Q20 1Q19 2Q19 3Q19 4Q19 1Q20 Net Charge-offs in $ Millions (right) NPLs in $ Millions (right) NPL ratio (left) NCO/Avg Loans (left) 18

DRIVERS OF CHANGE UNDER CECL o Changes in portfolio and credit quality o Macro economic conditions o Consideration of additional economic scenarios o Net charge- offs * Includes the Allowance for Off-Balance Sheet Exposures. 19
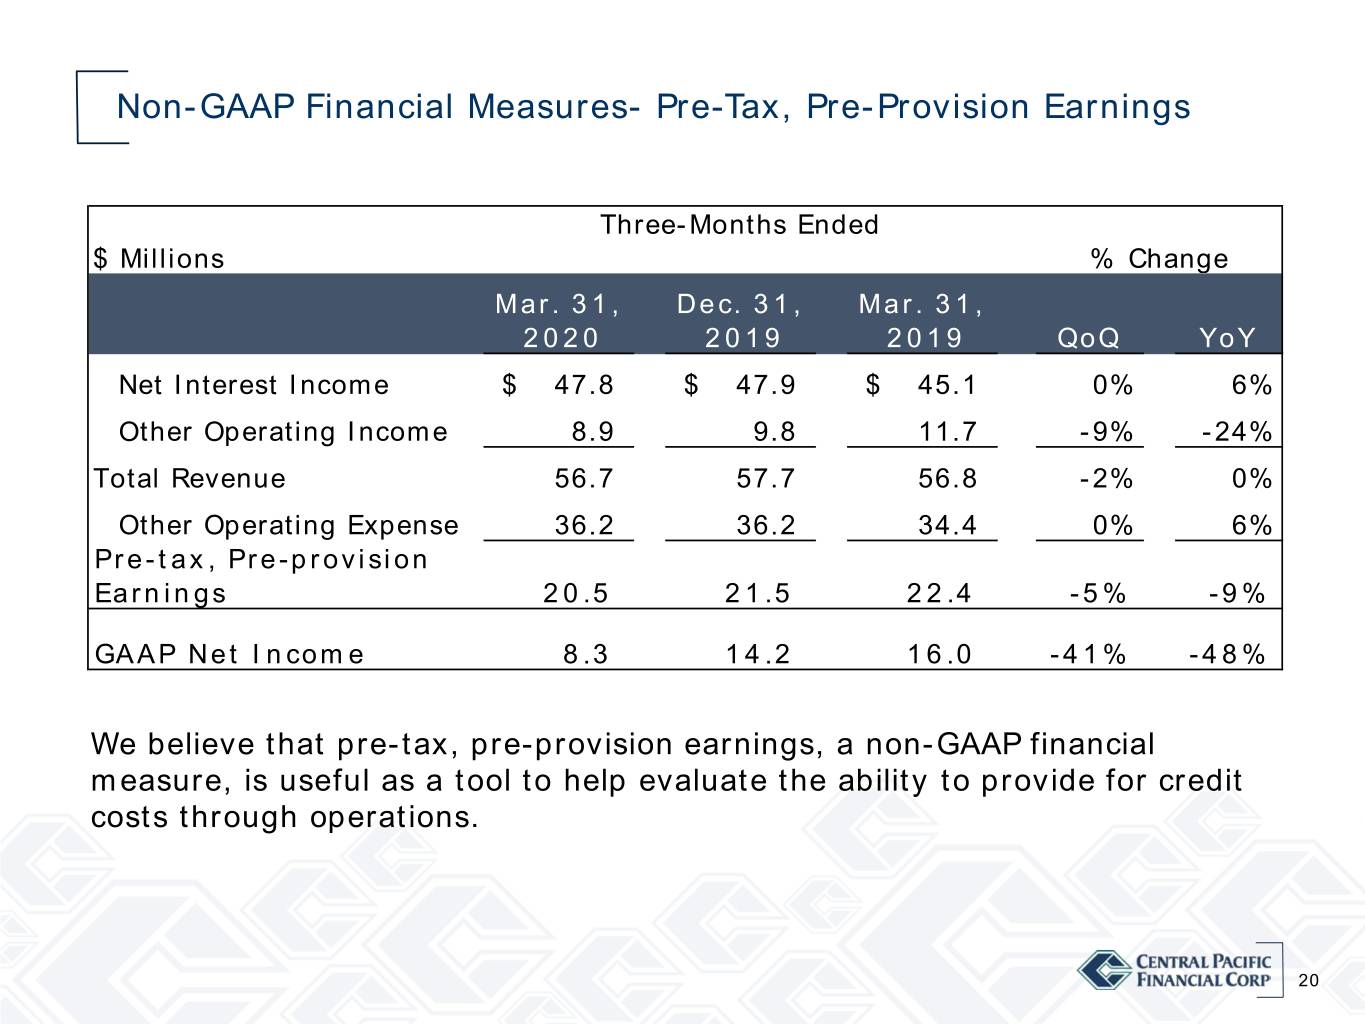
Non-GAAP Financial Measures- Pre-Tax, Pre-Provision Earnings Three-Months Ended $ Millions % Change Mar. 31, Dec. 31, Mar. 31, 2020 2019 2019 QoQ YoY Net Interest Income $ 47.8 $ 47.9 $ 45.1 0% 6% Other Operating Income 8.9 9.8 11.7 -9% -24% Total Revenue 56.7 57.7 56.8 -2% 0% Other Operating Expense 36.2 36.2 34.4 0% 6% Pre-tax, Pre-provision Earnings 20.5 21.5 22.4 -5% -9% GAAP Net Income 8.3 14.2 16.0 -41% -48% We believe that pre-tax, pre-provision earnings, a non-GAAP financial measure, is useful as a tool to help evaluate the ability to provide for credit costs through operations. 20


