Exhibit 99

| National Fuel Gas Company BMO Capital Markets 3rd Annual Appalachian E&P Forum January 2007 |

| Safe Harbor NOTE: This presentation contains certain forward-looking statements as defined by the Private Securities Litigation Reform Act of 1995. Forward-looking statements include, but are not limited to, statements concerning plans, objectives, goals, projections, strategies and future events or performance, other statements that are not statements of historical fact, and statements identified by words such as "anticipates," "believes," "estimates," "expects," "intends," "plans," "may," "should," "will" or words of similar meaning. While National Fuel's expectations, beliefs and projections are made in good faith and are believed to have a reasonable basis, actual results may differ materially. Refer to National Fuel's most recent Form 10-K for a listing of important risk factors you should consider. In addition, this presentation contains certain non- GAAP financial measures. For pages that contain non-GAAP financial measures, pages containing the most directly comparable GAAP financial measures and reconciliations are provided at the end of this presentation. |
| Grow shareholder value through timely investment in the energy industry. National Fuel Gas Company Corporate Objective |

| National Fuel Gas Company Energy Mktg. Timber E&P P&S Utility National Fuel Gas Distribution Corporation National Fuel Gas Supply Corporation and Empire State Pipeline Seneca Resources Corporation Highland Forest Resources, Inc. and NE Div. Of Seneca Resources Corporation National Fuel Resources, Inc. National Fuel Gas Company Major Business Segments |
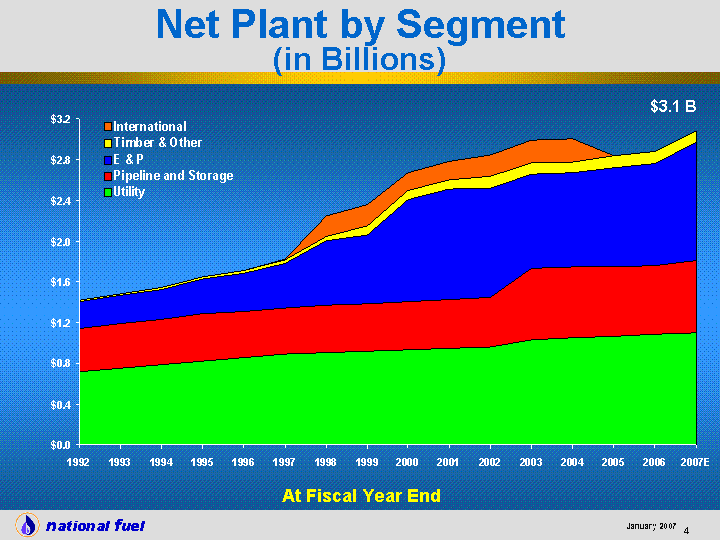
| 1992 1993 1994 1995 1996 1997 1998 1999 2000 2001 2002 2003 2004 2005 2006 2007E $3.1 B At Fiscal Year End Net Plant by Segment (in Billions) |
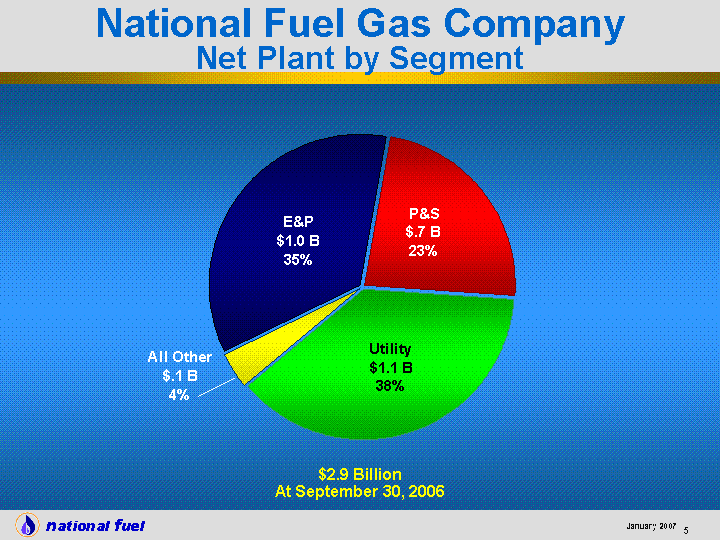
| National Fuel Gas Company Net Plant by Segment $2.9 Billion At September 30, 2006 P&S Utility All Other E&P Net plant 0.67 1.084 0.118 1.002 |
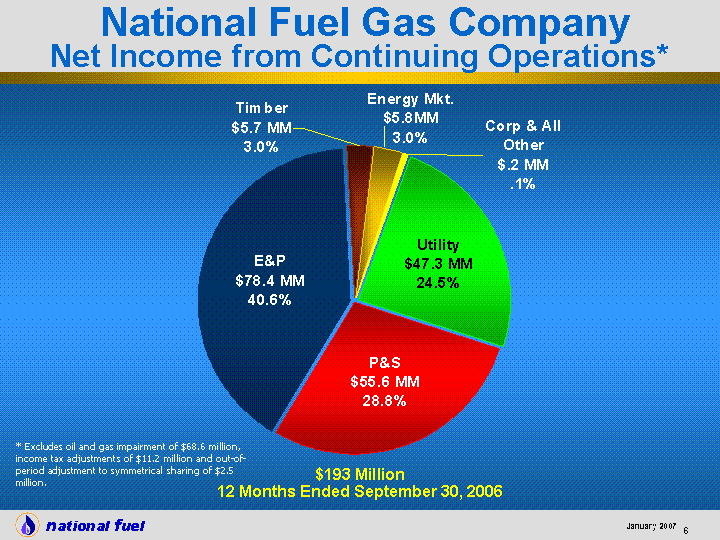
| $193 Million 12 Months Ended September 30, 2006 Utility P&S E&P Timber Energy Mkt. Corp. & Other NI 47.3 55.6 78.4 5.7 5.8 1 National Fuel Gas Company Net Income from Continuing Operations* * Excludes oil and gas impairment of $68.6 million, income tax adjustments of $11.2 million and out-of- period adjustment to symmetrical sharing of $2.5 million. |
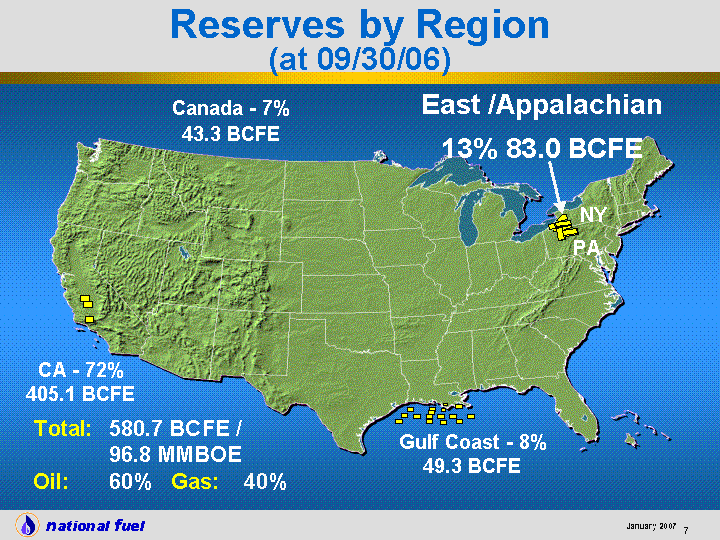
| Canada - 7% 43.3 BCFE NY PA Gulf Coast - 8% 49.3 BCFE CA - 72% 405.1 BCFE Total: 580.7 BCFE / 96.8 MMBOE Oil: 60% Gas: 40% Reserves by Region (at 09/30/06) East /Appalachian 13% 83.0 BCFE |

| E&P Year End Results September 30, 2006 Production: 47.4 BCFE Operating Revenue $346.9 MM Net Income $ 78.4 MM * Drilled 277 New Wells - 97% Success Rate Expenses/Mcfe 4th Quarter Fiscal Year DD&A $1.98 $2.00 LOE $1.14 $1.18 G&A $0.40 $0.49 ($23.3 MM) * Excludes oil & gas impairment of $68.6 million and income tax adjustment of $11.2 million. |
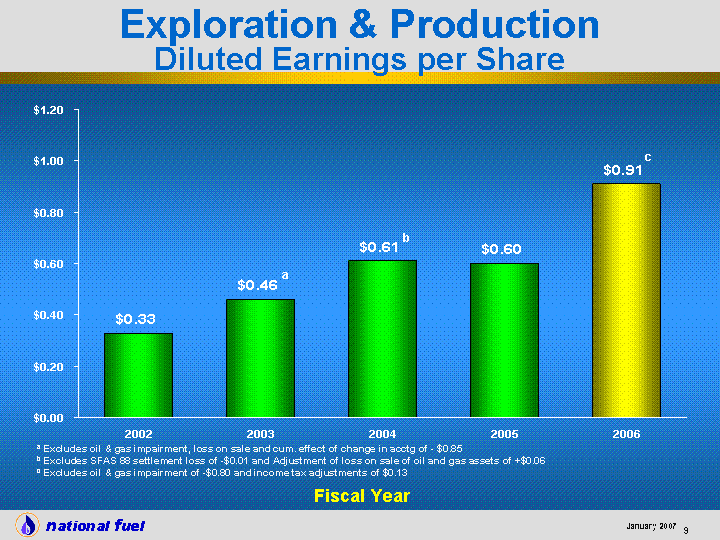
| Fiscal Year 1999 2000 2001 2002 2003 2004 2005 2006 Earnings 0.09 0.44 0.89 0.33 0.46 0.61 0.6 0.91 a b a Excludes oil & gas impairment, loss on sale and cum. effect of change in acctg of - $0.85 b Excludes SFAS 88 settlement loss of -$0.01 and Adjustment of loss on sale of oil and gas assets of +$0.06 c Excludes oil & gas impairment of -$0.80 and income tax adjustments of $0.13 Fiscal Year Exploration & Production Diluted Earnings per Share c |
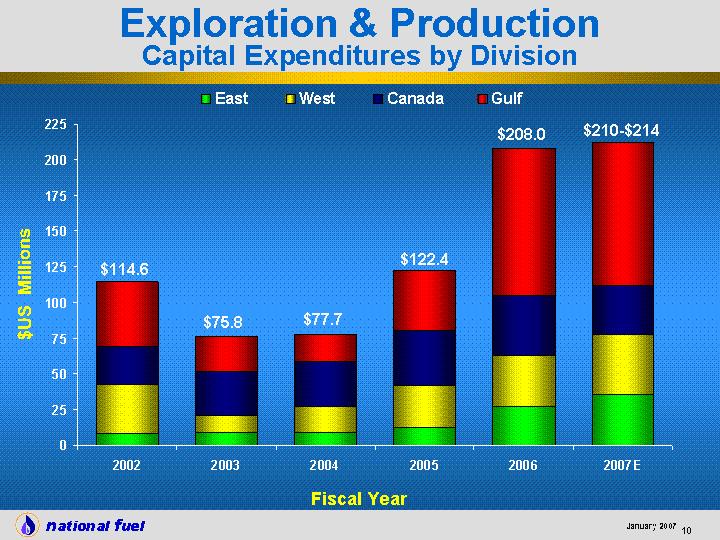
| 2002 2003 2004 2005 2006 2007E East 8.4 9.4 9.5 12.5 27 35.5 West 34.4 11.4 17.4 29.6 36 42.5 Canada 27 30.8 31.4 38.5 42 34.5 Gulf 44.8 24.2 19.4 41.8 103 99.5 $114.6 $75.8 $77.7 $122.4 $208.0 Fiscal Year $US Millions Exploration & Production Capital Expenditures by Division $210-$214 |
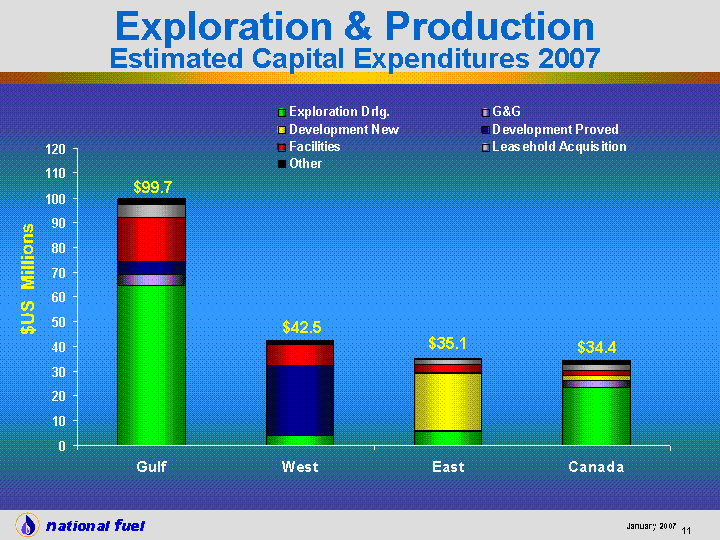
| $US Millions Exploration & Production Estimated Capital Expenditures 2007 Gulf West East Canada Exploration Drlg. 64.5 4 5.6 23.4 G&G 4.3 0 0.5 2.7 Development New 0 0 23 1.9 Development Proved 5.6 28.1 0.4 0 Facilities 17.6 8.6 3.5 2.3 Leasehold Acquisition 5.4 0 1.8 2.7 Other 2.3 1.8 0.3 1.4 $99.7 $42.5 $35.1 $34.4 |

| E&P's Forecast Data for Fiscal 2007 Production: 47 - 52 BCFE Number of Wells to be Drilled: 255 - 298 Expenses/Mcfe Estimated Range DD&A $2.00 - $2.10 LOE $1.10 - $1.30 Other Taxes (% of Revenue) $0.10 - $0.14 Other Operating Expenses $8.5 MM - $10.5 MM General and Administrative $ 24 MM - $26 MM |

| Swaps Volume Average Hedge Price Oil 0.5 MMBBL $37.86 / BBL Gas 2.3 BCF $ 7.32 / MCF No-cost Collars Volume Lowest Floor Price Highest Ceiling Price Oil 0.1 MMBBL $70.00 / BBL $77.00 / BBL Gas 4.1 BCF $ 7.42 / MCF $20.53 / MCF Nine Months Remaining Fiscal 2007 Exploration & Production Hedging Summary at 12/31/06 Fiscal 2008 Swaps Volume Average Hedge Price Oil 0.2 MMBBL $51.80 / BBL Gas 2.3 BCF $ 8.22 / MCF No-cost Collars Volume Lowest Floor Price Highest Ceiling Price Gas 1.4 BCF $ 7.42 / MCF $17.81 / MCF |
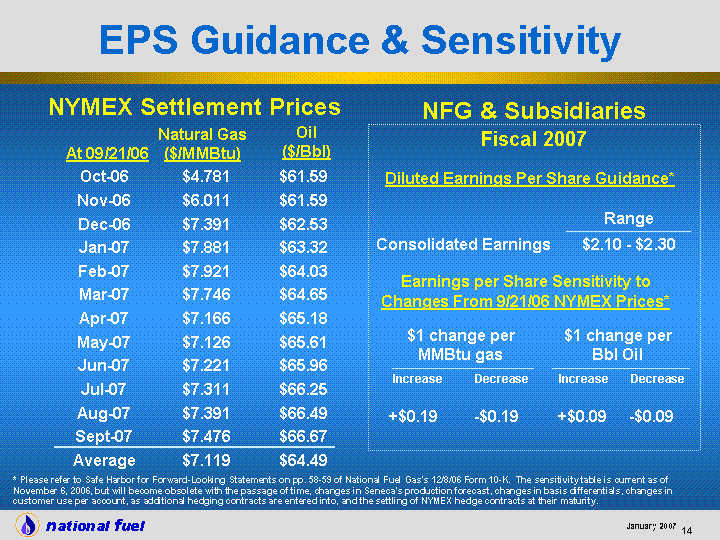
| EPS Guidance & Sensitivity Natural Gas ($/MMBtu) Oil ($/Bbl) At 09/21/06 $64.49 $7.119 Average $66.67 $7.476 Sept-07 $66.49 $7.391 Aug-07 $66.25 $7.311 Jul-07 $65.96 $7.221 Jun-07 $65.61 $7.126 May-07 $65.18 $7.166 Apr-07 $64.65 $7.746 Mar-07 $64.03 $7.921 Feb-07 $63.32 $7.881 Jan-07 $62.53 $7.391 Dec-06 $61.59 $6.011 Nov-06 $61.59 $4.781 Oct-06 * Please refer to Safe Harbor for Forward-Looking Statements on pp. 58-59 of National Fuel Gas's 12/8/06 Form 10-K. The sensitivity table is current as of November 6, 2006, but will become obsolete with the passage of time, changes in Seneca's production forecast, changes in basis differentials, changes in customer use per account, as additional hedging contracts are entered into, and the settling of NYMEX hedge contracts at their maturity. - -$0.09 +$0.09 - -$0.19 +$0.19 Decrease Decrease Increase $1 change per Bbl Oil $1 change per MMBtu gas Diluted Earnings Per Share Guidance* Range $2.10 - $2.30 Consolidated Earnings Earnings per Share Sensitivity to Changes From 9/21/06 NYMEX Prices* Increase Fiscal 2007 NFG & Subsidiaries NYMEX Settlement Prices |
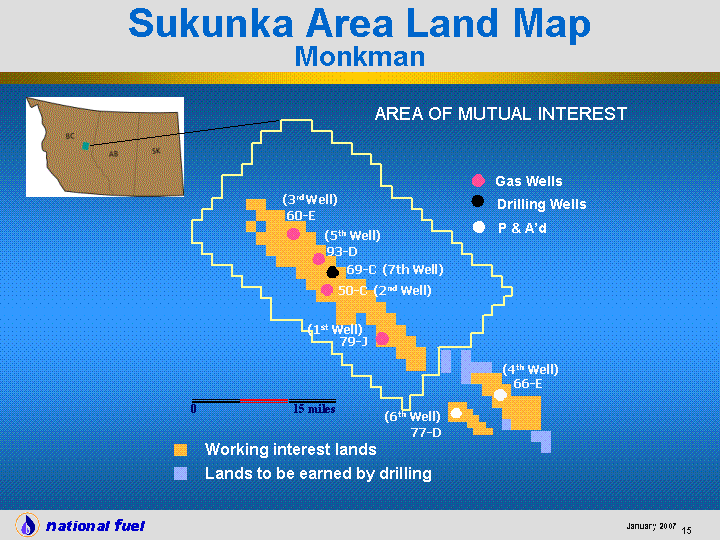
| 0 15 miles (2nd Well) (3rd Well) (5th Well) (4th Well) AREA OF MUTUAL INTEREST Gas Wells Drilling Wells Working interest lands Lands to be earned by drilling 66-E 79-J 50-C 93-D (1st Well) 60-E Sukunka Area Land Map Monkman P & A'd (6th Well) 77-D (7th Well) 69-C |
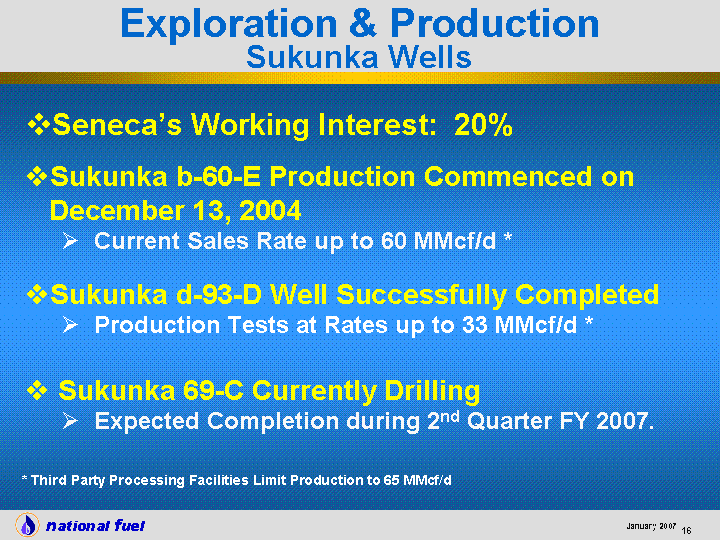
| Seneca's Working Interest: 20% Sukunka b-60-E Production Commenced on December 13, 2004 Current Sales Rate up to 60 MMcf/d * Sukunka d-93-D Well Successfully Completed Production Tests at Rates up to 33 MMcf/d * Sukunka 69-C Currently Drilling Expected Completion during 2nd Quarter FY 2007. Exploration & Production Sukunka Wells * Third Party Processing Facilities Limit Production to 65 MMcf/d |
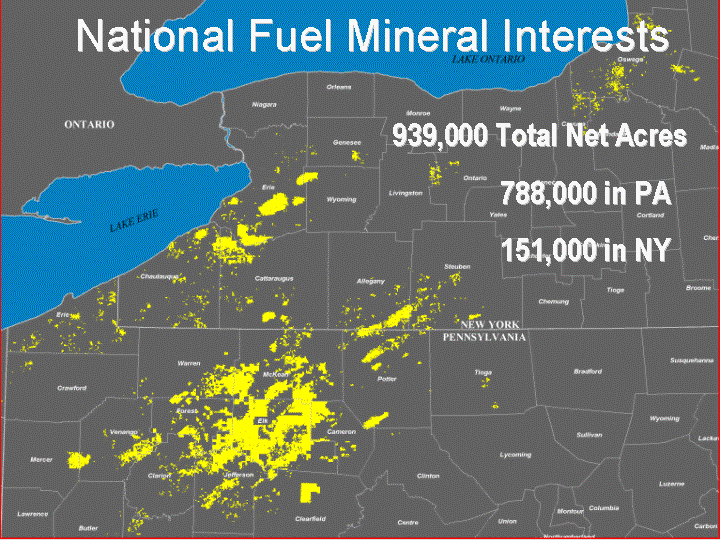
| 939,000 Total Net Acres 788,000 in PA 151,000 in NY National Fuel Mineral Interests |
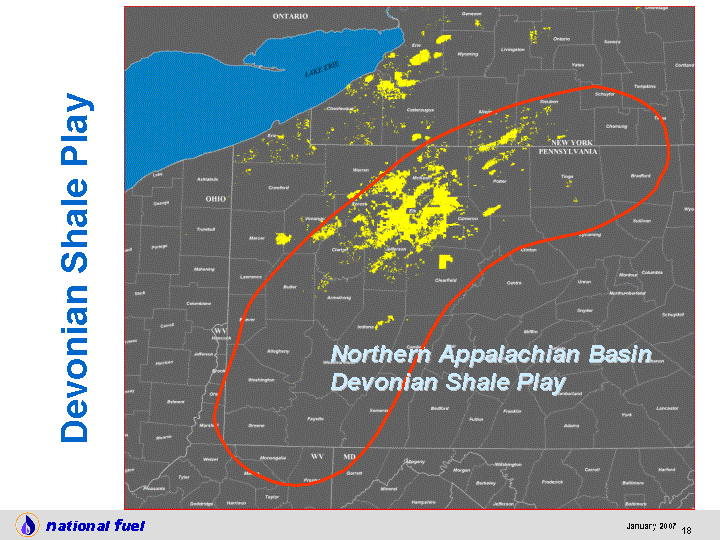
| Devonian Shale Play Northern Appalachian Basin Devonian Shale Play national fuel January 2007 37 |
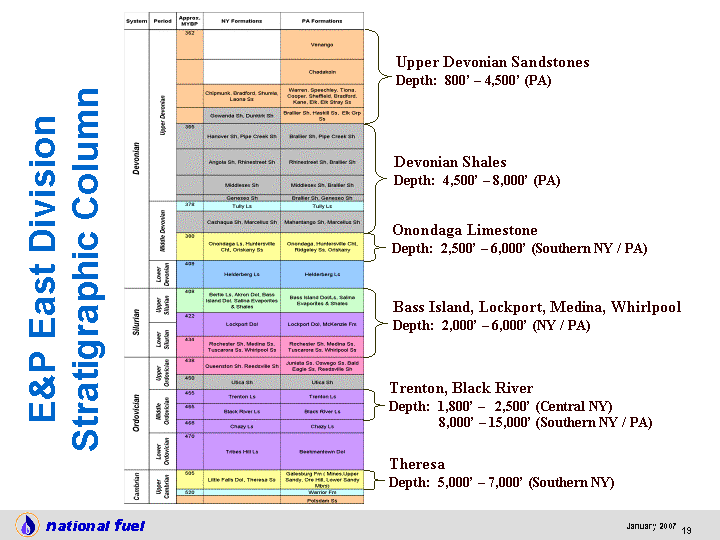
| E&P East Division Stratigraphic Column Devonian Shales Depth: 4,500' - 8,000' (PA) Bass Island, Lockport, Medina, Whirlpool Depth: 2,000' - 6,000' (NY / PA) Upper Devonian Sandstones Depth: 800' - 4,500' (PA) Onondaga Limestone Depth: 2,500' - 6,000' (Southern NY / PA) Trenton, Black River Depth: 1,800' - 2,500' (Central NY) 8,000' - 15,000' (Southern NY / PA) Theresa Depth: 5,000' - 7,000' (Southern NY) national fuel January 2007 39 |
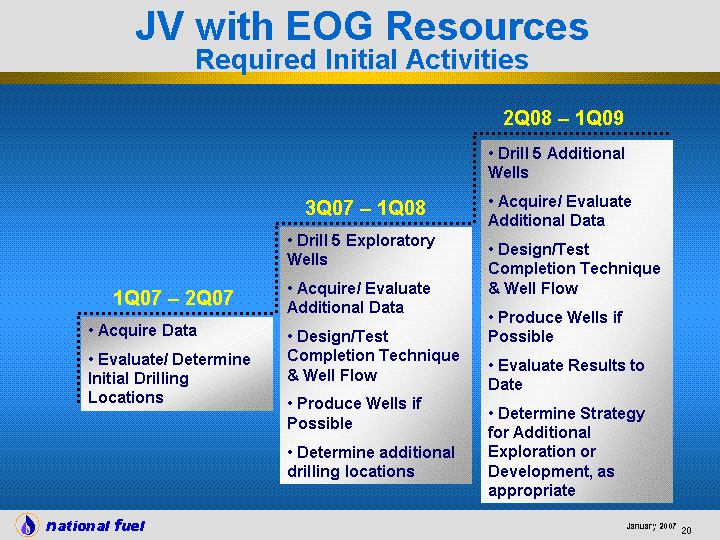
| JV with EOG Resources Required Initial Activities 1Q07 - 2Q07 3Q07 - 1Q08 2Q08 - 1Q09 Acquire Data Evaluate/ Determine Initial Drilling Locations Drill 5 Exploratory Wells Acquire/ Evaluate Additional Data Design/Test Completion Technique & Well Flow Produce Wells if Possible Determine additional drilling locations Drill 5 Additional Wells Acquire/ Evaluate Additional Data Design/Test Completion Technique & Well Flow Produce Wells if Possible Evaluate Results to Date Determine Strategy for Additional Exploration or Development, as appropriate |

| E&P East Division Net Well Completions Fiscal Year 2002 2003 2004 2005 2006 Productive 30 61 41 48 144.46 Dry 1.1 0.1 3 5 1.75 Success Ratio 0.96 1 0.93 0.91 0.99 Net Wells Completed 380% Increase in Productive Completions Success Ratio Climbed Back to 99% |
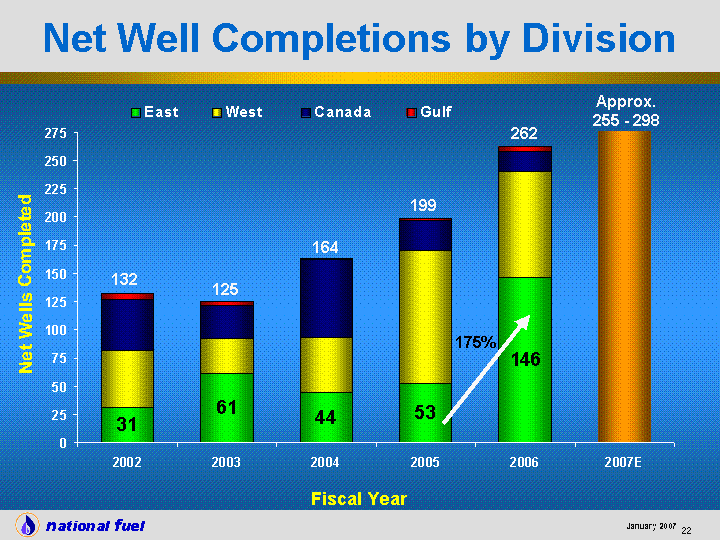
| 2002 2003 2004 2005 2006 2007E East 31.1 61.1 44 53 146.21 155 West 49.99 30.97 49 116.97 93.98 92 Canada 45.8 29.66 69.43 26.64 17.45 19 Gulf 5.25 3.35 1.15 2 4.57 10 Fiscal Year Net Well Completions by Division 132 125 164 262 199 Net Wells Completed 175% Approx. 255 - 298 |

| E&P East Division Capital Expenditures & Net Well Completions Fiscal Year 2002 2003 2004 2005 2006 2007E Productive 30 61 41 48 144.46 155 Dry 1.1 0.1 3 5 1.75 Capital Expenditures 8.4 9.4 9.5 12.5 27 35.5 Net Wells Completed Capital Expenditures ($ US Millions) Approx. 145 - 155 |
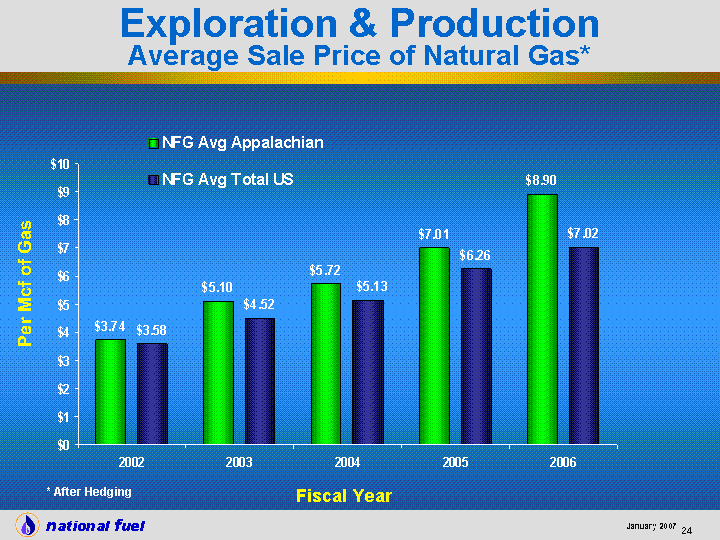
| Fiscal Year Exploration & Production Average Sale Price of Natural Gas* 2002 2003 2004 2005 2006 NFG Avg Appalachian 3.74 5.1 5.72 7.01 8.9 NFG Avg Total US 3.58 4.52 5.13 6.26 7.02 Per Mcf of Gas * After Hedging |
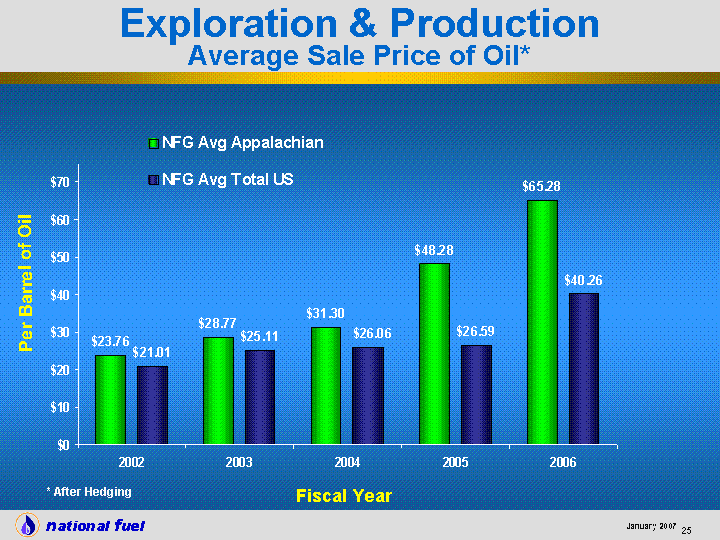
| Fiscal Year Exploration & Production Average Sale Price of Oil* 2002 2003 2004 2005 2006 NFG Avg Appalachian 23.76 28.77 31.3 48.28 65.28 NFG Avg Total US 21.01 25.11 26.06 26.59 40.26 Per Barrel of Oil * After Hedging |
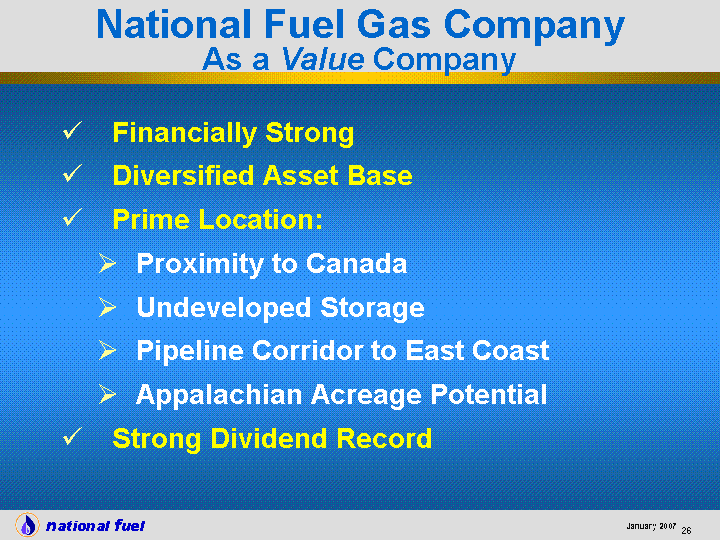
| National Fuel Gas Company As a Value Company Financially Strong Diversified Asset Base Prime Location: Proximity to Canada Undeveloped Storage Pipeline Corridor to East Coast Appalachian Acreage Potential Strong Dividend Record |
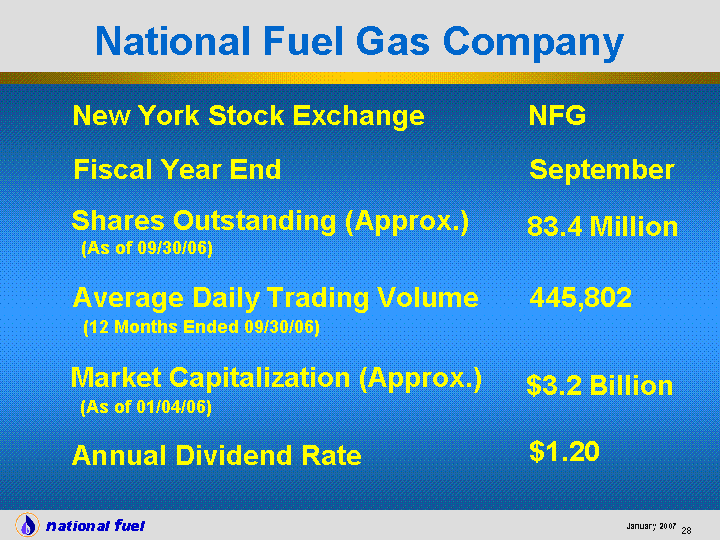
| National Fuel Gas Company New York Stock Exchange NFG Shares Outstanding (Approx.) (As of 09/30/06) 83.4 Million Average Daily Trading Volume (12 Months Ended 09/30/06) 445,802 Market Capitalization (Approx.) (As of 01/04/06) $3.2 Billion $1.20 Annual Dividend Rate September Fiscal Year End |
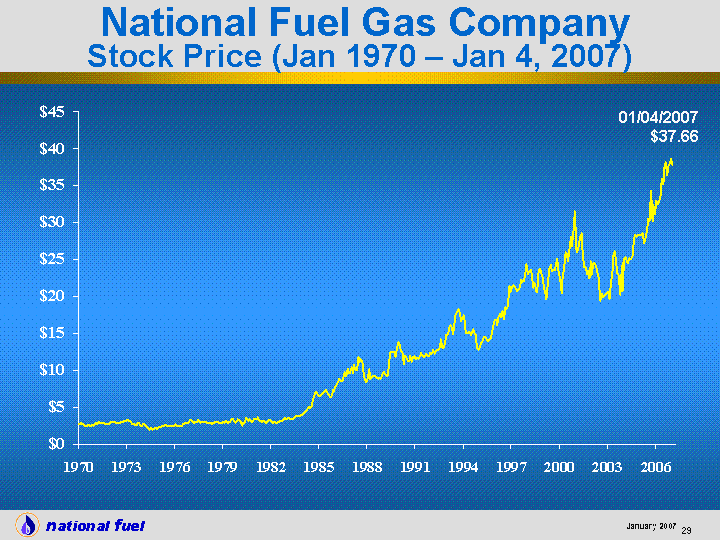
| 1/1/1970 2/1/1970 3/1/1970 4/1/1970 5/1/1970 6/1/1970 7/1/1970 8/1/1970 9/1/1970 10/1/1970 11/1/1970 12/1/1970 1/1/1971 2/1/1971 3/1/1971 4/1/1971 5/1/1971 6/1/1971 7/1/1971 8/1/1971 9/1/1971 10/1/1971 11/1/1971 12/1/1971 1/1/1972 2/1/1972 3/1/1972 4/1/1972 5/1/1972 6/1/1972 7/1/1972 8/1/1972 9/1/1972 10/1/1972 11/1/1972 12/1/1972 1/1/1973 2/1/1973 3/1/1973 4/1/1973 5/1/1973 6/1 /1973 7/1/1973 8/1/1973 9/1/1973 10/1/1973 11/1/1973 12/1/1973 1/1/1974 2/1/1974 3/1/1974 4/1/1974 5/1/1974 6/1/1974 7/1/1974 8/1/1974 9/1/1974 10/1/1974 11/1/1974 12/1/1974 1/1/1975 2/1/1975 3/1/1975 4/1/1975 5/1/1975 6/1/1975 7/1/1975 8/1/1975 9/1/1975 10/1/1975 11/1/1975 12/1/1975 1/1/1976 2/1/1976 3/1/1976 4/1/1976 5/1/1976 6/1/1976 7/1/1976 8/1/1976 9/1/1976 10/1/1976 11/1/1976 12/1/1976 1/1/1977 2/1/1977 3/1/1977 4/1/1977 5/1/1977 6/1/1977 7/1/1977 8/1/1977 9/1/1977 10/1/1977 11/1/1977 12/1/1977 1/1/1978 2/1/1978 3/1/1978 2.727279545 2.798297727 2.840918182 2.698881818 2.514225 2.372140909 2.428984091 2.642038636 2.5284 2.500002273 2.599418182 2.5284 2.784075 2.911936364 2.684659091 2.982954545 2.840918182 2.784075 2.7699 2.840918182 2.713056818 2.755677273 2.741454545 2.840918182 3.03975 3.03975 2.982954545 2.897713636 2.883538636 2.840918182 2.798297727 2.869315909 2.982954545 3.025575 3.153388636 3.139213636 3.181834091 3.210231818 3.139213636 2.897713636 2.713056818 2.727279545 2.613640909 2.627863636 2.883538636 2.7699 2.500002273 2.400586364 2.670436364 2.698881818 2.514225 2.386363636 2.159086364 1.974429545 2.173309091 1.974429545 2.045447727 2.144863636 2.088068182 2.088068182 2.343743182 2.301122727 2.457381818 2.357965909 2.500002273 2.556797727 2.428984091 2.400586364 2.357965909 2.400586364 2.4147613 64 2.428984091 2.713056818 2.500002273 2.500002273 2.5284 2.514225 2.5284 2.741454545 2.826695455 2.840918182 2.869315909 2.869315909 3.181834091 3.238629545 3.011352273 2.954556818 3.053972727 3.025575 3.238629545 3.110815909 2.897713636 2.997177273 3.025575 2.997177273 3.03975 2.840918182 2.840918182 2.883538636 National Fuel Gas Company Stock Price (Jan 1970 - Jan 4, 2007) 01/04/2007 $37.66 |
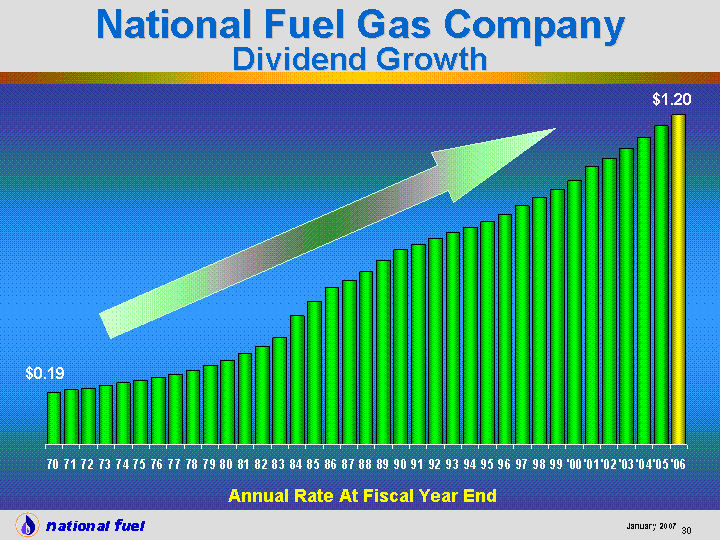
| 70 0.19 71 0.2 72 0.205 73 0.215 74 0.225 75 0.235 76 0.245 77 0.255 78 0.27 79 0.2875 80 0.3075 81 0.33 82 0.36 83 0.39 84 0.47 85 0.52 86 0.57 87 0.6 88 0.63 89 0.67 90 0.71 91 0.73 92 0.75 93 0.77 94 0.79 95 0.81 96 0.84 97 0.87 98 0.9 99 0.93 '00 0.96 '01 1.01 '02 1.04 '03 1.08 '04 1.12 '05 1.16 '06 1.2 National Fuel Gas Company Dividend Growth $0.19 $1.20 Annual Rate At Fiscal Year End |
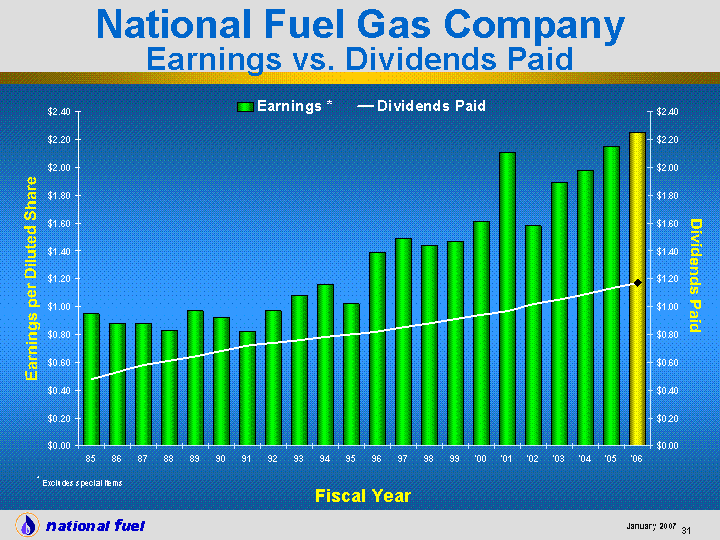
| Earnings * Dividends Paid 85 0.95 0.48 86 0.88 0.53 87 0.88 0.58 88 0.83 0.61 89 0.97 0.64 90 0.92 0.68 91 0.82 0.72 92 0.97 0.74 93 1.08 0.76 94 1.16 0.78 95 1.02 0.8 96 1.39 0.82 97 1.49 0.85 98 1.44 0.88 99 1.47 0.91 '00 1.61 0.94 '01 2.11 0.97 '02 1.58 1.02 '03 1.89 1.05 '04 1.98 1.09 '05 2.15 1.13 '06 2.25 1.17 * Excludes special items Dividends Paid Fiscal Year National Fuel Gas Company Earnings vs. Dividends Paid Earnings per Diluted Share |
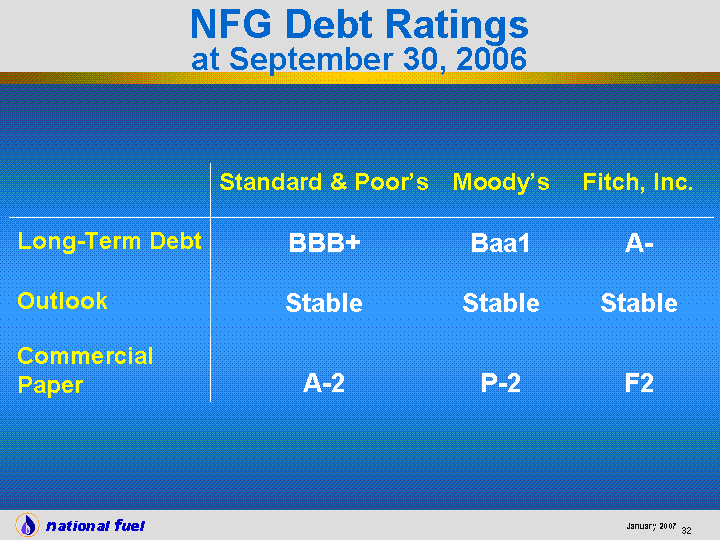
| Standard & Poor's Moody's Fitch, Inc. Long-Term Debt BBB+ Baa1 A- Outlook Stable Stable Stable Commercial Paper A-2 P-2 F2 NFG Debt Ratings at September 30, 2006 |

| Commercial Paper Program And Bilateral Credit Facilities - Aggregate Of $635 MM $0 MM borrowed at September 30, 2006 $300.0 MM Committed Credit Facility Through September 2010 $0 borrowed Universal Shelf Registration on File - Additional $550 MM Can Be Issued As Debt Or Equity Securities Any offer and sale of such securities will be made only by means of a prospectus meeting requirements of securities laws National Fuel Gas Company Capital Resources |
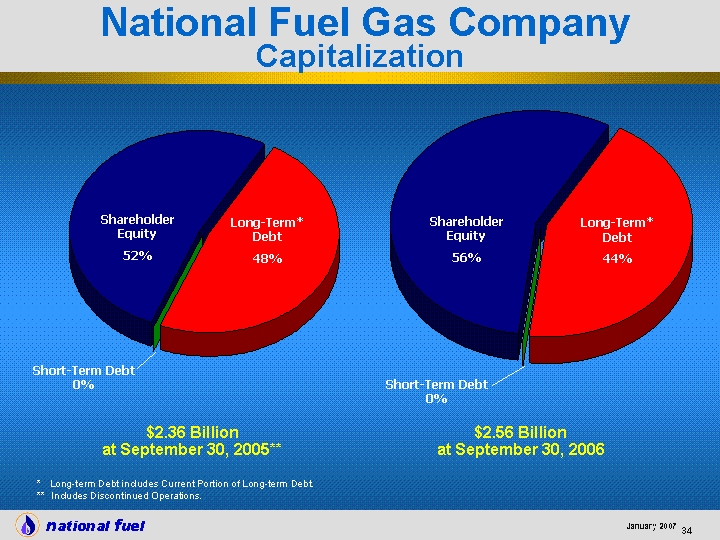
| * Long-term Debt includes Current Portion of Long-term Debt. ** Includes Discontinued Operations. $2.36 Billion at September 30, 2005** Long-Term Debt Short-Term Debt Shareholder Equity Capitalization 1128 0 1230 Short-Term Debt 0% Shareholder Equity 52% Long-Term* Debt 48% $2.56 Billion at September 30, 2006 Long-Term Debt Short-Term Debt Shareholder Equity Capitalization 1119 0 1444 Short-Term Debt 0% National Fuel Gas Company Capitalization Shareholder Equity 56% Long-Term* Debt 44% |
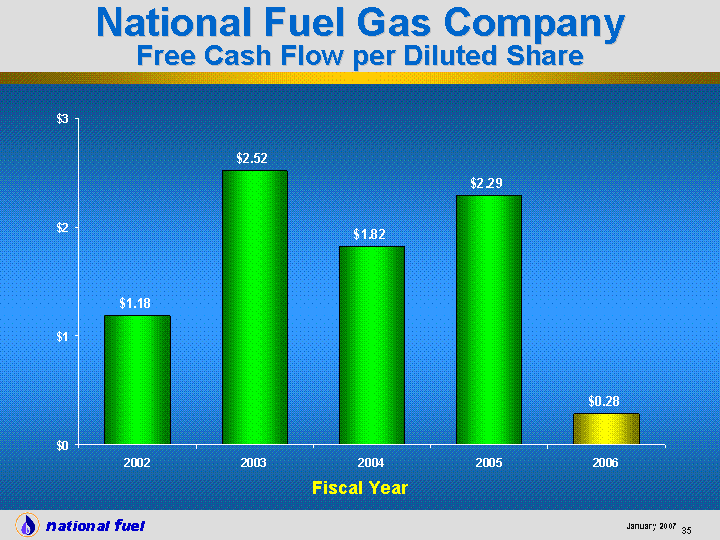
| 2002 2003 2004 2005 2006 CFPS 1.18 2.52 1.82 2.29 0.28 Fiscal Year National Fuel Gas Company Free Cash Flow per Diluted Share |
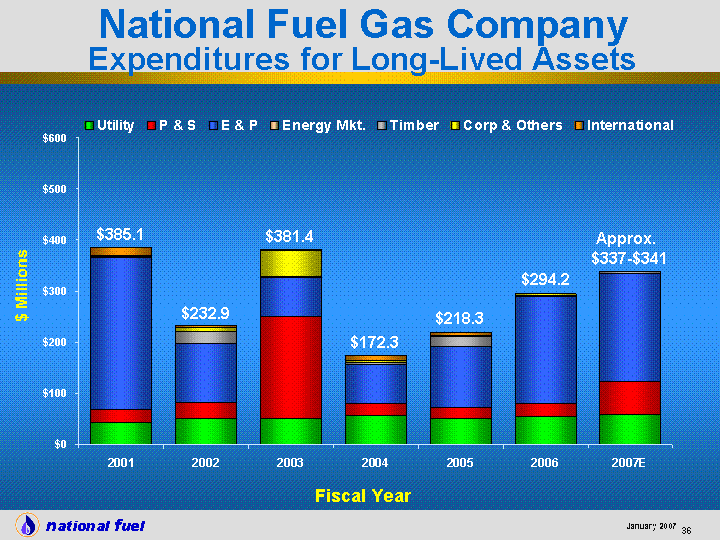
| 2001 2002 2003 2004 2005 2006 2007E Utility 42.4 51.5 49.9 55.5 50.1 54.4 58 P & S 26 30.3 199.4 23.2 21.1 26 65 E & P 296.4 114.6 75.8 77.7 121.2 208.3 212 Energy Mkt. 0.116 0.1 0.2 0.0102 0 $- 0 Timber 3.7 25.6 3.5 2.8 18.9 2.3 2 Corp & Others 0.937 6.6 50.1 5.7 1.1 3.2 2 International 15.6 4.2 2.5 7.5 5.9 0 $385.1 $ Millions $232.9 $381.4 $172.3 $218.3 Fiscal Year National Fuel Gas Company Expenditures for Long-Lived Assets $294.2 Approx. $337-$341 |
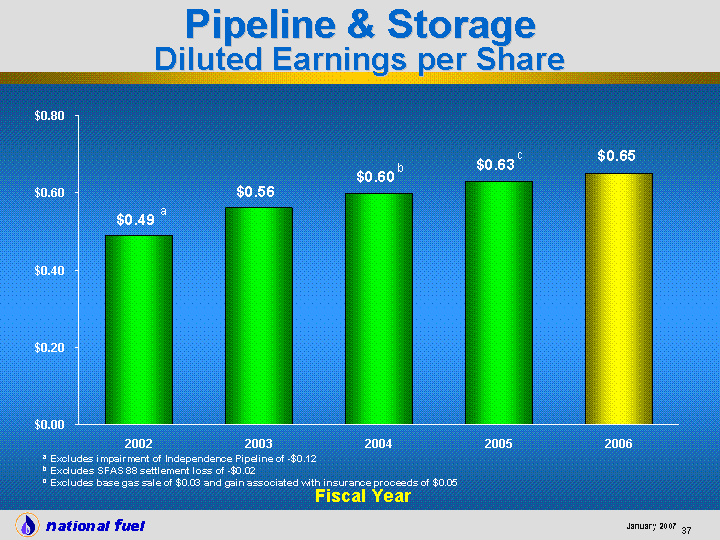
| Fiscal Year 2002 2003 2004 2005 2006 Earnings 0.49 0.56 0.599 0.63 0.65 a Excludes impairment of Independence Pipeline of -$0.12 b Excludes SFAS 88 settlement loss of -$0.02 c Excludes base gas sale of $0.03 and gain associated with insurance proceeds of $0.05 a b Fiscal Year Pipeline & Storage Diluted Earnings per Share c |
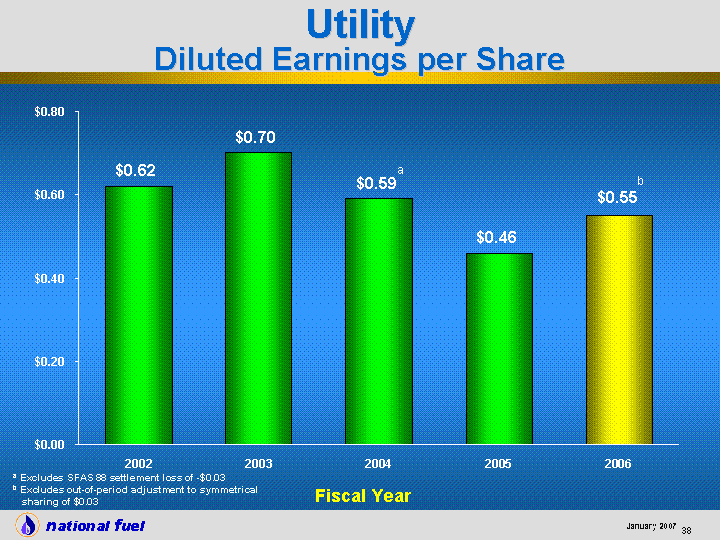
| Fiscal Year 2001 2002 2003 2004 2005 2006 Earnings 0.76 0.62 0.7 0.59 0.46 0.55 a Excludes SFAS 88 settlement loss of -$0.03 b Excludes out-of-period adjustment to symmetrical sharing of $0.03 a Fiscal Year Utility Diluted Earnings per Share b |

| Energy Marketing Diluted Earnings per Share Fiscal Year 2002 2003 2004 2005 2006 Earnings 0.11 0.07 0.07 0.06 0.07 Fiscal Year |

| Fiscal Year 2002 2003 2004 2005 2006 Earnings 0.12 0.12 0.07 0.06 0.07 a Excludes gain from timber sale of +$1.26 b Excludes adj. of gain on timber sale of -$0.01 a b Fiscal Year Timber Diluted Earnings per Share |

| Comparable GAAP Financial Measure Slides And Reconciliations |

| $138.1 Million 12 Months Ended September 30, 2006 Utility P&S E&P Timber Energy Mkt. Corp. & Other NI 49.8 55.6 21 5.7 5.8 1 National Fuel Gas Company Net Income from Continuing Operations |
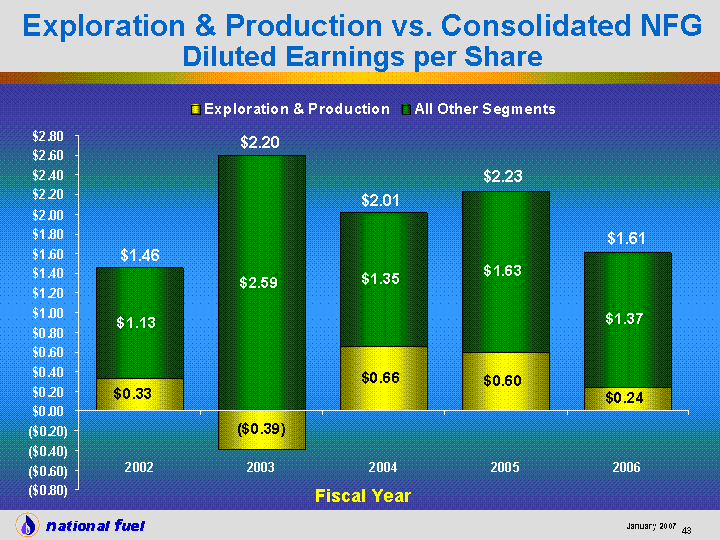
| 1999 2000 2001 2002 2003 2004 2005 2006 Exploration & Production 0.09 0.44 -0.4 0.33 -0.39 0.66 0.6 0.24 All Other Segments 1.38 1.17 1.22 1.13 2.59 1.35 1.63 1.37 $1.46 $2.20 $2.01 $2.23 Fiscal Year Exploration & Production vs. Consolidated NFG Diluted Earnings per Share $1.61 |
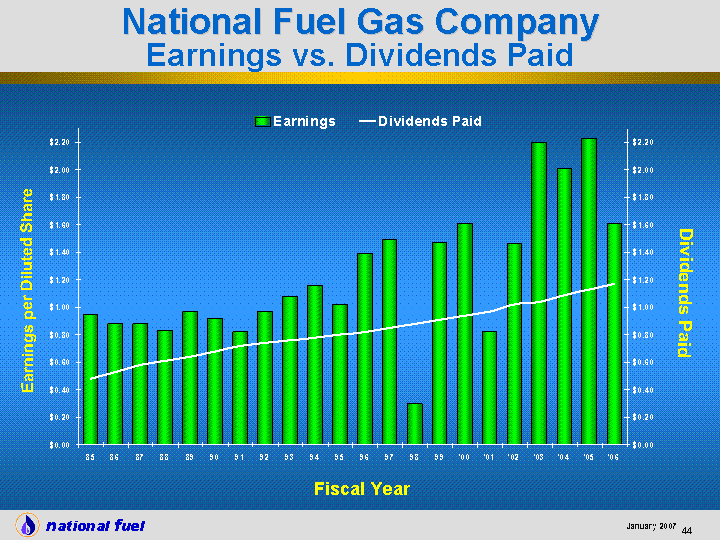
| Earnings Dividends Paid 85 0.95 0.48 86 0.88 0.53 87 0.88 0.58 88 0.83 0.61 89 0.97 0.64 90 0.92 0.68 91 0.82 0.72 92 0.97 0.74 93 1.08 0.76 94 1.16 0.78 95 1.02 0.8 96 1.39 0.82 97 1.49 0.85 98 0.3 0.88 99 1.47 0.91 '00 1.61 0.94 '01 0.82 0.97 '02 1.46 1.02 '03 2.2 1.04 '04 2.01 1.09 '05 2.23 1.13 '06 1.61 1.17 National Fuel Gas Company Earnings vs. Dividends Paid Fiscal Year Dividends Paid Earnings per Diluted Share |
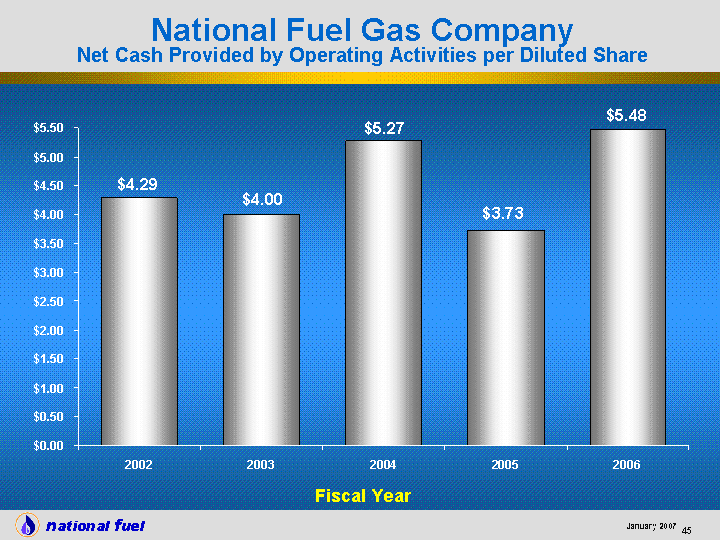
| 2002 2003 2004 2005 2006 4.29 4 5.27 3.73 5.48 Fiscal Year National Fuel Gas Company Net Cash Provided by Operating Activities per Diluted Share |
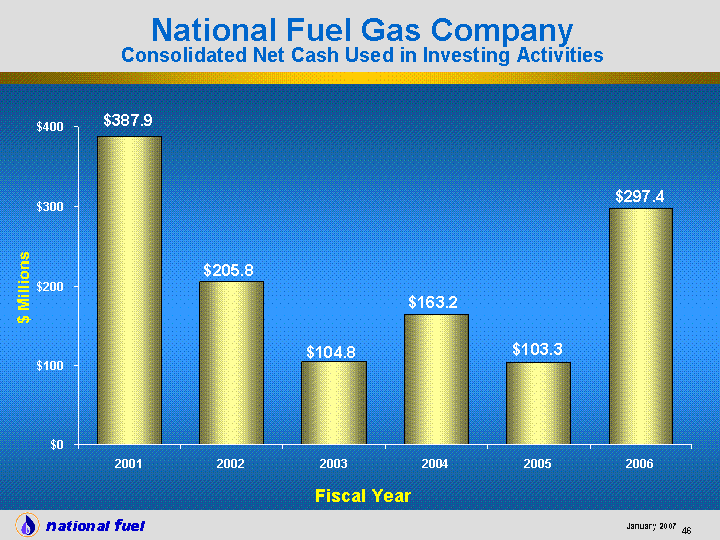
| 2001 2002 2003 2004 2005 2006 387.9 205.8 104.8 163.2 103.3 297.4 Fiscal Year National Fuel Gas Company Consolidated Net Cash Used in Investing Activities $ Millions |
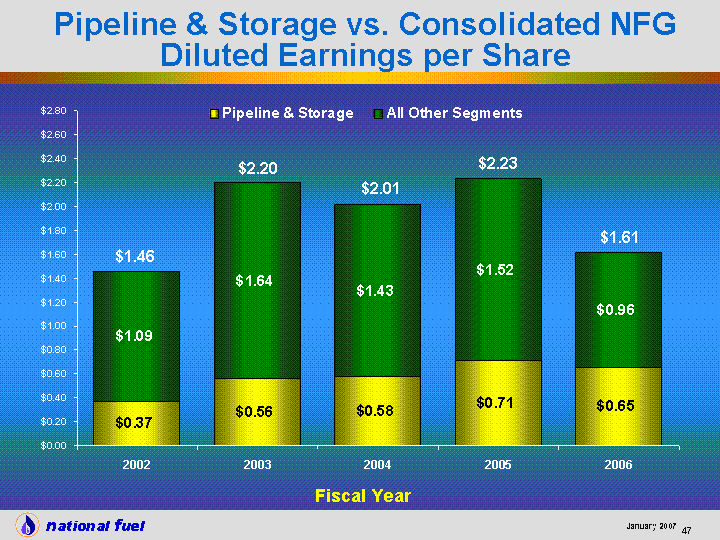
| 1999 2000 2001 2002 2003 2004 2005 2006 Pipeline & Storage 0.51 0.4 0.5 0.37 0.56 0.58 0.71 0.65 All Other Segments 0.96 1.21 0.32 1.09 1.64 1.43 1.52 0.96 $1.46 $2.20 $2.01 $2.23 Fiscal Year Pipeline & Storage vs. Consolidated NFG Diluted Earnings per Share $1.61 |
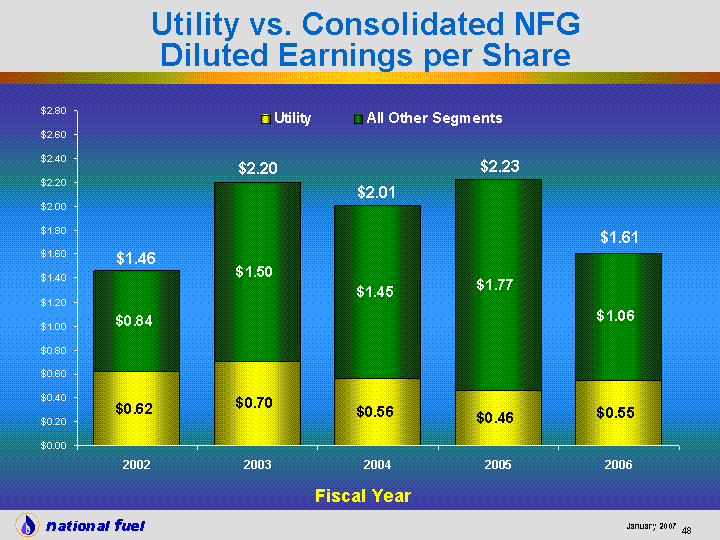
| 1999 2000 2001 2002 2003 2004 2005 2006 Utility 0.51 0.4 0.76 0.62 0.7 0.56 0.46 0.55 All Other Segments 0.96 1.21 0.06 0.84 1.5 1.45 1.77 1.06 $1.46 $2.20 $2.01 $2.23 Fiscal Year Utility vs. Consolidated NFG Diluted Earnings per Share $1.61 |
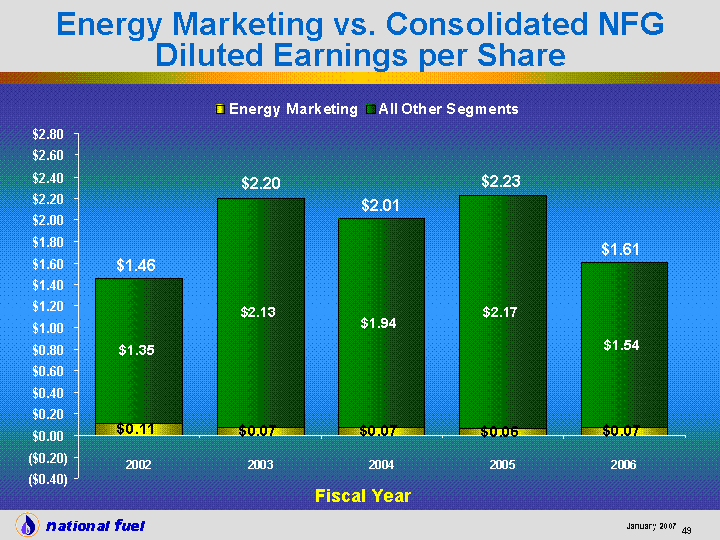
| 2001 2002 2003 2004 2005 2006 Energy Marketing -0.04 0.11 0.07 0.07 0.06 0.07 All Other Segments 0.86 1.35 2.13 1.94 2.17 1.54 Fiscal Year Energy Marketing vs. Consolidated NFG Diluted Earnings per Share $1.46 $2.20 $2.01 $2.23 $1.61 |
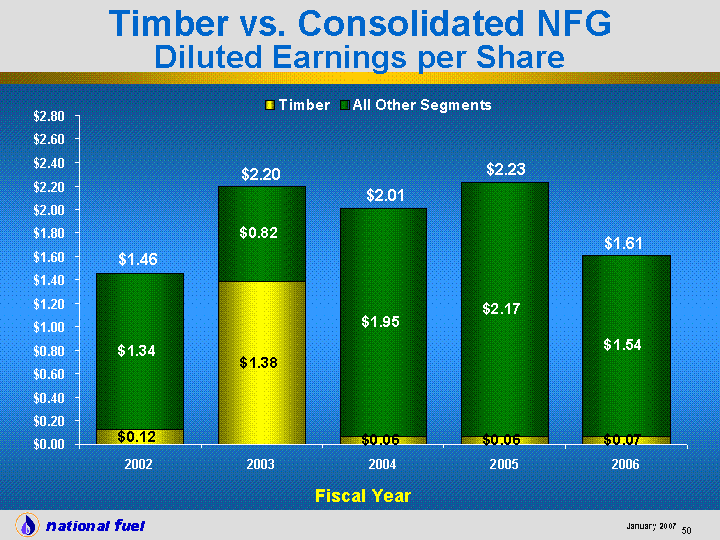
| 1999 2000 2001 2002 2003 2004 2005 2006 Timber 0.06 0.08 0.1 0.12 1.38 0.06 0.06 0.07 All Other Segments 1.41 1.53 0.72 1.34 0.82 1.95 2.17 1.54 $1.46 $2.20 $2.01 $2.23 Fiscal Year Timber vs. Consolidated NFG Diluted Earnings per Share $1.61 |
Reconciliation of Segment Net Income from Continuing Operations to
Consolidated Net Income from Continuing Operations
(‘000)
| | | | | | | | | |
| | | 12 Mos Ended 9/30/06 | |
| Utility | | $ | 47,264 | | | | | |
| Plus: Out-of-Period Adjustment to Symmetrical Sharing | | | 2,551 | | | $ | 49,815 | |
| | | | | | | | |
| | | | | | | | | |
| Pipeline & Storage | | | | | | | 55,633 | |
| | | | | | | | | |
| Exploration & Production | | $ | 78,415 | | | | | |
| Plus: Impairment of O&G Prod. Prop. | | | (68,646 | ) | | | | |
| Income Tax Adjustments | | | 11,202 | | | | 20,971 | |
| | | | | | | | |
| | | | | | | | | |
| Energy Marketing | | | | | | | 5,798 | |
| | | | | | | | | |
| Timber | | | | | | | 5,704 | |
| | | | | | | | | |
| Corporate & Other | | | | | | | 170 | |
| | | | | | | | |
| | | | | | | | | |
| Consolidated Net Income from Continuing Operations | | | | | | $ | 138,091 | |
| | | | | | | | |
Reconciliation of Exploration & Production Operating Revenue to
Consolidated Operating Revenue
($000s)
| | | | | |
| | | 2006 | |
| Exploration & Production | | $ | 346,880 | |
| All Other Segments | | | 1,964,779 | |
| | | | |
| Consolidated Operating Revenue | | $ | 2,311,659 | |
| | | | |
Reconciliation of Exploration & Production Net Income to
Consolidated Net Income
($000s)
| | | | | |
| | | 2006 | |
| Exploration & Production | | $ | 20,971 | |
| All Other Segments | | | 117,120 | |
| | | | |
| Consolidated Net Income | | $ | 138,091 | |
| | | | |
Reconciliation of Exploration & Production Depreciation, Depletion and Amortization to
Consolidated Depreciation, Depletion and Amortization (DD&A)
($000s)
| | | | | |
| | | 2006 | |
| Exploration & Production DD&A * | | $ | 94,738 | |
| All Other Segments DD&A | | | 84,877 | |
| | | | |
| Consolidated DD&A | | $ | 179,615 | |
| | | | |
| | |
| * | | DD&A and Total LOE cost per Mcf equivalent equals Exploration & Production DD&A and Total LOE costs, respectively, for the referenced fiscal period, divided by the Total Gas & Oil Production (Mmcfe) in that same fiscal period. |
Reconciliation of Exploration & Production Lease Operating Expense (LOE) to
Consolidated O&M
($000s)
| | | | | |
| | | 2006 | |
Exploration & Production LOE | | $ | 50,944 | |
Exploration & Production Property, Franchise and Other Taxes | | | 5,038 | |
| | | | |
| Exploration & Production Total LOE * | | $ | 55,982 | |
| | | | |
| | | | | |
Exploration & Production LOE | | $ | 50,944 | |
| Exploration & Production Other O&M | | | 31,385 | |
| | | | |
| Exploration & Production Total O&M | | $ | 82,329 | |
| All Other Segments O&M | | | 331,397 | |
| | | | |
| Total Consolidated O&M | | $ | 413,726 | |
| | | | |
| | | | | |
Exploration & Production Property, Franchise and Other Taxes | | $ | 5,038 | |
| All Other Segments Property, Franchise and Other Taxes | | | 64,904 | |
| | | | |
| Total Consolidated Property Franchise and Other Taxes | | $ | 69,942 | |
| | | | |
Reconciliation of Exploration & Production General & Administrative Costs to
Consolidated O&M
($000s)
| | | | | |
| | | 2006 | |
| Exploration & Production General & Administrative * | | $ | 23,352 | |
| Exploration & Production All Other O&M | | | 58,977 | |
| | | | |
| Exporation & Production Total O&M | | $ | 82,329 | |
| All Other Segments O&M | | | 331,397 | |
| | | | |
| Total Consolidated O&M | | $ | 413,726 | |
| | | | |
| | |
| * | | General and Administrative cost per Mcf equivalent equals Exploration & Production General and Administrative cost, for the referenced fiscal period, divided by the Total Gas & Oil Production (Mmcfe) in that same fiscal period. |
Reconciliation of Exploration & Production Segment Capital Expenditures to
Consolidated Capital Expenditures
($000s)
| | | | | | | | | | | | | | | | | | | | | | | | | | | | | | | | | |
| | | 2002 | | 2003 | | 2004 | | 2005 | | 2006 | | 2007E |
| | | |
| Exploration & Production Capital Expenditures | | $ | 114,602 | | | $ | 75,837 | | | $ | 77,654 | | | $ | 121,200 | | | $ | 207,000 | | | $ | 210,000 | | | | — | | | $ | 214,000 | |
| Other | | | — | | | | — | | | | — | | | | 1,250 | | | | — | | | | | | | | | | | | — | |
| | | |
| Total Exploration & Production Capital Expenditures | | $ | 114,602 | | | $ | 75,837 | | | $ | 77,654 | | | $ | 122,450 | | | $ | 207,000 | | | $ | 210,000 | | | | — | | | $ | 214,000 | |
| All Other | | | 117,766 | | | | 76,414 | | | | 94,687 | | | | 97,080 | | | | 95,500 | | | | | | | | | | | | 127,000 | |
| | | |
| Total Corporation | | $ | 232,368 | | | $ | 152,251 | | | $ | 172,341 | | | $ | 219,530 | | | $ | 302,500 | | | $ | 337,000 | | | | — | | | $ | 341,000 | |
| | | |
NATIONAL FUEL GAS COMPANY
AND SUBSIDIARIES
RECONCILIATION TO REPORTED EARNINGS
| | | | | | | | | | | | | | | | | | | | | |
| | | Fiscal Year | | | Fiscal Year | | | Fiscal Year | | | Fiscal Year | | | Fiscal Year | |
| | | Ended | | | Ended | | | Ended | | | Ended | | | Ended | |
| (Diluted Earnings Per Share) | | September 30, 2002 | | | September 30, 2003 | | | September 30, 2004 | | | September 30, 2005 | | | September 30, 2006 | |
| | | |
Utility | | | | | | | | | | | | | | | | | | | | |
| Reported earnings | | $ | 0.62 | | | $ | 0.70 | | | $ | 0.56 | | | $ | 0.46 | | | $ | 0.58 | |
| Out-of-period adjustment to symmetical sharing | | | — | | | | — | | | | — | | | | — | | | | (0.03 | ) |
| Pension settlement loss | | | — | | | | — | | | | 0.03 | | | | — | | | | — | |
| | | |
| Earnings before non-recurring items | | | 0.62 | | | | 0.70 | | | | 0.59 | | | | 0.46 | | | | 0.55 | |
| | | |
| | | | | | | | | | | | | | | | | | | | | |
Pipeline and Storage | | | | | | | | | | | | | | | | | | | | |
| Reported earnings | | | 0.37 | | | | 0.56 | | | | 0.58 | | | | 0.71 | | | | 0.65 | |
| Impairment of Independence Pipeline | | | 0.12 | | | | — | | | | — | | | | — | | | | — | |
| Pension settlement loss | | | — | | | | — | | | | 0.02 | | | | — | | | | — | |
| Gain associated with insurance proceeds | | | — | | | | — | | | | — | | | | (0.05 | ) | | | — | |
| Base gas sale | | | | | | | | | | | | | | | (0.03 | ) | | | — | |
| | | |
| Earnings before non-recurring items | | | 0.49 | | | | 0.56 | | | | 0.60 | | | | 0.63 | | | | 0.65 | |
| | | |
| | | | | | | | | | | | | | | | | | | | | |
Exploration and Production | | | | | | | | | | | | | | | | | | | | |
| Reported earnings | | | 0.33 | | | | (0.39 | ) | | | 0.66 | | | | 0.60 | | | | 0.24 | |
| Income tax adjustments | | | — | | | | — | | | | — | | | | — | | | | -0.13 | |
| Loss on sale of oil and gas assets | | | — | | | | 0.48 | | | | — | | | | — | | | | | |
| Impairment of oil and gas producing properties | | | — | | | | 0.36 | | | | — | | | | — | | | | 0.80 | |
| Cumulative Effect of Change in Accounting | | | — | | | | 0.01 | | | | — | | | | — | | | | | |
| Adjustment of loss on sale of oil and gas assets | | | — | | | | — | | | | (0.06 | ) | | | — | | | | | |
| Pension settlement loss | | | — | | | | — | | | | 0.01 | | | | — | | | | | |
| | | |
| Earnings before non-recurring items | | | 0.33 | | | | 0.46 | | | | 0.61 | | | | 0.60 | | | | 0.91 | |
| | | |
| | | | | | | | | | | | | | | | | | | | | |
International | | | | | | | | | | | | | | | | | | | | |
| Reported earnings | | | (0.06 | ) | | | (0.12 | ) | | | 0.07 | | | | | | | | | |
| Cumulative Effect of Change in Accounting | | | — | | | | 0.10 | | | | — | | | see | | | | |
| Pension settlement loss | | | — | | | | — | | | | — | | | “Discontinued | | | | |
| Tax rate change | | | — | | | | — | | | | (0.06 | ) | | Operations” | | | | |
| Repatriation tax | | | | | | | | | | | | | | below | | | | |
| | | | | | | | | | | |
| Earnings before non-recurring items | | | (0.06 | ) | | | (0.02 | ) | | | 0.01 | | | | | | | | | |
| | | | | | | | | | | |
| | | | | | | | | | | | | | | | | | | | | |
Energy Marketing | | | | | | | | | | | | | | | | | | | | |
| Reported earnings | | | 0.11 | | | | 0.07 | | | | 0.07 | | | | 0.06 | | | | 0.07 | |
| Pension settlement loss | | | — | | | | — | | | | — | | | | — | | | | — | |
| | | |
| Earnings before non-recurring items | | | 0.11 | | | | 0.07 | | | | 0.07 | | | | 0.06 | | | | 0.07 | |
| | | |
| | | | | | | | | | | | | | | | | | | | | |
Timber | | | | | | | | | | | | | | | | | | | | |
| Reported earnings | | | 0.12 | | | | 1.38 | | | | 0.06 | | | | 0.06 | | | | 0.07 | |
| Gain on sale of timber assets | | | — | | | | (1.26 | ) | | | — | | | | — | | | | — | |
| Pension settlement loss | | | — | | | | — | | | | — | | | | — | | | | — | |
| Adjustment of gain on sale of timber properties | | | — | | | | — | | | | 0.01 | | | | — | | | | — | |
| | | |
| Earnings before non-recurring items | | | 0.12 | | | | 0.12 | | | | 0.07 | | | | 0.06 | | | | 0.07 | |
| | | |
| | | | | | | | | | | | | | | | | | | | | |
Corporate and All Other | | | | | | | | | | | | | | | | | | | | |
| Reported earnings | | | (0.03 | ) | | | — | | | | 0.01 | | | | (0.08 | ) | | | — | |
| Pension settlement loss | | | — | | | | — | | | | 0.02 | | | | — | | | | — | |
| | | |
| Earnings before non-recurring items | | | (0.03 | ) | | | — | | | | 0.03 | | | | (0.08 | ) | | | — | |
| | | |
| | | | | | | | | | | | | | | | | | | | | |
Consolidated | | | | | | | | | | | | | | | | | | | | |
| Reported earnings | | | 1.46 | | | | 2.20 | | | | 2.01 | | | | | | | | | |
| Total non-recurring items from above | | | 0.12 | | | | (0.31 | ) | | | (0.03 | ) | | | | | | | | |
| | | | | | | | | | | |
| Earnings before non-recurring items | | $ | 1.58 | | | $ | 1.89 | | | $ | 1.98 | | | | | | | | | |
| | | | | | | | | | | |
| | | | | | | | | | | | | | | | | | | | | |
Consolidated Earnings from Continuing Operations | | | | | | | | | | | | | | | | | | | | |
| Reported earnings from continuing operations | | | | | | | | | | | | | | | 1.81 | | | | 1.61 | |
| Total non-recurring items from above | | | | | | | | | | | | | | | (0.08 | ) | | | 0.64 | |
| | | | | | | | | | | | | | | |
| Earnings from continuing operations before non-recurring items | | | | | | | | | | | | | | $ | 1.73 | | | $ | 2.25 | |
| | | | | | | | | | | | | | | |
Discontinued Operations | | | | | | | | | | | | | | | | | | | | |
| Reported earnings from discontinued operations | | | | | | | | | | | | | | | 0.42 | | | | | |
| | | | | | | | | | | | | | | | | | | | |
Consolidated | | | | | | | | | | | | | | | | | | | | |
| Reported earnings | | | | | | | | | | | | | | $ | 2.23 | | | $ | 1.61 | |
| | | | | | | | | | | | | | | |
Free Cash Flow Per Diluted Share Calculation
and Reconciliation to Net Cash Provided by Operating Activities
| | | | | | | | | | | | | | | | | | | | | |
| | | Fiscal Year Ended | | | Fiscal Year Ended | | | Fiscal Year Ended | | | Fiscal Year Ended | | | Fiscal Year Ended | |
| | | September 30, 2002 | | | September 30, 2003 | | | September 30, 2004 | | | September 30, 2005 | | | September 30, 2006 | |
| Net Income | | $ | 117,682 | | | $ | 178,944 | | | $ | 166,586 | | | $ | 189,488 | | | $ | 138,091 | |
| DD&A | | | 180,668 | | | | 195,226 | | | | 189,538 | | | | 193,144 | | | | 179,615 | |
| Impairment of Oil and Gas Producing Properties | | | — | | | | 42,774 | | | | — | | | | — | | | | 104,739 | |
| Impairment of Investment in Partnership | | | 15,167 | | | | — | | | | — | | | | 4,158 | | | | — | |
| (Income) Loss from Unconsolidated Subsidiaries, Net of Cash Distributions | | | 361 | | | | 703 | | | | (19 | ) | | | (1,372 | ) | | | 1,068 | |
| Excess Tax Benefits Associated with Stock-Based Compensation Awards | | | — | | | | — | | | | — | | | | — | | | | (6,515 | ) |
| Gain on Sale of Discontinued Operations | | | — | | | | — | | | | — | | | | (27,386 | ) | | | — | |
| Loss (Gain) on Sale of Oil and Gas Properties | | | — | | | | 58,472 | | | | (4,645 | ) | | | — | | | | — | |
| (Gain) Loss on Sale of Timber Properties | | | | | | | (168,787 | ) | | | 1,252 | | | | — | | | | — | |
| Deferred Income Taxes | | | 62,013 | | | | 78,369 | | | | 40,329 | | | | 40,388 | | | | (5,231 | ) |
| Minority Interest in Foreign Subsidiaries | | | 730 | | | | 785 | | | | 1,933 | | | | 2,645 | | | | — | |
| Cumulative Effect of Changes in Accounting | | | — | | | | 8,892 | | | | — | | | | — | | | | — | |
| Other | | | 9,842 | | | | 11,289 | | | | 9,839 | | | | 7,390 | | | | 4,829 | |
| | | | | | | | | | | | | | | | |
| | | | 386,463 | | | | 406,667 | | | | 404,813 | | | | 408,455 | | | | 416,596 | |
| Less: Dividends Paid on Common Stock (Including Dividends to Minority Interests) | | | (80,974 | ) | | | (84,530 | ) | | | (89,092 | ) | | | (106,835 | ) | | | (98,266 | ) |
| Plus: Net Proceeds from Sale of Oil and Gas Producing Properties | | | 22,068 | | | | 78,531 | | | | 7,162 | | | | 1,349 | | | | 13 | |
| Plus: Net Proceeds from Sale of Timber Properties | | | — | | | | 186,014 | | | | — | | | | — | | | | — | |
| Plus: Net Proceeds from Sale of Foreign Subsidiary | | | — | | | | — | | | | — | | | | 111,619 | | | | — | |
| Less: Expenditures for Long-Lived Assets | | | (232,904 | ) | | | (381,440 | ) | | | (172,341 | ) | | | (219,530 | ) | | | (294,159 | ) |
| | | | | | | | | | | | | | | | |
| Free Cash Flow | | $ | 94,653 | | | $ | 205,242 | | | $ | 150,542 | | | $ | 195,058 | | | $ | 24,184 | |
| | | | | | | | | | | | | | | | |
| | | | | | | | | | | | | | | | | | | | | |
| Weighted Average Diluted Shares | | | 80,534 | | | | 81,358 | | | | 82,900 | | | | 85,029 | | | | 86,029 | |
| | | | | | | | | | | | | | | | | | | | | |
Free Cash Flow Per Diluted Share | | $ | 1.18 | | | $ | 2.52 | | | $ | 1.82 | | | $ | 2.29 | | | $ | 0.28 | |
| | | | | | | | | | | | | | | | |
| | | | | | | | | | | | | | | | | | | | | |
Reconciliation to Net Cash Provided by Operating Activities: | | | | | | | | | | | | | | | | | | | | |
| Free Cash Flow | | $ | 94,653 | | | $ | 205,242 | | | $ | 150,542 | | | $ | 195,058 | | | $ | 24,184 | |
| Add Back: | | | | | | | | | | | | | | | | | | | | |
| Expenditures for Long-Lived Assets | | | 232,904 | | | | 381,440 | | | | 172,341 | | | | 219,530 | | | | 294,159 | |
| Dividends Paid on Common Stock (Inc. Dividends to Minority Interests) | | | 80,974 | | | | 84,530 | | | | 89,092 | | | | 106,835 | | | | 98,266 | |
| Deduct: | | | | | | | | | | | | | | | | | | | | |
| Net Proceeds from Sale of Oil and Gas Producing Properties | | | (22,068 | ) | | | (78,531 | ) | | | (7,162 | ) | | | (1,349 | ) | | | (13 | ) |
| Net Proceeds from Sale of Timber Properties | | | — | | | | (186,014 | ) | | | — | | | | — | | | | — | |
| Net Proceeds from Sale of Foreign Subsidiary | | | — | | | | — | | | | — | | | | (111,619 | ) | | | — | |
| Change in: | | | | | | | | | | | | | | | | | | | | |
| Hedging Collateral Deposits | | | (352 | ) | | | (1,109 | ) | | | (7,151 | ) | | | (69,172 | ) | | | 58,108 | |
| Receivables and Unbilled Utility Revenue | | | 40,786 | | | | (28,382 | ) | | | 4,840 | | | | (21,857 | ) | | | (7,397 | ) |
| Gas Stored Underground & Materials and Supplies | | | 8,717 | | | | (13,826 | ) | | | 13,662 | | | | 1,934 | | | | 1,679 | |
| Unrecovered Purchased Gas Costs | | | (8,318 | ) | | | (16,261 | ) | | | 21,160 | | | | (7,285 | ) | | | 1,847 | |
| Prepayments and Other Current Assets | | | (1,737 | ) | | | (12,628 | ) | | | 37,390 | | | | (39,779 | ) | | | (41,314 | ) |
| Accounts Payable | | | (24,025 | ) | | | 13,699 | | | | (5,134 | ) | | | 48,089 | | | | (23,144 | ) |
| Amounts Payable to Customers | | | (51,223 | ) | | | 692 | | | | 2,462 | | | | (1,996 | ) | | | 22,777 | |
| Other Accruals and Current Liabilities | | | (27,332 | ) | | | 9,343 | | | | 2,082 | | | | 16,085 | | | | (16,012 | ) |
| Other Assets | | | 11,869 | | | | (9,343 | ) | | | (2,525 | ) | | | (13,461 | ) | | | (22,700 | ) |
| Other Liabilities | | | 10,350 | | | | (23,124 | ) | | | (34,450 | ) | | | (3,667 | ) | | | 80,960 | |
| | | | | | | | | | | | | | | | |
| Net Cash Provided by Operating Activities | | $ | 345,198 | | | $ | 325,728 | | | $ | 437,149 | | | $ | 317,346 | | | $ | 471,400 | |
| | | | | | | | | | | | | | | | |
| | | | | | | | | | | | | | | | | | | | | |
| Weighted Average Diluted Shares | | | 80,534 | | | | 81,358 | | | | 82,900 | | | | 85,029 | | | | 86,029 | |
| | | | | | | | | | | | | | | | | | | | | |
Net Cash Provided by Operating Activities Per Diluted Share | | $ | 4.29 | | | $ | 4.00 | | | $ | 5.27 | | | $ | 3.73 | | | $ | 5.48 | |
| | | | | | | | | | | | | | | | |
Reconciliation of National Fuel Gas Expenditures for Long-lived Assets to
Consolidated Net Cash Used in Investing Activities
(‘000)
| | | | | | | | | | | | | | | | | | | | | | | | | |
| | | 2001 | | 2002 | | 2003 | | 2004 | | 2005 | | 2006 |
| | | |
| Capital Expenditures | | $ | (292,706 | ) | | $ | (232,368 | ) | | $ | (152,251 | ) | | $ | (172,341 | ) | | $ | (219,530 | ) | | $ | (294,159 | ) |
| Investment in Subsidiaries, Net of Cash | | $ | (90,567 | ) | | $ | — | | | $ | (228,814 | ) | | $ | — | | | $ | — | | | $ | — | |
| Investment in Partnerships | | $ | (1,830 | ) | | $ | (536 | ) | | $ | (375 | ) | | $ | — | | | $ | — | | | $ | — | |
| | | |
| Expenditures for Long Lived Assets | | $ | (385,103 | ) | | $ | (232,904 | ) | | $ | (381,440 | ) | | $ | (172,341 | ) | | $ | (219,530 | ) | | $ | (294,159 | ) |
| | | | | | | | | | | | | | | | | | | | | | | | | |
| Expenditures for Long Lived Assets | | $ | (385,103 | ) | | $ | (232,904 | ) | | $ | (381,440 | ) | | $ | (172,341 | ) | | $ | (219,530 | ) | | $ | (294,159 | ) |
| Net Proceeds from Sale of Foreign Subsidiary | | $ | — | | | $ | — | | | $ | — | | | $ | — | | | $ | 111,619 | | | $ | — | |
| Net Proceeds from Sale of Timber Properties | | $ | — | | | $ | — | | | $ | 186,014 | | | $ | — | | | $ | — | | | $ | — | |
| Net Proceeds from Sale of Oil and Gas Producing Properties | | $ | 2,069 | | | $ | 22,068 | | | $ | 78,531 | | | $ | 7,162 | | | $ | 1,349 | | | $ | 13 | |
| Other | | $ | (4,892 | ) | | $ | 5,012 | | | $ | 12,065 | | | $ | 1,974 | | | $ | 3,238 | | | $ | (3,230 | ) |
| | | |
| Net Cash Used in Investing Activities | | $ | (387,926 | ) | | $ | (205,824 | ) | | $ | (104,830 | ) | | $ | (163,205 | ) | | $ | (103,324 | ) | | $ | (297,376 | ) |
| | | |


