
| National Fuel Gas Company Philip C. Ackerman Chairman, President & CEO |

| Safe Harbor NOTE: This presentation contains certain forward-looking statements as defined by the Private Securities Litigation Reform Act of 1995. Forward-looking statements include, but are not limited to, statements concerning plans, objectives, goals, projections, strategies, future events or performance, and underlying assumptions and other statements that are not statements of historical fact, and statements identified by words such as "anticipates," "estimates," "expects," "intends," "plans, " "predicts, " " projects, " and similar expressions. While National Fuel's expectations, beliefs and projections are made in good faith and are believed to have a reasonable basis, actual results may differ materially. You may refer to National Fuel's most recent Form 10-K for a listing of important risk factors you should consider. In addition, this presentation contains certain non-GAAP financial measures. For pages that contain non-GAAP financial measures, pages containing the most directly comparable GAAP financial measures and reconciliations are provided at the end of this presentation. |
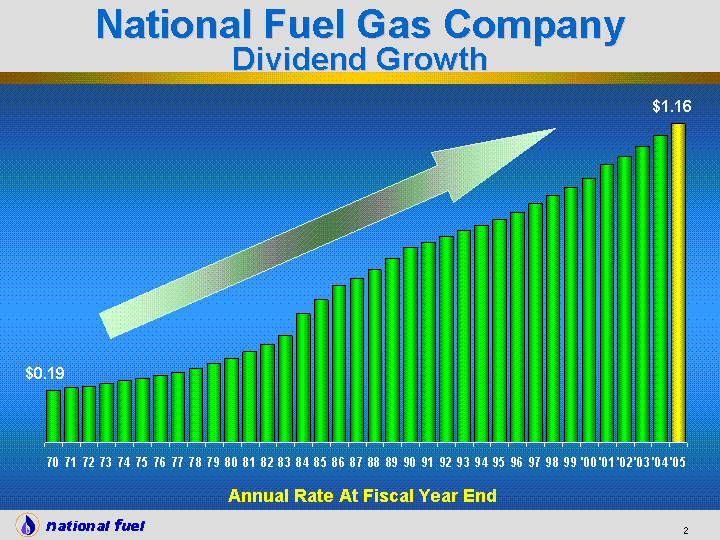
| 70 0.19 71 0.2 72 0.205 73 0.215 74 0.225 75 0.235 76 0.245 77 0.255 78 0.27 79 0.2875 80 0.3075 81 0.33 82 0.36 83 0.39 84 0.47 85 0.52 86 0.57 87 0.6 88 0.63 89 0.67 90 0.71 91 0.73 92 0.75 93 0.77 94 0.79 95 0.81 96 0.84 97 0.87 98 0.9 99 0.93 '00 0.96 '01 1.01 '02 1.04 '03 1.08 '04 1.12 '05 1.16 National Fuel Gas Company Dividend Growth $0.19 $1.16 Annual Rate At Fiscal Year End |

| 2001 2002 2003 2004 2005 2006E 2.11 1.58 1.89 1.98 2.15 2.4 Fiscal Year National Fuel Gas Company Diluted Earnings per Share* * Excludes special items |

| 2001 2002 2003 2004 2005 CFPS -1.15 1.24 2.67 1.84 2.48 Fiscal Year National Fuel Gas Company Free Cash Flow per Diluted Share |

| 2001 2002 2003 2004 2005 2006E Utility 42.4 51.5 49.9 55.5 50.1 56 P & S 26 30.3 199.4 23.2 21.1 34 E & P 296.4 114.6 75.8 77.7 122.4 155 Energy Mkt. 0.116 0.1 0.2 0.0102 0 0 Timber 3.7 25.6 3.5 2.8 18.9 2 Corp & Others 0.937 6.6 50.1 5.7 1.1 2 International 15.6 4.2 2.5 7.5 5.9 0 $385.1 $ Millions $232.9 $381.4 $172.3 $219.5 Fiscal Year National Fuel Gas Company Expenditures for Long-Lived Assets Approx. $249.0 |
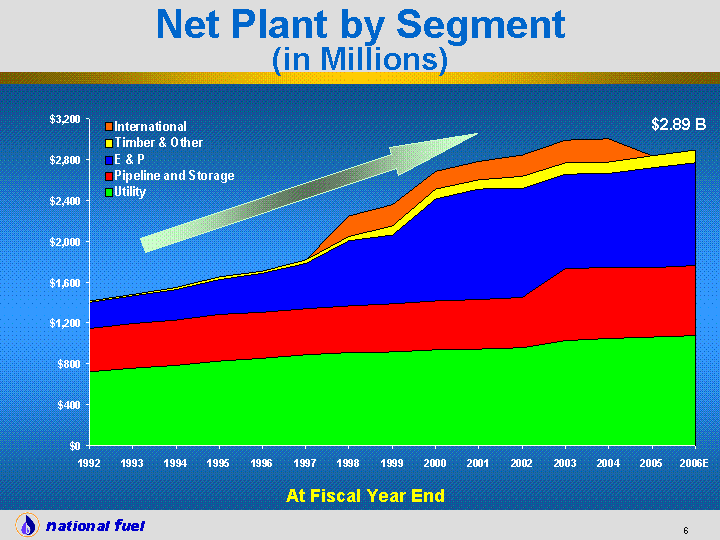
| 1992 1993 1994 1995 1996 1997 1998 1999 2000 2001 2002 2003 2004 2005 2006E $2.89 B At Fiscal Year End Net Plant by Segment (in Millions) |
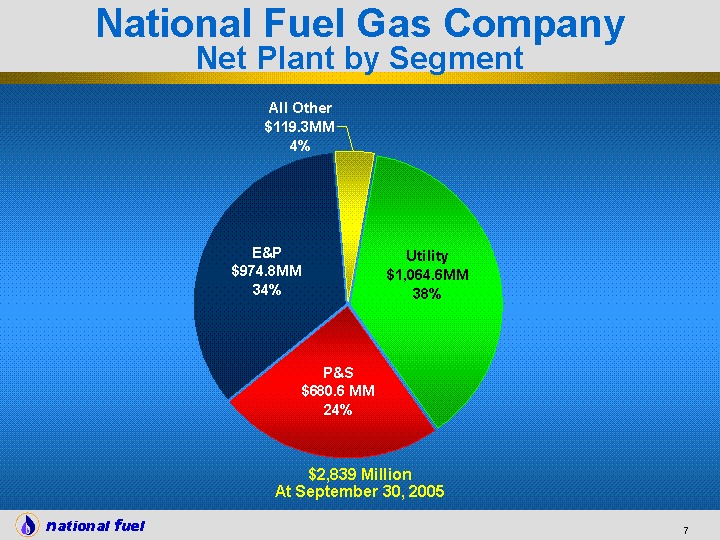
| National Fuel Gas Company Net Plant by Segment $2,839 Million At September 30, 2005 Utility P&S E&P All Other Net plant 1064.6 680.6 974.8 119.3 |

| National Fuel Gas Company FY 2006 Est. Diluted EPS by Segment $2.30 - $2.50 Fiscal 2006 Estimated Range Utility P&S E&P All Other Net plant 0.555 0.615 1.15 0.08 |

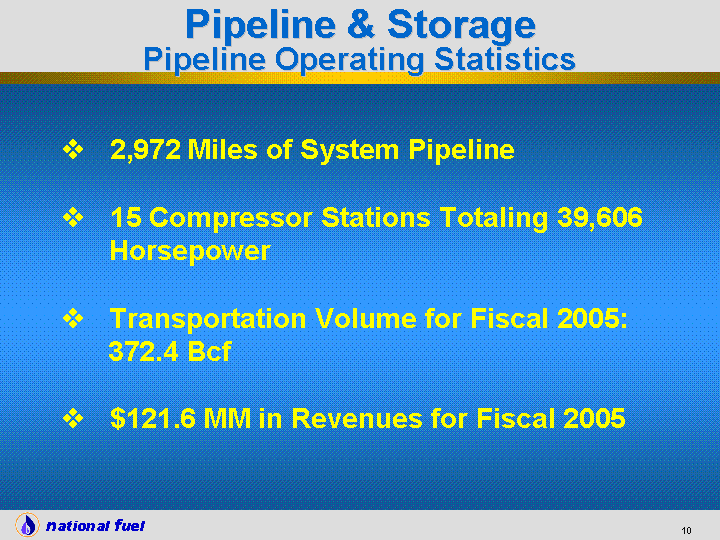
| 2,972 Miles of System Pipeline 15 Compressor Stations Totaling 39,606 Horsepower Transportation Volume for Fiscal 2005: 372.4 Bcf $121.6 MM in Revenues for Fiscal 2005 Pipeline & Storage Pipeline Operating Statistics |
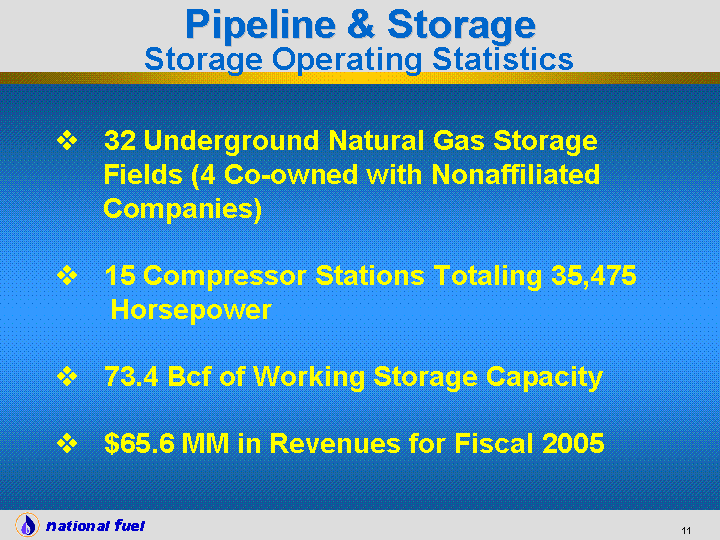
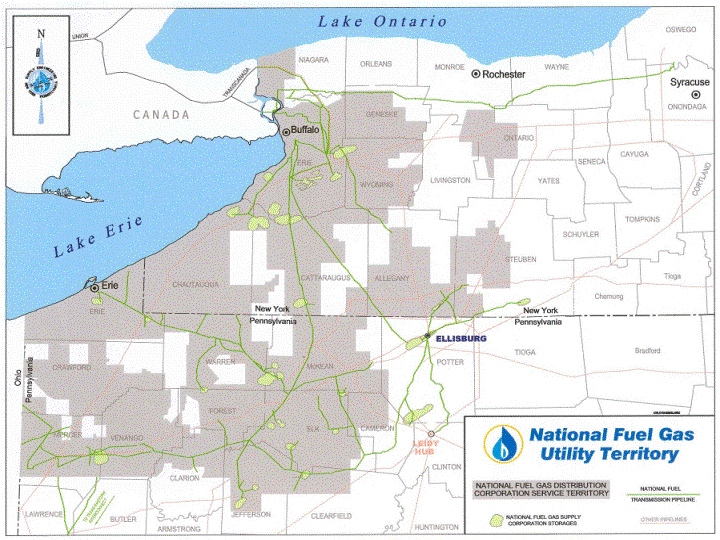
| 32 Underground Natural Gas Storage Fields (4 Co-owned with Nonaffiliated Companies) 15 Compressor Stations Totaling 35,475 Horsepower 73.4 Bcf of Working Storage Capacity $65.6 MM in Revenues for Fiscal 2005 Pipeline & Storage Storage Operating Statistics |

| Fiscal Year 2001 2002 2003 2004 2005 2006E Earnings 0.5 0.49 0.56 0.599 0.63 0.63 a Excludes impairment of Independence Pipeline of -$0.12 b Excludes SFAS 88 settlement loss of -$0.02 c Excludes base gas sale of $0.03 and gain associated with insurance proceeds of $0.05 a b Fiscal Year Pipeline & Storage Diluted Earnings per Share c |

| Fiscal Year 2001 2002 2003 2004 2005 2006E Earnings 0.76 0.62 0.7 0.59 0.46 0.555 a Excludes SFAS 88 settlement loss of -$0.03 a Fiscal Year Utility Diluted Earnings per Share |

| Residential Industrial Commercial NI 681713 1203 47979 Utility Average Number of Customers 730,895 Customers Fiscal 2005 |

| Commercial Residential Industrial NI 34308 73012 32724 140,044 MMcf Fiscal 2005 Utility Volumes by Customer Class (MMcf) |

| Canada - 9% 56.3 BCFE NY PA Gulf Coast - 8% 46.2 BCFE East - 14% 84.2 BCFE CA - 69% 413 BCFE Total: 599.7 BCFE Oil: 60% Gas: 40% E&P's Reserves by Region (at 09/30/05) |

| Fiscal Year 2001 2002 2003 2004 2005 2006E Earnings 0.89 0.33 0.46 0.61 0.6 1.15 a b c a Excludes oil & gas impairment of -$1.29 b Excludes oil & gas impairment, loss on sale and cum. effect of change in acctg of - $0.85 c Excludes SFAS 88 settlement loss of -$0.01 and Adjustment of loss on sale of oil and gas assets of +$0.06 d Based on forecast using 9/13/05 NYMEX price. Fiscal Year Exploration & Production Diluted Earnings per Share d |
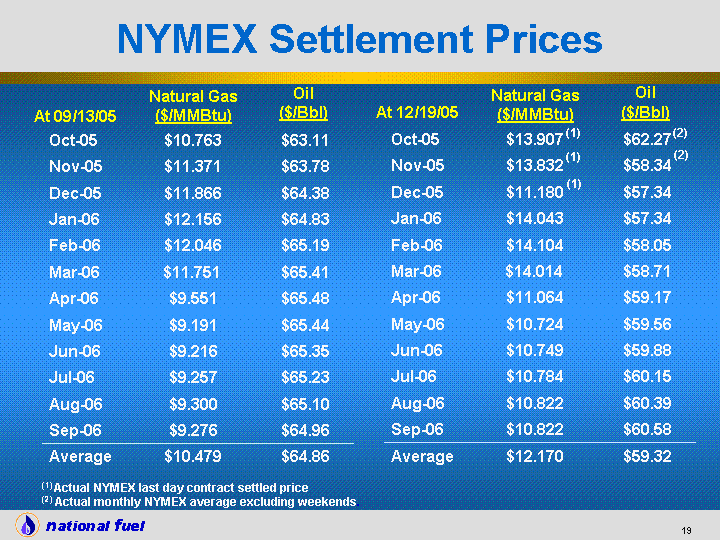
| Oct-05 Oct-05 $10.763 $63.11 Nov-05 Nov-05 $11.371 $63.78 Dec-05 Dec-05 $11.866 $64.38 Jan-06 Jan-06 $12.156 $64.83 Feb-06 Feb-06 $12.046 $65.19 Mar-06 $11.751 $11.751 $65.41 Apr-06 Apr-06 $9.551 $65.48 May-06 May-06 $9.191 $65.44 Jun-06 Jun-06 $9.216 $65.35 Jul-06 Jul-06 $9.257 $65.23 Aug-06 Aug-06 $9.300 $65.10 Sep-06 Sep-06 $9.276 $64.96 Average Average $10.479 $64.86 NYMEX Settlement Prices Natural Gas ($/MMBtu) Oil ($/Bbl) Oct-05 Oct-05 $13.907 $62.27 Nov-05 Nov-05 $13.832 $58.34 Dec-05 Dec-05 $11.180 $57.34 Jan-06 Jan-06 $14.043 $57.34 Feb-06 Feb-06 $14.104 $58.05 Mar-06 $14.014 $14.014 $58.71 Apr-06 Apr-06 $11.064 $59.17 May-06 May-06 $10.724 $59.56 Jun-06 Jun-06 $10.749 $59.88 Jul-06 Jul-06 $10.784 $60.15 Aug-06 Aug-06 $10.822 $60.39 Sep-06 Sep-06 $10.822 $60.58 Average Average $12.170 $59.32 Natural Gas ($/MMBtu) Oil ($/Bbl) (1) Actual NYMEX last day contract settled price (2) Actual monthly NYMEX average excluding weekends. At 09/13/05 At 12/19/05 (1) (1) (2) (1) (2) |

| Increase Decrease Increase Increase Utility -$0.01 +$0.01 - - Pipeline & Storage +$0.02 -$0.02 - - Exploration & Production +$0.09 -$0.09 +$0.01 -$0.01 Energy Marketing - - - - Timber - - - - Corporate & Other - - - - Consolidated +$0.12 -$0.12 +$0.01 -$0.01 $1 change per MMBtu gas $1 change per Bbl Oil Earnings Per Share Sensitivity to Changes from 09/13/05 NYMEX Prices* * Please refer to forward looking statements contained on pp. 55 and 56 of National Fuel Gas Company's 2005 Form 10-K. This sensitivity table is current as of December 28, 2005, but will become obsolete with the passage of time, changes in Seneca's production forecast, changes in customer use per account, as additional hedging contracts are entered into, and the settling of NYMEX hedge contracts at their maturity. |

| Gulf East West Canada Anticipated Well Drilling Well High Med Low Risk Reserve Potential High Med. Low **Well plans as of 8/1/05 Successful Well P & A Well Peppers #1 Sukunka #77-D (#6) Sukunka #93-D (#5) Central N.Y. (3) Drumheller (15) S W Sask (10) Westline (60) Muzette (20) Bronson #2 West Cameron 96 #2 Viosca Knoll 256 #1 Sukunka #7 Galveston 253 #1 Caribou (3) Vigilant (2) Shale (6) East Cameron 34 #1 Vermilion 342 Alberta CBM (10) High Island 37 #B-2 High Island 37 #A-5 2006 Exploration and Exploitation Opportunities** |
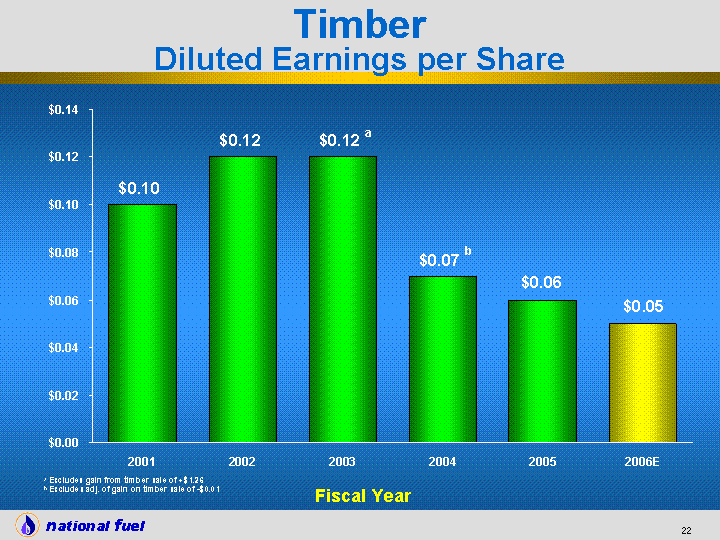
| Fiscal Year 2001 2002 2003 2004 2005 2006E Earnings 0.1 0.12 0.12 0.07 0.06 0.05 a Excludes gain from timber sale of +$1.26 b Excludes adj. of gain on timber sale of -$0.01 a b Fiscal Year Timber Diluted Earnings per Share |

| Cherry 25 Oak 17 Maple 35 Other 23 Total Estimated Inventory 386,000,000 Board Feet Timber Trees by Type* * as of 09/30/05 |
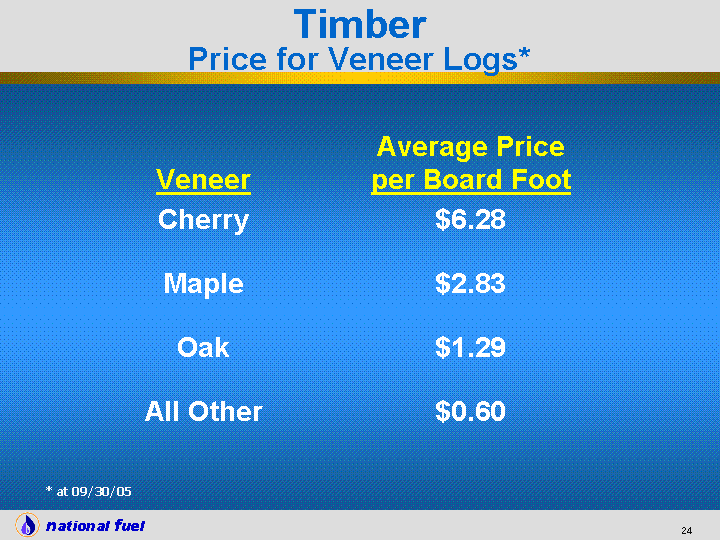
| Veneer Average Price per Board Foot Cherry $6.28 Maple $2.83 Oak $1.29 All Other $0.60 Timber Price for Veneer Logs* * at 09/30/05 |

| Energy Marketing Diluted Earnings per Share Fiscal Year 2001 2002 2003 2004 2005 2006E Earnings -0.04 0.11 0.07 0.07 0.06 0.02 Fiscal Year |

| National Fuel Gas Company David F. Smith President National Fuel Gas Supply Corporation |

| Futures Coldest Nov/Dec On Record Hurricanes Katrina / Rita Long Cold Winter NYMEX Natural Gas Settlement Price $ Per Dth |
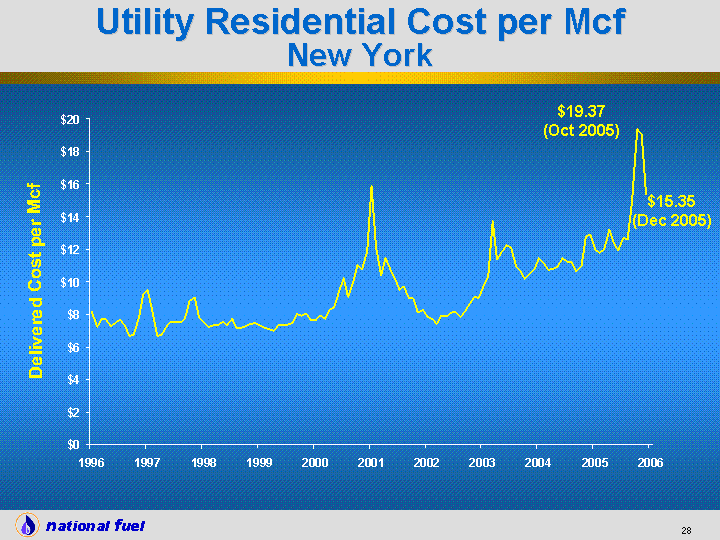
| 1/1/1996 2/1/1996 3/1/1996 4/1/1996 5/1/1996 6/1/1996 7/1/1996 8/1/1996 9/1/1996 10/1/1996 11/1/1996 12/1/1996 1/1/1997 2/1/1997 3/1/1997 4/1/1997 5/1/1997 6/1/1997 7/1/1997 8/1/1997 9/1/1997 10/1/1997 11/1/1997 12/1/1997 1/1/1998 2/1/1998 3/1/1998 4/1/1998 5/1/1998 6/1/1998 7/1/1998 8/1/1998 9/1/1998 10/1/1998 11/1/1998 12/1/1998 1/1/1999 2/1/1999 3/1/1999 4/1/1999 5/1/1999 6/1/1999 7/1/1999 8/1/1999 9/1/1999 10/1/1999 11/1/1999 12/1/1999 1/1/2000 2/1/2000 3/1/2000 4/1/2000 5/1/2000 6/1/2000 7/1/2000 8/1/2000 9/1/2000 10/1/2000 11/1/2000 12/1/2000 1/1/2001 2/1/2001 3/1/2001 4/1/2001 5/1/2001 6/1/2001 7/1/2001 8/1/2001 9/1/2001 10/1/2001 11/1/2001 12/1/2001 1/1/2002 2/1/2002 3/1/2002 4/1/2002 5/1/2002 6/1/2002 7/1/2002 8 /1/2002 9/1/2002 10/1/2002 11/1/2002 12/1/2002 1/1/2003 2/1/2003 3/1/2003 8.14 7.22 7.66 7.7 7.27 7.47 7.67 7.33 6.67 6.76 7.77 9.25 9.47 8.04 6.65 6.74 7.27 7.55 7.52 7.48 7.77 8.82 8.99 7.8 7.51 7.22 7.33 7.32 7.54 7.3 7.73 7.19 7.15 7.27 7.41 7.47 7.32 7.19 7.06 6.99 7.32 7.37 7.34 7.47 8.01 7.93 8.03 7.61 7.63 7.89 7.72 8.27 8.43 9.43 10.21 9.05 9.97 11.04 10.75 11.84 15.85 12.12 10.38 11.47 10.81 10.14 9.52 9.72 8.97 8.97 8.09 8.28 7.87 7.7 7.4 7.92 7.88 8.1 8.14 7.8 8.14 8.61 9.05 9 9.66 10.35 13.7 Utility Residential Cost per Mcf New York Delivered Cost per Mcf $19.37 (Oct 2005) $15.35 (Dec 2005) |
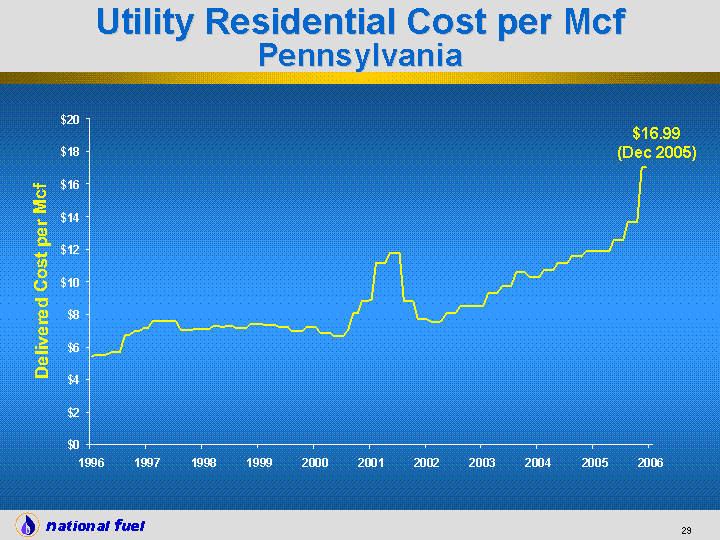
| 1/1/1996 2/1/1996 3/1/1996 4/1/1996 5/1/1996 6/1/1996 7/1/1996 8/1/1996 9/1/1996 10/1/1996 11/1/1996 12/1/1996 1/1/1997 2/1/1997 3/1/1997 4/1/1997 5/1/1997 6/1/1997 7/1/1997 8/1/1997 9/1/1997 10/1/1997 11/1/1997 12/1/1997 1/1/1998 2/1/1998 3/1/1998 4/1/1998 5/1/1998 6/1/1998 7/1/1998 8/1/1998 9/1/1998 10/1/1998 11/1/1998 12/1/1998 1/1/1999 2/1/1999 3/1/1999 4/1/1999 5/1/1999 6/1/1999 7/1/1999 8/1/1999 9/1/1999 10/1/1999 11/1/1999 12/1/1999 1/1/2000 2/1/2000 3/1/2000 4/1/2000 5/1/2000 6/1/2000 7/1/2000 8/1/2000 9/1/2000 10/1/2000 11/1/2000 12/1/2000 1/1/2001 2/1/2001 3/1/2001 4/1/2001 5/1/2001 6/1/2001 7/1/2001 8/1/2001 9/1/2001 10/1/2001 11/1/2001 12/1/2001 1/1/2002 2/1/2002 3/1/2002 4/1/2002 5/1/2002 6/1/2002 7/1/2002 8/1/2002 9/1/2002 10/1/2002 11/1/2002 12/1/2002 1/1/2003 2/1/2003 3/1/2003 4/1/2003 5/1/2003 6/1/2003 7/1/2003 8/1/2003 9/1/2003 10/1/2003 11/1/2003 12/1/2003 1/1/2004 2/1/2004 3/1/2004 5.44 5.5 5.5 5.5 5.65 5.65 5.65 6.71 6.71 6.94 6.94 7.13 7.13 7.59 7.59 7.59 7.59 7.59 7.59 7.04 7.04 7.04 7.08 7.08 7.08 7.08 7.27 7.27 7.24 7.26 7.26 7.14 7.14 7.14 7.38 7.38 7.38 7.37 7.37 7.37 7.2 7.2 7.2 6.94 6.94 6.93 7.23 7.22 7.22 6.84 6.86 6.86 6.68 6.68 6.68 7.02 8.05 8.04 8.85 8.85 8.87 11.17 11.17 11.17 11.75 11.75 11.75 8.78 8.78 8.78 7.7 7.7 7.7 7.51 7.51 7.57 8.06 8.06 8.06 8.51 8.51 8.5 8.51 8.51 8.52 9.27 9.27 9.27 9.69 9.69 9.69 10.58 10.58 10.58 10.23 10.23 10.23 10.71 10.71 Utility Residential Cost per Mcf Pennsylvania Delivered Cost per Mcf $16.99 (Dec 2005) |

| 1st Qtr Local 0.07 Forward Fixed Pricing 0.2 Storage 0.4 Daily Price 0.1 Monthly Price 0.23 Local - 7% Forward Fixed Price - 20% Storage Withdrawals - 40% Daily Price - 10% Monthly Price - 23% Gas Cost Management Plan Pricing Mix - Winter of 2005-06 |
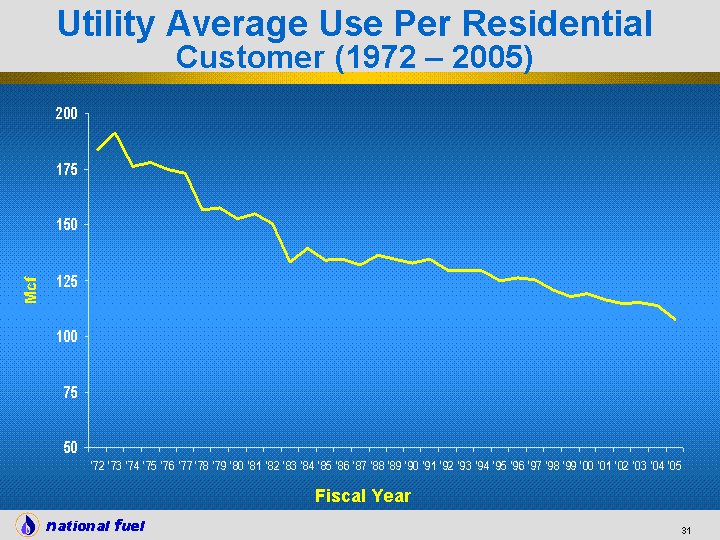
| '72 '73 '74 '75 '76 '77 '78 '79 '80 '81 '82 '83 '84 '85 '86 '87 '88 '89 '90 '91 '92 '93 '94 '95 '96 '97 '98 '99 '00 '01 '02 '03 '04 '05 183.6975828 191.09417 176.1608614 178 175 173 156.4683675 157.3988734 152.6182359 155.0142588 150.2625021 133.2243326 139.3767397 134.0725921 134.6165511 131.8059139 136.4741597 134.3094389 132.8787172 134.4322294 129.8360219 129.2571224 129.044162 124.8296622 126.2706064 125.4152364 120.8291303 117.7165376 119.1897568 116.5099318 114.4333643 114.8731499 113.6091112 107.3680728 Fiscal Year Utility Average Use Per Residential Customer (1972 - 2005) Mcf |

| Updates Rate Case Update - Embedded Usage Per Account (Mcf) NY PA 10/1/96 8/1/05 5/1/96 4/15/05 121.2 110.6 125.5 108.7 Conservation Tracker Proposed To Be Included in Next Filings Recently Enacted in a Number of Jurisdictions Including NW Natural (Portland, OR), Baltimore Gas & Electric (Baltimore, MD), Washington Gas Light (Washington, D.C.), Piedmont Gas (Eastern NC), AGL Resources (Atlanta, GA) Resolution Approved at NARUC |

| 2001 2002 2003 2004 2005 6 12.5 11.3 14.5 15.6 Utility - NY Net Uncollectible Write-offs $ Millions Fiscal Year |
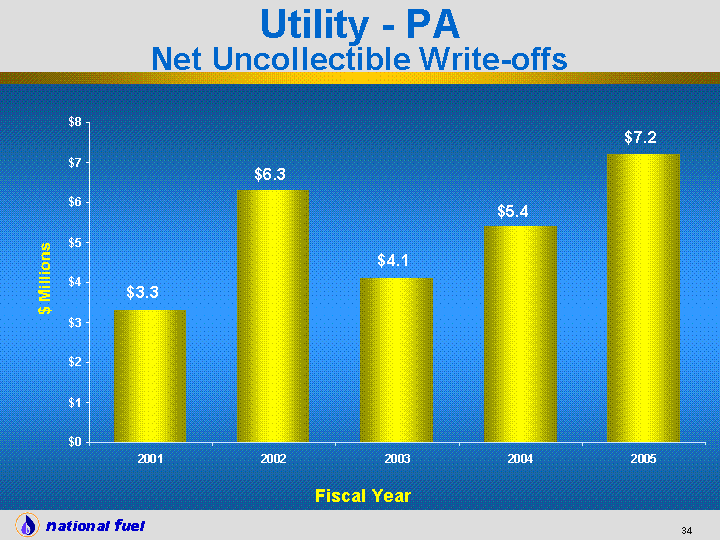
| 2001 2002 2003 2004 2005 3.3 6.3 4.1 5.4 7.2 Utility - PA Net Uncollectible Write-offs $ Millions Fiscal Year |

| At 09/30/02 At 09/30/03 At 09/30/04 At 09/30/05 30-59 days 5.4 7.87 8.27 8.97 60-89 days 3.66 5.59 5.95 6.47 90-119 days 3.4 5.84 5.38 6.3 120 days & over 28.97 43.81 48.41 54.45 Utility Aged Accounts Receivable $ Millions |

| At 09/30/02 At 09/30/03 At 09/30/04 At 09/30/05 30-59 days 5.4 7.87 8.27 8.97 60-89 days 3.66 5.59 5.95 6.47 90-119 days 3.4 5.84 5.38 6.3 120 days & over 28.97 43.81 48.41 54.45 Reserve for Bad Debt 13.3 12.67 12.9 25.1 Utility Aged Accounts Receivable $ Millions |

| Increased Bad Debt Reserve Rate Case Base Rates Include Allowance Based on Historical Experience Transferred Additional Amount of $4.5 MM from CMR to Uncollectible Reserve Bad Debt Tracker New York Merchant Function Charge Varies with Cost of Gas Residential Non-Residential 2.742% .304% Multiplied by Gas Supply Cost Rate Solutions to A/R Uncollectibles |
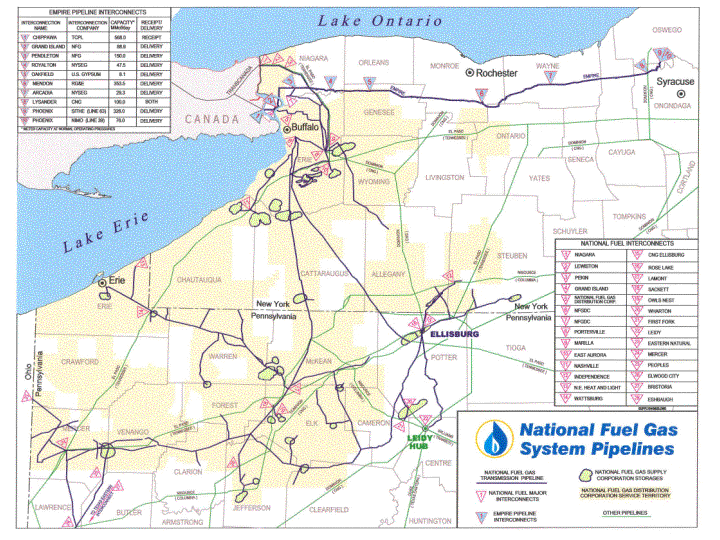
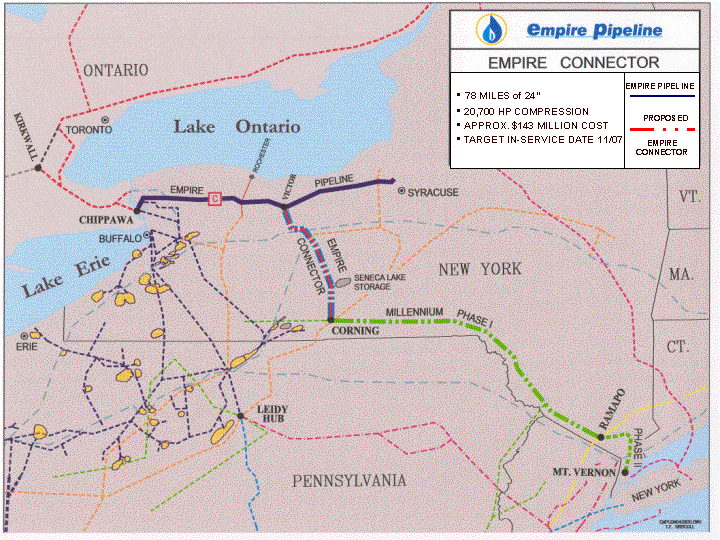
| 78 MILES of 24" 20,700 HP COMPRESSION APPROX. $143 MILLION COST TARGET IN-SERVICE DATE 11/07 EMPIRE PIPELINE PROPOSED EMPIRE CONNECTOR |

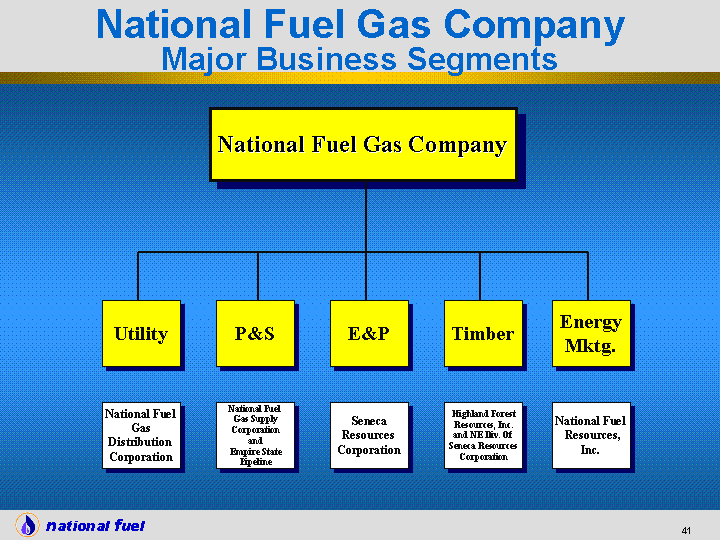
| National Fuel Gas Company Energy Mktg. Timber E&P P&S Utility National Fuel Gas Distribution Corporation National Fuel Gas Supply Corporation and Empire State Pipeline Seneca Resources Corporation Highland Forest Resources, Inc. and NE Div. Of Seneca Resources Corporation National Fuel Resources, Inc. National Fuel Gas Company Major Business Segments |

| National Fuel Gas Company New York Stock Exchange NFG Shares Outstanding (Approx.) (As of 11/30/05) 84.5 Million Average Daily Trading Volume (12 Months Ended 11/30/05) 345,321 Market Capitalization (Approx.) (As of 12/29/05) $2.6 Billion $1.16 Annual Dividend Rate (current as of 12/30/05) September Fiscal Year End |

| 1/1/1992 2/1/1992 3/1/1992 4/1/1992 5/1/1992 6/1/1992 7/1/1992 8/1/1992 9/1/1992 10/1/1992 11/1/1992 12/1/1992 1/1/1993 2/1/1993 3/1/1993 4/1/1993 5/1/1993 6/1/1993 7/1/1993 8/1/1993 9/1/1993 10/1/1993 11/1/1993 12/1/1993 1/1/1994 2/1/1994 3/1/1994 4/1/1994 5/1/1994 6/1/1994 7/1/1994 8/1/1994 9/1/1994 10/1/1994 11/1/1994 12/1/1994 1/1/1995 2/1/1995 3/1/1995 4/1/1995 5/1/1995 6/1/1995 7/1/1995 8/1/1995 9/1/1995 10/1/1995 11/1/1995 12/1/1995 1/1/1996 2/1/1996 3/1/1996 4/1/1996 5/1/1996 6/1/1996 7/1/1996 8/1/1996 9/1/1996 10/1/1996 11/1/1996 12/1/1996 1/1/1997 2/1/1997 3/1/1997 4/1/1997 5/1/1997 6/1/1997 7/1/1997 8/1/1997 9/1/1997 10/1/1997 11/1/1997 12/1/1997 1/1/1998 2/1/1998 3/1/1998 4/1/1998 5/1/1998 6/1/1998 7/1/1998 8/1/1998 9/1/1998 10/1/1998 11/1/1998 12/1/1998 1/1/1999 2/1/1999 3/1/1999 4/1/1999 5/1/1999 6/1/1999 7/1/1999 8/1/1999 9/1/1999 10/1/1999 11/1/1999 12.1875 12.75 12.1875 12.5 12.6875 12.75 13.1875 14.125 13.0625 13.125 14.0625 14.75 14.8125 15.75 16 15.875 14.9375 16.6875 17.375 17.9375 18.1875 17.75 16.6875 17 17.4375 15.375 15 15 15.1875 14.6875 15 15.5625 14.9375 14.875 13 12.75 13.25 13.625 14 14.4375 14.4375 14.3125 14 14.0625 14.375 14.875 16.0625 16.8125 16.75 16.0625 17.3125 17.5625 17.1875 18 16.875 18.5 18.375 18.625 21.3125 20.625 21.125 21.5 21.375 20.8125 20.6875 20.96875 21.25 22.21875 22 22.0625 23.34375 24.34375 23 23.3125 23.5 23 21.1875 21.78125 20.65625 20.5625 23.5 23.625 22.96875 22.59375 21.15625 20.21875 19.625 21.875 23.75 24.25 23.46875 23.53125 23.59375 24.4375 25.03125 $31.17 (12/29/05) $34.79 (10/03/05) National Fuel Gas Stock Price (January 1992 - December 29, 2005) |

| Standard & Poor's Moody's Fitch, Inc. Long-Term Debt BBB+ Baa1 A- Outlook Stable Stable Stable Commercial Paper A-2 P-2 F-2 NFG Debt Ratings at September 30, 2005 |

| Commercial Paper Program And Bilateral Credit Facilities - Aggregate Of $625 MM $0 MM borrowed at September 30, 2005 $300.0 MM Committed Credit Facility Through September 2010 $0 borrowed Universal Shelf Registration on File - Additional $550 MM Can Be Issued As Debt Or Equity Securities Any offer and sale of such securities will be made only by means of a prospectus meeting requirements of securities laws National Fuel Gas Company Capital Resources |

| Seneca's Fourth Quarter Results September 30, 2005 Production: 12.7 Bcfe Number of Gross Wells Drilled: 79 Operating Revenue $73.9 MM Net Income $11.7 MM Diluted Earnings per Share $0.13 Expenses Actual Amount $/Mcfe LOE $13,870,000 $1.09 DD&A $23,368,000 $1.84 General and Administrative $ 4,623,000 $0.36 |
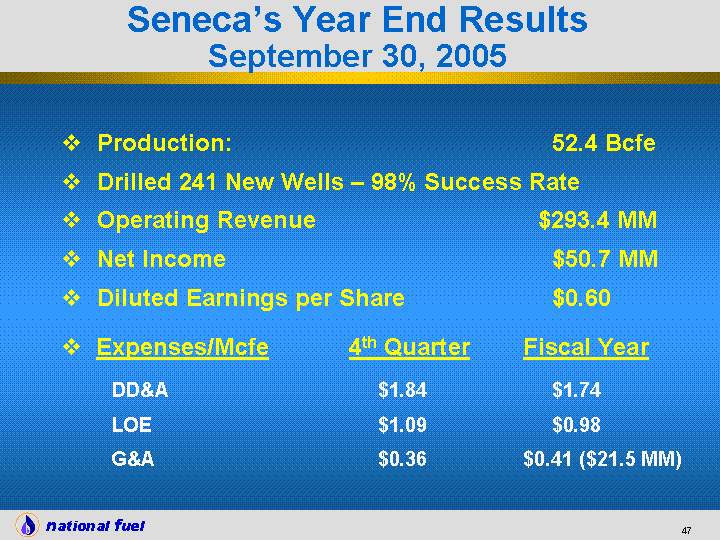
| Seneca's Year End Results September 30, 2005 Production: 52.4 Bcfe Drilled 241 New Wells - 98% Success Rate Operating Revenue $293.4 MM Net Income $50.7 MM Diluted Earnings per Share $0.60 Expenses/Mcfe 4th Quarter Fiscal Year DD&A $1.84 $1.74 LOE $1.09 $0.98 G&A $0.36 $0.41 ($21.5 MM) |

| 2002 2003 2004 2005 2006 LOE 0.752 0.817 0.714 0.98 1.15 Prod/Ad Val Tax 0.111 0.157 0.081 0.097 0.13 General & Admin. 0.403 0.292 0.383 0.411 0.48 Interest 0.622 0.703 0.811 0.844 0.841 Cash Tax -0.105 0.19 0.053 0.084 0.341 Cash Margin 1.774 1.955 2.838 3.287 4.855 Exploration & Production Improving Margins |

| Granted Federal Royalty Relief from all Offshore Production after October 1, 2006 $44 MM Total Recovery $19 MM Net to Seneca Spud 2 New Sukunka Wells 93-D (Well #5) and 77-D (Well #6) Exploration & Production Recent Developments |

| Success Exploratory Development Dry Ratio East 2 78 1 99% West - 115 - 100% Gulf 7 3 1 91% Canada 24 7 3 91% Total 33 203 5 98% Seneca's Gross Well Drilling Activity for Fiscal 2005 |

| Region Anticipated Activity East 120 West 75 Gulf 7-10 Canada 45 Total 247-250 Seneca's Well Drilling Program for Fiscal 2006 |

| 0 15 miles (2nd Well) (3rd Well) (5th Well) (4th Well) (6th Well) AREA OF MUTUAL INTEREST Gas Wells Proposed Wells Working interest lands Lands to be earned by drilling 77-D 75-E 79-J 50-C 93-D (1st Well) 60-E Sukunka Area Land Map Monkman |

| Exploration & Production Sukunka Wells Seneca has 20% Working Interest in This Area Sukunka b-60-E Production Commenced on December 13, 2004 Current Sales Rate up to 60 MMcf/d Fourth Sukunka Well b-75-E Currently Completing Sukunka b-93-D (Well #5), Currently Drilling, is Offset to b-60-E Well |

| High Island 37 #A-5 Drilling 78% Production & Reserves Galveston 227 On Production 30% Production Sukunka #77-D (#6) Drilling 20% Production & Reserves Sukunka #93-D (#5) Drilling 20% Production & Reserves Eugene Island 320 #1 Waiting on Platform 100% Production* East Cameron 213 #1 Platform Set 100% Production* Viosca Knoll 77 Waiting on Platform 47% Production Viosca Knoll 432 Waiting on Platform 47% Production High Island 37 #B-2 Waiting on Rig 25% Production & Reserves Working Fiscal 2006 Status Interest Impact * Already included in Forecast Impact Wells for Seneca's Production & Reserves |
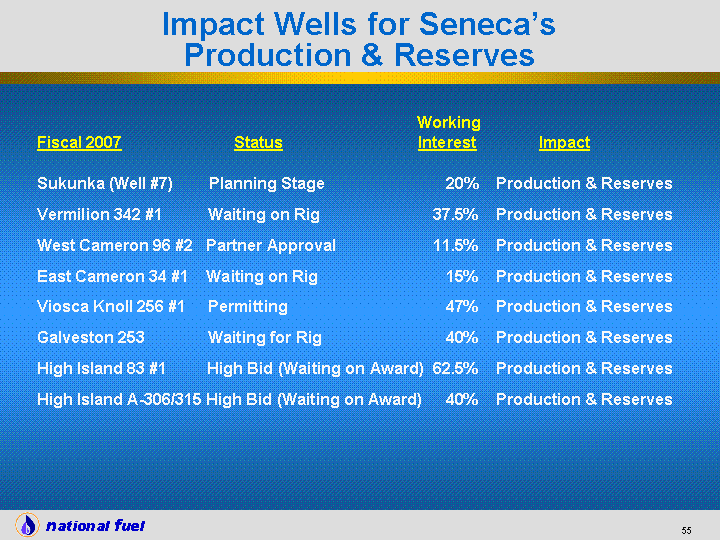
| Working Fiscal 2007 Status Interest Impact Sukunka (Well #7) Planning Stage 20% Production & Reserves Vermilion 342 #1 Waiting on Rig 37.5% Production & Reserves West Cameron 96 #2 Partner Approval 11.5% Production & Reserves East Cameron 34 #1 Waiting on Rig 15% Production & Reserves Viosca Knoll 256 #1 Permitting 47% Production & Reserves Galveston 253 Waiting for Rig 40% Production & Reserves High Island 83 #1 High Bid (Waiting on Award) 62.5% Production & Reserves High Island A-306/315 High Bid (Waiting on Award) 40% Production & Reserves Impact Wells for Seneca's Production & Reserves |
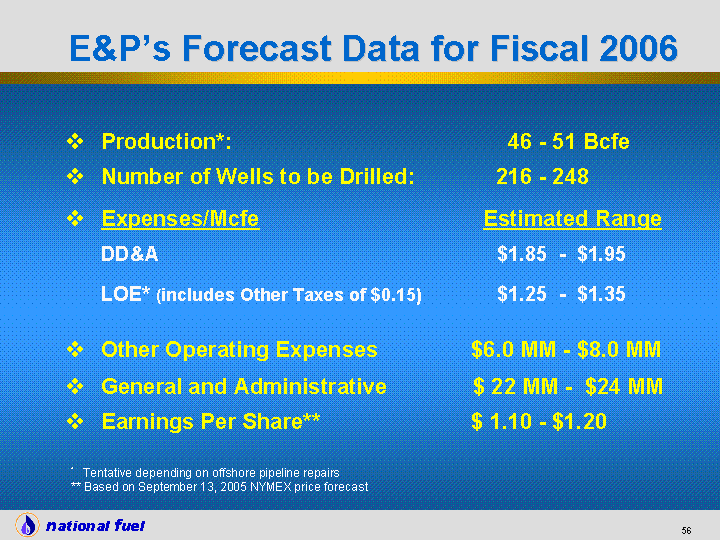
| E&P's Forecast Data for Fiscal 2006 Production*: 46 - 51 Bcfe Number of Wells to be Drilled: 216 - 248 Expenses/Mcfe Estimated Range DD&A $1.85 - $1.95 LOE* (includes Other Taxes of $0.15) $1.25 - $1.35 Other Operating Expenses $6.0 MM - $8.0 MM General and Administrative $ 22 MM - $24 MM Earnings Per Share** $ 1.10 - $1.20 * Tentative depending on offshore pipeline repairs ** Based on September 13, 2005 NYMEX price forecast |

| Swaps Volume Average Hedge Price Oil 1.9 MMBBL $34.14 / BBL Gas 8.7 BCF $6.12 /MCF No-cost Collars Volume Lowest Floor Price Highest Ceiling Price Gas 7.3 BCF $4.77 / MCF $19.03 / MCF Fiscal 2006 Exploration & Production Hedging Summary at 12/19/05 Fiscal 2007 Swaps Volume Average Hedge Price Oil 0.9 MMBBL $37.03 / BBL Gas 0.7 BCF $5.76 /MCF No-cost Collars Volume Lowest Floor Price Highest Ceiling Price Gas 3.5 BCF $7.42 / MCF $20.53 / MCF Fiscal 2008 Swaps Volume Average Hedge Price Oil 0.05 MMBBL $39.00 / BBL |

| 69% of Production Online as of 12/19/2005 No Definite Timetable for Remaining Production Waiting on Pipelines Total Estimated Insured Repair Costs - $4 MM Seneca's Deductible for Property Damage - $500,000 Separate Deductible for Restoring & Redrilling Wells - $750,000 Revisit Producing Forecast When All Repair Dates are Known Hurricanes Katrina & Rita Update |

| Utility Rate Case Settlements New York Pennsylvania Approximate Rate Base $640-$650 MM $270 MM Approximate Rate Base Revenue Increase $21 MM $12 MM Effective Date 08/01/2005 04/12/2005 Next Possible Filing Date 09/01/2006 05/31/2006 * Black-box settlement in both states. Approximate Utility Capital Structure* : Long-term Debt 45% Cost Component 6.65% Short-term Debt 5% Cost Component 3.5% - 4.5% Equity Component 50% Return on Equity 10% - 11% |

| Comparable GAAP Financial Measure Slides And Reconciliations |

| 2001 2002 2003 2004 2005 0.82 1.46 2.2 2.01 2.23 Fiscal Year National Fuel Gas Company Reported Diluted Earnings per Share |

| 2001 2002 2003 2004 2005 5.15 4.29 4 5.27 3.73 Fiscal Year National Fuel Gas Company Net Cash Provided by Operating Activities per Diluted Share |

| 2001 2002 2003 2004 2005 387.9 205.8 104.8 163.2 103.3 Fiscal Year National Fuel Gas Company Consolidated Net Cash Used in Investing Activities $ Millions |
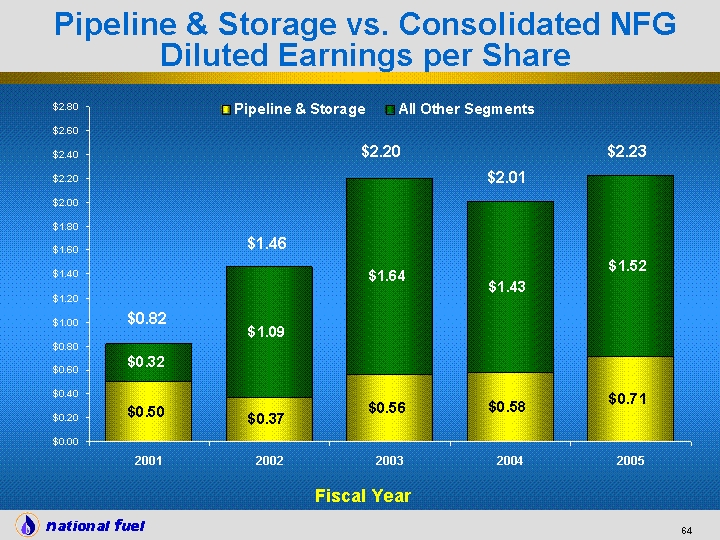
| 2001 2002 2003 2004 2005 Pipeline & Storage 0.5 0.37 0.56 0.58 0.71 All Other Segments 0.32 1.09 1.64 1.43 1.52 $0.82 $1.46 $2.20 $2.01 $2.23 Fiscal Year Pipeline & Storage vs. Consolidated NFG Diluted Earnings per Share |

| 2001 2002 2003 2004 2005 Utility 0.76 0.62 0.7 0.56 0.46 All Other Segments 0.06 0.84 1.5 1.45 1.77 $0.82 $1.46 $2.20 $2.01 $2.23 Fiscal Year Utility vs. Consolidated NFG Diluted Earnings per Share |

| 2001 2002 2003 2004 2005 Exploration & Production -0.4 0.33 -0.39 0.66 0.6 All Other Segments 1.22 1.13 2.59 1.35 1.63 $0.82 $1.46 $2.20 $2.01 $2.23 Fiscal Year Exploration & Production vs. Consolidated NFG Diluted Earnings per Share |

| 2001 2002 2003 2004 2005 Timber 0.1 0.12 1.38 0.06 0.06 All Other Segments 0.72 1.34 0.82 1.95 2.17 $0.82 $1.46 $2.20 $2.01 $2.23 Fiscal Year Timber vs. Consolidated NFG Diluted Earnings per Share |

| 2001 2002 2003 2004 2005 Energy Marketing -0.04 0.11 0.07 0.07 0.06 All Other Segments 0.86 1.35 2.13 1.94 2.17 Fiscal Year Energy Marketing vs. Consolidated NFG Diluted Earnings per Share $0.82 $1.46 $2.20 $2.01 $2.23 |
NATIONAL FUEL GAS COMPANY
AND SUBSIDIARIES
RECONCILIATION TO REPORTED EARNINGS
| | | | | | | | | | | | | | | | | | | | | |
| | | Fiscal Year | | | Fiscal Year | | | Fiscal Year | | | Fiscal Year | | | Fiscal Year | |
| | | Ended | | | Ended | | | Ended | | | Ended | | | Ended | |
| (Diluted Earnings Per Share) | | September 30, 2001 | | | September 30, 2002 | | | September 30, 2003 | | | September 30, 2004 | | | September 30, 2005 | |
Utility | | | | | | | | | | | | | | | | | | | | |
| Reported earnings | | $ | 0.76 | | | $ | 0.62 | | | $ | 0.70 | | | $ | 0.56 | | | $ | 0.46 | |
| Pension settlement loss | | | — | | | | — | | | | — | | | | 0.03 | | | | — | |
| | | | | | | | | | | | | | | | |
| Earnings before non-recurring items | | | 0.76 | | | | 0.62 | | | | 0.70 | | | | 0.59 | | | | 0.46 | |
| | | | | | | | | | | | | | | | |
| | | | | | | | | | | | | | | | | | | | | |
Pipeline and Storage | | | | | | | | | | | | | | | | | | | | |
| Reported earnings | | | 0.50 | | | | 0.37 | | | | 0.56 | | | | 0.58 | | | | 0.71 | |
| Impairment of Independence Pipeline | | | — | | | | 0.12 | | | | — | | | | — | | | | — | |
| Pension settlement loss | | | — | | | | — | | | | — | | | | 0.02 | | | | — | |
| Gain associated with insurance proceeds | | | — | | | | — | | | | — | | | | — | | | | (0.05 | ) |
| Base gas sale | | | | | | | | | | | | | | | | | | | (0.03 | ) |
| | | | | | | | | | | | | | | | |
| Earnings before non-recurring items | | | 0.50 | | | | 0.49 | | | | 0.56 | | | | 0.60 | | | | 0.63 | |
| | | | | | | | | | | | | | | | |
| | | | | | | | | | | | | | | | | | | | | |
Exploration and Production | | | | | | | | | | | | | | | | | | | | |
| Reported earnings | | | (0.40 | ) | | | 0.33 | | | | (0.39 | ) | | | 0.66 | | | | 0.60 | |
| Loss on sale of oil and gas assets | | | — | | | | — | | | | 0.48 | | | | — | | | | — | |
| Impairment of oil and gas producing properties | | | 1.29 | | | | — | | | | 0.36 | | | | — | | | | — | |
| Cumulative Effect of Change in Accounting | | | — | | | | — | | | | 0.01 | | | | — | | | | — | |
| Adjustment of loss on sale of oil and gas assets | | | — | | | | — | | | | — | | | | (0.06 | ) | | | — | |
| Pension settlement loss | | | — | | | | — | | | | — | | | | 0.01 | | | | — | |
| | | | | | | | | | | | | | | | |
| Earnings before non-recurring items | | | 0.89 | | | | 0.33 | | | | 0.46 | | | | 0.61 | | | | 0.60 | |
| | | | | | | | | | | | | | | | |
| | | | | | | | | | | | | | | | | | | | | |
International | | | | | | | | | | | | | | | | | | | | |
| Reported earnings | | | (0.04 | ) | | | (0.06 | ) | | | (0.12 | ) | | | 0.07 | | | | | |
| Cumulative Effect of Change in Accounting | | | — | | | | — | | | | 0.10 | | | | — | | | see |
| Pension settlement loss | | | — | | | | — | | | | — | | | | — | | | “Discontinued |
| Tax rate change | | | — | | | | — | | | | — | | | | (0.06 | ) | | Operations” |
| Repatriation tax | | | | | | | | | | | | | | | | | | below |
| | | | | | | | | | | | | | | | | |
| Earnings before non-recurring items | | | (0.04 | ) | | | (0.06 | ) | | | (0.02 | ) | | | 0.01 | | | | | |
| | | | | | | | | | | | | | | | | |
| | | | | | | | | | | | | | | | | | | | | |
Energy Marketing | | | | | | | | | | | | | | | | | | | | |
| Reported earnings | | | (0.04 | ) | | | 0.11 | | | | 0.07 | | | | 0.07 | | | | 0.06 | |
| Pension settlement loss | | | — | | | | — | | | | — | | | | — | | | | — | |
| | | | | | | | | | | | | | | | |
| Earnings before non-recurring items | | | (0.04 | ) | | | 0.11 | | | | 0.07 | | | | 0.07 | | | | 0.06 | |
| | | | | | | | | | | | | | | | |
| | | | | | | | | | | | | | | | | | | | | |
Timber | | | | | | | | | | | | | | | | | | | | |
| Reported earnings | | | 0.10 | | | | 0.12 | | | | 1.38 | | | | 0.06 | | | | 0.06 | |
| Gain on sale of timber assets | | | — | | | | — | | | | (1.26 | ) | | | — | | | | — | |
| Pension settlement loss | | | — | | | | — | | | | — | | | | — | | | | — | |
| Adjustment of gain on sale of timber properties | | | — | | | | — | | | | — | | | | 0.01 | | | | — | |
| | | | | | | | | | | | | | | | |
| Earnings before non-recurring items | | | 0.10 | | | | 0.12 | | | | 0.12 | | | | 0.07 | | | | 0.06 | |
| | | | | | | | | | | | | | | | |
| | | | | | | | | | | | | | | | | | | | | |
Corporate and All Other | | | | | | | | | | | | | | | | | | | | |
| Reported earnings | | | (0.06 | ) | | | (0.03 | ) | | | — | | | | 0.01 | | | | (0.08 | ) |
| Pension settlement loss | | | — | | | | — | | | | — | | | | 0.02 | | | | — | |
| | | | | | | | | | | | | | | | |
| Earnings before non-recurring items | | | (0.06 | ) | | | (0.03 | ) | | | — | | | | 0.03 | | | | (0.08 | ) |
| | | | | | | | | | | | | | | | |
| | | | | | | | | | | | | | | | | | | | | |
Consolidated | | | | | | | | | | | | | | | | | | | | |
| Reported earnings | | | 0.82 | | | | 1.46 | | | | 2.20 | | | | 2.01 | | | | | |
| Total non-recurring items from above | | | 1.29 | | | | 0.12 | | | | (0.31 | ) | | | (0.03 | ) | | | | |
| | | | | | | | | | | | | | | | | |
| Earnings before non-recurring items | | $ | 2.11 | | | $ | 1.58 | | | $ | 1.89 | | | $ | 1.98 | | | | | |
| | | | | | | | | | | | | | | | | |
| | | | | | | | | | | | | | | | | | | | | |
Consolidated Earnings from Continuing Operations | | | | | | | | | | | | | | | | | | | | |
| Reported earnings from continuing operations | | | | | | | | | | | | | | | | | | | 1.81 | |
| Total non-recurring items from above | | | | | | | | | | | | | | | | | | | (0.08 | ) |
| | | | | | | | | | | | | | | | | | | | |
| Earnings from continuing operations before non-recurring items | | | | | | | | | | | | | | | | | | $ | 1.73 | |
| | | | | | | | | | | | | | | | | | | | |
| | | | | | | | | | | | | | | | | | | | | |
Discontinued Operations | | | | | | | | | | | | | | | | | | | | |
| Reported earnings from discontinued operations | | | | | | | | | | | | | | | | | | | 0.42 | |
| | | | | | | | | | | | | | | | | | | | |
| | | | | | | | | | | | | | | | | | | | | |
Consolidated | | | | | | | | | | | | | | | | | | | | |
| Reported earnings | | | | | | | | | | | | | | | | | | $ | 2.23 | |
| | | | | | | | | | | | | | | | | | | | |
Free Cash Flow Per Diluted Share Calculation
and Reconciliation to Net Cash Provided by Operating Activities
| | | | | | | | | | | | | | | | | | | | | |
| | | Fiscal Year Ended | | Fiscal Year Ended | | Fiscal Year Ended | | Fiscal Year Ended | | Fiscal Year Ended |
| | | 9/30/01 | | 9/30/02 | | 9/30/03 | | 9/30/04 | | 9/30/05 |
| | | |
| Net Income Available for Common Stock | | $ | 65,499,000 | | | $ | 117,682,000 | | | $ | 178,944,000 | | | $ | 166,586,000 | | | $ | 189,488,000 | |
| Addback: | | | | | | | | | | | | | | | | | | | | |
| Gain on Sale of Discontinued Operations | | $ | — | | | $ | — | | | $ | — | | | $ | — | | | $ | (27,386,000 | ) |
| (Gain) Loss on Sale of Timber Properties | | $ | — | | | $ | — | | | $ | (168,787,000 | ) | | $ | 1,252,000 | | | $ | — | |
| (Gain) Loss on Sale of Oil and Gas | | | | | | | | | | | | | | | | | | $ | — | |
| Producing Properties | | $ | — | | | $ | — | | | $ | 58,472,000 | | | $ | (4,645,000 | ) | | $ | — | |
| Impairment of Oil & Gas Producing Properties | | $ | 180,781,000 | | | $ | — | | | $ | 42,774,000 | | | $ | — | | | $ | — | |
| Depreciation & Depletion and Amortization | | $ | 174,914,000 | | | $ | 180,668,000 | | | $ | 195,226,000 | | | $ | 189,538,000 | | | $ | 193,144,000 | |
| Deferred Income Taxes | | $ | (55,849,000 | ) | | $ | 62,013,000 | | | $ | 78,369,000 | | | $ | 40,329,000 | | | $ | 40,388,000 | |
| Impairment of Investment in Partnership | | $ | — | | | $ | 15,167,000 | | | $ | — | | | $ | — | | | $ | 4,158,000 | |
| Cumulative Effect of Change in Accounting | | $ | — | | | $ | — | | | $ | 8,892,000 | | | $ | — | | | $ | — | |
| (Income) Loss from Unconsolidated Subs. | | | | | | | | | | | | | | $ | — | | | $ | — | |
| Net of Cash Distributions | | $ | (1,199,000 | ) | | $ | 361,000 | | | $ | 703,000 | | | $ | (19,000 | ) | | $ | (1,372,000 | ) |
| Minority Interests in Foreign Subsidiary | | $ | 1,342,000 | | | $ | 730,000 | | | $ | 785,000 | | | $ | 1,933,000 | | | $ | 2,645,000 | |
| Other | | $ | 6,553,000 | | | $ | 9,842,000 | | | $ | 11,289,000 | | | $ | 9,839,000 | | | $ | 7,390,000 | |
| Net Cash Used in Investing Activities | | $ | (387,926,000 | ) | | $ | (205,824,000 | ) | | $ | (104,830,000 | ) | | $ | (163,205,000 | ) | | $ | (103,324,000 | ) |
| Dividends | | $ | (76,671,000 | ) | | $ | (80,974,000 | ) | | $ | (84,530,000 | ) | | $ | (89,092,000 | ) | | $ | (94,159,000 | ) |
| |
| Total Free Cash Flow | | $ | (92,556,000 | ) | | $ | 99,665,000 | | | $ | 217,307,000 | | | $ | 152,516,000 | | | $ | 210,972,000 | |
| Weighted Avg. Shares Outstanding (Diluted) | | | 80,361,258 | | | | 80,534,453 | | | | 81,357,896 | | | | 82,900,438 | | | | 85,029,131 | |
| | | | | | | | | | | | | | | | | | | | | |
| Free Cash Flow Per Diluted Share | | $ | (1.15 | ) | | $ | 1.24 | | | $ | 2.67 | | | $ | 1.84 | | | | 2.48 | |
| | | |
| | | | | | | | | | | | | | | | | | | | | |
| Total Free Cash Flow | | $ | (92,556,000 | ) | | $ | 99,665,000 | | | $ | 217,307,000 | | | $ | 152,516,000 | | | $ | 210,972,000 | |
| Add back: | | | | | | | | | | | | | | | | | | | | |
| Net Cash Used in Investing Activities | | $ | 387,926,000 | | | $ | 205,824,000 | | | $ | 104,830,000 | | | $ | 163,205,000 | | | $ | 103,324,000 | |
| Dividends | | $ | 76,671,000 | | | $ | 80,974,000 | | | $ | 84,530,000 | | | $ | 89,092,000 | | | $ | 94,159,000 | |
| Change in: | | | | | | | | | | | | | | | | | | | | |
| Hedging Collateral Deposits | | $ | — | | | $ | (352,000 | ) | | $ | (1,109,000 | ) | | $ | (7,151,000 | ) | | $ | (69,172,000 | ) |
| Receivables and Unbilled Utility Revenue | | $ | (2,277,000 | ) | | $ | 40,786,000 | | | $ | (28,382,000 | ) | | $ | 4,840,000 | | | $ | (31,246,000 | ) |
| Gas Stored Underground and Materials and Supplies | | $ | (37,054,000 | ) | | $ | 8,717,000 | | | $ | (13,826,000 | ) | | $ | 13,662,000 | | | $ | 1,934,000 | |
| Unrecovered Purchased Gas Costs | | $ | 25,568,000 | | | $ | (8,318,000 | ) | | $ | (16,261,000 | ) | | $ | 21,160,000 | | | $ | (7,285,000 | ) |
| Prepayments | | $ | (399,000 | ) | | $ | (1,737,000 | ) | | $ | (12,628,000 | ) | | $ | 37,390,000 | | | $ | (30,390,000 | ) |
| Accounts Payable | | $ | 20,419,000 | | | $ | (24,025,000 | ) | | $ | 13,699,000 | | | $ | (5,134,000 | ) | | $ | 48,089,000 | |
| Amounts Payable to Customers | | $ | 41,640,000 | | | $ | (51,223,000 | ) | | $ | 692,000 | | | $ | 2,462,000 | | | $ | (1,996,000 | ) |
| Other Accruals and Current Liabilities | | $ | 13,969,000 | | | $ | (27,332,000 | ) | | $ | 9,343,000 | | | $ | 2,082,000 | | | $ | 16,085,000 | |
| Other Assets | | $ | (32,167,000 | ) | | $ | 11,869,000 | | | $ | (9,343,000 | ) | | $ | (2,525,000 | ) | | $ | (13,461,000 | ) |
| Other Liabilities | | $ | 12,287,000 | | | $ | 10,350,000 | | | $ | (23,124,000 | ) | | $ | (34,450,000 | ) | | $ | (3,667,000 | ) |
| |
| Net Cash Provided by Operating Activities | | $ | 414,027,000 | | | $ | 345,198,000 | | | $ | 325,728,000 | | | $ | 437,149,000 | | | $ | 317,346,000 | |
| | | | | | | | | | | | | | | | | | | | | |
| Weighted Avg. Shares Outstanding (Diluted) | | | 80,361,258 | | | | 80,534,453 | | | | 81,357,896 | | | | 82,900,438 | | | | 85,029,131 | |
| | | | | | | | | | | | | | | | | | | | | |
| Net Cash Provided by Operating Activities per Diluted Share | | $ | 5.15 | | | $ | 4.29 | | | $ | 4.00 | | | $ | 5.27 | | | | 3.73 | |
| | | |
Reconciliation of National Fuel Gas Expenditures for Long-lived Assets to
Consolidated Net Cash Used in Investing Activities
(’000)
| | | | | | | | | | | | | | | | | | | | | |
| | | 2001 | | 2002 | | 2003 | | 2004 | | 2005 |
| | | |
| Capital Expenditures | | $ | (292,706 | ) | | $ | (232,368 | ) | | $ | (152,251 | ) | | $ | (172,341 | ) | | $ | (219,530 | ) |
| Investment in Subsidiaries, Net of Cash | | | (90,567 | ) | | $ | — | | | | (228,814 | ) | | $ | — | | | $ | — | |
| Investment in Partnerships | | $ | (1,830 | ) | | $ | (536 | ) | | $ | (375 | ) | | $ | — | | | $ | — | |
| | | |
| Expenditures for Long Lived Assets | | $ | (385,103 | ) | | $ | (232,904 | ) | | $ | (381,440 | ) | | $ | (172,341 | ) | | $ | (219,530 | ) |
| | | | | | | | | | | | | | | | | | | | | |
| Expenditures for Long Lived Assets | | $ | (385,103 | ) | | $ | (232,904 | ) | | $ | (381,440 | ) | | $ | (172,341 | ) | | $ | (219,530 | ) |
| Net Proceeds from Sale of Foreign Subsidiary | | $ | — | | | $ | — | | | $ | — | | | $ | — | | | $ | 111,619 | |
| Net Proceeds from Sale of Timber Properties | | $ | — | | | $ | — | | | $ | 186,014 | | | $ | — | | | $ | — | |
| Net Proceeds from Sale of Oil and Gas Producing Properties | | $ | 2,069 | | | $ | 22,068 | | | $ | 78,531 | | | $ | 7,162 | | | $ | 1,349 | |
| Other | | $ | (4,892 | ) | | $ | 5,012 | | | $ | 12,065 | | | $ | 1,974 | | | $ | 3,238 | |
| | | |
| Net Cash Used in Investing Activities | | $ | (387,926 | ) | | $ | (205,824 | ) | | $ | (104,830 | ) | | $ | (163,205 | ) | | $ | (103,324 | ) |
| | | |
Reconciliation of Pipeline & Storage Operating Revenues to
Consolidated Operating Revenues Fiscal 2005
($Millions)
| | | | | |
| Pipeline Revenues | | $ | 121.6 | |
| Storage Revenues | | $ | 65.6 | |
| Other Revenues | | $ | 28.7 | |
| |
| Total Pipeline & Storage Revenues | | $ | 215.9 | |
| All Other Segments | | $ | 1,707.7 | |
| Total Corporation | | $ | 1,923.6 | |
Reconciliation of Pipeline & Storage Segment Diluted Earnings Per Share to
Consolidated Diluted Earnings Per Share
| | | | | |
| | | Forecast | |
| | | Fiscal 2006E | |
| Pipeline & Storage Segment | | $ | 0.60-$0.63 | |
| All Other Segments | | $ | 1.70-$1.87 | |
| | | | |
| Total Corporation | | $ | 2.30-$2.50 | |
| | | | |
Reconciliation of Utility Segment Diluted Earnings Per Share to
Consolidated Diluted Earnings Per Share
| | | | | |
| | | Forecast | |
| | | Fiscal 2006E | |
| Utility Segment | | $ | 0.52-$0.59 | |
| All Other Segments | | $ | 1.78-$1.91 | |
| | | | |
| Total Corporation | | $ | 2.30-$2.50 | |
| | | | |
Reconciliation of Exploration & Production Operating Revenue to
Consolidated Operating Revenue
($Millions)
| | | | | | | | | |
| | | 4Q FY 2005 | | 2005 |
| | | |
| Exploration & Production | | $ | 73.9 | | | $ | 293.4 | |
| All Other Segments | | $ | 213.2 | | | $ | 1,630.1 | |
| | | |
| Total Corporation | | $ | 287.1 | | | $ | 1,923.5 | |
| | | |
Reconciliation of Exploration & Production Net Income to
Consolidated Net Income
($Millions)
| | | | | | | | | |
| | | 4Q FY 2005 | | 2005 |
| | | |
| Exploration & Production | | $ | 11.7 | | | $ | 50.7 | |
| All Other Segments | | $ | 37.5 | | | $ | 138.8 | |
| | | |
| Total Corporation | | $ | 49.2 | | | $ | 189.5 | |
| | | |
Reconciliation of Exploration & Production Diluted Earnings Per Share to
Consolidated Diluted Earnings Per Share
| | | | | | | | | | | | | |
| | | | | | | | | | | Forecast |
| | | 4Q FY 2005 | | 2005 | | Fiscal 2006E |
| | | |
| Exploration & Production | | $ | 0.13 | | | $ | 0.60 | | | $ | 1.10-$1.20 | |
| All Other Segments | | $ | 0.44 | | | $ | 1.63 | | | $ | 1.20-$1.30 | |
| | | |
| Total Corporation | | $ | 0.57 | | | $ | 2.23 | | | $ | 2.30-$2.50 | |
| | | |
Reconciliation of Timber Segment Diluted Earnings Per Share to
Consolidated Diluted Earnings Per Share
| | | | | |
| | | Forecast | |
| | | Fiscal 2006E | |
| Timber Segment | | $ | 0.05 | |
| All Other Segments | | $ | 2.25-$2.45 | |
| | | | |
| Total Corporation | | $ | 2.30-$2.50 | |
| | | | |
Reconciliation of Energy Marketing Segment Diluted Earnings Per Share to
Consolidated Diluted Earnings Per Share
| | | | | |
| | | Forecast | |
| | | Fiscal 2006E | |
| Energy Marketing Segment | | $ | 0.02 | |
| All Other Segments | | $ | 2.28-$2.48 | |
| | | | |
| Total Corporation | | $ | 2.30-$2.50 | |
| | | | |
Reconciliation of Utility Net Uncollectible Write-offs (NY & PA) to
National Fuel Gas Net Accounts Receivable Written-Off Reserve for Doubtful Accounts
($Thousands)
| | | | | | | | | | | | | | | | | | | | | |
| | | 2001 | | 2002 | | 2003 | | 2004 | | 2005 |
| | | |
| Balance at Beginning of Period | | $ | 12,013 | | | $ | 18,521 | | | $ | 17,299 | | | $ | 17,943 | | | $ | 17,440 | |
| Additions Charged to Costs and Expenses | | | 17,445 | | | | 16,082 | | | | 17,275 | | | | 20,328 | | | | 31,113 | |
| | | |
| | | $ | 29,458 | | | $ | 34,603 | | | $ | 34,574 | | | $ | 38,271 | | | $ | 48,553 | |
| | | | | | | | | | | | | | | | | | | | | |
| Additions Charged to Other Accounts | | $ | — | | | $ | 2,834 | | | $ | — | | | $ | — | | | $ | 2,480 | |
| | | | | | | | | | | | | | | | | | | | | |
| Deductions (Write-offs): | | | | | | | | | | | | | | | | | | | | |
| Utility: | | | | | | | | | | | | | | | | | | | | |
| New York | | $ | 6,000 | | | $ | 12,500 | | | $ | 11,300 | | | $ | 14,500 | | | $ | 15,600 | |
| Pennsylvania | | | 3,300 | | | $ | 6,300 | | | $ | 4,100 | | | $ | 5,400 | | | $ | 7,200 | |
| All Other Segments | | | 1,637 | | | | 1,338 | | | | 1,231 | | | | 931 | | | | 1,293 | |
| | | |
| Total Deductions | | $ | 10,937 | | | $ | 20,138 | | | $ | 16,631 | | | $ | 20,831 | | | $ | 24,093 | |
| | | | | | | | | | | | | | | | | | | | | |
| Reserve for Doubtful Account Balance at End of Period | | $ | 18,521 | | | $ | 17,299 | | | $ | 17,943 | | | $ | 17,440 | | | $ | 26,940 | |
| | | |
Reconciliation of Utility Segment Aged Accounts Receivable to
Consolidated Accounts Receivable — Net
($Millions)
| | | | | | | | | | | | | | | | | |
| | | at 9/30/02 | | at 9/30/03 | | at 9/30/04 | | at 9/30/05 |
| | | |
| Utility Aged Accounts Receivable | | $ | 41.5 | | | $ | 63.1 | | | $ | 68.1 | | | $ | 76.3 | |
| Utility Current/Other Accounts Receivable | | $ | 16.2 | | | $ | 28.0 | | | $ | 18.2 | | | $ | 16.4 | |
| | | |
| Utility Gross Accounts Receivable | | $ | 57.7 | | | $ | 91.1 | | | $ | 86.3 | | | $ | 92.7 | |
| Utility Reserve for Bad Debt | | $ | (13.3 | ) | | $ | (12.7 | ) | | $ | (12.9 | ) | | $ | (25.1 | ) |
| | | |
| Utility Net Accounts Receivable | | $ | 44.4 | | | $ | 78.4 | | | $ | 73.4 | | | $ | 67.6 | |
| | | |
| All Other Segments Gross Accounts Receivable | | $ | 55.1 | | | $ | 63.4 | | | $ | 61.0 | | | $ | 89.3 | |
| All Other Segments Reserve for Bad Debts | | $ | (4.0 | ) | | $ | (5.3 | ) | | $ | (4.6 | ) | | $ | (1.8 | ) |
| | | |
| All Other Segments Net Accounts Receivable | | $ | 51.1 | | | $ | 58.2 | | | $ | 56.4 | | | $ | 87.5 | |
| | | |
| Total Corporation Accounts Receivable — Net | | $ | 95.5 | | | $ | 136.6 | | | $ | 129.8 | | | $ | 155.1 | |
| | | |


