Exhibit 99

| National Fuel Gas Company .. Philip C. Ackerman Chairman & CEO |

| Safe Harbor NOTE: This presentation contains certain forward-looking statements as defined by the Private Securities Litigation Reform Act of 1995. Forward-looking statements include, but are not limited to, statements concerning plans, objectives, goals, projections, strategies and future events or performance, other statements that are not statements of historical fact, and statements identified by words such as "anticipates," "believes," "estimates," "expects," "intends," "plans," "may," "should," "will" or words of similar meaning. While National Fuel's expectations, beliefs and projections are made in good faith and are believed to have a reasonable basis, actual results may differ materially. You may refer to National Fuel's most recent Form 10-Q for a listing of important risk factors you should consider. In addition, this presentation contains certain non-GAAP financial measures. For pages that contain non- GAAP financial measures, pages containing the most directly comparable GAAP financial measures and reconciliations are provided at the end of this presentation. |

| Grow shareholder value through timely investment in the energy industry. National Fuel Gas Company Corporate Objective |
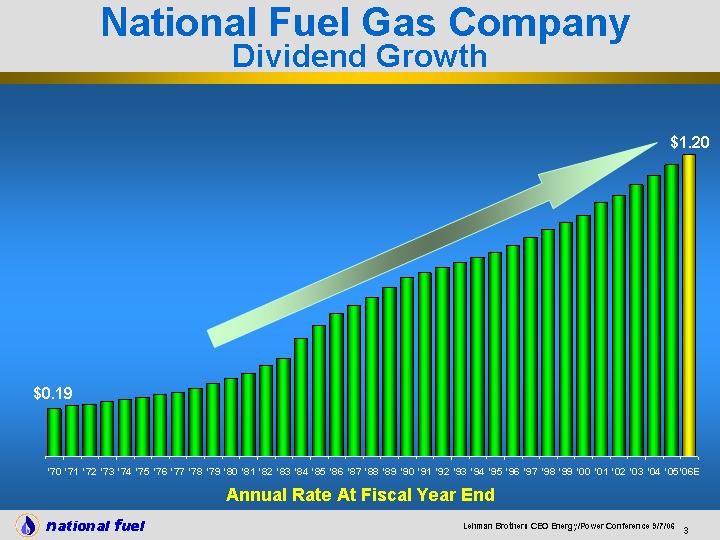
| '70 0.19 '71 0.2 '72 0.205 '73 0.215 '74 0.225 '75 0.235 '76 0.245 '77 0.255 '78 0.27 '79 0.2875 '80 0.3075 '81 0.33 '82 0.36 '83 0.39 '84 0.47 '85 0.52 '86 0.57 '87 0.6 '88 0.63 '89 0.67 '90 0.71 '91 0.73 '92 0.75 '93 0.77 '94 0.79 '95 0.81 '96 0.84 '97 0.87 '98 0.9 '99 0.93 '00 0.96 '01 1.01 '02 1.04 '03 1.08 '04 1.12 '05 1.16 '06E 1.2 $0.19 $1.20 Annual Rate At Fiscal Year End National Fuel Gas Company Dividend Growth |
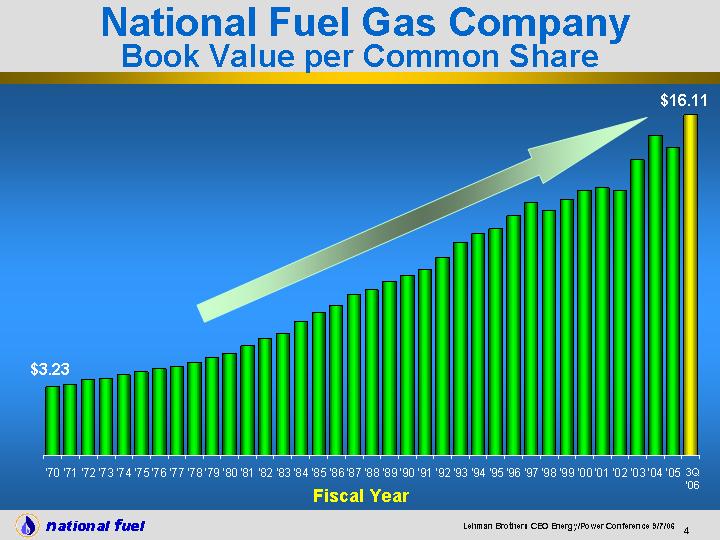
| '70 '71 '72 '73 '74 '75 '76 '77 '78 '79 '80 '81 '82 '83 '84 '85 '86 '87 '88 '89 '90 '91 '92 '93 '94 '95 '96 '97 '98 '99 '00 '01 '02 '03 '04 '05 3.23 3.36 3.58 3.64 3.8 3.94 4.06 4.21 4.39 4.63 4.82 5.18 5.54 5.75 6.31 6.76 7.07 7.61 7.83 8.22 8.48 8.76 9.34 10.04 10.47 10.69 11.31 11.97 11.57 12.09 12.55 12.63 12.54 13.97 15.11 14.58 16.11 $3.23 $16.11 Fiscal Year 3Q '06 National Fuel Gas Company Book Value per Common Share |
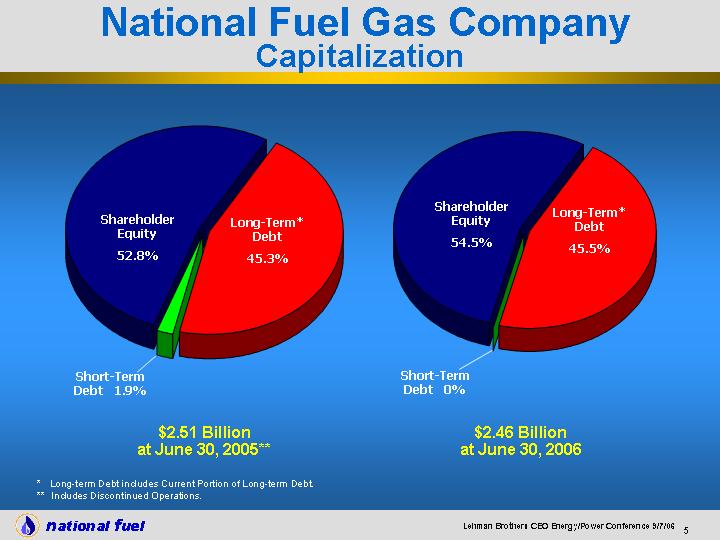
| * Long-term Debt includes Current Portion of Long-term Debt. ** Includes Discontinued Operations. $2.51 Billion at June 30, 2005** Long-Term Debt Short-Term Debt Shareholder Equity Capitalization 1137 49.6 1325.8 Short-Term Debt 1.9% Shareholder Equity 52.8% Long-Term* Debt 45.3% $2.46 Billion at June 30, 2006 Long-Term Debt Short-Term Debt Shareholder Equity Capitalization 1121.2 0 1341.7 Short-Term Debt 0% National Fuel Gas Company Capitalization Shareholder Equity 54.5% Long-Term* Debt 45.5% |
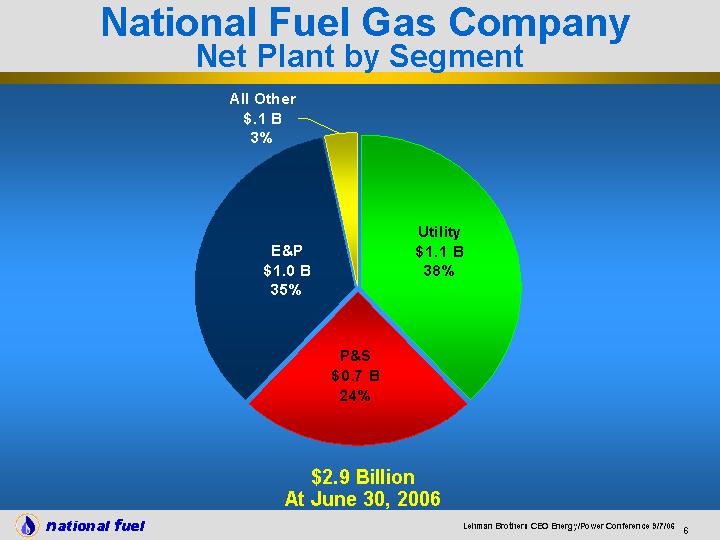
| $2.9 Billion At June 30, 2006 Utility P&S E&P All Other Net plant 1.1 0.7 1 0.1 National Fuel Gas Company Net Plant by Segment |
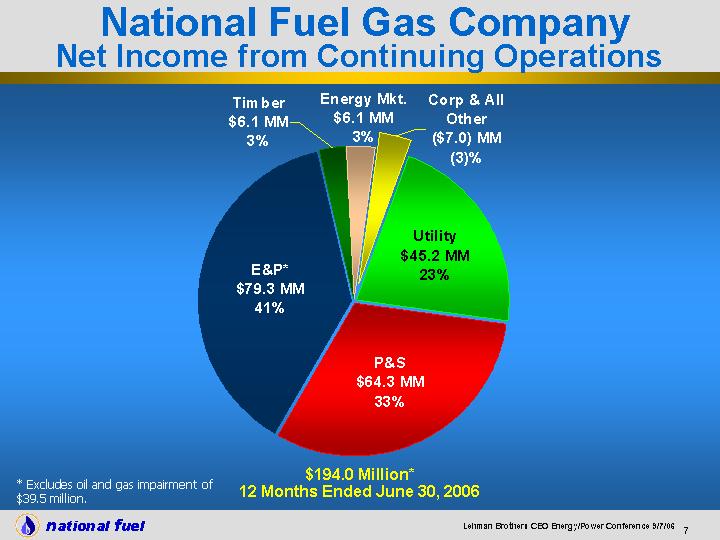
| $194.0 Million* 12 Months Ended June 30, 2006 Utility P&S E&P Timber Energy Mkt. Corp. & Other NI 45.2 64.3 79.3 6.1 6.1 -7 National Fuel Gas Company Net Income from Continuing Operations * Excludes oil and gas impairment of $39.5 million. |
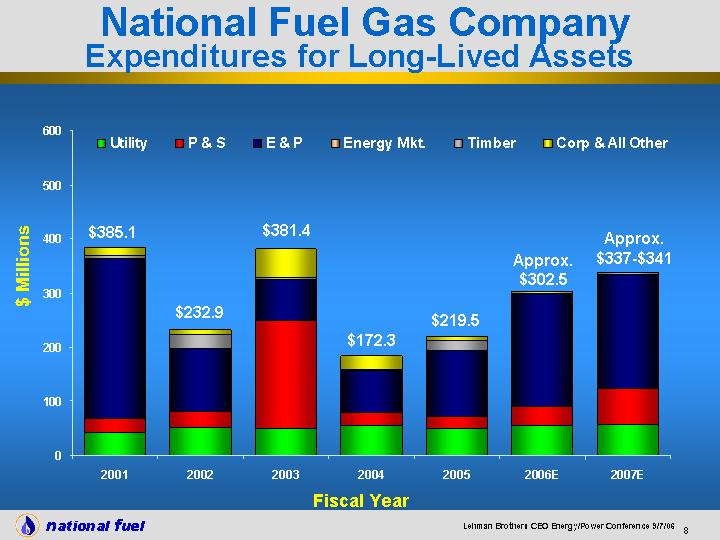
| $ Millions Fiscal Year 2001 2002 2003 2004 2005 2006E 2007E Utility 42.4 51.5 49.9 55.5 50.1 56 58 P & S 26 30.3 199.4 23.2 21.1 34 65 E & P 296.4 114.6 75.8 77.7 122.4 208 212 Energy Mkt. 0.116 0.1 0.2 0.0102 0 0 0 Timber 3.7 25.6 3.5 2.8 18.9 2 2 Corp & All Other 16.537 10.8 52.6 24 7 2.5 2 $385.1 $232.9 $381.4 $172.3 $219.5 Approx. $337-$341 National Fuel Gas Company Expenditures for Long-Lived Assets Approx. $302.5 |
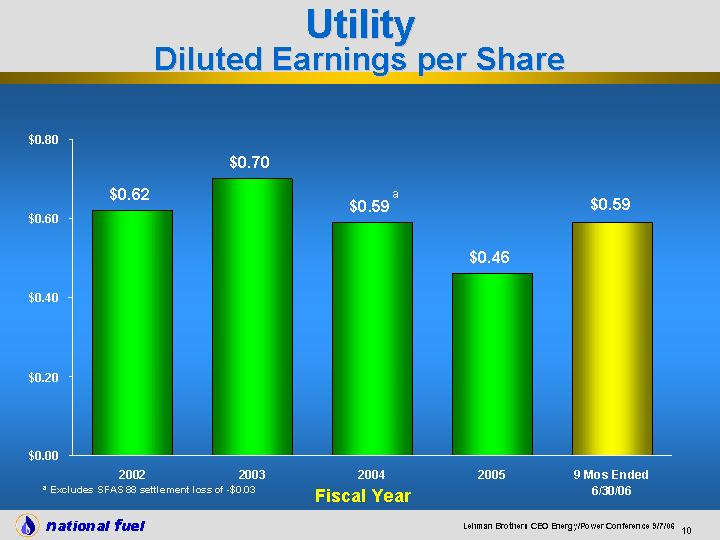
| Fiscal Year 2002 2003 2004 2005 9 Mos Ended 6/30/06 Earnings 0.62 0.7 0.59 0.46 0.59 a Excludes SFAS 88 settlement loss of -$0.03 a Fiscal Year Utility Diluted Earnings per Share |
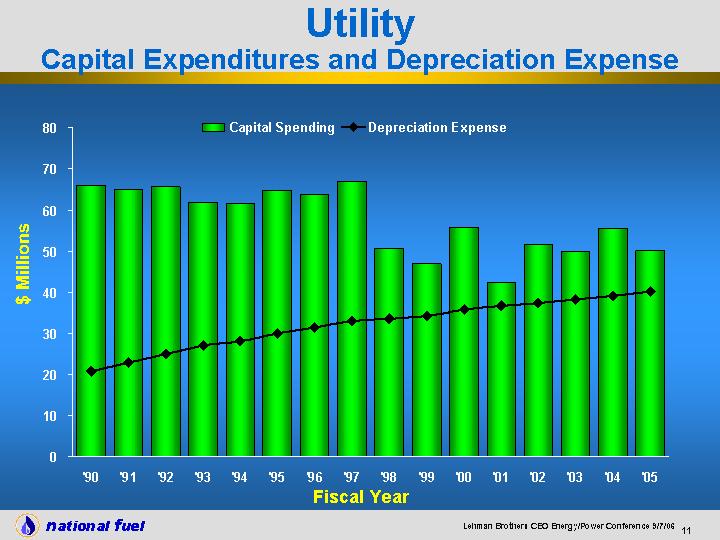
| '90 '91 '92 '93 '94 '95 '96 '97 '98 '99 '00 '01 '02 '03 '04 '05 Capital Spending 66.1 64.9 65.7 61.8 61.7 64.8 63.7 66.9 50.7 47 55.8 42.4 51.5 49.9 55.5 50.1 Depreciation Expense 20.8 22.9 25 27.1 28.2 30 31.5 33 33.5 34.2 35.8 36.6 37.4 38.2 39.1 40.2 $ Millions Fiscal Year Utility Capital Expenditures and Depreciation Expense |
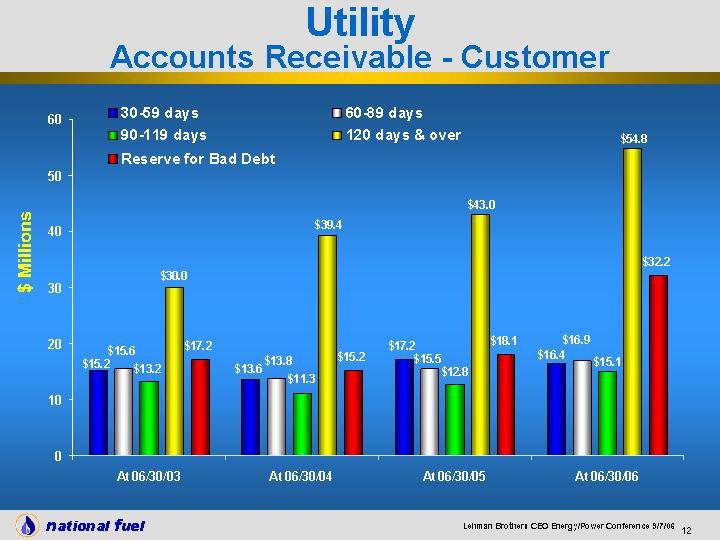
| At 06/30/03 At 06/30/04 At 06/30/05 At 06/30/06 30-59 days 15.2 13.64 17.23 16.44 60-89 days 15.57 13.81 15.53 16.94 90-119 days 13.15 11.25 12.8 15.08 120 days & over 29.95 39.4 43.03 54.81 Reserve for Bad Debt 17.17 15.16 18.13 32.21 Utility Accounts Receivable - Customer $ Millions |
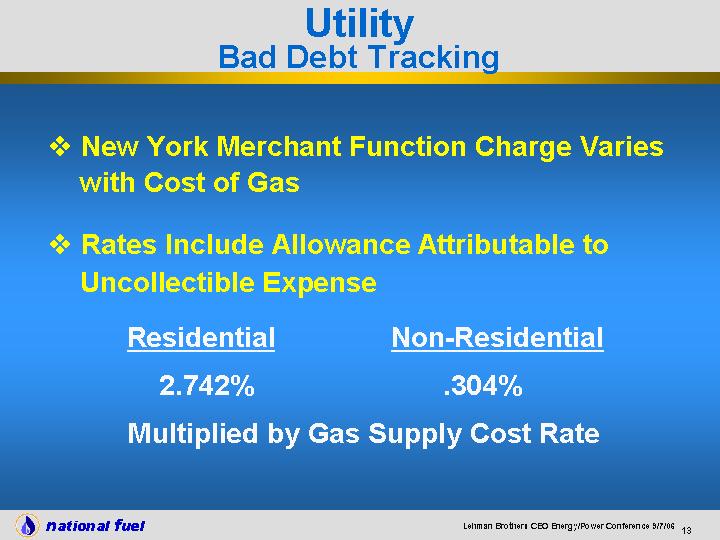
| New York Merchant Function Charge Varies with Cost of Gas Rates Include Allowance Attributable to Uncollectible Expense Residential Non-Residential 2.742% .304% Multiplied by Gas Supply Cost Rate Utility Bad Debt Tracking |
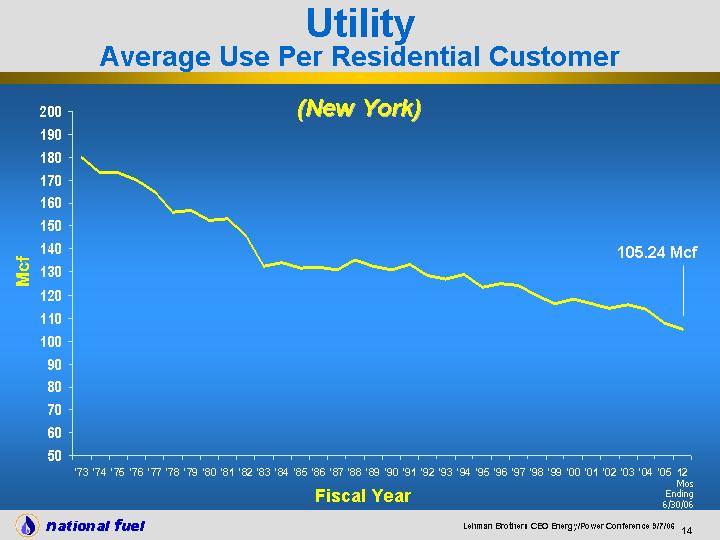
| '73 '74 '75 '76 '77 '78 '79 '80 '81 '82 '83 '84 '85 '86 '87 '88 '89 '90 '91 '92 '93 '94 '95 '96 '97 '98 '99 '00 '01 '02 '03 '04 '05 12 180.205 173.305 173.431 170.237 164.955 156.044 156.898 152.605 153.207 145.597 132.388 134.153 131.672 132.194 131.12 135.531 132.77 130.829 133.551 128.393 127.036 128.857 123.223 124.975 124.137 119.631 116.131 118.369 116.198 114.23 115.627 113.961 107.929 105.24 Fiscal Year Utility Average Use Per Residential Customer Mcf 105.24 Mcf (New York) Mos Ending 6/30/06 |
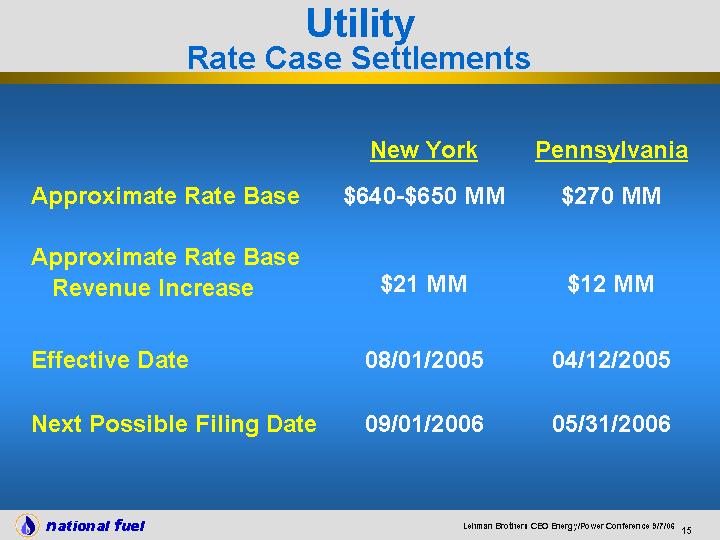
| Utility Rate Case Settlements New York Pennsylvania Approximate Rate Base $640-$650 MM $270 MM Approximate Rate Base Revenue Increase $21 MM $12 MM Effective Date 08/01/2005 04/12/2005 Next Possible Filing Date 09/01/2006 05/31/2006 |
| Utility Pennsylvania Jurisdiction On May 31, 2006 the Utility filed a rate case with the Pennsylvania PUC, to increase revenues by $25.9 million. Based on a typical rate proceeding, the case may not be completed until March, 2007. Contributing Factors Include, in part: An ongoing construction program, consisting of primarily non-revenue producing replacements of mains and services Increases in operation and maintenance expenses Increases in payroll and expenses for benefits Loss of load per account and increases in uncollectible accounts Increased cost of capital |
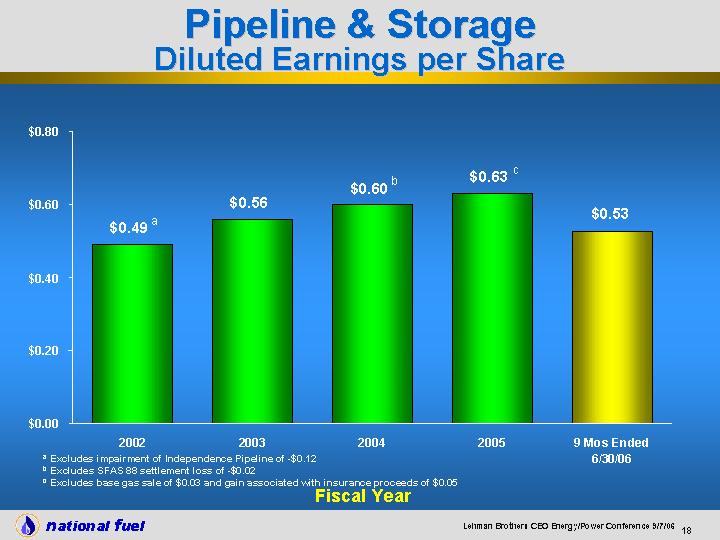
| a Excludes impairment of Independence Pipeline of -$0.12 b Excludes SFAS 88 settlement loss of -$0.02 c Excludes base gas sale of $0.03 and gain associated with insurance proceeds of $0.05 Fiscal Year Pipeline & Storage Diluted Earnings per Share Fiscal Year 2002 2003 2004 2005 9 Mos Ended 6/30/06 Earnings 0.49 0.56 0.599 0.63 0.527 a b c |
| 2,972 Miles of System Pipeline 15 Compressor Stations Totaling 39,606 Horsepower Transportation Volume for Fiscal 2005: 372.4 Bcf $121.6 MM in Revenues for Fiscal 2005 Pipeline & Storage Pipeline Operating Statistics |
| 32 Underground Natural Gas Storage Fields (4 Co-owned with Nonaffiliated Companies) 15 Compressor Stations Totaling 35,475 Horsepower 73.4 Bcf of Working Storage Capacity $65.6 MM in Revenues for Fiscal 2005 Pipeline & Storage Storage Operating Statistics |
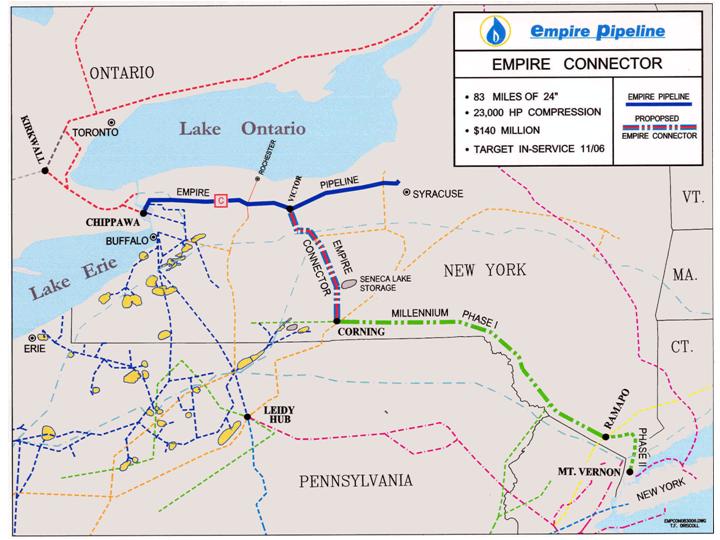
| 78 MILES of 24" 20,700 HP COMPRESSION APPROX. $143 MILLION COST TARGET IN-SERVICE DATE 11/07 EMPIRE PIPELINE PROPOSED EMPIRE CONNECTOR Update Pending from Tim Driscoll |
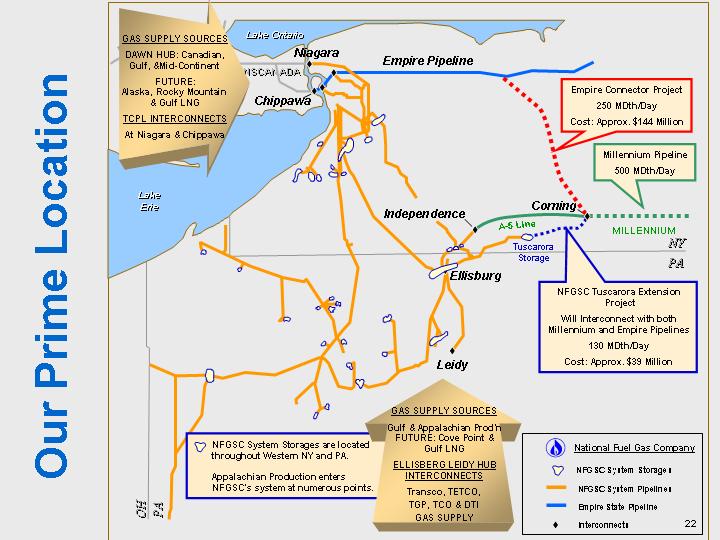
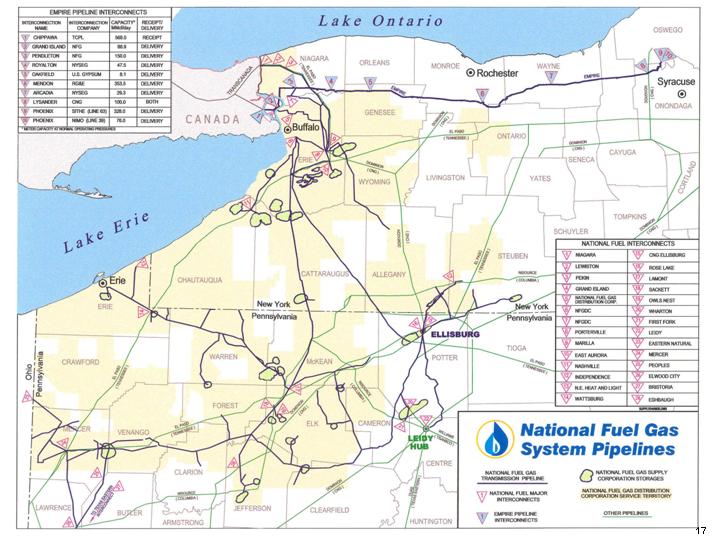
| Our Prime Location Niagara CANADA Lake Ontario Lake Erie Leidy Ellisburg NY PA PA OH TRANSCANADA UNION GAS Chippawa Corning A-5 Line Independence MILLENNIUM Empire Connector Project 250 MDth/Day Cost: Approx. $144 Million NFGSC Tuscarora Extension Project Will Interconnect with both Millennium and Empire Pipelines 130 MDth/Day Cost: Approx. $39 Million Tuscarora Storage GAS SUPPLY SOURCES DAWN HUB: Canadian, Gulf, &Mid-Continent FUTURE: Alaska, Rocky Mountain & Gulf LNG TCPL INTERCONNECTS At Niagara & Chippawa GAS SUPPLY SOURCES Gulf & Appalachian Prod'n FUTURE: Cove Point & Gulf LNG ELLISBERG LEIDY HUB INTERCONNECTS Transco, TETCO, TGP, TCO & DTI GAS SUPPLY Millennium Pipeline 500 MDth/Day National Fuel Gas Company NFGSC System Storages NFGSC System Pipelines Empire State Pipeline Interconnects Empire Pipeline 22 |
| 4/7/06: Complaint & Motion for Summary Disposition filed against Supply Corp. by NYPSC, PaPUC and Pennsylvania OCA (FERC Docket No. RP06-298-000) Complainants allege that Supply's rates are unjust and unreasonable and challenge Supply's fuel retainage level Supply is vigorously opposing these actions 6/7/06: FERC denied Complainants' Motion for Summary Disposition and deferred hearing pending outcome of settlement discussions Pipeline & Storage FERC Proceeding |
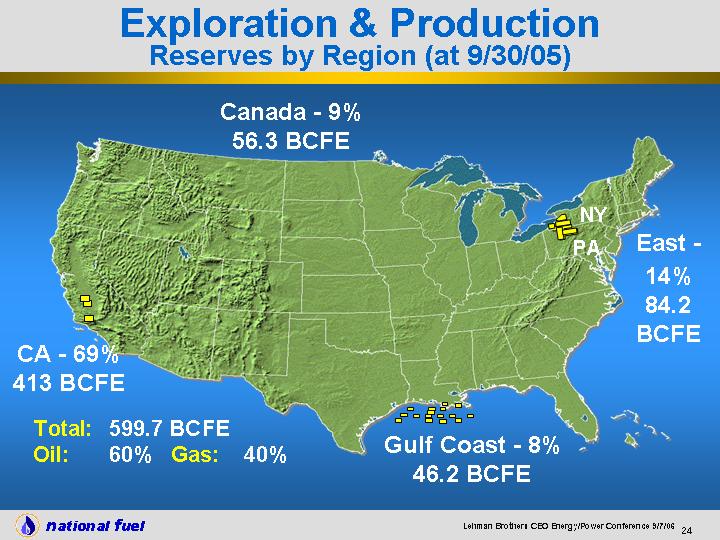
| Canada - 9% 56.3 BCFE NY PA Gulf Coast - 8% 46.2 BCFE East - 14% 84.2 BCFE CA - 69% 413 BCFE Total: 599.7 BCFE Oil: 60% Gas: 40% Exploration & Production Reserves by Region (at 9/30/05) |
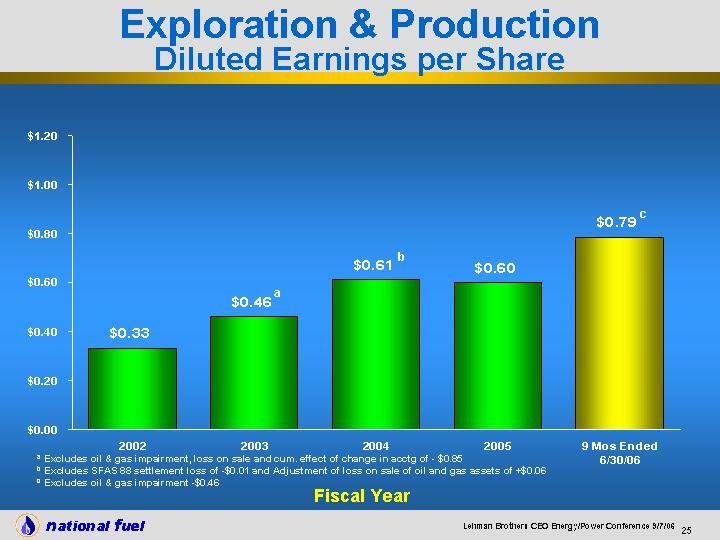
| Fiscal Year 2002 2003 2004 2005 9 Mos Ended 6/30/06 Earnings 0.33 0.46 0.61 0.6 0.785 a b a Excludes oil & gas impairment, loss on sale and cum. effect of change in acctg of - $0.85 b Excludes SFAS 88 settlement loss of -$0.01 and Adjustment of loss on sale of oil and gas assets of +$0.06 c Excludes oil & gas impairment -$0.46 Fiscal Year Exploration & Production Diluted Earnings per Share c |
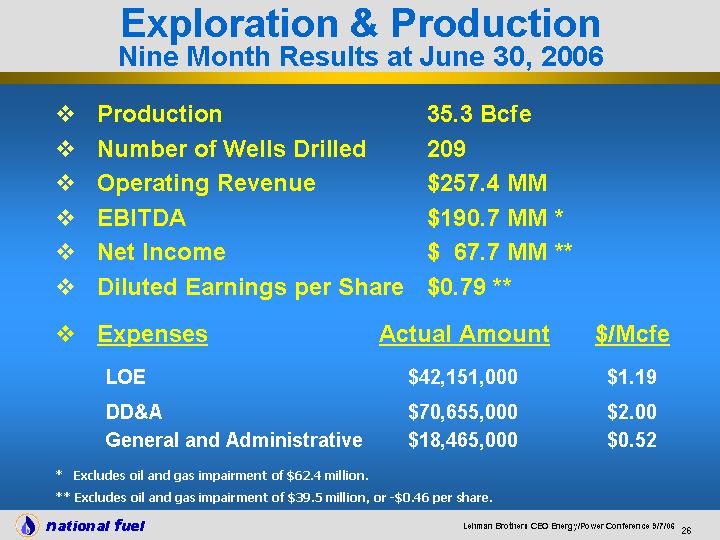
| Expenses Actual Amount $/Mcfe LOE $42,151,000 $1.19 DD&A $70,655,000 $2.00 General and Administrative $18,465,000 $0.52 Exploration & Production Nine Month Results at June 30, 2006 Production Number of Wells Drilled Operating Revenue EBITDA Net Income Diluted Earnings per Share 35.3 Bcfe 209 $257.4 MM $190.7 MM * $ 67.7 MM ** $0.79 ** ** Excludes oil and gas impairment of $39.5 million, or -$0.46 per share. * Excludes oil and gas impairment of $62.4 million. |
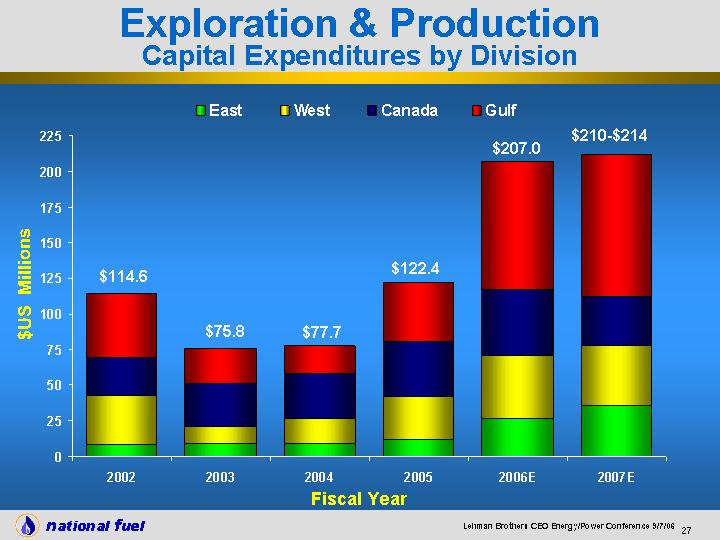
| 2002 2003 2004 2005 2006E 2007E East 8.4 9.4 9.5 12.5 27 35.5 West 34.4 11.4 17.4 29.6 44 42.5 Canada 27 30.8 31.4 38.5 46 34.5 Gulf 44.8 24.2 19.4 41.8 90 99.5 $114.6 $75.8 $77.7 $122.4 $207.0 Fiscal Year $US Millions Exploration & Production Capital Expenditures by Division $210-$214 |
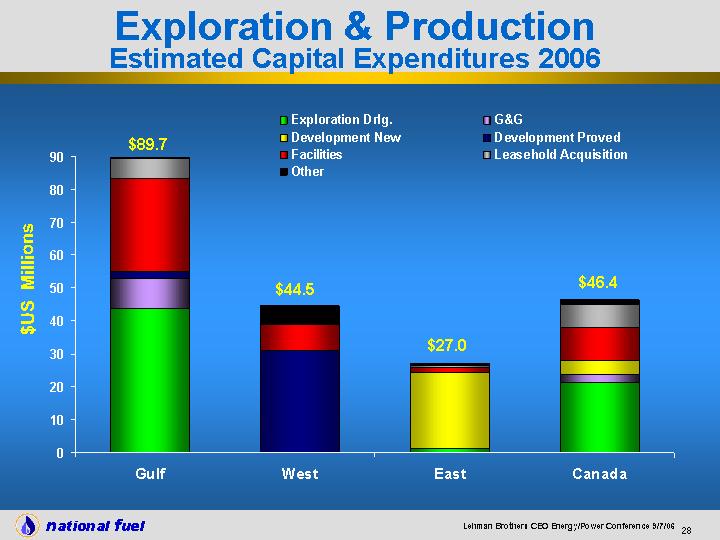
| $US Millions Exploration & Production Estimated Capital Expenditures 2006 Gulf West East Canada Exploration Drlg. 43.9 0 1.2 21.2 G&G 9 0 0.1 2.5 Development New 0 0 22.8 4.2 Development Proved 2.2 30.9 0 0 Facilities 28.2 7.9 1.7 10.2 Leasehold Acquisition 6.1 0 0.8 6.8 Other 0.3 5.7 0.5 1.5 $89.7 $44.5 $27.0 $46.4 |
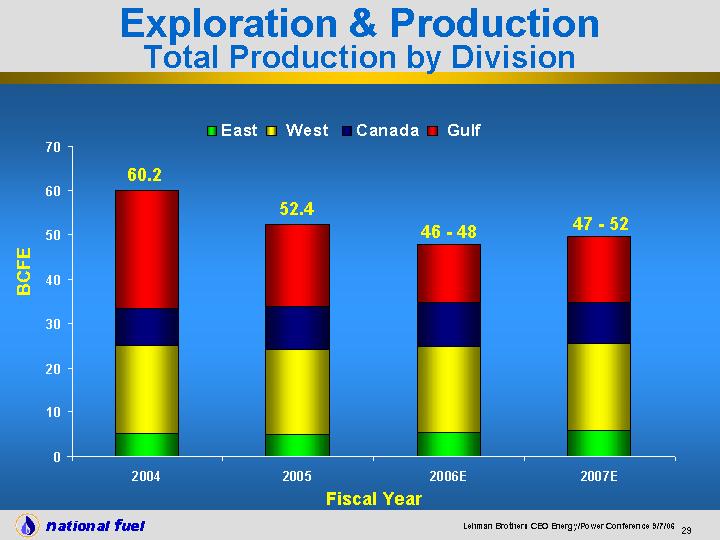
| 2004 2005 2006E 2007E East 5.25 4.9 5.4 6 West 19.957 19.3 19.4 19.5 Canada 8.2 9.8 10 9.25 Gulf 26.8 18.4 13.2 14.75 BCFE Fiscal Year Exploration & Production Total Production by Division 46 - 48 52.4 60.2 47 - 52 |
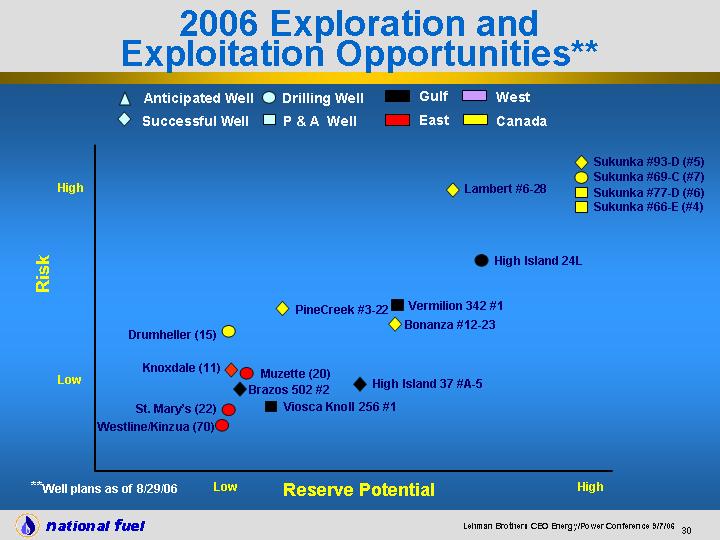
| Gulf East West Canada High Low Risk Reserve Potential High Low **Well plans as of 8/29/06 Anticipated Well Drilling Well Successful Well P & A Well Sukunka #93-D (#5) Drumheller (15) Westline/Kinzua (70) Muzette (20) PineCreek #3-22 High Island 24L Viosca Knoll 256 #1 Bonanza #12-23 Vermilion 342 #1 High Island 37 #A-5 2006 Exploration and Exploitation Opportunities** Sukunka #77-D (#6) Sukunka #69-C (#7) Sukunka #66-E (#4) Lambert #6-28 Brazos 502 #2 Knoxdale (11) St. Mary's (22) |

| High Island 37 #A-5 On Production 78% Medium Sukunka #77-D (#6) P & A 20% High Sukunka #93-D (#5) On Production 20% High Sukunka #66-E (#4) P & A 20% High Pine Creek 3-22 Evaluate Tie-in Options 60% Low Bonanza 12-23 Completing 65% Medium Lambert 6-28 Completing 19% High Viosca Knoll 256 #1 P & A 47% Low Brazos 502 #2 Mudline Suspended 65% Low High Island 24L Drilling 20% Medium Vermilion 342 #1 P & A 100% Medium Working Well Location Status Interest Reserve Impact Exploration & Production Impact Wells Production & Reserves Fiscal 2006 |

| Gulf East West Canada High Low Risk Reserve Potential High Low **Well plans as of 8/29/06 Anticipated Well Drilling Well Successful Well P & A Well Sukunka #8 2007 Exploration and Exploitation Opportunities** Sukunka 69-C #7 Peppers #16-16 West Cameron 96 #2 High Island 37 #B-2 High Island A-306/315 Ship Shoal 79 East Cameron 352 Vermilion 253 Trenton (2) Knoxdale (35) Muzette (30) Westline/Kinzua (35) St. Marys (20) East Cameron 34 Peppers #12-12 Drumheller (6) PineCreek (6) Bonanza development (2) Other Prospects (36) |
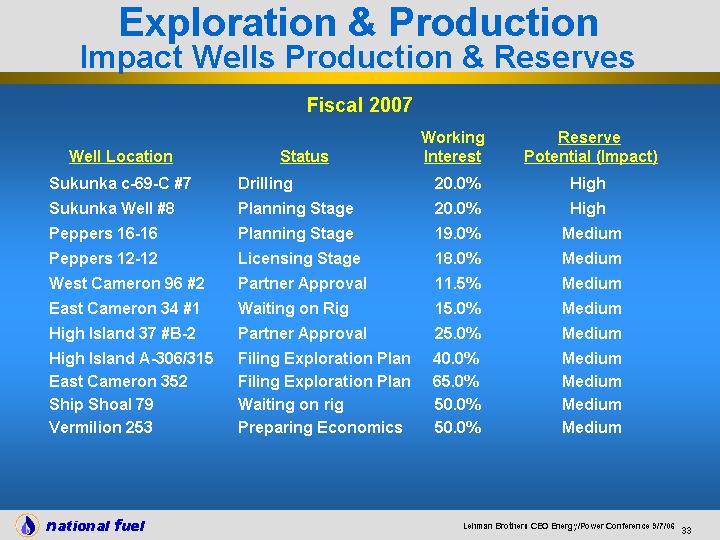
| Fiscal 2007 Sukunka c-69-C #7 Drilling 20.0% High Sukunka Well #8 Planning Stage 20.0% High Peppers 16-16 Planning Stage 19.0% Medium Peppers 12-12 Licensing Stage 18.0% Medium West Cameron 96 #2 Partner Approval 11.5% Medium East Cameron 34 #1 Waiting on Rig 15.0% Medium High Island 37 #B-2 Partner Approval 25.0% Medium High Island A-306/315 Filing Exploration Plan 40.0% Medium East Cameron 352 Filing Exploration Plan 65.0% Medium Ship Shoal 79 Waiting on rig 50.0% Medium Vermilion 253 Preparing Economics 50.0% Medium Well Location Status Working Interest Reserve Potential (Impact) Exploration & Production Impact Wells Production & Reserves |

| Seneca's Working Interest: 20% Sukunka b-60-E Production Commenced on December 13, 2004 Current Sales Rate up to 60 MMcf/d * Sukunka d-93-D Well Successfully Completed Production Tests at Rates up to 33 MMcf/d * Exploration & Production Sukunka Wells * Third Party Processing Facilities Limit Production to 65 MMcf/d |
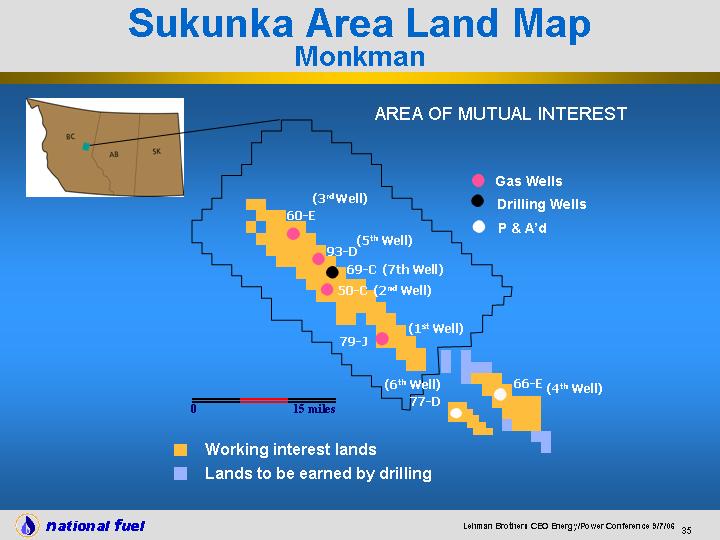
| 0 15 miles (2nd Well) (3rd Well) (5th Well) (4th Well) (6th Well) AREA OF MUTUAL INTEREST Gas Wells Drilling Wells Working interest lands Lands to be earned by drilling 66-E 79-J 50-C 93-D (1st Well) 60-E Sukunka Area Land Map Monkman P & A'd 77-D (7th Well) 69-C |
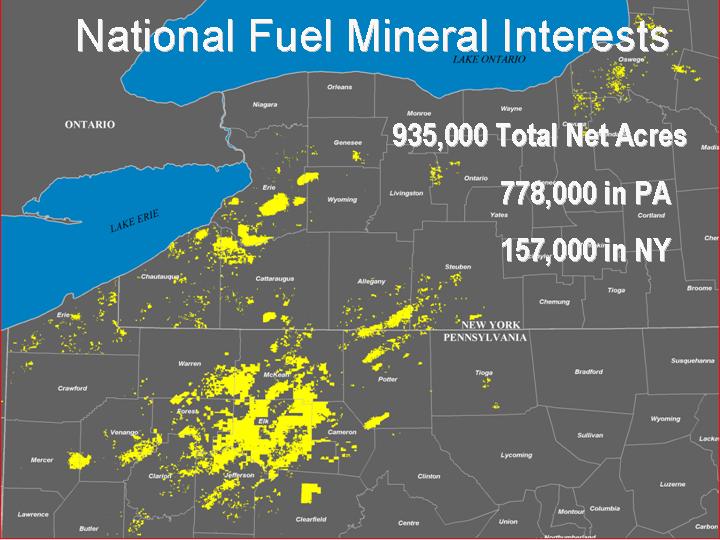
| 935,000 Total Net Acres 778,000 in PA 157,000 in NY National Fuel Mineral Interests |
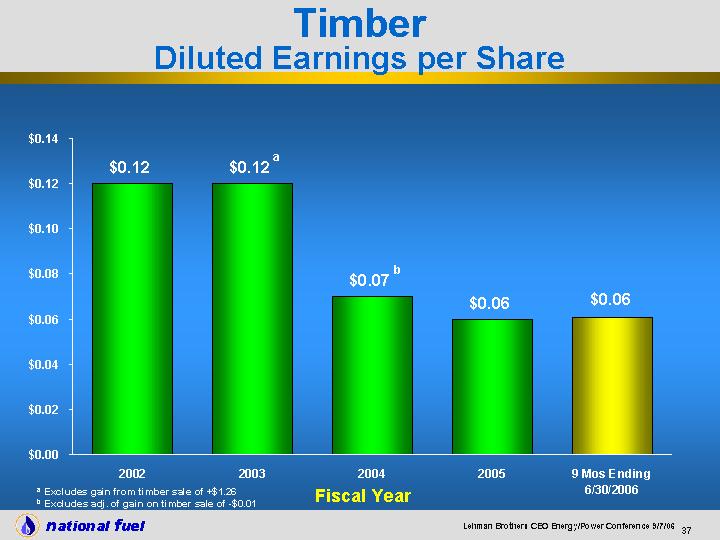
| Fiscal Year 2002 2003 2004 2005 9 Mos Ending 6/30/2006 Earnings 0.12 0.12 0.07 0.06 0.061 a b a Excludes gain from timber sale of +$1.26 b Excludes adj. of gain on timber sale of -$0.01 Fiscal Year Timber Diluted Earnings per Share |
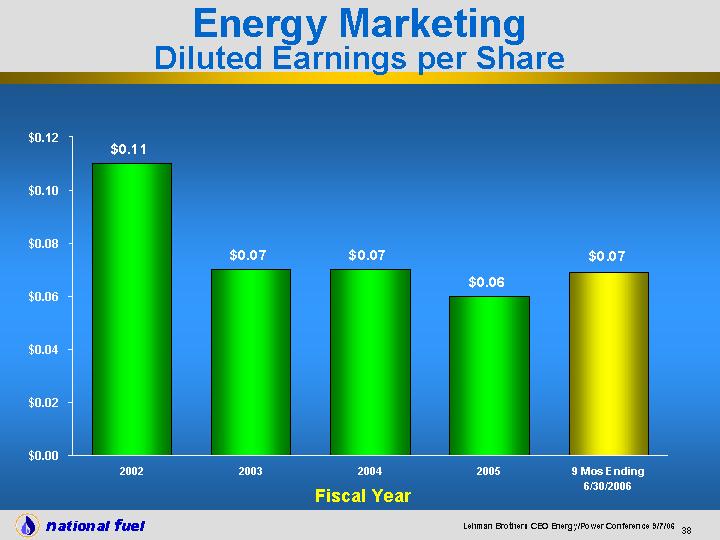
| Energy Marketing Diluted Earnings per Share Fiscal Year 2002 2003 2004 2005 9 Mos Ending 6/30/2006 Earnings 0.11 0.07 0.07 0.06 0.069 Fiscal Year |
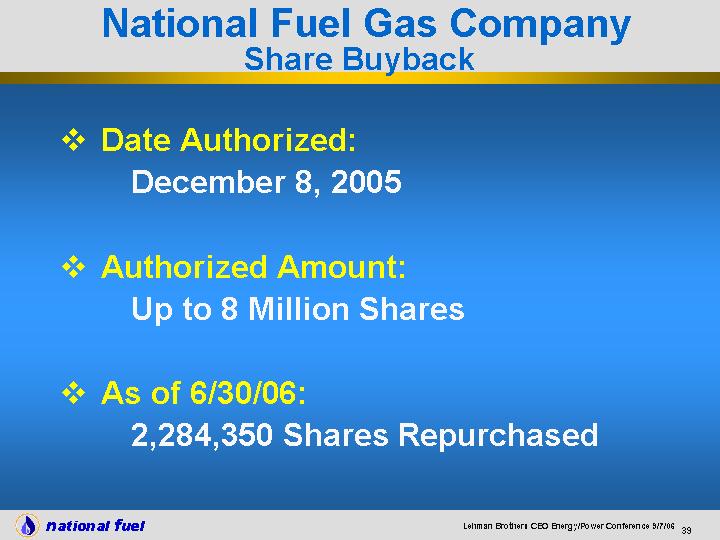
| National Fuel Gas Company Share Buyback Date Authorized: December 8, 2005 Authorized Amount: Up to 8 Million Shares As of 6/30/06: 2,284,350 Shares Repurchased |
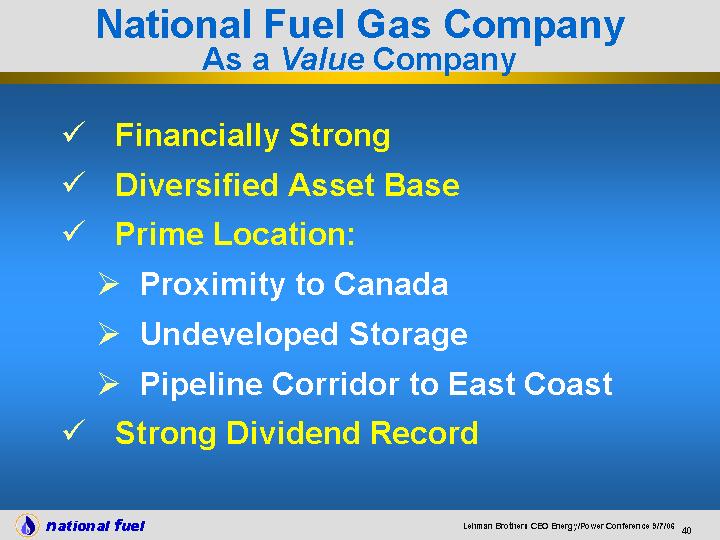
| National Fuel Gas Company As a Value Company Financially Strong Diversified Asset Base Prime Location: Proximity to Canada Undeveloped Storage Pipeline Corridor to East Coast Strong Dividend Record |

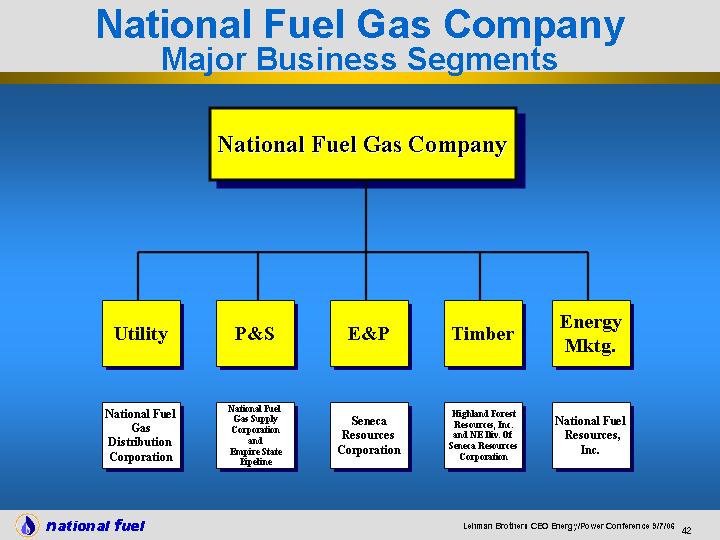
| National Fuel Gas Company Energy Mktg. Timber E&P P&S Utility National Fuel Gas Distribution Corporation National Fuel Gas Supply Corporation and Empire State Pipeline Seneca Resources Corporation Highland Forest Resources, Inc. and NE Div. Of Seneca Resources Corporation National Fuel Resources, Inc. National Fuel Gas Company Major Business Segments |
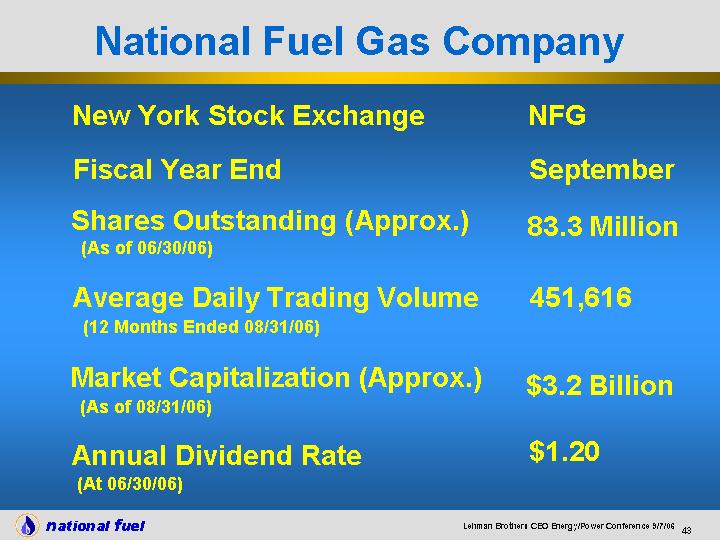
| National Fuel Gas Company New York Stock Exchange NFG Shares Outstanding (Approx.) (As of 06/30/06) 83.3 Million Average Daily Trading Volume (12 Months Ended 08/31/06) 451,616 Market Capitalization (Approx.) (As of 08/31/06) $3.2 Billion $1.20 Annual Dividend Rate (At 06/30/06) September Fiscal Year End |
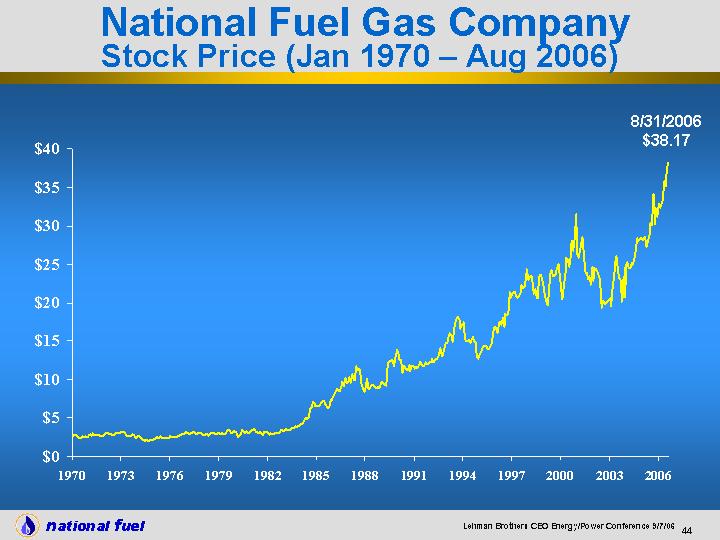
| 1/1/1970 2/1/1970 3/1/1970 4/1/1970 5/1/1970 6/1/1970 7/1/1970 8/1/1970 9/1/1970 10/1/1970 11/1/1970 12/1/1970 1/1/1971 2/1/1971 3/1/1971 4/1/1971 5/1/1971 6/1/1971 7/1/1971 8/1/1971 9/1/1971 10/1/1971 11/1/1971 12/1/1971 1/1/1972 2/1/1972 3/1/1972 4/1/1972 5/1/1972 6/1/1972 7/1/1972 8/1/1972 9/1/1972 10/1/1972 11/1/1972 12/1/1972 1/1/1973 2/1/1973 3/1/1973 4/1/1973 5/1/1973 6/1/1973 7/1/1973 8/1/1973 9/1/1973 10/1/1973 11/1/1973 12/1/1973 1/1/1974 2/1/1974 3/1/1974 4/1/1974 5/1/1974 6/1/1974 7/1/1974 8/1/1974 9/1/1974 10/1/1974 11/1/1974 12/1/1974 1/1/1975 2/1/1975 3/1/1975 4/1/1975 5/1/1975 6/1/1975 7/1/1975 8/1/1975 9/1/1975 10/1/1975 11/1/1975 12/1/1975 1/1/1976 2/1/1976 3/1/1976 4/1/1976 5/1/1976 6/1/1976 7/1/1976 8/1/1976 9/1/1976 10/1/1976 11/1/1976 12/1/1976 1/1/1977 2/1/1977 3/1/1977 4/1/1977 5/1/1977 6/1/1977 7/1/1977 8/1/1977 9/1/1977 10/1/1977 11/1/1977 12/1/1977 1/1/1978 2/1/1978 3/1/1978 2.727279545 2.798297727 2.840918182 2.698881818 2.514225 2.372140909 2.428984091 2.642038636 2.5284 2.500002273 2.599418182 2.5284 2.784075 2.911936364 2.684659091 2.982954545 2.840918182 2.784075 2.7699 2.840918182 2.713056818 2.755677273 2.741454545 2.840918182 3.03975 3.03975 2.982954545 2.897713636 2.883538636 2.840918182 2.798297727 2.869315909 2.982954545 3.025575 3.153388636 3.139213636 3.181834091 3.210231818 3.139213636 2.897713636 2.713056818 2.727279545 2.613640909 2.627863636 2.883538636 2.7699 2.500002273 2.400586364 2.670436364 2.698881818 2.514225 2.386363636 2.159086364 1.974429545 2.173309091 1.974429545 2.045447727 2.144863636 2.088068182 2.088068182 2.343743182 2.301122727 2.457381818 2.357965909 2.500002273 2.556797727 2.428984091 2.400586364 2.357965909 2.400586364 2.414761 364 2.428984091 2.713056818 2.500002273 2.500002273 2.5284 2.514225 2.5284 2.741454545 2.826695455 2.840918182 2.869315909 2.869315909 3.181834091 3.238629545 3.011352273 2.954556818 3.053972727 3.025575 3.238629545 3.110815909 2.897713636 2.997177273 3.025575 2.997177273 3.03975 2.840918182 2.840918182 2.883538636 National Fuel Gas Company Stock Price (Jan 1970 - Aug 2006) 8/31/2006 $38.17 |

| Standard & Poor's Moody's Fitch, Inc. Long-Term Debt BBB+ Baa1 A- Outlook Stable Stable Stable Commercial Paper A-2 P-2 F2 NFG Debt Ratings |
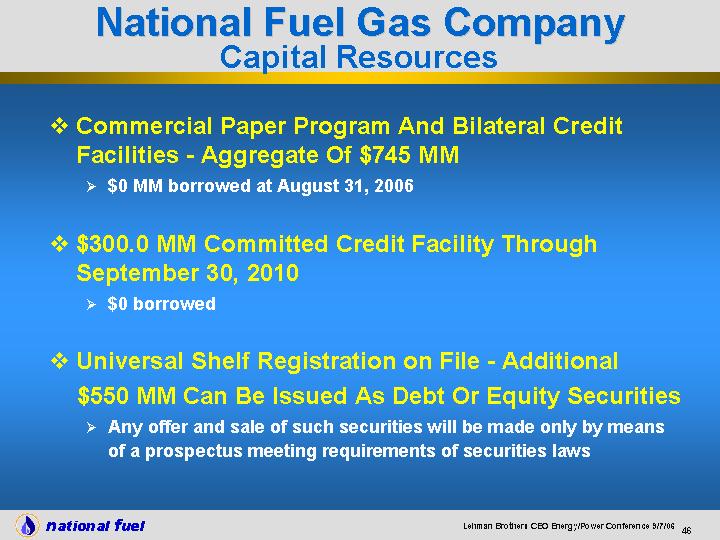
| Commercial Paper Program And Bilateral Credit Facilities - Aggregate Of $745 MM $0 MM borrowed at August 31, 2006 $300.0 MM Committed Credit Facility Through September 30, 2010 $0 borrowed Universal Shelf Registration on File - Additional $550 MM Can Be Issued As Debt Or Equity Securities Any offer and sale of such securities will be made only by means of a prospectus meeting requirements of securities laws National Fuel Gas Company Capital Resources |
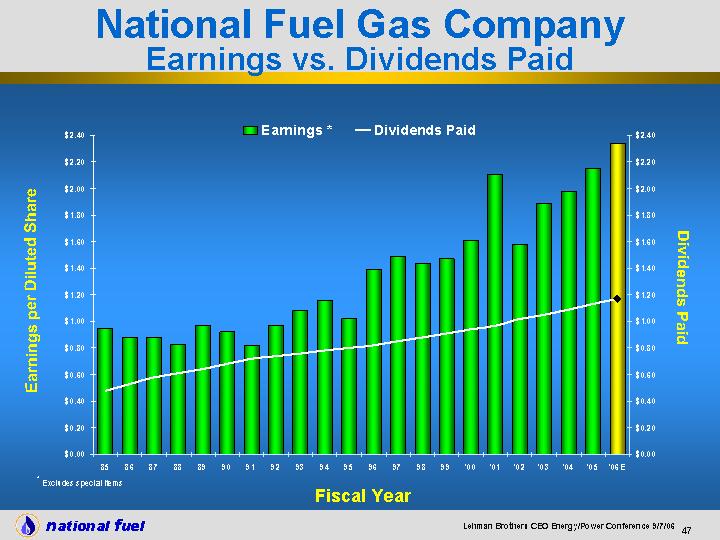
| Earnings * Dividends Paid 85 0.95 0.48 86 0.88 0.53 87 0.88 0.58 88 0.83 0.61 89 0.97 0.64 90 0.92 0.68 91 0.82 0.72 92 0.97 0.74 93 1.08 0.76 94 1.16 0.78 95 1.02 0.8 96 1.39 0.82 97 1.49 0.85 98 1.44 0.88 99 1.47 0.91 '00 1.61 0.94 '01 2.11 0.97 '02 1.58 1.02 '03 1.89 1.05 '04 1.98 1.09 '05 2.15 1.13 '06E 2.34 1.17 * Excludes special items Dividends Paid Fiscal Year National Fuel Gas Company Earnings vs. Dividends Paid Earnings per Diluted Share |
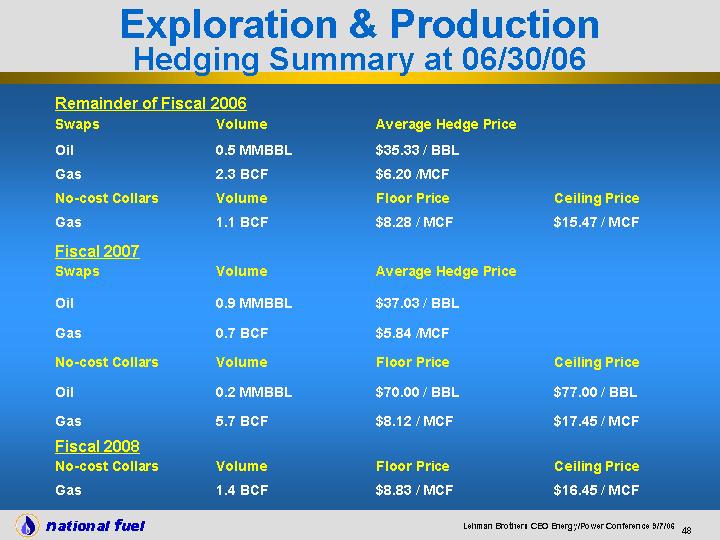
| Exploration & Production Hedging Summary at 06/30/06 $15.47 / MCF $8.28 / MCF 1.1 BCF Gas Ceiling Price Floor Price Volume No-cost Collars $6.20 /MCF 2.3 BCF Gas $35.33 / BBL 0.5 MMBBL Oil Average Hedge Price Volume Swaps Remainder of Fiscal 2006 $77.00 / BBL $70.00 / BBL 0.2 MMBBL Oil $17.45 / MCF $8.12 / MCF 5.7 BCF Gas Ceiling Price Floor Price Volume No-cost Collars $5.84 /MCF 0.7 BCF Gas $37.03 / BBL 0.9 MMBBL Oil Average Hedge Price Volume Swaps Fiscal 2007 $16.45 / MCF $8.83 / MCF 1.4 BCF Gas Ceiling Price Floor Price Volume No-cost Collars Fiscal 2008 |
| Comparable GAAP Financial Measure Slides And Reconciliations |
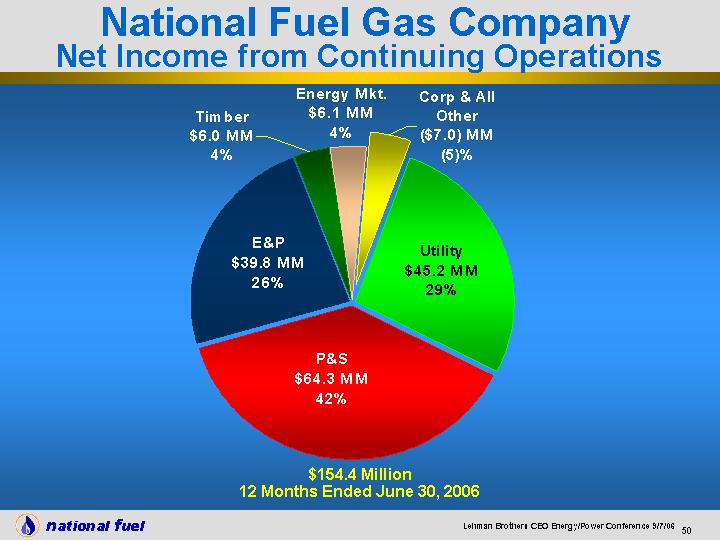
| $154.4 Million 12 Months Ended June 30, 2006 Utility P&S E&P Timber Energy Mkt. Corp. & Other NI 45.2 64.3 39.8 6 6.1 -7 National Fuel Gas Company Net Income from Continuing Operations |
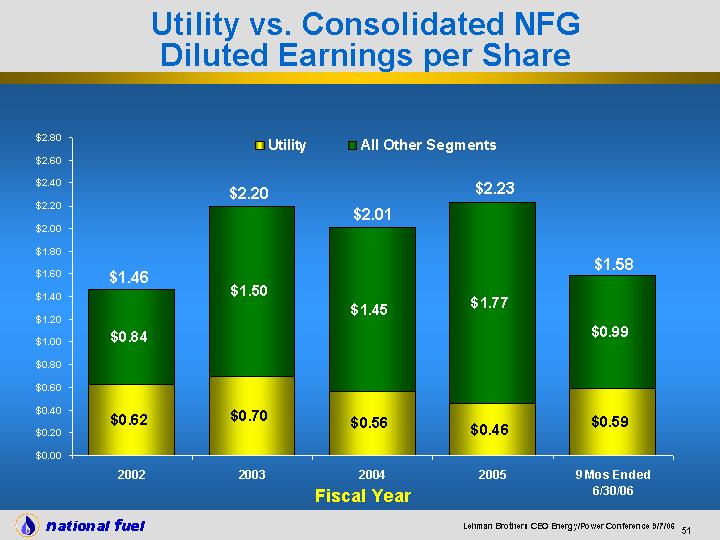
| Fiscal Year Utility vs. Consolidated NFG Diluted Earnings per Share 2002 2003 2004 2005 9 Mos Ended 6/30/06 Utility 0.62 0.7 0.56 0.46 0.59 All Other Segments 0.84 1.5 1.45 1.77 0.99 $1.46 $2.20 $2.01 $2.23 $1.58 |

| 2002 2003 2004 2005 9 Mos Ended 6/30/06 Pipeline & Storage 0.37 0.56 0.58 0.71 0.53 All Other Segments 1.09 1.64 1.43 1.52 1.05 $1.46 $2.20 $2.01 $2.23 Fiscal Year Pipeline & Storage vs. Consolidated NFG Diluted Earnings per Share $1.58 |
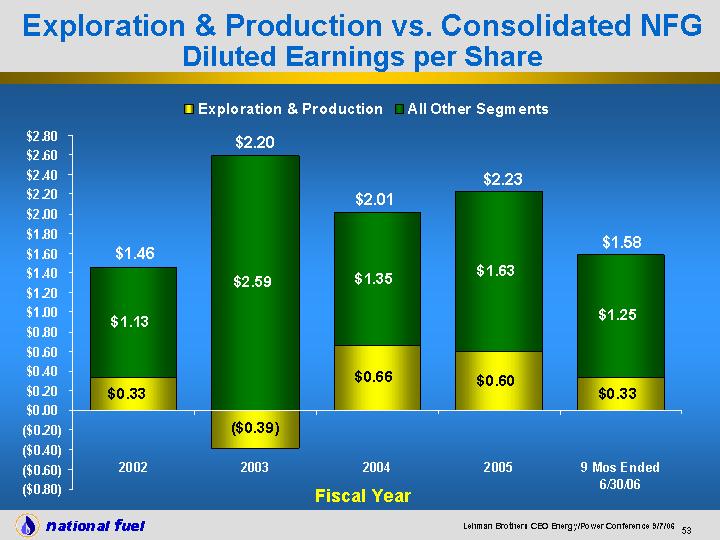
| 2002 2003 2004 2005 9 Mos Ended 6/30/06 Exploration & Production 0.33 -0.39 0.66 0.6 0.33 All Other Segments 1.13 2.59 1.35 1.63 1.25 $1.46 $2.20 $2.01 $2.23 Fiscal Year Exploration & Production vs. Consolidated NFG Diluted Earnings per Share $1.58 |
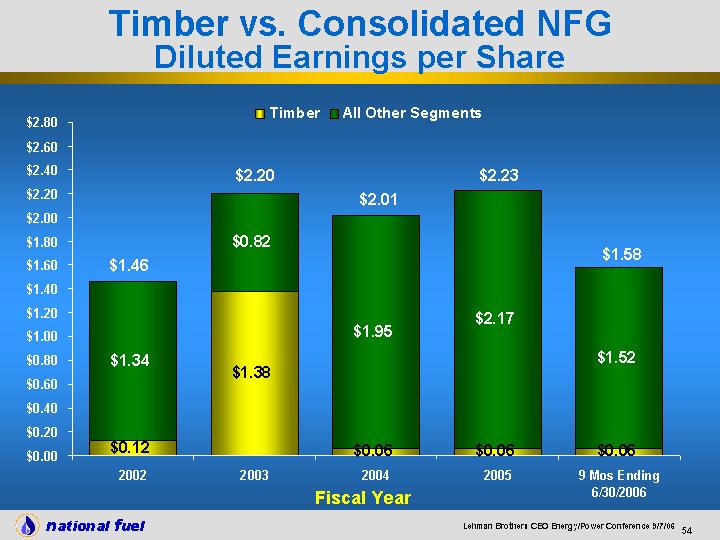
| Fiscal Year Timber vs. Consolidated NFG Diluted Earnings per Share 2002 2003 2004 2005 9 Mos Ending 6/30/2006 Timber 0.12 1.38 0.06 0.06 0.06 All Other Segments 1.34 0.82 1.95 2.17 1.52 $1.46 $2.20 $2.01 $2.23 $1.58 |
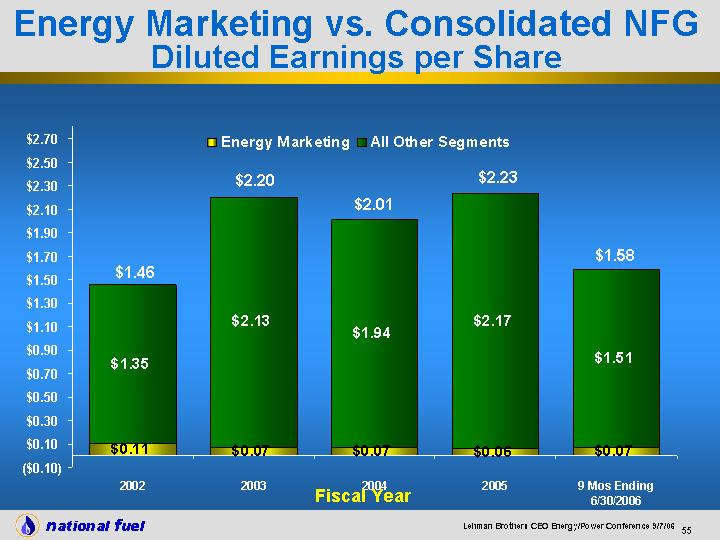
| 2002 2003 2004 2005 9 Mos Ending 6/30/2006 Energy Marketing 0.11 0.07 0.07 0.06 0.07 All Other Segments 1.35 2.13 1.94 2.17 1.51 Fiscal Year $1.46 $2.20 $2.01 $2.23 $1.58 Energy Marketing vs. Consolidated NFG Diluted Earnings per Share |
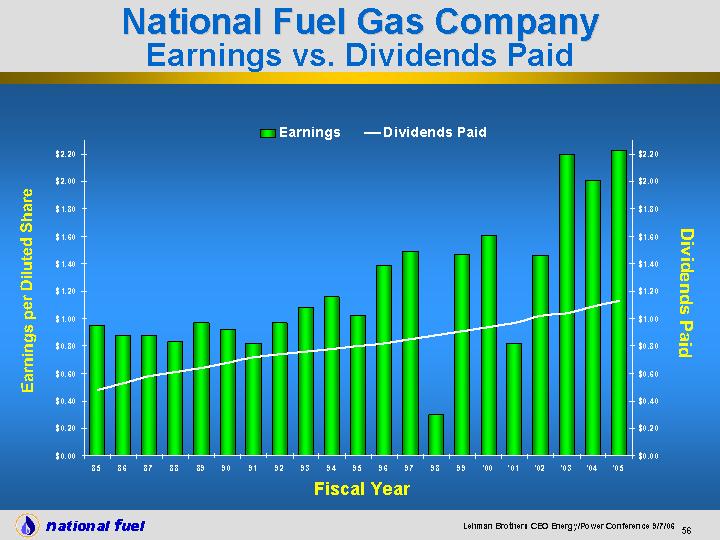
| Earnings Dividends Paid 85 0.95 0.48 86 0.88 0.53 87 0.88 0.58 88 0.83 0.61 89 0.97 0.64 90 0.92 0.68 91 0.82 0.72 92 0.97 0.74 93 1.08 0.76 94 1.16 0.78 95 1.02 0.8 96 1.39 0.82 97 1.49 0.85 98 0.3 0.88 99 1.47 0.91 '00 1.61 0.94 '01 0.82 0.97 '02 1.46 1.02 '03 2.2 1.04 '04 2.01 1.09 '05 2.23 1.13 National Fuel Gas Company Earnings vs. Dividends Paid Fiscal Year Dividends Paid Earnings per Diluted Share |
Reconciliation of National Fuel Gas Expenditures for Long-lived Assets to
Consolidated Net Cash Used in Investing Activities
(‘000)
| | | | | | | | | | | | | | | | | | | | | |
| | | 2002 | | | 2003 | | | 2004 | | | 2005 | | | 2006E | |
| | | |
| |
| Capital Expenditures | | $ | (232,368 | ) | | $ | (152,251 | ) | | $ | (172,341 | ) | | $ | (219,530 | ) | | $ | (302,500 | ) |
| Investment in Subsidiaries, Net of Cash | | $ | — | | | | (228,814 | ) | | $ | — | | | $ | — | | | $ | — | |
| Investment in Partnerships | | $ | (536 | ) | | $ | (375 | ) | | $ | — | | | $ | — | | | $ | — | |
| | | | | | | | | | | | | | | | |
| Expenditures for Long Lived Assets | | $ | (232,904 | ) | | $ | (381,440 | ) | | $ | (172,341 | ) | | $ | (219,530 | ) | | $ | (302,500 | ) |
| Expenditures for Long Lived Assets | | $ | (232,904 | ) | | $ | (381,440 | ) | | $ | (172,341 | ) | | $ | (219,530 | ) | | $ | (302,500 | ) |
| Net Proceeds from Sale of Foreign Subsidiary | | $ | — | | | $ | — | | | $ | — | | | $ | 111,619 | | | $ | — | |
| Net Proceeds from Sale of Timber Properties | | $ | — | | | $ | 186,014 | | | $ | — | | | $ | — | | | $ | — | |
| Net Proceeds from Sale of Oil and Gas Producing Properties | | $ | 22,068 | | | $ | 78,531 | | | $ | 7,162 | | | $ | 1,349 | | | $ | 4 | |
| Other | | $ | 5,012 | | | $ | 12,065 | | | $ | 1,974 | | | $ | 3,238 | | | $ | (1,578 | ) |
| | | | | | | | | | | | | | | | |
| Net Cash Used in Investing Activities | | $ | (205,824 | ) | | $ | (104,830 | ) | | $ | (163,205 | ) | | $ | (103,324 | ) | | $ | (304,074 | ) |
| | | |
Reconciliation of Segment Net Plant to
Consolidated Property, Plant and Equipment
(‘000)
| | | | | |
| | | At 6/30/2006 | |
| |
| Utility | | $ | 1,075,932 | |
| Pipeline & Storage | | | 682,235 | |
| Exporation & Production | | | 1,009,746 | |
| Energy Marketing | | | 56 | |
| Timber | | | 91,201 | |
| Corporate & Other | | | 25,930 | |
| | | | |
| Consolidated Property, Plant and Equipment | | $ | 2,885,100 | |
| | | | |
57
Reconciliation of Segment Net Income from Continuing Operations to
Consolidated Net Income from Continuing Operations
(‘000)
| | | | | |
| | | 12 Mos | |
| | | Ended | |
| | | 6/30/06 | |
| |
| Utility | | $ | 45,161 | |
| Pipeline & Storage | | | 64,262 | |
| |
| Exploration & Production | | | 79,330 | |
| Plus: Impairment of O&G Prod. Prop. | | | (39,502 | ) |
| | | | |
| Total Exploration & Production | | | 39,828 | |
| |
| Energy Marketing | | | 6,077 | |
| Timber | | | 6,065 | |
| Corporate & Other | | | (6,958 | ) |
| | | | |
| |
| Consolidated Net Income from Continuing Operations | | $ | 154,435 | |
| | | | |
Reconciliation of Utility Segment Diluted Earnings per Share to
Consolidated Reported Earnings per Share
($000s)
| | | | | | | | | | | | | | | | | | | | | |
| | | | | | | | | | | | | | | | | | | 9 Mos Ended | |
| | | 2002 | | | 2003 | | | 2004 | | | 2005 | | | 6/30/2006 | |
| | | |
| |
| Utility Segment | | $ | 0.62 | | | $ | 0.70 | | | $ | 0.59 | | | $ | 0.46 | | | $ | 0.59 | |
| Plus: | | | | | | | | | | | | | | | | | | | | |
| Pension Settlement Loss | | | | | | | | | | $ | (0.03 | ) | | | | | | | | |
| | | |
| Utility Segment Reported Earnings | | $ | 0.62 | | | $ | 0.70 | | | $ | 0.56 | | | $ | 0.46 | | | $ | 0.59 | |
| All Other Segments | | | 0.84 | | | | 1.50 | | | | 1.45 | | | | 1.77 | | | | 0.99 | |
| | | | | | | | | | | | | | | | |
| Total Corporation | | $ | 1.46 | | | $ | 2.20 | | | $ | 2.01 | | | $ | 2.23 | | | $ | 1.58 | |
| | | |
58
| | | | | | | | | | | | | | | | | | | | | | | | | | | | | | | | | |
Reconciliation of Utility Segment Capital Expenditures to
Consolidated Capital Expenditures | | | | | | | | | | | | | | | | | | | | | | | | | | | | | | | | |
($000s) | | | | | | | | | | | | | | | | | | | | | | | | | | | | | | | | |
| | | | 1990 | | | | 1991 | | | | 1992 | | | | 1993 | | | | 1994 | | | | 1995 | | | | 1996 | | | | 1997 | |
| | | |
| | | | | | | | | | | | | | | | | | | | | | | | | | | | | | | | | |
| Utility Segment | | $ | 66,110 | | | $ | 64,937 | | | $ | 65,650 | | | $ | 61,803 | | | $ | 61,715 | | | $ | 64,844 | | | $ | 63,730 | | | $ | 66,908 | |
| All Other | | | 95,391 | | | | 91,242 | | | | 92,206 | | | | 70,123 | | | | 73,369 | | | | 117,982 | | | | 107,837 | | | | 147,093 | |
| | | | | | | | | | | | | | | | | | | | | | | | | |
| Total Corporation | | $ | 161,501 | | | $ | 156,179 | | | $ | 157,856 | | | $ | 131,926 | | | $ | 135,084 | | | $ | 182,826 | | | $ | 171,567 | | | $ | 214,001 | |
| | | |
| | | | | | | | | | | | | | | | | | | | | | | | | | | | | | | | | |
| | | | 1998 | | | | 1999 | | | | 2000 | | | | 2001 | | | | 2002 | | | | 2003 | | | | 2004 | | | | 2005 | |
| | | |
| | | | | | | | | | | | | | | | | | | | | | | | | | | | | | | | | |
| Utility Segment | | $ | 50,680 | | | $ | 46,974 | | | $ | 55,799 | | | $ | 42,374 | | | $ | 51,550 | | | $ | 49,944 | | | $ | 55,449 | | | $ | 50,071 | |
| All Other | | | 339,438 | | | | 209,146 | | | | 213,572 | | | | 250,332 | | | | 180,818 | | | | 102,307 | | | | 116,892 | | | | 169,459 | |
| | | | | | | | | | | | | | | | | | | | | | | | | |
| Total Corporation | | $ | 390,118 | | | $ | 256,120 | | | $ | 269,371 | | | $ | 292,706 | | | $ | 232,368 | | | $ | 152,251 | | | $ | 172,341 | | | $ | 219,530 | |
| | | |
| | | | | | | | | | | | | | | | | | | | | | | | | | | | | | | | | |
Reconciliation of Utility Depreciation Expense to
Consolidated Depreciation Expense |
($000s) |
| | | | 1990 | | | | 1991 | | | | 1992 | | | | 1993 | | | | 1994 | | | | 1995 | | | | 1996 | | | | 1997 | |
| | | |
| | | | | | | | | | | | | | | | | | | | | | | | | | | | | | | | | |
| Utility Segment | | $ | 20,802 | | | $ | 22,877 | | | $ | 25,001 | | | $ | 27,137 | | | $ | 28,216 | | | $ | 30,052 | | | $ | 31,491 | | | $ | 32,971 | |
| All Other | | | 22,938 | | | | 27,928 | | | | 30,725 | | | | 42,288 | | | | 46,548 | | | | 41,730 | | | | 66,740 | | | | 78,679 | |
| | | | | | | | | | | | | | | | | | | | | | | | | |
| Total Corporation | | $ | 43,740 | | | $ | 50,805 | | | $ | 55,726 | | | $ | 69,425 | | | $ | 74,764 | | | $ | 71,782 | | | $ | 98,231 | | | $ | 111,650 | |
| | | |
| | | | | | | | | | | | | | | | | | | | | | | | | | | | | | | | | |
| | | | 1998 | | | | 1999 | | | | 2000 | | | | 2001 | | | | 2002 | | | | 2003 | | | | 2004 | | | | 2005 | |
| | | |
| Utility Segment | | $ | 33,459 | | | $ | 34,215 | | | $ | 35,842 | | | $ | 36,607 | | | $ | 37,412 | | | $ | 38,186 | | | $ | 39,101 | | | $ | 40,159 | |
| All Other | | | 83,779 | | | | 90,563 | | | | 106,328 | | | | 126,632 | | | | 131,333 | | | | 143,143 | | | | 135,188 | | | | 139,608 | |
| | | | | | | | | | | | | | | | | | | | | | | | | |
| Total Corporation | | $ | 117,238 | | | $ | 124,778 | | | $ | 142,170 | | | $ | 163,239 | | | $ | 168,745 | | | $ | 181,329 | | | $ | 174,289 | | | $ | 179,767 | |
| | | |
| | | | | | | | | | | | | | | | | | | | | | | | | | | | | | | | | |
Reconciliation of Utility Segment Aged Accounts Receivable to
Consolidated Accounts Receivable — Net | | | | | | | | | | | | | | | | | | | | | | | | | | | | | | | | |
Millions |
| | | at 6/30/03 | | at 6/30/04 | | at 6/30/05 | | at 6/30/06 | | | | | | | | | | | | | | | | |
| | | | | | | | | | | | | | | | | | | |
| | | | | | | | | | | | | | | | | | | | | | | | | | | | | | | | | |
| Utility Aged Accounts Receivable | | $ | 70.37 | | | $ | 85.14 | | | $ | 93.12 | | | $ | 98.83 | | | | | | | | | | | | | | | | | |
| Utility Current/Other Accounts Receivable | | $ | 101.31 | | | $ | 76.76 | | | $ | 81.64 | | | $ | 92.38 | | | | | | | | | | | | | | | | | |
| Utility Gross Accounts Receivable | | $ | 171.68 | | | $ | 161.90 | | | $ | 174.76 | | | $ | 191.21 | | | | | | | | | | | | | | | | | |
| Utility Reserve for Bad Debt | | $ | (17.17 | ) | | $ | (15.16 | ) | | $ | (18.13 | ) | | $ | (32.21 | ) | | | | | | | | | | | | | | | | |
| | | | | | | | | | | | | | | | | | | | | | | | | | | | | |
| Utility Net Accounts Receivable | | $ | 154.51 | | | $ | 146.74 | | | $ | 156.63 | | | $ | 159.00 | | | | | | | | | | | | | | | | | |
| | | | | | | | | | | | | | | | | | | |
| All Other Segments Gross Accounts Receivable | | $ | 66.57 | | | $ | 67.60 | | | $ | 66.83 | | | $ | 76.04 | | | | | | | | | | | | | | | | | |
| All Other Segments Reserve for Bad Debts | | $ | (4.28 | ) | | $ | (4.50 | ) | | $ | (2.05 | ) | | $ | (1.89 | ) | | | | | | | | | | | | | | | | |
| | | | | | | | | | | | | | | | | | | | | | | | | | | | | |
| All Other Segments Net Accounts Receivable | | $ | 62.29 | | | $ | 63.10 | | | $ | 64.78 | | | $ | 74.15 | | | | | | | | | | | | | | | | | |
| Total Corporation Accounts Receivable — Net | | $ | 216.80 | | | $ | 209.84 | | | $ | 221.41 | | | $ | 233.15 | | | | | | | | | | | | | | | | | |
| | | | | | | | | | | | | | | | | | | |
59
| | | | | | | | | | | | | | | | | | | | | |
Reconciliation of Pipeline Segment Diluted Earnings per Share to
Consolidated Reported Earnings per Share | | | | | | | | | | | | | | | | | | | | |
($000s) | | | | | | | | | | | | | | | | | | 9 Months |
| | | | | | | | | | | | | | | | | | | Ended |
| | | | 2002 | | | | 2003 | | | | 2004 | | | | 2005 | | | | 6/30/2006 | |
| | | |
| | | | | | | | | | | | | | | | | | | | | |
| Pipeline Segment | | $ | 0.49 | | | $ | 0.56 | | | $ | 0.60 | | | $ | 0.63 | | | $ | 0.53 | |
| Plus: | | | | | | | | | | | | | | | | | | | | |
| Gain Associaged with Insurance Proceeds | | | | | | | | | | | | | | $ | 0.05 | | | | | |
| Impairment of Independence Pipline | | $ | (0.12 | ) | | | | | | | | | | | | | | | | |
| Pension Settlement Loss | | | | | | | | | | $ | (0.02 | ) | | | | | | | | |
| Base Gas Sale | | | | | | | | | | | | | | $ | 0.03 | | | | | |
| | | |
| Pipeline Segment Reported Earnings | | $ | 0.37 | | | $ | 0.56 | | | $ | 0.58 | | | $ | 0.71 | | | $ | 0.53 | |
| All Other Segments | | | 1.09 | | | | 1.64 | | | | 1.43 | | | | 1.52 | | | | 1.05 | |
| | | | | | | | | | | | | | | | |
| Total Corporation | | $ | 1.46 | | | $ | 2.20 | | | $ | 2.01 | | | $ | 2.23 | | | $ | 1.58 | |
| | | |
| | | | | | | | | | | | | | | | | | | | | |
Reconciliation of Pipeline Operating Revenues to
Consolidated Operating Revenues from Continuing Operations | | | | | | | | | | | | | | | | | | | | |
($000s) | | | | | | | | | | | | | | | | | | | | |
| | | Fiscal Year | | | | | | | | | | | | | | | | |
| | | | 2005 | | | | | | | | | | | | | | | | | |
| | | | | | | | | | | | | | | | | | | | |
| | | | | | | | | | | | | | | | | | | | | |
| Pipeline Operating Revenues | | $ | 121,559 | | | | | | | | | | | | | | | | | |
| Storage Operating Revenues | | | 65,587 | | | | | | | | | | | | | | | | | |
| Other Operating Revenues | | | 28,713 | | | | | | | | | | | | | | | | | |
| | | | | | | | | | | | | | | | | | | | |
| Total Pipeline & Storage Operating Revenues | | $ | 215,859 | | | | | | | | | | | | | | | | | |
| All Other Segments Operating Revenues from Continuing Operations | | | 1,707,690 | | | | | | | | | | | | | | | | | |
| | | | | | | | | | | | | | | | | | | | |
| Consolidated Operating Revenues from Continuing Operations | | $ | 1,923,549 | | | | | | | | | | | | | | | | | |
| | | | | | | | | | | | | | | | | | | | |
| | | | | | | | | | | | | | | | | | | | | |
Reconciliation of Exploration & Production Segment Diluted Earnings per Share to
Consolidated Reported Earnings per Share | | | | | | | | | | | | | | | | | | | | |
($000s) |
| | | | | | | | | | | | | | | | | | | 9 Months |
| | | | | | | | | | | | | | | | | | | Ended |
| | | | 2002 | | | | 2003 | | | | 2004 | | | | 2005 | | | | 6/30/2006 | |
| | | |
| | | | | | | | | | | | | | | | | | | | | |
| Exploration & Production Segment | | $ | 0.33 | | | $ | 0.46 | | | $ | 0.61 | | | $ | 0.60 | | | $ | 0.79 | |
| Plus: | | | | | | | | | | | | | | | | | | | | |
| Impairment of O&G Prod. Prop. | | | | | | $ | (0.36 | ) | | | | | | | | | | | (0.46 | ) |
| Loss on Sale of Oil and Gas Assets | | | | | | $ | (0.48 | ) | | | | | | | | | | | | |
| Cumulative Effect of Change in Accounting | | | | | | $ | (0.01 | ) | | | | | | | | | | | | |
| Adjustment on Loss on Sale of Oil and Gas Assets | | | | | | | | | | $ | 0.06 | | | | | | | | | |
| Pension Settlement Loss | | | | | | | | | | $ | (0.01 | ) | | | | | | | | |
| Exploration & Production Reported Earnings | | $ | 0.33 | | | $ | (0.39 | ) | | $ | 0.66 | | | $ | 0.60 | | | $ | 0.33 | |
| All Other Segments | | | 1.13 | | | | 2.59 | | | | 1.35 | | | | 1.63 | | | | 1.25 | |
| | | | | | | | | | | | | | | | |
| Total Corporation | | $ | 1.46 | | | $ | 2.20 | | | $ | 2.01 | | | $ | 2.23 | | | $ | 1.58 | |
| | | |
60
| | | | | |
Reconciliation of Exploration & Production Operating Revenue to
Consolidated Operating Revenue | | | | |
($000s) | | 9 Mos Ended |
| | | | 6/30/2006 | |
| | | | |
| | | | | |
| Exploration & Production | | $ | 257,406 | |
| All Other Segments | | | 1,759,783 | |
| | | | |
| Consolidated Operating Revenue | | $ | 2,017,189 | |
| | | | |
| | | | | |
Reconciliation of Exploration & Production EBITDA to
Consolidated Net Income | | | | |
($000s) | | | | |
| | | 9 Mos Ended |
| | | | 6/30/2006 | |
| | | | |
| | | | | |
| Exploration & Production EBITDA | | $ | 190,724 | |
| | | | | |
| Less: | | | | |
| Impairment of O&G Prod. Prop. | | | 62,371 | |
| Interest Charges — Net | | | 31,509 | |
| Federal & State Income Taxes | | | (1,963 | ) |
| Depreciation, Depletion & Amortization | | | 70,655 | |
| | | | |
| Exploration & Production Net Income | | | 28,152 | |
| All Other Segments Net Income | | | 107,971 | |
| | | | |
| Consolidated Net Income | | $ | 136,123 | |
| | | | |
| | | | | |
Reconciliation of Exploration & Production Net Income to
Consolidated Net Income | | | | |
($000s) | | | | |
| | | 9 Mos Ended |
| | | | 6/30/2006 | |
| | | | |
| | | | | |
| Exploration & Production Net Income | | $ | 67,652 | |
| Impairment of O&G Prod. Prop. | | $ | (39,502 | ) |
| | | | |
| | | $ | 28,150 | |
| All Other Segments Net Income | | | 107,973 | |
| | | | |
| Consolidated Net Income | | $ | 136,123 | |
| | | | |
61
| | | | | |
Reconciliation of Exploration & Production Lease Operating Expense (LOE) to
Consolidated O&M | | | | |
($000s) | | 9 Mos Ended |
| | | | 6/30/2006 | |
| | | | |
| | | | | |
Exploration & Production LOE | | $ | 38,179 | |
Exploration & Production Property, Franchise and
Other Taxes | | | 3,972 | |
| | | | |
| Exploration & Production Total LOE * | | $ | 42,151 | |
| | | | |
| | | | | |
Exploration & Production LOE | | $ | 38,179 | |
| Exploration & Production Other O&M | | | 24,433 | |
| | | | |
| Exploration & Production Total O&M | | $ | 62,612 | |
| All Other Segments O&M | | | 258,209 | |
| | | | |
| Total Consolidated O&M | | $ | 320,821 | |
| | | | |
| | | | | |
Exploration & Production Property, Franchise and
Other Taxes | | $ | 3,972 | |
| All Other Segments Property, Franchise and Other Taxes | | | 50,175 | |
| | | | |
| Total Consolidated Property Franchise and Other Taxes | | $ | 54,147 | |
| | | | |
| | | | | |
Reconciliation of Exploration & Production Depreciation, Depletion and Amortization to Consolidated Depreciation, Depletion and Amortization (DD&A) | | | | |
($000s) | | | | |
| | | 9 Mos Ended |
| | | | 6/30/2006 | |
| | | | |
| | | | | |
| Exploration & Production DD&A * | | $ | 38,179 | |
| All Other Segments DD&A | | | 96,088 | |
| | | | |
| Consolidated DD&A | | $ | 134,267 | |
| | | | |
* DD&A and Total LOE cost per Mcf equivalent equals the 9 months ended 6/30/2006 Exploration & Production DD&A and Total LOE costs, respectively, divided by the Total Gas & Oil Production (Mmcfe) in that same fiscal period.
62
| | | | | | | | | | | | | | | | | | | | | | | | | |
Reconciliation of Exploration & Production General & Administrative Costs to
Consolidated O&M | | | | | | | | | | | | | | | | | | | | | | | | |
($000s) |
| | | 9 Mos Ended | | | | | | | | | | | | | | | | | | | | |
| | | | 6/30/2006 | | | | | | | | | | | | | | | | | | | | | |
| | | | | | | | | | | | | | | | | | | | | | | | |
| | | | | | | | | | | | | | | | | | | | | | | | | |
| Exploration & Production General & Administrative * | | $ | 18,465 | | | | | | | | | | | | | | | | | | | | | |
| Exploration & Production All Other O&M | | | 44,147 | | | | | | | | | | | | | | | | | | | | | |
| | | | | | | | | | | | | | | | | | | | | | | | |
| Exporation & Production Total O&M | | $ | 62,612 | | | | | | | | | | | | | | | | | | | | | |
| All Other Segments O&M | | | 258,209 | | | | | | | | | | | | | | | | | | | | | |
| | | | | | | | | | | | | | | | | | | | | | | | |
| Total Consolidated O&M | | $ | 320,821 | | | | | | | | | | | | | | | | | | | | | |
| | | | | | | | | | | | | | | | | | | | | | | | |
| |
| * General and Administrative cost per Mcf equivalent equals the 9 months ended 6/30/2006 Exploration & Production General and Administrative cost divided by the Total Gas & Oil Production (Mmcfe) in that same fiscal period. | | | | | | | | | | | | | | | | | | | | |
| | | | | | | | | | | | | | | | | | | | | | | | | |
Reconciliation of Exploration & Production Segment Capital Expenditures to
Consolidated Capital Expenditures | | | | | | | | | | | | | | | | | | | | | | | | |
($000s) | | | | | | | | | | | | | | | | | | | | | | | | |
| | | | 2002 | | | | 2003 | | | | 2004 | | | | 2005 | | | | 2006E | | | 2007E |
| | | |
| | | | | | | | | | | | | | | | | | | | | | | | | |
| Exploration & Production Capital Expenditures | | | 114,602 | | | $ | 75,837 | | | $ | 77,654 | | | $ | 121,200 | | | $ | 207,000 | | | $ | 210,000 - $214,000 | |
| Other | | | — | | | $ | — | | | $ | — | | | $ | 1,250 | | | $ | — | | | $ | — | |
| | | |
| | | | | | | | | | | | | | | | | | | | | | | | | |
| Total Exploration & Production Capital Expenditures | | | 114,602 | | | $ | 75,837 | | | $ | 77,654 | | | $ | 122,450 | | | $ | 207,000 | | | $ | 210,000 - $214,000 | |
| All Other | | | 117,766 | | | | 76,414 | | | | 94,687 | | | | 97,080 | | | | 95,500 | | | $ | 127,000 | |
| | | |
| Total Corporation | | | 232,368 | | | $ | 152,251 | | | $ | 172,341 | | | $ | 219,530 | | | $ | 302,500 | | | $ | 337,000 - $341,000 | |
| | | |
| | | | | | | | | | | | | | | | | | | | | | | | | |
Reconciliation of Timber Segment Diluted Earnings Per Share to
Consolidated Diluted Earnings Per Share | | | | | | | | | | | | | | | | | | | | | | | | |
| | | | | | | | | | | | | | | | | | | 9 Mos Ending | | | | |
| | | | 2002 | | | | 2003 | | | | 2004 | | | | 2005 | | | | 6/30/06 | | | | | |
| | | | | | | |
| | | | | | | | | | | | | | | | | | | | | | | | | |
| Timber Segment | | $ | 0.12 | | | $ | 0.12 | | | $ | 0.07 | | | $ | 0.06 | | | $ | 0.06 | | | | | |
| Nonrecurring Items | | $ | — | | | $ | 1.26 | | | $ | (0.01 | ) | | $ | — | | | | | | | | | |
| Timber Segment Reported Earnings | | $ | 0.12 | | | $ | 1.38 | | | $ | 0.06 | | | $ | 0.06 | | | | | | | | | |
| All Other Segments | | | 1.34 | | | | 0.82 | | | | 1.95 | | | | 2.17 | | | | 1.52 | | | | | |
| | | | | | | |
| Total Corporation | | $ | 1.46 | | | $ | 2.20 | | | $ | 2.01 | | | $ | 2.23 | | | $ | 1.58 | | | | | |
| | | | | | | |
| | | | | | | | | | | | | | | | | | | | | | | | | |
Reconciliation of Energy Marketing Segment Diluted Earnings Per Share to
Consolidated Diluted Earnings Per Share | | | | | | | | | | | | | | | | | | | | | | | | |
| | | | | | | | | | | | | | | | | | | 9 Mos Ending | | | | |
| | | | 2002 | | | | 2003 | | | | 2004 | | | | 2005 | | | | 6/30/06 | | | | | |
| | | | | | | |
| | | | | | | | | | | | | | | | | | | | | | | | | |
| Energy Marketing Segment | | $ | 0.11 | | | $ | 0.07 | | | $ | 0.07 | | | $ | 0.06 | | | $ | 0.07 | | | | | |
| All Other Segments | | | 1.35 | | | | 2.13 | | | | 1.94 | | | | 2.17 | | | | 1.51 | | | | | |
| | | | | | | |
| Total Corporation | | $ | 1.46 | | | $ | 2.20 | | | $ | 2.01 | | | $ | 2.23 | | | $ | 1.58 | | | | | |
| | | | | | | |
63
NATIONAL FUEL GAS COMPANY
AND SUBSIDIARIES
RECONCILIATION TO REPORTED EARNINGS
| | | | | | | | | | | | | | | | | | | | | |
| | | Fiscal Year | | | Fiscal Year | | | Fiscal Year | | | Fiscal Year | | | Fiscal Year | |
| | | Ended | | | Ended | | | Ended | | | Ended | | | Ended | |
| (Diluted Earnings Per Share) | | September 30, 2001 | | | September 30, 2002 | | | September 30, 2003 | | | September 30, 2004 | | | September 30, 2005 | |
Utility | | | | | | | | | | | | | | | | | | | | |
| Reported earnings | | $ | 0.76 | | | $ | 0.62 | | | $ | 0.70 | | | $ | 0.56 | | | $ | 0.46 | |
| Pension settlement loss | | | — | | | | — | | | | — | | | | 0.03 | | | | — | |
| | | | | | | | | | | | | | | | |
| Earnings before non-recurring items | | | 0.76 | | | | 0.62 | | | | 0.70 | | | | 0.59 | | | | 0.46 | |
| | | | | | | | | | | | | | | | |
| | | | | | | | | | | | | | | | | | | | | |
Pipeline and Storage | | | | | | | | | | | | | | | | | | | | |
| Reported earnings | | | 0.50 | | | | 0.37 | | | | 0.56 | | | | 0.58 | | | | 0.71 | |
| Impairment of Independence Pipeline | | | — | | | | 0.12 | | | | — | | | | — | | | | — | |
| Pension settlement loss | | | — | | | | — | | | | — | | | | 0.02 | | | | — | |
| Gain associated with insurance proceeds | | | — | | | | — | | | | — | | | | — | | | | (0.05 | ) |
| Base gas sale | | | | | | | | | | | | | | | | | | | (0.03 | ) |
| | | | | | | | | | | | | | | | |
| Earnings before non-recurring items | | | 0.50 | | | | 0.49 | | | | 0.56 | | | | 0.60 | | | | 0.63 | |
| | | | | | | | | | | | | | | | |
| | | | | | | | | | | | | | | | | | | | | |
Exploration and Production | | | | | | | | | | | | | | | | | | | | |
| Reported earnings | | | (0.40 | ) | | | 0.33 | | | | (0.39 | ) | | | 0.66 | | | | 0.60 | |
| Loss on sale of oil and gas assets | | | — | | | | — | | | | 0.48 | | | | — | | | | — | |
| Impairment of oil and gas producing properties | | | 1.29 | | | | — | | | | 0.36 | | | | — | | | | — | |
| Cumulative Effect of Change in Accounting | | | — | | | | — | | | | 0.01 | | | | — | | | | — | |
| Adjustment of loss on sale of oil and gas assets | | | — | | | | — | | | | — | | | | (0.06 | ) | | | — | |
| Pension settlement loss | | | — | | | | — | | | | — | | | | 0.01 | | | | — | |
| | | | | | | | | | | | | | | | |
| Earnings before non-recurring items | | | 0.89 | | | | 0.33 | | | | 0.46 | | | | 0.61 | | | | 0.60 | |
| | | | | | | | | | | | | | | | |
| | | | | | | | | | | | | | | | | | | | | |
International | | | | | | | | | | | | | | | | | | | | |
| Reported earnings | | | (0.04 | ) | | | (0.06 | ) | | | (0.12 | ) | | | 0.07 | | | | | |
| Cumulative Effect of Change in Accounting | | | — | | | | — | | | | 0.10 | | | | — | | | see |
| Pension settlement loss | | | — | | | | — | | | | — | | | | — | | | "Discontinued |
| Tax rate change | | | — | | | | — | | | | — | | | | (0.06 | ) | | Operations" |
| Repatriation tax | | | | | | | | | | | | | | | | | | below |
| | | | | | | | | | | | | | | | | |
| Earnings before non-recurring items | | | (0.04 | ) | | | (0.06 | ) | | | (0.02 | ) | | | 0.01 | | | | | |
| | | | | | | | | | | | | | | | | |
| | | | | | | | | | | | | | | | | | | | | |
Energy Marketing | | | | | | | | | | | | | | | | | | | | |
| Reported earnings | | | (0.04 | ) | | | 0.11 | | | | 0.07 | | | | 0.07 | | | | 0.06 | |
| Pension settlement loss | | | — | | | | — | | | | — | | | | — | | | | — | |
| | | | | | | | | | | | | | | | |
| Earnings before non-recurring items | | | (0.04 | ) | | | 0.11 | | | | 0.07 | | | | 0.07 | | | | 0.06 | |
| | | | | | | | | | | | | | | | |
| | | | | | | | | | | | | | | | | | | | | |
Timber | | | | | | | | | | | | | | | | | | | | |
| Reported earnings | | | 0.10 | | | | 0.12 | | | | 1.38 | | | | 0.06 | | | | 0.06 | |
| Gain on sale of timber assets | | | — | | | | — | | | | (1.26 | ) | | | — | | | | — | |
| Pension settlement loss | | | — | | | | — | | | | — | | | | — | | | | — | |
| Adjustment of gain on sale of timber properties | | | — | | | | — | | | | — | | | | 0.01 | | | | — | |
| | | | | | | | | | | | | | | | |
| Earnings before non-recurring items | | | 0.10 | | | | 0.12 | | | | 0.12 | | | | 0.07 | | | | 0.06 | |
| | | | | | | | | | | | | | | | |
| | | | | | | | | | | | | | | | | | | | | |
Corporate and All Other | | | | | | | | | | | | | | | | | | | | |
| Reported earnings | | | (0.06 | ) | | | (0.03 | ) | | | — | | | | 0.01 | | | | (0.08 | ) |
| Pension settlement loss | | | — | | | | — | | | | — | | | | 0.02 | | | | — | |
| | | | | | | | | | | | | | | | |
| Earnings before non-recurring items | | | (0.06 | ) | | | (0.03 | ) | | | — | | | | 0.03 | | | | (0.08 | ) |
| | | | | | | | | | | | | | | | |
| | | | | | | | | | | | | | | | | | | | | |
Consolidated | | | | | | | | | | | | | | | | | | | | |
| Reported earnings | | | 0.82 | | | | 1.46 | | | | 2.20 | | | | 2.01 | | | | | |
| Total non-recurring items from above | | | 1.29 | | | | 0.12 | | | | (0.31 | ) | | | (0.03 | ) | | | | |
| | | | | | | | | | | | | | | | | |
| Earnings before non-recurring items | | $ | 2.11 | | | $ | 1.58 | | | $ | 1.89 | | | $ | 1.98 | | | | | |
| | | | | | | | | | | | | | | | | |
| | | | | | | | | | | | | | | | | | | | | |
Consolidated Earnings from Continuing Operations | | | | | | | | | | | | | | | | | | | | |
| Reported earnings from continuing operations | | | | | | | | | | | | | | | | | | | 1.81 | |
| Total non-recurring items from above | | | | | | | | | | | | | | | | | | | (0.08 | ) |
| | | | | | | | | | | | | | | | | | | | |
| Earnings from continuing operations before non-recurring items | | | | | | | | | | | | | | | | | | $ | 1.73 | |
| | | | | | | | | | | | | | | | | | | | |
| | | | | | | | | | | | | | | | | | | | | |
Discontinued Operations | | | | | | | | | | | | | | | | | | | | |
| Reported earnings from discontinued operations | | | | | | | | | | | | | | | | | | | 0.42 | |
| | | | | | | | | | | | | | | | | | | | |
| | | | | | | | | | | | | | | | | | | | | |
Consolidated | | | | | | | | | | | | | | | | | | | | |
| Reported earnings | | | | | | | | | | | | | | | | | | $ | 2.23 | |
| | | | | | | | | | | | | | | | | | | | |
64