Exhibit 99
| National Fuel Gas Company David F. Smith President & Chief Executive Officer Ronald J. Tanski Treasurer & Principal Financial Officer Matthew D. Cabell, President Seneca Resources Corporation |

| This presentation may contain "forward-looking statements" as defined by the Private Securities Litigation Reform Act of 1995, including statements regarding future prospects, plans, performance and capital structure, anticipated capital expenditures and completion of construction projects, as well as statements that are identified by the use of the words "anticipates," "estimates," "expects," "forecasts," "intends," "plans," "predicts," "projects," "believes," "seeks," "will," "may," and similar expressions. Forward-looking statements involve risks and uncertainties, which could cause actual results or outcomes to differ materially from those expressed in the forward-looking statements. The Company's expectations, beliefs and projections contained herein are expressed in good faith and are believed to have a reasonable basis, but there can be no assurance that such expectations, beliefs or projections will result or be achieved or accomplished. In addition to other factors, the following are important factors that could cause actual results to differ materially from results referred to in the forward-looking statements: changes in economic conditions, including economic disruptions caused by terrorist activities, acts of war or major accidents; changes in demographic patterns and weather conditions, including the occurrence of severe weather such as hurricanes; changes in the availability and/or price of natural gas or oil and the effect of such changes on the accounting treatment of derivative financial instruments or the valuation of the Company's natural gas and oil reserves; uncertainty of oil and gas reserve estimates; ability to successfully identify, drill for and produce economically viable natural gas and oil reserves, including shortages, delays or unavailability of equipment and services required in drilling operations; significant changes from expectations in the Company's actual production levels for natural gas or oil; changes in the availability and/or price of derivative financial instruments; changes in the price differentials between various types of oil; inability to obtain new customers or retain existing ones; significant changes in competitive factors affecting the Company; changes in laws and regulations to which the Company is subject, including changes in tax, environmental, safety and employment laws and regulations; governmental/regulatory actions, initiatives and proceedings; unanticipated impacts of restructuring initiatives in the natural gas and electric industries; significant changes from expectations in actual capital expenditures and operating expenses and unanticipated project delays or changes in project costs or plans; the nature and projected profitability of pending and potential projects and other investments, and the ability to obtain necessary governmental approvals and permits; occurrences affecting the Company's ability to obtain funds from operations, from borrowings under our credit lines or other credit facilities or from issuances of other short-term notes or debt or equity securities to finance needed capital expenditures and other investments, including any downgrades in the Company's credit ratings; ability to successfully identify and finance acquisitions or other investments and ability to operate and integrate existing and any subsequently acquired business or properties; impairments under the SEC's full cost ceiling test for natural gas and oil reserves; significant changes in tax rates or policies or in rates of inflation or interest; significant changes in the Company's relationship with its employees or contractors and the potential adverse effects if labor disputes, grievances or shortages were to occur; changes in accounting principles or the application of such principles to the Company; the cost and effects of legal and administrative claims against the Company or activist shareholder campaigns to effect changes at the Company; or increasing costs of insurance, changes in coverage and the ability to obtain insurance. For a discussion of these risks and other factors that could cause actual results to differ materially from results referred to in the forward- looking statements, see "Risk Factors" in the Company's Form 10-K for the fiscal year ended September 30, 2007 and Form 10-Q for the quarter ended March 31, 2008. The Company disclaims any obligation to update any forward-looking statements to reflect events or circumstances after the date hereof or to reflect the occurrence of unanticipated events. Safe Harbor For Forward Looking Statements |

| National Fuel Gas Company Net Plant by Segment $2.9 Billion At March 31, 2008 P&S Utility All Other E&P Net plant 0.7 1.1 0.112 0.988 |
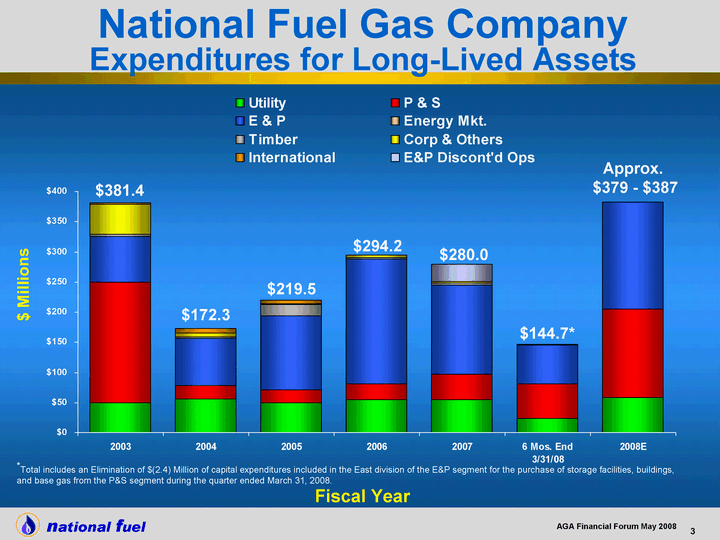
| 2001 2002 2003 2004 2005 2006 2007 6 Mos. End 3/31/08 2008E Utility 42.4 51.5 49.9 55.5 50.1 54.4 54.2 23.9 59 P & S 26 30.3 199.4 23.2 21.1 26 43.2 57.1 146 E & P 296.4 114.6 75.8 77.7 122.45 208.3 146.7 64.9 177 Energy Mkt. 0.116 0.1 0.2 0.0102 0.06 $- 0.08 0 0 Timber 3.7 25.6 3.5 2.8 18.9 2.3 3.657 1.1 0 Corp & Others 0.937 6.6 50.1 5.7 1.1 3.2 3.1 0.1 1 International 15.6 4.2 2.5 7.5 5.9 0 0 0 0 E&P Discont'd Ops 0 0 0 0 0 0 29.1 0 $ Millions $172.3 $219.5 Fiscal Year National Fuel Gas Company Expenditures for Long-Lived Assets $294.2 Approx. $379 - $387 $280.0 $144.7* $381.4 *Total includes an Elimination of $(2.4) Million of capital expenditures included in the East division of the E&P segment for the purchase of storage facilities, buildings, and base gas from the P&S segment during the quarter ended March 31, 2008. |
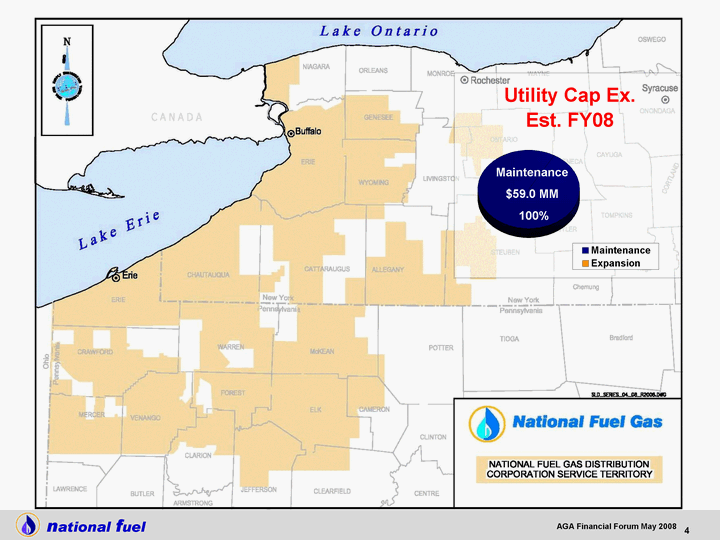
| ## national fuel 7 AGA Financial Forum May 2008 Maintenance Expansion Cap Ex 59 0 Maintenance $59.0 MM 100% |
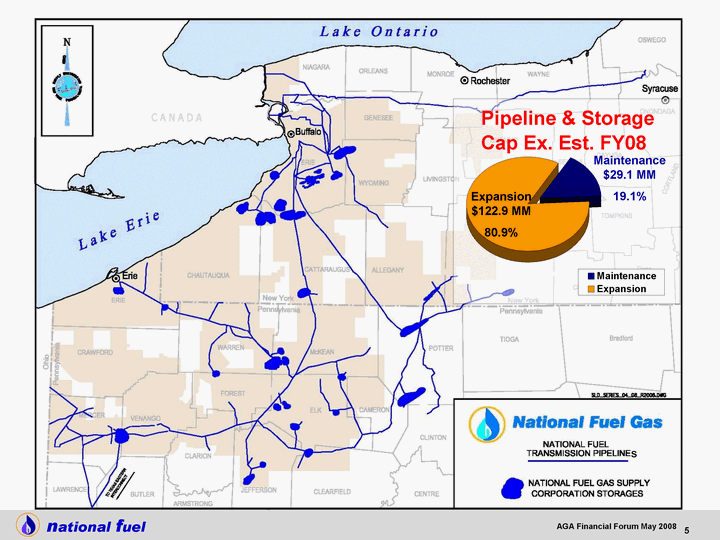
| S ## national fuel 9 AGA Financial Forum May 2008 Maintenance Expansion Cap Ex 23 122.9 Expansion $122.9 MM 80.9% Maintenance $29.1 MM 19.1% |
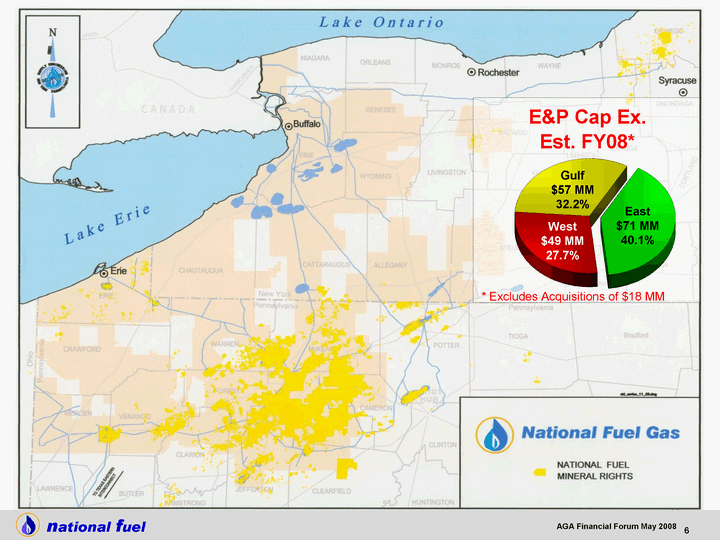
| 13 East West Gulf Cap Ex 71 49 57 East $71 MM 40.1% Gulf $57 MM 32.2% West $49 MM 27.7% national fuel 11 AGA Financial Forum May 2008 * Excludes Acquisitions of $18 MM |
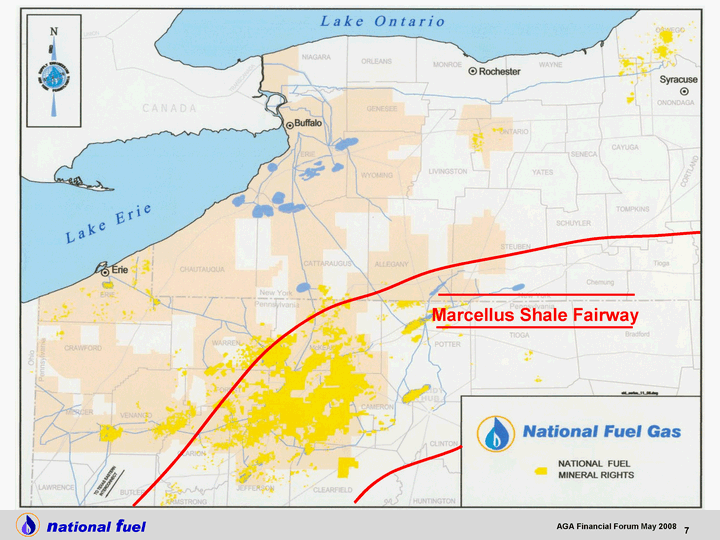
| 13 national fuel 13 AGA Financial Forum May 2008 Marcellus Shale Fairway |
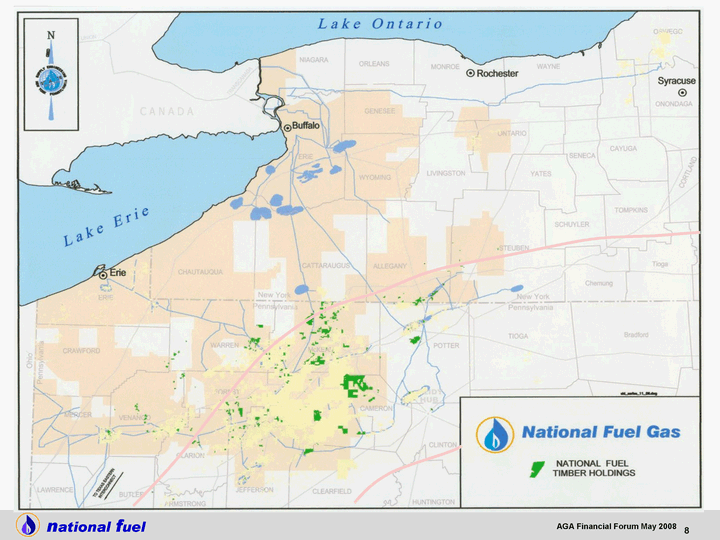
| 14 national fuel 15 AGA Financial Forum May 2008 |
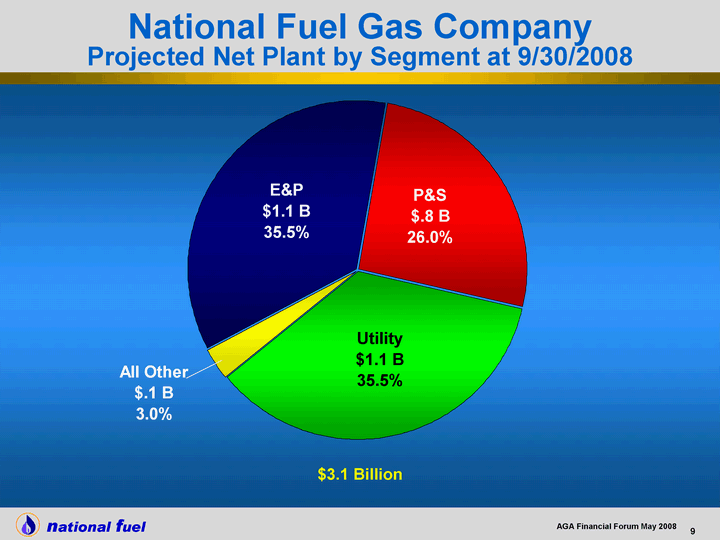
| National Fuel Gas Company Projected Net Plant by Segment at 9/30/2008 $3.1 Billion P&S Utility All Other E&P Net plant 0.8 1.1 0.1 1.1 |
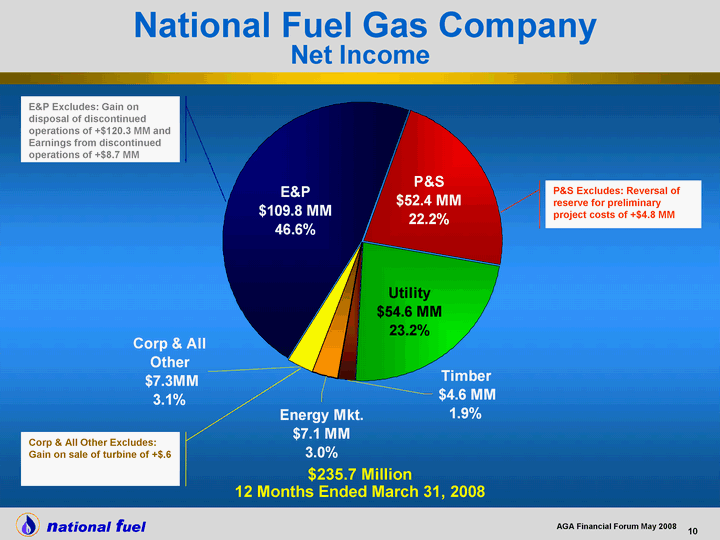
| $235.7 Million 12 Months Ended March 31, 2008 P&S Utility Timber Energy Mkt. * Corp. & Other E&P NI 52.4 54.6 4.6 7.1 7.3 109.8 National Fuel Gas Company Net Income |
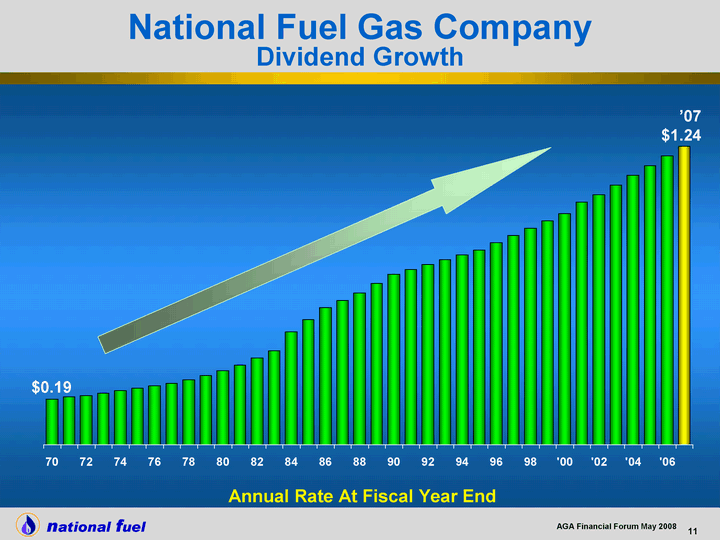
| 70 0.19 71 0.2 72 0.205 73 0.215 74 0.225 75 0.235 76 0.245 77 0.255 78 0.27 79 0.2875 80 0.3075 81 0.33 82 0.36 83 0.39 84 0.47 85 0.52 86 0.57 87 0.6 88 0.63 89 0.67 90 0.71 91 0.73 92 0.75 93 0.77 94 0.79 95 0.81 96 0.84 97 0.87 98 0.9 99 0.93 '00 0.96 '01 1.01 '02 1.04 '03 1.08 '04 1.12 '05 1.16 '06 1.2 '07 1.24 National Fuel Gas Company Dividend Growth $0.19 '07 $1.24 Annual Rate At Fiscal Year End |
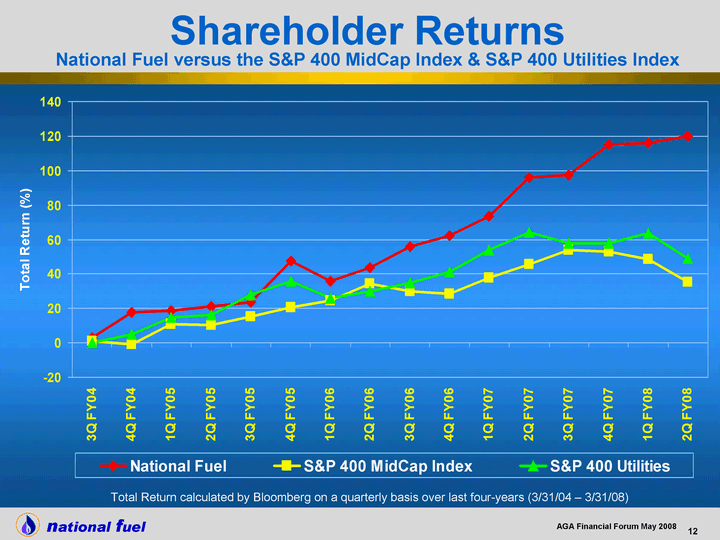
| Shareholder Returns National Fuel versus the S&P 400 MidCap Index & S&P 400 Utilities Index 3Q FY04 4Q FY04 1Q FY05 2Q FY05 3Q FY05 4Q FY05 1Q FY06 2Q FY06 3Q FY06 4Q FY06 1Q FY07 2Q FY07 3Q FY07 4Q FY07 1Q FY08 2Q FY08 National Fuel 2.76 17.6 18.81 21.03 23.61 47.47 35.74 43.66 55.6 62.29 73.41 96 97.63 115.01 115.84 119.72 S&P 400 MidCap Index 0.96 -1.16 10.83 10.39 15.08 20.7 24.73 34.23 30.01 28.6 37.58 45.55 54.05 52.7 48.54 35.4 S&P 400 Utilities -0.12 4.83 14.71 16.25 28.14 35.64 26.15 30.05 34.68 41.04 53.95 63.93 58.04 57.84 63.87 48.96 Total Return calculated by Bloomberg on a quarterly basis over last four-years (3/31/04 - 3/31/08) |
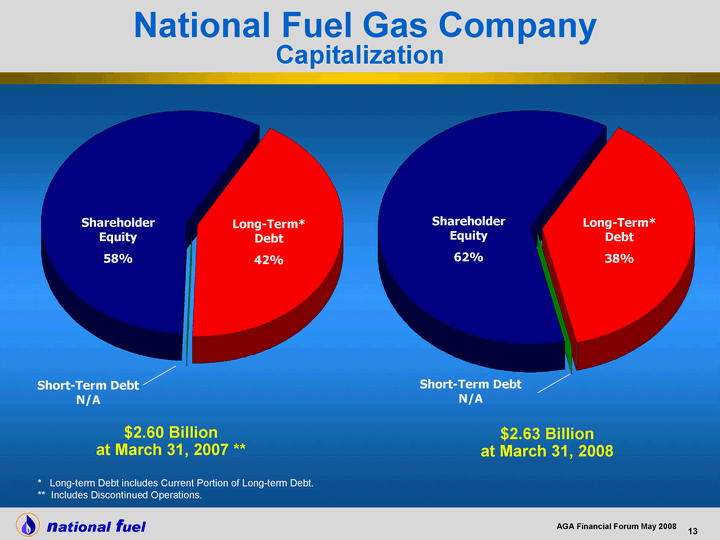
| * Long-term Debt includes Current Portion of Long-term Debt. ** Includes Discontinued Operations. National Fuel Gas Company Capitalization $2.60 Billion at March 31, 2007 ** Long-Term Debt Short-Term Debt Shareholder Equity Capitalization 1095 0 1506 Short-Term Debt N/A Shareholder Equity 58% Long-Term* Debt 42% $2.63 Billion at March 31, 2008 Long-Term Debt Short-Term Debt Shareholder Equity Capitalization 999 0 1629 Short-Term Debt N/A Shareholder Equity 62% Long-Term* Debt 38% |
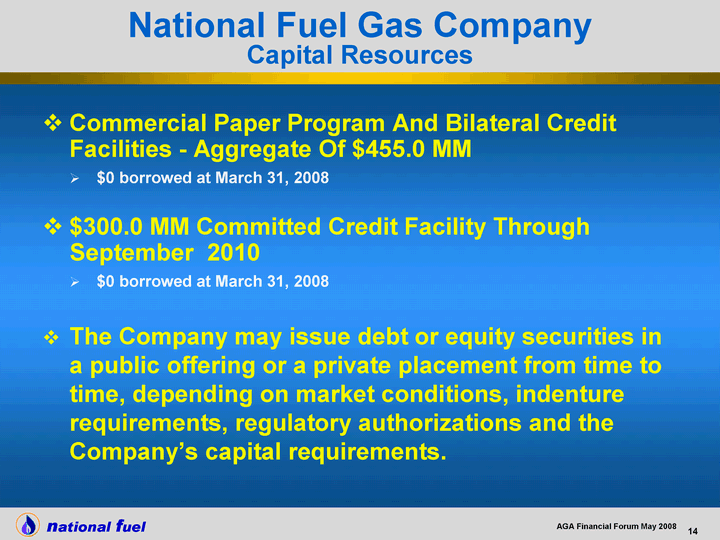
| Commercial Paper Program And Bilateral Credit Facilities - Aggregate Of $455.0 MM $0 borrowed at March 31, 2008 $300.0 MM Committed Credit Facility Through September 2010 $0 borrowed at March 31, 2008 The Company may issue debt or equity securities in a public offering or a private placement from time to time, depending on market conditions, indenture requirements, regulatory authorizations and the Company's capital requirements. National Fuel Gas Company Capital Resources |

| National Fuel Gas Company Share Buyback Date Authorized: December 8, 2005 Authorized Amount: Up to 8 Million Shares As of 03/31/08: 6,227,553 Shares Repurchased |
| National Fuel Gas Supply Corporation Empire State Pipeline Pipeline & Storage Segment |
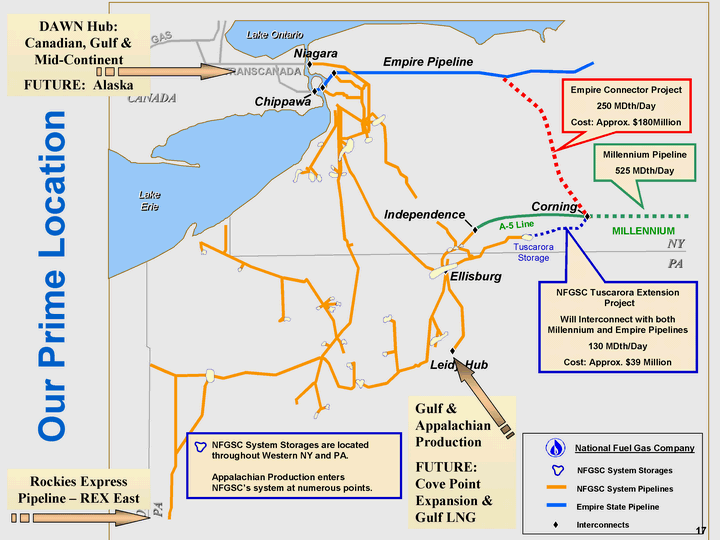
| DAWN Hub: Canadian, Gulf & Mid-Continent FUTURE: Alaska Rockies Express Pipeline - REX East Gulf & Appalachian Production FUTURE: Cove Point Expansion & Gulf LNG 17 |
| XX national fuel 35 AGA Financial Forum May 2008 |

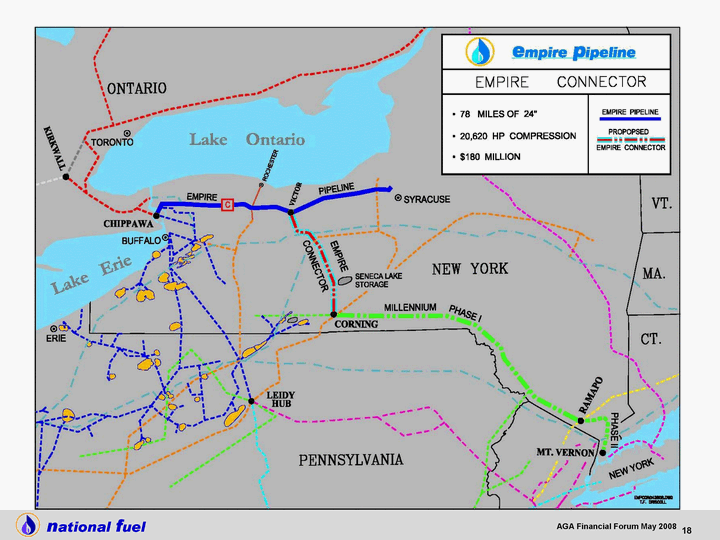
| Construction Started September 2007 >18 miles Completed in Calendar 2007; Activities to Resume for the 2008 Construction Season Initial Capacity 250,000 Dth/day - KeySpan 150,750 Dth/day Target In-Service Date November 1, 2008 78 Miles of 24" Pipe - 1,440 psig 20,620 HP of Compression Receipts from TransCanada Pipeline @ Chippawa, Ontario; Deliveries to Millennium @ Corning, New York Capital Cost Approximately $180 Million $65 Million spent as of March 31, 2008 Pipeline & Storage Empire Connector |
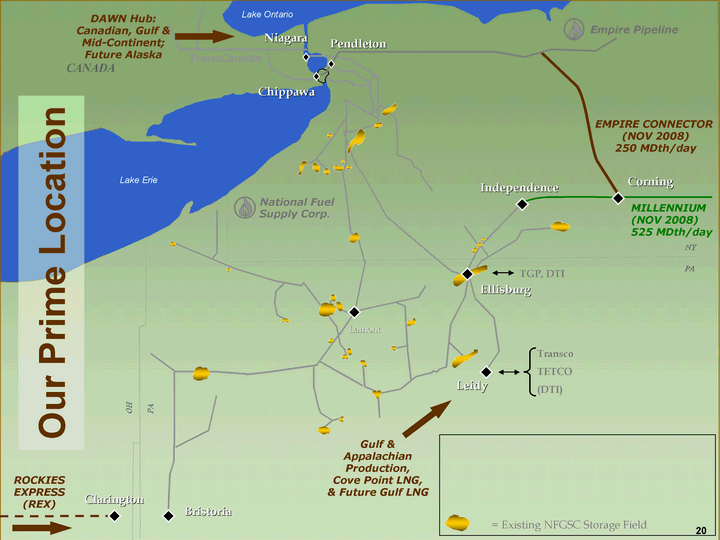
| ROCKIES EXPRESS (REX) MILLENNIUM (NOV 2008) 525 MDth/day EMPIRE CONNECTOR (NOV 2008) 250 MDth/day CANADA Lake Ontario Lake Erie Leidy Ellisburg NY PA Chippawa Corning Independence TransCanada Pendleton Niagara PA OH National Fuel Supply Corp. Empire Pipeline Bristoria Clarington Lamont TGP, DTI = Existing NFGSC Storage Field Gulf & Appalachian Production, Cove Point LNG, & Future Gulf LNG DAWN Hub: Canadian, Gulf & Mid-Continent; Future Alaska Our Prime Location 20 |
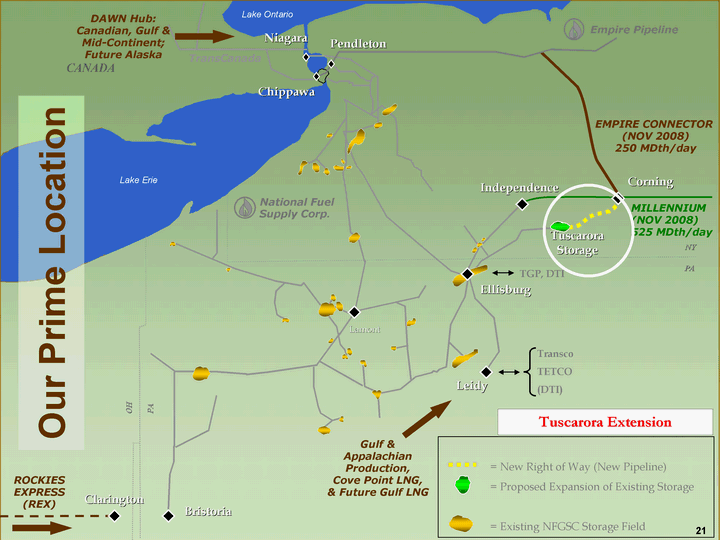
| ROCKIES EXPRESS (REX) MILLENNIUM (NOV 2008) 525 MDth/day EMPIRE CONNECTOR (NOV 2008) 250 MDth/day CANADA Lake Ontario Lake Erie Leidy Ellisburg NY PA Chippawa Corning Independence Tuscarora Storage TransCanada Pendleton Niagara PA OH National Fuel Supply Corp. Empire Pipeline Bristoria Clarington Lamont TGP, DTI = New Right of Way (New Pipeline) = Proposed Expansion of Existing Storage = Existing NFGSC Storage Field Gulf & Appalachian Production, Cove Point LNG, & Future Gulf LNG DAWN Hub: Canadian, Gulf & Mid-Continent; Future Alaska Our Prime Location 21 Tuscarora Extension |
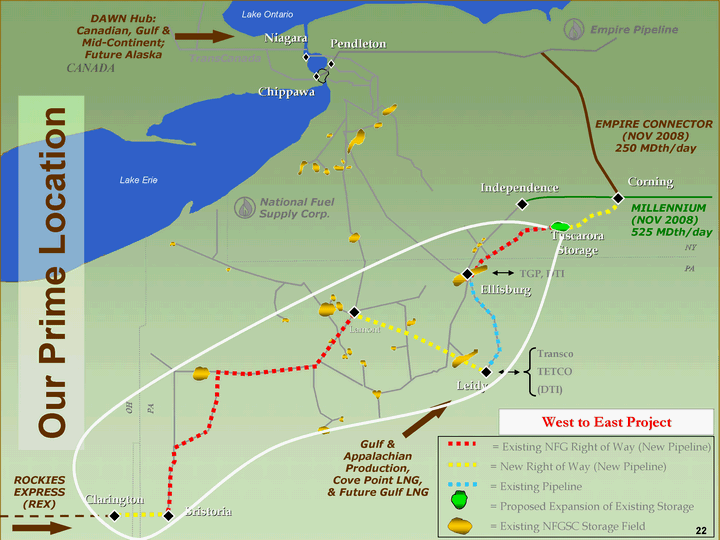
| ROCKIES EXPRESS (REX) MILLENNIUM (NOV 2008) 525 MDth/day EMPIRE CONNECTOR (NOV 2008) 250 MDth/day CANADA Lake Ontario Lake Erie Leidy Ellisburg NY PA Chippawa Corning Independence TransCanada Pendleton Niagara PA OH National Fuel Supply Corp. Empire Pipeline Bristoria Clarington Lamont TGP, DTI = Existing NFG Right of Way (New Pipeline) = New Right of Way (New Pipeline) = Existing Pipeline = Proposed Expansion of Existing Storage = Existing NFGSC Storage Field Gulf & Appalachian Production, Cove Point LNG, & Future Gulf LNG DAWN Hub: Canadian, Gulf & Mid-Continent; Future Alaska Our Prime Location 22 Tuscarora Storage West to East Project |
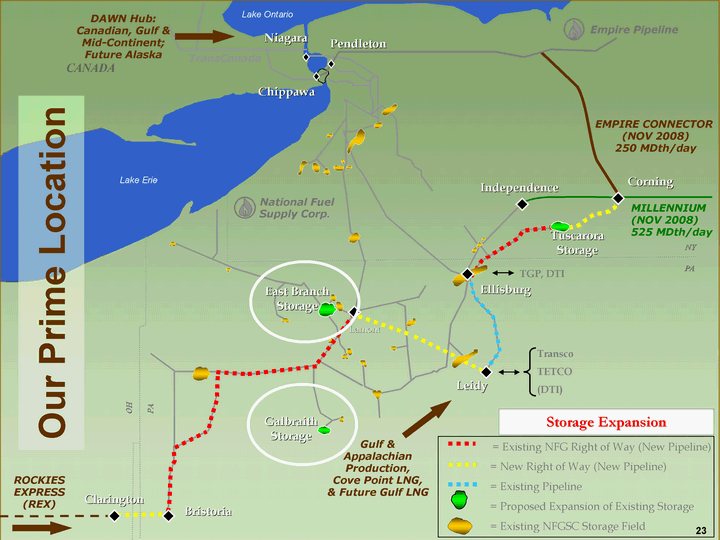
| ROCKIES EXPRESS (REX) MILLENNIUM (NOV 2008) 525 MDth/day EMPIRE CONNECTOR (NOV 2008) 250 MDth/day CANADA Lake Ontario Lake Erie Leidy Ellisburg NY PA Chippawa Corning Independence Tuscarora Storage TransCanada Pendleton Niagara PA OH National Fuel Supply Corp. Empire Pipeline Bristoria Clarington Lamont TGP, DTI Gulf & Appalachian Production, Cove Point LNG, & Future Gulf LNG DAWN Hub: Canadian, Gulf & Mid-Continent; Future Alaska Our Prime Location 23 Galbraith Storage East Branch Storage = Existing NFG Right of Way (New Pipeline) = New Right of Way (New Pipeline) = Existing Pipeline = Proposed Expansion of Existing Storage = Existing NFGSC Storage Field Storage Expansion |
| National Fuel Gas Distribution Corporation Utility Segment |
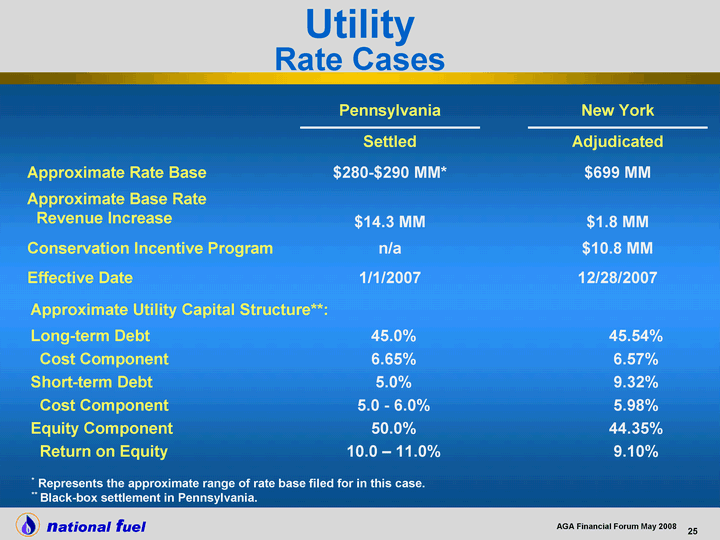
| Utility Rate Cases * Represents the approximate range of rate base filed for in this case. ** Black-box settlement in Pennsylvania. Pennsylvania New York Settled Adjudicated Approximate Rate Base $280-$290 MM* $699 MM Approximate Base Rate Revenue Increase $14.3 MM $1.8 MM Conservation Incentive Program n/a $10.8 MM Effective Date 1/1/2007 12/28/2007 Approximate Utility Capital Structure**: Approximate Utility Capital Structure**: Long-term Debt Cost Component Short-term Debt Cost Component Equity Component Return on Equity 45.0% 6.65% 5.0% 5.0 - 6.0% 50.0% 10.0 - 11.0% 45.54% 6.57% 9.32% 5.98% 44.35% 9.10% |
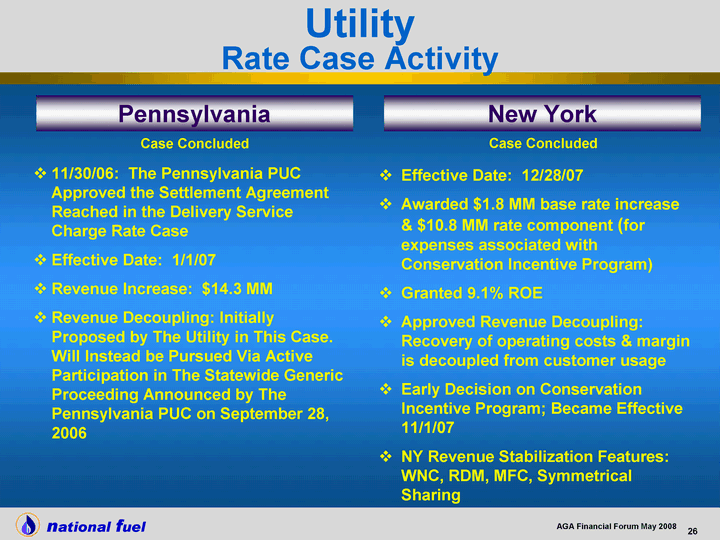
| Utility Rate Case Activity 11/30/06: The Pennsylvania PUC Approved the Settlement Agreement Reached in the Delivery Service Charge Rate Case Effective Date: 1/1/07 Revenue Increase: $14.3 MM Revenue Decoupling: Initially Proposed by The Utility in This Case. Will Instead be Pursued Via Active Participation in The Statewide Generic Proceeding Announced by The Pennsylvania PUC on September 28, 2006 Pennsylvania Effective Date: 12/28/07 Awarded $1.8 MM base rate increase & $10.8 MM rate component (for expenses associated with Conservation Incentive Program) Granted 9.1% ROE Approved Revenue Decoupling: Recovery of operating costs & margin is decoupled from customer usage Early Decision on Conservation Incentive Program; Became Effective 11/1/07 NY Revenue Stabilization Features: WNC, RDM, MFC, Symmetrical Sharing New York Case Concluded Case Concluded |

| Exploration & Production Segment |
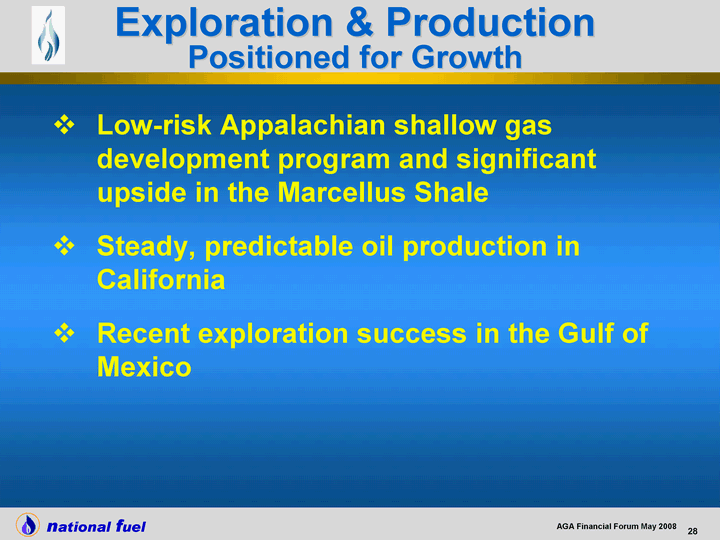
| Low-risk Appalachian shallow gas development program and significant upside in the Marcellus Shale Steady, predictable oil production in California Recent exploration success in the Gulf of Mexico Exploration & Production Positioned for Growth |
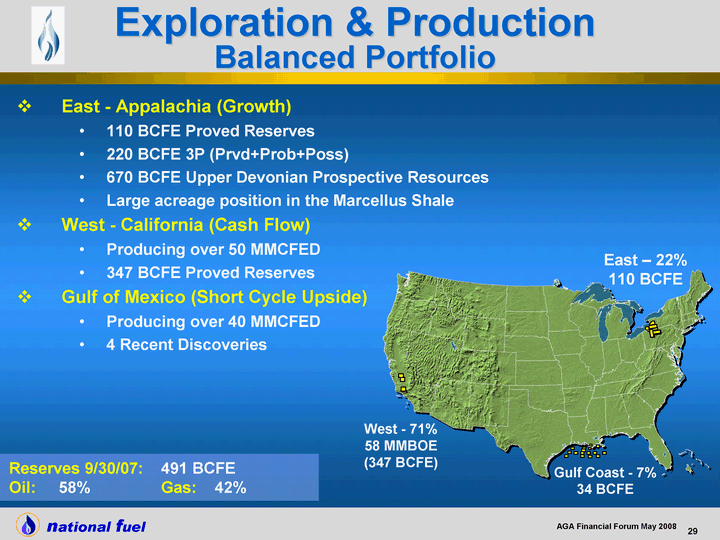
| East - Appalachia (Growth) 110 BCFE Proved Reserves 220 BCFE 3P (Prvd+Prob+Poss) 670 BCFE Upper Devonian Prospective Resources Large acreage position in the Marcellus Shale West - California (Cash Flow) Producing over 50 MMCFED 347 BCFE Proved Reserves Gulf of Mexico (Short Cycle Upside) Producing over 40 MMCFED 4 Recent Discoveries Exploration & Production Balanced Portfolio Gulf Coast - 7% 34 BCFE West - 71% 58 MMBOE (347 BCFE) East - 22% 110 BCFE Reserves 9/30/07: 491 BCFE Oil: 58% Gas: 42% |
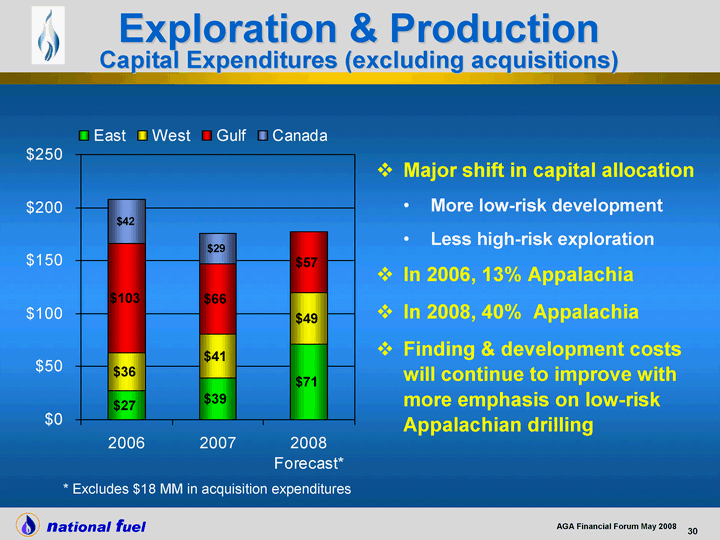
| 2006 2007 2008 Forecast* East 27 39.1 71 West 36 41.4 49 Gulf 103 66.2 57 Canada 42 29.1 0 Major shift in capital allocation More low-risk development Less high-risk exploration In 2006, 13% Appalachia In 2008, 40% Appalachia Finding & development costs will continue to improve with more emphasis on low-risk Appalachian drilling Exploration & Production Capital Expenditures (excluding acquisitions) * Excludes $18 MM in acquisition expenditures |
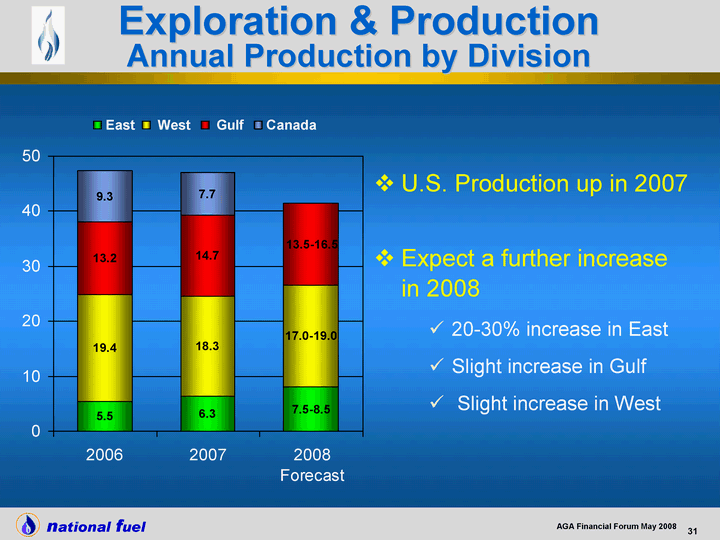
| U.S. Production up in 2007 Expect a further increase in 2008 20-30% increase in East Slight increase in Gulf Slight increase in West 2006 2007 2008 Forecast East 5.5 6.3 8.1 West 19.4 18.3 18.5 Gulf 13.2 14.7 14.9 Canada 9.3 7.7 Exploration & Production Annual Production by Division |
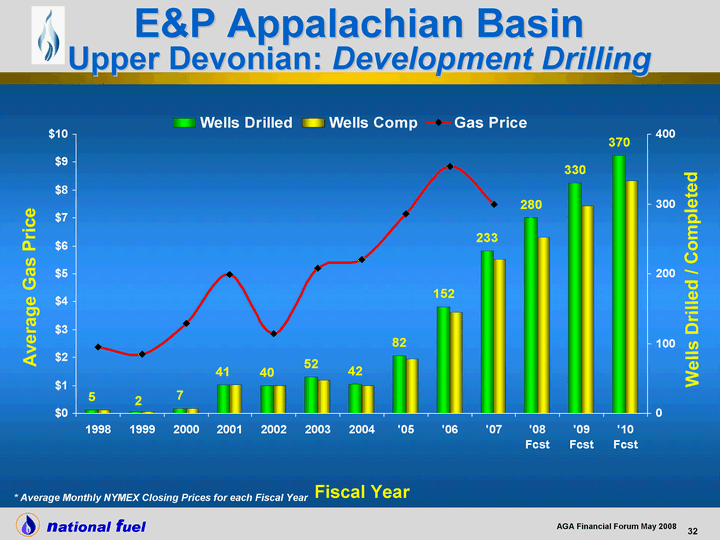
| 1998 1999 2000 2001 2002 2003 2004 '05 '06 '07 '08 Fcst '09 Fcst '10 Fcst Wells Drilled 5 2 7 41 40 52 42 82 152 233 280 330 370 Wells Comp 5 2 7 41 40 48 40 78 145 220 252 297 333 Gas Price 2.36 2.13 3.21 4.98 2.84 5.2 5.51 7.15 8.83 7.49 Fiscal Year Wells Drilled / Completed Average Gas Price E&P Appalachian Basin Upper Devonian: Development Drilling * Average Monthly NYMEX Closing Prices for each Fiscal Year |
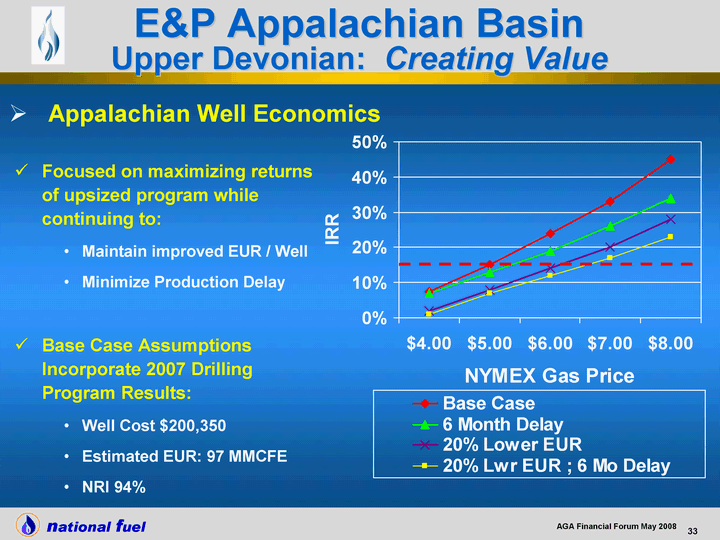
| Focused on maximizing returns of upsized program while continuing to: Maintain improved EUR / Well Minimize Production Delay Base Case Assumptions Incorporate 2007 Drilling Program Results: Well Cost $200,350 Estimated EUR: 97 MMCFE NRI 94% Upper Devonian Cases 4 5 6 7 8 Base Case 0.075 0.15 0.24 0.33 0.45 6 Month Delay 0.07 0.13 0.19 0.26 0.34 20% Lower EUR 0.02 0.08 0.14 0.2 0.28 20% Lwr EUR ; 6 Mo Delay 0.01 0.07 0.12 0.17 0.23 Appalachian Well Economics E&P Appalachian Basin Upper Devonian: Creating Value |
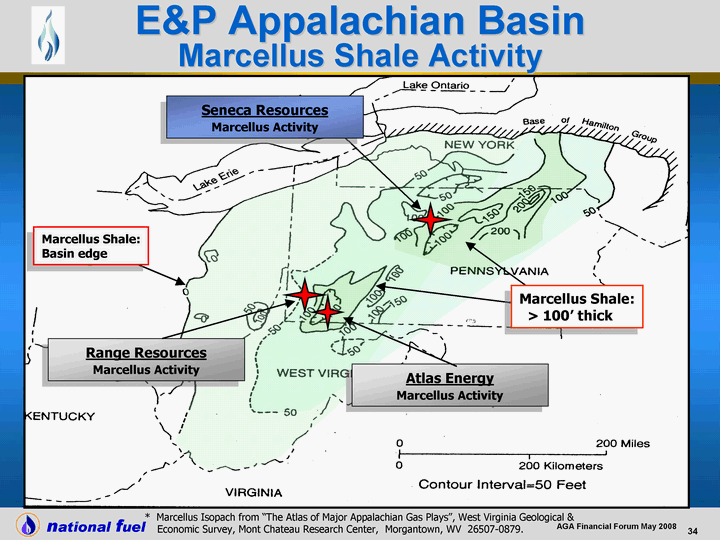
| Marcellus Shale: Basin edge Range Resources Marcellus Activity Seneca Resources Marcellus Activity Atlas Energy Marcellus Activity * Marcellus Isopach from "The Atlas of Major Appalachian Gas Plays", West Virginia Geological & Economic Survey, Mont Chateau Research Center, Morgantown, WV 26507-0879. E&P Appalachian Basin Marcellus Shale Activity Marcellus Shale: > 100' thick |
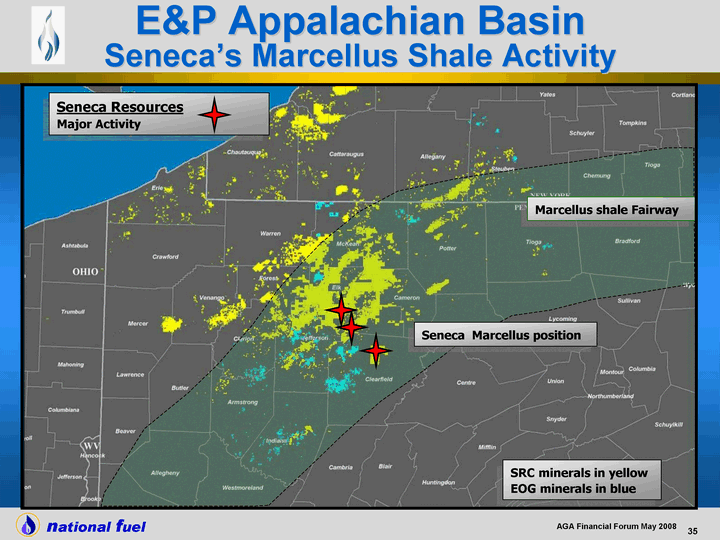
| Marcellus shale Fairway Seneca Resources Major Activity E&P Appalachian Basin Seneca's Marcellus Shale Activity SRC minerals in yellow EOG minerals in blue Seneca Marcellus position |
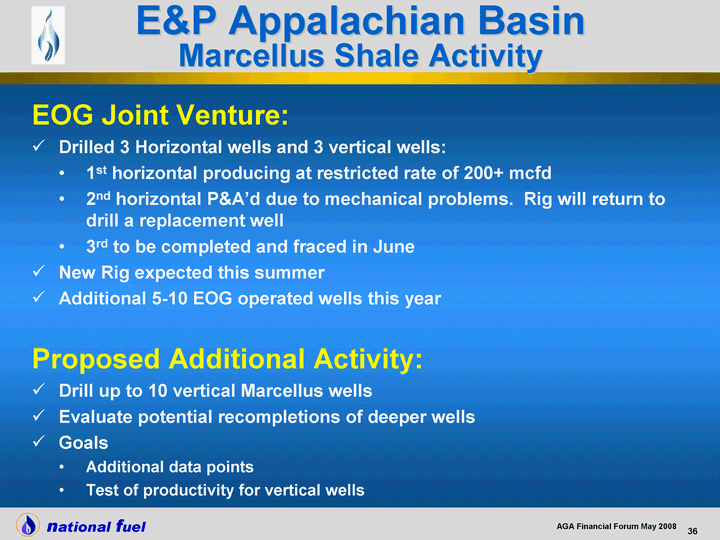
| EOG Joint Venture: Drilled 3 Horizontal wells and 3 vertical wells: 1st horizontal producing at restricted rate of 200+ mcfd 2nd horizontal P&A'd due to mechanical problems. Rig will return to drill a replacement well 3rd to be completed and fraced in June New Rig expected this summer Additional 5-10 EOG operated wells this year Proposed Additional Activity: Drill up to 10 vertical Marcellus wells Evaluate potential recompletions of deeper wells Goals Additional data points Test of productivity for vertical wells E&P Appalachian Basin Marcellus Shale Activity |
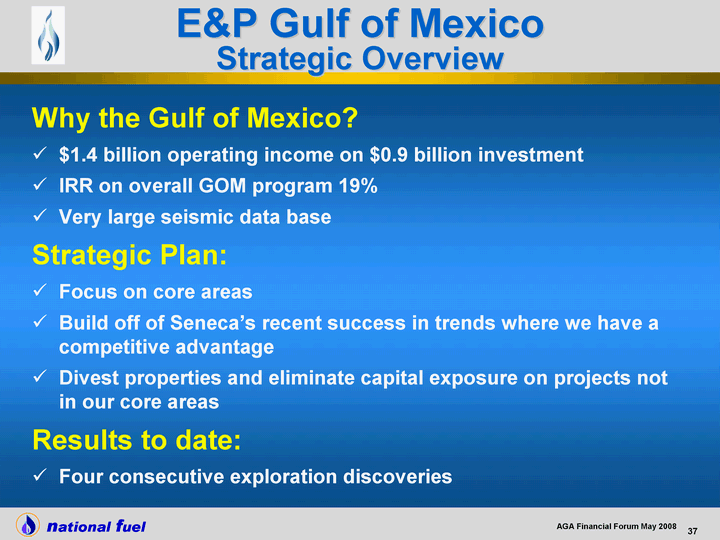
| Why the Gulf of Mexico? $1.4 billion operating income on $0.9 billion investment IRR on overall GOM program 19% Very large seismic data base Strategic Plan: Focus on core areas Build off of Seneca's recent success in trends where we have a competitive advantage Divest properties and eliminate capital exposure on projects not in our core areas Results to date: Four consecutive exploration discoveries E&P Gulf of Mexico Strategic Overview |
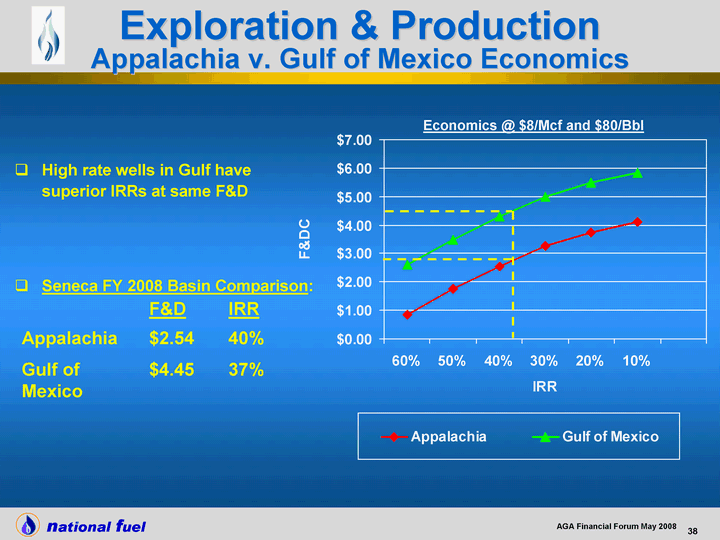
| High rate wells in Gulf have superior IRRs at same F&D Seneca FY 2008 Basin Comparison: 0.6 0.5 0.4 0.3 0.2 0.1 Appalachia 0.85 1.75 2.55 3.25 3.75 4.1 Gulf of Mexico 2.6 3.5 4.3 5 5.5 5.85 F&D IRR Appalachia $2.54 40% Gulf of Mexico $4.45 37% Economics @ $8/Mcf and $80/Bbl Exploration & Production Appalachia v. Gulf of Mexico Economics |
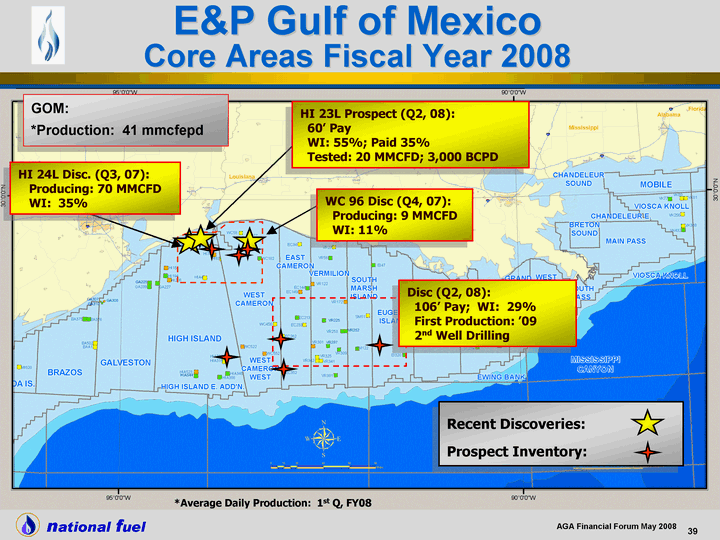
| GOM: *Production: 41 mmcfepd *Average Daily Production: 1st Q, FY08 Recent Discoveries: Prospect Inventory: WC 96 Disc (Q4, 07): Producing: 9 MMCFD WI: 11% Disc (Q2, 08): 106' Pay; WI: 29% First Production: '09 2nd Well Drilling HI 24L Disc. (Q3, 07): Producing: 70 MMCFD WI: 35% HI 23L Prospect (Q2, 08): 60' Pay WI: 55%; Paid 35% Tested: 20 MMCFD; 3,000 BCPD E&P Gulf of Mexico Core Areas Fiscal Year 2008 |
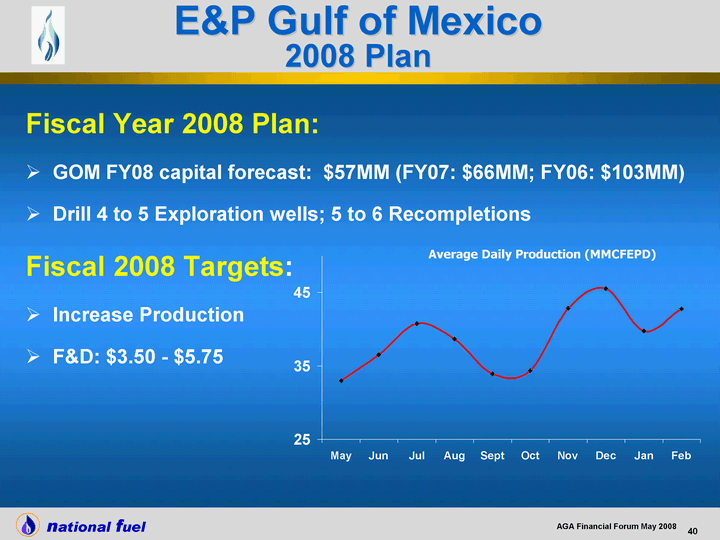
| Fiscal Year 2008 Plan: GOM FY08 capital forecast: $57MM (FY07: $66MM; FY06: $103MM) Drill 4 to 5 Exploration wells; 5 to 6 Recompletions Fiscal 2008 Targets: Increase Production F&D: $3.50 - $5.75 May Jun Jul Aug Sept Oct Nov Dec Jan Feb Ave. Daily Production 33 36.5 40.8 38.7 33.9 34.4 42.9 45.5 39.8 42.8 Average Daily Production (MMCFEPD) E&P Gulf of Mexico 2008 Plan |

| Reserves R/P Ratio Production Revenue Lifting Cost Operating Income 2007 58 MMBOE (347 BCFE) 18.9 3.06 MMBOE (47% of Seneca) $148.9 M (30% of Seneca) $7.97 / BOE $88.3 M (52% of Seneca) 2008 Goal 2.83 - 3.17 MMBOE (~45% of Seneca) $176.7 M * (46% of Seneca) $8.22 / BOE $107.1M * (53% of Seneca) Crude Pricing After Hedging $ / BBL Increase = $29.58 Increase = $1.35 E&P California Increasing Margins * Based upon FY2008 Production of 3.05 MMBOE |

| Property Trade Exchanged Seneca's Upper Ojai assets plus $14.1mm for additional Sespe assets SRC gains 6.6 BCFE of reserves, 210 BOEPD of production, reserve replacement cost of $2.14/MCFE Significant upside potential at Sespe Marvic Sand Development at MWSS Drill 11 wells in 2008 3.3 BCFE @ $1.58 F&D cost Additional wells in 2009 based on 2008 results E&P California Reserve Replacement Projects |
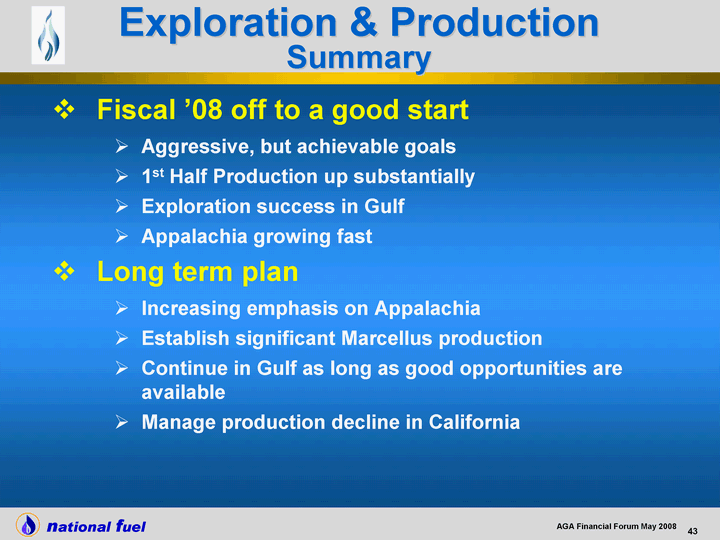
| Exploration & Production Summary Fiscal '08 off to a good start Aggressive, but achievable goals 1st Half Production up substantially Exploration success in Gulf Appalachia growing fast Long term plan Increasing emphasis on Appalachia Establish significant Marcellus production Continue in Gulf as long as good opportunities are available Manage production decline in California |
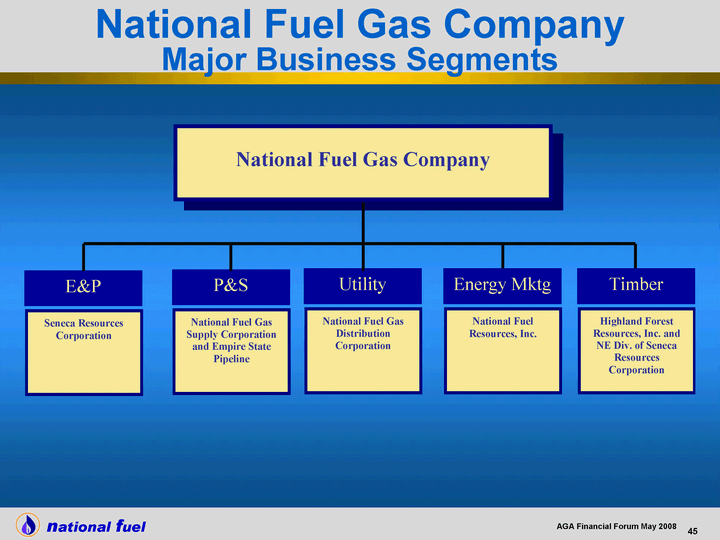
| National Fuel Gas Company Major Business Segments |
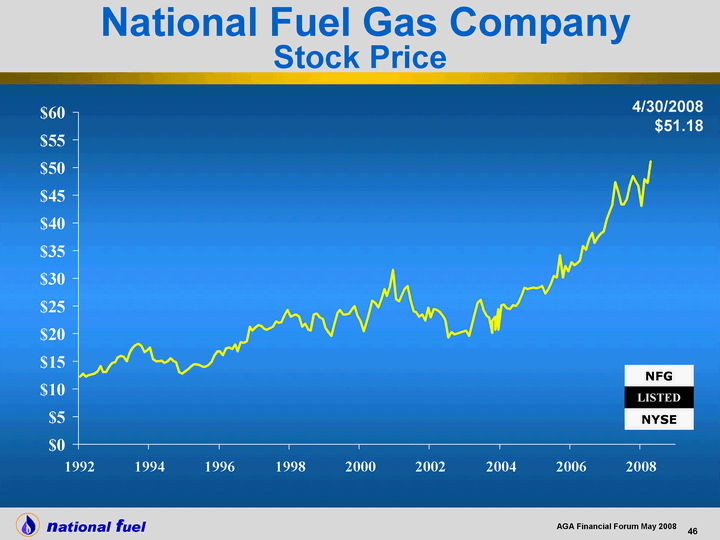
| 1/1/1992 2/1/1992 3/1/1992 4/1/1992 5/1/1992 6/1/1992 7/1/1992 8/1/1992 9/1/1992 10/1/1992 11/1/1992 12/1/1992 1/1/1993 2/1/1993 3/1/1993 4/1/1993 5/1/1993 6/1/1993 7/1/1993 8/1/1993 9/1/1993 10/1/1993 11/1/1993 12/1/1993 1/1/1994 2/1/1994 3/1/1994 4/1/1994 5/1/1994 6/1/1994 7/1/1994 8/1/1994 9/1/1994 10/1/1994 11/1/1994 12/1/1994 1/1/1995 2/1/1995 3/1/1995 4/1/1995 5/1/1995 6/1/1995 7/1/1995 8/1/1995 9/1/1995 10/1/1995 11/1/1995 12/1/1995 1/1/1996 2/1/1996 3/1/1996 4/1/1996 5/1/1996 6/1/1996 7/1/1996 8/1/1996 9/1/1996 10/1/1996 11/1/1996 12/1/1996 1/1/1997 2/1/1997 3/1/1997 4/1/1997 5/1/1997 6/1/1997 7/1/1997 8/1/1997 9/1/1997 10/1/1997 11/1/1997 12/1/1997 1/1/1998 2/1/1998 3/1/1998 4/1/1998 5/1/1998 6/1/1998 7/1/1998 8/1/1998 9/1/1998 10/1/1998 11/1/1998 12/1/1998 1/1/1999 2/1/1999 3/1/1999 4/1/1999 5/1/1999 6/1/1999 7/1/1999 8/1/1999 9/1/1999 10/1/1999 11/1/1999 12/1/1999 1/1/2000 2/1/2000 3/1/2000 12.1875 12.75 12.1875 12.5 12.6875 12.75 13.1875 14.125 13.0625 13.125 14.0625 14.75 14.8125 15.75 16 15.875 14.9375 16.6875 17.375 17.9375 18.1875 17.75 16.6875 17 17.4375 15.375 15 15 15.1875 14.6875 15 15.5625 14.9375 14.875 13 12.75 13.25 13.625 14 14.4375 14.4375 14.3125 14 14.0625 14.375 14.875 16.0625 16.8125 16.75 16.0625 17.3125 17.5625 17.1875 18 16.875 18.5 18.375 18.625 21.3125 20.625 21.125 21.5 21.375 20.8125 20.6875 20.96875 21.25 22.21875 22 22.0625 23.34375 24.34375 23 23.3125 23.5 23 21.1875 21.78125 20.65625 20.5625 23.5 23.625 22.96875 22.59375 21.15625 20.21875 19.625 21.875 23.75 24.25 23.46875 23.53125 23.59375 24.4375 25.03125 23.25 22.28125 20.46875 22.28125 National Fuel Gas Company Stock Price 4/30/2008 $51.18 NFG LISTED NYSE |
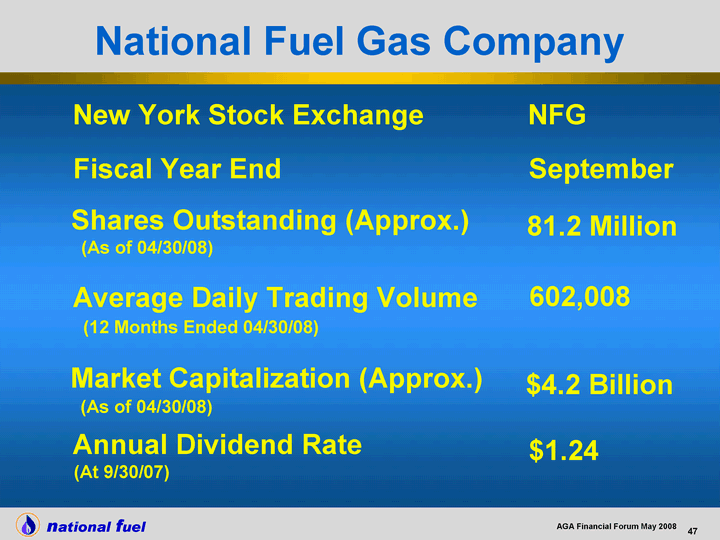
| National Fuel Gas Company New York Stock Exchange NFG Shares Outstanding (Approx.) (As of 04/30/08) 81.2 Million Average Daily Trading Volume (12 Months Ended 04/30/08) 602,008 Market Capitalization (Approx.) (As of 04/30/08) $4.2 Billion $1.24 Annual Dividend Rate (At 9/30/07) September Fiscal Year End |
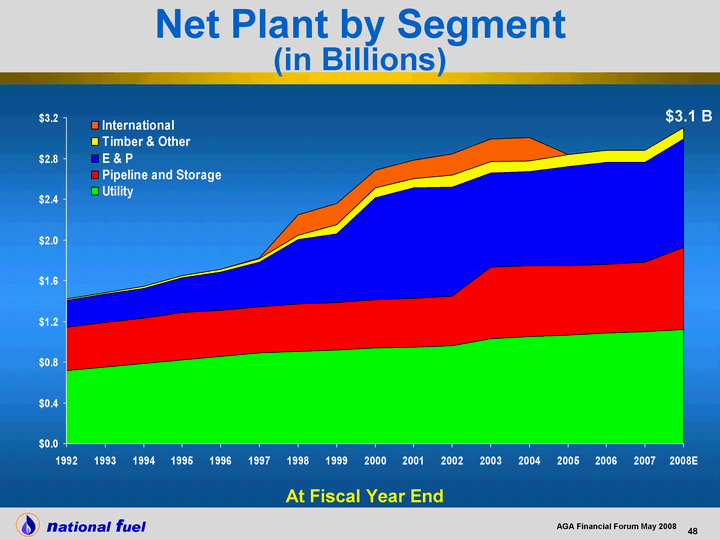
| 1992 1993 1994 1995 1996 1997 1998 1999 2000 2001 2002 2003 2004 2005 2006 2007 2008E $3.1 B At Fiscal Year End Net Plant by Segment (in Billions) |
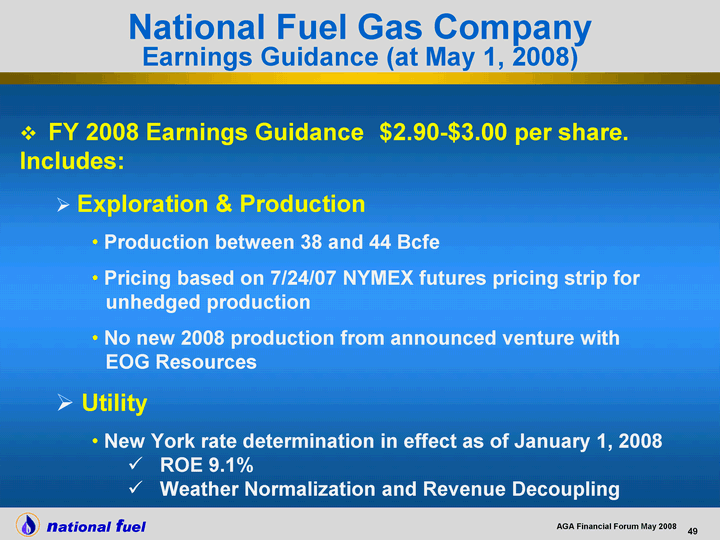
| National Fuel Gas Company Earnings Guidance (at May 1, 2008) FY 2008 Earnings Guidance $2.90-$3.00 per share. Includes: Exploration & Production Production between 38 and 44 Bcfe Pricing based on 7/24/07 NYMEX futures pricing strip for unhedged production No new 2008 production from announced venture with EOG Resources Utility New York rate determination in effect as of January 1, 2008 ROE 9.1% Weather Normalization and Revenue Decoupling |

| Natural Gas ($/MMBtu) Oil ($/Bbl) At 07/24/07 $72.34 $7.826 Average $72.09 $7.994 Sept-08 $72.19 $7.939 Aug-08 $72.29 $7.866 Jul-08 $72.39 $7.768 Jun-08 $72.48 $7.678 May-08 $72.59 $7.713 Apr-08 EPS Guidance & Sensitivity * Please refer to Safe Harbor for Forward-Looking Statements in National Fuel Gas's Form 10-Q for the quarter ended March 31, 2008. The earnings guidance and sensitivity table are current as of May 1, 2008 and only consider revenue from the Exploration and Production segment's crude oil and natural gas sales. The sensitivities will become obsolete with the passage of time, changes in Seneca's production forecast, changes in basis differentials, as additional hedging contracts are entered into, and with the settling of NYMEX hedge contracts at their maturity. NYMEX Settlement Prices - -$0.03 +$0.03 - -$0.02 +$0.02 Decrease Decrease Increase $5 change per Bbl Oil $1 change per MMBtu Gas Fiscal 2008 NFG & Subsidiaries |

| 2002 2003 2004 2005 2006 2007 6 Mos. End 3/31/2008 CFPS 1.18 4 5.27 3.73 5.48 4.62 3.58 6 Mo. End 3/31/08 3.24 Fiscal Year National Fuel Gas Company Net Cash Provided by Operating Activities per Diluted Share |
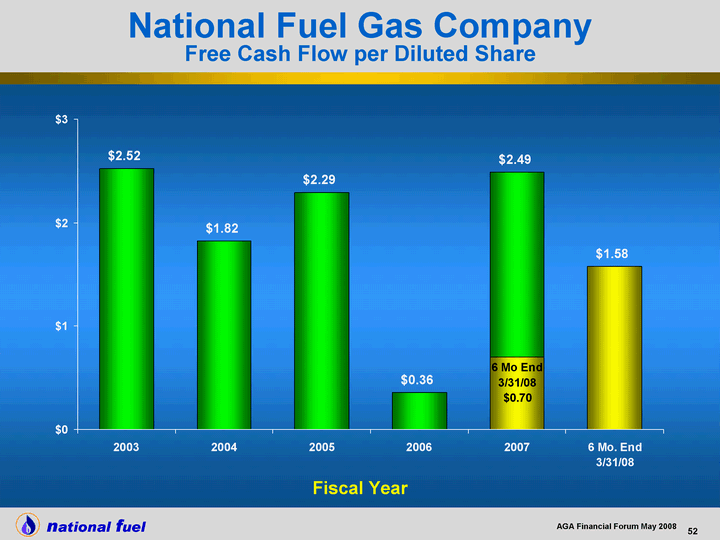
| 2002 2003 2004 2005 2006 2007 6 Mo. End 3/31/08 CFPS 1.18 2.52 1.82 2.29 0.36 2.49 1.58 6 Mo. End 3/31/08 0.7 Fiscal Year National Fuel Gas Company Free Cash Flow per Diluted Share |
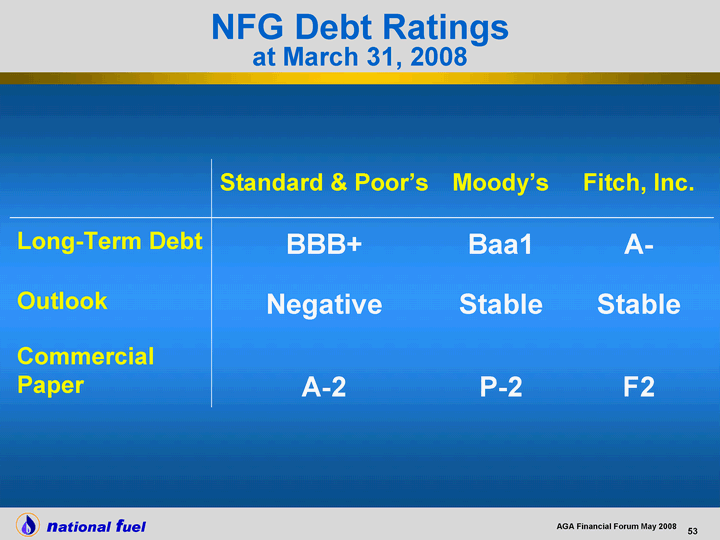
| Standard & Poor's Moody's Fitch, Inc. Long-Term Debt BBB+ Baa1 A- Outlook Negative Stable Stable Commercial Paper A-2 P-2 F2 NFG Debt Ratings at March 31, 2008 |
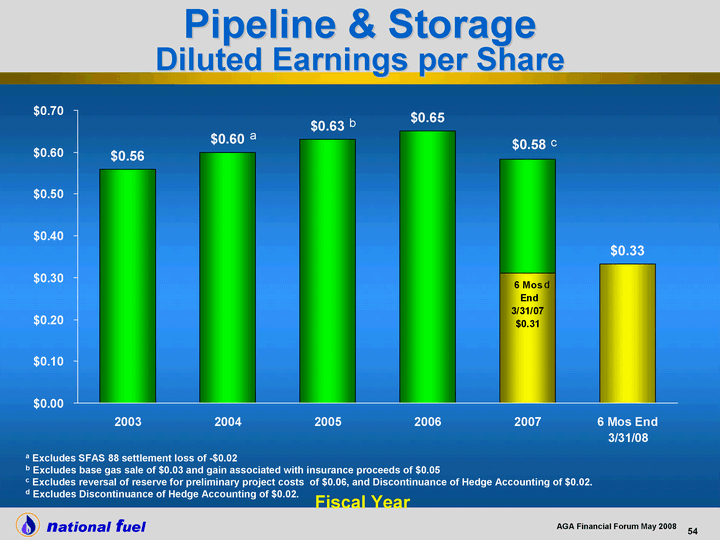
| Fiscal Year 2002 2003 2004 2005 2006 2007 6 Mos End 3/31/08 Earnings 0.49 0.56 0.599 0.63 0.65 0.583 0.332 6 Mos End 3/31/07 0.31 a Excludes SFAS 88 settlement loss of -$0.02 b Excludes base gas sale of $0.03 and gain associated with insurance proceeds of $0.05 c Excludes reversal of reserve for preliminary project costs of $0.06, and Discontinuance of Hedge Accounting of $0.02. d Excludes Discontinuance of Hedge Accounting of $0.02. a Fiscal Year Pipeline & Storage Diluted Earnings per Share b c d |
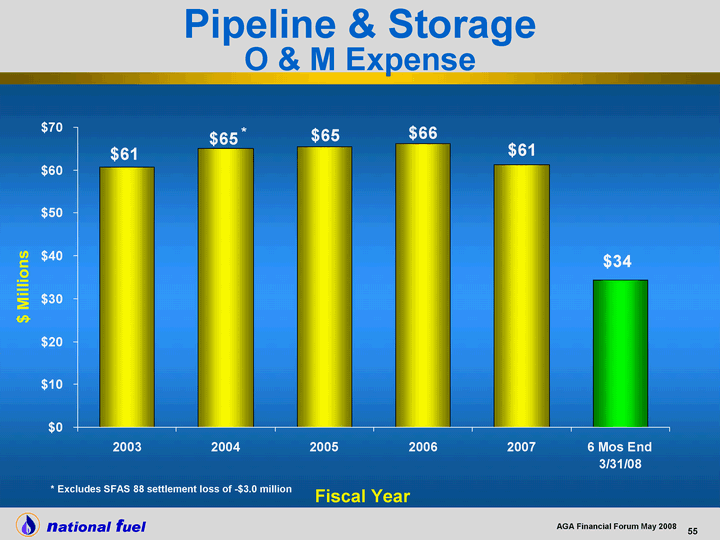
| 2002 2003 2004 2005 2006 2007 6 Mos End 3/31/08 61.3 60.7 65.1 65.4 66.3 61.2 34.4 * Excludes SFAS 88 settlement loss of -$3.0 million * Pipeline & Storage O & M Expense $ Millions Fiscal Year |
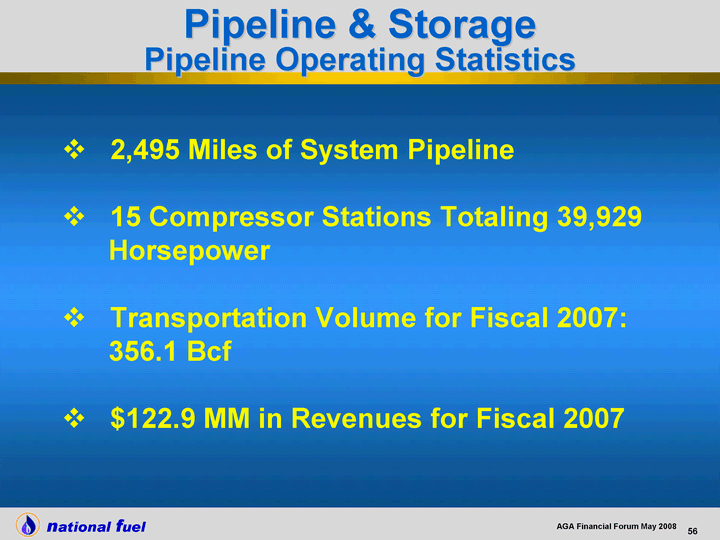
| 2,495 Miles of System Pipeline 15 Compressor Stations Totaling 39,929 Horsepower Transportation Volume for Fiscal 2007: 356.1 Bcf $122.9 MM in Revenues for Fiscal 2007 Pipeline & Storage Pipeline Operating Statistics |
| 32 Underground Natural Gas Storage Fields (4 Co-owned with Nonaffiliated Companies) 15 Compressor Stations Totaling 35,475 Horsepower 78.3 Bcf of Working Storage Capacity $67.1 MM in Revenues for Fiscal 2007 Pipeline & Storage Storage Operating Statistics |
| Open Season Conducted May 2007 Initial Interest Strong 324-mile pipeline from Rockies Express (REX) terminus at Clarington, OH to Millennium Pipeline in Corning, NY Receipts from REX (~555,000 to 750,000 dth/d), Local Production, Cove Point Gas at Leidy and Corning Deliveries to Millennium and Empire at Corning Pipeline & Storage West to East Project |
| Phase I Pipeline Capacity 130,000 Dth/day 23 Miles of 24" Pipe 800 HP of Compression Receipts from NFGSC and Other Storages and Upstream Pipelines Deliveries to Millennium and Empire Capital Cost Approximately $49 Million Development Activities Contingent on Market Pipeline & Storage Tuscarora Extension |
| Incremental storage capacity of ~ 7 Bcf No additional base gas required East Branch and Galbraith Storage Fields in western Pennsylvania Assessment ongoing Pipeline & Storage Storage Expansion Project |
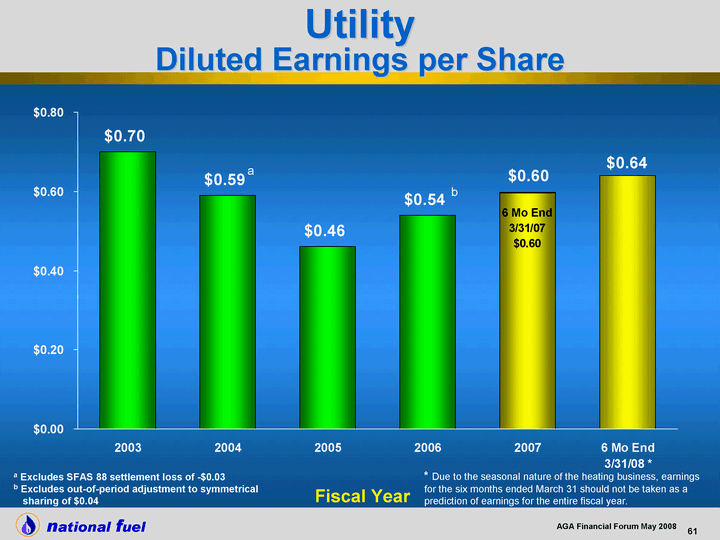
| Fiscal Year 2002 2003 2004 2005 2006 2007 6 Mo End 3/31/08 * Earnings 0.62 0.7 0.59 0.46 0.54 0.597 0.64 6 Mos End 3/31/07 0.596 a Excludes SFAS 88 settlement loss of -$0.03 b Excludes out-of-period adjustment to symmetrical sharing of $0.04 a Fiscal Year Utility Diluted Earnings per Share b * Due to the seasonal nature of the heating business, earnings for the six months ended March 31 should not be taken as a prediction of earnings for the entire fiscal year. |
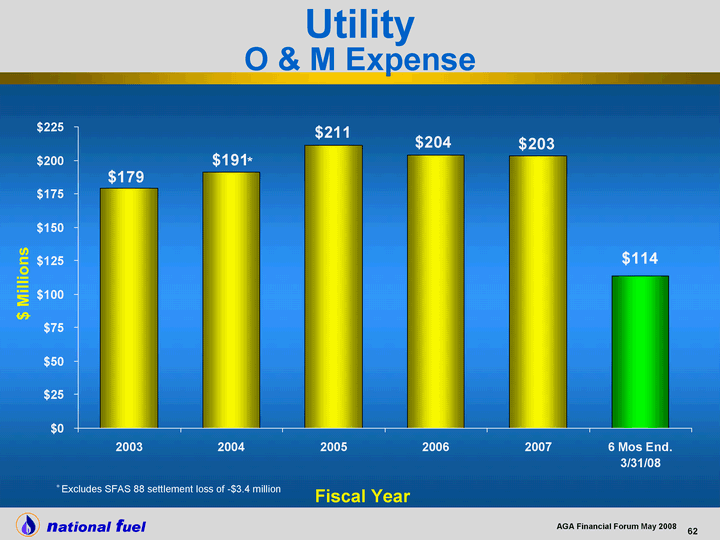
| 2002 2003 2004 2005 2006 2007 6 Mos End. 3/31/08 Utility 169 179 191 211 204 203 113.8 * Excludes SFAS 88 settlement loss of -$3.4 million Fiscal Year $ Millions * Utility O & M Expense |
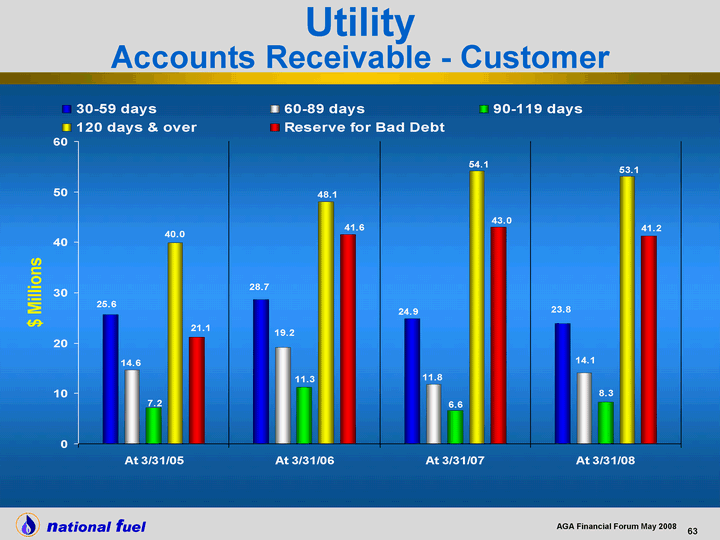
| At 3/31/05 At 3/31/06 At 3/31/07 At 3/31/08 30-59 days 25.6 28.69 24.87 23.84 60-89 days 14.6 19.19 11.83 14.09 90-119 days 7.15 11.26 6.64 8.3 120 days & over 39.95 48.08 54.14 53.09 Reserve for Bad Debt 21.13 41.55 43 41.2 Utility Accounts Receivable - Customer |
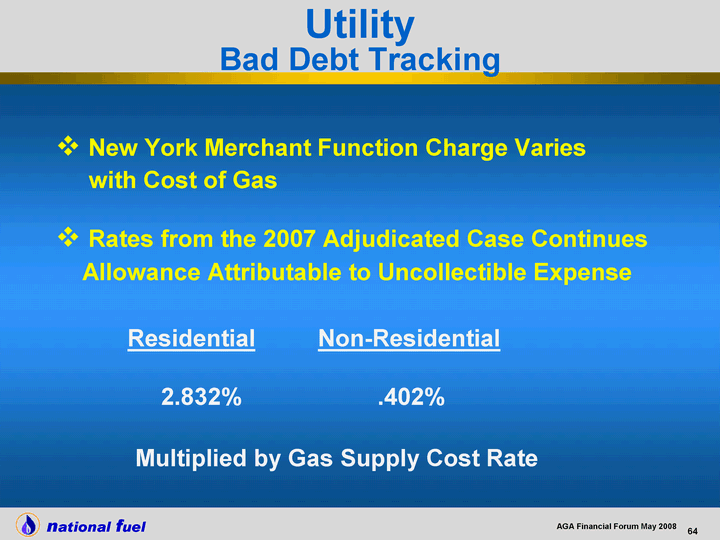
| New York Merchant Function Charge Varies with Cost of Gas Rates from the 2007 Adjudicated Case Continues Allowance Attributable to Uncollectible Expense Residential Non-Residential 2.832% .402% Multiplied by Gas Supply Cost Rate Utility Bad Debt Tracking |
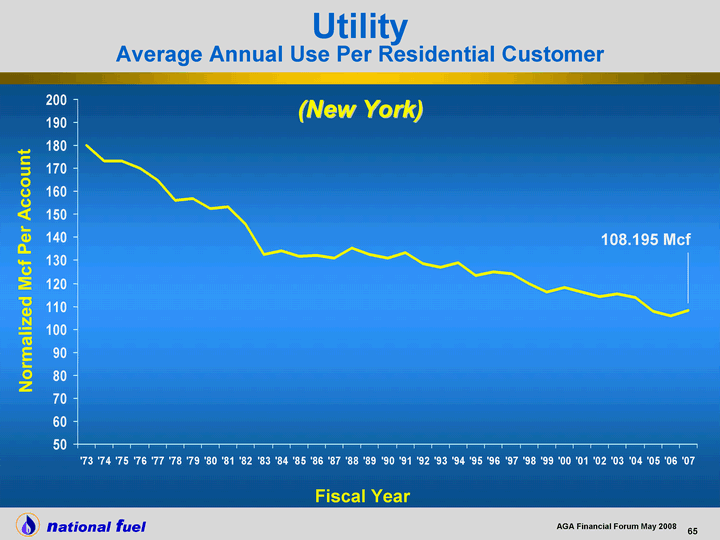
| Fiscal Year Utility Average Annual Use Per Residential Customer Normalized Mcf Per Account '73 '74 '75 '76 '77 '78 '79 '80 '81 '82 '83 '84 '85 '86 '87 '88 '89 '90 '91 '92 '93 '94 '95 '96 '97 '98 '99 '00 '01 '02 '03 '04 '05 '06 '07 180.205 173.305 173.431 170.237 164.955 156.044 156.898 152.605 153.207 145.597 132.388 134.153 131.672 132.194 131.12 135.531 132.77 130.829 133.551 128.393 127.036 128.857 123.223 124.975 124.137 119.631 116.131 118.369 116.198 114.23 115.603 113.854 107.928 105.861 108.195 108.195 Mcf (New York) |
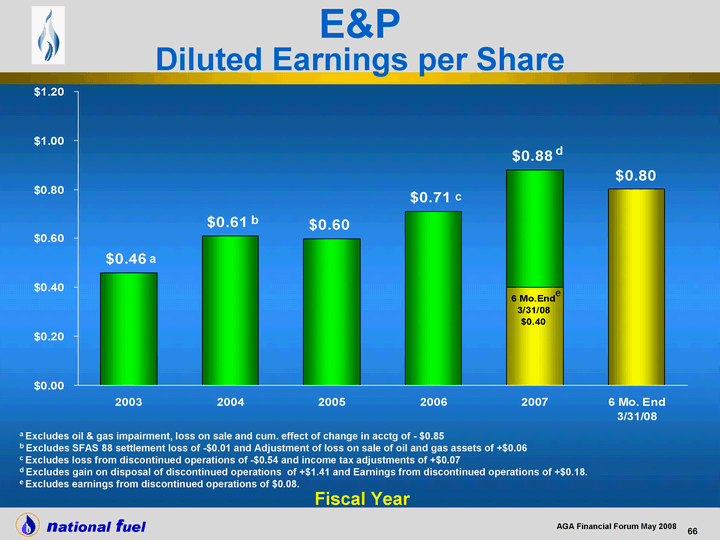
| Fiscal Year 2002 2003 2004 2005 2006 2007 6 Mo. End 3/31/08 Earnings 0.33 0.46 0.61 0.6 0.71 0.88 0.801 6 Mo. End 3/31/08 0.4 a b a Excludes oil & gas impairment, loss on sale and cum. effect of change in acctg of - $0.85 b Excludes SFAS 88 settlement loss of -$0.01 and Adjustment of loss on sale of oil and gas assets of +$0.06 c Excludes loss from discontinued operations of -$0.54 and income tax adjustments of +$0.07 d Excludes gain on disposal of discontinued operations of +$1.41 and Earnings from discontinued operations of +$0.18. e Excludes earnings from discontinued operations of $0.08. Fiscal Year c d E&P Diluted Earnings per Share e |
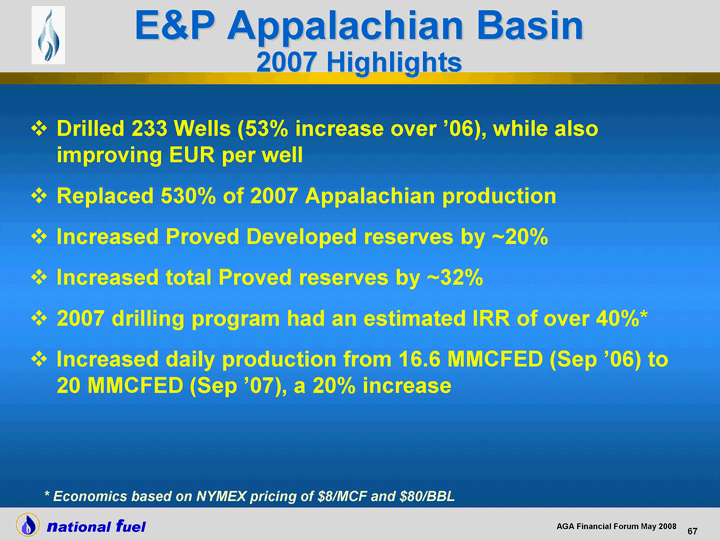
| Drilled 233 Wells (53% increase over '06), while also improving EUR per well Replaced 530% of 2007 Appalachian production Increased Proved Developed reserves by ~20% Increased total Proved reserves by ~32% 2007 drilling program had an estimated IRR of over 40%* Increased daily production from 16.6 MMCFED (Sep '06) to 20 MMCFED (Sep '07), a 20% increase E&P Appalachian Basin 2007 Highlights * Economics based on NYMEX pricing of $8/MCF and $80/BBL |
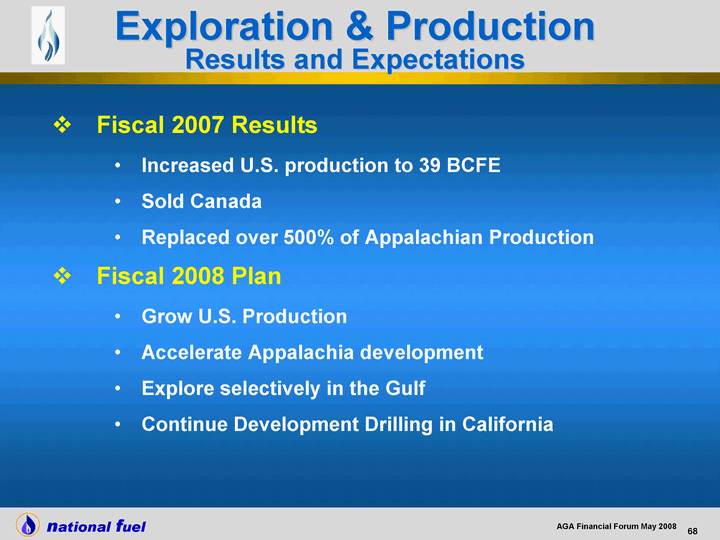
| Fiscal 2007 Results Increased U.S. production to 39 BCFE Sold Canada Replaced over 500% of Appalachian Production Fiscal 2008 Plan Grow U.S. Production Accelerate Appalachia development Explore selectively in the Gulf Continue Development Drilling in California Exploration & Production Results and Expectations |
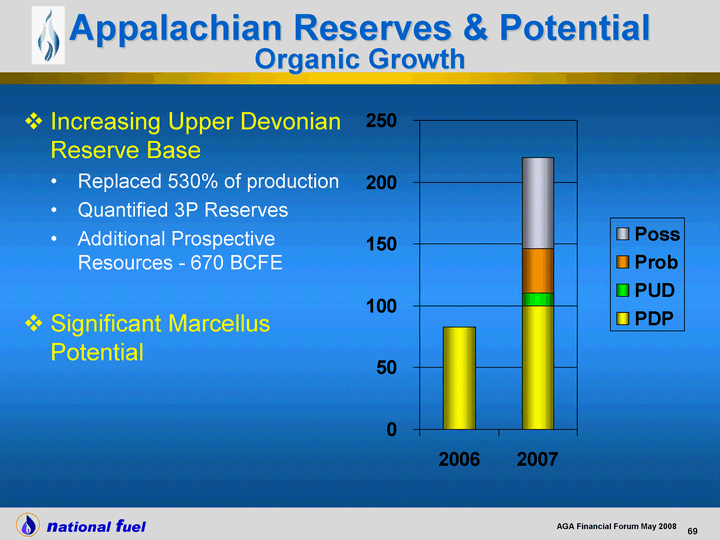
| Increasing Upper Devonian Reserve Base Replaced 530% of production Quantified 3P Reserves Additional Prospective Resources - 670 BCFE Significant Marcellus Potential 9/30/2006 9/30/2007 PDP 83 99.6 PUD 0 10.4 Prob 0 36.5 Poss 73.8 Appalachian Reserves & Potential Organic Growth |
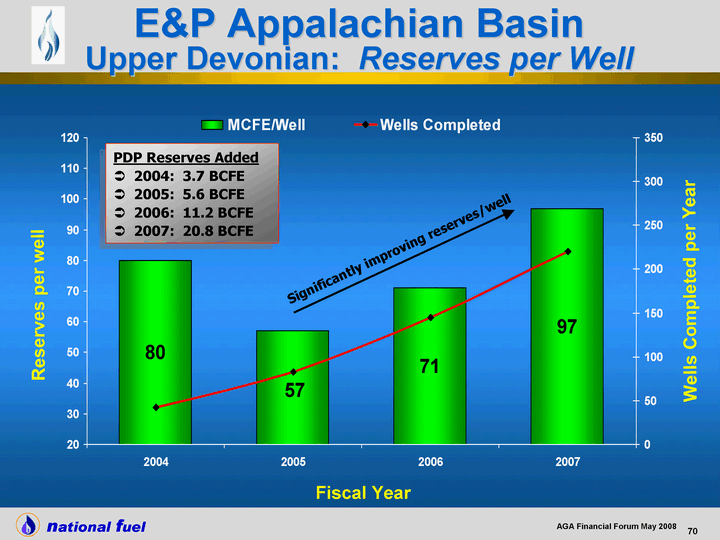
| Significantly improving reserves/well Fiscal Year 2004 2005 2006 2007 MCFE/Well 80 57 71 97 Wells Completed 42 83 145 220 Reserves per well Wells Completed per Year PDP Reserves Added 2004: 3.7 BCFE 2005: 5.6 BCFE 2006: 11.2 BCFE 2007: 20.8 BCFE E&P Appalachian Basin Upper Devonian: Reserves per Well |
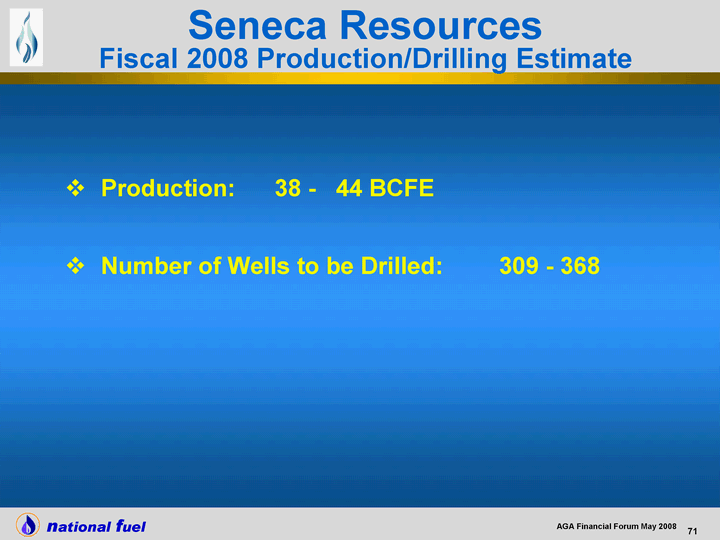
| Production: 38 - 44 BCFE Number of Wells to be Drilled: 309 - 368 Seneca Resources Fiscal 2008 Production/Drilling Estimate |

| Seneca Resources Hedging Summary SWAPS Volume Average Hedge Price Fiscal 2008 (6 Mos. Remaining) Oil 0.8 MMBBL $65.72 / BBL Gas 7.7 BCF $8.54 / MCF Fiscal 2009 Oil 0.9 MMBBL $72.39 / BBL Gas 9.4 BCF $9.30 / MCF Fiscal 2010 Oil 0.2 MMBBL $84.00 / BBL |
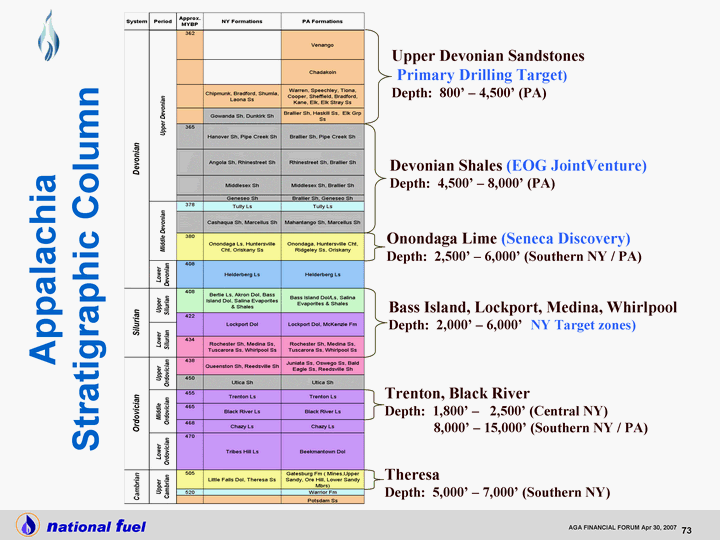
| Appalachia Stratigraphic Column Exploration & Production Devonian Shales (EOG JointVenture) Depth: 4,500' - 8,000' (PA) Bass Island, Lockport, Medina, Whirlpool Depth: 2,000' - 6,000' (NY Target zones) Upper Devonian Sandstones (Primary Drilling Target) Depth: 800' - 4,500' (PA) Onondaga Lime (Seneca Discovery) Depth: 2,500' - 6,000' (Southern NY / PA) Trenton, Black River Depth: 1,800' - 2,500' (Central NY) 8,000' - 15,000' (Southern NY / PA) Theresa Depth: 5,000' - 7,000' (Southern NY) national fuel 145 AGA FINANCIAL FORUM Apr 30, 2007 |
| This presentation contains certain non-GAAP financial measures. For pages that contain non-GAAP financial measures, pages containing the most directly comparable GAAP financial measures and reconciliations are provided in the slides that follow. The Company believes that its non-GAAP financial measures are useful to investors because they provide an alternative method for assessing the Company's operating results in a manner that is focused on the performance of the Company's ongoing operations. The Company's management uses these non-GAAP financial measures for the same purpose, and for planning and forecasting purposes. The presentation of non-GAAP financial measures is not meant to be a substitute for financial measures prepared in accordance with GAAP. Comparable GAAP Financial Measure Slides and Reconciliations |

| 2002 2003 2004 2005 2006 2007 6 Mos End 3/31/08 Pipeline & Storage 0.37 0.56 0.58 0.71 0.65 0.66 0.33 All Other Segments 1.09 1.64 1.43 1.52 0.96 3.3 1.603 $2.20 $2.01 $2.23 Fiscal Year Pipeline & Storage vs. Consolidated NFG Diluted Earnings per Share $1.61 $3.96 $1.93 |
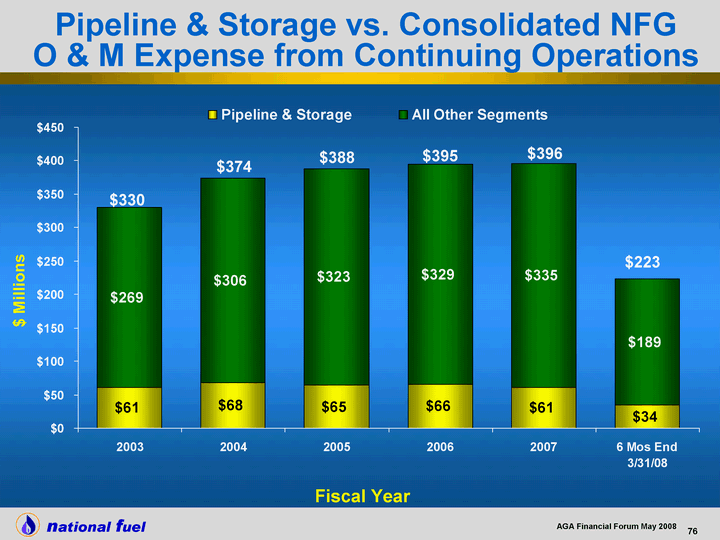
| 2002 2003 2004 2005 2006 2007 6 Mos End 3/31/08 Pipeline & Storage 61 61 68 65 66 61 34 All Other Segments 333 269 306 323 329 335 189 Fiscal Year $ Millions Pipeline & Storage vs. Consolidated NFG O & M Expense from Continuing Operations $330 $374 $388 $395 $396 $223 |
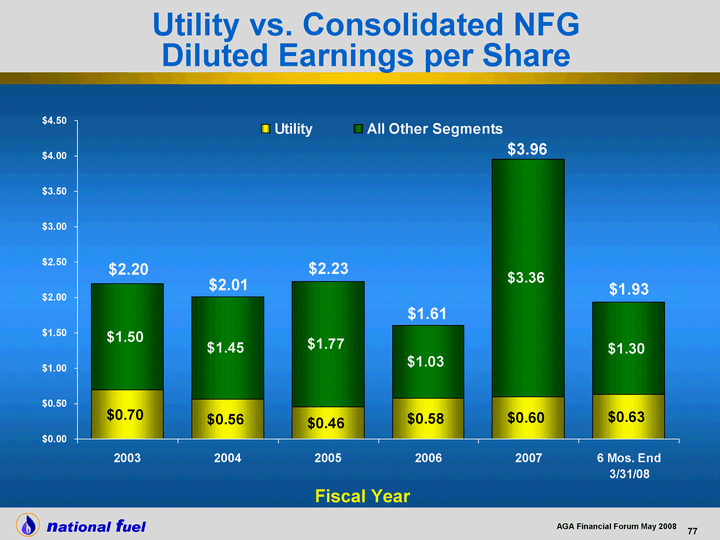
| 2002 2003 2004 2005 2006 2007 6 Mos. End 3/31/08 Utility 0.62 0.7 0.56 0.46 0.58 0.6 0.63 All Other Segments 0.84 1.5 1.45 1.77 1.03 3.36 1.3 $2.20 $2.01 $2.23 Fiscal Year Utility vs. Consolidated NFG Diluted Earnings per Share $1.61 $3.96 $1.93 |
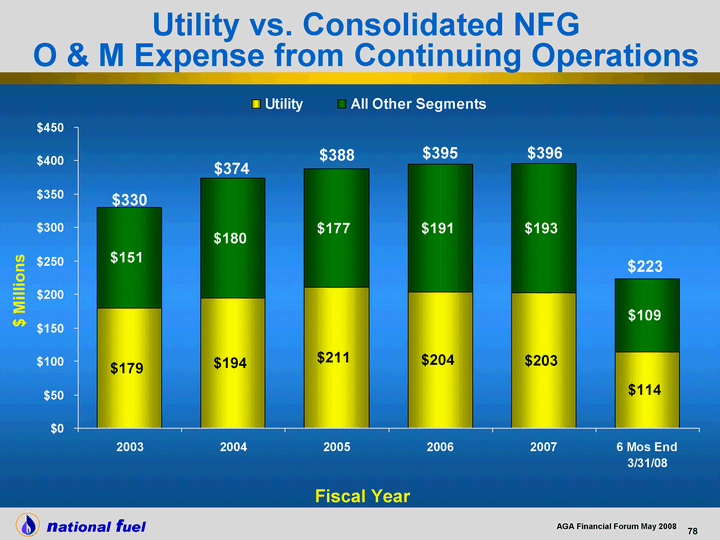
| 2002 2003 2004 2005 2006 2007 6 Mos End 3/31/08 Utility 169 179 194 211 204 203 114 All Other Segments 225 151 180 177 191 193 109 Fiscal Year $ Millions Utility vs. Consolidated NFG O & M Expense from Continuing Operations $330 $374 $388 $395 $396 $223 |
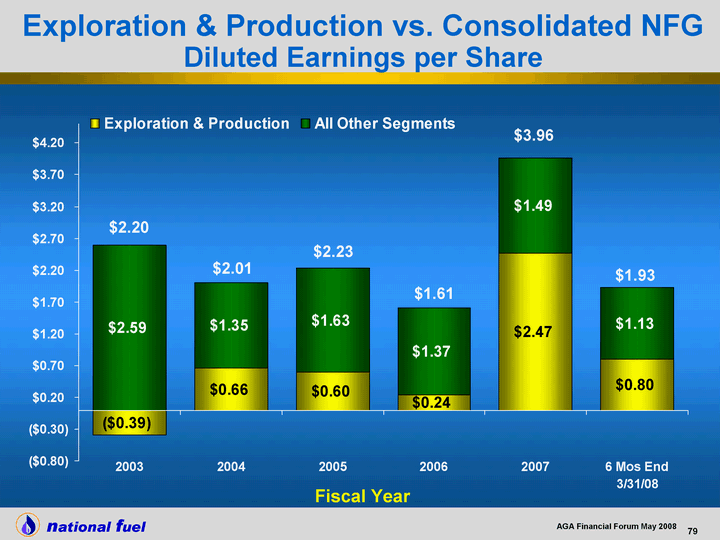
| 2002 2003 2004 2005 2006 2007 6 Mos End 3/31/08 Exploration & Production 0.33 -0.39 0.66 0.6 0.24 2.47 0.8 All Other Segments 1.13 2.59 1.35 1.63 1.37 1.49 1.13 $2.20 $2.01 $2.23 Fiscal Year Exploration & Production vs. Consolidated NFG Diluted Earnings per Share $1.61 $3.96 $1.93 |
Reconciliation of Segment Net Income to
Consolidated Net Income
(‘000)
| | | | | | | | | |
| | | 12 Mos Ended 03/31/08 | |
| Utility | | | | | | $ | 54,649 | |
| | | | | | | | | |
| Pipeline & Storage | | $ | 52,372 | | | | | |
| Plus: Reversal of reserve for preliminary project costs | | | 4,787 | | | | 57,159 | |
| | | | | | | | |
| | | | | | | | | |
| Exploration & Production | | $ | 109,759 | | | | | |
| Plus: Gain on disposal of discontinued operations. | | | 120,301 | | | | | |
| Earnings from discontinued operations | | | 8,680 | | | | 238,740 | |
| | | | | | | | |
| | | | | | | | | |
| Energy Marketing | | | | | | | 7,067 | |
| | | | | | | | | |
| Timber | | | | | | | 4,591 | |
| | | | | | | | | |
| Corporate & Other | | $ | 7,304 | | | | | |
| Plus: Gain on sale of turbine | | | 586 | | | $ | 7,890 | |
| | | | | | | | |
| | | | | | | | | |
| Consolidated Net Income | | | | | | $ | 370,096 | |
| | | | | | | | |
NATIONAL FUEL GAS COMPANY
AND SUBSIDIARIES
RECONCILIATION TO REPORTED EARNINGS
| | | | | | | | | | | | | | | | | | | | | | | | | |
| | | Fiscal Year | | Fiscal Year | | Fiscal Year | | Fiscal Year | | Fiscal Year | | 6 Months |
| | | Ended | | Ended | | Ended | | Ended | | Ended | | Ended |
| (Diluted Earnings Per Share) | | September 30, 2003 | | September 30, 2004 | | September 30, 2005 | | September 30, 2006 | | September 30, 2007 | | March 31, 2008 |
| | | |
Utility | | | | | | | | | | | | | | | | | | | | | | | | |
| Reported earnings | | $ | 0.70 | | | $ | 0.56 | | | $ | 0.46 | | | $ | 0.58 | | | $ | 0.60 | | | $ | 0.64 | |
| Out-of-period adjustment to symmetical sharing | | | — | | | | — | | | | — | | | | (0.03 | ) | | | — | | | | — | |
| Pension settlement loss | | | — | | | | 0.03 | | | | — | | | | — | | | | — | | | | — | |
| | | |
| Earnings before non-recurring items | | | 0.70 | | | | 0.59 | | | | 0.46 | | | | 0.55 | | | | 0.60 | | | | 0.64 | |
| | | |
| | | | | | | | | | | | | | | | | | | | | | | | | |
Pipeline and Storage | | | | | | | | | | | | | | | | | | | | | | | | |
| Reported earnings | | | 0.56 | | | | 0.58 | | | | 0.71 | | | | 0.65 | | | | 0.66 | | | | 0.33 | |
| Reversal of reserve for preliminary project costs | | | — | | | | — | | | | — | | | | — | | | | (0.06 | ) | | | — | |
| Discontinuance of hedge accounting | | | — | | | | — | | | | — | | | | — | | | | (0.02 | ) | | | — | |
| Pension settlement loss | | | — | | | | 0.02 | | | | — | | | | — | | | | — | | | | — | |
| Gain associated with insurance proceeds | | | — | | | | — | | | | (0.05 | ) | | | — | | | | — | | | | — | |
| Base gas sale | | | | | | | | | | | (0.03 | ) | | | — | | | | — | | | | — | |
| | | |
| Earnings before non-recurring items | | | 0.56 | | | | 0.60 | | | | 0.63 | | | | 0.65 | | | | 0.58 | | | | 0.33 | |
| | | |
| | | | | | | | | | | | | | | | | | | | | | | | | |
Exploration and Production | | | | | | | | | | | | | | | | | | | | | | | | |
| Reported earnings | | | (0.39 | ) | | | 0.66 | | | | 0.60 | | | | 0.24 | | | | 2.47 | | | | 0.80 | |
| Gain on disposal of discontinued operations | | | — | | | | — | | | | — | | | | — | | | | (1.41 | ) | | | — | |
| (Earnings)/Loss from discontinued operations | | | — | | | | — | | | | — | | | | 0.54 | | | | (0.18 | ) | | | — | |
| Income tax adjustments | | | — | | | | — | | | | — | | | | (0.07 | ) | | | — | | | | — | |
| Loss on sale of oil and gas assets | | | 0.48 | | | | — | | | | — | | | | — | | | | — | | | | — | |
| Impairment of oil and gas producing properties | | | 0.36 | | | | — | | | | — | | | | — | | | | — | | | | — | |
| Cumulative Effect of Change in Accounting | | | 0.01 | | | | — | | | | — | | | | — | | | | — | | | | — | |
| Adjustment of loss on sale of oil and gas assets | | | — | | | | (0.06 | ) | | | — | | | | — | | | | — | | | | — | |
| Pension settlement loss | | | — | | | | 0.01 | | | | — | | | | — | | | | — | | | | — | |
| | | |
| Earnings before non-recurring items | | | 0.46 | | | | 0.61 | | | | 0.60 | | | | 0.71 | | | | 0.88 | | | | 0.80 | |
| | | |
| | | | | | | | | | | | | | | | | | | | | | | | | |
International | | | | | | | | | | | | | | | | | | | | | | | | |
| Reported earnings | | | (0.12 | ) | | | 0.07 | | | | | | | | | | | | | | | | | |
| Cumulative Effect of Change in Accounting | | | 0.10 | | | | — | | | see | | | | | | | | | | | | |
| Pension settlement loss | | | — | | | | — | | | “Discontinued | | | | | | | | | | | | |
| Tax rate change | | | — | | | | (0.06 | ) | | Operations” | | | | | | | | | | | | |
| Repatriation tax | | | | | | | | | | below | | | | | | | | | | | | |
| | | | | | | | | | | | | | | | | | | |
| Earnings before non-recurring items | | | (0.02 | ) | | | 0.01 | | | | | | | | | | | | | | | | | |
| | | | | | | | | | | | | | | | | | | |
| | | | | | | | | | | | | | | | | | | | | | | | | |
Energy Marketing | | | | | | | | | | | | | | | | | | | | | | | | |
| Reported earnings | | | 0.07 | | | | 0.07 | | | | 0.06 | | | | 0.07 | | | | 0.09 | | | | 0.07 | |
| Resolution of a purchased gas contingency | | | — | | | | — | | | | — | | | | — | | | | (0.03 | ) | | | — | |
| Pension settlement loss | | | — | | | | — | | | | — | | | | — | | | | — | | | | — | |
| | | |
| Earnings before non-recurring items | | | 0.07 | | | | 0.07 | | | | 0.06 | | | | 0.07 | | | | 0.06 | | | | 0.07 | |
| | | |
| | | | | | | | | | | | | | | | | | | | | | | | | |
Timber | | | | | | | | | | | | | | | | | | | | | | | | |
| Reported earnings | | | 1.38 | | | | 0.06 | | | | 0.06 | | | | 0.07 | | | | 0.04 | | | | 0.05 | |
| Gain on sale of timber assets | | | (1.26 | ) | | | — | | | | — | | | | — | | | | — | | | | — | |
| Pension settlement loss | | | — | | | | — | | | | — | | | | — | | | | — | | | | — | |
| Adjustment of gain on sale of timber properties | | | — | | | | 0.01 | | | | — | | | | — | | | | — | | | | — | |
| | | |
| Earnings before non-recurring items | | | 0.12 | | | | 0.07 | | | | 0.06 | | | | 0.07 | | | | 0.04 | | | | 0.05 | |
| | | |
| | | | | | | | | | | | | | | | | | | | | | | | | |
Corporate and All Other | | | | | | | | | | | | | | | | | | | | | | | | |
| Reported earnings | | | — | | | | 0.01 | | | | (0.08 | ) | | | — | | | | 0.10 | | | | 0.04 | |
| Pension settlement loss | | | — | | | | 0.02 | | | | — | | | | — | | | | — | | | | — | |
| Gain on sale of turbine | | | — | | | | — | | | | — | | | | — | | | | — | | | | (0.01 | ) |
| | | |
| Earnings before non-recurring items | | | — | | | | 0.03 | | | | (0.08 | ) | | | — | | | | 0.10 | | | | 0.03 | |
| | | |
| | | | | | | | | | | | | | | | | | | | | | | | | |
Consolidated | | | | | | | | | | | | | | | | | | | | | | | | |
| Reported earnings | | | 2.20 | | | | 2.01 | | | | | | | | | | | | | | | | | |
| Total non-recurring items from above | | | (0.31 | ) | | | (0.03 | ) | | | | | | | | | | | | | | | | |
| | | | | | | | | | | | | | | | | | | |
| Earnings before non-recurring items | | $ | 1.89 | | | $ | 1.98 | | | | | | | | | | | | | | | | | |
| | | | | | | | | | | | | | | | | | | |
| | | | | | | | | | | | | | | | | | | | | | | | | |
Consolidated Earnings from Continuing Operations | | | | | | | | | | | | | | | | | | | | | | | | |
| Reported earnings from continuing operations | | | | | | | | | | | 1.81 | | | | 1.61 | | | | 3.96 | | | | 1.93 | |
| Total non-recurring items from above | | | | | | | | | | | (0.08 | ) | | | (0.10 | ) | | | (1.70 | ) | | | (0.01 | ) |
| | | | | | | | | | | |
| Earnings from continuing operations before non-recurring items | | | | | | | | | | $ | 1.73 | | | $ | 1.51 | | | $ | 2.26 | | | $ | 1.92 | |
| | | | | | | | | | | |
| | | | | | | | | | | | | | | | | | | | | | | | | |
Discontinued Operations | | | | | | | | | | | | | | | | | | | | | | | | |
| Reported earnings from discontinued operations | | | | | | | | | | | 0.42 | | | | | | | | | | | | | |
| | | | | | | | | | | | | | | | | | | | | | | | |
| | | | | | | | | | | | | | | | | | | | | | | | | |
Consolidated | | | | | | | | | | | | | | | | | | | | | | | | |
| Reported earnings | | | | | | | | | | $ | 2.23 | | | $ | 1.61 | | | $ | 3.96 | | | $ | 1.93 | |
| | | | | | | | | | | |
Reconciliation of Pipeline & Storage Operating Revenues to
Consolidated Operating Revenues Fiscal 2007
($Millions)
| | | | | |
| Pipeline Revenues | | $ | 122.9 | |
| Storage Revenues | | $ | 67.1 | |
| Other Revenues | | $ | 21.9 | |
| | | | |
| Total Pipeline & Storage Revenues | | $ | 211.9 | |
| All Other Segments | | $ | 1,827.7 | |
| | | | |
| Total Corporation | | $ | 2,039.6 | |
| | | | |
Reconciliation of Pipeline & Storage O&M Expense to
Consolidated O&M Expense (From Continuing Operations)
($000s)
| | | | | | | | | | | | | | | | | | | | | | | | | |
| | | | | | | | | | | | | | | | | | | | | | | 6 Mos. End |
| | | 2003 | | 2004 | | 2005 | | 2006 | | 2007 | | 3/31/08 |
| | | |
| Pipeline & Storage | | $ | 61,286 | | | $ | 65,071 | | | $ | 65,397 | | | $ | 66,340 | | | $ | 61,230 | | | $ | 34,415 | |
| SFAS 88 Pension Settlement | | | — | | | | 3,026 | | | | — | | | | — | | | | — | | | | — | |
| All Other Segments | | | 269,030 | | | | 305,913 | | | | 322,697 | | | | 328,949 | | | | 335,178 | | | | 188,625 | |
| | | |
| Total Corporation | | $ | 330,316 | | | $ | 374,010 | | | $ | 388,094 | | | $ | 395,289 | | | $ | 396,408 | | | $ | 223,040 | |
| | | |
Reconciliation of Utility Segment O&M Expense to
Consolidated O&M Expense (From Continuing Operations)
($000s)
| | | | | | | | | | | | | | | | | | | | | | | | | |
| | | | | | | | | | | | | | | | | | | | | | | 6 Mos. End |
| | | 2003 | | 2004 | | 2005 | | 2006 | | 2007 | | 3/31/08 |
| | | |
| Utility Segment | | $ | 179,052 | | | $ | 190,669 | | | $ | 211,019 | | | $ | 204,330 | | | $ | 202,965 | | | $ | 113,778 | |
| SFAS 88 Pension Settlement | | | — | | | | 3,374 | | | | — | | | | — | | | | — | | | | — | |
| All Other Segments | | | 151,264 | | | | 179,967 | | | | 177,075 | | | | 190,959 | | | | 193,443 | | | | 109,262 | |
| | | |
| Total Corporation | | $ | 330,316 | | | $ | 374,010 | | | $ | 388,094 | | | $ | 395,289 | | | $ | 396,408 | | | $ | 223,040 | |
| | | |
Reconciliation of Utility Segment Aged Accounts Receivable to
Consolidated Accounts Receivable — Net
($Millions)
| | | | | | | | | | | | | | | | | |
| | | at 3/31/05 | | at 3/31/06 | | at 3/31/07 | | at 3/31/08 |
| | | |
| Utility Aged Accounts Receivable | | $ | 87.30 | | | $ | 107.20 | | | $ | 97.50 | | | $ | 99.3 | |
| Utility Current/Other Accounts Receivable | | $ | 170.00 | | | $ | 193.50 | | | $ | 178.00 | | | $ | 201.8 | |
| | | | | | | | | | | | | | | | |
| Utility Gross Accounts Receivable | | $ | 257.30 | | | $ | 300.70 | | | $ | 275.50 | | | $ | 301.1 | |
| Utility Reserve for Bad Debt | | $ | (21.10 | ) | | $ | (41.60 | ) | | $ | (43.00 | ) | | $ | (41.2 | ) |
| | | |
| Utility Net Accounts Receivable | | $ | 236.20 | | | $ | 259.10 | | | $ | 232.50 | | | $ | 259.9 | |
| | | |
| All Other Segments Gross Accounts Receivable | | $ | 85.90 | | | $ | 100.80 | | | $ | 104.70 | | | $ | 105.5 | |
| All Other Segments Reserve for Bad Debts | | $ | (4.30 | ) | | $ | (1.90 | ) | | $ | (1.50 | ) | | $ | (1.5 | ) |
| | | |
| All Other Segments Net Accounts Receivable | | $ | 81.60 | | | $ | 98.90 | | | $ | 103.20 | | | $ | 104.0 | |
| | | |
| Total Corporation Accounts Receivable — Net | | $ | 317.80 | | | $ | 358.00 | | | $ | 335.70 | | | $ | 363.9 | |
| | | |
Reconciliation of National Fuel Gas Expenditures for Long-lived Assets to
Consolidated Net Cash Used in Investing Activities
(‘000)
| | | | | | | | | | | | | | | | | | | | | | | | | |
| | | | | | | | | | | | | | | | | | | | | | | 6 Mos. End |
| | | 2003 | | 2004 | | 2005 | | 2006 | | 2007 | | 3/31/08 |
| | | |
| Capital Expenditures | | $ | (152,251 | ) | | $ | (172,341 | ) | | $ | (219,530 | ) | | $ | (294,159 | ) | | $ | (276,728 | ) | | $ | (144,707 | ) |
| Investment in Subsidiaries, Net of Cash | | | (228,814 | ) | | $ | — | | | $ | — | | | $ | — | | | $ | — | | | $ | — | |
| Investment in Partnerships | | $ | (375 | ) | | $ | — | | | $ | — | | | $ | — | | | $ | (3,300 | ) | | $ | — | |
| | | | | | | |
| Expenditures for Long Lived Assets | | $ | (381,440 | ) | | $ | (172,341 | ) | | $ | (219,530 | ) | | $ | (294,159 | ) | | $ | (280,028 | ) | | $ | (144,707 | ) |
| | | | | | | | | | | | | | | | | | | | | | | | | |
| Expenditures for Long Lived Assets | | $ | (381,440 | ) | | $ | (172,341 | ) | | $ | (219,530 | ) | | $ | (294,159 | ) | | $ | (280,028 | ) | | $ | (144,707 | ) |
| Net Proceeds from Sale of Foreign Subsidiary | | $ | — | | | $ | — | | | $ | 111,619 | | | $ | — | | | $ | 232,092 | | | $ | — | |
| Cash Held in Escrow | | | | | | | | | | | | | | | | | | $ | (58,248 | ) | | $ | 58,397 | |
| Net Proceeds from Sale of Timber Properties | | $ | 186,014 | | | $ | — | | | $ | — | | | $ | — | | | $ | — | | | $ | — | |
| Net Proceeds from Sale of Oil and Gas Producing Properties | | $ | 78,531 | | | $ | 7,162 | | | $ | 1,349 | | | $ | 13 | | | $ | 5,137 | | | $ | 2,313 | |
| Other | | $ | 12,065 | | | $ | 1,974 | | | $ | 3,238 | | | $ | (3,230 | ) | | $ | (725 | ) | | $ | 1,557 | |
| | | |
| Net Cash Used in Investing Activities | | $ | (104,830 | ) | | $ | (163,205 | ) | | $ | (103,324 | ) | | $ | (297,376 | ) | | $ | (101,772 | ) | | $ | (82,440 | ) |
| | | |
Reconciliation of Exploration & Production Segment Capital Expenditures to
Consolidated Capital Expenditures
($000s)
| | | | | | | | | | | | | |
| | | 2006 | | 2007 | | 2008E |
| | | |
| Exploration & Production Capital Expenditures | | $ | 166,535 | | | $ | 146,687 | | | $ | 177,000 | |
| Acquisition Expenditures | | $ | — | | | $ | 0 | | | $ | 18,000 | |
| Expenditures from Discontinued Operations | | $ | 41,768 | | | | 29,129 | | | | — | |
| | | |
| Total Exploration & Production Capital Expenditures | | $ | 208,303 | | | $ | 175,816 | | | $ | 195,000 | |
| All Other | | | 85,856 | | | $ | 100,912 | | | $ | 184,000-$192,000 | |
| | | |
| Total Corporation | | $ | 294,159 | | | $ | 276,728 | | | $ | 379,000-$387,000 | |
| | | |
Reconciliation of Exploration & Production Operating Revenue to
Consolidated Operating Revenue (from Continuing Operations)
($000s)
| | | | | |
| | | 2007 | |
| Exploration & Production | | $ | 324,037 | |
| All Other Segments | | | 1,715,529 | |
| | | | |
| Consolidated Operating Revenue | | $ | 2,039,566 | |
| | | | |
Reconciliation of Exploration & Production Net Income to
Consolidated Net Income
($000s)
| | | | | |
| | | 2007 | |
| Exploration & Production (Income from Continuing Operations) | | $ | 74,889 | |
| Income from Discontinued Operations, Net of Tax | | | 15,479 | |
| Gain on Disposal of Discontinued Operations, Net of Tax | | | 120,301 | |
| | | | |
| Total Exploration & Production | | $ | 210,669 | |
| All Other Segments | | | 126,786 | |
| | | | |
| Consolidated Net Income | | $ | 337,455 | |
| | | | |
Reconciliation of Exploration & Production Lease Operating Expense (LOE) to
Consolidated O&M (from Continuing Operations)
($000s)
| | | | | |
| | | 2007 | |
Exploration & Production LOE | | $ | 43,916 | |
Exploration & Production Property, Franchise and Other Taxes | | | 4,493 | |
| | | | |
| Exploration & Production Total LOE * | | $ | 48,409 | |
| | | | |
| | | | | |
Exploration & Production LOE | | $ | 43,916 | |
| Exploration & Production Other O&M | | | 28,324 | |
| | | | |
| Exploration & Production Total O&M | | $ | 72,240 | |
| All Other Segments O&M | | | 324,168 | |
| | | | |
| Total Consolidated O&M | | $ | 396,408 | |
| | | | |
| | | | | |
Exploration & Production Property, Franchise and Other Taxes (from Continuing Operations) | | $ | 4,493 | |
| All Other Segments Property, Franchise and Other Taxes | | | 66,167 | |
| | | | |
| Total Consolidated Property Franchise and Other Taxes | | $ | 70,660 | |
| | | | |
Reconciliation of Exploration & Production Depreciation, Depletion and Amortization to
Consolidated Depreciation, Depletion and Amortization (DD&A)
($000s)
| | | | | |
| | | 2007 | |
| Exploration & Production DD&A * | | $ | 78,174 | |
| All Other Segments DD&A | | | 79,745 | |
| | | | |
| Consolidated DD&A | | $ | 157,919 | |
| | | | |
| | |
| * | | DD&A and Total LOE cost per Mcf equivalent equals Exploration & Production DD&A and Total LOE costs, respectively, for the referenced fiscal period, divided by the Total Gas & Oil Production (Mmcfe) in that same fiscal period. |
Reconciliation of Exploration & Production General & Administrative Costs to
Consolidated O&M (from Continuing Operations)
($000s)
| | | | | |
| | | 2007 | |
| Exploration & Production General & Administrative * | | $ | 19,946 | |
| Exploration & Production All Other O&M | | | 52,294 | |
| | | | |
| Exporation & Production Total O&M | | $ | 72,240 | |
| All Other Segments O&M | | | 324,168 | |
| | | | |
| Total Consolidated O&M | | $ | 396,408 | |
| | | | |
| | |
| * | | General and Administrative cost per Mcf equivalent equals Exploration & Production General and Administrative cost, for the referenced fiscal period, divided by the Total Gas & Oil Production (Mmcfe) in that same fiscal period. |
Free Cash Flow Per Diluted Share Calculation
and Reconciliation to Net Cash Provided by Operating Activities
($000s)
| | | | | | | | | | | | | | | | | | | | | | | | | | | | | |
| | | Fiscal Year Ended | | Fiscal Year Ended | | Fiscal Year Ended | | Fiscal Year Ended | | 6 Months Ending | | Fiscal Year Ended | | 6 Months Ending |
| | | September 30, 2003 | | September 30, 2004 | | September 30, 2005 | | September 30, 2006 | | 31-Mar-07 | | September 30, 2007 | | 31-Mar-08 |
| | | |
| Net Income | | $ | 178,944 | | | $ | 166,586 | | | $ | 189,488 | | | $ | 138,091 | | | $ | 132,967 | | | $ | 337,455 | | | $ | 165,608 | |
| DD&A | | | 195,226 | | | | 189,538 | | | | 193,144 | | | | 179,615 | | | | 84,886 | | | | 170,803 | | | | 86,533 | |
| Impairment of Oil and Gas Producing Properties | | | 42,774 | | | | — | | | | — | | | | 104,739 | | | | — | | | | — | | | | — | |
| Impairment of Investment in Partnership | | | — | | | | — | | | | 4,158 | | | | — | | | | — | | | | — | | | | — | |
| (Income) Loss from Unconsolidated Subsidiaries, Net of Cash Distributions | | | 703 | | | | (19 | ) | | | (1,372 | ) | | | 1,067 | | | | (960 | ) | | | (3,366 | ) | | | 1,651 | |
| Gain on Sale of Discontinued Operations | | | — | | | | — | | | | (27,386 | ) | | | — | | | | — | | | | (159,873 | ) | | | — | |
| Loss (Gain) on Sale of Oil and Gas Properties | | | 58,472 | | | | (4,645 | ) | | | — | | | | — | | | | — | | | | — | | | | — | |
| (Gain) Loss on Sale of Timber Properties | | | (168,787 | ) | | | 1,252 | | | | — | | | | — | | | | — | | | | — | | | | — | |
| Deferred Income Taxes | | | 78,369 | | | | 40,329 | | | | 40,388 | | | | (5,230 | ) | | | 21,803 | | | | 52,847 | | | | 12,817 | |
| Minority Interest in Foreign Subsidiaries | | | 785 | | | | 1,933 | | | | 2,645 | | | | — | | | | — | | | | — | | | | — | |
| Cumulative Effect of Changes in Accounting | | | 8,892 | | | | — | | | | — | | | | — | | | | — | | | | — | | | | — | |
| Other | | | 11,289 | | | | 9,839 | | | | 7,390 | | | | 4,829 | | | | 3,818 | | | | 16,399 | | | | (194 | ) |
| | | |
| | | | 406,667 | | | | 404,813 | | | | 408,455 | | | | 423,111 | | | | 242,514 | | | | 414,265 | | | | 266,415 | |
| Less: Dividends Paid on Common Stock (Including Dividends to Minority Interests) | | | (84,530 | ) | | | (89,092 | ) | | | (106,835 | ) | | | (98,266 | ) | | | (49,808 | ) | | | (100,632 | ) | | | (51,896 | ) |
| Plus: Net Proceeds from Sale of Oil and Gas Producing Properties | | | 78,531 | | | | 7,162 | | | | 1,349 | | | | 13 | | | | 2,330 | | | | 5,137 | | | | 2,313 | |
| Plus: Net Proceeds from Sale of Timber Properties | | | 186,014 | | | | — | | | | — | | | | — | | | | — | | | | — | | | | — | |
| Plus: Net Proceeds from Sale of Turbine | | | — | | | | — | | | | — | | | | — | | | | — | | | | — | | | | 5,000 | |
| Plus: Net Proceeds from Sale of Foreign Subsidiary | | | — | | | | — | | | | 111,619 | | | | — | | | | — | | | | 232,092 | | | | — | |
| Plus: Cash Held in Escrow | | | — | | | | — | | | | — | | | | — | | | | — | | | | (58,248 | ) | | | 58,397 | |
| Less: Expenditures for Long-Lived Assets | | | (381,440 | ) | | | (172,341 | ) | | | (219,530 | ) | | | (294,159 | ) | | | (135,613 | ) | | | (280,028 | ) | | | (144,707 | ) |
| | | |
| Free Cash Flow | | $ | 205,242 | | | $ | 150,542 | | | $ | 195,058 | | | $ | 30,699 | | | $ | 59,423 | | | $ | 212,586 | | | $ | 135,522 | |
| | | |
| | | | | | | | | | | | | | | | | | | | | | | | | | | | | |
| Weighted Average Diluted Shares | | | 81,358 | | | | 82,900 | | | | 85,029 | | | | 86,028 | | | | 84,862 | | | | 85,301 | | | | 85,603 | |
| | | | | | | | | | | | | | | | | | | | | | | | | | | | | |
Free Cash Flow Per Share | | $ | 2.52 | | | $ | 1.82 | | | $ | 2.29 | | | $ | 0.36 | | | $ | 0.70 | | | $ | 2.49 | | | $ | 1.58 | |
| | | |
| | | | | | | | | | | | | | | | | | | | | | | | | | | | | |
Reconciliation to Net Cash Provided by Operating Activities: | | | | | | | | | | | | | | | | | | | | | | | | | | | | |
| Free Cash Flow | | $ | 205,242 | | | $ | 150,542 | | | $ | 195,058 | | | $ | 30,699 | | | $ | 59,423 | | | $ | 212,586 | | | $ | 135,522 | |
| Add Back: | | | | | | | | | | | | | | | | | | | | | | | | | | | | |
| Expenditures for Long-Lived Assets | | | 381,440 | | | | 172,341 | | | | 219,530 | | | | 294,159 | | | | 135,613 | | | | 280,028 | | | | 144,707 | |
| Dividends Paid on Common Stock (Inc. Dividends to Minority Interests) | | | 84,530 | | | | 89,092 | | | | 106,835 | | | | 98,266 | | | | 49,808 | | | | 100,632 | | | | 51,896 | |
| Investment in Partnership | | | — | | | | — | | | | — | | | | — | | | | — | | | | 3,300 | | | | — | |
| Cash Held in Escrow | | | — | | | | — | | | | — | | | | — | | | | — | | | | 58,248 | | | | (58,397 | ) |
| Deduct: | | | | | | | | | | | | | | | | | | | | | | | | | | | | |
| Excess Tax Benefits Associated with Stock-Based Compensation Awards | | | 0 | | | | 0 | | | | 0 | | | | (6,515 | ) | | | (13,689 | ) | | | (13,689 | ) | | | (16,275 | ) |
| Net Proceeds from Sale of Oil and Gas Producing Properties | | | (78,531 | ) | | | (7,162 | ) | | | (1,349 | ) | | | (13 | ) | | | (2,330 | ) | | | (5,137 | ) | | | (2,313 | ) |
| Net Proceeds from Sale of Timber Properties | | | (186,014 | ) | | | — | | | | — | | | | — | | | | — | | | | — | | | | — | |
| Net Proceeds from Sale of Turbine | | | — | | | | — | | | | — | | | | — | | | | — | | | | — | | | | (5,000 | ) |
| Net Proceeds from Sale of Foreign Subsidiary | | | — | | | | — | | | | (111,619 | ) | | | — | | | | — | | | | (232,092 | ) | | | — | |
| Change in: | | | | | | | | | | | | | | | | | | | | | | | | | | | | |
| Hedging Collateral Deposits | | | (1,109 | ) | | | (7,151 | ) | | | (69,172 | ) | | | 58,108 | | | | 17,642 | | | | 15,610 | | | | 1,712 | |
| Receivables and Unbilled Utility Revenue | | | (28,382 | ) | | | 4,840 | | | | (31,246 | ) | | | (12,343 | ) | | | (196,094 | ) | | | 5,669 | | | | (245,912 | ) |
| Gas Stored Underground & Materials and Supplies | | | (13,826 | ) | | | 13,662 | | | | 1,934 | | | | 1,679 | | | | 47,243 | | | | (5,714 | ) | | | 44,734 | |
| Unrecovered Purchased Gas Costs | | | (16,261 | ) | | | 21,160 | | | | (7,285 | ) | | | 1,847 | | | | (992 | ) | | | (1,799 | ) | | | 13,347 | |
| Prepayments and Other Current Assets | | | (12,628 | ) | | | 37,390 | | | | (30,390 | ) | | | (39,572 | ) | | | 28,659 | | | | 18,800 | | | | 15,878 | |
| Accounts Payable | | | 13,699 | | | | (5,134 | ) | | | 48,089 | | | | (23,144 | ) | | | 34,417 | | | | (26,002 | ) | | | 39,838 | |
| Amounts Payable to Customers | | | 692 | | | | 2,462 | | | | (1,996 | ) | | | 22,777 | | | | (13,339 | ) | | | (13,526 | ) | | | (5,424 | ) |
| Customer Advances | | | — | | | | — | | | | — | | | | 4,946 | | | | (29,417 | ) | | | (6,554 | ) | | | (22,863 | ) |
| Other Accruals and Current Liabilities | | | 9,343 | | | | 2,082 | | | | 16,085 | | | | (17,754 | ) | | | 163,928 | | | | 8,950 | | | | 192,787 | |
| Other Assets | | | (9,343 | ) | | | (2,525 | ) | | | (13,461 | ) | | | (22,700 | ) | | | (3,765 | ) | | | 4,109 | | | | 18,127 | |
| Other Liabilities | | | (23,124 | ) | | | (34,450 | ) | | | (3,667 | ) | | | 80,960 | | | | (2,434 | ) | | | (5,922 | ) | | | 4,504 | |
| | | |
| Net Cash Provided by Operating Activities | | $ | 325,728 | | | $ | 437,149 | | | $ | 317,346 | | | $ | 471,400 | | | $ | 274,673 | | | $ | 397,497 | | | $ | 306,868 | |
| | | |


