Exhibit 99
| Howard Weil Energy ConferenceMarch 2009 |

| Safe Harbor For Forward Looking Statements This presentation may contain "forward-looking statements" as defined by the Private Securities Litigation Reform Act of 1995, including statements regarding future prospects, plans, performance and capital structure, anticipated capital expenditures and completion of construction projects, as well as statements that are identified by the use of the words "anticipates," "estimates," "expects," "forecasts," "intends," "plans," "predicts," "projects," "believes," "seeks," "will," "may," and similar expressions. Forward-looking statements involve risks and uncertainties, which could cause actual results or outcomes to differ materially from those expressed in the forward-looking statements. The Company's expectations, beliefs and projections contained herein are expressed in good faith and are believed to have a reasonable basis, but there can be no assurance that such expectations, beliefs or projections will result or be achieved or accomplished. In addition to other factors, the following are important factors that could cause actual results to differ materially from results referred to in the forward-looking statements: financial and economic conditions, including the availability of credit, and their effect on the Company's ability to obtain financing on acceptable terms for working capital, capital expenditures and other investments; occurrences affecting the Company's ability to obtain financing under credit lines or other credit facilities or through the issuance of commercial paper, other short-term notes or debt or equity securities, including any downgrades in the Company's credit ratings and changes in interest rates and other capital market conditions; changes in economic conditions, including global, national or regional recessions, and their effect on the demand for, and customers' ability to pay for, the Company's products and services; economic disruptions caused by terrorist activities, acts of war or major accidents; changes in actuarial assumptions, the interest rate environment and the return on assets for the Company's retirement plan and post-retirement benefit plans, which can affect future funding obligations and costs and plan liabilities; changes in demographic patterns and weather conditions, including the occurrence of severe weather such as hurricanes; changes in the availability and/or price of natural gas or oil and the effect of such changes on the accounting treatment of derivative financial instruments or the valuation of the Company's natural gas and oil reserves; uncertainty of oil and natural gas reserve estimates; ability to successfully identify, drill for and produce economically viable natural gas and oil reserves, including shortages, delays or unavailability of equipment and services required in drilling operations; significant changes from expectations in the Company's actual production levels for natural gas or oil; changes in the availability and/or price of derivative financial instruments; changes in the price differentials between various types of oil; inability to obtain new customers or retain existing ones; significant changes in competitive factors affecting the Company; changes in laws and regulations to which the Company is subject, including tax, environmental, safety and employment laws and regulations; governmental/regulatory actions, initiatives and proceedings, including those involving acquisitions, financings, rate cases (which address, among other things, allowed rates of return, rate design and retained natural gas), affiliate relationships, industry structure, franchise renewal, and environmental/safety requirements; unanticipated impacts of restructuring initiatives in the natural gas and electric industries; significant changes from expectations in actual capital expenditures and operating expenses and unanticipated project delays or changes in project costs or plans; the nature and projected profitability of pending and potential projects and other investments, and the ability to obtain necessary governmental approvals and permits; ability to successfully identify and finance acquisitions or other investments and ability to operate and integrate existing and any subsequently acquired business or properties; impairments under the SEC's full cost ceiling test for natural gas and oil reserves; significant changes in tax rates or policies or in rates of inflation or interest; significant changes in the Company's relationship with its employees or contractors and the potential adverse effects if labor disputes, grievances or shortages were to occur; changes in accounting principles or the application of such principles to the Company; the cost and effects of legal and administrative claims against the Company or activist shareholder campaigns to effect changes at the Company; increasing health care costs and the resulting effect on health insurance premiums and on the obligation to provide post-retirement benefits; or increasing costs of insurance, changes in coverage and the ability to obtain insurance.For a discussion of these risks and other factors that could cause actual results to differ materially from results referred to in the forward-looking statements, see "Risk Factors" in the Company's Form 10-Q for the quarter ended December 31, 2008. The Company disclaims any obligation to update any forward-looking statements to reflect events or circumstances after the date hereof or to reflect the occurrence of unanticipated events. |

| National Fuel Gas Company Business Segment Reporting Publicly Traded Holding CompanyNYSE symbol - NFG Reporting Segments Corporate Subsidiaries |
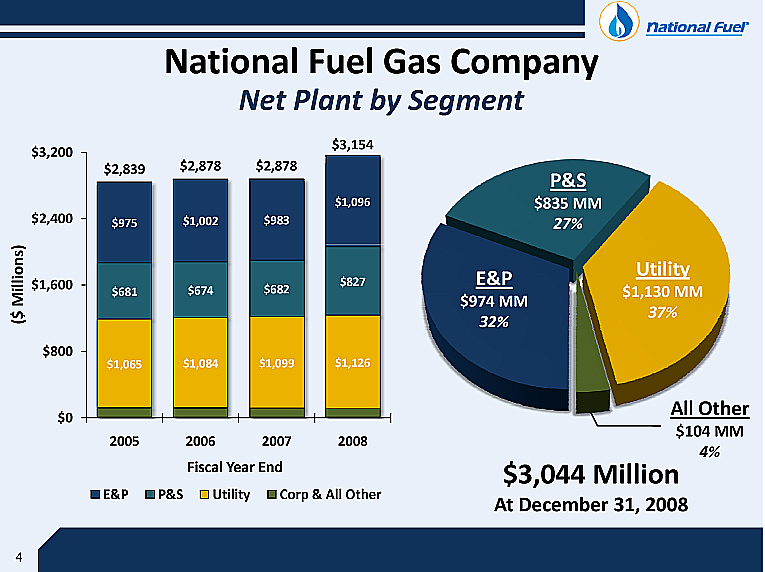
| Net Plant by Segment (CHART) $3,044 MillionAt December 31, 2008 All Other$104 MM4% (CHART) National Fuel Gas Company |
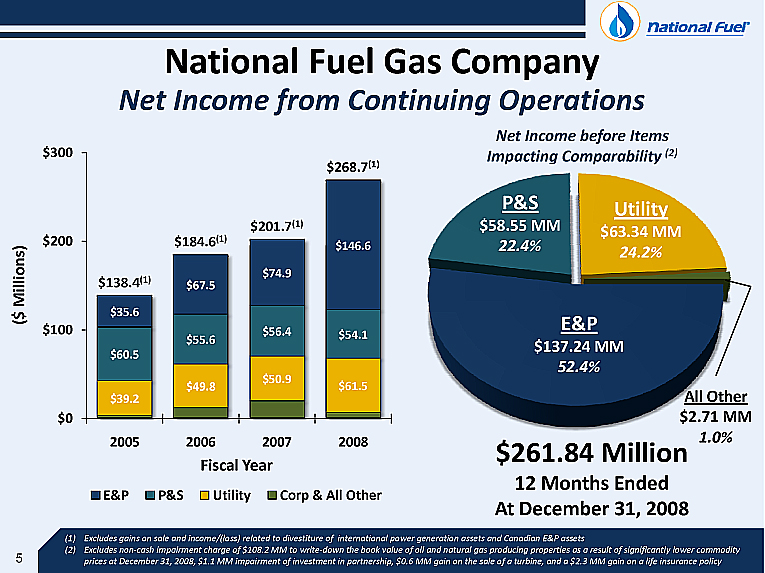
| Net Income from Continuing Operations (CHART) $261.84 Million12 Months EndedAt December 31, 2008 All Other$2.71 MM1.0% (CHART) National Fuel Gas Company Excludes gains on sale and income/(loss) related to divestiture of international power generation assets and Canadian E&P assets(2) Excludes non-cash impairment charge of $108.2 MM to write-down the book value of oil and natural gas producing properties as a result of significantly lower commodity prices at December 31, 2008, $1.1 MM impairment of investment in partnership, $0.6 MM gain on the sale of a turbine, and a $2.3 MM gain on a life insurance policy Net Income before Items Impacting Comparability (2) |
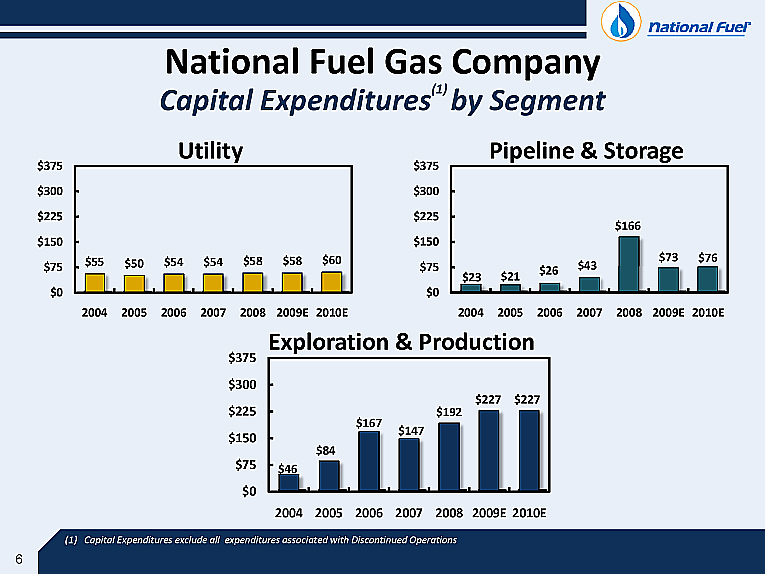
| National Fuel Gas Company Capital Expenditures(1) by Segment (CHART) (CHART) Utility Pipeline & Storage Exploration & Production Capital Expenditures exclude all expenditures associated with Discontinued Operations (CHART) |

| National Fuel Gas Company Capitalization The Company may issue debt or equity securities in a public offering or a private placement from time to time, depending on market conditions, indenture requirements, regulatory authorizations and the Company's capital requirements.Includes $100 MM current portion of long-term debt which was repaid on March 1, 2009 (CHART) $2.76 BillionAt December 31, 2008 Long-Term Debt(2) 40% Shareholder Equity 58% Short-Term Debt 2% Capital Resources(1)$300.0 MM Commercial Paper Program and Uncommitted Credit Facilities - Aggregate of $720.0 MM$300.0 MM Committed Credit Facility through September 2010 - backs Commercial Paper ProgramAs of December 31, 2008, $66 MM was borrowed under the Uncommitted Credit Facilities |

| 9 Utility Segment (Shaded Region)Operated by National Fuel Gas Distribution CorporationGas service to approximately 727,000 customers in Western New York & Northwest PennsylvaniaNY jurisdiction has revenue decoupling, weather normalization, and sym. sharingFocused on providing safe, reliable service and minimizing operating expenses |
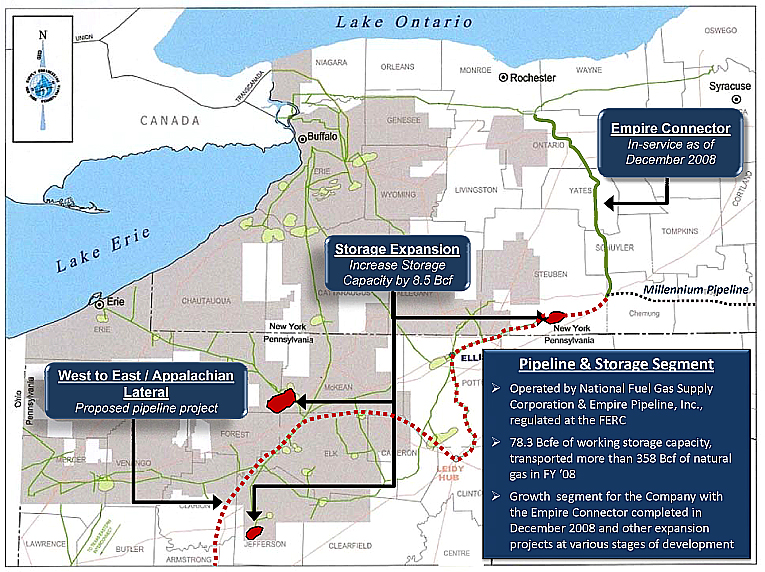
| 10 Empire ConnectorIn-service as of December 2008 Storage ExpansionIncrease Storage Capacity by 8.5 Bcf West to East / Appalachian LateralProposed pipeline project Millennium Pipeline Pipeline & Storage Segment Operated by National Fuel Gas Supply Corporation & Empire Pipeline, Inc., regulated at the FERC78.3 Bcfe of working storage capacity, transported more than 358 Bcf of natural gas in FY '08Growth segment for the Company with the Empire Connector completed in December 2008 and other expansion projects at various stages of development |
| Exploration & Production Seneca Resources Corporation |
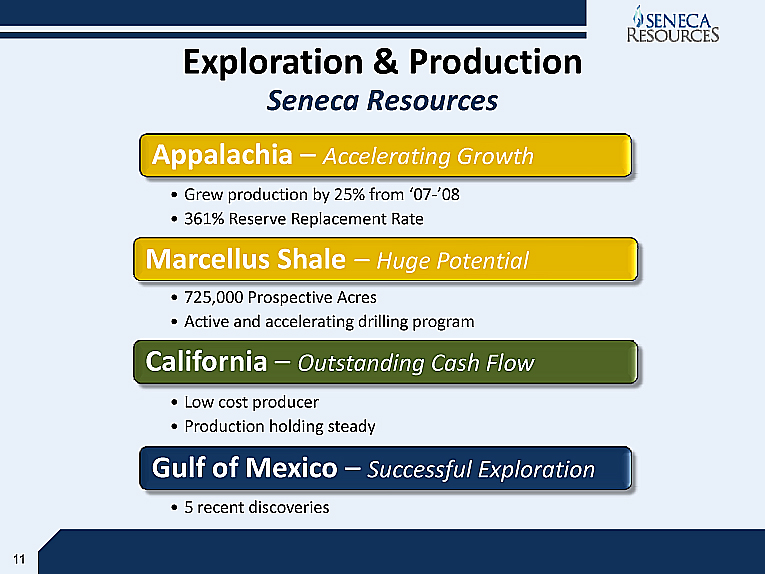
| Exploration & Production Seneca Resources |
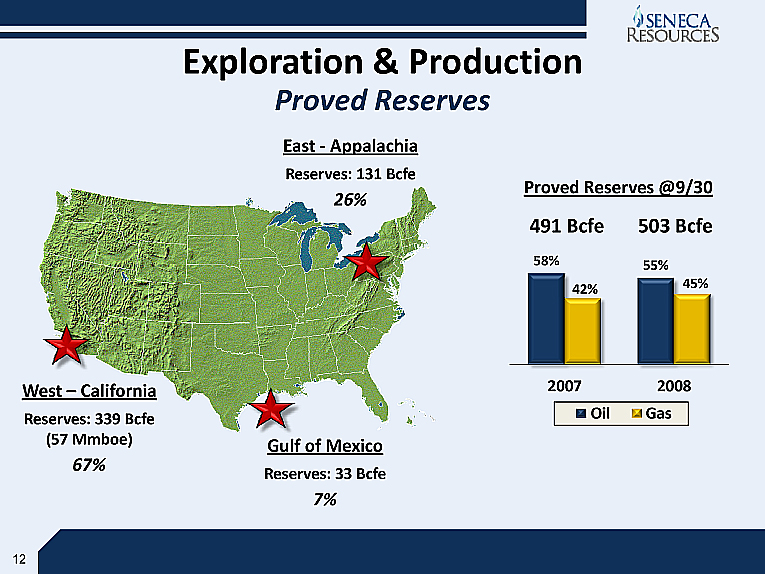
| Exploration & Production Proved Reserves (CHART) Proved Reserves @9/30 491 Bcfe 503 Bcfe West - CaliforniaReserves: 339 Bcfe (57 Mmboe)67% Gulf of MexicoReserves: 33 Bcfe 7% East - AppalachiaReserves: 131 Bcfe 26% |
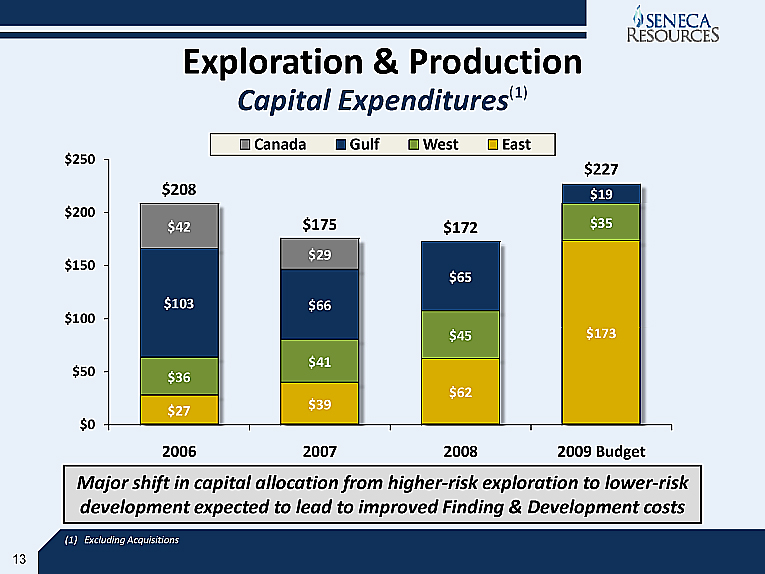
| Exploration & Production Capital Expenditures(1) Major shift in capital allocation from higher-risk exploration to lower-risk development expected to lead to improved Finding & Development costs (CHART) Excluding Acquisitions |
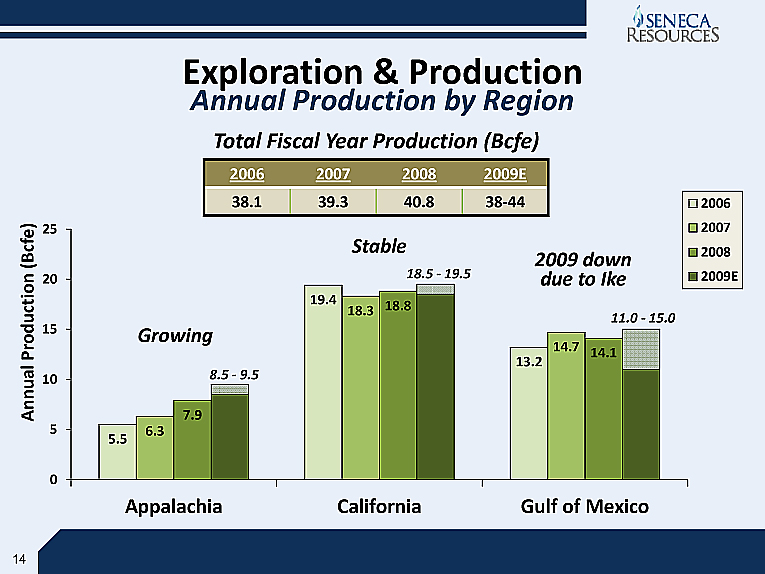
| Exploration & Production Annual Production by Region (CHART) Growing 2006 2007 2008 2009E 38.1 39.3 40.8 38-44 Total Fiscal Year Production (Bcfe) Stable 2009 down due to Ike |
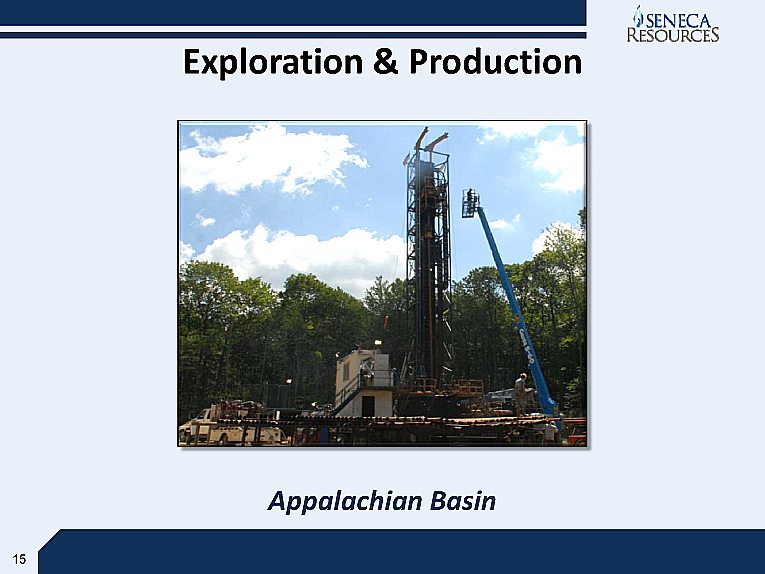
| Exploration & Production Appalachian Basin |
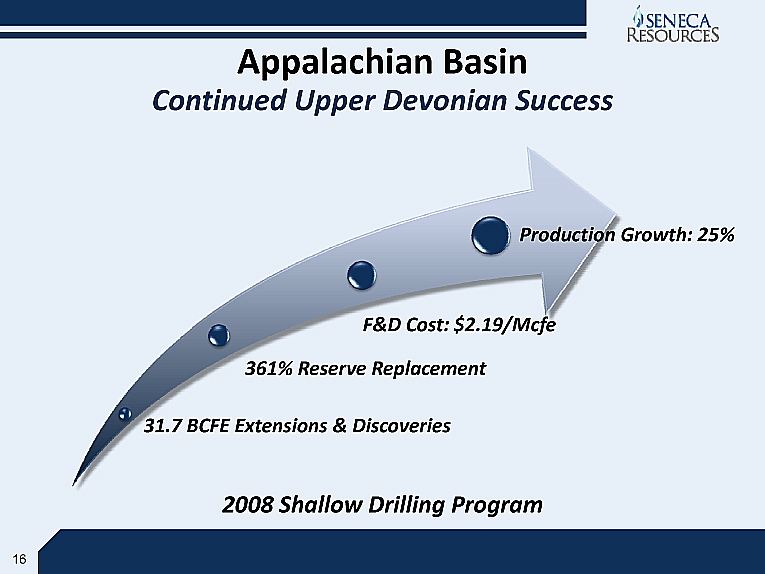
| Appalachian Basin Continued Upper Devonian Success 2008 Shallow Drilling Program |
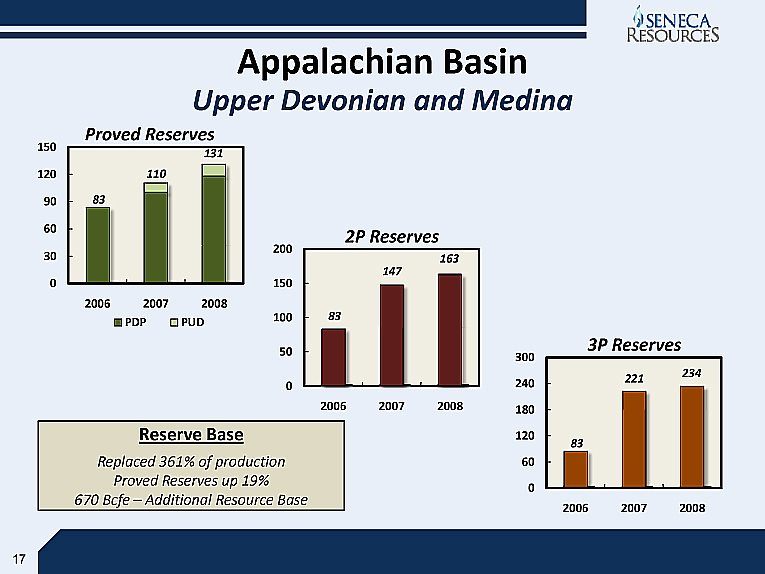
| Appalachian Basin Upper Devonian and Medina (CHART) Proved Reserves (CHART) (CHART) 2P Reserves 3P Reserves Reserve BaseReplaced 361% of productionProved Reserves up 19%670 Bcfe - Additional Resource Base |
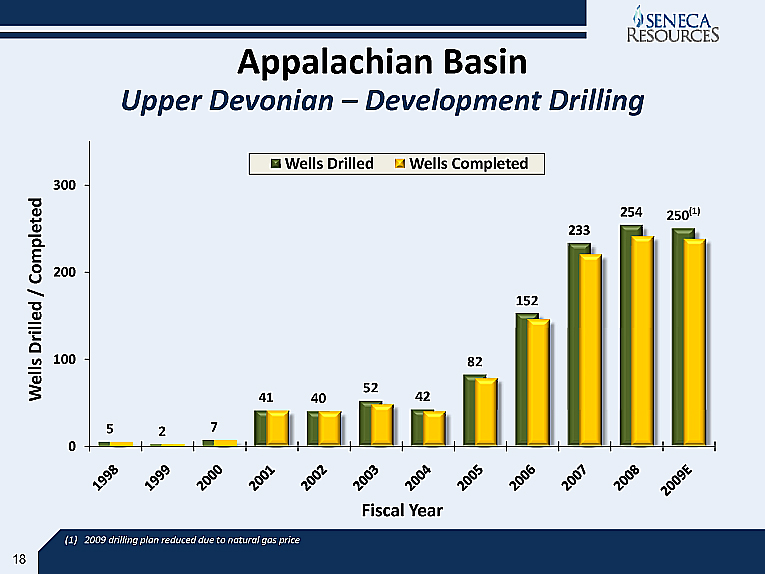
| Appalachian Basin Upper Devonian - Development Drilling (CHART) 2009 drilling plan reduced due to natural gas price |
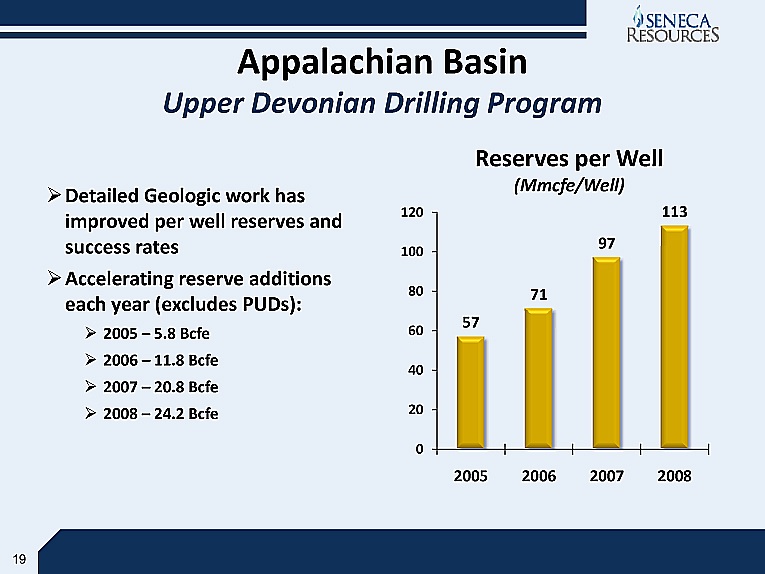
| Appalachian Basin 20 Upper Devonian Drilling Program (CHART) Detailed Geologic work has improved per well reserves and success ratesAccelerating reserve additions each year (excludes PUDs):2005 - 5.8 Bcfe2006 - 11.8 Bcfe2007 - 20.8 Bcfe2008 - 24.2 Bcfe |
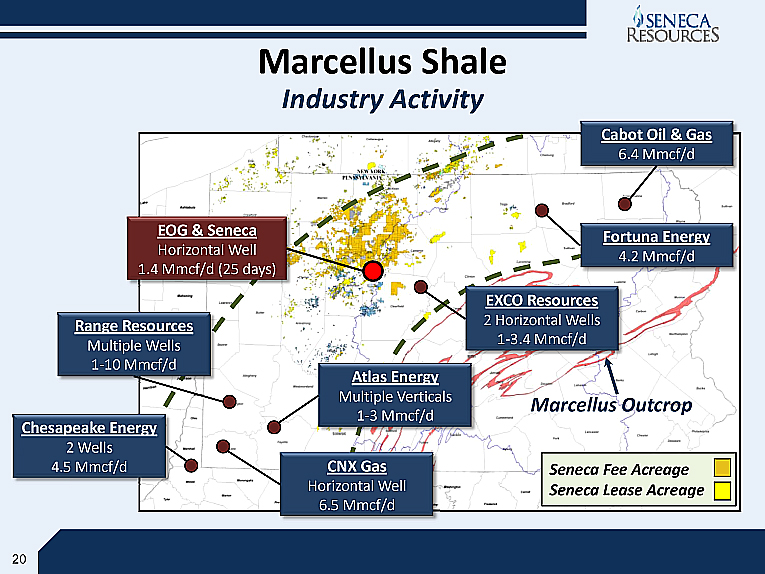
| Marcellus Shale Industry Activity Marcellus Outcrop Seneca Fee AcreageSeneca Lease Acreage Range ResourcesMultiple Wells1-10 Mmcf/d Atlas EnergyMultiple Verticals1-3 Mmcf/d CNX GasHorizontal Well6.5 Mmcf/d Chesapeake Energy2 Wells4.5 Mmcf/d EXCO Resources2 Horizontal Wells1-3.4 Mmcf/d Fortuna Energy4.2 Mmcf/d Cabot Oil & Gas6.4 Mmcf/d EOG & SenecaHorizontal Well1.4 Mmcf/d (25 days) |
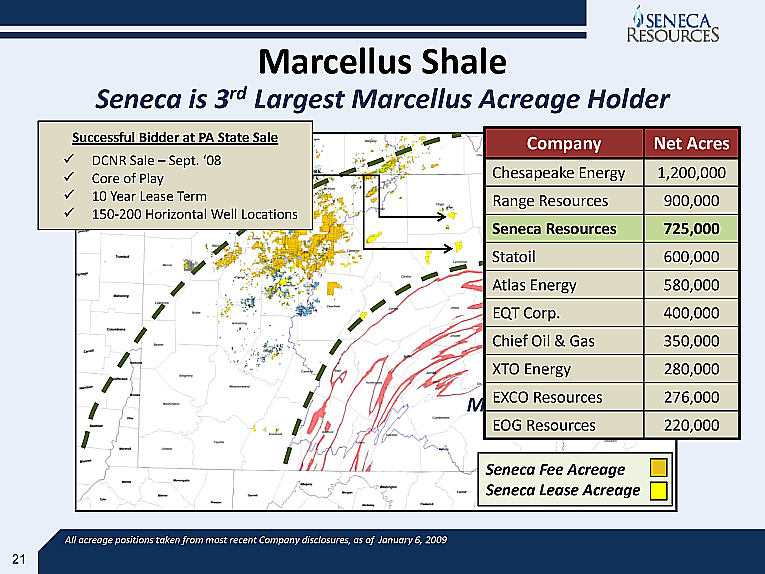
| Marcellus Shale Seneca is 3rd Largest Marcellus Acreage Holder All acreage positions taken from most recent Company disclosures, as of January 6, 2009 Marcellus Outcrop Seneca Fee AcreageSeneca Lease Acreage Company Net Acres Chesapeake Energy 1,200,000 Range Resources 900,000 Seneca Resources 725,000 Statoil 600,000 Atlas Energy 580,000 EQT Corp. 400,000 Chief Oil & Gas 350,000 XTO Energy 280,000 EXCO Resources 276,000 EOG Resources 220,000 Successful Bidder at PA State SaleDCNR Sale - Sept. '08Core of Play10 Year Lease Term150-200 Horizontal Well Locations |
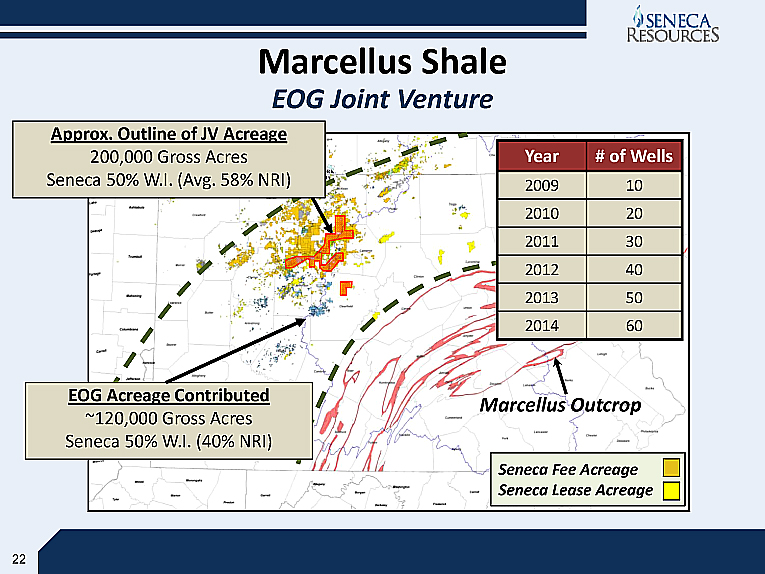
| Marcellus Shale EOG Joint Venture Marcellus Outcrop Seneca Fee AcreageSeneca Lease Acreage Year # of Wells 2009 10 2010 20 2011 30 2012 40 2013 50 2014 60 Approx. Outline of JV Acreage200,000 Gross AcresSeneca 50% W.I. (Avg. 58% NRI) EOG Acreage Contributed~120,000 Gross AcresSeneca 50% W.I. (40% NRI) |

| Well Type # of Wells Vertical 5 Horizontal 7 Marcellus Shale EOG JV Drilling Update Well # IP Rate Details 1 350 Mcf/d Short Lateral; Ineffective Frac Job 2 400 Mcf/d Short Lateral - 1,500' 3 1,400 Mcf/d 3,500' Lateral 4,5 3,800' - 4,200' Laterals; 3rd Q Frac 6 5,700' Lateral; 3rd Q Frac 7 5,600' Lateral; April '09 Frac Drilling Summary Horizontal Well Summary 2009: 10 Anticipated Horizontal Wells |
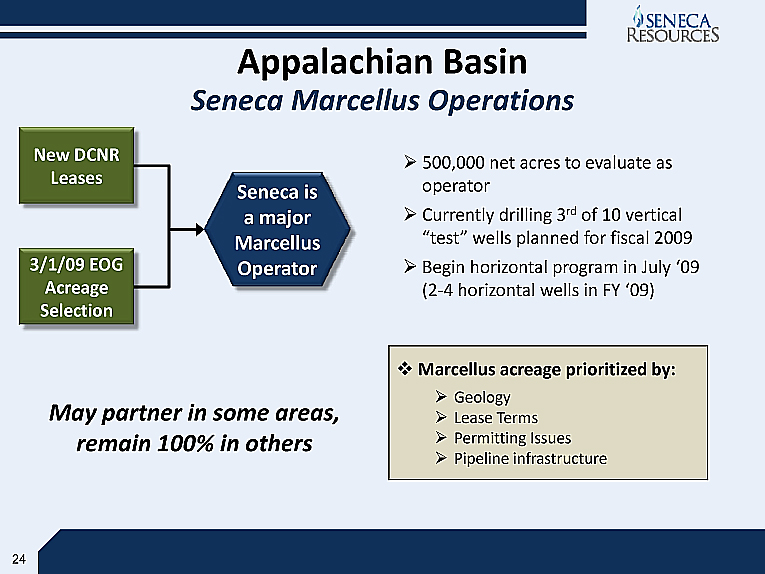
| Appalachian Basin Seneca Marcellus Operations New DCNR Leases 3/1/09 EOG Acreage Selection Seneca is a major Marcellus Operator Marcellus acreage prioritized by:GeologyLease TermsPermitting IssuesPipeline infrastructure May partner in some areas, remain 100% in others 500,000 net acres to evaluate as operatorCurrently drilling 3rd of 10 vertical "test" wells planned for fiscal 2009Begin horizontal program in July '09 (2-4 horizontal wells in FY '09) |
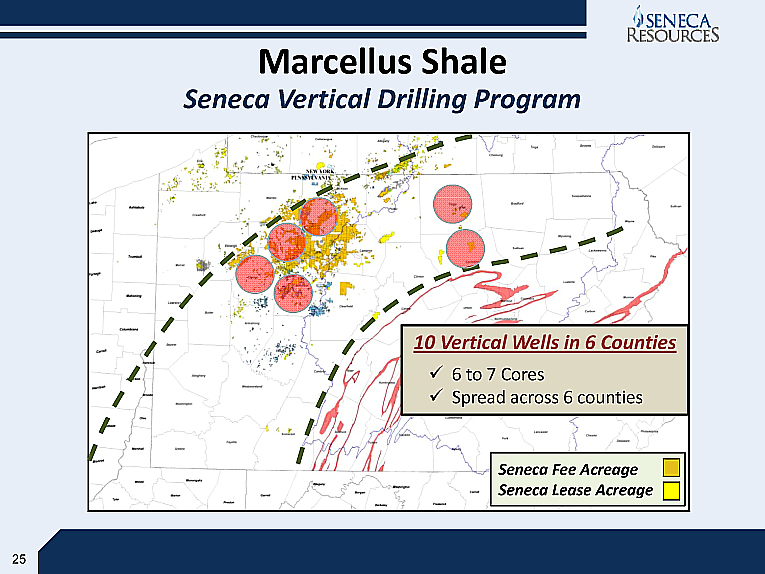
| Marcellus Shale Seneca Vertical Drilling Program Marcellus Outcrop Seneca Fee AcreageSeneca Lease Acreage 10 Vertical Wells in 6 Counties 6 to 7 Cores Spread across 6 counties |

| Marcellus Shale Seneca Horizontal Development Drilling Program Marcellus Outcrop Seneca Fee AcreageSeneca Lease Acreage Initial Area of FocusHWD Rig arrives July 2009NFG Midstream working on Gathering System |

| Appalachian Basin Marcellus Shale Evaluation Depth TVD: 5,000' - 8,000' Thickness 50' - 200' Total Organic Content (TOC) 2% - (>) 10% Thermal Maturity 1% - 3% Effective Porosity 3% - 12% Pressure (psi/foot) 0.43 - 0.65 Water Saturation 12% - 35% Gas-in-Place (Bcfe/Section) 30 - 150 Anticipated EUR/Horizontal Well (Bcfe) 1.0 - 3.0 |
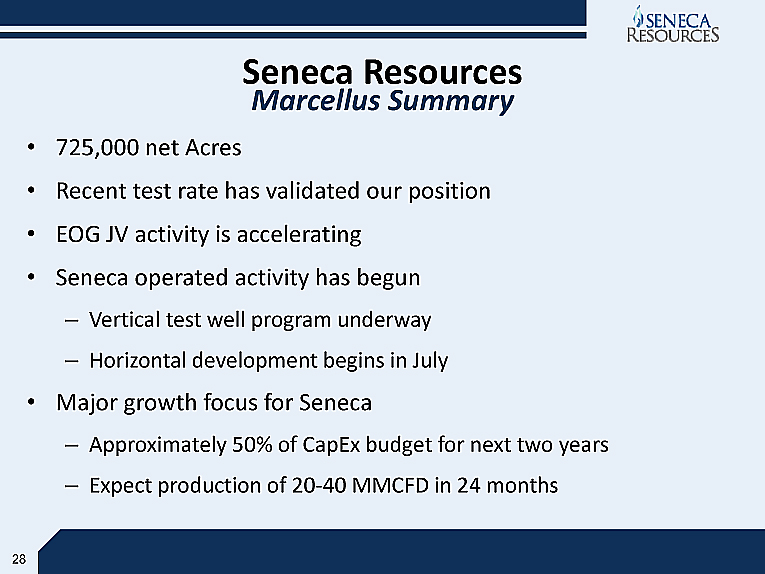
| Marcellus Summary Seneca Resources 725,000 net AcresRecent test rate has validated our positionEOG JV activity is acceleratingSeneca operated activity has begunVertical test well program underwayHorizontal development begins in JulyMajor growth focus for SenecaApproximately 50% of CapEx budget for next two yearsExpect production of 20-40 MMCFD in 24 months |

| Exploration & Production Gulf of Mexico |
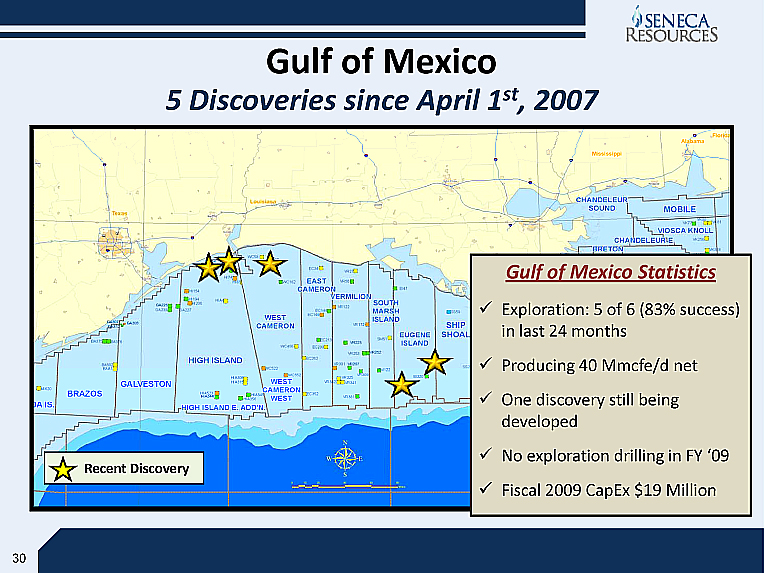
| Gulf of Mexico 5 Discoveries since April 1st, 2007 Recent Discovery Gulf of Mexico StatisticsExploration: 5 of 6 (83% success) in last 24 monthsProducing 40 Mmcfe/d netOne discovery still being developedNo exploration drilling in FY '09Fiscal 2009 CapEx $19 Million |
| Exploration & Production California |

| California Lifting Cost - Peer Comparison (CHART) Seneca is a low-cost operator in California, with Lifting Costs consistently outperforming its peers Source: IHS Herold, Inc. and Seneca Financial Reports |
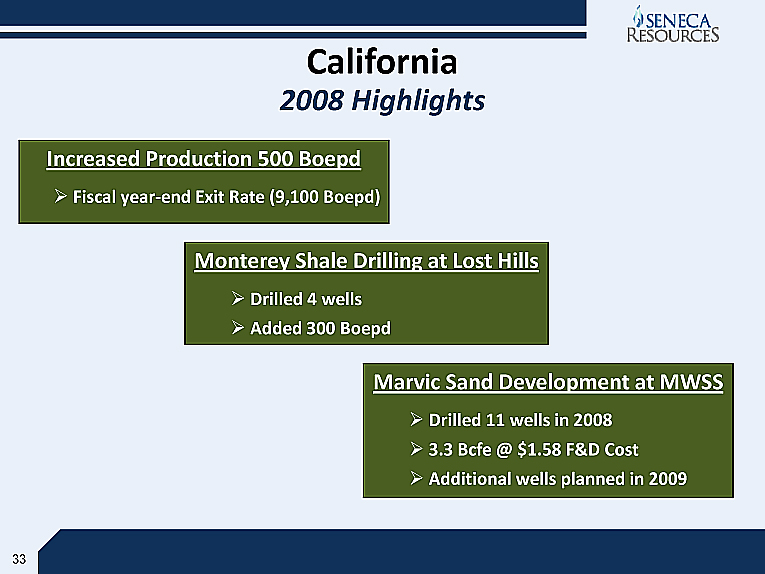
| California 2008 Highlights Monterey Shale Drilling at Lost Hills Drilled 4 wells Added 300 Boepd Marvic Sand Development at MWSS Drilled 11 wells in 2008 3.3 Bcfe @ $1.58 F&D Cost Additional wells planned in 2009 Increased Production 500 Boepd Fiscal year-end Exit Rate (9,100 Boepd) |
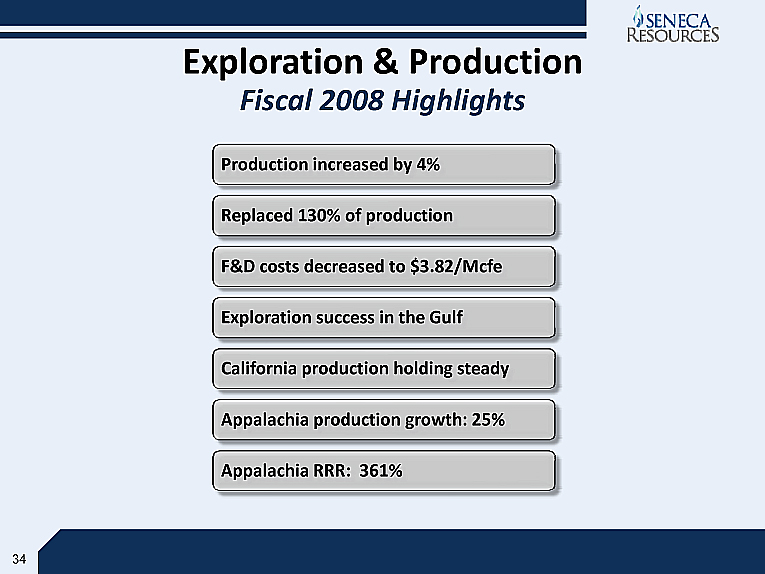
| Exploration & Production Fiscal 2008 Highlights |

| Future Direction Seneca Resources 2009 PlansEvaluate overall Marcellus position and establish productionMaintain California production at FY '08 level Minimize spending in the GulfLong Term ExpectationsContinue strategic shift to AppalachiaGrow Marcellus production to 20-40 MMCFD in next 24 monthsMaintain modest investment in California to maintain production and divert CapEx to Appalachia to fuel Marcellus growth |
| Appendix |
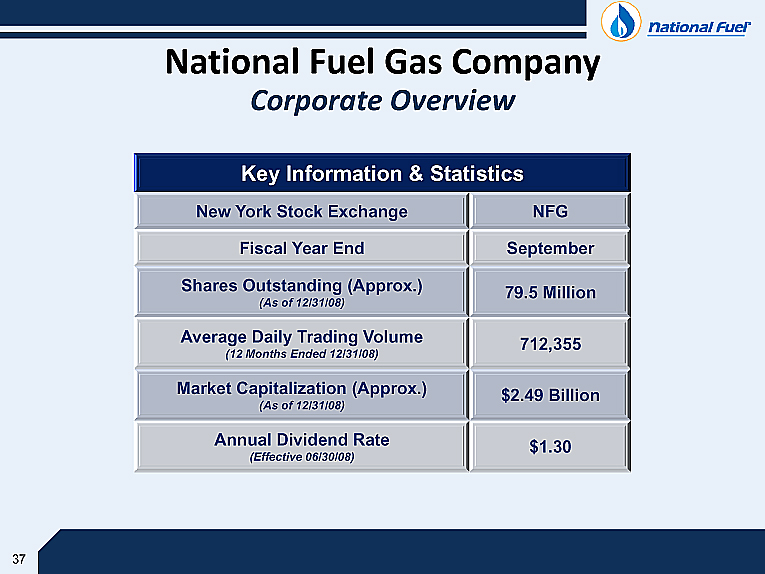
| National Fuel Gas Company Corporate Overview Key Information & Statistics Key Information & Statistics New York Stock Exchange NFG Fiscal Year End September Shares Outstanding (Approx.) (As of 12/31/08) 79.5 Million Average Daily Trading Volume (12 Months Ended 12/31/08) 712,355 Market Capitalization (Approx.) (As of 12/31/08) $2.49 Billion Annual Dividend Rate (Effective 06/30/08) $1.30 |
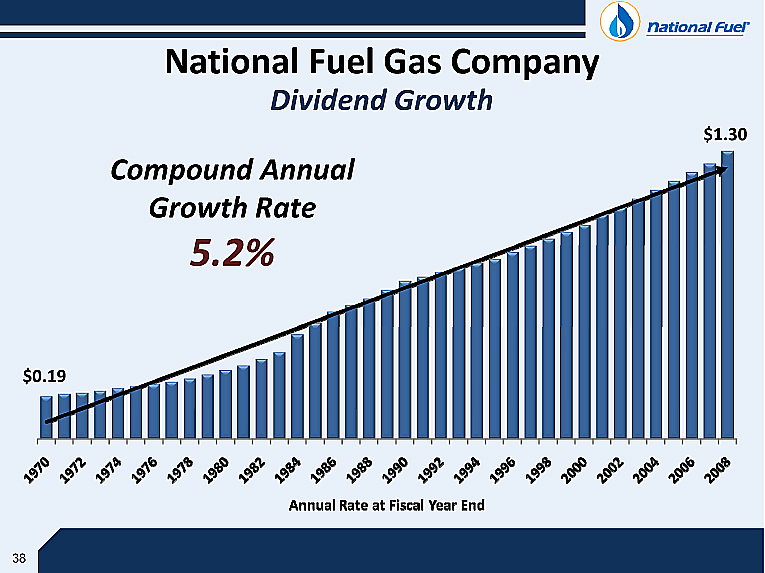
| National Fuel Gas Company Dividend Growth Compound Annual Growth Rate5.2% $1.30 $0.19 |
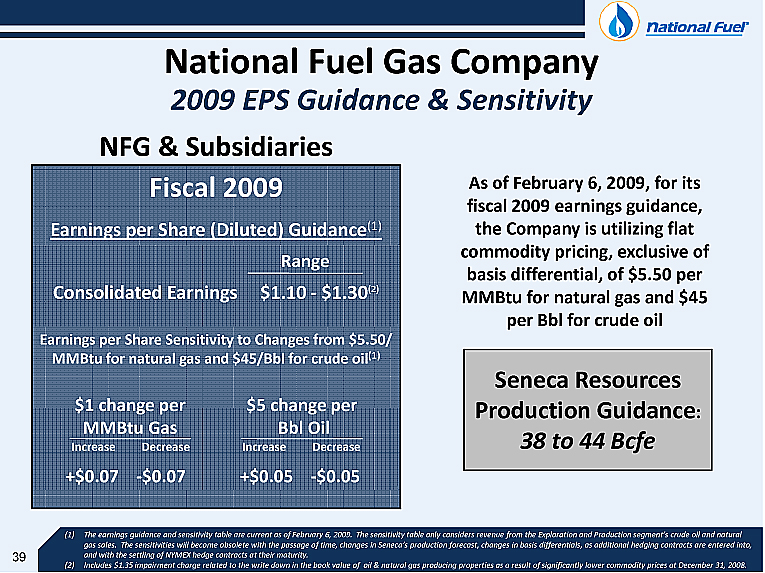
| National Fuel Gas Company 2009 EPS Guidance & Sensitivity Fiscal 2009Earnings per Share (Diluted) Guidance(1)Consolidated Earnings $1.10 - $1.30(2)Earnings per Share Sensitivity to Changes from $5.50/ MMBtu for natural gas and $45/Bbl for crude oil(1)$1 change per $5 change per MMBtu Gas Bbl Oil Increase Decrease Increase Decrease +$0.07 -$0.07 +$0.05 -$0.05 Range NFG & Subsidiaries The earnings guidance and sensitivity table are current as of February 6, 2009. The sensitivity table only considers revenue from the Exploration and Production segment's crude oil and natural gas sales. The sensitivities will become obsolete with the passage of time, changes in Seneca's production forecast, changes in basis differentials, as additional hedging contracts are entered into, and with the settling of NYMEX hedge contracts at their maturity.Includes $1.35 impairment charge related to the write down in the book value of oil & natural gas producing properties as a result of significantly lower commodity prices at December 31, 2008. As of February 6, 2009, for its fiscal 2009 earnings guidance, the Company is utilizing flat commodity pricing, exclusive of basis differential, of $5.50 per MMBtu for natural gas and $45 per Bbl for crude oil Seneca Resources Production Guidance:38 to 44 Bcfe |
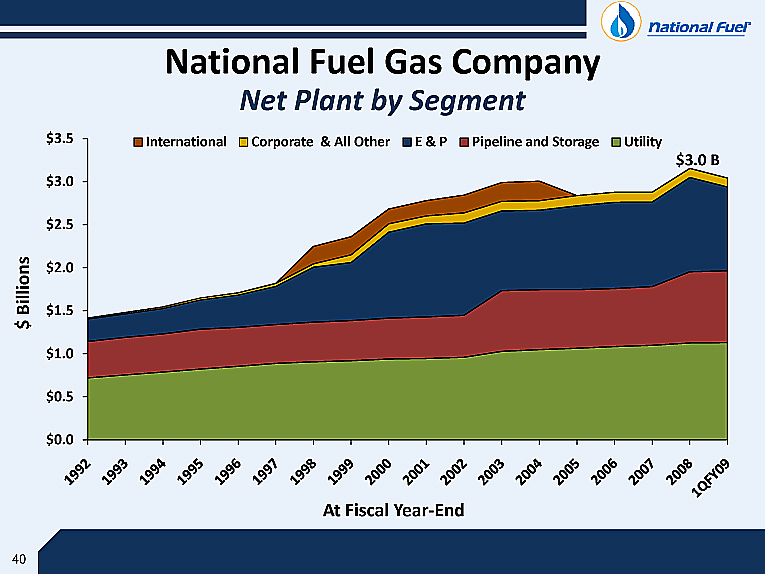
| National Fuel Gas Company Net Plant by Segment (CHART) $3.0 B |
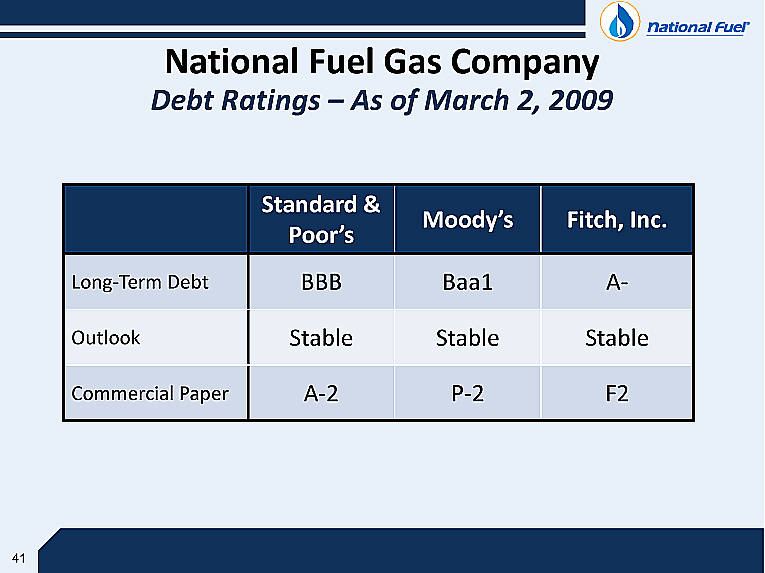
| National Fuel Gas Company Debt Ratings - As of March 2, 2009 Standard & Poor's Moody's Fitch, Inc. Long-Term Debt BBB Baa1 A- Outlook Stable Stable Stable Commercial Paper A-2 P-2 F2 |
| Pipeline & Storage National Fuel Gas Supply CorporationEmpire State Pipeline |
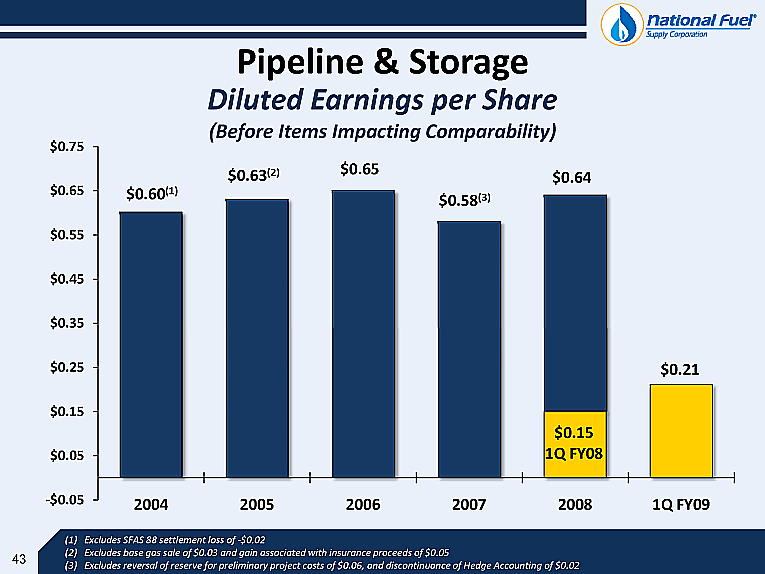
| Pipeline & Storage Excludes SFAS 88 settlement loss of -$0.02Excludes base gas sale of $0.03 and gain associated with insurance proceeds of $0.05Excludes reversal of reserve for preliminary project costs of $0.06, and discontinuance of Hedge Accounting of $0.02 (CHART) Diluted Earnings per Share(Before Items Impacting Comparability) |
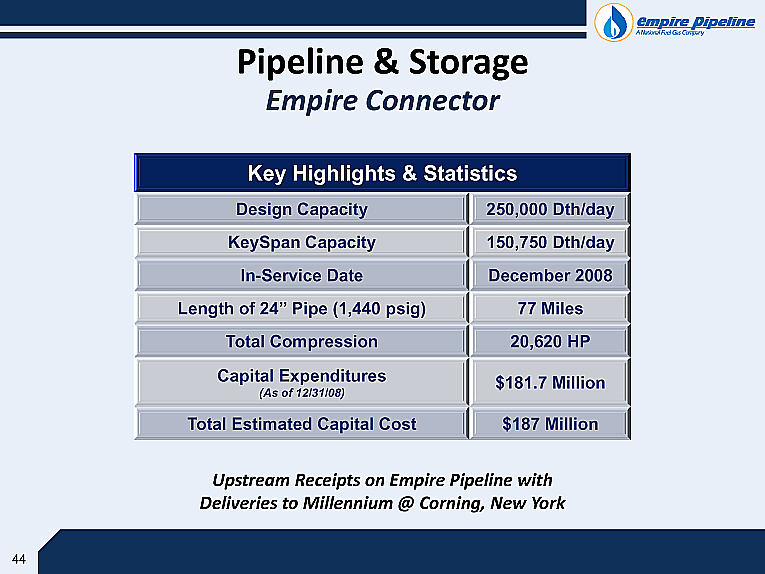
| Pipeline & Storage Empire Connector Key Highlights & Statistics Key Highlights & Statistics Design Capacity 250,000 Dth/day KeySpan Capacity 150,750 Dth/day In-Service Date December 2008 Length of 24" Pipe (1,440 psig) 77 Miles Total Compression 20,620 HP Capital Expenditures (As of 12/31/08) $181.7 Million Total Estimated Capital Cost $187 Million Upstream Receipts on Empire Pipeline withDeliveries to Millennium @ Corning, New York |

| Pipeline & Storage Upcoming Projects West to East & Appalachian Lateral ProjectPipeline Length: 324 Miles Starting Location: Rockies Express (REX) - Clarington, OHEnding Location: Millennium Pipeline - Corning, NYReceipts From: REX (~555,000 to 750,000 Dth/d) Local Production Cove Point Gas at Leidy and CorningDeliveries To: Millennium & Empire at CorningProject Status: Open Seasons Conducted May 2007/October 2008 Strong Initial Interest Storage ExpansionIncremental Storage Capacity: Approximately 8.5 Bcf No additional base gas requiredStorage Fields: East Branch - Pennsylvania Galbraith - Pennsylvania Tuscarora - Central New YorkProject Status: Open Season Conducted October 2008 |
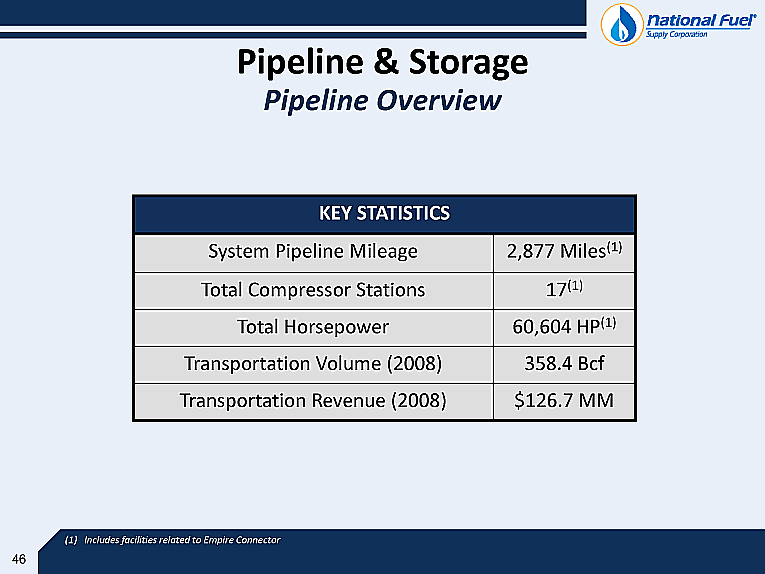
| Pipeline Overview KEY STATISTICS KEY STATISTICS System Pipeline Mileage 2,877 Miles(1) Total Compressor Stations 17(1) Total Horsepower 60,604 HP(1) Transportation Volume (2008) 358.4 Bcf Transportation Revenue (2008) $126.7 MM Includes facilities related to Empire Connector Pipeline & Storage |
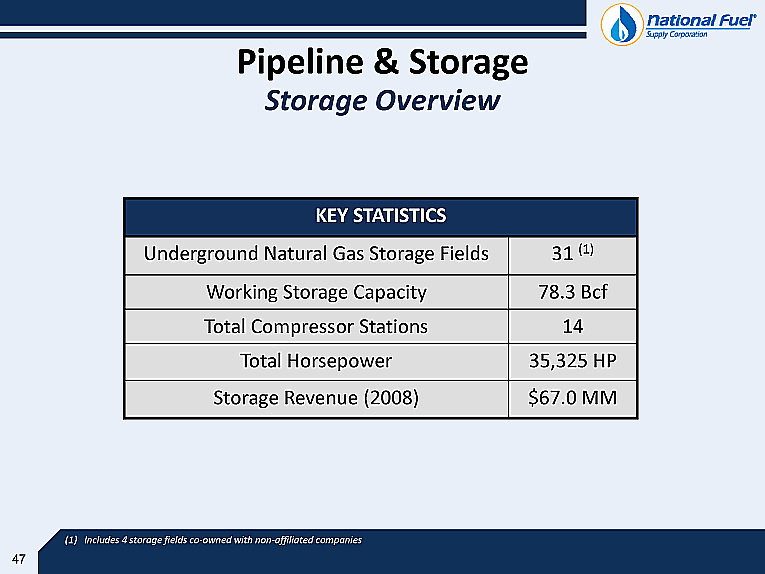
| Storage Overview Pipeline & Storage KEY STATISTICS KEY STATISTICS Underground Natural Gas Storage Fields 31 (1) Working Storage Capacity 78.3 Bcf Total Compressor Stations 14 Total Horsepower 35,325 HP Storage Revenue (2008) $67.0 MM Includes 4 storage fields co-owned with non-affiliated companies |
| Utility Segment National Fuel Gas Distribution Corporation |
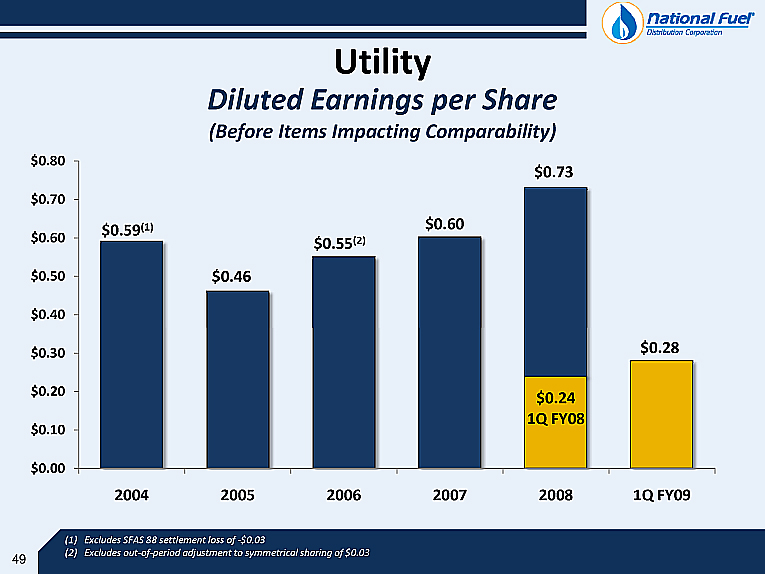
| Utility Excludes SFAS 88 settlement loss of -$0.03Excludes out-of-period adjustment to symmetrical sharing of $0.03 Diluted Earnings per Share(Before Items Impacting Comparability) (CHART) |
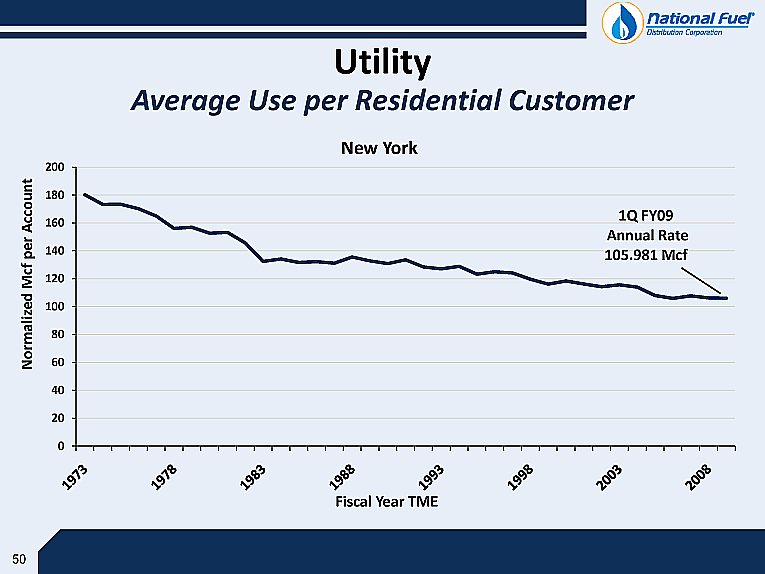
| Utility Average Use per Residential Customer (CHART) |
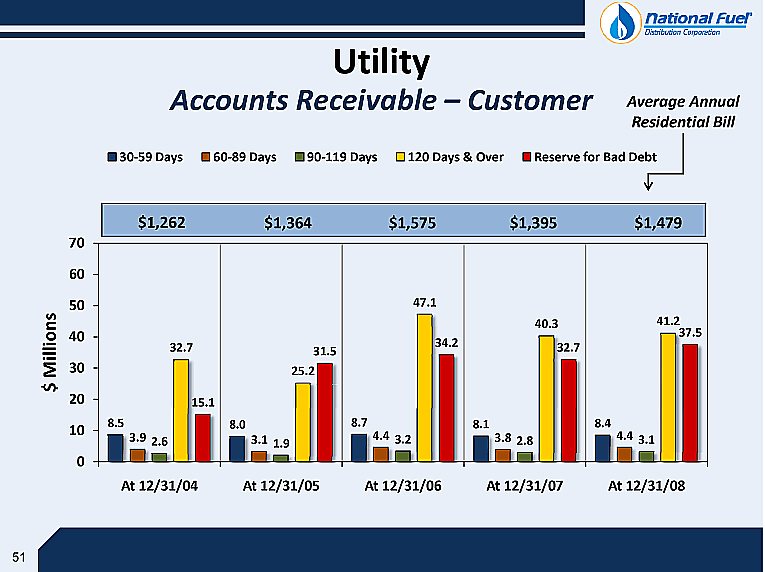
| Utility Accounts Receivable - Customer (CHART) Average Annual Residential Bill |
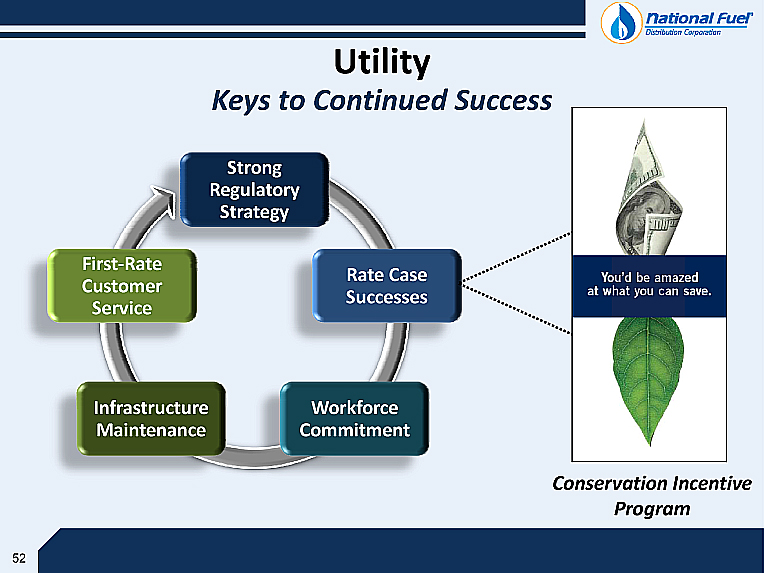
| Utility Keys to Continued Success Conservation Incentive Program |
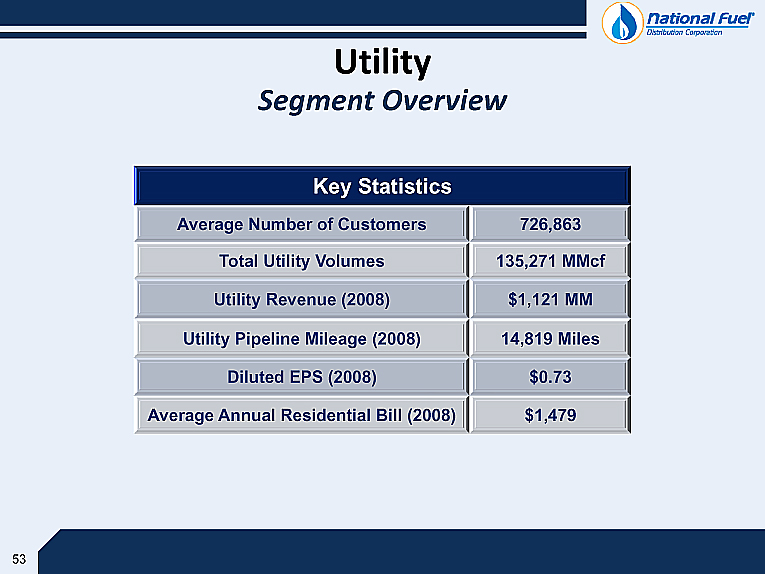
| Utility Segment Overview Key Statistics Key Statistics Average Number of Customers 726,863 Total Utility Volumes 135,271 MMcf Utility Revenue (2008) $1,121 MM Utility Pipeline Mileage (2008) 14,819 Miles Diluted EPS (2008) $0.73 Average Annual Residential Bill (2008) $1,479 |
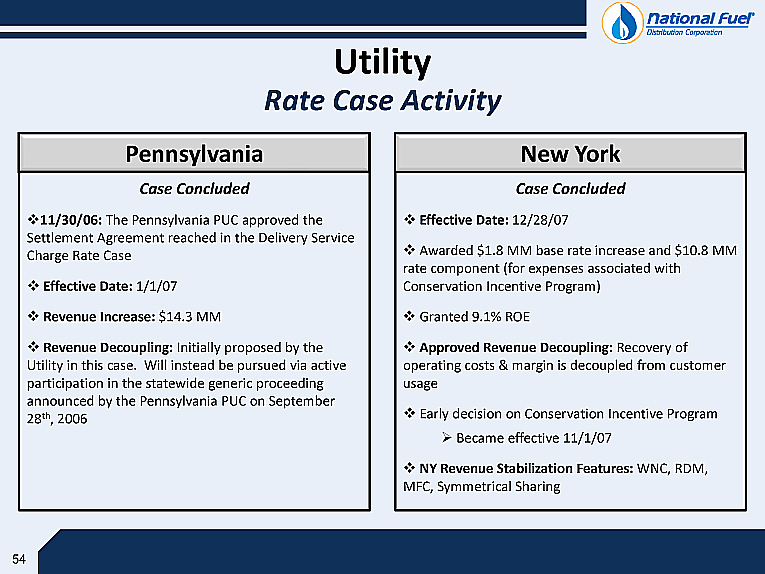
| Utility Rate Case Activity 11/30/06: The Pennsylvania PUC approved the Settlement Agreement reached in the Delivery Service Charge Rate Case Effective Date: 1/1/07 Revenue Increase: $14.3 MM Revenue Decoupling: Initially proposed by the Utility in this case. Will instead be pursued via active participation in the statewide generic proceeding announced by the Pennsylvania PUC on September 28th, 2006 Pennsylvania Effective Date: 12/28/07 Awarded $1.8 MM base rate increase and $10.8 MM rate component (for expenses associated with Conservation Incentive Program) Granted 9.1% ROE Approved Revenue Decoupling: Recovery of operating costs & margin is decoupled from customer usage Early decision on Conservation Incentive Program Became effective 11/1/07 NY Revenue Stabilization Features: WNC, RDM, MFC, Symmetrical Sharing New York Case Concluded Case Concluded |
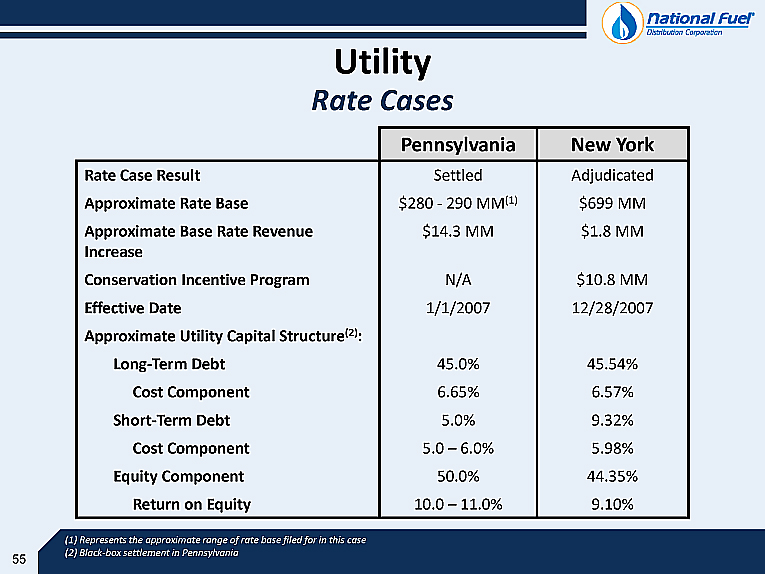
| Utility Rate Cases Pennsylvania New York Rate Case Result Rate Case Result Settled Adjudicated Approximate Rate Base Approximate Rate Base $280 - 290 MM(1) $699 MM Approximate Base Rate Revenue Increase Approximate Base Rate Revenue Increase $14.3 MM $1.8 MM Conservation Incentive Program Conservation Incentive Program N/A $10.8 MM Effective Date Effective Date 1/1/2007 12/28/2007 Approximate Utility Capital Structure(2): Approximate Utility Capital Structure(2): Long-Term Debt 45.0% 45.54% Cost Component 6.65% 6.57% Short-Term Debt 5.0% 9.32% Cost Component 5.0 - 6.0% 5.98% Equity Component 50.0% 44.35% Return on Equity 10.0 - 11.0% 9.10% (1) Represents the approximate range of rate base filed for in this case(2) Black-box settlement in Pennsylvania |
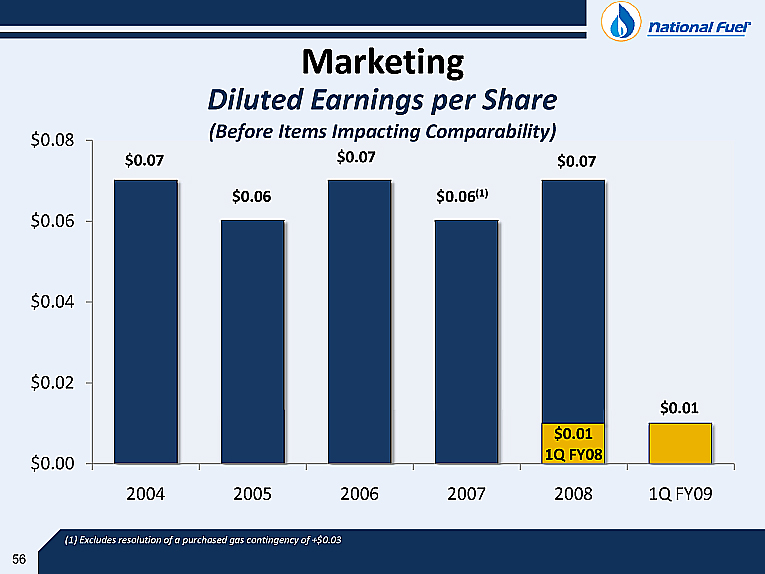
| Marketing (CHART) (1) Excludes resolution of a purchased gas contingency of +$0.03 Diluted Earnings per Share(Before Items Impacting Comparability) |
| National Fuel Gas Company Comparable GAAP Financial Measure Slides and Reconciliations This presentation contains certain non-GAAP financial measures. For pages that contain non-GAAP financial measures, pages containing the most directly comparable GAAP financial measures and reconciliations are provided in the slides that follow. The Company believes that its non-GAAP financial measures are useful to investors because they provide an alternative method for assessing the Company's operating results in a manner that is focused on the performance of the Company's ongoing operations. The Company's management uses these non-GAAP financial measures for the same purpose, and for planning and forecasting purposes. The presentation of non-GAAP financial measures is not meant to be a substitute for financial measures prepared in accordance with GAAP. |
Reconciliation of Income from Continuing Operations by Segment
to Consolidated GAAP Net Income
to Consolidated GAAP Net Income
| FY05 | FY06 | FY07 | FY08 | |||||||||||||
| Income from Continuing Operations | ||||||||||||||||
| Utility Segment Income from Continuing Operation | 39,197 | 49,815 | 50,886 | 61,472 | ||||||||||||
| P&S Segment Income from Continuing Operation | 60,454 | 55,633 | 56,386 | 54,148 | ||||||||||||
| E&P Segment Income from Continuing Operation | 35,581 | 67,494 | 74,889 | 146,612 | ||||||||||||
| Marketing Segment Income from Continuing Operation | 5,077 | 5,798 | 7,663 | 5,889 | ||||||||||||
| Corp & All Other Income from Continuing Operation | (1,872 | ) | 5,874 | 11,851 | 607 | |||||||||||
| Total Income from Continuing Operations | 138,437 | 184,614 | 201,675 | 268,728 | ||||||||||||
| Discontinued Operations | ||||||||||||||||
| Income (Loss) From Operations, Net of Tax | 25,277 | (46,523 | ) | 15,479 | — | |||||||||||
| Gain on Disposal, Net of Tax | 25,774 | — | 120,301 | — | ||||||||||||
| Income (Loss) From Discontinued Operations, Net of Tax | 51,051 | (46,523 | ) | 135,780 | — | |||||||||||
| GAAP Net Income | ||||||||||||||||
| Utility Segment GAAP Net Income | 39,197 | 49,815 | 50,886 | 61,472 | ||||||||||||
| P&S Segment GAAP Net Income | 60,454 | 55,633 | 56,386 | 54,148 | ||||||||||||
| E&P Segment GAAP Net Income | 50,659 | 20,971 | 210,669 | 146,612 | ||||||||||||
| Marketing Segment GAAP Net Income | 5,077 | 5,798 | 7,663 | 5,889 | ||||||||||||
| Corp & All Other GAAP Net Income | 34,101 | 5,874 | 11,851 | 607 | ||||||||||||
| Total GAAP Net Income | 189,488 | 138,091 | 337,455 | 268,728 | ||||||||||||
Reconciliation of Segment Net Income to
Consolidated Net Income
(‘000)
Consolidated Net Income
(‘000)
| 12 Mos Ended 12/31/08 | ||||||||||||
| Earning Before | ||||||||||||
| Items Impacting | Items Impacting | |||||||||||
| GAAP Earnings | Comparability | Comparability | ||||||||||
| Utility | $ | 63,343 | ||||||||||
| $ | 63,343 | |||||||||||
| Pipeline & Storage | $ | 58,546 | ||||||||||
| $ | 58,546 | |||||||||||
| Exploration & Production | $ | 29,033 | ||||||||||
| Add Back: Non-cash impairment charge | $ | 108,207 | ||||||||||
| $ | 137,240 | |||||||||||
| Energy Marketing | $ | 5,534 | ||||||||||
| $ | 5,534 | |||||||||||
| Corporate & Other | $ | (1,010 | ) | |||||||||
| Add Back: Impairment of Investment in Partnership | $ | 1,085 | ||||||||||
| Subtract: Gain on life insurance proceeds | $ | (2,312 | ) | |||||||||
| Subtract: Gain on sale of turbine | $ | (586 | ) | |||||||||
| $ | (2,823 | ) | ||||||||||
| GAAP Consolidated Net Income | $ | 155,446 | ||||||||||
| Total Items Impacting Comparability | $ | 106,394 | ||||||||||
| Net Income Before Items Impacting Comparability | $ | 261,840 | ||||||||||
NATIONAL FUEL GAS COMPANY
AND SUBSIDIARIES
RECONCILIATION TO REPORTED EARNINGS
AND SUBSIDIARIES
RECONCILIATION TO REPORTED EARNINGS
| Fiscal Year | Fiscal Year | Fiscal Year | Fiscal Year | Fiscal Year | Three Months | |||||||||||||||||||
| Ended | Ended | Ended | Ended | Ended | Ended | |||||||||||||||||||
| (Diluted Earnings Per Share) | September 30, 2004 | September 30, 2005 | September 30, 2006 | September 30, 2007 | September 30, 2008 | December 31, 2008 | ||||||||||||||||||
Utility | ||||||||||||||||||||||||
| Reported earnings | $ | 0.56 | $ | 0.46 | $ | 0.58 | $ | 0.60 | $ | 0.73 | $ | 0.28 | ||||||||||||
| Out-of-period adjustment to symmetical sharing | — | — | (0.03 | ) | — | — | — | |||||||||||||||||
| Pension settlement loss | 0.03 | — | — | — | — | — | ||||||||||||||||||
| Earnings before items impacting comparability | 0.59 | 0.46 | 0.55 | 0.60 | 0.73 | 0.28 | ||||||||||||||||||
Pipeline and Storage | ||||||||||||||||||||||||
| Reported earnings | 0.58 | 0.71 | 0.65 | 0.66 | 0.64 | 0.21 | ||||||||||||||||||
| Reversal of reserve for preliminary project costs | — | — | — | (0.06 | ) | — | — | |||||||||||||||||
| Discontinuance of hedge accounting | — | — | — | (0.02 | ) | — | — | |||||||||||||||||
| Pension settlement loss | 0.02 | — | — | — | — | — | ||||||||||||||||||
| Gain associated with insurance proceeds | — | (0.05 | ) | — | — | — | — | |||||||||||||||||
| Base gas sale | — | (0.03 | ) | — | — | — | — | |||||||||||||||||
| Earnings before items impacting comparability | 0.60 | 0.63 | 0.65 | 0.58 | 0.64 | 0.21 | ||||||||||||||||||
Exploration and Production | ||||||||||||||||||||||||
| Reported earnings | 0.66 | 0.60 | 0.24 | 2.47 | 1.73 | (1.04 | ) | |||||||||||||||||
| Gain on disposal of discontinued operations | — | — | — | (1.41 | ) | — | — | |||||||||||||||||
| Earnings from discontinued operations | — | — | — | (0.18 | ) | — | — | |||||||||||||||||
| Income tax adjustments | — | — | (0.07 | ) | — | — | — | |||||||||||||||||
| Loss on sale of oil and gas assets | — | — | — | — | — | — | ||||||||||||||||||
| Impairment of oil and gas producing properties | — | — | 0.54 | — | — | 1.35 | ||||||||||||||||||
| Cumulative Effect of Change in Accounting | — | — | — | — | — | — | ||||||||||||||||||
| Adjustment of loss on sale of oil and gas assets | (0.06 | ) | — | — | — | — | — | |||||||||||||||||
| Pension settlement loss | 0.01 | — | — | — | — | — | ||||||||||||||||||
| Earnings before items impacting comparability | 0.61 | 0.60 | 0.71 | 0.88 | 1.73 | 0.31 | ||||||||||||||||||
International | ||||||||||||||||||||||||
| Reported earnings | 0.07 | |||||||||||||||||||||||
| Cumulative Effect of Change in Accounting | — | see | ||||||||||||||||||||||
| Pension settlement loss | — | “Discontinued | ||||||||||||||||||||||
| Tax rate change | (0.06 | ) | Operations” | |||||||||||||||||||||
| Repatriation tax | below | |||||||||||||||||||||||
| Earnings before items impacting comparability | 0.01 | |||||||||||||||||||||||
Energy Marketing | ||||||||||||||||||||||||
| Reported earnings | 0.07 | 0.06 | 0.07 | 0.09 | 0.07 | 0.01 | ||||||||||||||||||
| Resolution of a purchased gas contingency | — | — | — | (0.03 | ) | — | — | |||||||||||||||||
| Pension settlement loss | — | — | — | — | — | — | ||||||||||||||||||
| Earnings before items impacting comparability | 0.07 | 0.06 | 0.07 | 0.06 | 0.07 | 0.01 | ||||||||||||||||||
Corporate and All Other | ||||||||||||||||||||||||
| Reported earnings | 0.07 | (0.02 | ) | 0.07 | 0.14 | 0.01 | 0.01 | |||||||||||||||||
| Pension settlement loss | 0.02 | — | — | — | — | — | ||||||||||||||||||
| Adjustment of gain on sale of timber properties | 0.01 | |||||||||||||||||||||||
| Gain on sale of turbine | (0.01 | ) | — | |||||||||||||||||||||
| Gain on life insurance policies | (0.03 | ) | ||||||||||||||||||||||
| Impairment of investment in partnership | 0.01 | |||||||||||||||||||||||
| Earnings before items impacting comparability | 0.10 | (0.02 | ) | 0.07 | 0.14 | 0.01 | (0.01 | ) | ||||||||||||||||
Consolidated | ||||||||||||||||||||||||
| Reported earnings | 2.01 | |||||||||||||||||||||||
| Total items impacting comparability from above | (0.03 | ) | ||||||||||||||||||||||
| Earnings before items impacting comparability | $ | 1.98 | ||||||||||||||||||||||
Consolidated Earnings from Continuing Operations | ||||||||||||||||||||||||
| Reported earnings from continuing operations | 1.81 | 1.61 | 3.96 | 3.18 | (0.53 | ) | ||||||||||||||||||
| Total items impacting comparability from above | (0.08 | ) | 0.44 | (1.70 | ) | (0.01 | ) | 1.33 | ||||||||||||||||
| Earnings from continuing operations before items impacting comparability | $ | 1.73 | $ | 2.05 | $ | 2.26 | $ | 3.17 | $ | 0.80 | ||||||||||||||
Discontinued Operations | ||||||||||||||||||||||||
| Reported earnings from discontinued operations | 0.42 | |||||||||||||||||||||||
Consolidated | ||||||||||||||||||||||||
| Reported earnings | $ | 2.23 | $ | 1.61 | $ | 3.96 | $ | 3.18 | $ | (0.53 | ) | |||||||||||||
Reconciliation of Pipeline & Storage Operating Revenues to
Consolidated Operating Revenues Fiscal 2008
($Millions)
Consolidated Operating Revenues Fiscal 2008
($Millions)
| Pipeline Revenues | $ | 126.7 | ||
| Storage Revenues | $ | 67.0 | ||
| Other Revenues | $ | 22.9 | ||
| Total Pipeline & Storage Revenues | $ | 216.6 | ||
| All Other Segments | $ | 2,183.8 | ||
| Total Corporation | $ | 2,400.4 | ||
Reconciliation of Pipeline & Storage O&M Expense to
Consolidated O&M Expense (From Continuing Operations)
($000s)
Consolidated O&M Expense (From Continuing Operations)
($000s)
| 3 Mos. End | ||||||||||||||||||||||||
| 2004 | 2005 | 2006 | 2007 | 2008 | 12/31/2008 | |||||||||||||||||||
| Pipeline & Storage | $ | 65,071 | $ | 65,397 | $ | 66,340 | $ | 61,230 | $ | 70,632 | $ | 16,147 | ||||||||||||
| SFAS 88 Pension Settlement | 3,026 | — | — | — | — | — | ||||||||||||||||||
| All Other Segments | 305,913 | 322,697 | 328,949 | 335,178 | 362,239 | 85,187 | ||||||||||||||||||
| Total Corporation | $ | 374,010 | $ | 388,094 | $ | 395,289 | $ | 396,408 | $ | 432,871 | $ | 101,334 | ||||||||||||
Reconciliation of Utility Segment O&M Expense to
Consolidated O&M Expense (From Continuing Operations)
($000s)
Consolidated O&M Expense (From Continuing Operations)
($000s)
| 3 Mos. End | ||||||||||||||||||||||||
| 2004 | 2005 | 2006 | 2007 | 2008 | 12/31/2008 | |||||||||||||||||||
| Utility Segment | $ | 190,669 | $ | 211,019 | $ | 204,330 | $ | 202,965 | $ | 202,745 | $ | 49,614 | ||||||||||||
| SFAS 88 Pension Settlement | 3,374 | — | — | — | — | — | ||||||||||||||||||
| All Other Segments | 179,967 | 177,075 | 190,959 | 193,443 | 230,126 | 51,720 | ||||||||||||||||||
| Total Corporation | $ | 374,010 | $ | 388,094 | $ | 395,289 | $ | 396,408 | $ | 432,871 | $ | 101,334 | ||||||||||||
Reconciliation of Utility Segment Aged Accounts Receivable to
Consolidated Accounts Receivable — Net
Consolidated Accounts Receivable — Net
| at 12/31/04 | at 12/31/05 | at 12/31/06 | at 12/31/07 | at 12/31/08 | ||||||||||||||||
| Utility Aged Accounts Receivable | $ | 67.3 | $ | 79.6 | $ | 86.6 | $ | 77.4 | $ | 86.7 | ||||||||||
| Utility Current/Other Accounts Receivable | $ | 78.7 | $ | 135.3 | $ | 62.2 | $ | 79.7 | $ | 108.0 | ||||||||||
| Utility Gross Accounts Receivable | $ | 146.0 | $ | 214.9 | $ | 148.8 | $ | 183.6 | $ | 194.7 | ||||||||||
| Utility Reserve for Bad Debt | $ | (15.1 | ) | $ | (31.5 | ) | $ | (34.2 | ) | $ | (32.7 | ) | $ | (37.5 | ) | |||||
| Utility Net Accounts Receivable | $ | 130.9 | $ | 183.4 | $ | 114.6 | $ | 150.9 | $ | 157.2 | ||||||||||
| All Other Segments Gross Accounts Receivable | $ | 71.5 | $ | 107.6 | $ | 79.5 | $ | 92.9 | $ | 75.9 | ||||||||||
| All Other Segments Reserve for Bad Debts | $ | (4.7 | ) | $ | (1.8 | ) | $ | (1.5 | ) | $ | (1.4 | ) | $ | (3.9 | ) | |||||
| All Other Segments Net Accounts Receivable | $ | 66.8 | $ | 105.8 | $ | 78.0 | $ | 91.5 | $ | 72.0 | ||||||||||
| Total Corporation Accounts Receivable — Net | $ | 197.7 | $ | 289.2 | $ | 192.6 | $ | 242.4 | $ | 229.2 | ||||||||||
Reconciliation of National Fuel Gas Expenditures for Long-lived Assets to
Consolidated Net Cash Used in Investing Activities
(‘000)
Consolidated Net Cash Used in Investing Activities
(‘000)
| 3 Mos. End | ||||||||||||||||||||||||
| 2004 | 2005 | 2006 | 2007 | 2008 | 12/31/2008 | |||||||||||||||||||
| Capital Expenditures | $ | (172,341 | ) | $ | (219,530 | ) | $ | (294,159 | ) | $ | (276,728 | ) | $ | (414,502 | ) | $ | (84,268 | ) | ||||||
| Investment in Subsidiaries, Net of Cash — Empire Connector | $ | — | $ | — | $ | — | $ | — | $ | (16,768 | ) | $ | 16,768 | |||||||||||
| Investment in Subsidiaries, Net of Cash — Lease Acquisition Costs (primarily PA DCNR) | $ | — | $ | — | $ | — | $ | — | $ | — | $ | (51,741 | ) | |||||||||||
| Investment in Partnerships | $ | — | $ | — | $ | — | $ | (3,300 | ) | $ | — | $ | — | |||||||||||
| Expenditures for Long Lived Assets | $ | (172,341 | ) | $ | (219,530 | ) | $ | (294,159 | ) | $ | (280,028 | ) | $ | (397,734 | ) | $ | (119,241 | ) | ||||||
| Cash Expenditures for Long Lived Assets | $ | (172,341 | ) | $ | (219,530 | ) | $ | (294,159 | ) | $ | (280,028 | ) | $ | (397,734 | ) | $ | (119,241 | ) | ||||||
| Net Proceeds from Sale of Foreign Subsidiary | $ | — | $ | 111,619 | $ | — | $ | 232,092 | $ | — | $ | — | ||||||||||||
| Cash Held in Escrow | $ | (58,248 | ) | $ | 58,397 | $ | — | |||||||||||||||||
| Net Proceeds from Sale of Oil and Gas Producing Properties | $ | 7,162 | $ | 1,349 | $ | 13 | $ | 5,137 | $ | 5,969 | $ | — | ||||||||||||
| Investment in Subsidiaries, Net of Cash — Empire Connector | $ | — | $ | — | $ | — | $ | — | $ | — | $ | (16,768 | ) | |||||||||||
| Investment in Subsidiaries, Net of Cash — Lease Acquisition Costs (primarily PA DCNR) | $ | — | $ | — | $ | — | $ | — | $ | — | $ | 51,741 | ||||||||||||
| Other | $ | 1,974 | $ | 3,238 | $ | (3,230 | ) | $ | (725 | ) | $ | 4,376 | $ | (632 | ) | |||||||||
| Net Cash Used in Investing Activities | $ | (163,205 | ) | $ | (103,324 | ) | $ | (297,376 | ) | $ | (101,772 | ) | $ | (328,992 | ) | $ | (84,900 | ) | ||||||
Reconciliation of Exploration & Production Segment Capital Expenditures to
Consolidated Capital Expenditures
($000s)
Consolidated Capital Expenditures
($000s)
| 2006 | 2007 | 2008 | 2009 Forecast | 2010 Forecast | ||||||||||||||||
| Exploration & Production Capital Expenditures | $ | 166,535 | $ | 146,687 | $ | 192,187 | $ | 227,000 | $ | 227,000 | ||||||||||
| All Other | $ | 127,624 | $ | 130,041 | $ | 222,315 | $ | 132,000 | $ | 137,000 | ||||||||||
| Total Corporation | $ | 294,159 | $ | 276,728 | $ | 414,502 | $ | 359,000 | $ | 364,000 | ||||||||||
Reconciliation of Exploration & Production Operating Revenue to
Consolidated Operating Revenue
($000s)
Consolidated Operating Revenue
($000s)
| 2008 | ||||
| Exploration & Production | $ | 466,760 | ||
| All Other Segments | 1,933,601 | |||
| Consolidated Operating Revenue | $ | 2,400,361 | ||
Reconciliation of Exploration & Production Net Income to
Consolidated Net Income
($000s)
Consolidated Net Income
($000s)
| 2005 | 2006 | 2007 | 2008 | |||||||||||||
| Exploration & Production (Income from Continuing Operations) | $ | 35,581 | $ | 67,494 | $ | 74,889 | $ | 146,612 | ||||||||
| Income from Discontinued Operations, Net of Tax | 15,078 | (46,523 | ) | 15,479 | — | |||||||||||
| Gain on Disposal of Discontinued Operations, Net of Tax | — | — | 120,301 | — | ||||||||||||
| Total Exploration & Production | $ | 50,659 | $ | 20,971 | $ | 210,669 | $ | 146,612 | ||||||||
| All Other Segments | 138,829 | 117,120 | 126,786 | 122,116 | ||||||||||||
| Consolidated Net Income | $ | 189,488 | $ | 138,091 | $ | 337,455 | $ | 268,728 | ||||||||