| AGA Financial Forum May 2009 Exhibit 99 |

| Safe Harbor For Forward Looking Statements This presentation may contain "forward-looking statements" as defined by the Private Securities Litigation Reform Act of 1995, including statements regarding future prospects, plans, performance and capital structure, anticipated capital expenditures and completion of construction projects, as well as statements that are identified by the use of the words "anticipates," "estimates," "expects," "forecasts," "intends," "plans," "predicts," "projects," "believes," "seeks," "will," "may," and similar expressions. Forward-looking statements involve risks and uncertainties, which could cause actual results or outcomes to differ materially from those expressed in the forward-looking statements. The Company's expectations, beliefs and projections contained herein are expressed in good faith and are believed to have a reasonable basis, but there can be no assurance that such expectations, beliefs or projections will result or be achieved or accomplished. In addition to other factors, the following are important factors that could cause actual results to differ materially from results referred to in the forward-looking statements: financial and economic conditions, including the availability of credit, and their effect on the Company's ability to obtain financing on acceptable terms for working capital, capital expenditures and other investments; occurrences affecting the Company's ability to obtain financing under credit lines or other credit facilities or through the issuance of commercial paper, other short-term notes or debt or equity securities, including any downgrades in the Company's credit ratings and changes in interest rates and other capital market conditions; changes in economic conditions, including global, national or regional recessions, and their effect on the demand for, and customers' ability to pay for, the Company's products and services; the creditworthiness or performance of the Company's key suppliers, customers and counterparties; economic disruptions or uninsured losses resulting from terrorist activities, acts of war, major accidents, fires, hurricanes, other severe weather, pest infestation or other natural disasters; changes in actuarial assumptions, the interest rate environment and the return on plan/trust assets related to the Company's pension and other post-retirement benefits, which can affect future funding obligations and costs and plan liabilities; changes in demographic patterns and weather conditions; changes in the availability and/or price of natural gas or oil and the effect of such changes on the accounting treatment of derivative financial instruments or the valuation of the Company's natural gas and oil reserves; impairments under the SEC's full cost ceiling test for natural gas and oil reserves; uncertainty of oil and gas reserve estimates; factors affecting the Company's ability to successfully identify, drill for and produce economically viable natural gas and oil reserves, including among others geology, lease availability, weather conditions, shortages, delays or unavailability of equipment and services required in drilling operations, and the need to obtain governmental approvals and permits and comply with environmental laws and regulations; significant differences between the Company's projected and actual production levels for natural gas or oil; changes in the availability and/or price of derivative financial instruments; changes in the price differentials between oil having different quality and/or different geographic locations, or changes in the price differentials between natural gas having different heating values and/or different geographic locations; inability to obtain new customers or retain existing ones; significant changes in competitive factors affecting the Company; changes in laws and regulations to which the Company is subject, including tax, environmental, safety and employment laws and regulations; governmental/regulatory actions, initiatives and proceedings, including those involving acquisitions, financings, rate cases (which address, among other things, allowed rates of return, rate design and retained natural gas), affiliate relationships, industry structure, franchise renewal, and environmental/safety requirements; unanticipated impacts of restructuring initiatives in the natural gas and electric industries; significant differences between the Company's projected and actual capital expenditures and operating expenses and unanticipated project delays or changes in project costs or plans; the nature and projected profitability of pending and potential projects and other investments, and the ability to obtain necessary governmental approvals and permits; ability to successfully identify and finance acquisitions or other investments and ability to operate and integrate existing and any subsequently acquired business or properties; significant changes in tax rates or policies or in rates of inflation or interest; significant changes in the Company's relationship with its employees or contractors and the potential adverse effects if labor disputes, grievances or shortages were to occur; changes in accounting principles or the application of such principles to the Company; the cost and effects of legal and administrative claims against the Company or activist shareholder campaigns to effect changes at the Company; increasing health care costs and the resulting effect on health insurance premiums and on the obligation to provide other post-retirement benefits; or increasing costs of insurance, changes in coverage and the ability to obtain insurance. For a discussion of these risks and other factors that could cause actual results to differ materially from results referred to in the forward-looking statements, see "Risk Factors" in the Company's Form 10-K for the fiscal year ended September 30, 2008 and the Company's Forms 10-Q for the quarters ended December 31, 2008 and March 31, 2009. The Company disclaims any obligation to update any forward-looking statements to reflect events or circumstances after the date hereof or to reflect the occurrence of unanticipated events. |
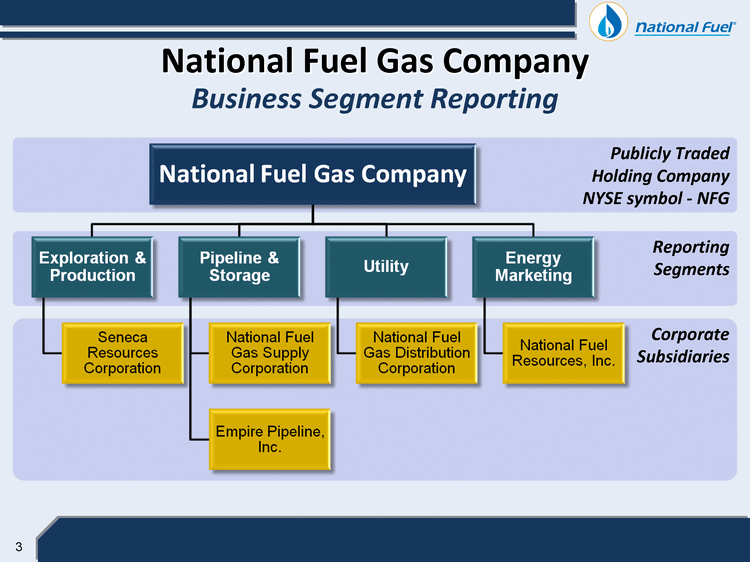
| National Fuel Gas Company Business Segment Reporting Publicly Traded Holding Company NYSE symbol - NFG Exploration #038; Production Pipeline & Storage Utility Energy Marketing Seneca Resources Corporation National Fuel Gas Supply Corporation National Fuel Gas Distribution Corporation National Fuel Resources, Inc. Empire Pipeline, Inc. Reporting Segments Corporate Subsidiaries |
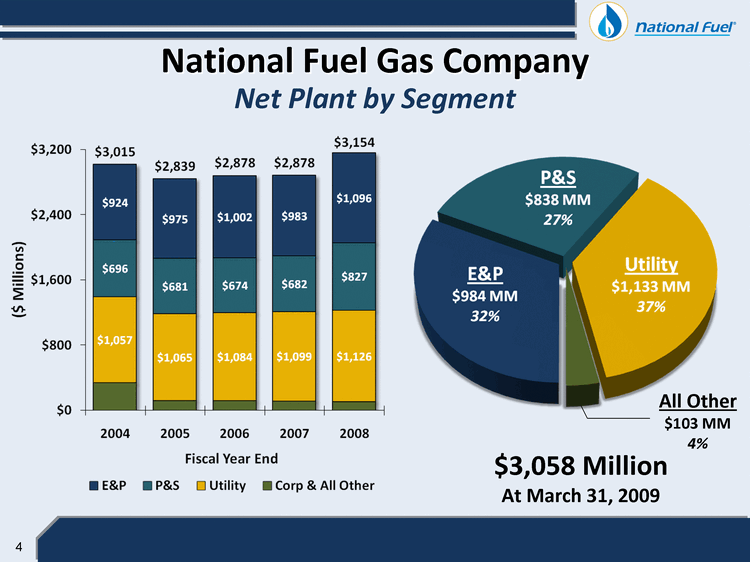
| Net Plant by Segment $3,058 Million At March 31, 2009 All Other $103 MM 4% National Fuel Gas Company ($ Millions) $3,200 $2,400 $1,600 $800 $0 $3,015 $2,839 $2,878 $2,878 $3,154 $924 $696 $1,057 $975 $1,002 $983 $1,096 $681 $674 $682 $827 $1,057 $1,065 $1,099 $1,126 P&S $838 mm 27% Utility $1,133 MM 37% E&P $984 MM 32% 2004 2005 2006 2007 2008 E&P P&S Utility Corp & All Other All Other $103 MM 4% |
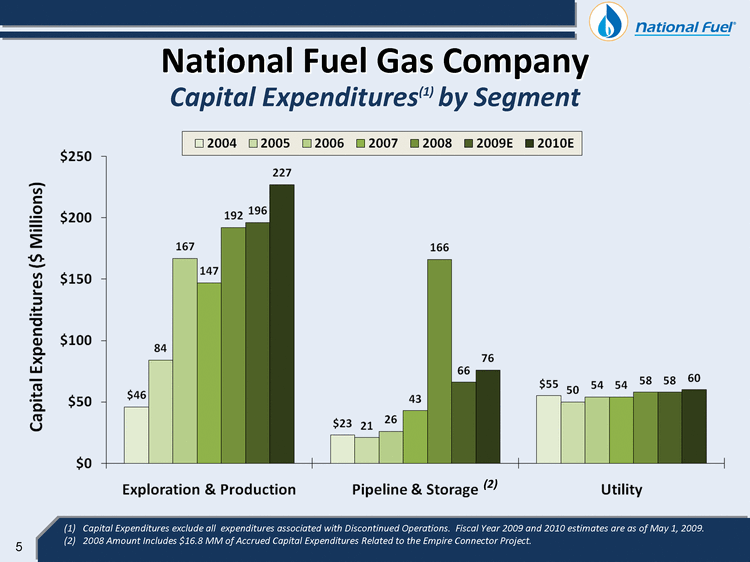
| National Fuel Gas Company Capital Expenditures(1) by Segment Capital Expenditures exclude all expenditures associated with Discontinued Operations. Fiscal Year 2009 and 2010 estimates are as of May 1, 2009. 2008 Amount Includes $16.8 MM of Accrued Capital Expenditures Related to the Empire Connector Project. (2) 2004 2005 2006 2007 2008 2009E 2010E Capital Expenditures ($ Millions) $0 $50 $100 $150 $200 $250 $46 84 167 147 192 196 277 $23 21 26 43 166 66 76 $55 50 54 54 58 58 60 Exploration & Production Pipeline & Storage (2) Utility |
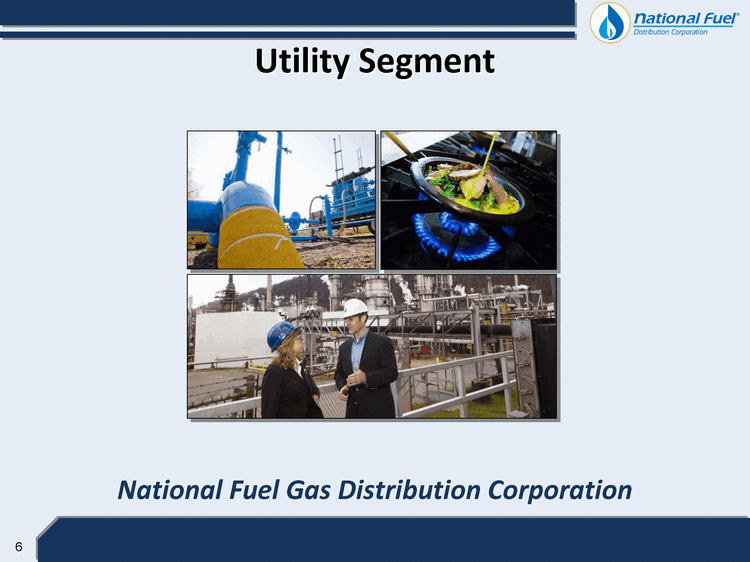
| Utility Segment National Fuel Gas Distribution Corporation |
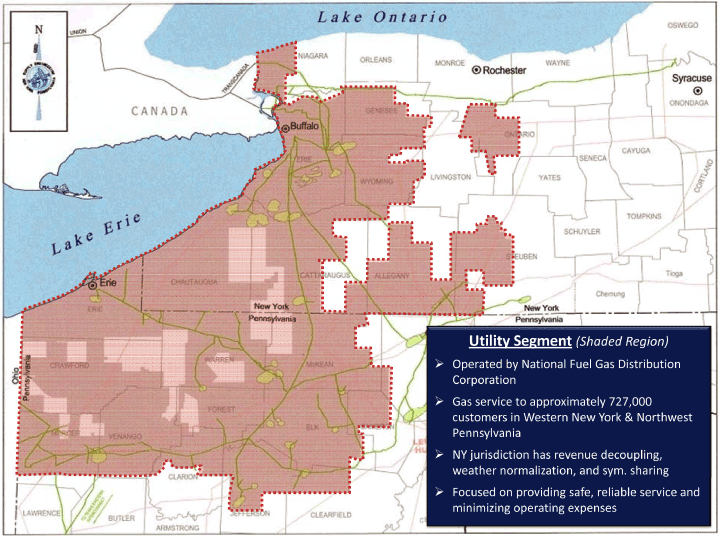
| 7 Utility Segment (Shaded Region) Operated by National Fuel Gas Distribution Corporation Gas service to approximately 727,000 customers in Western New York & Northwest Pennsylvania NY jurisdiction has revenue decoupling, weather normalization, and sym. sharing Focused on providing safe, reliable service and minimizing operating expenses |
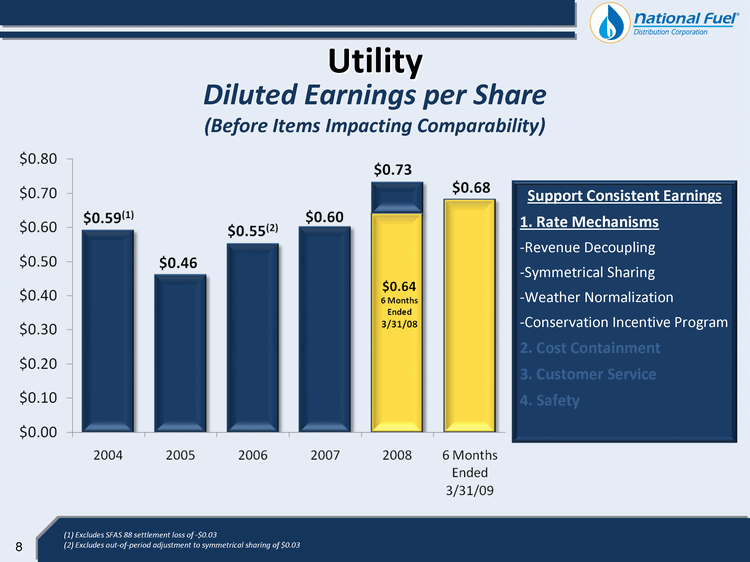
| 8 Utility (1) Excludes SFAS 88 settlement loss of -$0.03 (2) Excludes out-of-period adjustment to symmetrical sharing of $0.03 Diluted Earnings per Share (Before Items Impacting Comparability) Support Consistent Earnings 1. Rate Mechanisms - -Revenue Decoupling - -Symmetrical Sharing - -Weather Normalization - -Conservation Incentive Program 2. Cost Containment 3. Customer Service 4. Safety 2004 2005 2006 2007 2008 6 Months Ended 3/31/09 $0.80 $0.70 $0.60 $0.50 $0.40 $0.30 $0.20 $0.10 $0.00 $0.64 6 Months Ended 3/31/08 |
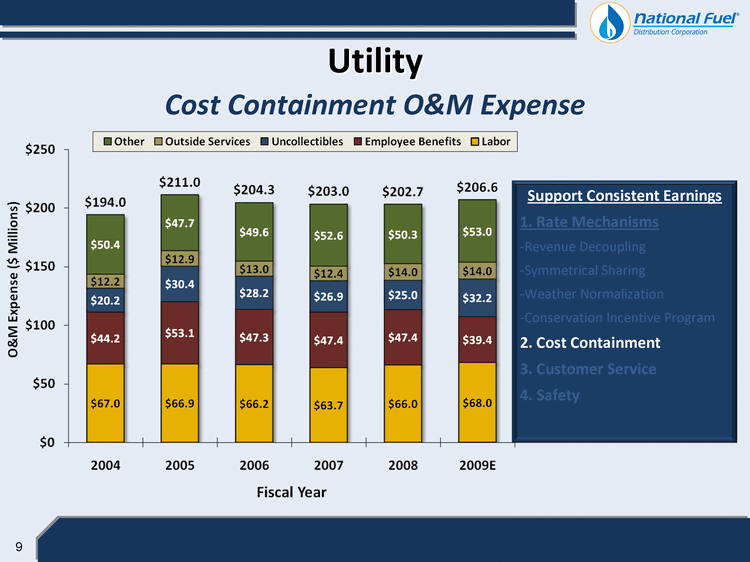
| 9 Utility Cost Containment O&M Expense Other Outside Services Uncollectibles Employee Benefits Labor $194.0 $50.4 $12.2 $20.2 $44.2 $67.0 $211.0 $47.7 $12.9 $30.4 $53.1 $66.9 $204.3 $49.6 $13.0 $28.2 $47.3 $66.2 $203.0 $52.6 $12.4 $26.9 $47.4 $63.7 $202.7 $50.3 $14.0 $25.0 $47.4 $66.0 $206.6 $53.0 $14.0 $32.2 $39.4 $68.0 2004 2005 2006 2007 2008 2009E $250 $200 $150 $100 $50 $0 Support Consistent Earnings 1. Rate Mechanisms - -Revenue Decoupling - -Symmetrical Sharing - -Weather Normalization - -Conservation Incentive Program 2. Cost Containment 3. Customer Service 4. Safety O&M Expenses ($ Millions) |
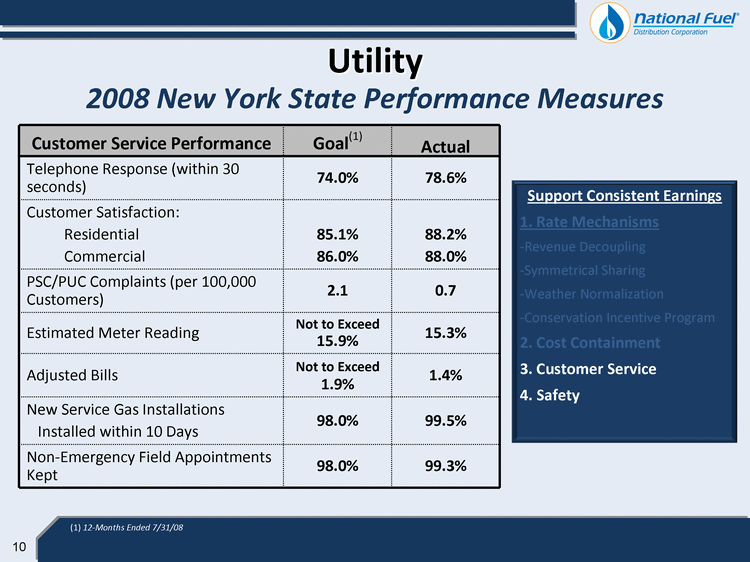
| 10 Utility (1) 12-Months Ended 7/31/08 2008 New York State Performance Measures Customer Service Performance Goal(1) Actual Telephone Response (within 30 seconds) 74.0% 78.6% Customer Satisfaction: Residential Commercial 85.1% 86.0% 88.2% 88.0% PSC/PUC Complaints (per 100,000 Customers) 2.1 0.7 Estimated Meter Reading Not to Exceed 15.9% 15.3% Adjusted Bills Not to Exceed 1.9% 1.4% New Service Gas Installations Installed within 10 Days 98.0% 99.5% Non-Emergency Field Appointments Kept 98.0% 99.3% Support Consistent Earnings 1. Rate Mechanisms - -Revenue Decoupling - -Symmetrical Sharing - -Weather Normalization - -Conservation Incentive Program 2. Cost Containment 3. Customer Service 4. Safety |

| 11 National Fuel Gas Supply Corporation Empire Pipeline, Inc. Pipeline & Storage |
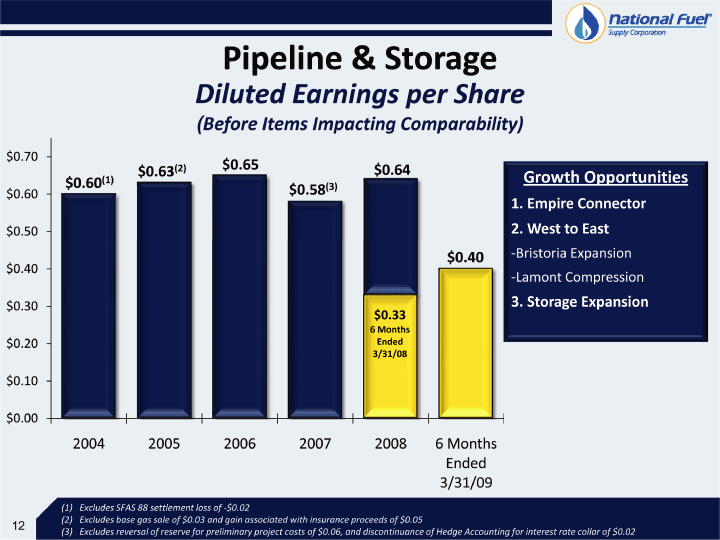
| 12 Pipeline & Storage (1) Excludes SFAS 88 settlement loss of -$0.02 (2) Excludes base gas sale of $0.03 and gain associated with insurance proceeds of $0.05 (3) Excludes reversal of reserve for preliminary project costs of $0.06, and discontinuance of Hedge Accounting for interest rate collar of $0.02 Diluted Earnings per Share (Before Items Impacting Comparability) Growth Opportunities 1. Empire Connector 2. West to East - -Bristoria Expansion - -Lamont Compression 3. Storage Expansion |
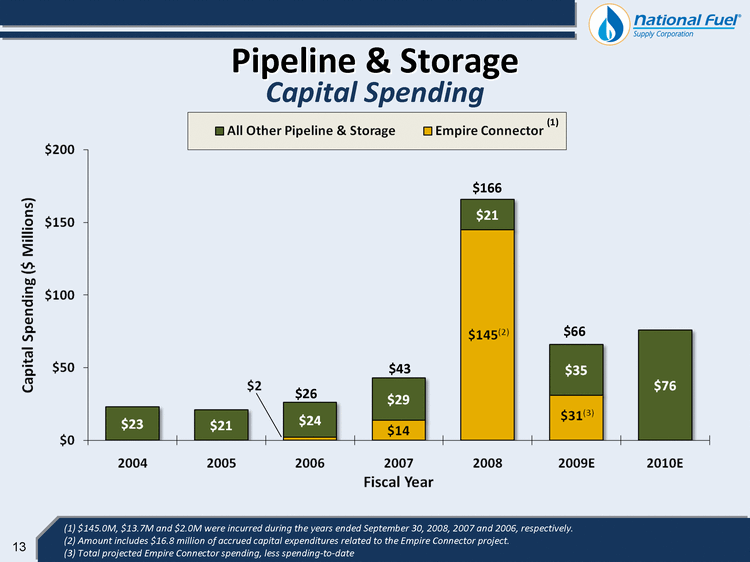
| 13 Pipeline & Storage Capital Spending All Other Pipeline & Storage Empire Connector(1) $200 $150 $100 $50 $0 Capital Spending($ Millions) (1) $145.0M, $13.7M and $2.0M were incurred during the years ended September 30, 2008, 2007 and 2006, respectively. (2) Amount includes $16.8 million of accrued capital expenditures related to the Empire Connector project. (3) Total projected Empire Connector spending, less spending-to-date Pipeline & Storage $23 $21 $2 $26 $24 $43 $29 $14 $166 $21 $145(2) $66 $35 $31(3) $76 2004 2005 2006 2007 2008 2009E 2010E |
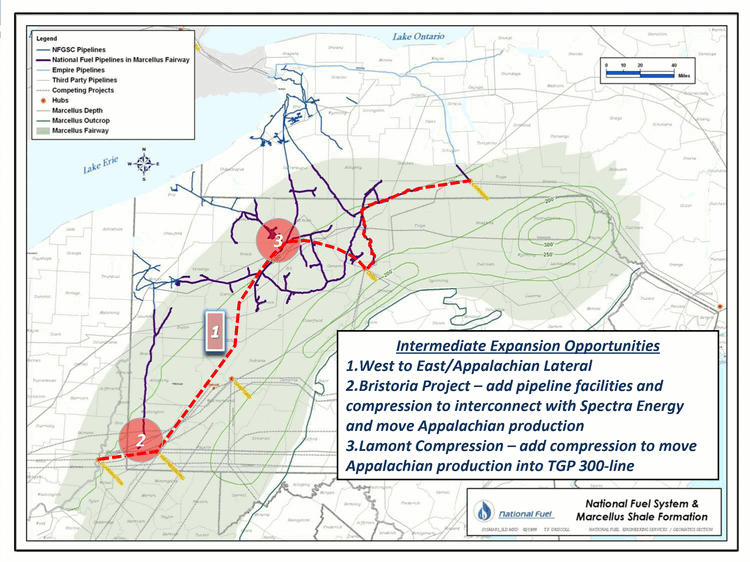
| 14 Intermediate Expansion Opportunities 1. West to East/Appalachian Lateral 2. Bristoria Project - add pipeline facilities and compression to interconnect with Spectra Energy and move Appalachian production 3. Lamont Compression - add compression to move Appalachian production into TGP 300-line |
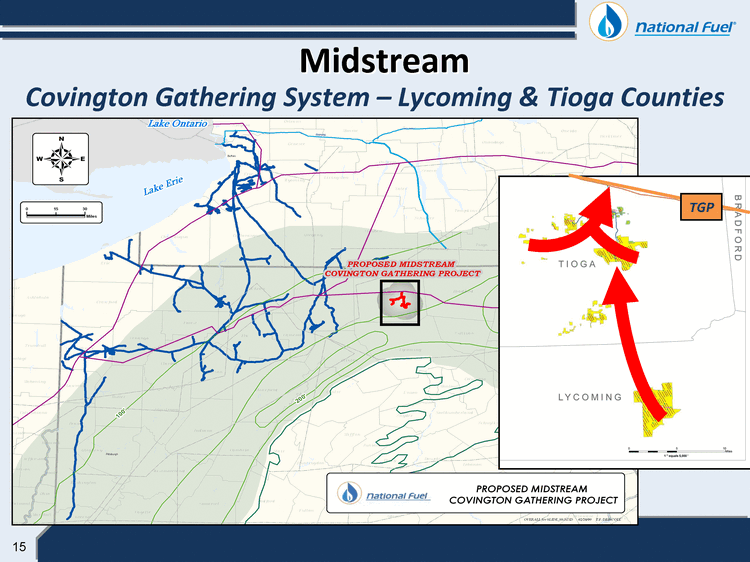
| 15 Midstream Covington Gathering System - Lycoming & Tioga Counties |
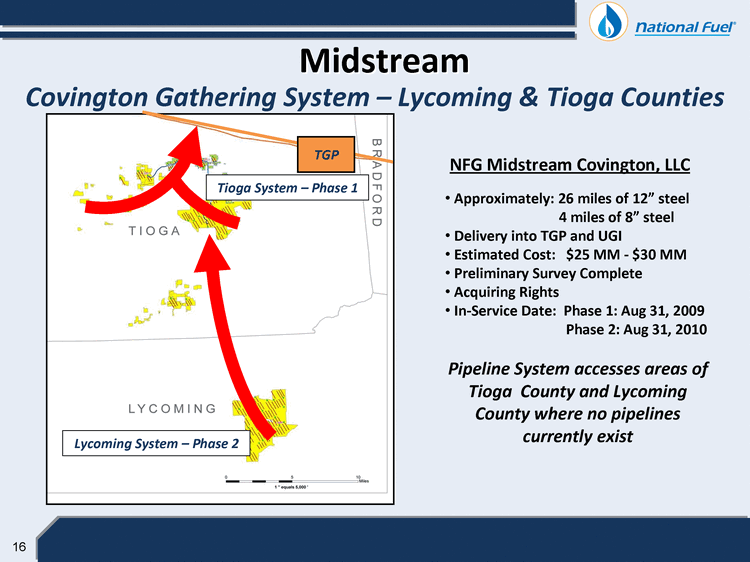
| 16 NFG Midstream Covington, LLC Approximately: 26 miles of 12" steel 4 miles of 8" steel Delivery into TGP and UGI Estimated Cost: $25 MM - $30 MM Preliminary Survey Complete Acquiring Rights In-Service Date: Phase 1: Aug 31, 2009 Phase 2: Aug 31, 2010 Pipeline System accesses areas of Tioga County and Lycoming County where no pipelines currently exist Midstream Covington Gathering System - Lycoming & Tioga Counties Tioga System - Phase 1 Lycoming System - Phase 2 |
| 17 Exploration & Production Seneca Resources Corporation |
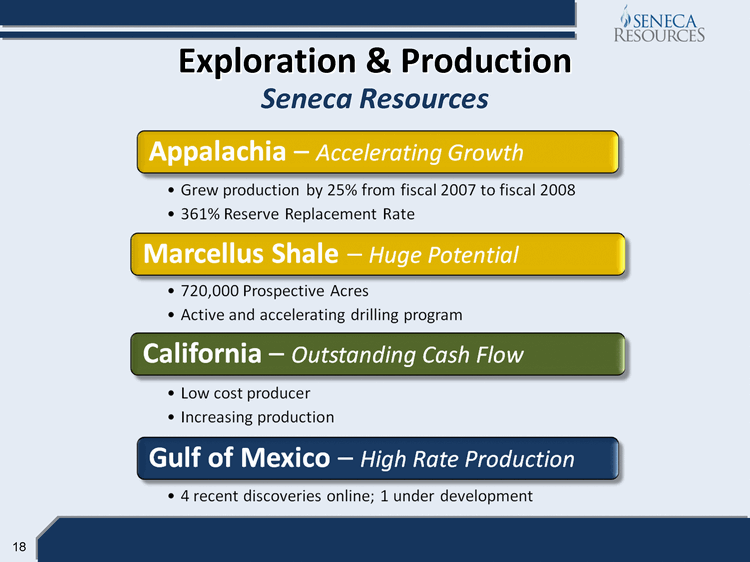
| 18 Exploration & Production Appalachia Accelerating Growth Grew production by from fiscal to fiscal 361% Reserve Replacement Rate Marcellus Shale Huge Potential 720,000 Prospective Acres Active and accelerating drilling program California Outstanding Cash Flow Low cost producer Increasing production Gulf of Mexico High Rate Production 4 recent discoveries online; 1 under development Seneca Resources |
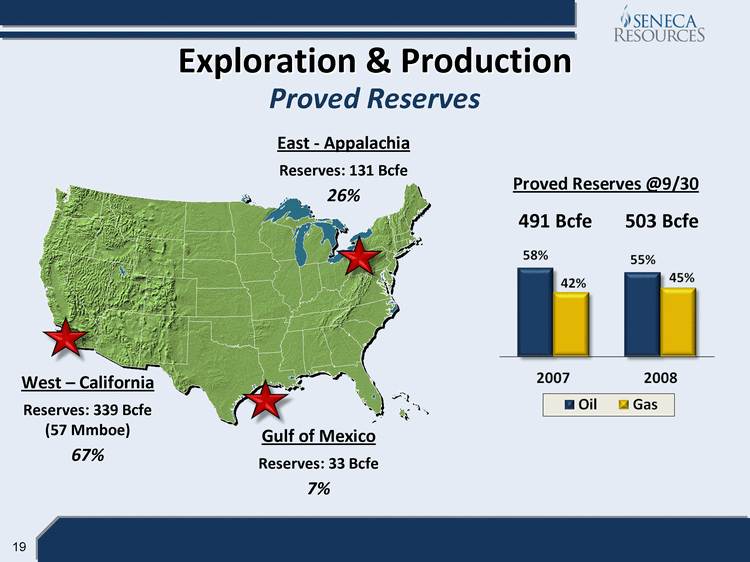
| 19 Exploration & Production Proved Reserves Proved Reserves @9/30 491 Bcfe 503 Bcfe West - California Reserves: 339 Bcfe (57 Mmboe) 67% Gulf of Mexico Reserves: 33 Bcfe 7% East - Appalachia Reserves: 131 Bcfe 26% |
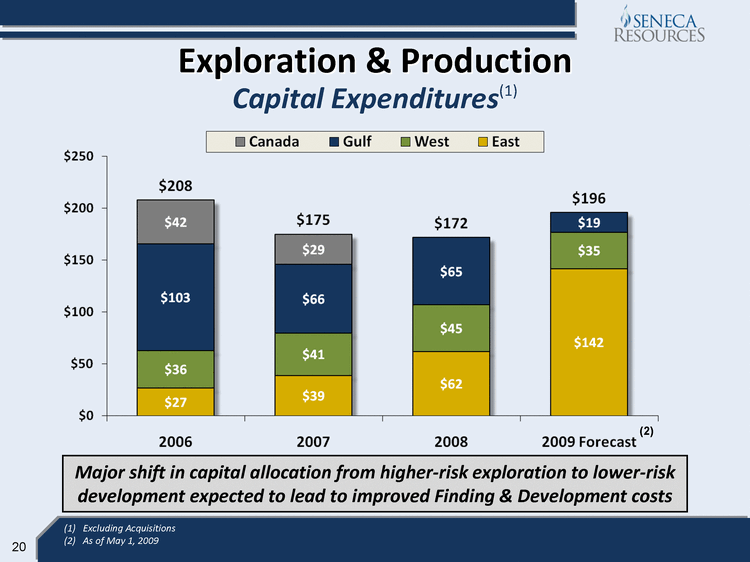
| 20 Exploration & Production Capital Expenditures(1) $208 $42 $103 $36 $27 $175 $29 $66 $41 $39 $172 $65 $45 $62 $196 $19 $35 $142 $250 $200 $150 $100 $50 $0 2006 2007 2008 2009 Forecast(2) Major shift in capital allocation from higher-risk exploration to lower-risk development expected to lead to improved Finding & Development costs Excluding Acquisitions As of May 1, 2009 (1) Excluding Acquisitions (2) As of May 1, 2009 |
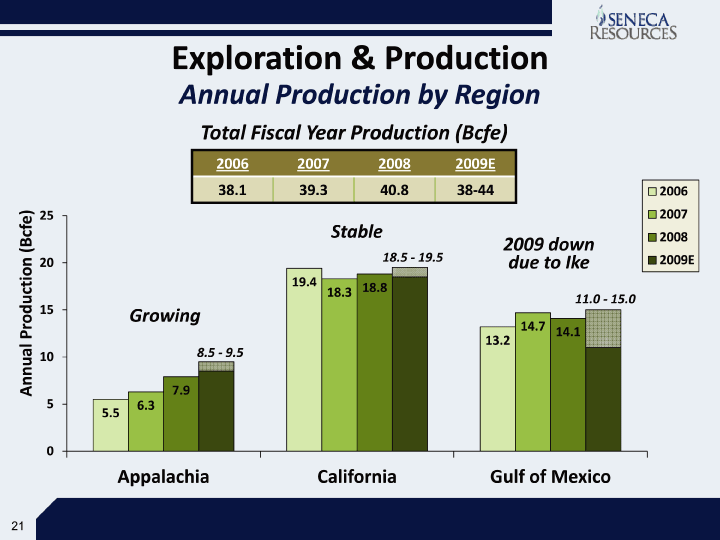
| 21 Exploration & Production Annual Production by Region Growing Total Fiscal Year Production (Bcfe) 2006 2007 2008 2009E 38.1 39.3 40.8 38-44 Annual Production (Bcfe) 0 5 10 15 20 25 5.5 6.3 7.9 8.5-9.5 19.4 18.3 18.8 18.5-19.5 13.2 14.7 14.1 11.0-15.0 Appalachia California Gulf of Mexico Stable 2009 down due to Ike |
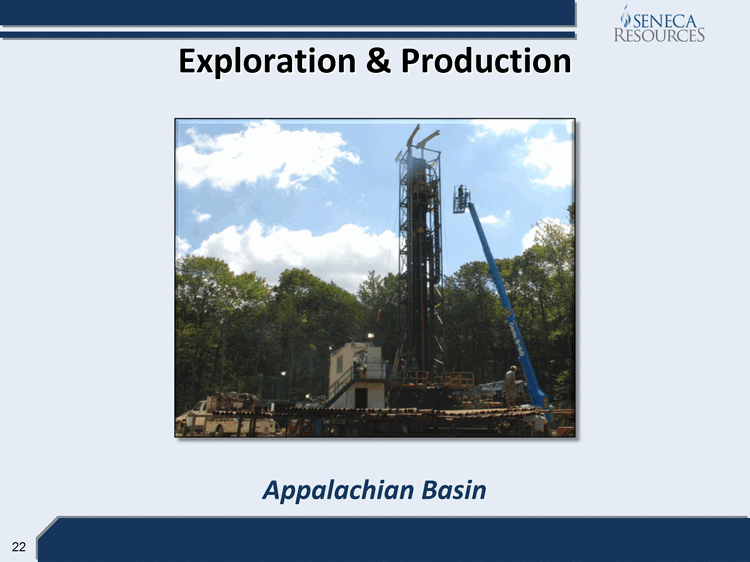
| 22 Exploration & Production Appalachian Basin |
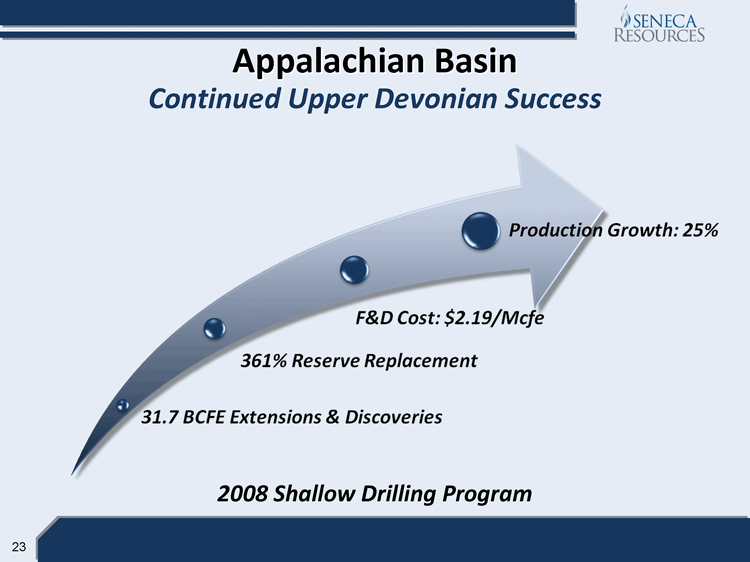
| 23 Appalachian Basin Continued Upper Devonian Success Production Growth: 25% F&DC Cost: 2.19/Mcfe 361% Reserve Replacement 31.7 BCFE Extensions & Discoveries 2008 Shallow Drilling Program |
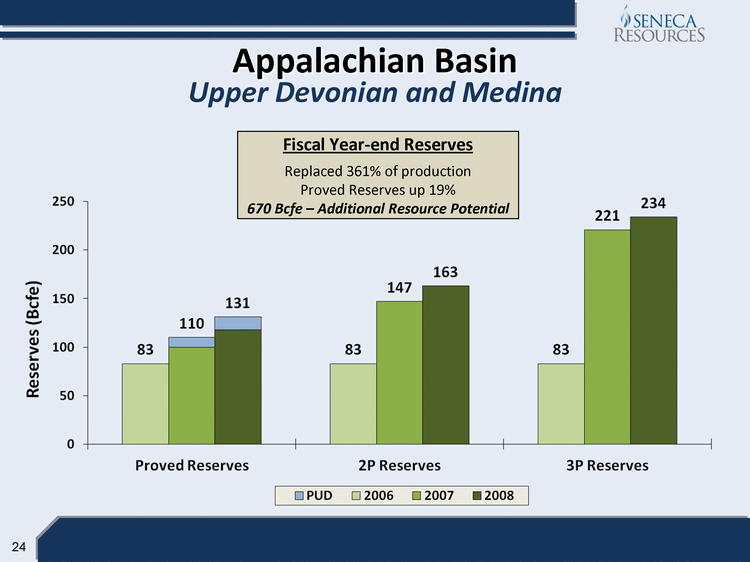
| 24 Appalachian Basin Upper Devonian and Medina Fiscal Year-end Reserves Replaced 361% of production Proved Reserves up 19% 0 50 100 150 200 250 83 110 131 83 147 163 83 221 234 Proved Reserves 2P Reserves 3P Reserves 670 Bcfe - Additional Resource Potential PUD 2006 2007 2008 |
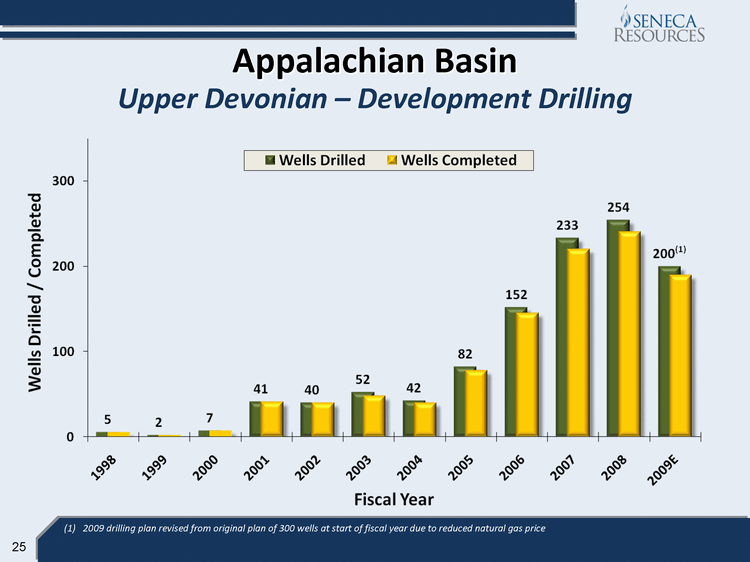
| 25 Appalachian Basin Upper Devonian - Development Drilling 0 100 200 300 5 2 7 41 40 52 42 82 152 233 254 200(1) 1998 1999 2000 2001 2002 2003 2004 2005 2006 2007 2008 2009E Fiscal Year (1) 2009 drilling plan revised from original plan of 300 wells at start of fiscal year due to reduced natural gas price |
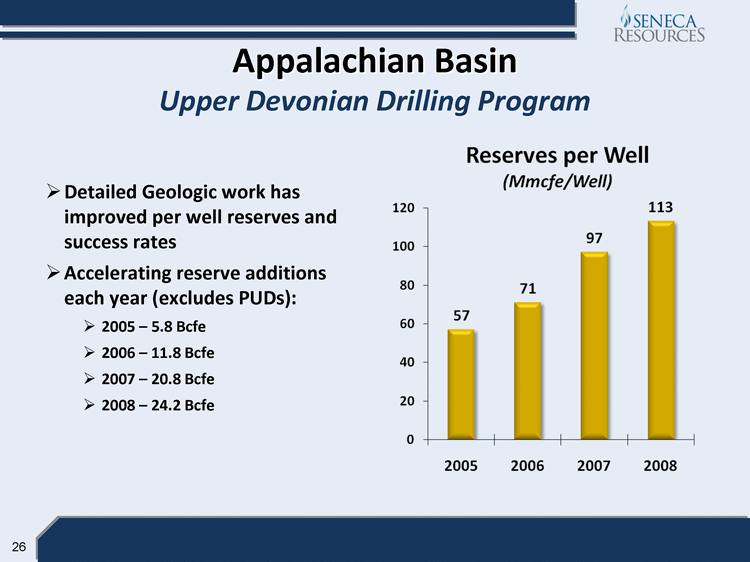
| 26 Appalachian Basin Upper Devonian Drilling Program Detailed Geologic work has improved per well reserves and success rates Accelerating reserve additions each year (excludes PUDs): 2005 - 5.8 Bcfe 2006 - 11.8 Bcfe 2007 - 20.8 Bcfe 2008 - 24.2 Bcfe 0 20 40 60 80 100 120 57 71 97 113 2005 2006 2007 2008 |
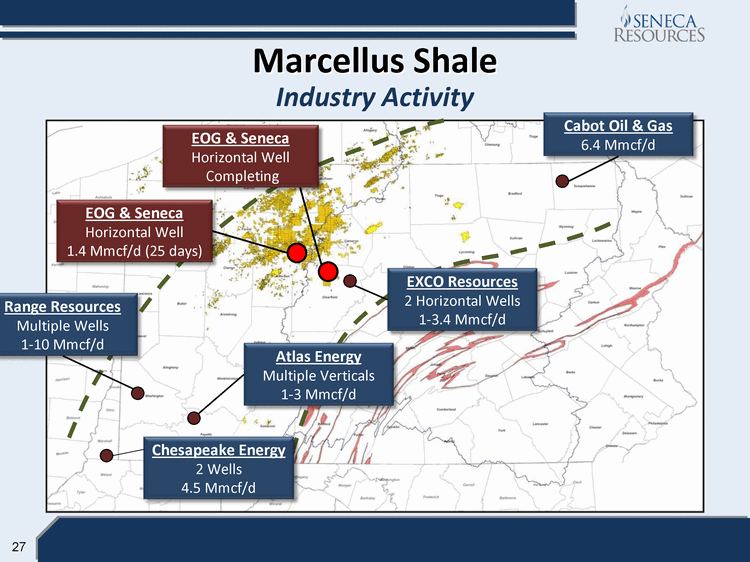
| 27 Marcellus Shale Industry Activity Range Resources Multiple Wells 1-10 Mmcf/d Atlas Energy Multiple Verticals 1-3 Mmcf/d Chesapeake Energy 2 Wells 4.5 Mmcf/d EXCO Resources 2 Horizontal Wells 1-3.4 Mmcf/d Cabot Oil & Gas 6.4 Mmcf/d EOG & Seneca Horizontal Well 1.4 Mmcf/d (25 days) EOG & Seneca Horizontal Well Completing |
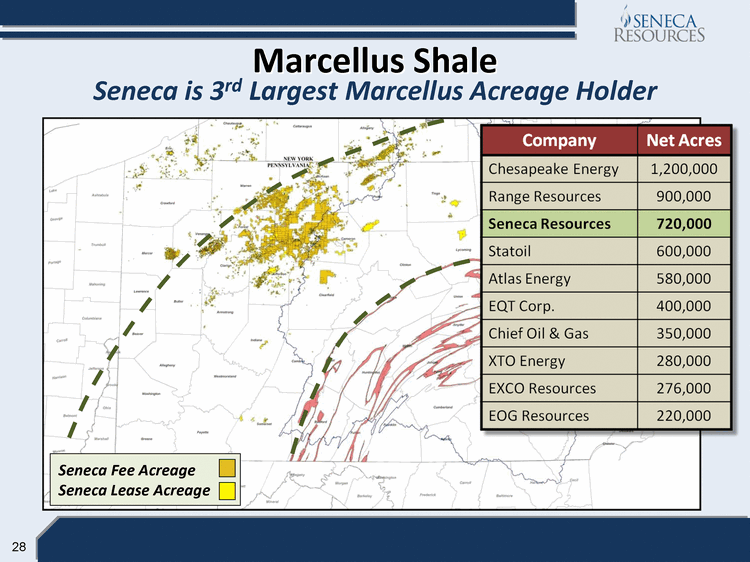
| 28 Marcellus Shale Seneca Fee Acreage Seneca Lease Acreage Seneca is 3rd Largest Marcellus Acreage Holder Company Net Acres Chesapeake Energy 1,200,000 Range Resources 900,000 Seneca Resources 720,000 Statoil 600 000 600,000 Atlas Energy 580,000 EQT Corp. 400,000 Q p , Chief Oil & Gas 350,000 XTO Energy 280,000 EXCO Resources 276,000 EOG Resources 220,000 |
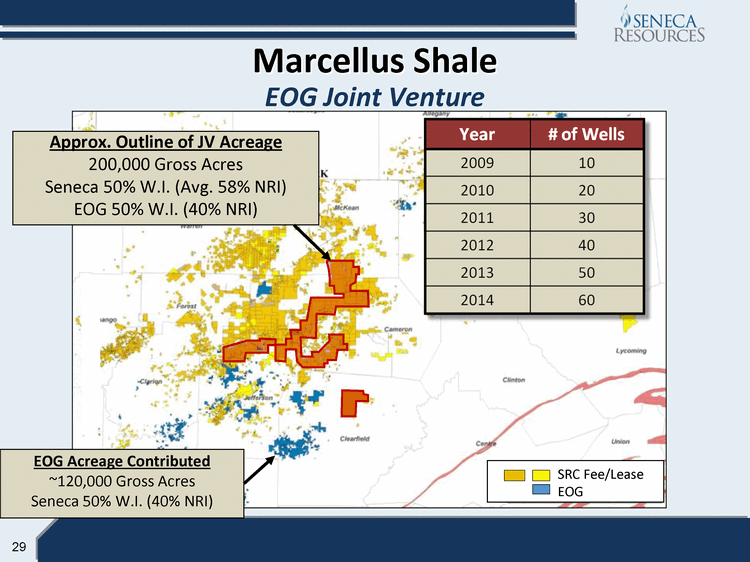
| 29 SRC Fee/Lease EOG Marcellus Shale EOG Joint Venture Approx. Outline of JV Acreage 200,000 Gross Acres Seneca 50% W.I. (Avg. 58% NRI) EOG 50% W.I. (40% NRI) Year # of Wells 2009 10 2010 20 2011 30 2012 40 2013 50 2014 60 EOG Acreage Contributed ~120,000 Gross Acres Seneca 50% W.I. (40% NRI) |

| 30 Well Type # of Wells Vertical 6 Horizontal 7 Well# IP Rate Details 1 350 Mcf/d Short Lateral; Ineffective Frac Job 2 400 Mcf/d Short Lateral 1,500 3 1,400 Mcf/d 3,500 Lateral 4,5,6 3,800 5,700 Laterals; Frac 3Q/4Q 7 5,600 Lateral; completing/testing 8 Drilling Marcellus Shale EOG JV Drilling Update Drilling Summary Horizontal Well Summary |
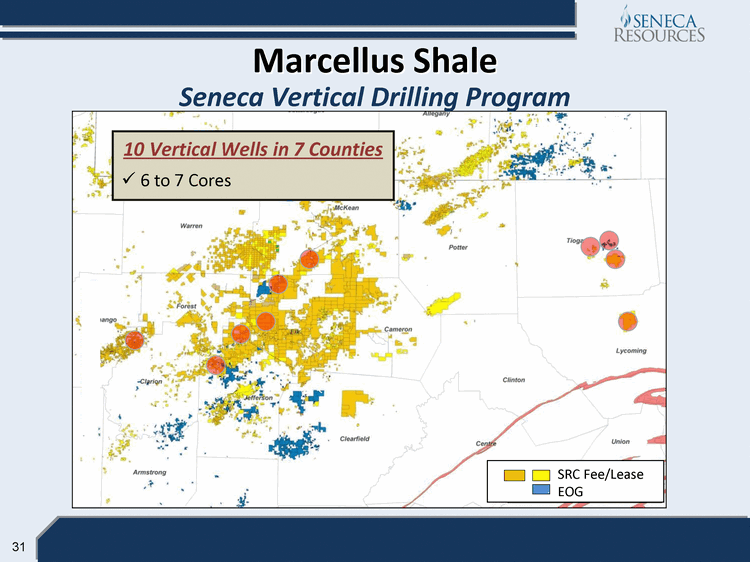
| 31 Marcellus Shale Seneca Vertical Drilling Program 10 Vertical Wells in 7 Counties 6 to 7 Cores SRC Fee/Lease EOG |
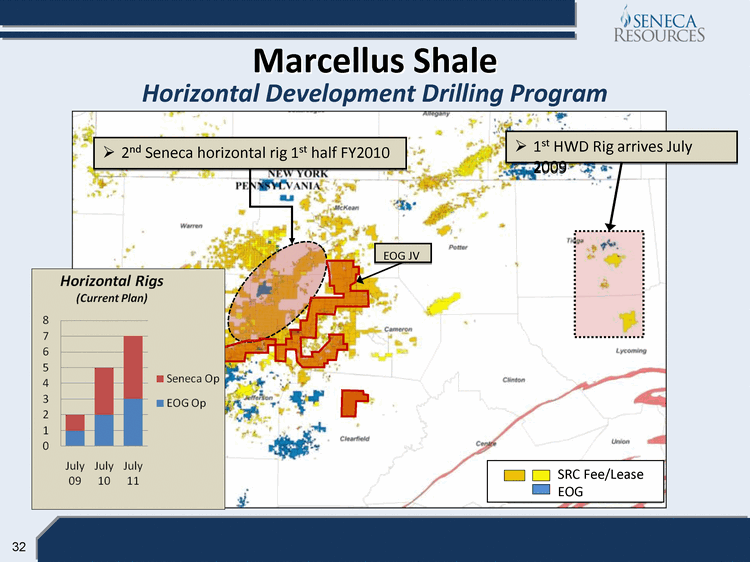
| 32 SRC Fee/Lease EOG Marcellus Shale Horizontal Development Drilling Program 1st HWD Rig arrives July 2009 2nd Seneca horizontal rig 1st half FY2010 EOG JV |
| 33 Seneca Resources Marcellus Summary 720,000 net Acres Recent test rate has validated our position EOG JV activity is accelerating Seneca operated activity has begun Major growth focus for Seneca Approximately 50% of CapEx budget for next two years Expect production of 30-40 MMCFD in 24 months |
| 34 Exploration & Production Gulf of Mexico |
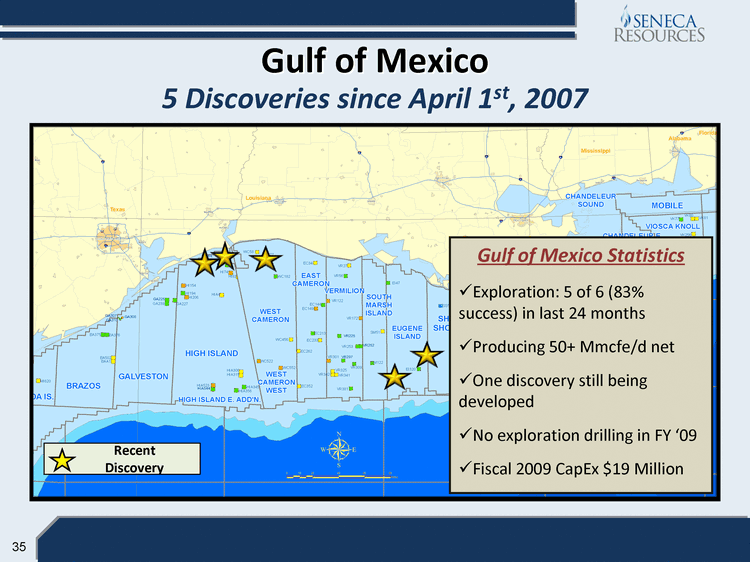
| 35 Gulf of Mexico 5 Discoveries since April 1st, 2007 Recent Discovery Gulf of Mexico Statistics Exploration: 5 of 6 (83% success) in last 24 months Producing 50+ Mmcfe/d net One discovery still being developed No exploration drilling in FY '09 Fiscal 2009 CapEx $19 Million |
| 36 Exploration & Production California |
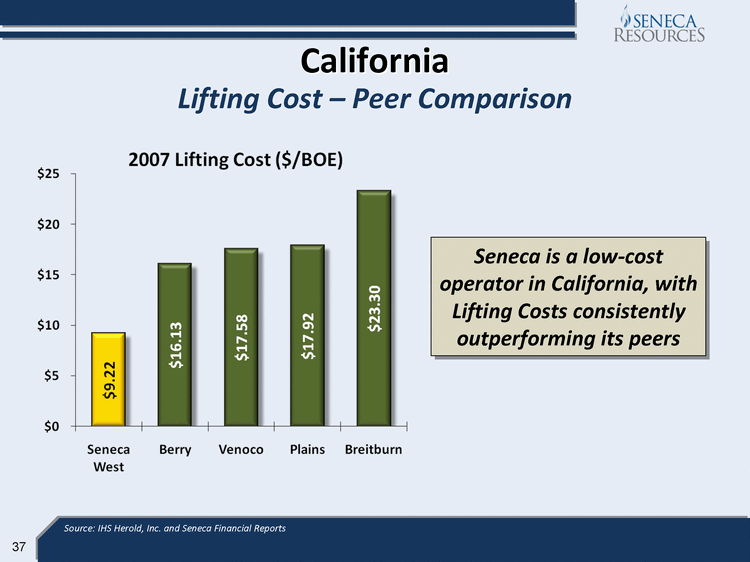
| 37 California Lifting Cost - Peer Comparison Seneca is a low-cost operator in California, with Lifting Costs consistently outperforming its peers Source: IHS Herold, Inc. and Seneca Financial Reports $0 $5 $10 $15 $20 $25 $9.22 $16.13 $17.58 $17.92 $23.30 |
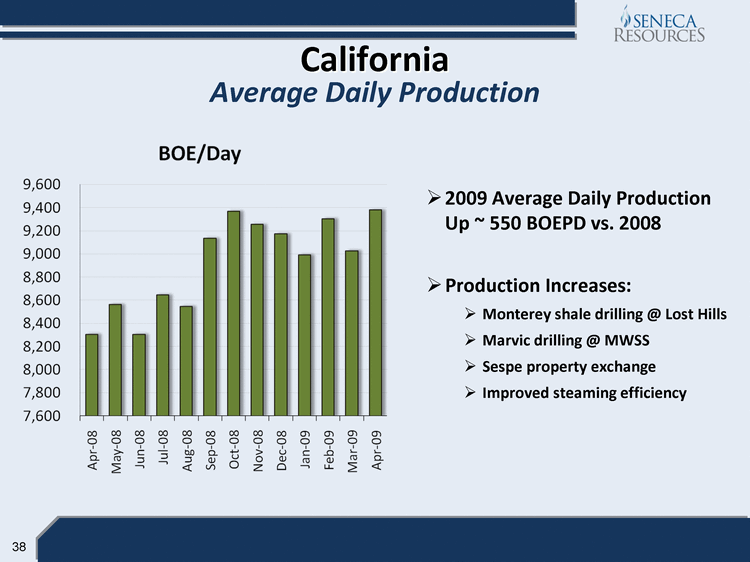
| 38 BOE/Day 9,600 9,400 9,200 9,000 8,800 8,600 8,400 8,200 8,000 7,800 7,600 Apr 08 May 08 Jun 08 Jul 08 Aug 08 Sep 08 Oct 08 Nov 08 Dec 08 Jan 09 Feb 09 Mar 09 Apr 09 California Average Daily Production 2009 Average Daily Production Up ~ 550 BOEPD vs. 2008 Production Increases: Monterey shale drilling @ Lost Hills Marvic drilling @ MWSS Sespe property exchange Improved steaming efficiency |
| 39 Seneca Resources Future Direction 2009 Plans Evaluate overall Marcellus position and establish production Maintain California production at FY '08 level Minimize spending in the Gulf Long Term Expectations Continue strategic shift to Appalachia Grow Marcellus production to 30-40 MMCFD in next 24 months Maintain production in California; utilize excess cash flow to fuel Marcellus growth |
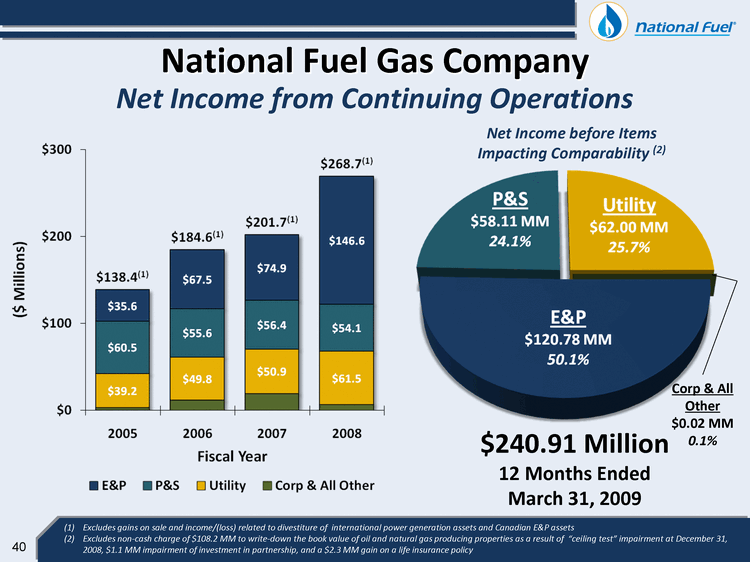
| 40 National Fuel Gas Company Net Income from Continuing Operations $268.7(1) $201.7 Net Income before Items Impacting Comparability (2) P&S $58.11 MM 24.1% Utility $62.00 MM 25 7% $146.6 $184.6(1) $201.7(1) $200 25.7% E&P $35.6 $67.5 $74.9 $138.4(1) $120.78 MM 50.1% $ $50.9 $61 5 $60.5 $55.6 $56.4 $54.1 $100 $240 91 Million $39.2 49.8 61.5 $0 2005 2006 2007 2008 240.91 Million 12 Months Ended March 31 2009 Fiscal Year E&P P&S Utility 31, Net Income from Continuing Operations $240.91 Million 12 Months Ended March 31, 2009 Corp & All Other $0.02 MM 0.1% National Fuel Gas Company (1) Excludes gains on sale and income/(loss) related to divestiture of international power generation assets and Canadian E&P assets (2) Excludes non-cash charge of $108.2 MM to write-down the book value of oil and natural gas producing properties as a result of "ceiling test" impairment at December 31, 2008, $1.1 MM impairment of investment in partnership, and a $2.3 MM gain on a life insurance policy Net Income before Items Impacting Comparability (2) |
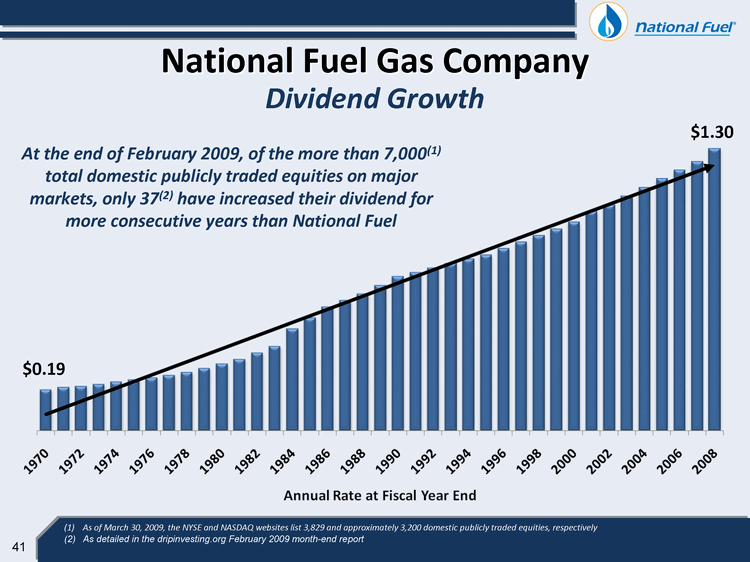
| 41 National Fuel Gas Company Dividend Growth $1.30 $0.19 1970 1972 1974 1976 1978 1980 1982 1984 1986 1988 1990 1992 1994 1996 1998 2000 2002 2006 2008 Annual Rate at Fiscal Year End At the end of February 2009, of the more than 7,000(1) total domestic publicly traded equities on major markets, only 37(2) have increased their dividend for more consecutive years than National Fuel As of March 30, 2009, the NYSE and NASDAQ websites list 3,829 and approximately 3,200 domestic publicly traded equities, respectively As detailed in the dripinvesting.org February 2009 month-end report |
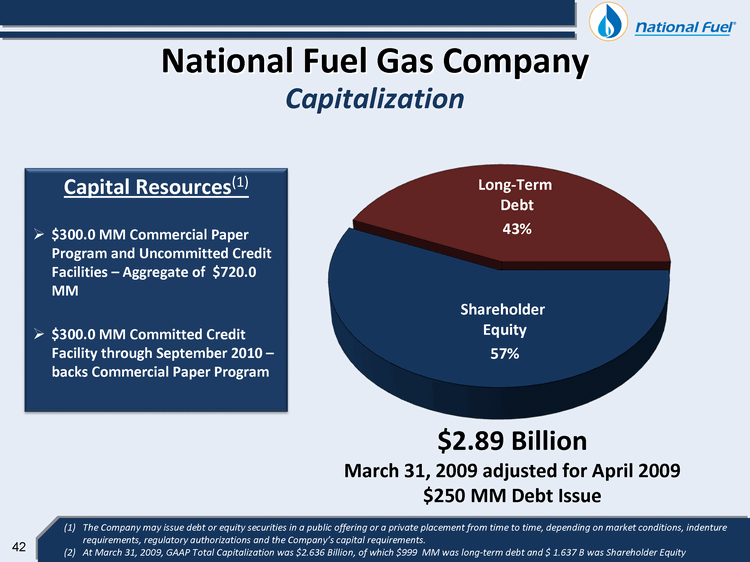
| 42 National Fuel Gas Company Capitalization The Company may issue debt or equity securities in a public offering or a private placement from time to time, depending on market conditions, indenture requirements, regulatory authorizations and the Company's capital requirements. At March 31, 2009, GAAP Total Capitalization was $2.636 Billion, of which $999 MM was long-term debt and $ 1.637 B was Shareholder Equity $2.89 Billion March 31, 2009 adjusted for April 2009 $250 MM Debt Issue Long-Term Debt 43% Shareholder Equity 57% Capital Resources(1) $300.0 MM Commercial Paper Program and Uncommitted Credit Facilities - Aggregate of $720.0 MM $300.0 MM Committed Credit Facility through September 2010 - backs Commercial Paper Program |
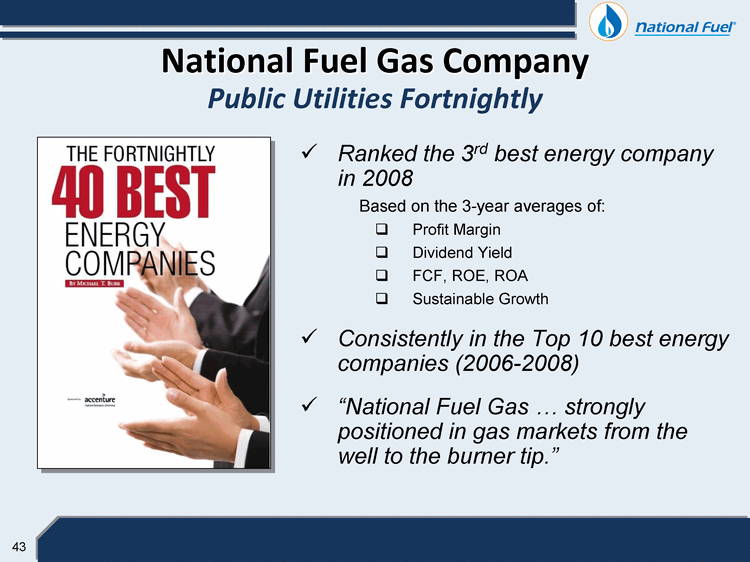
| 43 National Fuel Gas Company Public Utilities Fortnightly Ranked the 3rd best energy company in 2008 Based on the 3-year averages of: Profit Margin Dividend Yield FCF, ROE, ROA Sustainable Growth Consistently in the Top 10 best energy companies (2006-2008) "National Fuel Gas ... strongly positioned in gas markets from the well to the burner tip." |

| 44 |
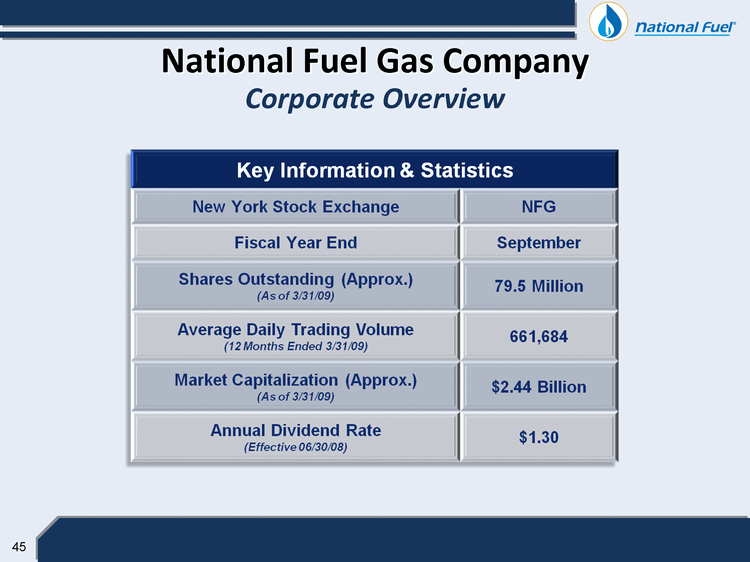
| 45 Key Information & Statistics New York Stock Exchange NFG Fiscal Year End September p Shares Outstanding (Approx.) (As of 3/31/09) 79.5 Million Average Daily Trading Volume (12 Months Ended 3/31/09) 661,684 M k t C it li ti (A ) Market Capitalization Approx.) (As of 3/31/09) $2.44 Billion Annual Dividend Rate $1 30 (Effective 06/30/08) 1.30 National Fuel Gas Company Corporate Overview |
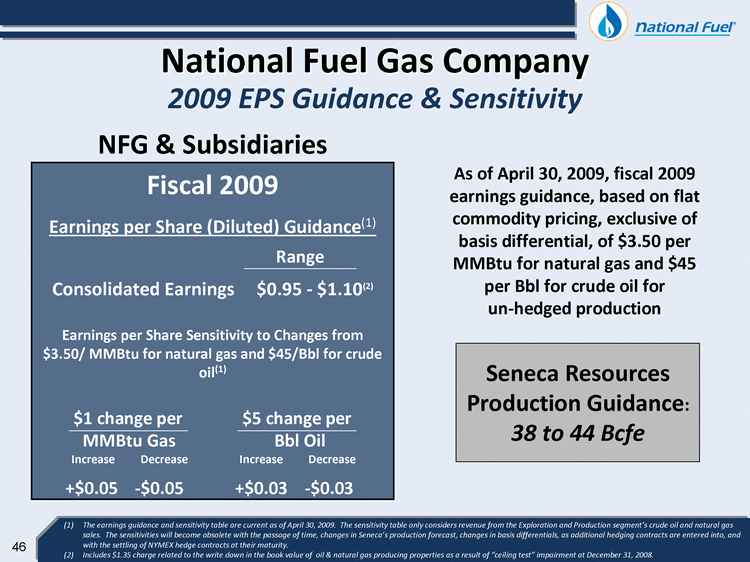
| 46 National Fuel Gas Company 2009 EPS Guidance & Sensitivity Fiscal 2009 Earnings per Share (Diluted) Guidance(1) Consolidated Earnings $0.95 - $1.10(2) Earnings per Share Sensitivity to Changes from $3.50/ MMBtu for natural gas and $45/Bbl for crude oil(1) $1 change per $5 change per MMBtu Gas Bbl Oil Increase Decrease Increase Decrease +$0.05 -$0.05 +$0.03 -$0.03 Range NFG & Subsidiaries The earnings guidance and sensitivity table are current as of April 30, 2009. The sensitivity table only considers revenue from the Exploration and Production segment's crude oil and natural gas sales. The sensitivities will become obsolete with the passage of time, changes in Seneca's production forecast, changes in basis differentials, as additional hedging contracts are entered into, and with the settling of NYMEX hedge contracts at their maturity. Includes $1.35 charge related to the write down in the book value of oil & natural gas producing properties as a result of "ceiling test" impairment at December 31, 2008. As of April 30, 2009, fiscal 2009 earnings guidance, based on flat commodity pricing, exclusive of basis differential, of $3.50 per MMBtu for natural gas and $45 per Bbl for crude oil for un-hedged production Seneca Resources Production Guidance: 38 to 44 Bcfe |
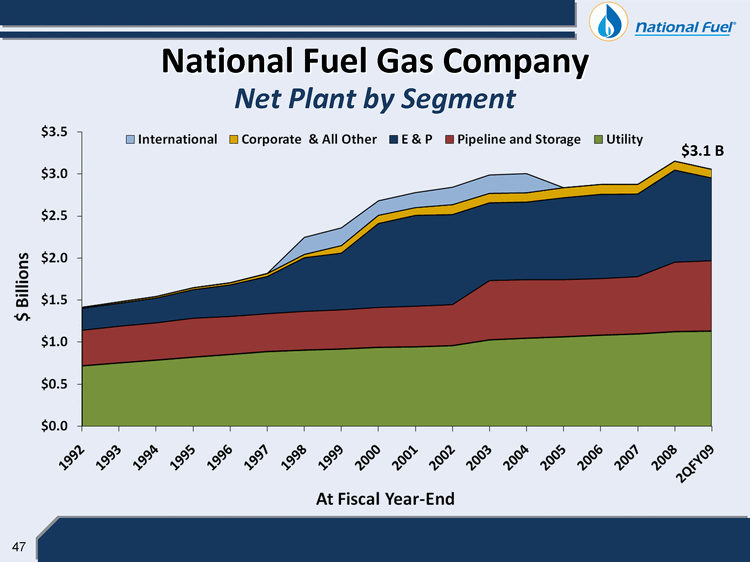
| 47 National Fuel Gas Company Net Plant by Segment $3.1 B National Fuel Gas Company Net Plant by Segment $3.0 $3.5 $2.5 $1.5 $2.0 $1.0 $0.0 $0.5 $47 1992 1993 1994 1995 1996 1997 1998 1999 2000 2001 2002 2003 2004 2005 2006 2007 2008 2QFY09 International Corporate & All Other E & P Pipeline and Storage Utility At Fiscal Year End |
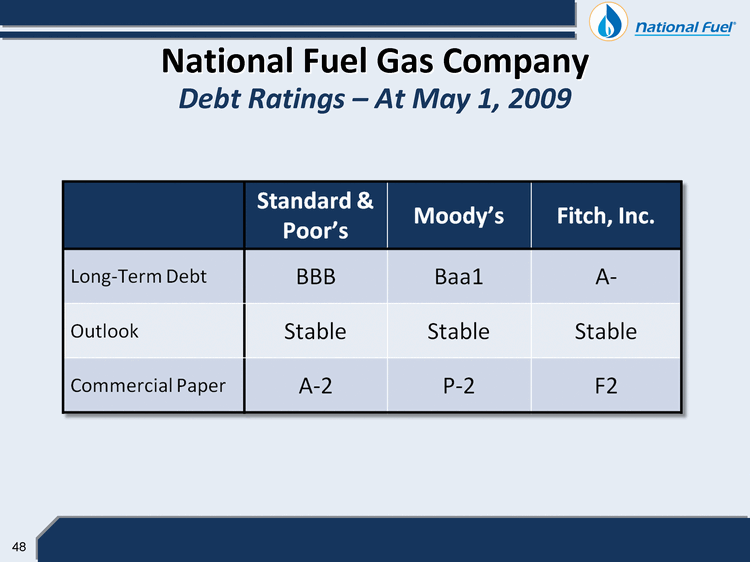
| 48 National Fuel Gas Company Debt Ratings - At May 1, 2009 Standard & Poors Moodys Fitch, Inc. Long-Term Debt BBB Baa1 A- Outlook Stable Stable Stable Commercial Paper A-2 P-2 F2 |
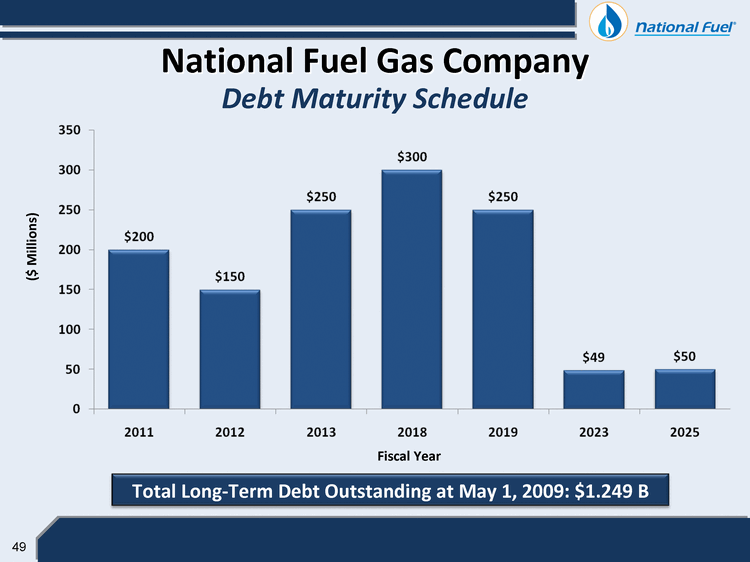
| 49 National Fuel Gas Company Debt Maturity Schedule ($ Millions) 300 350 200 250 150 50 100 0 $200 $150 $300 $250 $49 $50 0 50 100 150 200 250 300 350 Fiscal Year Total Long-Term Debt Outstanding at May 1, 2009: $1.249 B |
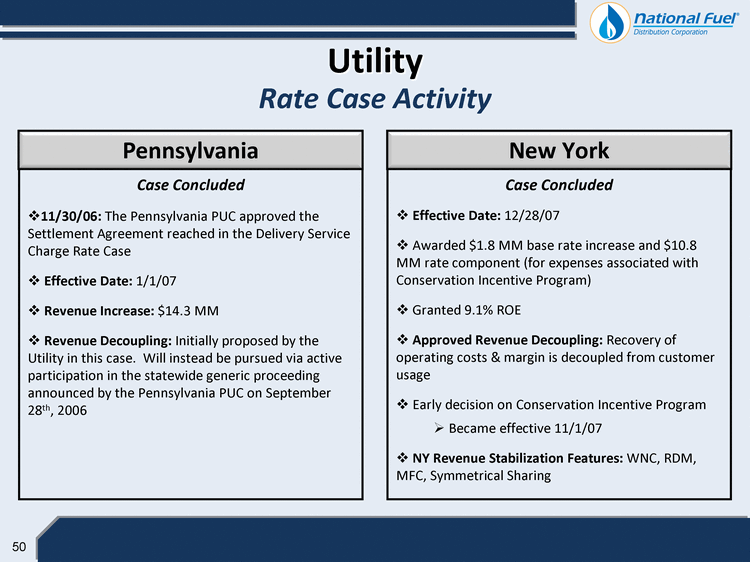
| 50 Utility Rate Case Activity 11/30/06: The Pennsylvania PUC approved the Settlement Agreement reached in the Delivery Service Charge Rate Case Effective Date: 1/1/07 Revenue Increase: $14.3 MM Revenue Decoupling: Initially proposed by the Utility in this case. Will instead be pursued via active participation in the statewide generic proceeding announced by the Pennsylvania PUC on September 28th, 2006 Pennsylvania Effective Date: 12/28/07 Awarded $1.8 MM base rate increase and $10.8 MM rate component (for expenses associated with Conservation Incentive Program) Granted 9.1% ROE Approved Revenue Decoupling: Recovery of operating costs & margin is decoupled from customer usage Early decision on Conservation Incentive Program Became effective 11/1/07 NY Revenue Stabilization Features: WNC, RDM, MFC, Symmetrical Sharing New York Case Concluded Case Concluded |
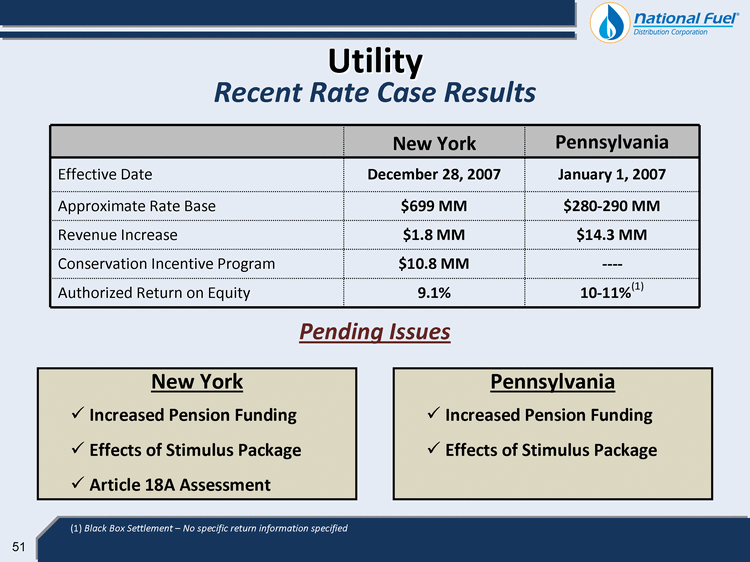
| 51 Utility Recent Rate Case Results Increased Pension Funding Effects of Stimulus Package Article 18A Assessment Increased Pension Funding Effects of Stimulus Package Pending Issues New York Pennsylvania Effective Date December 28, 2007 January 1, 2007 Approximate Rate Base $699 MM $280-290 MM Revenue Increase $1.8 MM $14.3 MM Conservation Incentive Program $10.8 MM ---- Authorized Return on Equity 9.1% 10-11%(1) (1) Black Box Settlement - No specific return information specified |
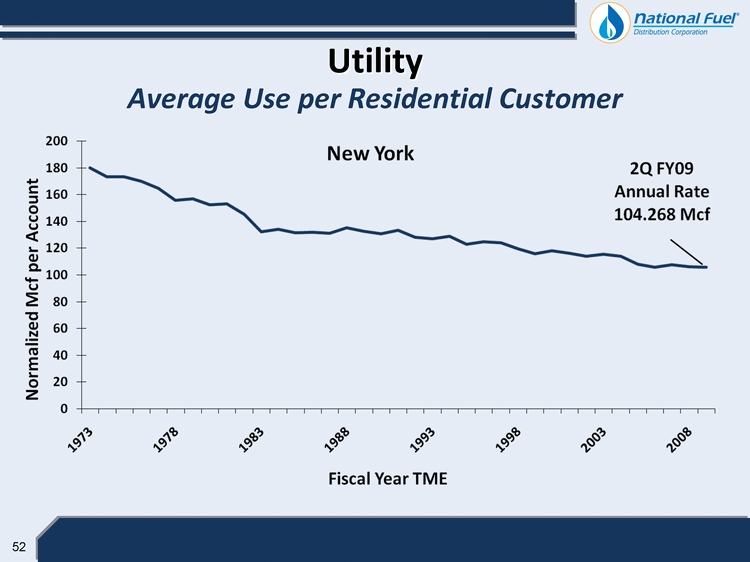
| 52 Utility Average Use per Residential Customer 200 120 140 160 80 100 40 60 20 0 1973 1978 1983 1988 1993 1998 2003 2008 Fiscal Year TME 2Q FY09 Annual Rate 104.268 Mcf |
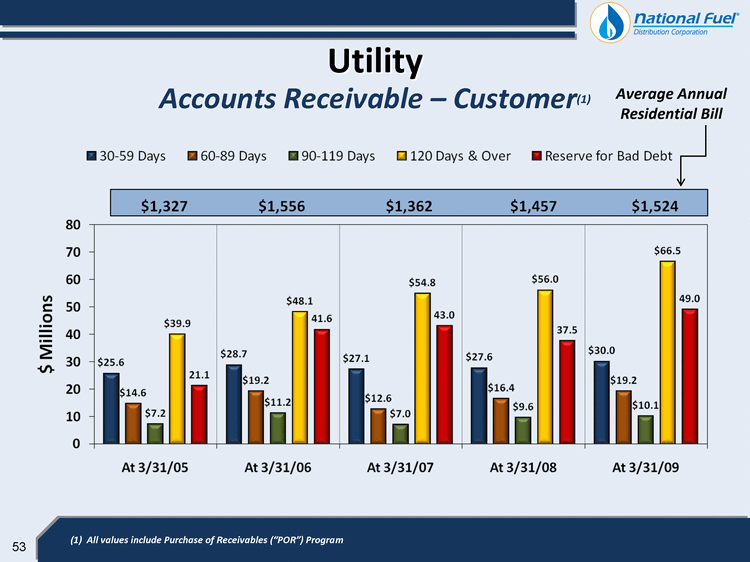
| 53 Utility Accounts Receivable - Customer(1) 30-59 Days 60-89 Days 90-119 Days 120 Days & Over Reserve for Bad Debt $1,556 $1,362 $1,457 $1,524 $1,327 $48.1 $54.8 $56.0 66.5 43 0 49.0 50 60 ns $25.6 $28.7 $27.1 $27.6 $30.0 $39.9 21 1 41.6 43.0 37.5 30 40 $14.6 $19.2 $12.6 $16.4 $19.2 $7.2 $11.2 $7.0 $9.6 $10.1 21.1 10 20 0 Average Annual Residential Bill (1) All values include Purchase of Receivables ("POR") Program |
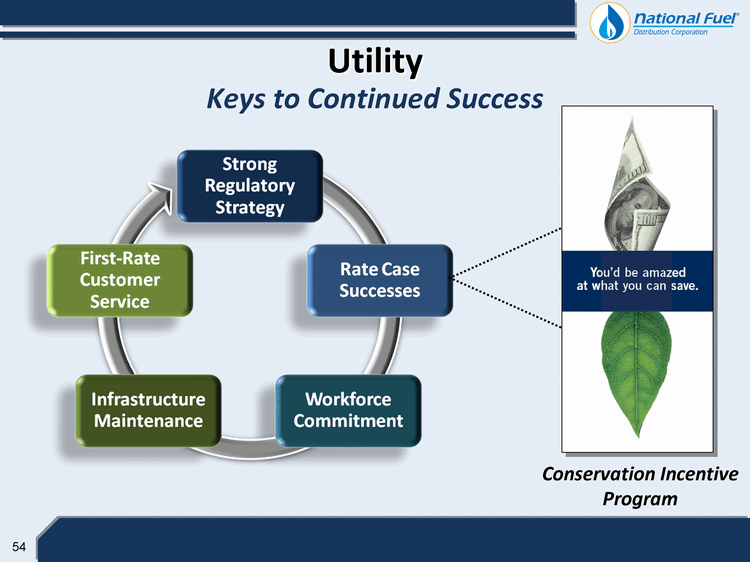
| 54 Utility Keys to Continued Success Conservation Incentive Program |
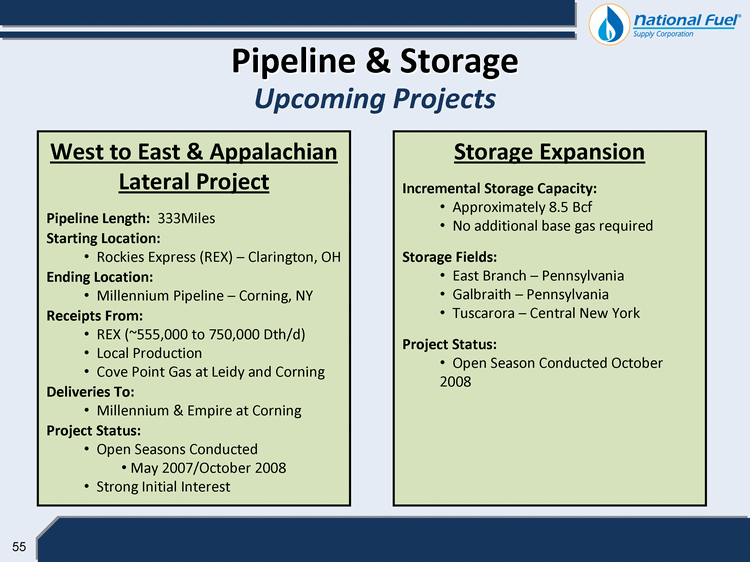
| 55 Pipeline & Storage Upcoming Projects West to East & Appalachian Lateral Project Pipeline Length: 333Miles Starting Location: Rockies Express (REX) - Clarington, OH Ending Location: Millennium Pipeline - Corning, NY Receipts From: REX (~555,000 to 750,000 Dth/d) Local Production Cove Point Gas at Leidy and Corning Deliveries To: Millennium & Empire at Corning Project Status: Open Seasons Conducted May 2007/October 2008 Strong Initial Interest Storage Expansion Incremental Storage Capacity: Approximately 8.5 Bcf No additional base gas required Storage Fields: East Branch - Pennsylvania Galbraith - Pennsylvania Tuscarora - Central New York Project Status: Open Season Conducted October 2008 |
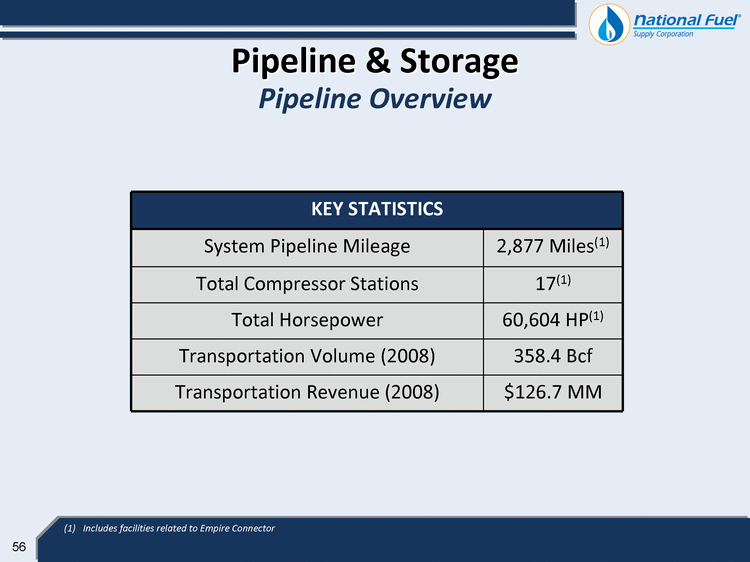
| 56 Pipeline Overview KEY STATISTICS KEY STATISTICS System Pipeline Mileage 2,877 Miles(1) Total Compressor Stations 17(1) Total Horsepower 60,604 HP(1) Transportation Volume (2008) 358.4 Bcf Transportation Revenue (2008) $126.7 MM Includes facilities related to Empire Connector Pipeline & Storage |
| 57 Storage Overview Pipeline & Storage KEY STATISTICS KEY STATISTICS Underground Natural Gas Storage Fields 31 (1) Working Storage Capacity 78.3 Bcf Total Compressor Stations 14 Total Horsepower 35,325 HP Storage Revenue (2008) $67.0 MM Includes 4 storage fields co-owned with non-affiliated companies |
| 58 $0.08 $0.07 $0.06 $0.05 $0.04 $0.03 $0.02 $0.01 $0.07 $0.06 $0.07 $0.06(1) $0.07 $0.08 2004 2005 2006 2007 2008 6 Months Ended 3/31/09 Energy Marketing (1) Excludes resolution of a purchased gas contingency of +$0.03 Diluted Earnings per Share (Before Items Impacting Comparability) |
| 59 National Fuel Gas Company Comparable GAAP Financial Measure Slides and Reconciliations This presentation contains certain non-GAAP financial measures. For pages that contain non-GAAP financial measures, pages containing the most directly comparable GAAP financial measures and reconciliations are provided in the slides that follow. The Company believes that its non-GAAP financial measures are useful to investors because they provide an alternative method for assessing the Company's operating results in a manner that is focused on the performance of the Company's ongoing operations. The Company's management uses these non-GAAP financial measures for the same purpose, and for planning and forecasting purposes. The presentation of non-GAAP financial measures is not meant to be a substitute for financial measures prepared in accordance with GAAP. |
Reconciliation of Income from Continuing Operations by Segment to Consolidated GAAP Net Income
| FY05 | FY06 | FY07 | FY08 | |||||||||||||
| Income from Continuing Operations | ||||||||||||||||
| Utility Segment Income from Continuing Operation | $ | 39,197 | $ | 49,815 | $ | 50,886 | $ | 61,472 | ||||||||
| P&S Segment Income from Continuing Operation | 60,454 | 55,633 | 56,386 | 54,148 | ||||||||||||
| E&P Segment Income from Continuing Operation | 35,581 | 67,494 | 74,889 | 146,612 | ||||||||||||
| Marketing Segment Income from Continuing Operation | 5,077 | 5,798 | 7,663 | 5,889 | ||||||||||||
| Corp & All Other Income from Continuing Operation | (1,872 | ) | 5,874 | 11,851 | 607 | |||||||||||
| Total Income from Continuing Operations | $ | 138,437 | $ | 184,614 | $ | 201,675 | $ | 268,728 | ||||||||
| Discontinued Operations | ||||||||||||||||
| Income (Loss) From Operations, Net of Tax | $ | 25,277 | $ | (46,523 | ) | $ | 15,479 | $ | — | |||||||
| Gain on Disposal, Net of Tax | 25,774 | — | 120,301 | — | ||||||||||||
| Income (Loss) From Discontinued Operations, Net of Tax | $ | 51,051 | $ | (46,523 | ) | $ | 135,780 | $ | — | |||||||
| GAAP Net Income | ||||||||||||||||
| Utility Segment GAAP Net Income | $ | 39,197 | $ | 49,815 | $ | 50,886 | $ | 61,472 | ||||||||
| P&S Segment GAAP Net Income | 60,454 | 55,633 | 56,386 | 54,148 | ||||||||||||
| E&P Segment GAAP Net Income | 50,659 | 20,971 | 210,669 | 146,612 | ||||||||||||
| Marketing Segment GAAP Net Income | 5,077 | 5,798 | 7,663 | 5,889 | ||||||||||||
| Corp & All Other GAAP Net Income | 34,101 | 5,874 | 11,851 | 607 | ||||||||||||
| Total GAAP Net Income | $ | 189,488 | $ | 138,091 | $ | 337,455 | $ | 268,728 | ||||||||
Reconciliation of Segment Net Income to Consolidated Net Income (‘000)
| 12 Mos Ended 3/31/09 | ||||||||||||
| Earning Before | ||||||||||||
| Items Impacting | Items Impacting | |||||||||||
| GAAP Earnings | Comparability | Comparability | ||||||||||
| Utility | $ | 61,999 | ||||||||||
| $ | 61,999 | |||||||||||
| Pipeline & Storage | $ | 58,113 | ||||||||||
| $ | 58,113 | |||||||||||
| Exploration & Production | $ | 12,568 | ||||||||||
| Less: Non-cash impairment charge | $ | 108,207 | ||||||||||
| $ | 120,775 | |||||||||||
| Energy Marketing | $ | 5,465 | ||||||||||
| $ | 5,465 | |||||||||||
| Corporate & Other | $ | (4,219 | ) | |||||||||
| Less: Impairment of Investment in Partnership | $ | 1,085 | ||||||||||
| Plus: Gain on life insurance proceeds | $ | (2,312 | ) | |||||||||
| $ | (5,446 | ) | ||||||||||
| GAAP Consolidated Net Income | $ | 133,926 | ||||||||||
| Total Items Impacting Comparability | $ | 106,980 | ||||||||||
| Net Income Before Items Impacting Comparability | $ | 240,906 | ||||||||||
NATIONAL FUEL GAS COMPANY
AND SUBSIDIARIES
RECONCILIATION TO REPORTED EARNINGS
AND SUBSIDIARIES
RECONCILIATION TO REPORTED EARNINGS
| Fiscal Year | Fiscal Year | Fiscal Year | Fiscal Year | Fiscal Year | Six Months | |||||||||||||||||||
| Ended | Ended | Ended | Ended | Ended | Ended | |||||||||||||||||||
| (Diluted Earnings Per Share) | September 30, 2004 | September 30, 2005 | September 30, 2006 | September 30, 2007 | September 30, 2008 | March 31, 2009 | ||||||||||||||||||
Utility | ||||||||||||||||||||||||
| Reported earnings | $ | 0.56 | $ | 0.46 | $ | 0.58 | $ | 0.60 | $ | 0.73 | $ | 0.68 | ||||||||||||
| Out-of-period adjustment to symmetical sharing | — | — | (0.03 | ) | — | — | — | |||||||||||||||||
| Pension settlement loss | 0.03 | — | — | — | — | — | ||||||||||||||||||
| Earnings before items impacting comparability | 0.59 | 0.46 | 0.55 | 0.60 | 0.73 | 0.68 | ||||||||||||||||||
Pipeline and Storage | ||||||||||||||||||||||||
| Reported earnings | 0.58 | 0.71 | 0.65 | 0.66 | 0.64 | 0.40 | ||||||||||||||||||
| Reversal of reserve for preliminary project costs | — | — | — | (0.06 | ) | — | — | |||||||||||||||||
| Discontinuance of hedge accounting | — | — | — | (0.02 | ) | — | — | |||||||||||||||||
| Pension settlement loss | 0.02 | — | — | — | — | — | ||||||||||||||||||
| Gain associated with insurance proceeds | — | (0.05 | ) | — | — | — | — | |||||||||||||||||
| Base gas sale | — | (0.03 | ) | — | — | — | — | |||||||||||||||||
| Earnings before items impacting comparability | 0.60 | 0.63 | 0.65 | 0.58 | 0.64 | 0.40 | ||||||||||||||||||
Exploration and Production | ||||||||||||||||||||||||
| Reported earnings | 0.66 | 0.60 | 0.24 | 2.47 | 1.73 | (0.82 | ) | |||||||||||||||||
| Gain on disposal of discontinued operations | — | — | — | (1.41 | ) | — | — | |||||||||||||||||
| Earnings from discontinued operations | — | — | — | (0.18 | ) | — | — | |||||||||||||||||
| Income tax adjustments | — | — | (0.07 | ) | — | — | — | |||||||||||||||||
| Loss on sale of oil and gas assets | — | — | — | — | — | — | ||||||||||||||||||
| Impairment of oil and gas producing properties | — | — | 0.54 | — | — | 1.35 | ||||||||||||||||||
| Cumulative Effect of Change in Accounting | — | — | — | — | — | — | ||||||||||||||||||
| Adjustment of loss on sale of oil and gas assets | (0.06 | ) | — | — | — | — | — | |||||||||||||||||
| Pension settlement loss | 0.01 | — | — | — | — | — | ||||||||||||||||||
| Earnings before items impacting comparability | 0.61 | 0.60 | 0.71 | 0.88 | 1.73 | 0.53 | ||||||||||||||||||
International | ||||||||||||||||||||||||
| Reported earnings | 0.07 | |||||||||||||||||||||||
| Cumulative Effect of Change in Accounting | — | see | ||||||||||||||||||||||
| Pension settlement loss | — | “Discontinued | ||||||||||||||||||||||
| Tax rate change | (0.06 | ) | Operations” | |||||||||||||||||||||
| Repatriation tax | below | |||||||||||||||||||||||
| Earnings before items impacting comparability | 0.01 | |||||||||||||||||||||||
Energy Marketing | ||||||||||||||||||||||||
| Reported earnings | 0.07 | 0.06 | 0.07 | 0.09 | 0.07 | 0.08 | ||||||||||||||||||
| Resolution of a purchased gas contingency | — | — | — | (0.03 | ) | — | — | |||||||||||||||||
| Pension settlement loss | — | — | — | — | — | — | ||||||||||||||||||
| Earnings before items impacting comparability | 0.07 | 0.06 | 0.07 | 0.06 | 0.07 | 0.08 | ||||||||||||||||||
Corporate and All Other | ||||||||||||||||||||||||
| Reported earnings | 0.07 | (0.02 | ) | 0.07 | 0.14 | 0.01 | 0.04 | |||||||||||||||||
| Pension settlement loss | 0.02 | — | — | — | — | — | ||||||||||||||||||
| Adjustment of gain on sale of timber properties | 0.01 | |||||||||||||||||||||||
| Gain on sale of turbine | (0.01 | ) | — | |||||||||||||||||||||
| Gain on life insurance policies | (0.03 | ) | ||||||||||||||||||||||
| Impairment of investment in partnership | 0.01 | |||||||||||||||||||||||
| Earnings before items impacting comparability | 0.10 | (0.02 | ) | 0.07 | 0.14 | 0.01 | 0.02 | |||||||||||||||||
Consolidated | ||||||||||||||||||||||||
| Reported earnings | 2.01 | |||||||||||||||||||||||
| Total items impacting comparability from above | (0.03 | ) | ||||||||||||||||||||||
| Earnings before items impacting comparability | $ | 1.98 | ||||||||||||||||||||||
Consolidated Earnings from Continuing Operations | ||||||||||||||||||||||||
| Reported earnings from continuing operations | 1.81 | 1.61 | 3.96 | 3.18 | 0.38 | |||||||||||||||||||
| Total items impacting comparability from above | (0.08 | ) | 0.44 | (1.70 | ) | (0.01 | ) | 1.33 | ||||||||||||||||
| Earnings from continuing operations before items impacting comparability | $ | 1.73 | $ | 2.05 | $ | 2.26 | $ | 3.17 | $ | 1.71 | ||||||||||||||
Discontinued Operations | ||||||||||||||||||||||||
| Reported earnings from discontinued operations | 0.42 | |||||||||||||||||||||||
Consolidated | ||||||||||||||||||||||||
| Reported earnings | $ | 2.23 | $ | 1.61 | $ | 3.96 | $ | 3.18 | $ | 0.38 | ||||||||||||||
Reconciliation of Utility Segment Aged Accounts Receivable to Consolidated Accounts Receivable — Net
| at 03/31/05 | at 03/31/06 | at 03/31/07 | at 03/31/08 | at 03/31/09 | ||||||||||||||||
| Utility Aged Accounts Receivable | $ | 87.3 | $ | 107.2 | $ | 101.5 | $ | 109.6 | $ | 125.8 | ||||||||||
| Utility Current/Other Accounts Receivable | 170.1 | 193.5 | 174.0 | 191.4 | 170.2 | |||||||||||||||
| Utility Gross Accounts Receivable | $ | 257.4 | $ | 300.7 | $ | 275.5 | $ | 301.0 | $ | 296.0 | ||||||||||
| Utility Reserve for Bad Debt | (21.1 | ) | (41.6 | ) | (43.0 | ) | (41.2 | ) | (49.0 | ) | ||||||||||
| Utility Net Accounts Receivable | $ | 236.3 | $ | 259.1 | $ | 232.5 | $ | 259.8 | $ | 247.0 | ||||||||||
| All Other Segments Gross Accounts Receivable | $ | 85.9 | $ | 100.7 | $ | 104.6 | $ | 105.6 | $ | 62.8 | ||||||||||
| All Other Segments Reserve for Bad Debts | (4.3 | ) | (1.8 | ) | (1.5 | ) | (1.5 | ) | (5.3 | ) | ||||||||||
| All Other Segments Net Accounts Receivable | $ | 81.6 | $ | 98.9 | $ | 103.1 | $ | 104.1 | $ | 57.5 | ||||||||||
| Total Corporation Accounts Receivable — Net | $ | 317.9 | $ | 358.0 | $ | 335.6 | $ | 363.9 | $ | 304.5 | ||||||||||
Reconciliation of Pipeline & Storage Operating Revenues to Consolidated Operating Revenues Fiscal 2008 ($Millions)
| Pipeline Revenues | $ | 126.7 | ||
| Storage Revenues | 67.0 | |||
| Other Revenues | 22.9 | |||
| Total Pipeline & Storage Revenues | $ | 216.6 | ||
| All Other Segments | 2,183.8 | |||
| Total Corporation | $ | 2,400.4 | ||
Reconciliation of Exploration & Production Segment Capital Expenditures to Consolidated Capital Expenditures ($000s)
| 2009 | 2010 | |||||||||||||||||||||||||||
| 2004 | 2005 | 2006 | 2007 | 2008 | Forecast | Forecast | ||||||||||||||||||||||
| Exploration & Production Capital Expenditures (Contiunuing Operations) | $ | 46,235 | $ | 83,973 | $ | 166,535 | $ | 146,687 | $ | 192,187 | $ | 196,000 | $ | 227,000 | ||||||||||||||
| Exploration & Production Capital Expenditures (Discontinued Operations) | 31,419 | 38,477 | 41,768 | 29,129 | — | — | — | |||||||||||||||||||||
| Pipeline & Storage Capital Expenditures (1) | 23,196 | 21,099 | 26,023 | 43,226 | 148,752 | 66,000 | 76,000 | |||||||||||||||||||||
| Utility Capital Expenditures | 55,449 | 50,071 | 54,414 | 54,185 | 57,457 | 58,000 | 60,000 | |||||||||||||||||||||
| Corporate, All Other Capital Expenditures (Continuing Operations) (2) (3) | 8,544 | 20,033 | 5,419 | 3,501 | (662 | ) | 11,000 | 16,000 | ||||||||||||||||||||
| Corporate & All Other Capital Expenditures (Discontinued Operations) | 7,498 | 5,877 | — | — | — | — | — | |||||||||||||||||||||
| Total Capital Expenditures Per Statement of Cash Flows | $ | 172,341 | $ | 219,530 | $ | 294,159 | $ | 276,728 | $ | 397,734 | $ | 331,000 | $ | 379,000 | ||||||||||||||
| (1) | 2008 Amount Excludes $16.8 Million of Accrued Capital Expenditures Related to the Empire Connector Project | |
| (2) | Including Intersegment Eliminations | |
| (3) | 2007 Amount Excludes a $3.3 Million Investment in Partnership Presented Separately on the Statement of Cash Flows |
Consolidated Net Income ($000s)
| 2005 | 2006 | 2007 | 2008 | |||||||||||||
| Exploration & Production (Income from Continuing Operations) | $ | 35,581 | $ | 67,494 | $ | 74,889 | $ | 146,612 | ||||||||
| Income from Discontinued Operations, Net of Tax | 15,078 | (46,523 | ) | 15,479 | — | |||||||||||
| Gain on Disposal of Discontinued Operations, Net of Tax | — | — | 120,301 | — | ||||||||||||
| Total Exploration & Production | $ | 50,659 | $ | 20,971 | $ | 210,669 | $ | 146,612 | ||||||||
| All Other Segments | 138,829 | 117,120 | 126,786 | 122,116 | ||||||||||||
| Consolidated Net Income | $ | 189,488 | $ | 138,091 | $ | 337,455 | $ | 268,728 | ||||||||