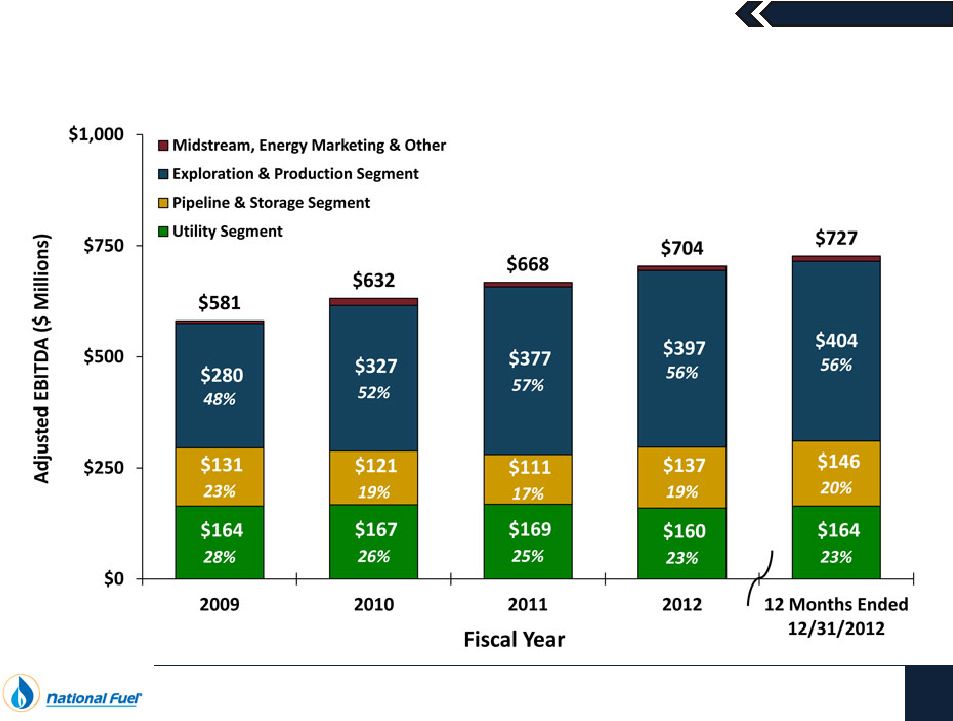
February 2013 51 Reconciliation of Adjusted EBITDA to Consolidated Net Income ($ Thousands) FY 2009 FY 2010 FY 2011 FY 2012 Exploration & Production - West Division Adjusted EBITDA 171,572 $ 187,838 $ 187,603 $ 226,897 $ 224,201 $ Exploration & Production - All Other Divisions Adjusted EBITDA 108,139 139,624 189,854 170,232 180,063 Total Exploration & Production Adjusted EBITDA 279,711 $ 327,462 $ 377,457 $ 397,129 $ 404,264 $ Total Adjusted EBITDA Exploration & Production Adjusted EBITDA 279,711 $ 327,462 $ 377,457 $ 397,129 $ 404,264 $ Utility Adjusted EBITDA 164,443 167,328 168,540 159,986 164,386 Pipeline & Storage Adjusted EBITDA 130,857 120,858 111,474 136,914 146,147 Energy Marketing Adjusted EBITDA 11,589 13,573 13,178 5,945 6,065 Corporate & All Other Adjusted EBITDA (5,575) 2,429 (2,960) 4,140 5,849 Total Adjusted EBITDA 581,025 $ 631,650 $ 667,689 $ 704,114 $ 726,711 $ Total Adjusted EBITDA 581,025 $ 631,650 $ 667,689 $ 704,114 $ 726,711 $ Minus: Net Interest Expense (81,013) (90,217) (75,205) (82,551) (85,375) Plus: Other Income 9,762 6,126 5,947 5,133 5,212 Minus: Income Tax Expense (52,859) (137,227) (164,381) (150,554) (153,379) Minus: Depreciation, Depletion & Amortization (170,620) (191,199) (226,527) (271,530) (281,314) Minus: Impairment of Oil and Gas Properties (E&P) (182,811) - - - - Plus/Minus: Income/(Loss) from Discontinued Operations, Net of Tax (Corp. & All Other) (2,776) 6,780 - - - Plus: Gain on Sale of Unconsolidated Subsidiaries (Corp. & All Other) - - 50,879 - - Plus: Elimination of Other Post-Retirement Regulatory Liability (P&S) - - - 21,672 21,672 Minus: Pennsylvania Impact Fee Related to Prior Fiscal Years (E&P) - - - (6,206) (6,206) Rounding - - - (1) 2 Consolidated Net Income 100,708 $ 225,913 $ 258,402 $ 220,077 $ 227,322 $ 12-Months Ended 12/31/12 |