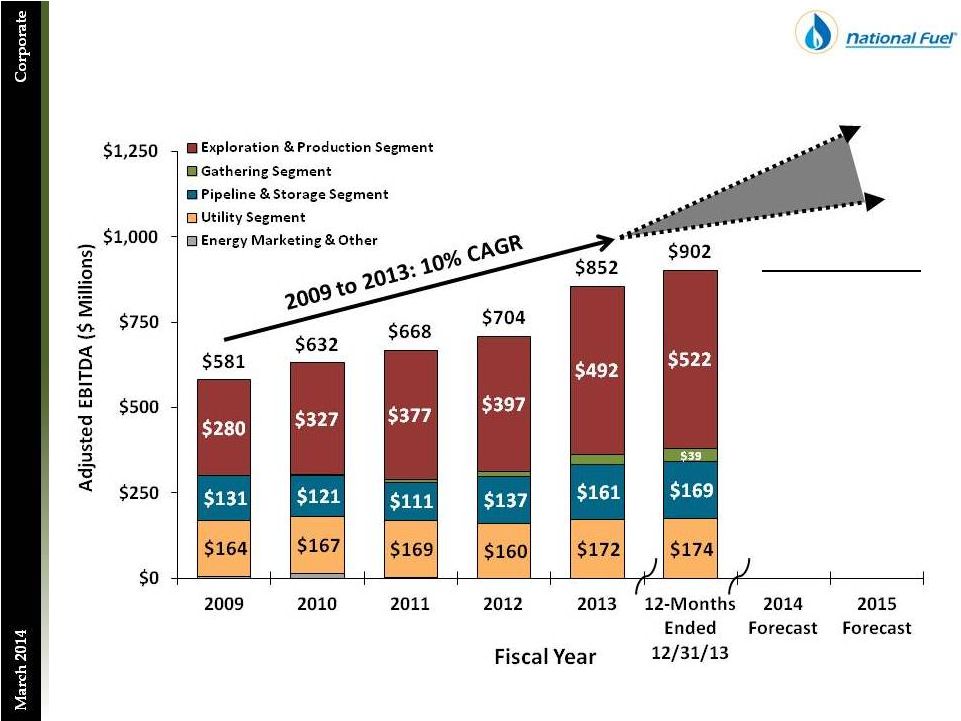
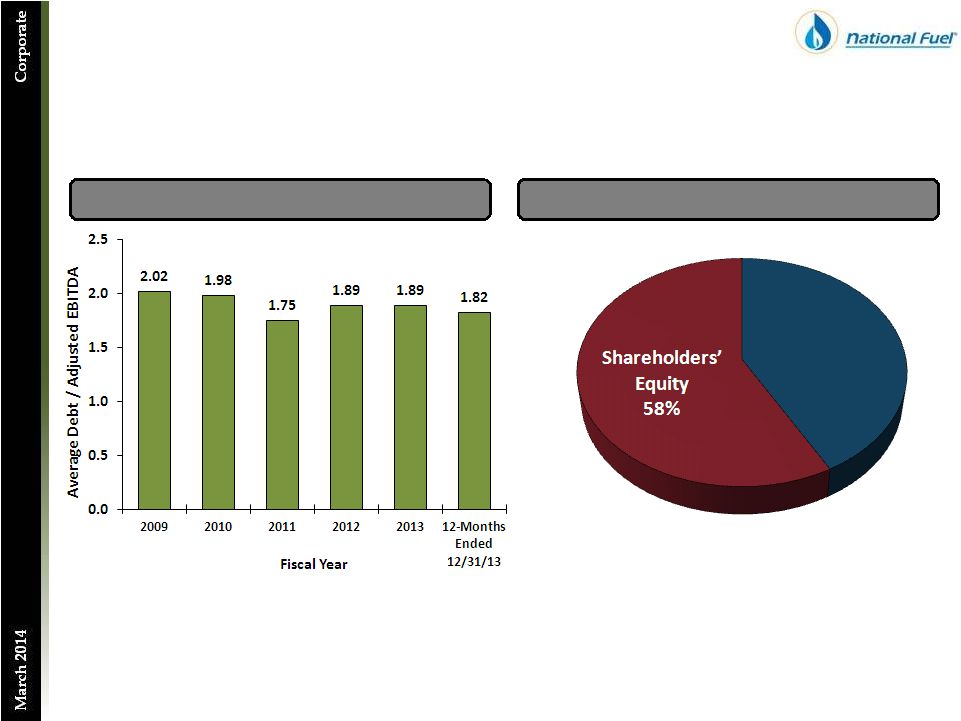
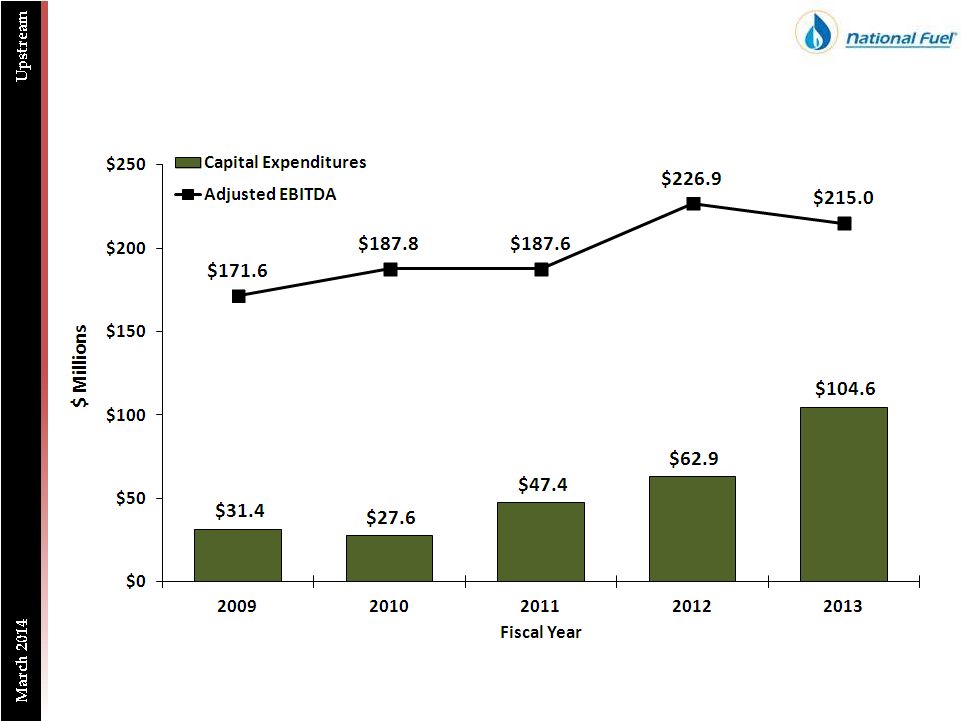
69 Reconciliation of Adjusted EBITDA to Consolidated Net Income ($ Thousands) FY 2009 FY 2010 FY 2011 FY 2012 Exploration & Production - West Division Adjusted EBITDA 171,572 $ 187,838 $ 187,603 $ 226,897 $ 215,042 $ 212,540 $ Exploration & Production - All Other Divisions Adjusted EBITDA 108,139 139,624 189,854 170,232 277,341 308,975 Total Exploration & Production Adjusted EBITDA 279,711 $ 327,462 $ 377,457 $ 397,129 $ 492,383 $ 521,515 $ Total Adjusted EBITDA Exploration & Production Adjusted EBITDA 279,711 $ 327,462 $ 377,457 $ 397,129 $ 492,383 $ 521,515 $ Pipeline & Storage Adjusted EBITDA 130,857 120,858 111,474 136,914 161,226 168,747 Gathering Adjusted EBITDA (141) 2,021 9,386 14,814 29,777 38,564 Utility Adjusted EBITDA 164,443 167,328 168,540 159,986 171,669 173,644 Energy Marketing Adjusted EBITDA 11,589 13,573 13,178 5,945 6,963 8,797 Corporate & All Other Adjusted EBITDA (5,434) 408 (12,346) (10,674) (9,920) (9,012) Total Adjusted EBITDA 581,025 $ 631,650 $ 667,689 $ 704,114 $ 852,098 $ 902,255 $ Total Adjusted EBITDA 581,025 $ 631,650 $ 667,689 $ 704,114 $ 852,098 $ 902,255 $ Minus: Net Interest Expense (81,013) (90,217) (75,205) (82,551) (89,776) (91,780) Plus: Other Income 9,762 6,126 5,947 5,133 4,697 3,510 Minus: Income Tax Expense (52,859) (137,227) (164,381) (150,554) (172,758) (184,633) Minus: Depreciation, Depletion & Amortization (170,620) (191,199) (226,527) (271,530) (326,760) (347,543) Minus: Impairment of Oil and Gas Properties (E&P) (182,811) - - - - - Plus/Minus: Income/(Loss) from Discontinued Operations, Net of Tax (Corp. & All Other) (2,776) 6,780 - - - - Plus: Gain on Sale of Unconsolidated Subsidiaries (Corp. & All Other) - - 50,879 - - - Plus: Elimination of Other Post-Retirement Regulatory Liability (P&S) - - - 21,672 - - Minus: Pennsylvania Impact Fee Related to Prior Fiscal Years (E&P) - - - (6,206) - - Minus: New York Regulatory Adjustment (Utility) - - - - (7,500) (7,500) Rounding - - - (1) - - Consolidated Net Income 100,708 $ 225,913 $ 258,402 $ 220,077 $ 260,001 $ 274,309 $ Consolidated Debt to Total Adjusted EBITDA Long-Term Debt, Net of Current Portion (End of Period) 1,249,000 $ 1,049,000 $ 899,000 $ 1,149,000 $ 1,649,000 $ 1,649,000 $ Current Portion of Long-Term Debt (End of Period) - 200,000 150,000 250,000 - - Notes Payable to Banks and Commercial Paper (End of Period) - - 40,000 171,000 - - Total Debt (End of Period) 1,249,000 $ 1,249,000 $ 1,089,000 $ 1,570,000 $ 1,649,000 $ 1,649,000 $ Long-Term Debt, Net of Current Portion (Start of Period) 999,000 1,249,000 1,049,000 899,000 1,149,000 1,149,000 Current Portion of Long-Term Debt (Start of Period) 100,000 - 200,000 150,000 250,000 250,000 Notes Payable to Banks and Commercial Paper (Start of Period) - - - 40,000 171,000 238,000 Total Debt (Start of Period) 1,099,000 $ 1,249,000 $ 1,249,000 $ 1,089,000 $ 1,570,000 $ 1,637,000 $ Average Total Debt 1,174,000 $ 1,249,000 $ 1,169,000 $ 1,329,500 $ 1,609,500 $ 1,643,000 $ Average Total Debt to Total Adjusted EBITDA 2.02 1.98 1.75 1.89 1.89 1.82 FY 2013 12-Months Ended 12/31/13 |