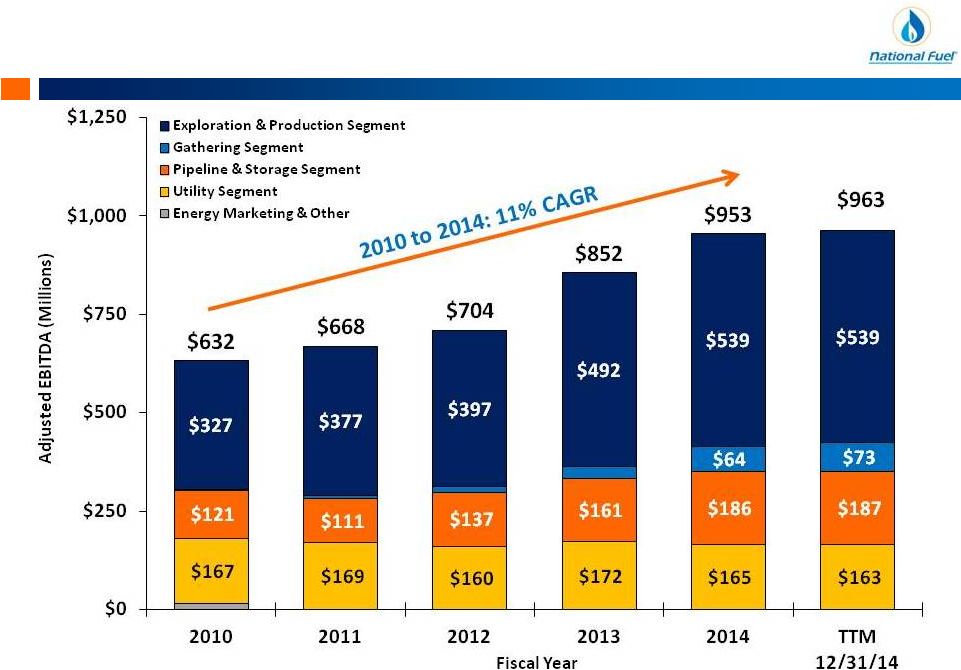
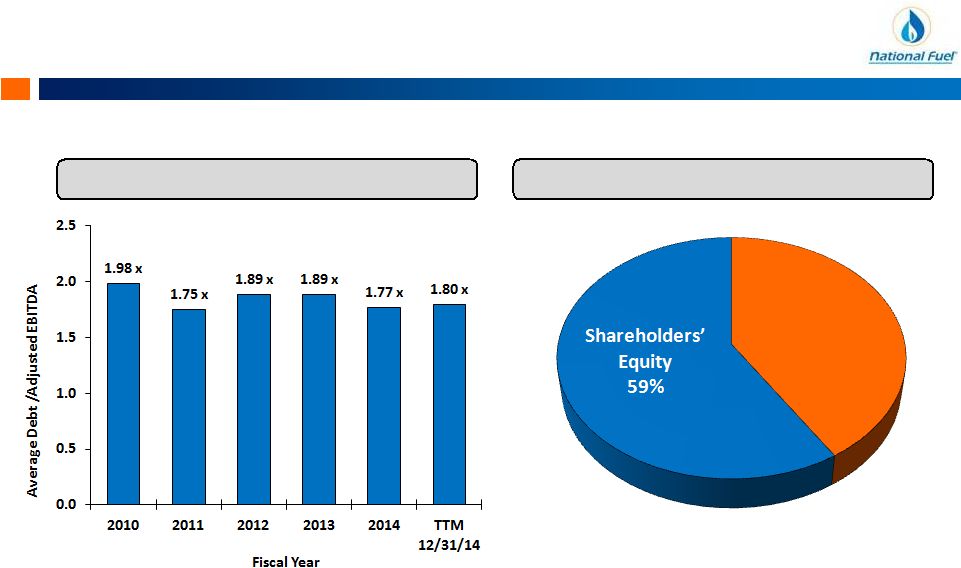
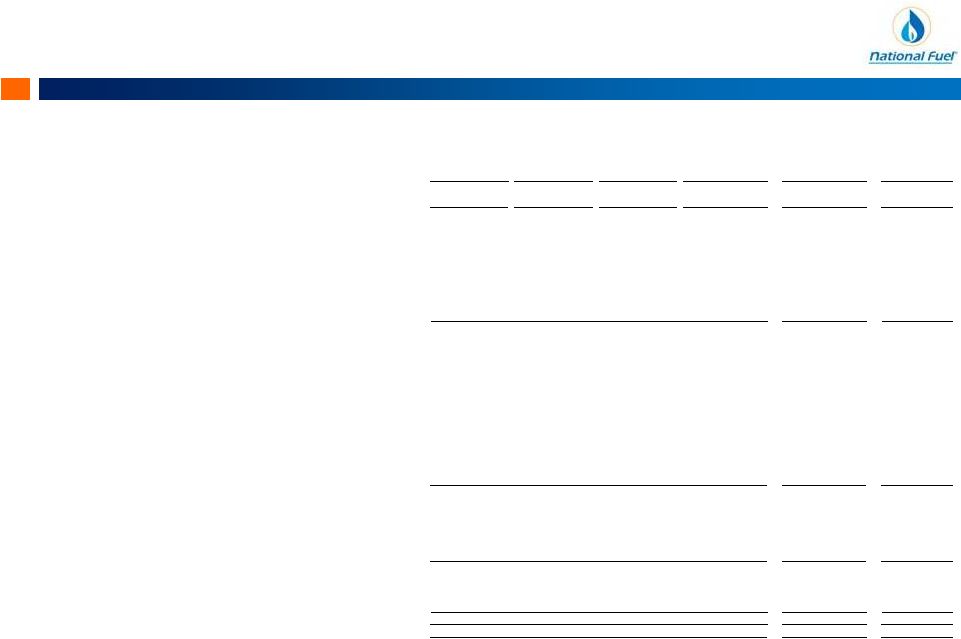
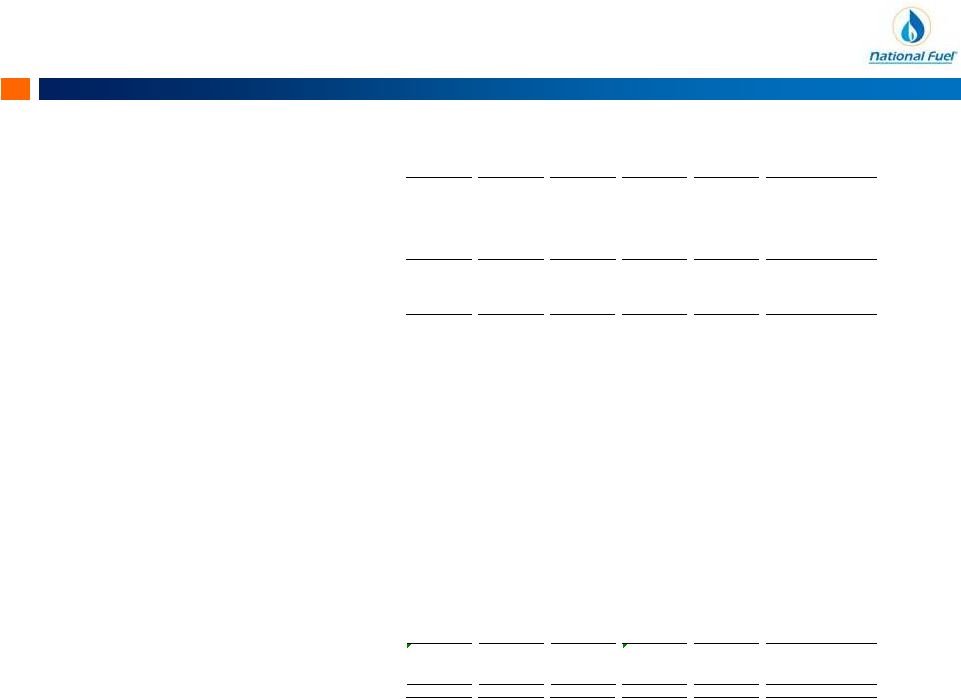
Appendix National Fuel Gas Company 59 Reconciliation of Adjusted EBITDA to Consolidated Net Income ($ Thousands) FY 2010 FY 2011 FY 2012 Exploration & Production - West Division Adjusted EBITDA 187,838 $ 187,603 $ 226,897 $ 215,042 $ 217,150 $ 206,875 $ Exploration & Production - All Other Divisions Adjusted EBITDA 139,624 189,854 170,232 277,341 322,322 332,332 Total Exploration & Production Adjusted EBITDA 327,462 $ 377,457 $ 397,129 $ 492,383 $ 539,472 $ 539,207 $ Total Adjusted EBITDA Exploration & Production Adjusted EBITDA 327,462 $ 377,457 $ 397,129 $ 492,383 $ 539,472 $ 539,207 $ Pipeline & Storage Adjusted EBITDA 120,858 111,474 136,914 161,226 186,022 186,799 Gathering Adjusted EBITDA 2,021 9,386 14,814 29,777 64,060 73,437 Utility Adjusted EBITDA 167,328 168,540 159,986 171,669 164,643 162,779 Energy Marketing Adjusted EBITDA 13,573 13,178 5,945 6,963 10,335 12,359 Corporate & All Other Adjusted EBITDA 408 (12,346) (10,674) (9,920) (11,078) (11,515) Total Adjusted EBITDA 631,650 $ 667,689 $ 704,114 $ 852,098 $ 953,454 $ 963,066 $ Total Adjusted EBITDA 631,650 $ 667,689 $ 704,114 $ 852,098 $ 953,454 $ 963,066 $ Minus: Net Interest Expense (90,217) (75,205) (82,551) (89,776) (90,107) (88,818) Plus: Other Income 6,126 5,947 5,133 4,697 9,461 10,416 Minus: Income Tax Expense (137,227) (164,381) (150,554) (172,758) (189,614) (189,349) Minus: Depreciation, Depletion & Amortization (191,199) (226,527) (271,530) (326,760) (383,781) (393,414) Plus/Minus: Income/(Loss) from Discontinued Operations, Net of Tax (Corp. & All Other) 6,780 - - - - - Plus: Gain on Sale of Unconsolidated Subsidiaries (Corp. & All Other) - 50,879 - - - - Plus: Elimination of Other Post-Retirement Regulatory Liability (P&S) - - 21,672 - - - Minus: Pennsylvania Impact Fee Related to Prior Fiscal Years (E&P) - - (6,206) - - - Minus: New York Regulatory Adjustment (Utility) - - - (7,500) - - Rounding - - (1) - - - Consolidated Net Income 225,913 $ 258,402 $ 220,077 $ 260,001 $ 299,413 $ 301,901 $ Consolidated Debt to Total Adjusted EBITDA Long-Term Debt, Net of Current Portion (End of Period) 1,049,000 $ 899,000 $ 1,149,000 $ 1,649,000 $ 1,649,000 $ 1,649,000 $ Current Portion of Long-Term Debt (End of Period) 200,000 150,000 250,000 - - - Notes Payable to Banks and Commercial Paper (End of Period) - 40,000 171,000 - 85,600 172,900 Total Debt (End of Period) 1,249,000 $ 1,089,000 $ 1,570,000 $ 1,649,000 $ 1,734,600 $ 1,821,900 $ Long-Term Debt, Net of Current Portion (Start of Period) 1,249,000 1,049,000 899,000 1,149,000 1,649,000 1,649,000 Current Portion of Long-Term Debt (Start of Period) - 200,000 150,000 250,000 - - Notes Payable to Banks and Commercial Paper (Start of Period) - - 40,000 171,000 - - Total Debt (Start of Period) 1,249,000 $ 1,249,000 $ 1,089,000 $ 1,570,000 $ 1,649,000 $ 1,649,000 $ Average Total Debt 1,249,000 $ 1,169,000 $ 1,329,500 $ 1,609,500 $ 1,691,800 $ 1,735,450 $ Average Total Debt to Total Adjusted EBITDA 1.98 x 1.75 x 1.89 x 1.89 x 1.77 x 1.80 x FY 2013 12-Months Ended 12/31/14 FY 2014 |