|
Exhibit 99 
|
Investor Presentation
Q4 Fiscal 2016 Update November 3, 2016
1
Safe Harbor For Forward Looking Statements
This plans, presentation objectives,may goals, contain projections, “forward estimates -looking of statements” oil and gas asquantities, defined bystrategies, the Privatefuture Securities events Litigation or performance Reform Act and of 1995, underlying including assumptions, statements capitalstructure,anticipated regarding future prospects, rules, capitaland expenditures, possible outcomes completion of litigation of construction or regulatory projects, proceedings, projectionsas for well pension as statements and other that post are -retirement identifiedbenefit by the obligations, use of the words impacts “anticipates,” of the adoption “estimates,” of new accounting “expects,” uncertainties “forecasts,” “intends,” which could “plans,” cause actual “predicts,” results “projects,” or outcomes“believes,” to differ materially “seeks,” from “will,” those“may,” expressed andin similar the forward expressions. -looking statements. Forward-looking The Company’s statements expectations, involve risks beliefs and and beliefs projections or projections are expressed will resultin orgood be achieved faith and orare accomplished. believed by the Company to have a reasonable basis, but there can be no assurance that management’s expectations, In forward addition -looking to other statements: factors, the Delays following or changes are important in costs or factors plansthat, within respect the view to Company of the Company, projectscould or related causeprojects actual results of other to companies, differ materially including fromdifficulties those discussed or delays in the in initiatives obtaining necessary and proceedings, governmental including approvals, those involving permits or rate orders cases or(which in obtaining address, theamong cooperation other of things, interconnecting target ratesfacility of return, operators; rate design governmental/regulatory and retained natural actions, gas), reserves; environmental/safety changes in the requirements, price of natural affiliate gasrelationships, or oil; financial industry and economic structure, conditions, and franchise including renewal; the availability impairments ofunder credit, the and SEC’s occurrences full cost ceiling affecting test the for Company’s natural gas ability and oil to in obtain interest financing rates and on acceptable other capital terms market for working conditions; capital, factors capital affecting expenditures the Company’s and other ability investments, to successfully including identify, any drill downgrades for and produce in the Company’s economically credit viable ratings natural and changes gas and oil drilling reserves, operations, including insufficient among others gathering, geology, processing lease availability, and transportation title disputes, capacity, weather the need conditions, to obtainshortages, governmental delays approvals or unavailability and permits, of equipment and compliance and services with environmental required in laws climate and change, regulations; otherchanges environmental in laws,matters, regulations real or property, judicial interpretations and exploration to which and production the Company activities is subject, suchincluding as hydraulic those fracturing; involvingchanges derivatives, in price taxes, differentials safety, employment, between similar transportation quantities capacity of natural to or from gas or such oil locations; at different other geographic changes in locations, price differentials and the effect between of such similar changes quantities on commodity of natural gas production, or oil having revenues different andquality, demand heating for pipeline value, Company; hydrocarbon uncertainty mix or delivery of oil and date; gasthe reserve cost estimates; and effects significant of legal and differences administrative between claims the Company’s against the projected Company and or actual activist production shareholder levels campaigns for natural to gas effect orchanges oil; changes at the in demographic including global, patterns national and weather or regional conditions; recessions, changes andintheir the availability, effect on the price demand or accounting for, andtreatment customers’ of derivative ability to financial pay for, instruments; the Company’s changes products in economic and services; conditions, the creditworthiness fires, severe weather, or performance natural disasters, of the terrorist Company’s activities, key suppliers, acts of war, customers cyber attacks and counterparties; or pest infestation; economic significant disruptions differences or uninsured between losses the Company’s resulting from projected major and accidents, actual pension capital expenditures and other post and -retirement operatingbenefits, expenses; which changes canin affect laws, future actuarial funding assumptions, obligations theand interest costs rate andenvironment plan liabilities; andincreasing the return on health plan/trust care costs assets and related the resulting to the Company’s effect on insurance. health insurance premiums and on the obligation to provide other post-retirement benefits; or Increasing costs of insurance, changes in coverage and the ability to obtain Forward engineering -looking data, statements can be estimated include estimates with reasonable of oil and certainty gas quantities. to be economically Proved oil and producible gas reserves under areexisting those quantities economic of oil conditions, and gas which, operating by analysis methodsofand geoscience government and regulations. than estimates Other of proved estimates reserves. of oil and Accordingly, gas quantities, estimates including otherestimates than proved of probable reservesreserves, are subject possible to substantially reserves,greater and resource risk of potential, being actually are by realized. theirnaturemorespeculative Investors are urged to consider closely the disclosure in our Form 10-K available at www.nationalfuelgas.com. You can also obtain this form on the SEC’s website at www.sec.gov.
“Risk For a discussion Factors” inof the the Company’s risks set forth Form above 10-K and for the other fiscal factors yearthat ended could September cause actual 30, 2015 results and tothe differ Forms materially 10-Q for from theresults quarters referred endedto December in the forward 31, 2015, -looking March statements, 31, 2016 and see June 30, 2016. The Company disclaims any obligation to update any forward-looking statements to reflect events or circumstances after the date thereof or to reflect the occurrence of unanticipated events. 2
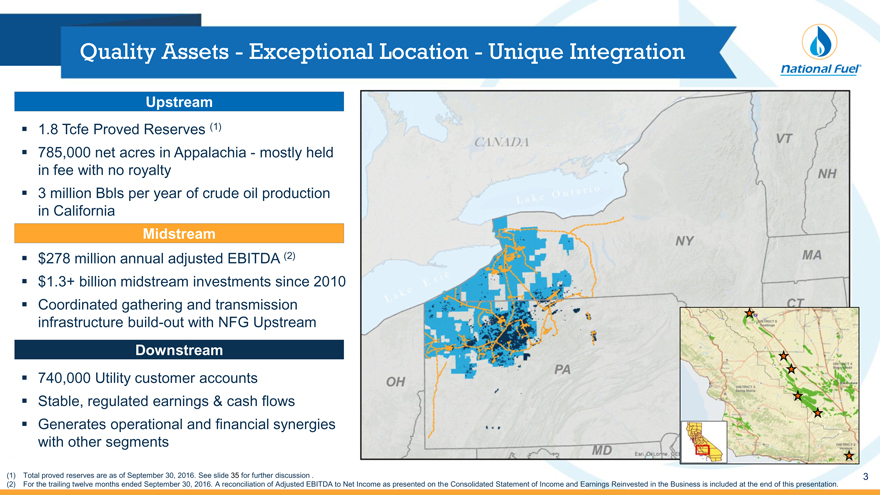
Quality Assets—Exceptional Location—Unique Integration
Upstream
1.8 Tcfe Proved Reserves (1)
785,000 net acres in Appalachia—mostly held in fee with no royalty 3 million Bbls per year of crude oil production in California
Midstream
$278 million annual adjusted EBITDA (2) $1.3+ billion midstream investments since 2010 Coordinated gathering and transmission infrastructure build-out with NFG Upstream
Downstream
740,000 Utility customer accounts Stable, regulated earnings & cash flows Generates operational and financial synergies with other segments
(1) Total proved reserves are as of September 30, 2016. See slide 35 for further discussion . (2) For the trailing twelve months ended September 30, 2016. A reconciliation of Adjusted EBITDA to Net Income as presented on the Consolidated Statement of Income and Earnings Reinvested in the Business is included at the end of this presentation. 3
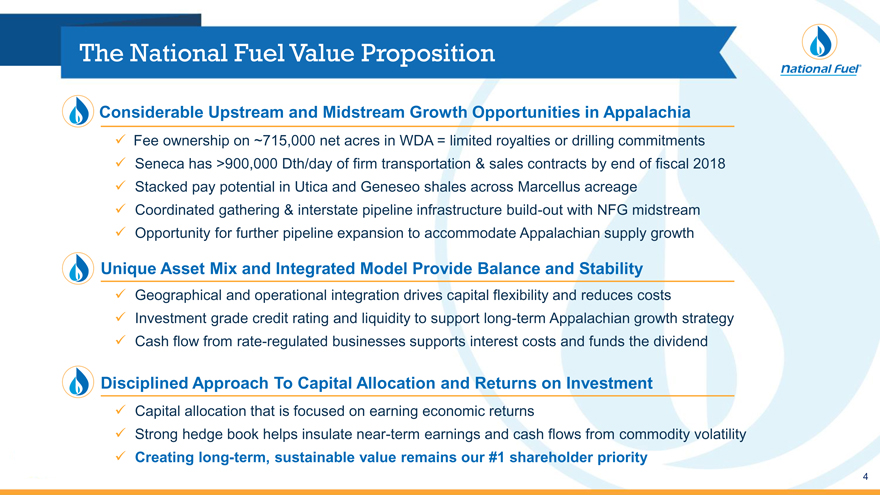
The National Fuel Value Proposition
Considerable Upstream and Midstream Growth Opportunities in Appalachia
Fee ownership on ~715,000 net acres in WDA = limited royalties or drilling commitments Seneca has >900,000 Dth/day of firm transportation & sales contracts by end of fiscal 2018 Stacked pay potential in Utica and Geneseo shales across Marcellus acreage Coordinated gathering & interstate pipeline infrastructure build-out with NFG midstream Opportunity for further pipeline expansion to accommodate Appalachian supply growth
Unique Asset Mix and Integrated Model Provide Balance and Stability
Geographical and operational integration drives capital flexibility and reduces costs
Investment grade credit rating and liquidity to support long-term Appalachian growth strategy Cash flow from rate-regulated businesses supports interest costs and funds the dividend
Disciplined Approach To Capital Allocation and Returns on Investment
Capital allocation that is focused on earning economic returns
Strong hedge book helps insulate near-term earnings and cash flows from commodity volatility
Creating long-term, sustainable value remains our #1 shareholder priority
4
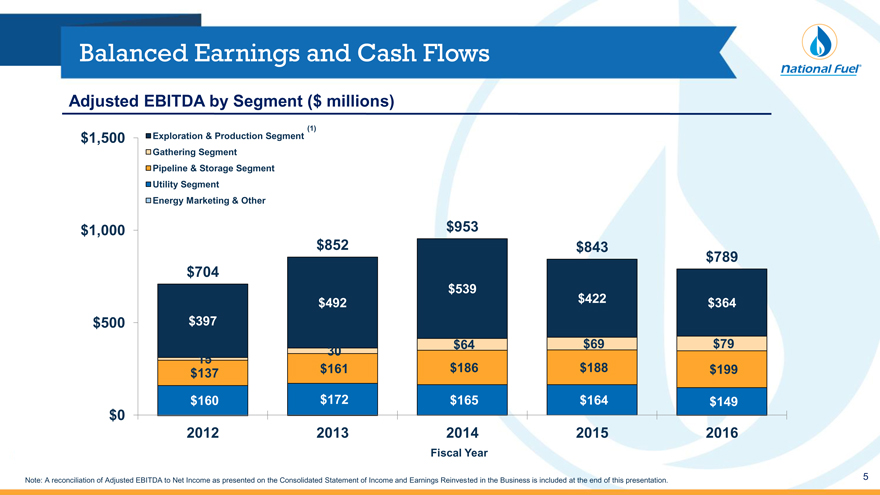
Balanced Earnings and Cash Flows
Adjusted EBITDA by Segment ($ millions)
Exploration & Production Segment (1)
$1,500
Gathering Segment
Pipeline & Storage Segment
Utility Segment
Energy Marketing & Other
$1,000 $953
$852 $843
$789
$704
$539
$492 $422 $364
$500 $397
$64 $69 $79
30
15
$137 $161 $186 $188 $199
$160 $172 $165 $164 $149
$0
2012 2013 2014 2015 2016
Fiscal Year
Note: A reconciliation of Adjusted EBITDA to Net Income as presented on the Consolidated Statement of Income and Earnings Reinvested in the Business is included at the end of this presentation. 5
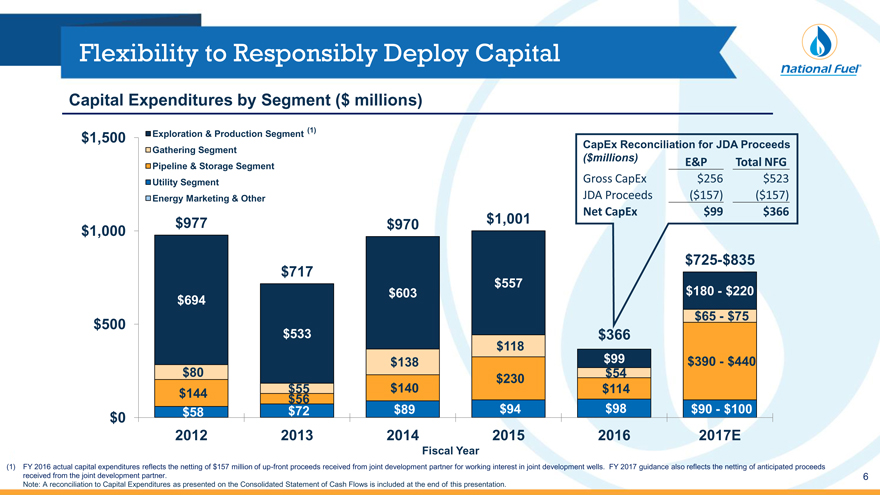
Flexibility to Responsibly Deploy Capital
Capital Expenditures by Segment ($ millions)
$1,500 Exploration & Production Segment (1)
CapEx Reconciliation for JDA Proceeds
Gathering Segment
Pipeline & Storage Segment ($millions) E&P Total NFG
Utility Segment Gross CapEx $256 $523
Energy Marketing & Other JDA Proceeds ($157) ($157)
$1,001 Net CapEx $99 $366 $977 $970 $1,000 $725-$835 $717 $557 $603 $180—$220 $694
$65—$75 $500 $533 $366 $118 $138 $99 $390—$440
$80 $54 $230 $144 $55 $140 $114 $56
$58 $72 $89 $94 $98 $90—$100 $0 2012 2013 2014 2015 2016 2017E
Fiscal Year
(1) FY 2016 actual capital expenditures reflects the netting of $157 million of up-front proceeds received from joint development partner for working interest in joint development wells. FY 2017 guidance also reflects the netting of anticipated proceeds received from the joint development partner. 6 Note: A reconciliation to Capital Expenditures as presented on the Consolidated Statement of Cash Flows is included at the end of this presentation.
6
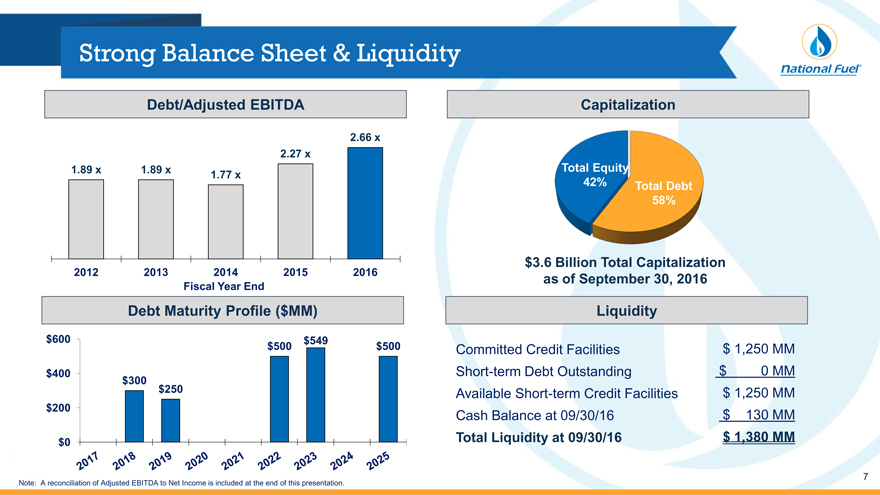
Strong Balance Sheet & Liquidity
Debt/Adjusted EBITDA Capitalization
2.66 x
2.27 x
1.89 x 1.89 x Total Equity
1.77 x
42% Total Debt
58%
$3.6 Billion Total Capitalization
2012 2013 2014 2015 2016 as of September 30, 2016
Fiscal Year End
Debt Maturity Profile ($MM) Liquidity
$600 $549
$500 $500 Committed Credit Facilities $ 1,250 MM
$400 Short-term Debt Outstanding $ 0 MM
$300
$250 Available Short-term Credit Facilities $ 1,250 MM
$200
Cash Balance at 09/30/16 $ 130 MM
$0 Total Liquidity at 09/30/16 $ 1,380 MM
7
Note: A reconciliation of Adjusted EBITDA to Net Income is included at the end of this presentation.
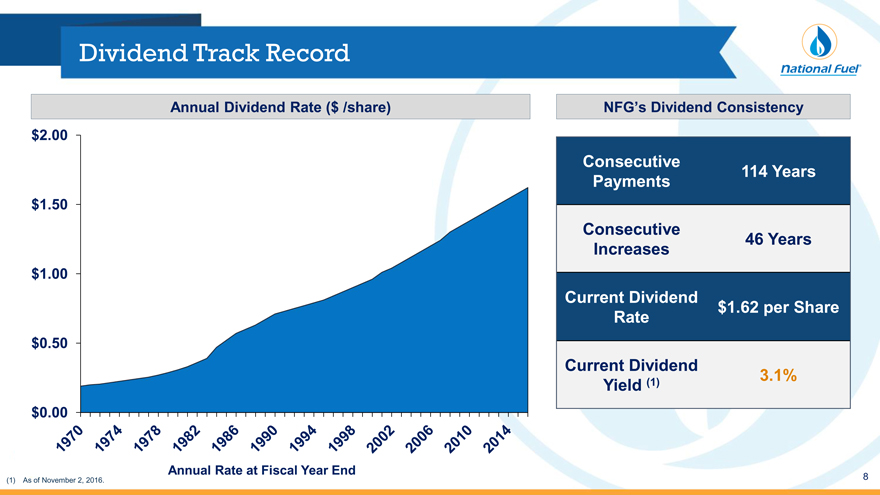
Dividend Track Record
Annual Dividend Rate ($ /share) NFG’s Dividend Consistency
$2.00
Consecutive
114 Years
Payments
$1.50
Consecutive
46 Years
Increases
$1.00
Current Dividend
$1.62 per Share
Rate
$0.50
Current Dividend
3.1%
Yield (1)
$0.00
Annual Rate at Fiscal Year End
(1) As of November 2, 2016. 8
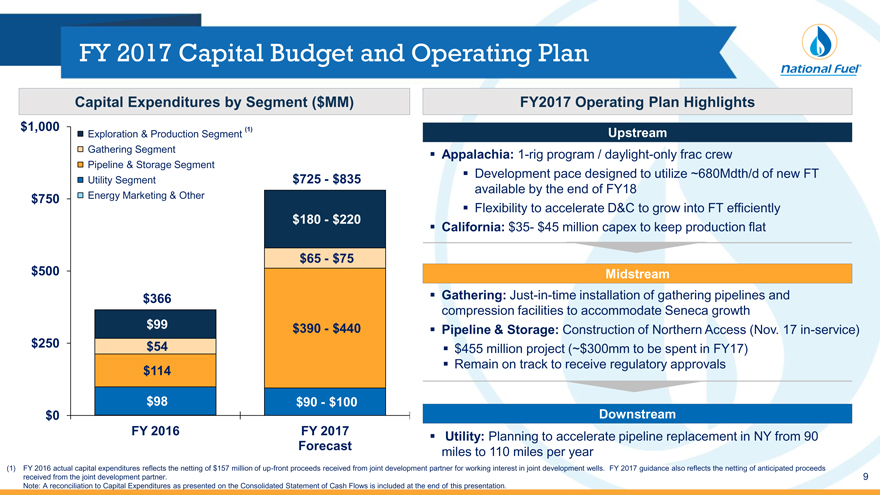
FY 2017 Capital Budget and Operating Plan
Capital Expenditures by Segment ($MM) FY2017 Operating Plan Highlights $1,000 (1)
Exploration & Production Segment Upstream
Gathering Segment Appalachia: 1-rig program / daylight-only frac crew
Pipeline & Storage Segment
$725—$835 Development pace designed to utilize ~680Mdth/d of new FT
Utility Segment
available by the end of FY18
$750 Energy Marketing & Other
$180—$220 Flexibility to accelerate D&C to grow into FT efficiently California: $35- $45 million capex to keep production flat
$65—$75 $500 Midstream $366 Gathering: Just-in-time installation of gathering pipelines and compression facilities to accommodate Seneca growth
$99 $390—$440 Pipeline & Storage: Construction of Northern Access (Nov. 17 in-service) $250 $54 $455 million project (~$300mm to be spent in FY17) Remain on track to receive regulatory approvals $114
$98 $90—$100
$0 Downstream
FY 2016 FY 2017 Utility: Planning to accelerate pipeline replacement in NY from 90
Forecast miles to 110 miles per year
(1) FY 2016 actual capital expenditures reflects the netting of $157 million of up-front proceeds received from joint development partner for working interest in joint development wells. FY 2017 guidance also reflects the netting of anticipated proceeds received from the joint development partner. 9 Note: A reconciliation to Capital Expenditures as presented on the Consolidated Statement of Cash Flows is included at the end of this presentation.
Appalachia Overview
Exploration & Production ~ Gathering ~ Pipeline & Storage
10
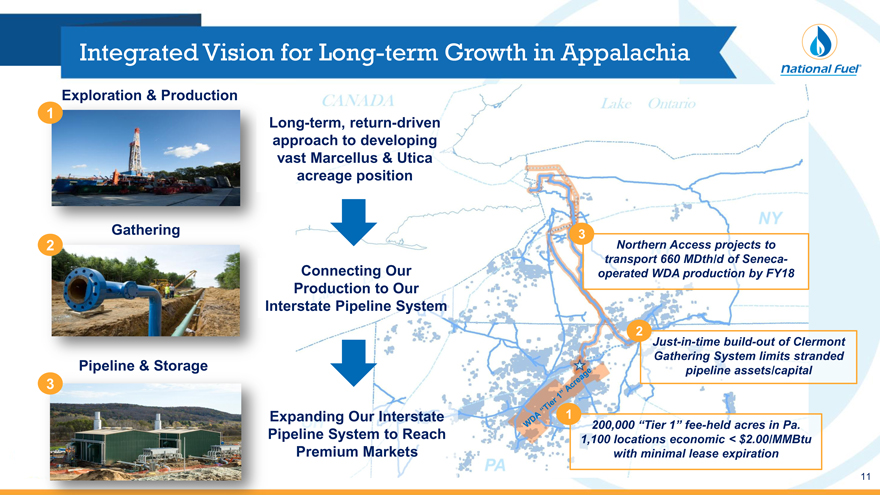
Integrated Vision for Long-term Growth in Appalachia
Exploration & Production 1
Long-term, return-driven approach to developing vast Marcellus & Utica acreage position
Gathering 3
2 Northern Access projects to transport 660 MDth/d of Seneca-Connecting Our operated WDA production by FY18
Production to Our Interstate Pipeline System
Just-in-time build-out of Clermont Gathering System limits stranded Pipeline & Storage pipeline assets/capital
3
Expanding Our Interstate 1
200,000 “Tier 1” fee-held acres in Pa. Pipeline System to Reach 1,100 locations economic < $2.00/MMBtu Premium Markets with minimal lease expiration
11
Upstream
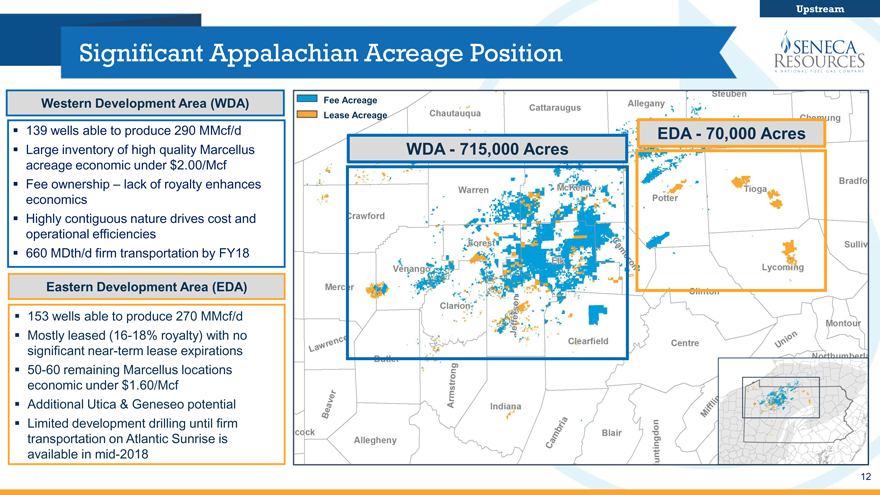
Significant Appalachian Acreage Position
Western Development Area (WDA) Fee Acreage
Lease Acreage
139 wells able to produce 290 MMcf/d EDA—70,000 Acres Large inventory of high quality Marcellus WDA—715,000 Acres acreage economic under $2.00/Mcf Fee ownership – lack of royalty enhances economics Highly contiguous nature drives cost and operational efficiencies 660 MDth/d firm transportation by FY18
Eastern Development Area (EDA)
153 wells able to produce 270 MMcf/d Mostly leased (16-18% royalty) with no significant near-term lease expirations 50-60 remaining Marcellus locations economic under $1.60/Mcf Additional Utica & Geneseo potential Limited development drilling until firm transportation on Atlantic Sunrise is available in mid-2018
12
Marcellus Shale: Western Development Area
Upstream
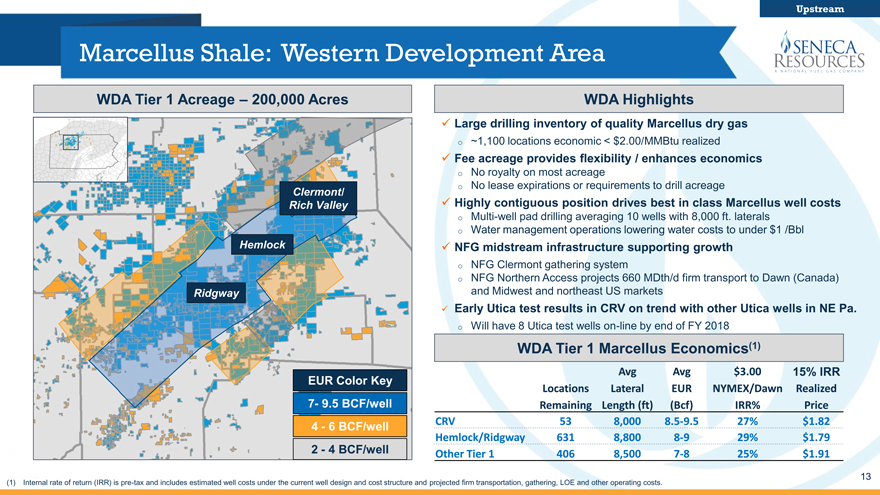
WDA Tier 1 Acreage – 200,000 Acres
Clermont/
Rich Valley
Hemlock
Ridgway
WDA Highlights
Large drilling inventory of quality Marcellus dry gas
~1,100 locations economic < $2.00/MMBtu realized
Fee acreage provides flexibility / enhances economics
No royalty on most acreage
No lease expirations or requirements to drill acreage
Highly contiguous position drives best in class Marcellus well costs
Multi-well pad drilling averaging 10 wells with 8,000 ft. laterals
Water management operations lowering water costs to under $1 /Bbl
NFG midstream infrastructure supporting growth
NFG Clermont gathering system
NFG Northern Access projects 660 MDth/d firm transport to Dawn (Canada) and Midwest and northeast US markets
Early Utica test results in CRV on trend with other Utica wells in NE Pa.
Will have 8 Utica test wells on-line by end of FY 2018
WDA Tier 1 Marcellus Economics(1)
Avg Avg $3.00 15% IRR
EUR Color Key
Locations Lateral EUR NYMEX/Dawn Realized
7- 9.5 BCF/well Remaining Length (ft) (Bcf) IRR% Price
4 - 6 BCF/well CRV 53 8,000 8.5-9.5 27% $ 1.82
Hemlock/Ridgway 631 8,800 8-9 29% $ 1.79
2 - 4 BCF/well Other Tier 1 406 8,500 7-8 25% $ 1.91
13
(1) Internal rate of return (IRR) is pre-tax and includes estimated well costs under the current well design and cost structure and projected firm transportation, gathering, LOE and other operating costs.
Upstream
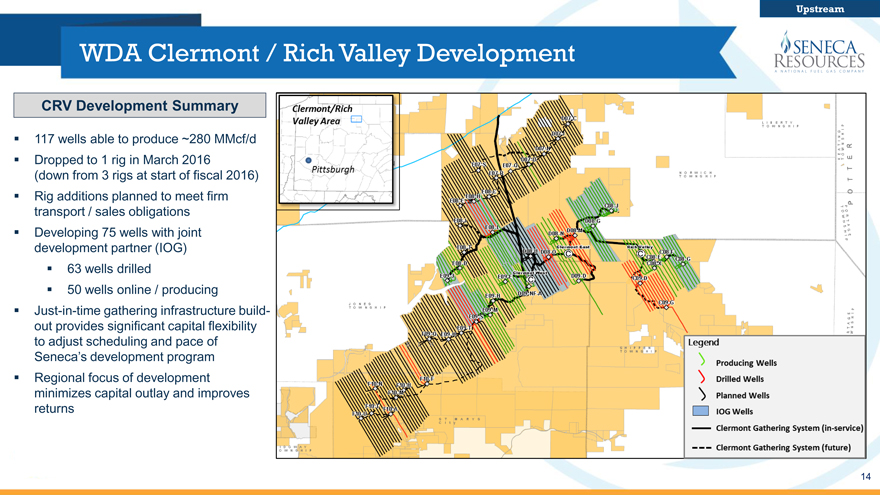
WDA Clermont / Rich Valley Development
CRV Development Summary
117 wells able to produce ~280 MMcf/d Dropped to 1 rig in March 2016 (down from 3 rigs at start of fiscal 2016) Rig additions planned to meet firm transport / sales obligations Developing 75 wells with joint development partner (IOG) 63 wells drilled 50 wells online / producing Just-in-time gathering infrastructure build-out provides significant capital flexibility to adjust scheduling and pace of Seneca’s development program Regional focus of development minimizes capital outlay and improves returns
14
Upstream
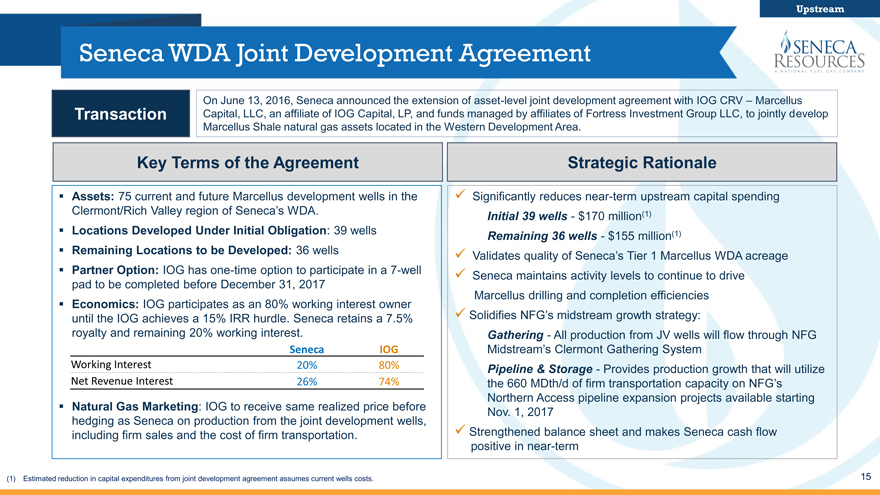
Seneca WDA Joint Development Agreement
On June 13, 2016, Seneca announced the extension of asset-level joint development agreement with IOG CRV – Marcellus Transaction Capital, LLC, an affiliate of IOG Capital, LP, and funds managed by affiliates of Fortress Investment Group LLC, to jointly develop Marcellus Shale natural gas assets located in the Western Development Area.
Key Terms of the Agreement Strategic Rationale
Assets: 75 current and future Marcellus development wells in the Significantly reduces near-term upstream capital spending Clermont/Rich Valley region of Seneca’s WDA. (1)
Initial 39 wells—$170 million
Locations Developed Under Initial Obligation: 39 wells (1)
Remaining 36 wells—$155 million
Remaining Locations to be Developed: 36 wells
Validates quality of Seneca’s Tier 1 Marcellus WDA acreage Partner Option: IOG has one-time option to participate in a 7-well Seneca maintains activity levels to continue to drive pad to be completed before December 31, 2017 Marcellus drilling and completion efficiencies Economics: IOG participates as an 80% working interest owner Solidifies NFG’s midstream growth strategy: until the IOG achieves a 15% IRR hurdle. Seneca retains a 7.5% royalty and remaining 20% working interest. Gathering—All production from JV wells will flow through NFG
Seneca IOG Midstream’s Clermont Gathering System
Working Interest 20% 80% Pipeline & Storage—Provides production growth that will utilize Net Revenue Interest 26% 74% the 660 MDth/d of firm transportation capacity on NFG’s Northern Access pipeline expansion projects available starting Natural Gas Marketing: IOG to receive same realized price before Nov. 1, 2017 hedging as Seneca on production from the joint development wells, including firm sales and the cost of firm transportation. Strengthened balance sheet and makes Seneca cash flow positive in near-term
(1) Estimated reduction in capital expenditures from joint development agreement assumes current wells costs. 15
Upstream
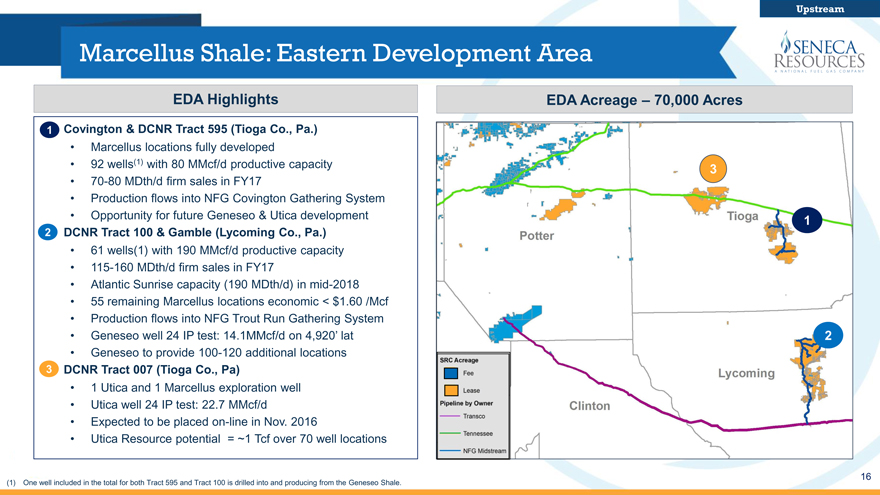
Marcellus Shale: Eastern Development Area
EDA Highlights EDA Acreage – 70,000 Acres
1 Covington & DCNR Tract 595 (Tioga Co., Pa.)
• Marcellus locations fully developed
• 92 wells(1) with 80 MMcf/d productive capacity
3
• 70-80 MDth/d firm sales in FY17
• Production flows into NFG Covington Gathering System
• Opportunity for future Geneseo & Utica development 1
2 DCNR Tract 100 & Gamble (Lycoming Co., Pa.)
• 61 wells(1) with 190 MMcf/d productive capacity
• 115-160 MDth/d firm sales in FY17
• Atlantic Sunrise capacity (190 MDth/d) in mid-2018
• 55 remaining Marcellus locations economic < $1.60 /Mcf
• Production flows into NFG Trout Run Gathering System
• Geneseo well 24 IP test: 14.1MMcf/d on 4,920’ lat 2
• Geneseo to provide 100-120 additional locations
3 DCNR Tract 007 (Tioga Co., Pa)
• 1 Utica and 1 Marcellus exploration well
• Utica well 24 IP test: 22.7 MMcf/d
• Expected to be placed on-line in Nov. 2016
• Utica Resource potential = ~1 Tcf over 70 well locations
16
(1) One well included in the total for both Tract 595 and Tract 100 is drilled into and producing from the Geneseo Shale.
Upstream
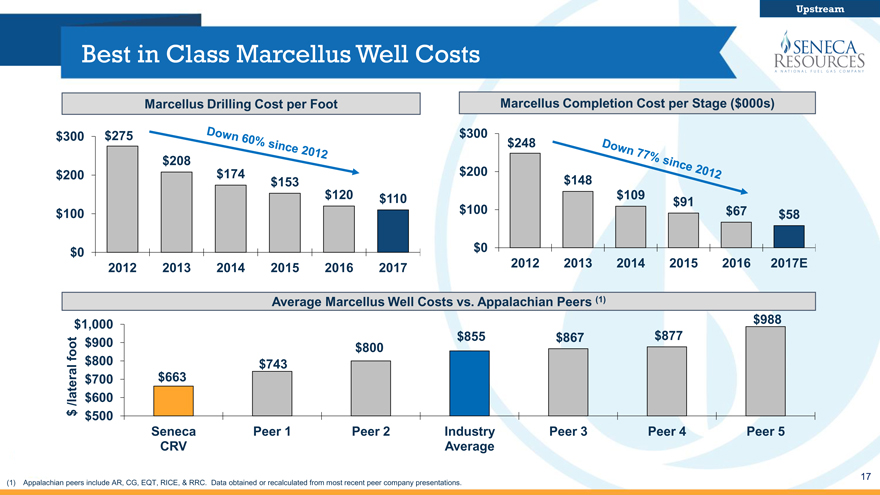
Best in Class Marcellus Well Costs
Marcellus Drilling Cost per Foot Marcellus Completion Cost per Stage ($000s)
$300 $275 $300 $248 $208 $200 $174 $200 $153 $148 $120 $110 $109 $91 $100 $100 $67 $58
$0 $0
2012 2013 2014 2015 2016 2017 2012 2013 2014 2015 2016 2017E
Average Marcellus Well Costs vs. Appalachian Peers (1) $1,000 $988 $855 $867 $877 foot $900 $800 $800 $743 $700 $663 /lateral $600 $ $500 Seneca Peer 1 Peer 2 Industry Peer 3 Peer 4 Peer 5 CRV Average
17
(1) Appalachian peers include AR, CG, EQT, RICE, & RRC. Data obtained or recalculated from most recent peer company presentations.
Upstream
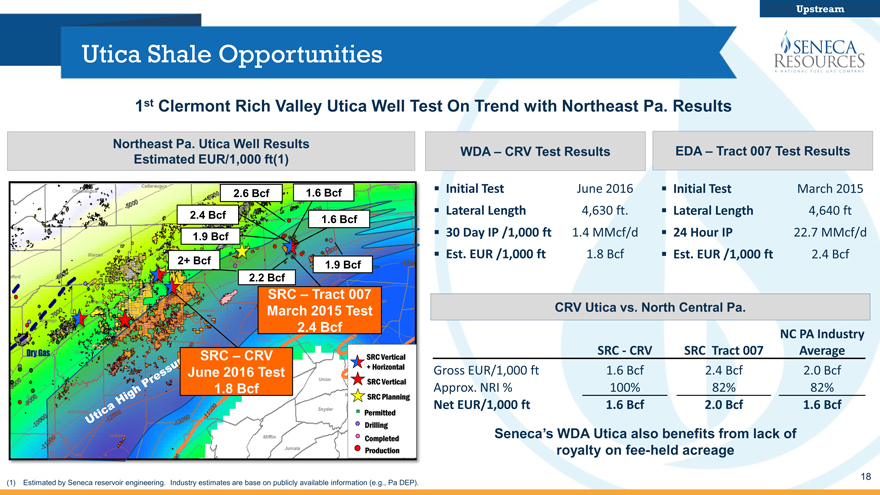
Utica Shale Opportunities
1st Clermont Rich Valley Utica Well Test On Trend with Northeast Pa. Results
Northeast Pa. Utica Well Results
WDA – CRV Test Results EDA – Tract 007 Test Results Estimated EUR/1,000 ft(1)
2.6 Bcf 1.6 Bcf Initial Test June 2016 Initial Test March 2015 2.4 Bcf Lateral Length 4,630 ft. Lateral Length 4,640 ft
1.6 Bcf
1.9 Bcf 30 Day IP /1,000 ft 1.4 MMcf/d 24 Hour IP 22.7 MMcf/d Est. EUR /1,000 ft 1.8 Bcf Est. EUR /1,000 ft 2.4 Bcf
2+ Bcf 1.9 Bcf 2.2 Bcf
SRC – Tract 007
March 2015 Test CRV Utica vs. North Central Pa.
2.4 Bcf
NC PA Industry SRC CRV SRC Tract 007 Average
SRC – CRV SRC Vertical
June 2016 Test + Horizontal Gross EUR/1,000 ft 1.6 Bcf 2.4 Bcf 2.0 Bcf
SRC Vertical
1.8 Bcf SRC Planning Approx. NRI % 100% 82% 82%
Net EUR/1,000 ft 1.6 Bcf 2.0 Bcf 1.6 Bcf
Permitted Drilling
Completed Seneca’s WDA Utica also benefits from lack of Production royalty on fee-held acreage
18
(1) Estimated by Seneca reservoir engineering. Industry estimates are base on publicly available information (e.g., Pa DEP).
Upstream
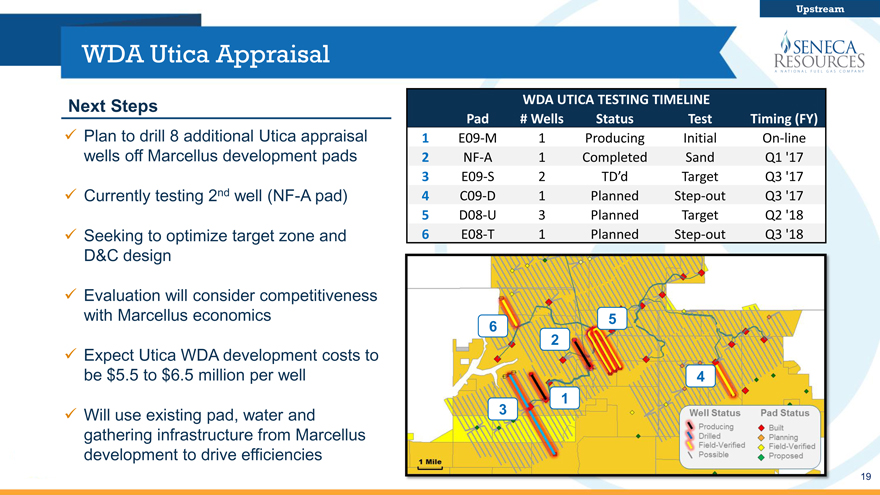
WDA Utica Appraisal
Next Steps WDA UTICA TESTING TIMELINE
Pad # Wells Status Test Timing (FY)
Plan to drill 8 additional Utica appraisal 1 E09 M 1 Producing Initial On line wells off Marcellus development pads 2 NF A1 Completed Sand Q1 ’17
3 E09 S2 TD’d Target Q3 ’17
Currently testing 2nd well (NF-A pad) 4 C09 D 1 Planned Step out Q3 ’17
5 D08 U 3 Planned Target Q2 ’18
Seeking to optimize target zone and 6 E08 T 1 Planned Step out Q3 ’18 D&C design
Evaluation will consider competitiveness with Marcellus economics 5
6 2
Expect Utica WDA development costs to be $5.5 to $6.5 million per well 4 1
Will use existing pad, water and 3 gathering infrastructure from Marcellus development to drive efficiencies
19
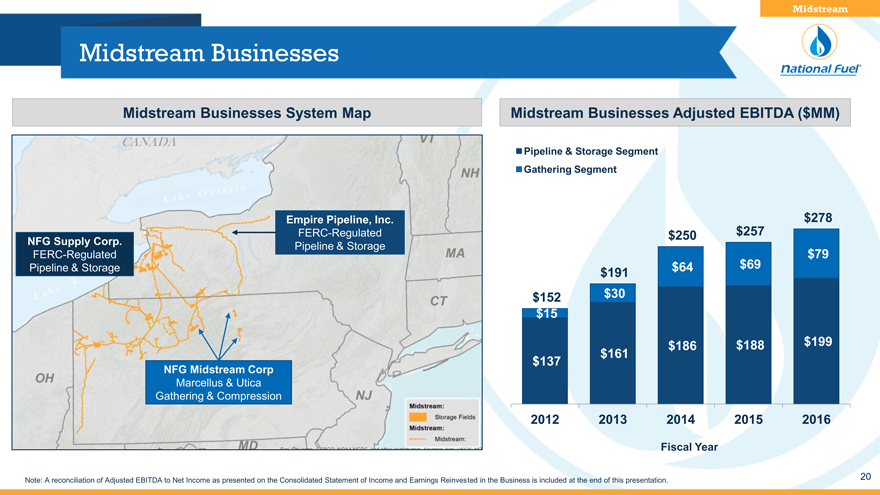
Midstream Businesses
Midstream Businesses System Map Midstream Businesses Adjusted EBITDA ($MM)
Pipeline & Storage Segment
Gathering Segment
Empire Pipeline, Inc. $278
FERC-Regulated $250 $257
NFG Supply Corp. Pipeline & Storage
FERC-Regulated $79
Pipeline & Storage $191 $64 $69
$152 $30
$15
$186 $188 $199
$137 $161
NFG Midstream Corp
Marcellus & Utica
Gathering & Compression
2012 2013 2014 2015 2016
Fiscal Year
Note: A reconciliation of Adjusted EBITDA to Net Income as presented on the Consolidated Statement of Income and Earnings Reinvested in the Business is included at the end of this presentation. 20
Midstream
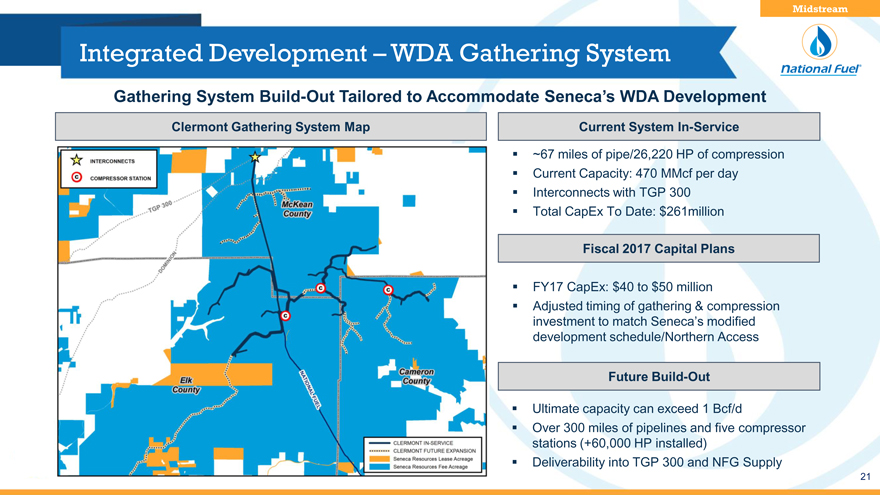
Integrated Development – WDA Gathering System
Gathering System Build-Out Tailored to Accommodate Seneca’s WDA Development
Clermont Gathering System Map Current System In-Service
~67 miles of pipe/26,220 HP of compression Current Capacity: 470 MMcf per day Interconnects with TGP 300 Total CapEx To Date: $261million
FY17 CapEx: $40 to $50 million
Adjusted timing of gathering & compression investment to match Seneca’s modified development schedule/Northern Access
Future Build-Out
Ultimate capacity can exceed 1 Bcf/d
Over 300 miles of pipelines and five compressor stations (+60,000 HP installed) Deliverability into TGP 300 and NFG Supply
21
Midstream
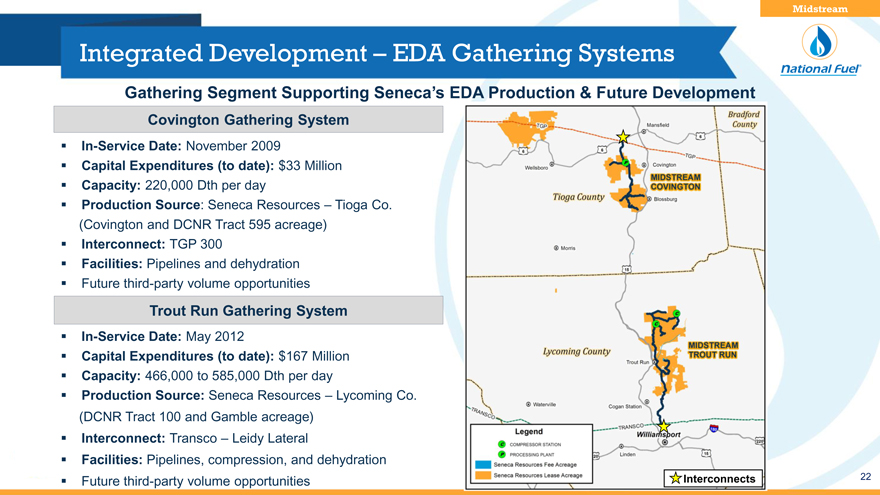
Integrated Development – EDA Gathering Systems
Gathering Segment Supporting Seneca’s EDA Production & Future Development
Covington Gathering System
In-Service Date: November 2009
Capital Expenditures (to date): $33 Million
Capacity: 220,000 Dth per day
Production Source: Seneca Resources – Tioga Co. (Covington and DCNR Tract 595 acreage)
Interconnect: TGP 300
Facilities: Pipelines and dehydration Future third-party volume opportunities
Trout Run Gathering System
In-Service Date: May 2012
Capital Expenditures (to date): $167 Million
Capacity: 466,000 to 585,000 Dth per day
Production Source: Seneca Resources – Lycoming Co. (DCNR Tract 100 and Gamble acreage) Interconnect: Transco – Leidy Lateral Facilities: Pipelines, compression, and dehydration
Future third-party volume opportunities Interconnects 22
Midstream
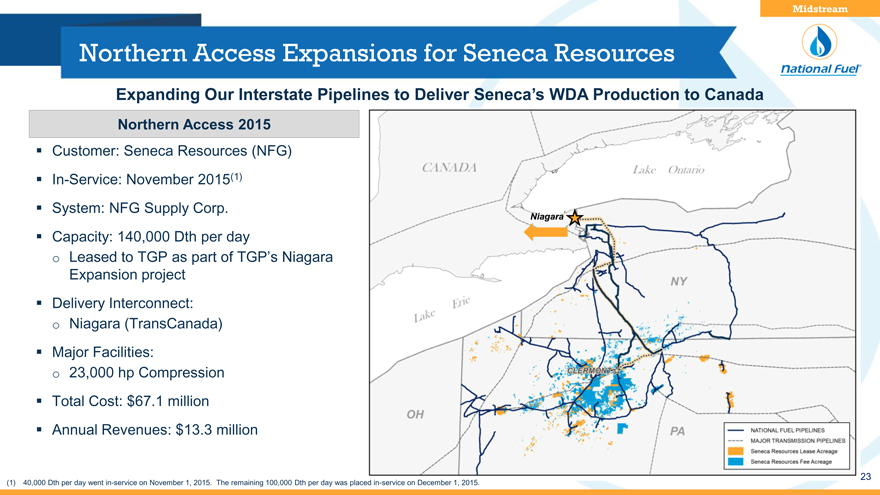
Northern Access Expansions for Seneca Resources
Expanding Our Interstate Pipelines to Deliver Seneca’s WDA Production to Canada
Northern Access 2015
Customer: Seneca Resources (NFG) In-Service: November 2015(1) System: NFG Supply Corp.
Niagara
Capacity: 140,000 Dth per day o Leased to TGP as part of TGP’s Niagara Expansion project Delivery Interconnect: o Niagara (TransCanada) Major Facilities: o 23,000 hp Compression Total Cost: $67.1 million Annual Revenues: $13.3 million
23
(1) 40,000 Dth per day went in-service on November 1, 2015. The remaining 100,000 Dth per day was placed in-service on December 1, 2015.
Midstream
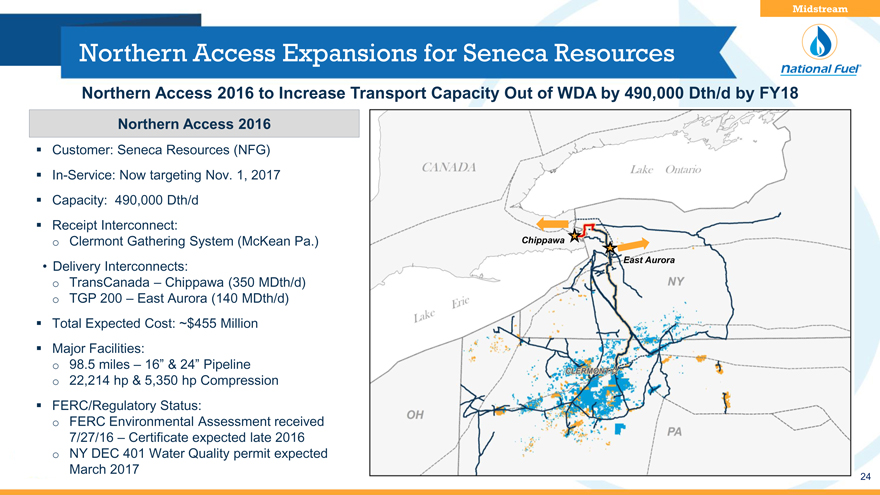
Northern Access Expansions for Seneca Resources
Northern Access 2016 to Increase Transport Capacity Out of WDA by 490,000 Dth/d by FY18
Northern Access 2016
Customer: Seneca Resources (NFG) In-Service: Now targeting Nov. 1, 2017 Capacity: 490,000 Dth/d Receipt Interconnect: o Clermont Gathering System (McKean Pa.) Chippawa
• Delivery Interconnects: East Aurora o TransCanada – Chippawa (350 MDth/d) o TGP 200 – East Aurora (140 MDth/d) Total Expected Cost: ~$455 Million Major Facilities: o 98.5 miles – 16” & 24” Pipeline o 22,214 hp & 5,350 hp Compression FERC/Regulatory Status: o FERC Environmental Assessment received 7/27/16 – Certificate expected late 2016 o NY DEC 401 Water Quality permit expected March 2017
24
Midstream
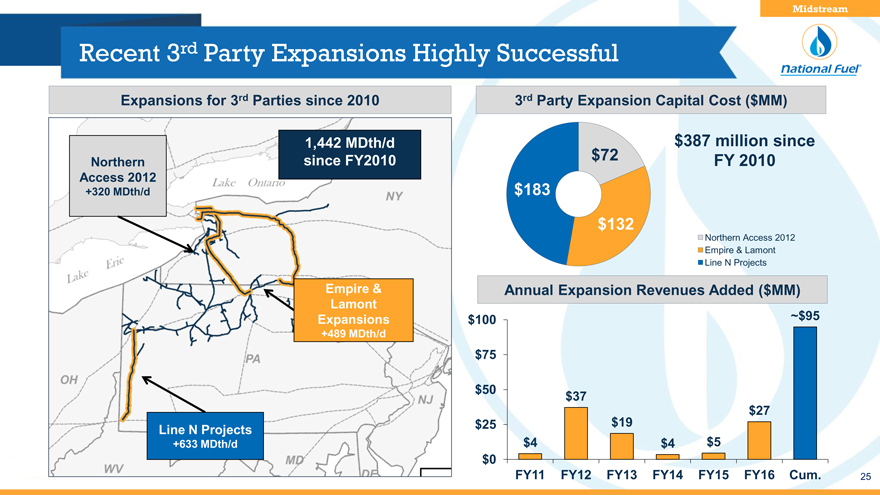
Recent 3rd Party Expansions Highly Successful
Expansions for 3rd Parties since 2010 3rd Party Expansion Capital Cost ($MM)
1,442 MDth/d $387 million since since FY2010 $72 FY 2010
Northern Access 2012
+320 MDth/d $183
$132
Northern Access 2012 Empire & Lamont Line N Projects
Empire & Annual Expansion Revenues Added ($MM)
Lamont ~$95 Expansions $100
+489 MDth/d $75
$50 $37
$19 $27 Line N Projects $25
+633 MDth/d $4 $4 $5 $0
FY11 FY12 FY13 FY14 FY15 FY16 Cum. 25
Midstream
Empire System Expansion
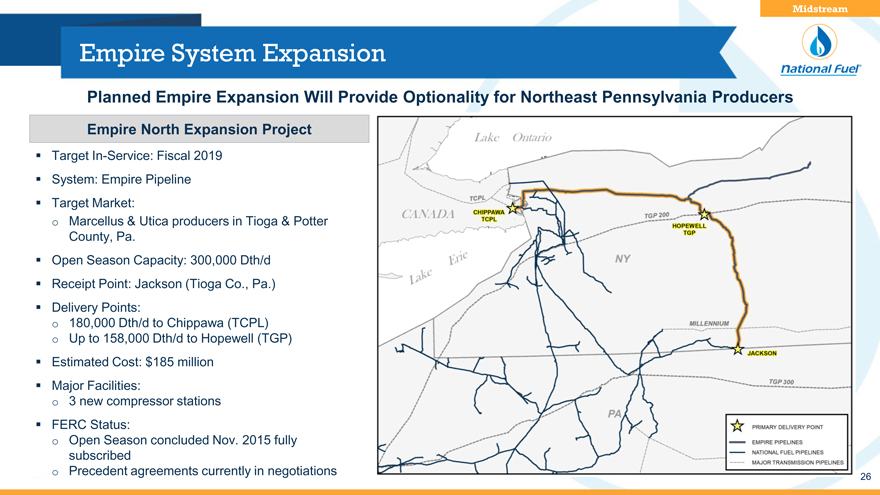
Planned Empire Expansion Will Provide Optionality for Northeast Pennsylvania Producers
Empire North Expansion Project
Target In-Service: Fiscal 2019 System: Empire Pipeline Target Market: o Marcellus & Utica producers in Tioga & Potter County, Pa.
Open Season Capacity: 300,000 Dth/d Receipt Point: Jackson (Tioga Co., Pa.) Delivery Points: o 180,000 Dth/d to Chippawa (TCPL) o Up to 158,000 Dth/d to Hopewell (TGP) Estimated Cost: $185 million Major Facilities: o 3 new compressor stations FERC Status: o Open Season concluded Nov. 2015 fully subscribed o Precedent agreements currently in negotiations
26
Midstream
2015 Pipeline Expansion Projects In-Service
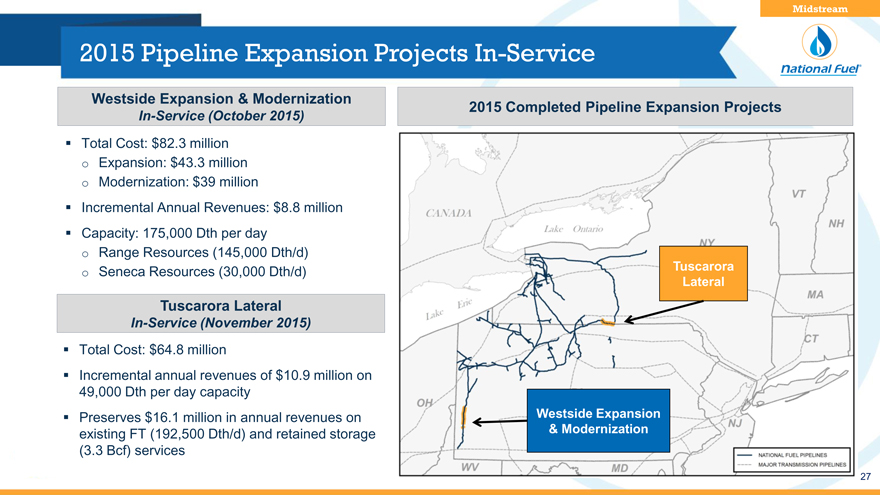
Westside Expansion & Modernization
2015 Completed Pipeline Expansion Projects
In-Service (October 2015)
Total Cost: $82.3 million o Expansion: $43.3 million o Modernization: $39 million
Incremental Annual Revenues: $8.8 million Capacity: 175,000 Dth per day o Range Resources (145,000 Dth/d)
Tuscarora o Seneca Resources (30,000 Dth/d)
Lateral
Tuscarora Lateral
In-Service (November 2015)
Total Cost: $64.8 million
Incremental annual revenues of $10.9 million on 49,000 Dth per day capacity
Preserves $16.1 million in annual revenues on existing FT (192,500 Dth/d) and retained storage & Modernization (3.3 Bcf) services
27
Pipeline & Storage Customer Mix
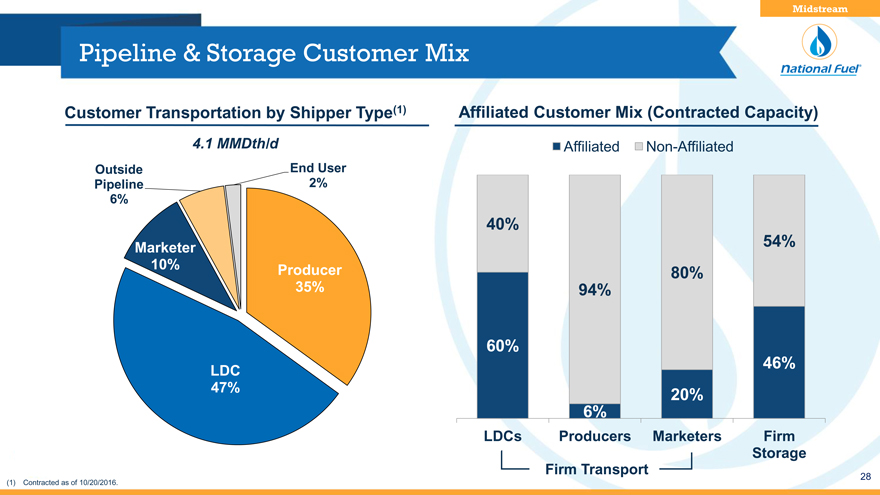
Customer Transportation by Shipper Type(1) Affiliated Customer Mix (Contracted Capacity)
4.1 MMDth/d Affiliated Non-Affiliated
Outside End User
Pipeline 2%
6%
40%
Marketer 54%
10% Producer 80%
35% 94%
60%
LDC 46%
47% 20%
6%
LDCs Producers Marketers Firm
Storage
Firm Transport 28
(1) Contracted as of 10/20/2016.
Upstream
California Overview
Exploration & Production
29
Upstream
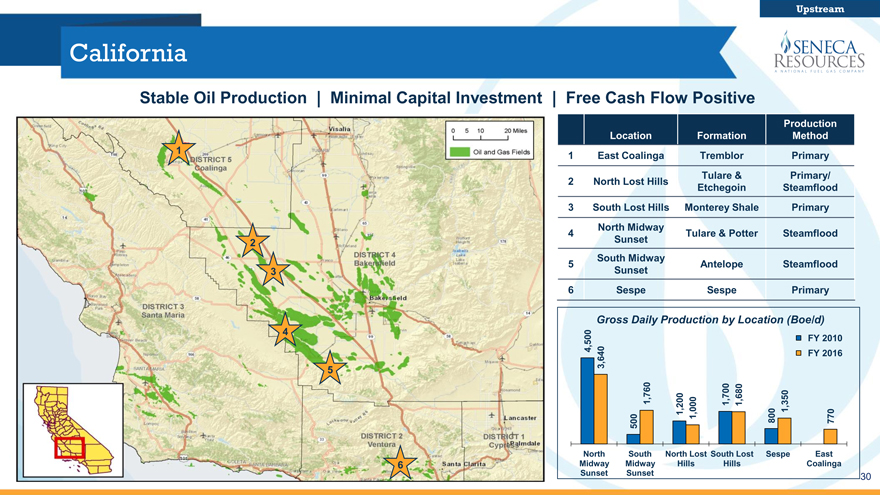
California
Stable Oil Production | Minimal Capital Investment | Free Cash Flow Positive
Production Location Formation Method 1
1 East Coalinga Tremblor Primary Tulare & Primary/
2 North Lost Hills
Etchegoin Steamflood
3 South Lost Hills Monterey Shale Primary North Midway
4 Tulare & Potter Steamflood
2 Sunset South Midway
5 Antelope Steamflood
3 Sunset
6 Sespe Sespe Primary
Gross Daily Production by Location (Boe/d)
4
4,500 FY 2010 3,640 FY 2016
5
1,760 ,200 000 1,700 1,680 1,350
0 0
1 1, 80
500 77
North South North Lost South Lost Sespe East
6 Midway Midway Hills Hills Coalinga Sunset Sunset 30
Upstream
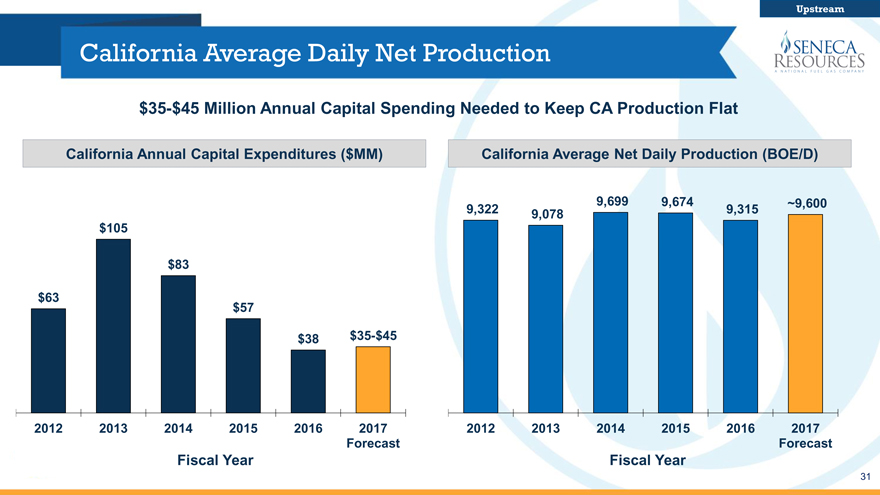
California Average Daily Net Production
$35-$45 Million Annual Capital Spending Needed to Keep CA Production Flat
California Annual Capital Expenditures ($MM) California Average Net Daily Production (BOE/D)
9,699 9,674 ~9,600 9,322 9,078 9,315 $105
$83
$63 $57
$38 $35-$45
2012 2013 2014 2015 2016 2017 2012 2013 2014 2015 2016 2017 Forecast Forecast
Fiscal Year Fiscal Year
31
Upstream
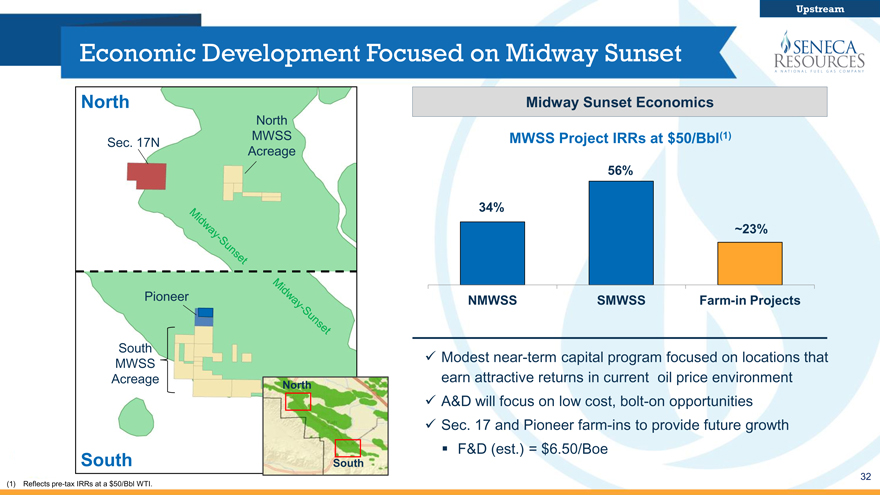
Economic Development Focused on Midway Sunset
North Midway Sunset Economics
North
MWSS MWSS Project IRRs at $50/Bbl(1)
Sec. 17N
Acreage
56%
34%
~23%
Pioneer NMWSS SMWSS Farm-in Projects
South
? Modest near-term capital program focused on locations that
MWSS
Acreage earn attractive returns in current oil price environment
North
? A&D will focus on low cost, bolt-on opportunities? Sec. 17 and Pioneer farm-ins to provide future growth? F&D (est.) = $6.50/Boe
South South
(1) | | Reflects pre-tax IRRs at a $50/Bbl WTI. 32 |
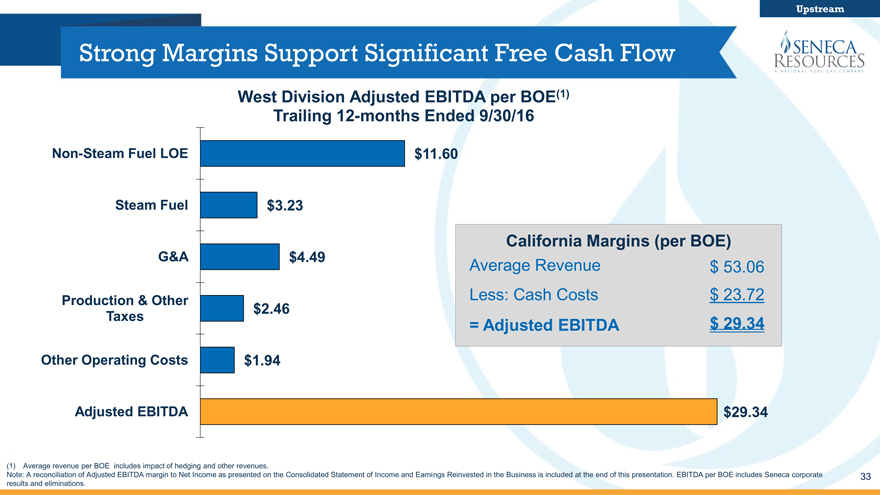
Strong Margins Support Significant Free Cash Flow
West Division Adjusted EBITDA per BOE(1)
Trailing 12-months Ended 9/30/16
Non-Steam Fuel LOE $11.60
Steam Fuel $3.23
California Margins (per BOE)
G&A $4.49 Average Revenue $ 53.06
Production & Other Less: Cash Costs $ 23.72
$2.46
Taxes = Adjusted EBITDA $ 29.34
Other Operating Costs $1.94
Adjusted EBITDA
$29.34
(1) Average revenue per BOE includes impact of hedging and other revenues.
Note: A reconciliation of Adjusted EBITDA margin to Net Income as presented on the Consolidated Statement of Income and Earnings Reinvested in the Business is included at the end of this presentation. EBITDA per BOE includes Seneca corporate 33
results and eliminations.
Production and Marketing
Exploration & Production
34
Proved Reserves & Development Costs
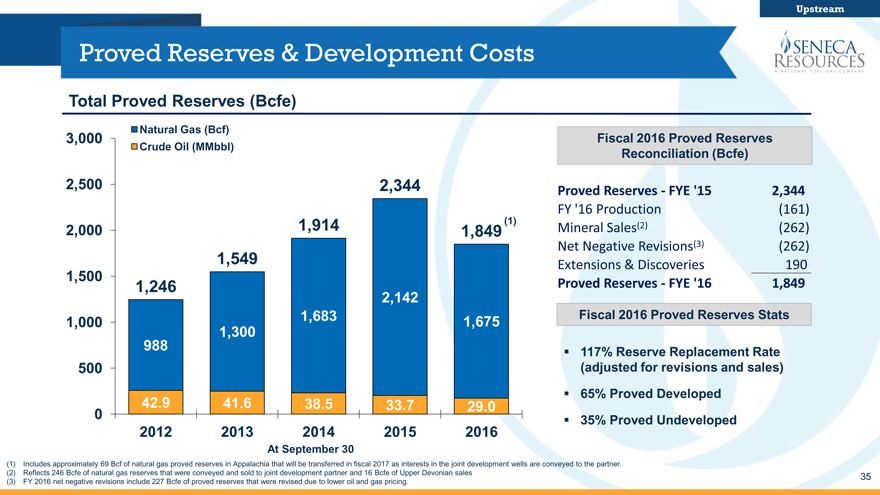
Total Proved Reserves (Bcfe)
Natural Gas (Bcf)
3,000 Fiscal 2016 Proved Reserves
Crude Oil (MMbbl) Reconciliation (Bcfe)
2,500 2,344 Proved Reserves - FYE ��15 2,344
FY ‘16 Production (161)
2,000 1,914 1,849 (1) Mineral Sales(2) (262)
Net Negative Revisions(3) (262)
1,549 Extensions & Discoveries 190
1,500 1,246 Proved Reserves - FYE ‘16 1,849
2,142
1,000 1,683 1,675 Fiscal 2016 Proved Reserves Stats
1,300
988 117% Reserve Replacement Rate
500 (adjusted for revisions and sales)
65% Proved Developed
42.9 41.6 38.5 33.7 29.0
0 35% Proved Undeveloped
2012 2013 2014 2015 2016
At September 30
(1) Includes approximately 69 Bcf of natural gas proved reserves in Appalachia that will be transferred in fiscal 2017 as interests in the joint development wells are conveyed to the partner.
(2) Reflects 246 Bcfe of natural gas reserves that were conveyed and sold to joint development partner and 16 Bcfe of Upper Devonian sales 35
(3) FY 2016 net negative revisions include 227 Bcfe of proved reserves that were revised due to lower oil and gas pricing.
Upstream
Seneca Production
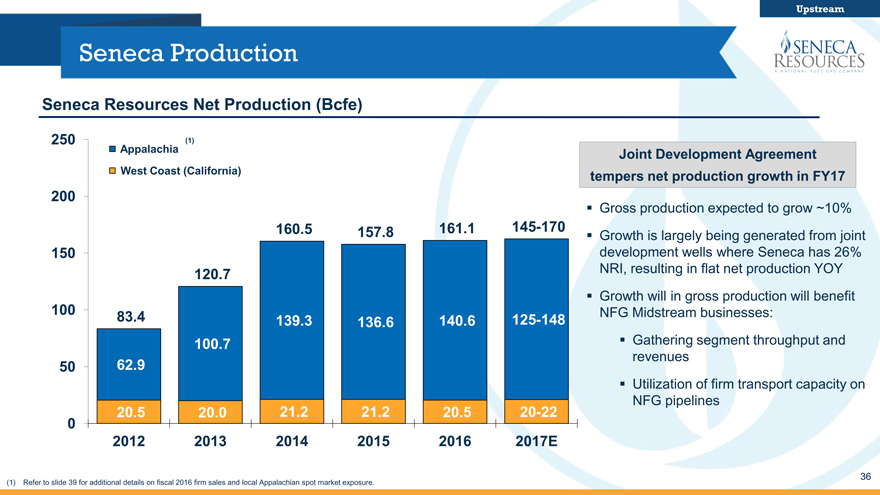
Seneca Resources Net Production (Bcfe)
250 Appalachia (1)
Joint Development Agreement West Coast (California) tempers net production growth in FY17
200
? Gross production expected to grow ~10%
160.5 157.8 161.1 145-170
? Growth is largely being generated from joint 150 development wells where Seneca has 26% 120.7 NRI, resulting in flat net production YOY
? Growth will in gross production will benefit 100 NFG Midstream businesses:
83.4 139.3 136.6 140.6 125-148
100.7 ? Gathering segment throughput and revenues
50 62.9
? Utilization of firm transport capacity on NFG pipelines
20.5 20.0 21.2 21.2 20.5 20-22 0 2012 2013 2014 2015 2016 2017E
36
(1) | | Refer to slide 39 for additional details on fiscal 2016 firm sales and local Appalachian spot market exposure. |
Upstream
Long-Term Contracts Supporting Appalachian Growth
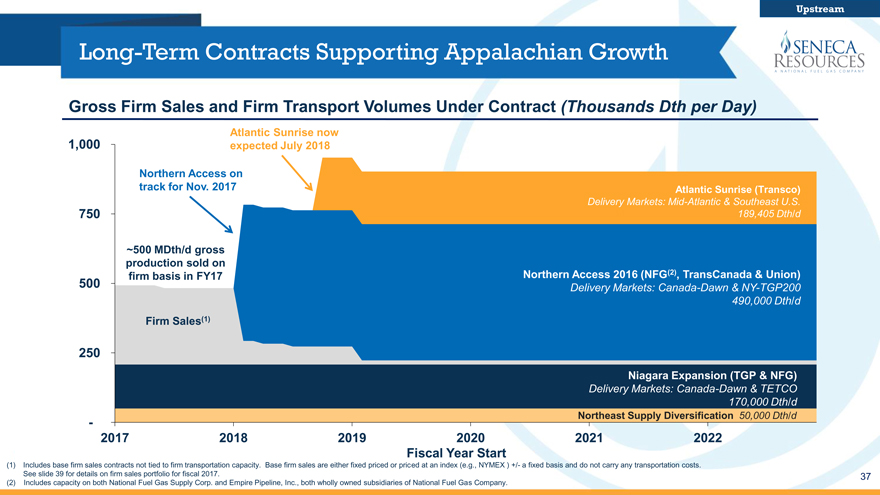
Gross Firm Sales and Firm Transport Volumes Under Contract (Thousands Dth per Day)
Atlantic Sunrise now 1,000 expected July 2018
Northern Access on track for Nov. 2017 Atlantic Sunrise (Transco)
Delivery Markets: Mid-Atlantic & Southeast U.S. 750 189,405 Dth/d
~500 MDth/d gross production sold on firm basis in FY17 Northern Access 2016 (NFG(2), TransCanada & Union)
500 Delivery Markets: Canada-Dawn & NY-TGP200 490,000 Dth/d
Firm Sales(1)
250
Niagara Expansion (TGP & NFG)
Delivery Markets: Canada-Dawn & TETCO 170,000 Dth/d
Northeast Supply Diversification 50,000 Dth/d
-
2017 2018 2019 2020 2021 2022 Fiscal Year Start
(1) Includes base firm sales contracts not tied to firm transportation capacity. Base firm sales are either fixed priced or priced at an index (e.g., NYMEX ) +/- a fixed basis and do not carry any transportation costs.
See slide 39 for details on firm sales portfolio for fiscal 2017. (2) Includes capacity on both National Fuel Gas Supply Corp. and Empire Pipeline, Inc., both wholly owned subsidiaries of National Fuel Gas Company.
37
Upstream
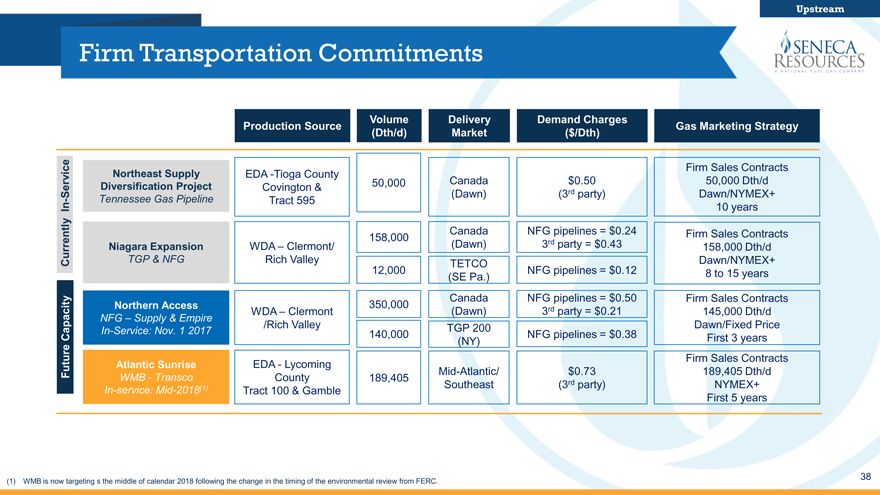
Firm Transportation Commitments
Volume Delivery Demand Charges
Production Source Gas Marketing Strategy (Dth/d) Market ($/Dth)
e Firm Sales Contracts Northeast Supply EDA -Tioga County 50,000 Canada $0.50 50,000 Dth/d
Diversification Project Covington &
Servic (Dawn) (3rd party) Dawn/NYMEX+
- Tennessee Gas Pipeline Tract 595
In 10 years Canada NFG pipelines = $0.24 Firm Sales Contracts 158,000 rd rently Niagara Expansion WDA – Clermont/ (Dawn) 3 party = $0.43 158,000 Dth/d Cur TGP & NFG Rich Valley TETCO Dawn/NYMEX+ 12,000 NFG pipelines = $0.12 8 to 15 years (SE Pa.) Canada NFG pipelines = $0.50 Firm Sales Contracts
Northern Access 350,000 rd
WDA – Clermont (Dawn) 3 party = $0.21 145,000 Dth/d pacity NFG – Supply & Empire
/Rich Valley TGP 200 Dawn/Fixed Price Ca—. 140,000 NFG pipelines = $0.38 (NY) First 3 years Firm Sales Contracts
Atlantic Sunrise EDA—Lycoming
Future Mid-Atlantic/ $0.73 189,405 Dth/d WMB—Transco County 189,405 Southeast (3rd party) NYMEX+
In-service: Mid-2018(1) Tract 100 & Gamble
First 5 years
(1) WMB is now targeting s the middle of calendar 2018 following the change in the timing of the environmental review from FERC.
38
Upstream
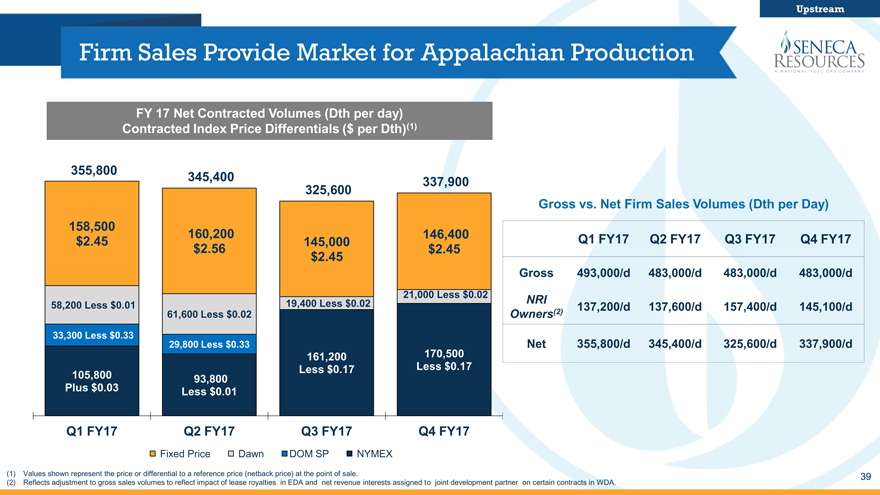
Firm Sales Provide Market for Appalachian Production
FY 17 Net Contracted Volumes (Dth per day) Contracted Index Price Differentials ($ per Dth)(1)
355,800
345,400 337,900 325,600
Gross vs. Net Firm Sales Volumes (Dth per Day) 158,500 160,200 146,400 Q1 FY17 Q2 FY17 Q3 FY17 Q4 FY17 $2.45 145,000
. $2.45 $2.45
Gross 493,000/d 483,000/d 483,000/d 483,000/d
19,400 Less $0.02 21,000 Less $0.02 NRI
58,200 Less $0.01 137,200/d 137,600/d 157,400/d 145,100/d
61,600 Less $0.02 Owners(2)
33,300 Less $0.33 29,800 Less $0.33
170,500 Net 355,800/d 345,400/d 325,600/d 337,900/d
161,200 Less $0.17 Less $0.17 105,800 93,800 Plus $0.03 Less $0.01
Q1 FY17 Q2 FY17 Q3 FY17 Q4 FY17
Fixed Price Dawn DOM SP NYMEX
(1) Values shown represent the price or differential to a reference price (netback price) at the point of sale. (2) Reflects adjustment to gross sales volumes to reflect impact of lease royalties in EDA and net revenue interests assigned to joint development partner on certain contracts in WDA.
39
Upstream
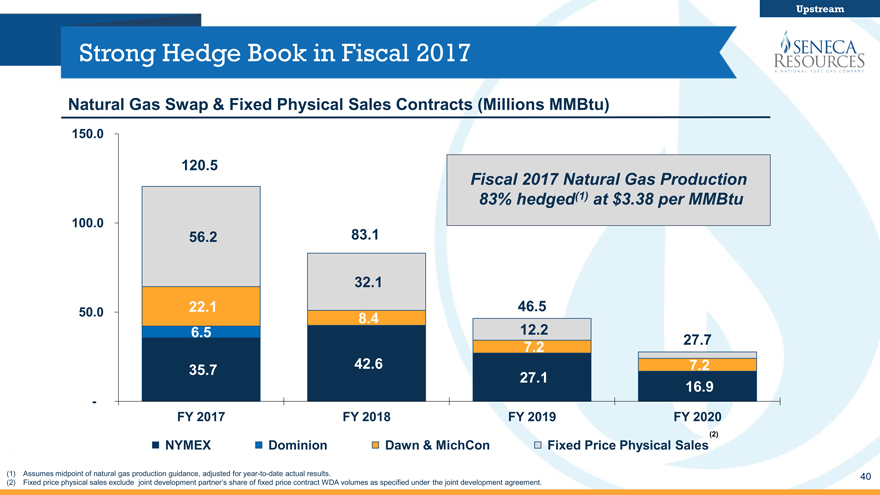
Strong Hedge Book in Fiscal 2017
Natural Gas Swap & Fixed Physical Sales Contracts (Millions MMBtu)
150.0
120.5
Fiscal 2017 Natural Gas Production
83% hedged(1) at $3.38 per MMBtu
100.0
56.2 83.1
32.1
50.0 22.1 46.5
8.4
6.5 12.2
7.2 27.7
35.7 42.6 7.2
27.1 16.9
-
FY 2017 FY 2018 FY 2019 FY 2020
(2)
NYMEX Dominion Dawn & MichCon Fixed Price Physical Sales
(1) Assumes midpoint of natural gas production guidance, adjusted for year-to-date actual results. 40
(2) Fixed price physical sales exclude joint development partner’s share of fixed price contract WDA volumes as specified under the joint development agreement.
Upstream
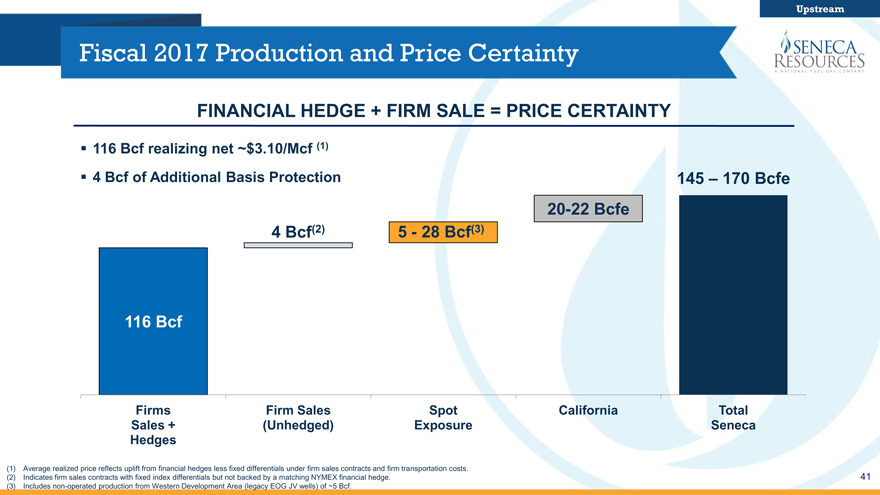
Fiscal 2017 Production and Price Certainty
FINANCIAL HEDGE + FIRM SALE = PRICE CERTAINTY
116 Bcf realizing net ~$3.10/Mcf (1)
4 Bcf of Additional Basis Protection 145 – 170 Bcfe
20-22 Bcfe
4 Bcf(2) 5—28 Bcf(3) 116 Bcf
Firms Firm Sales Spot California Total Sales + (Unhedged) Exposure Seneca Hedges
(1) Average realized price reflects uplift from financial hedges less fixed differentials under firm sales contracts and firm transportation costs.
(2) Indicates firm sales contracts with fixed index differentials but not backed by a matching NYMEX financial hedge. (3) Includes non-operated production from Western Development Area (legacy EOG JV wells) of ~5 Bcf. 41
Upstream
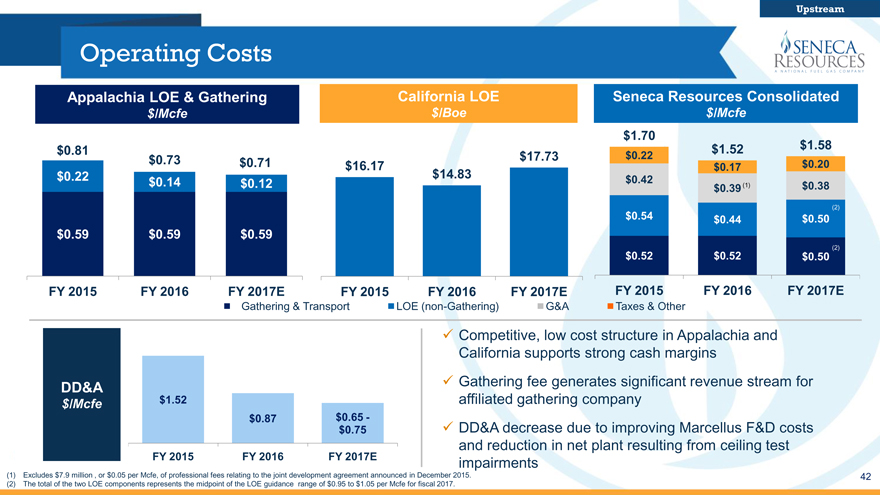
Operating Costs
Appalachia LOE & Gathering California LOE Seneca Resources Consolidated $/Mcfe $/Boe $/Mcfe $1.70 $0.81 $17.73 $0.22 $1.52 $1.58 $0.73 $0.71 $0.20
. $0.17 $0.22 $14.83 $0.42 $0.14 $0.12 (1) (1) $0.38 $0.39 $0.54 (2) $0.44 $0.50 $0.59 $0.59 $0.59 $0.52 $0.52 $0.50
FY 2015 FY 2016 FY 2017E FY 2015 FY 2016 FY 2017E FY 2015 FY 2016 FY 2017E
Gathering & Transport LOE (non-Gathering) G&A Taxes & Other
Competitive, low cost structure in Appalachia and California supports strong cash margins DD&A Gathering fee generates significant revenue stream for $/Mcfe $1.52 affiliated gathering company
$0.87 $0.65 -
$0.75 DD&A decrease due to improving Marcellus F&D costs FY 2015 FY 2016 FY 2017E and reduction in net plant resulting from ceiling test impairments
(1) Excludes $7.9 million , or $0.05 per Mcfe, of professional fees relating to the joint development agreement announced in December 2015. 42 (2) The total of the two LOE components represents the midpoint of the LOE guidance range of $0.95 to $1.05 per Mcfe for fiscal 2017.
Downstream Overview
Utility ~ Energy Marketing
43
Downstream
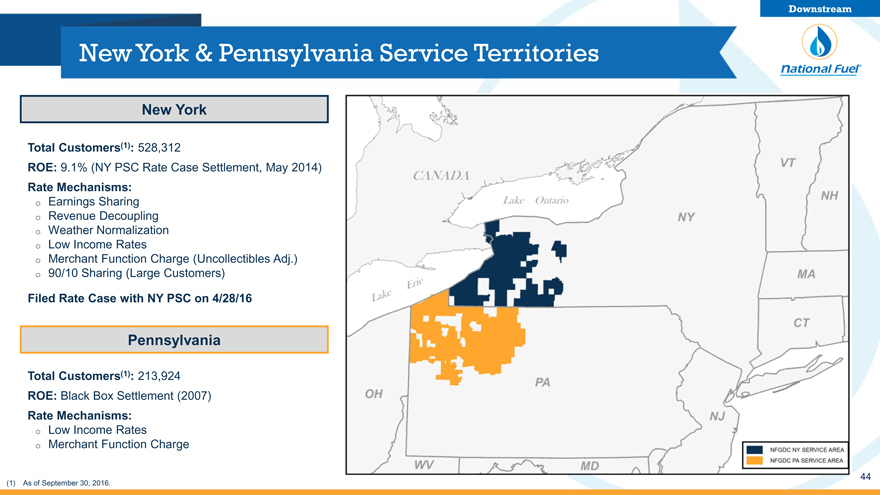
New York & Pennsylvania Service Territories
New York
Total Customers(1): 528,312
ROE: 9.1% (NY PSC Rate Case Settlement, May 2014)
Rate Mechanisms: o Earnings Sharing o Revenue Decoupling o Weather Normalization o Low Income Rates o Merchant Function Charge (Uncollectibles Adj.) o 90/10 Sharing (Large Customers)
Filed Rate Case with NY PSC on 4/28/16
Pennsylvania
Total Customers(1): 213,924
ROE: Black Box Settlement (2007)
Rate Mechanisms: o Low Income Rates o Merchant Function Charge
(1) As of September 30, 2016.
44
Downstream
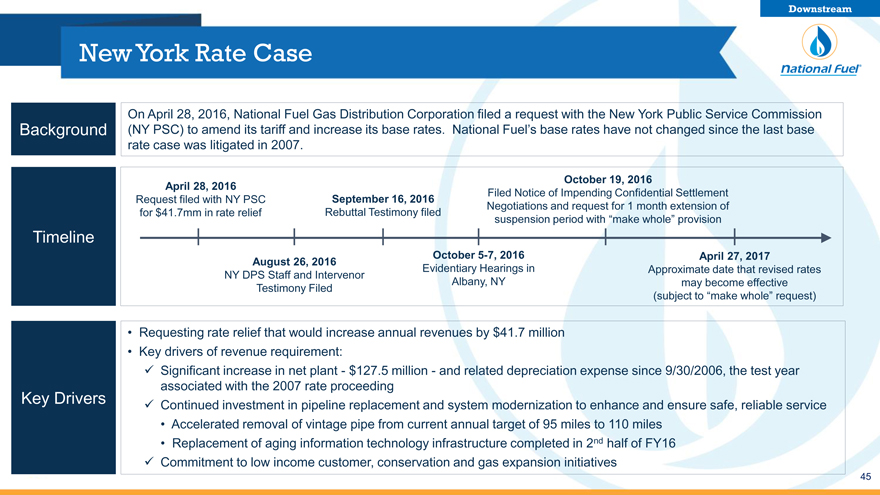
New York Rate Case
On April 28, 2016, National Fuel Gas Distribution Corporation filed a request with the New York Public Service Commission Background (NY PSC) to amend its tariff and increase its base rates. National Fuel’s base rates have not changed since the last base rate case was litigated in 2007.
October 19, 2016 April 28, 2016
Filed Notice of Impending Confidential Settlement Request filed with NY PSC September 16, 2016 Negotiations and request for 1 month extension of for $41.7mm in rate relief Rebuttal Testimony filed suspension period with “make whole” provision
Timeline
October 5-7, 2016 April 27, 2017 August 26, 2016
Evidentiary Hearings in Approximate date that revised rates NY DPS Staff and Intervenor Albany, NY may become effective Testimony Filed (subject to “make whole” request)
• Requesting rate relief that would increase annual revenues by $41.7 million
• Key drivers of revenue requirement:
Significant increase in net plant—$127.5 million—and related depreciation expense since 9/30/2006, the test year associated with the 2007 rate proceeding Key Drivers Continued investment in pipeline replacement and system modernization to enhance and ensure safe, reliable service
• Accelerated removal of vintage pipe from current annual target of 95 miles to 110 miles
• Replacement of aging information technology infrastructure completed in 2nd half of FY16 Commitment to low income customer, conservation and gas expansion initiatives
45
Downstream
Utility: Shifting Trends in Customer Usage
Usage Per Account (1)
Residential (Mcf) Industrial (MMcf)
106 40
104
35 102
100
30 98
96
25 94
92 20
12-Months Ended September 30
(1) Weighted Average of New York and Pennsylvania service territories (assumes normal weather).
46
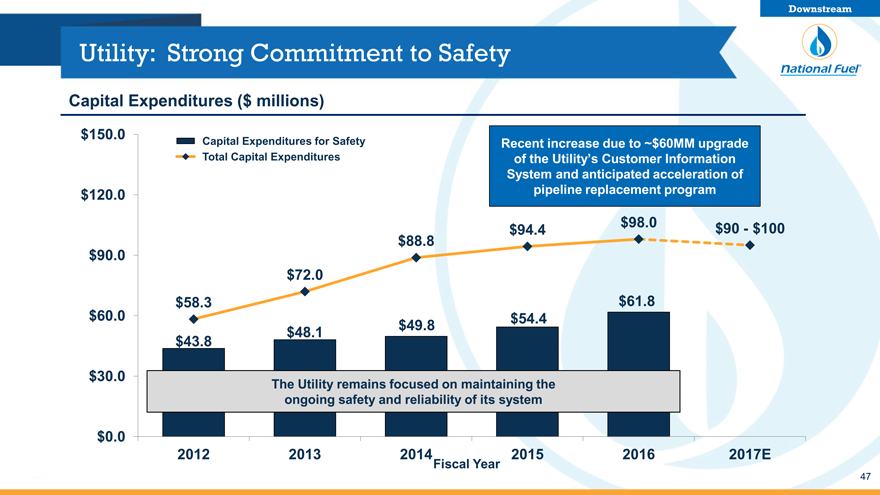
Utility: Strong Commitment to Safety
Capital Expenditures ($ millions)
$150.0 Capital Expenditures for Safety Recent increase due to ~$60MM upgrade
Total Capital Expenditures of the Utility’s Customer Information
System and anticipated acceleration of
$120.0 pipeline replacement program
$94.4 $98.0 $90 - $100
$88.8
$90.0
$72.0
$58.3 $61.8
$60.0 $54.4
$48.1 $49.8
$43.8
$30.0 The Utility remains focused on maintaining the
ongoing safety and reliability of its system
$0.0
2012 2013 2014 2015 2016 2017E
Fiscal Year
47
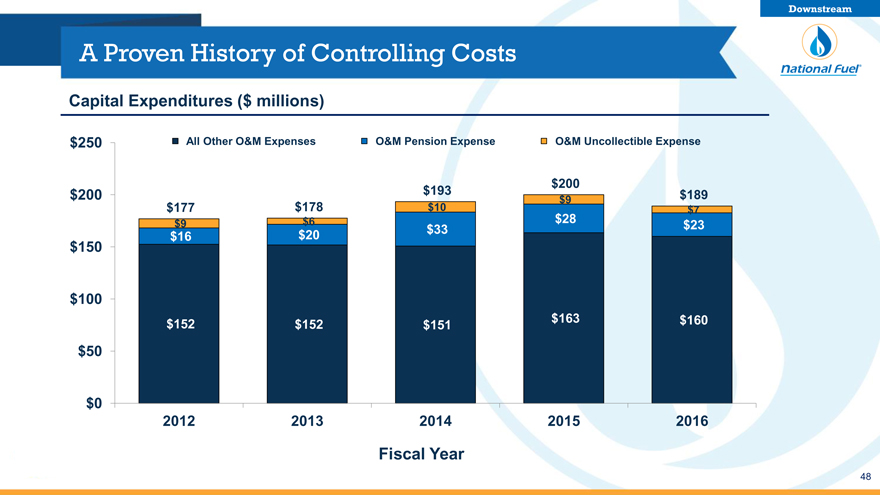
Downstream
A Proven History of Controlling Costs
Capital Expenditures ($ millions)
$250 All Other O&M Expenses O&M Pension Expense O&M Uncollectible Expense
$200 $200 $193 $189 $9 $177 $178 $10 $28 $7
$9 $6 $23
$20 $33 $16 $150
$100 $152 $163 $160 $152 $151 $50
$0
2012 2013 2014 2015 2016
Fiscal Year
48
Appendix
49
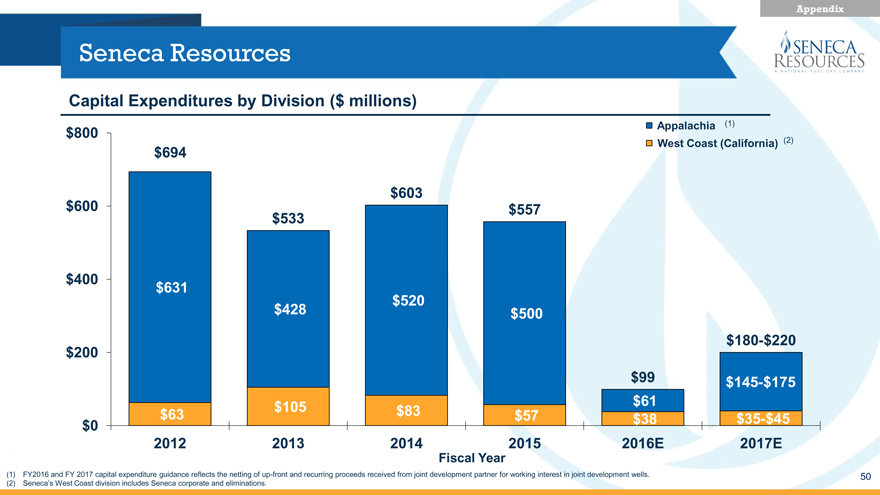
Appendix
Seneca Resources
Capital Expenditures by Division ($ millions)
$800 Appalachia (1)
West Coast (California) (2)
$694
$603
$600 $557
$533
$400 $631
$520
$428 $500
$180-$220
$200
$99 $145-$175
$105 $61
$0 $63 $83 $57 $38 $35-$45
2012 2013 2014 2015 2016E 2017E
Fiscal Year
(1) FY2016 and FY 2017 capital expenditure guidance reflects the netting of up-front and recurring proceeds received from joint development partner for working interest in joint development wells. 50
(2) Seneca’s West Coast division includes Seneca corporate and eliminations.
Appendix
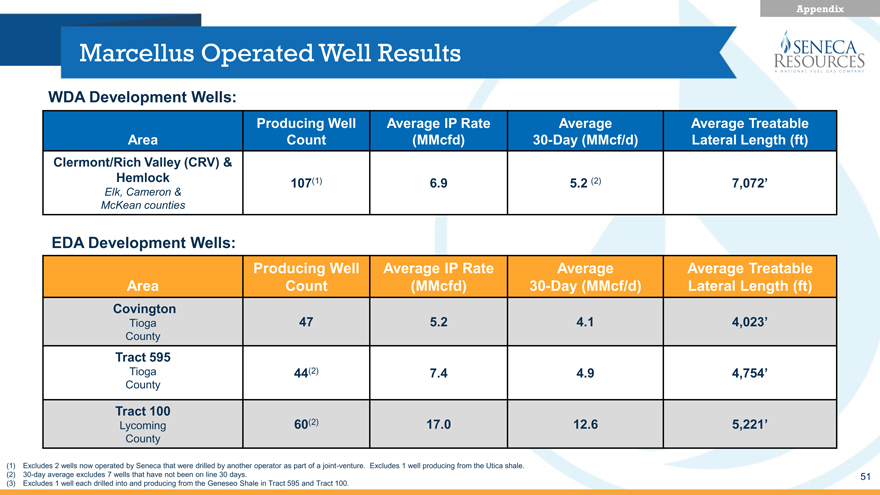
Marcellus Operated Well Results
WDA Development Wells:
Producing Well Average IP Rate Average Average Treatable Area Count (MMcfd) 30-Day (MMcf/d) Lateral Length (ft)
Clermont/Rich Valley (CRV) &
Hemlock 107(1) 6.9 5.2 (2) 7,072’
Elk, Cameron & McKean counties
EDA Development Wells:
Producing Well Average IP Rate Average Average Treatable Area Count (MMcfd) 30-Day (MMcf/d) Lateral Length (ft)
Covington
Tioga 47 5.2 4.1 4,023’
County
Tract 595
Tioga 44(2) 7.4 4.9 4,754’
County
Tract 100
Lycoming 60(2) 17.0 12.6 5,221’
County
(1) Excludes 2 wells now operated by Seneca that were drilled by another operator as part of a joint-venture. Excludes 1 well producing from the Utica shale.
(2) 30-day average excludes 7 wells that have not been on line 30 days. (3) Excludes 1 well each drilled into and producing from the Geneseo Shale in Tract 595 and Tract 100.
51
Appendix
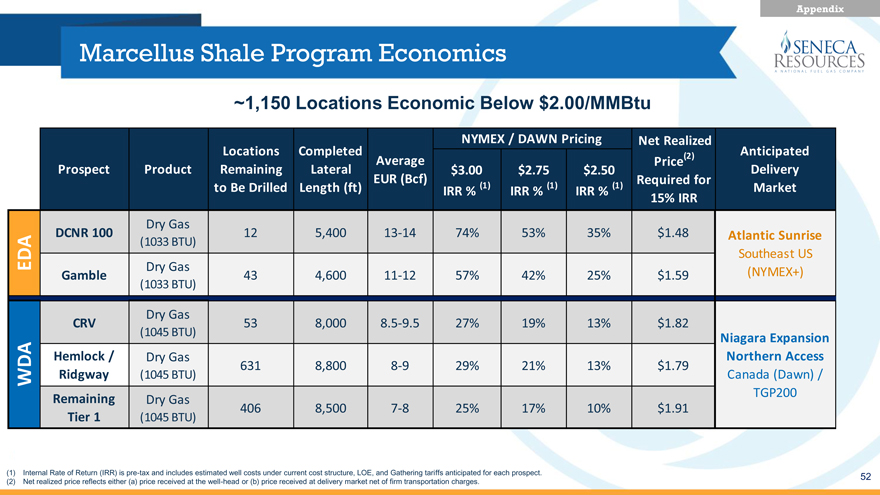
Marcellus Shale Program Economics
~1,150 Locations Economic Below $2.00/MMBtu
NYMEX / DAWN Pricing Net Realized
Locations Completed Anticipated Average Price(2) Prospect Product Remaining Lateral $3.00 $2.75 $2.50 Delivery EUR (Bcf) Required for to Be Drilled Length (ft) IRR % (1) IRR % (1) IRR % (1) Market 15% IRR
Dry Gas
DCNR 100 12 5,400 13 14 74% 53% 35% $1.48 Atlantic Sunrise
A (1033 BTU)
ED Southeast US Dry Gas (NYMEX+) Gamble 43 4,600 11 12 57% 42% 25% $1.59
(1033 BTU)
Dry Gas
CRV 53 8,000 8.5 9.5 27% 19% 13% $1.82
(1045 BTU)
Niagara Expansion Hemlock / Dry Gas Northern Access
631 8,800 8 9 29% 21% 13% $1.79
WDA Ridgway (1045 BTU) Canada (Dawn) / TGP200
Remaining Dry Gas
406 8,500 7 8 25% 17% 10% $1.91
Tier 1 (1045 BTU)
(1) Internal Rate of Return (IRR) is pre-tax and includes estimated well costs under current cost structure, LOE, and Gathering tariffs anticipated for each prospect. (2) Net realized price reflects either (a) price received at the well-head or (b) price received at delivery market net of firm transportation charges.
52
Appendix
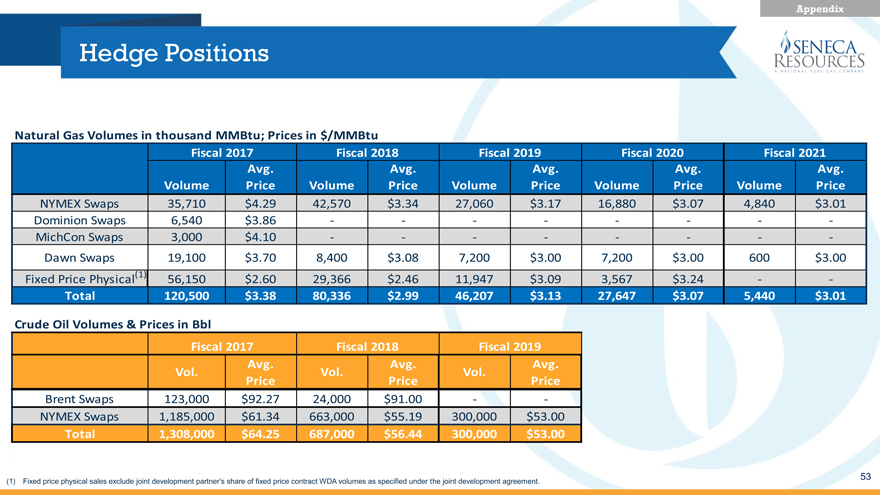
Hedge Positions
Natural Gas Volumes in thousand MMBtu; Prices in $/MMBtu
Fiscal 2017 Fiscal 2018 Fiscal 2019 Fiscal 2020 Fiscal 2021
Avg. Avg. Avg. Avg. Avg.
Volume Price Volume Price Volume Price Volume Price Volume Price
NYMEX Swaps 35,710 $4.29 42,570 $3.34 27,060 $3.17 16,880 $3.07 4,840 $3.01
Dominion Swaps 6,540 $3.86 - - - - - - - -
MichCon Swaps 3,000 $4.10 - - - - - - - -
Dawn Swaps 19,100 $3.70 8,400 $3.08 7,200 $3.00 7,200 $3.00 600 $3.00
Fixed Price Physical(1) 56,150 $2.60 29,366 $2.46 11,947 $3.09 3,567 $3.24 - -
Total 120,500 $3.38 80,336 $2.99 46,207 $3.13 27,647 $3.07 5,440 $3.01
Crude Oil Volumes & Prices in Bbl
Fiscal 2017 Fiscal 2018 Fiscal 2019
Avg. Avg. Avg.
Vol. Vol. Vol.
Price Price Price
Brent Swaps 123,000 $92.27 24,000 $91.00 - -
NYMEX Swaps 1,185,000 $61.34 663,000 $55.19 300,000 $53.00
Total 1,308,000 $64.25 687,000 $56.44 300,000 $53.00
(1) Fixed price physical sales exclude joint development partner’s share of fixed price contract WDA volumes as specified under the joint development agreement.
53
Appendix
Comparable GAAP Financial Measure Slides & Reconciliations
This presentation contains certain non-GAAP financial measures. For pages that contain non-GAAP financial measures, pages containing the most directly comparable GAAP financial measures and reconciliations are provided in the slides that follow.
The Company believes that its non-GAAP financial measures are useful to investors because they provide an alternative method for assessing the Company’s ongoing operating results and for comparing the Company’s financial performance to other companies. The Company’s management uses these non-GAAP financial measures for the same purpose, and for planning and forecasting purposes. The presentation of non-GAAP financial measures is not meant to be a substitute for financial measures prepared in accordance with GAAP.
The Company defines Adjusted EBITDA as reported GAAP earnings before the following items: interest expense, depreciation, depletion and amortization, interest and other income, impairments, items impacting comparability and income taxes.
54
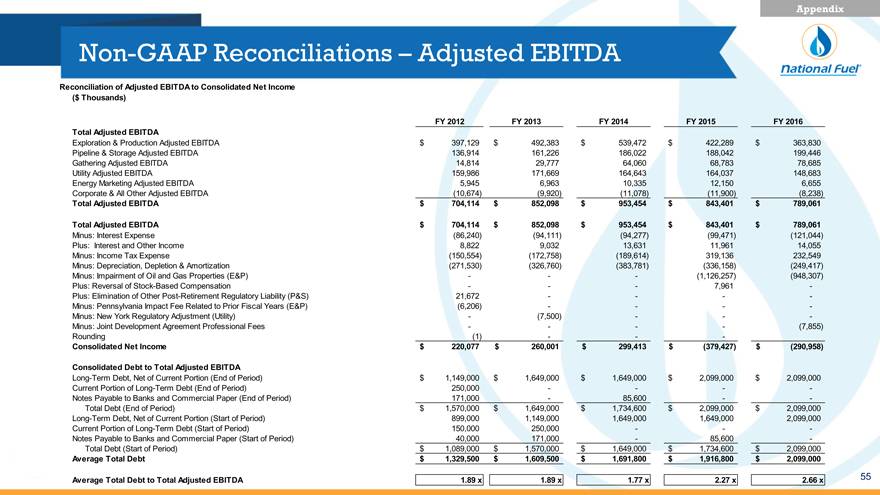
Non-GAAP Reconciliations – Adjusted EBITDA
Reconciliation of Adjusted EBITDA to Consolidated Net Income
($ Thousands)
FY 2012 FY 2013 FY 2014 FY 2015 FY 2016
Total Adjusted EBITDA
Exploration & Production Adjusted EBITDA $ 397,129 $ 492,383 $ 539,472 $ 422,289 $ 363,830
Pipeline & Storage Adjusted EBITDA 136,914 161,226 186,022 188,042 199,446
Gathering Adjusted EBITDA 14,814 29,777 64,060 68,783 78,685
Utility Adjusted EBITDA 159,986 171,669 164,643 164,037 148,683
Energy Marketing Adjusted EBITDA 5,945 6,963 10,335 12,150 6,655
Corporate & All Other Adjusted EBITDA (10,674) (9,920) (11,078) (11,900) (8,238)
Total Adjusted EBITDA $ 704,114 $ 852,098 $ 953,454 $ 843,401 $ 789,061
Total Adjusted EBITDA $ 704,114 $ 852,098 $ 953,454 $ 843,401 $ 789,061
Minus: Interest Expense (86,240) (94,111) (94,277) (99,471) (121,044)
Plus: Interest and Other Income 8,822 9,032 13,631 11,961 14,055
Minus: Income Tax Expense (150,554) (172,758) (189,614) 319,136 232,549
Minus: Depreciation, Depletion & Amortization (271,530) (326,760) (383,781) (336,158) (249,417)
Minus: Impairment of Oil and Gas Properties (E&P) - - - (1,126,257) (948,307)
Plus: Reversal of Stock-Based Compensation - - - 7,961 -
Plus: Elimination of Other Post-Retirement Regulatory Liability (P&S) 21,672 - - - -
Minus: Pennsylvania Impact Fee Related to Prior Fiscal Years (E&P) (6,206) - - - -
Minus: New York Regulatory Adjustment (Utility) - (7,500) - - -
Minus: Joint Development Agreement Professional Fees - - - - (7,855)
Rounding (1) - - -
Consolidated Net Income $ 220,077 $ 260,001 $ 299,413 $ (379,427) $ (290,958)
Consolidated Debt to Total Adjusted EBITDA
Long-Term Debt, Net of Current Portion (End of Period) $ 1,149,000 $ 1,649,000 $ 1,649,000 $ 2,099,000 $ 2,099,000
Current Portion of Long-Term Debt (End of Period) 250,000 - - - -
Notes Payable to Banks and Commercial Paper (End of Period) 171,000 - 85,600 - -
Total Debt (End of Period) $ 1,570,000 $ 1,649,000 $ 1,734,600 $ 2,099,000 $ 2,099,000
Long-Term Debt, Net of Current Portion (Start of Period) 899,000 1,149,000 1,649,000 1,649,000 2,099,000
Current Portion of Long-Term Debt (Start of Period) 150,000 250,000 - - -
Notes Payable to Banks and Commercial Paper (Start of Period) 40,000 171,000 - 85,600 -
Total Debt (Start of Period) $ 1,089,000 $ 1,570,000 $ 1,649,000 $ 1,734,600 $ 2,099,000
Average Total Debt $ 1,329,500 $ 1,609,500 $ 1,691,800 $ 1,916,800 $ 2,099,000
Average Total Debt to Total Adjusted EBITDA 1.89 x 1.89 x 1.77 x 2.27 x 2.66 x 55
Appendix
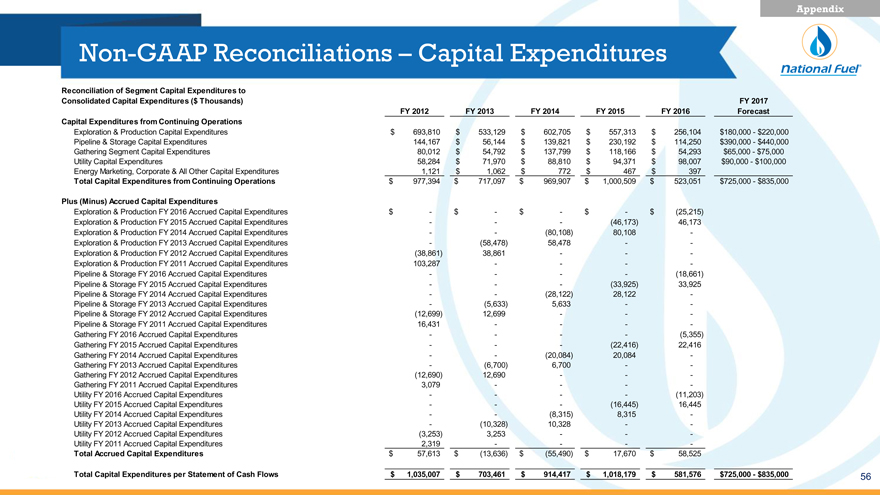
Non-GAAP Reconciliations – Capital Expenditures
Reconciliation of Segment Capital Expenditures to
Consolidated Capital Expenditures ($ Thousands) FY 2017 FY 2012 FY 2013 FY 2014 FY 2015 FY 2016 Forecast Capital Expenditures from Continuing Operations
Exploration & Production Capital Expenditures $ 693,810 $ 533,129 $ 602,705 $ 557,313 $ 256,104 $180,000—$220,000 Pipeline & Storage Capital Expenditures 144,167 $ 56,144 $ 139,821 $ 230,192 $ 114,250 $390,000—$440,000 Gathering Segment Capital Expenditures 80,012 $ 54,792 $ 137,799 $ 118,166 $ 54,293 $65,000—$75,000 Utility Capital Expenditures 58,284 $ 71,970 $ 88,810 $ 94,371 $ 98,007 $90,000—$100,000 Energy Marketing, Corporate & All Other Capital Expenditures 1,121 $ 1,062 $ 772 $ 467 $ 397 Total Capital Expenditures from Continuing Operations $ 977,394 $ 717,097 $ 969,907 $ 1,000,509 $ 523,051 $725,000—$835,000
Plus (Minus) Accrued Capital Expenditures
Exploration & Production FY 2016 Accrued Capital Expenditures $ —$ —$ —$ —$ (25,215) Exploration & Production FY 2015 Accrued Capital Expenditures — — — (46,173) 46,173 Exploration & Production FY 2014 Accrued Capital Expenditures — — (80,108) 80,108 -Exploration & Production FY 2013 Accrued Capital Expenditures — (58,478) 58,478 — -Exploration & Production FY 2012 Accrued Capital Expenditures (38,861) 38,861 — — -Exploration & Production FY 2011 Accrued Capital Expenditures 103,287 — — — -Pipeline & Storage FY 2016 Accrued Capital Expenditures — — — — (18,661) Pipeline & Storage FY 2015 Accrued Capital Expenditures — — — (33,925) 33,925 Pipeline & Storage FY 2014 Accrued Capital Expenditures — — (28,122) 28,122 -Pipeline & Storage FY 2013 Accrued Capital Expenditures — (5,633) 5,633 — -Pipeline & Storage FY 2012 Accrued Capital Expenditures (12,699) 12,699 — — -Pipeline & Storage FY 2011 Accrued Capital Expenditures 16,431 — — — -Gathering FY 2016 Accrued Capital Expenditures — — — — (5,355) Gathering FY 2015 Accrued Capital Expenditures — — — (22,416) 22,416 Gathering FY 2014 Accrued Capital Expenditures — — (20,084) 20,084 -Gathering FY 2013 Accrued Capital Expenditures — (6,700) 6,700 — -Gathering FY 2012 Accrued Capital Expenditures (12,690) 12,690 — — -Gathering FY 2011 Accrued Capital Expenditures 3,079 — — — -Utility FY 2016 Accrued Capital Expenditures — — — — (11,203) Utility FY 2015 Accrued Capital Expenditures — — — (16,445) 16,445 Utility FY 2014 Accrued Capital Expenditures — — (8,315) 8,315 -Utility FY 2013 Accrued Capital Expenditures — (10,328) 10,328 — -Utility FY 2012 Accrued Capital Expenditures (3,253) 3,253 — — -Utility FY 2011 Accrued Capital Expenditures 2,319 — — — -
Total Accrued Capital Expenditures $ 57,613 $ (13,636) $ (55,490) $ 17,670 $ 58,525
Total Capital Expenditures per Statement of Cash Flows $ 1,035,007 $ 703,461 $ 914,417 $ 1,018,179 $ 581,576 $725,000—$835,000
56
Appendix
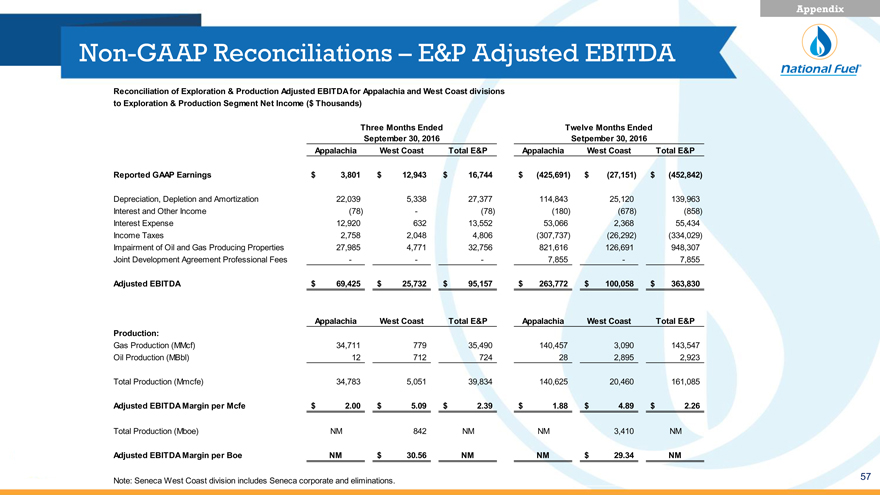
Non-GAAP Reconciliations – E&P Adjusted EBITDA
Reconciliation of Exploration & Production Adjusted EBITDA for Appalachia and West Coast divisions to Exploration & Production Segment Net Income ($ Thousands)
Three Months Ended Twelve Months Ended September 30, 2016 Setpember 30, 2016
Appalachia West Coast Total E&P Appalachia West Coast Total E&P
Reported GAAP Earnings $ 3,801 $ 12,943 $ 16,744 $ (425,691) $ (27,151) $ (452,842)
Depreciation, Depletion and Amortization 22,039 5,338 27,377 114,843 25,120 139,963 Interest and Other Income (78) — (78) (180) (678) (858) Interest Expense 12,920 632 13,552 53,066 2,368 55,434 Income Taxes 2,758 2,048 4,806 (307,737) (26,292) (334,029) Impairment of Oil and Gas Producing Properties 27,985 4,771 32,756 821,616 126,691 948,307 Joint Development Agreement Professional Fees — — — 7,855 — 7,855
Adjusted EBITDA $ 69,425 $ 25,732 $ 95,157 $ 263,772 $ 100,058 $ 363,830
Appalachia West Coast Total E&P Appalachia West Coast Total E&P Production:
Gas Production (MMcf) 34,711 779 35,490 140,457 3,090 143,547 Oil Production (MBbl) 12 712 724 28 2,895 2,923
Total Production (Mmcfe) 34,783 5,051 39,834 140,625 20,460 161,085
Adjusted EBITDA Margin per Mcfe $ 2.00 $ 5.09 $ 2.39 $ 1.88 $ 4.89 $ 2.26
Total Production (Mboe) NM 842 NM NM 3,410 NM
Adjusted EBITDA Margin per Boe NM $ 30.56 NM NM $ 29.34 NM
Note: Seneca West Coast division includes Seneca corporate and eliminations.
57
Appendix
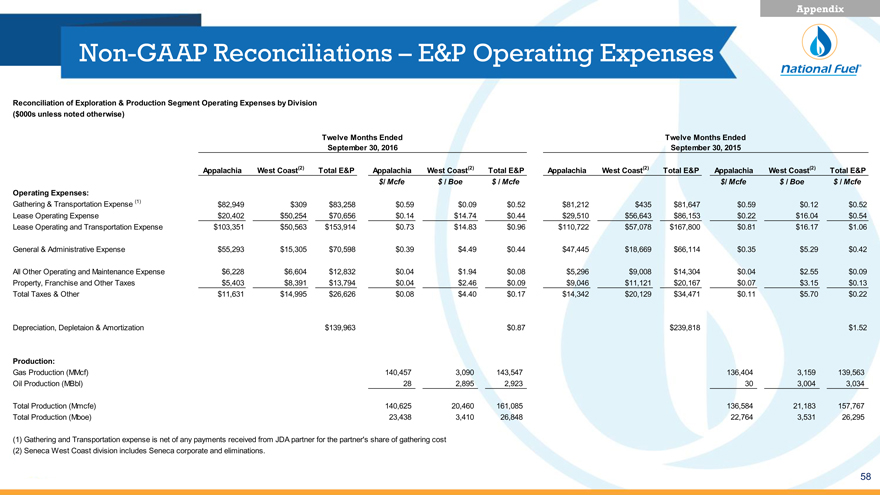
Non-GAAP Reconciliations – E&P Operating Expenses
Reconciliation of Exploration & Production Segment Operating Expenses by Division
($000s unless noted otherwise)
Twelve Months Ended Twelve Months Ended September 30, 2016 September 30, 2015
Appalachia West Coast(2) Total E&P Appalachia West Coast(2) Total E&P Appalachia West Coast(2) Total E&P Appalachia West Coast(2) Total E&P $/ Mcfe $ / Boe $ / Mcfe $/ Mcfe $ / Boe $ / Mcfe
Operating Expenses:
Gathering & Transportation Expense (1) $82,949 $309 $83,258 $0.59 $0.09 $0.52 $81,212 $435 $81,647 $0.59 $0.12 $0.52 Lease Operating Expense $20,402 $50,254 $70,656 $0.14 $14.74 $0.44 $29,510 $56,643 $86,153 $0.22 $16.04 $0.54 Lease Operating and Transportation Expense $103,351 $50,563 $153,914 $0.73 $14.83 $0.96 $110,722 $57,078 $167,800 $0.81 $16.17 $1.06
General & Administrative Expense $55,293 $15,305 $70,598 $0.39 $4.49 $0.44 $47,445 $18,669 $66,114 $0.35 $5.29 $0.42
All Other Operating and Maintenance Expense $6,228 $6,604 $12,832 $0.04 $1.94 $0.08 $5,296 $9,008 $14,304 $0.04 $2.55 $0.09 Property, Franchise and Other Taxes $5,403 $8,391 $13,794 $0.04 $2.46 $0.09 $9,046 $11,121 $20,167 $0.07 $3.15 $0.13 Total Taxes & Other $11,631 $14,995 $26,626 $0.08 $4.40 $0.17 $14,342 $20,129 $34,471 $0.11 $5.70 $0.22
Depreciation, Depletaion & Amortization $139,963 $0.87 $239,818 $1.52
Production:
Gas Production (MMcf) 140,457 3,090 143,547 136,404 3,159 139,563 Oil Production (MBbl) 28 2,895 2,923 30 3,004 3,034
Total Production (Mmcfe) 140,625 20,460 161,085 136,584 21,183 157,767 Total Production (Mboe) 23,438 3,410 26,848 22,764 3,531 26,295
(1) Gathering and Transportation expense is net of any payments received from JDA partner for the partner’s share of gathering cost (2) Seneca West Coast division includes Seneca corporate and eliminations.
58