Investor Presentation
Q1 Fiscal 2017 Update
February 2, 2017
1
Safe Harbor For Forward Looking Statements
This plans, presentation objectives, may goals, contain projections, “forward-looking estimates of statements” oil and gas as quantities, defined by strategies, the Private future Securities events Litigation or performance Reform Act and of 1995, underlying including assumptions, statements capital regarding stru rules, capital and expenditures, possible outcomes completion of litigation of construction or regulatory projects, proceedings, projections as for well pension as statements and other that post-retirement are identified benefit by the obligations, use of the words impacts “anticipates,” of the adoption “estimates,” of new accounting “expects,”
“forecasts,” uncertainties “intends,” which could “plans,” cause actual “predicts,” results or “projects,” outcomes “believes,” to differ materially “seeks,” from “will,” those “may,” expressed and in similar the forward-looking expressions. statements. Forward-looking The Company’s statements expectations, involve risks beliefs and and beliefs projections or projections are expressed will result in or good be achieved faith and or are accomplished. believed by the Company to have a reasonable basis, but there can be no assurance that management’s expectations, In forward-looking addition to other statements: factors, the Delays following or changes are important in costs or factors plans that, with in respect the view to Company of the Company, projects could or related cause projects actual results of other to companies, differ materially including from difficulties those discussed or delays in the in obtaining initiatives necessary and proceedings, governmental including approvals, those involving permits or rate orders cases or (which in obtaining address, the among cooperation other of things, interconnecting target rates facility of return, operators; rate design governmental/regulatory and retained natural actions, gas), Company environmental/safety is subject, including requirements, those affiliate involving relationships, derivatives, industry taxes, safety, structure, employment, and franchise climate renewal; change, changes other in environmental laws, regulations matters, or judicial real property, interpretations and exploration to which and the production financial and activities economic such conditions, as hydraulic including fracturing; the availability impairments of under credit, the and SEC’s occurrences full cost ceiling affecting test the for Company’s natural gas ability and oil to reserves; obtain financing changes on in acceptable the price of terms natural for gas working or oil; capital, conditions; capital factors expenditures affecting the and Company’s other investments, ability to successfully including any identify, downgrades drill for in and the produce Company’s economically credit ratings viable and natural changes gas in and interest oil reserves, rates and including other capital among market others geology, gathering, lease processing availability, and transportation title disputes, capacity, weather conditions, the need to shortages, obtain governmental delays or unavailability approvals and of equipment permits, and and compliance services required with environmental in drilling operations, laws and regulations; insufficient between increasing similar health quantities care costs of and natural the resulting gas or oil effect at different on health geographic insurance locations, premiums and and the on the effect obligation of such changes to provide on other commodity post-retirement production, benefits; revenues changes and demand in price differentials for pipeline hydrocarbon transportation mix capacity or delivery to or from date; such the locations; cost and effects other changes of legal in and price administrative differentials claims between against similar the quantities Company of or natural activist gas shareholder or oil having campaigns different to quality, effect changes heating value, at the demographic Company; uncertainty patterns of and oil weather and gas conditions; reserve estimates; changes significant in the availability, differences price between or accounting the Company’s treatment projected of derivative and actual financial production instruments; levels changes for natural in gas economic or oil; conditions, changes in creditworthiness including global, or national performance or regional of the Company’s recessions, key and suppliers, their effect customers on the demand and counterparties; for, and customers’ economic ability disruptions to pay or for, uninsured the Company’s losses resulting products from and major services; accidents, the capital fires, severe expenditures weather, and natural operating disasters, expenses; terrorist changes activities, in laws, acts actuarial of war, cyber assumptions, attacks the or pest interest infestation; rate environment significant and differences the return between on plan/trust the Company’s assets related projected to the Company’s and actual pension the ability and to other obtain post-retirement insurance. benefits, which can affect future funding obligations and costs and plan liabilities; or increasing costs of insurance, changes in coverage and Forward-looking engineering data, statements can be estimated include estimates with reasonable of oil and certainty gas quantities. to be economically Proved oil and producible gas reserves under are existing those quantities economic of oil conditions, and gas which, operating by analysis methods of and geoscience government and than regulations. estimates Other of proved estimates reserves. of oil and Accordingly, gas quantities, estimates including other estimates than proved of probable reserves reserves, are subject possible to substantially reserves, greater and resource risk of potential, being actually are by realized. their nature Investors more are speculative urged to consider closely the disclosure in our Form10-K available at www.nationalfuelgas.com. You can also obtain this form on the SEC’s website at www.sec.gov.
For “Risk a discussion Factors” in of the the Company’s risks set forth Form above10-K and for other the fiscal factors year that ended could cause September actual 30, results 2016 to and differ the materially Forms10-Q from for results the quarter referred ended to in the December forward-looking 31, 2016. statements, The Company see disclaims any obligation to update any forward-looking statements to reflect events or circumstances after the date thereof or to reflect the occurrence of unanticipated events.
2
Quality Assets—Exceptional Location—Unique Integration
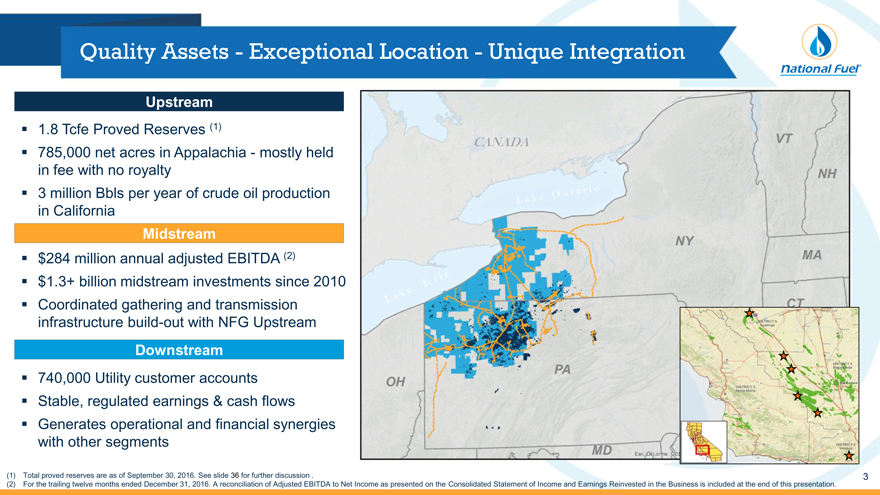
Upstream
1.8 Tcfe Proved Reserves (1)
785,000 net acres in Appalachia—mostly held in fee with no royalty
3 million Bbls per year of crude oil production in California
Midstream
$284 million annual adjusted EBITDA (2)
$1.3+ billion midstream investments since 2010
Coordinated gathering and transmission infrastructurebuild-out with NFG Upstream
Downstream
740,000 Utility customer accounts
Stable, regulated earnings & cash flows
Generates operational and financial synergies with other segments
Total proved reserves are as of September 30, 2016. See slide 36 for further discussion .
For the trailing twelve months ended December 31, 2016. A reconciliation of Adjusted EBITDA to Net Income as presented on the Consolidated Statement of Income and Earnings Reinvested in the Business is included at the end of this presentation.
3
The National Fuel Value Proposition
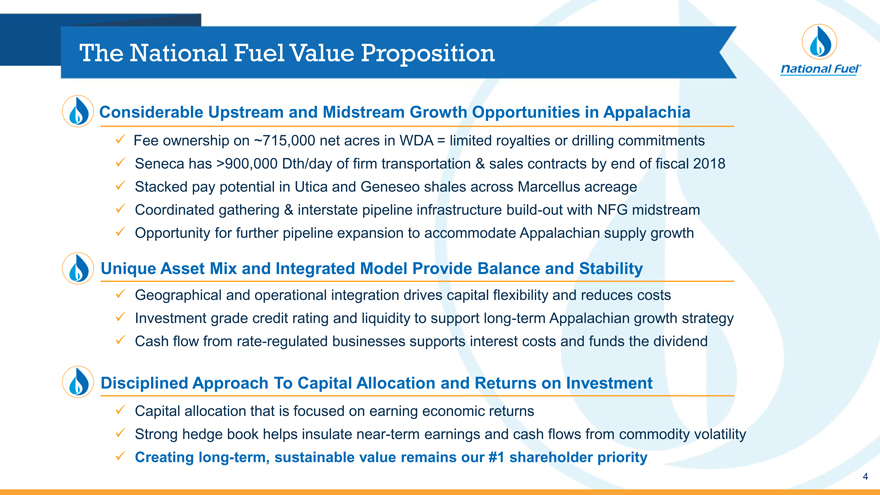
Considerable Upstream and Midstream Growth Opportunities in Appalachia
Fee ownership on ~715,000 net acres in WDA = limited royalties or drilling commitments Seneca has >900,000 Dth/day of firm transportation & sales contracts by end of fiscal 2018 Stacked pay potential in Utica and Geneseo shales across Marcellus acreage Coordinated gathering & interstate pipeline infrastructurebuild-out with NFG midstream Opportunity for further pipeline expansion to accommodate Appalachian supply growth
Unique Asset Mix and Integrated Model Provide Balance and Stability
Geographical and operational integration drives capital flexibility and reduces costs
Investment grade credit rating and liquidity to support long-term Appalachian growth strategy ? Cash flow from rate-regulated businesses supports interest costs and funds the dividend
Disciplined Approach To Capital Allocation and Returns on Investment
Capital allocation that is focused on earning economic returns
Strong hedge book helps insulate near-term earnings and cash flows from commodity volatility
Creating long-term, sustainable value remains our #1 shareholder priority
4
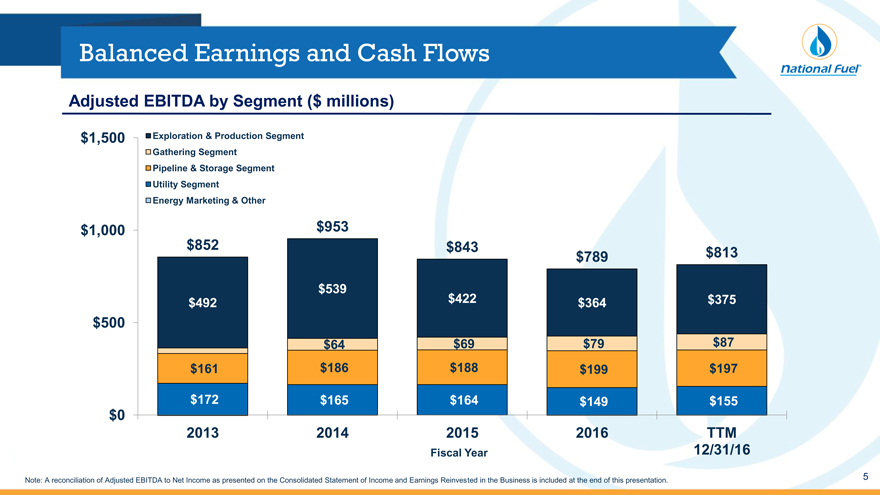
Balanced Earnings and Cash Flows
Adjusted EBITDA by Segment ($ millions)
$1,500 Exploration & Production Segment
Gathering Segment
Pipeline & Storage Segment
Utility Segment
Energy Marketing & Other
$1,000 $953
$852 $843$789$813
$539
$492 $422$364$375
$500
$64$69$79$87
$161 $186$188$199$197
$172 $165$164$149$155
$0
2013 201420152016TTM
Fiscal Year12/31/16
Note: A reconciliation of Adjusted EBITDA to Net Income as presented on the Consolidated Statement of Income and Earnings Reinvested in the Business is included at the end of this presentation.
5
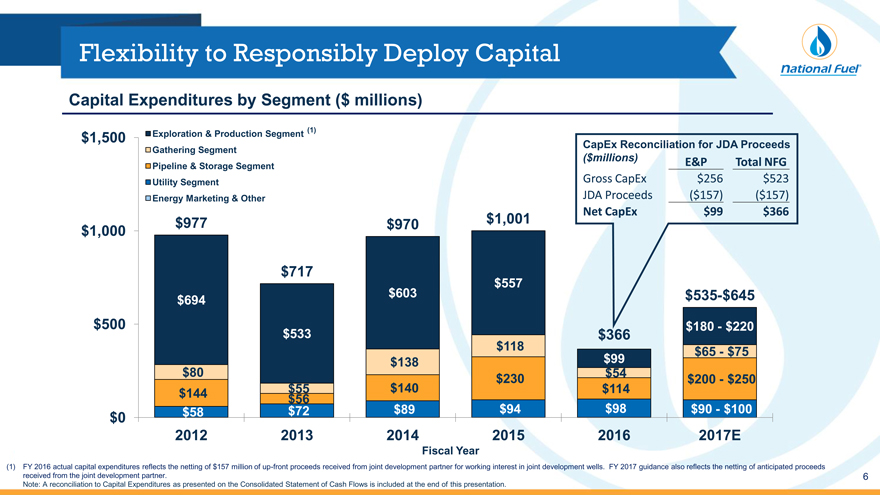
Flexibility to Responsibly Deploy Capital
Capital Expenditures by Segment ($ millions)
$1,500 Exploration & Production Segment (1) CapEx Reconciliation for JDA Proceeds
Gathering Segment
($millions) E&P Total NFG
Pipeline & Storage Segment
Utility Segment Gross CapEx $256 $523
Energy Marketing & Other JDA Proceeds($157)($157)
Net CapEx $99 $366
$1,000 $977 $970 $1,001
$717
$557
$694 $603 $535-$645
$500 $180—$220
$533 $366
$118 $65—$75
$138 $99
$80 $54
$230 $200—$250
$144 $55 $140 $114
$56
$0 $58 $72 $89 $94 $98 $90—$100
2012 2013 2014 2015 2016 2017E
Fiscal Year
FY 2016 actual capital expenditures reflects the netting of $157 million of up-front proceeds received from joint development partner for working interest in joint development wells. FY 2017 guidance also reflects the netting of anticipated proceeds received from the joint development partner.
Note: A reconciliation to Capital Expenditures as presented on the Consolidated Statement of Cash Flows is included at the end of this presentation.
6
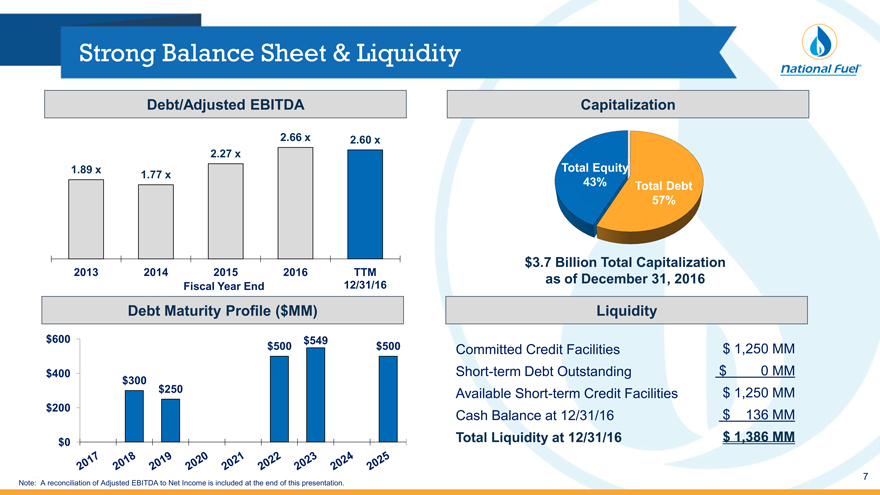
Strong Balance Sheet & Liquidity
Debt/Adjusted EBITDA Capitalization
2.66 x 2.60 x
2.27 x
1.89 x Total Equity
1.77 x
43% Total Debt
57%
$3.7 Billion Total Capitalization
2013 2014 2015 2016 TTM as of December 31, 2016
Fiscal Year End 12/31/16
Debt Maturity Profile ($MM) Liquidity
$600 $549
$500 $500 Committed Credit Facilities $ 1,250 MM
$400 Short-term Debt Outstanding $ 0 MM
$300
$250 Available Short-term Credit Facilities $ 1,250 MM
$200 Cash Balance at 12/31/16 $ 136 MM
$0 Total Liquidity at 12/31/16 $ 1,386 MM
Note: A reconciliation of Adjusted EBITDA to Net Income is included at the end of this presentation.
7
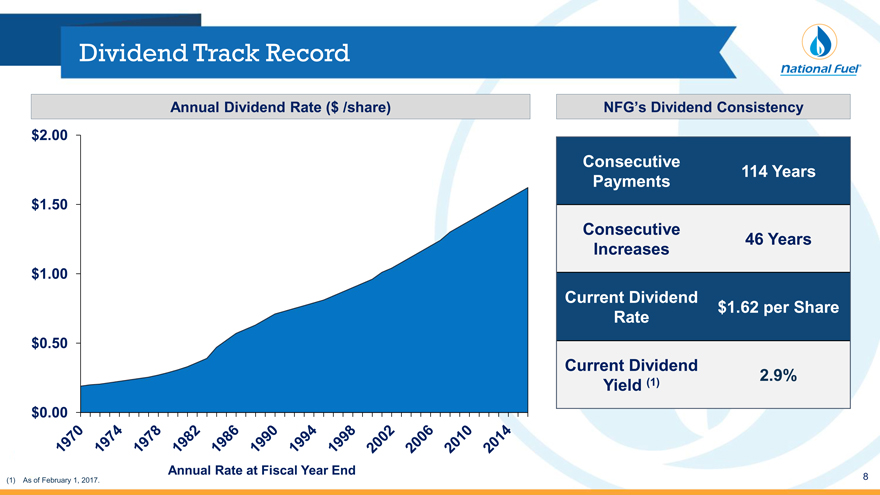
Dividend Track Record
Annual Dividend Rate ($ /share)
$ 2.00
$ 1.50
$ 1.00
$ 0.50
$ 0.00
NFG’s Dividend Consistency
Consecutive
Payments 114 Years
Consecutive 46 Years
Increases
Current Dividend $1.62 per Share
Rate
Current Dividend
Yield (1) 2.9%
Annual Rate at Fiscal Year End
(1) As of February 1, 2017.
8
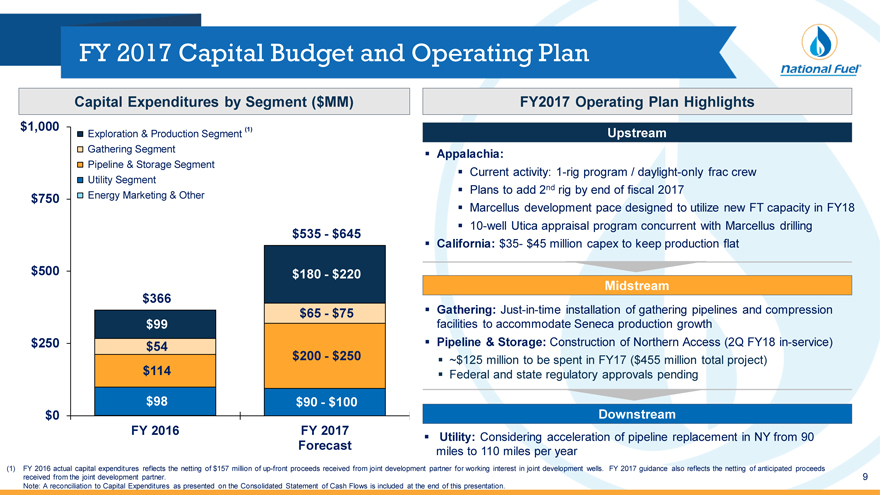
FY 2017 Capital Budget and Operating Plan
Capital Expenditures by Segment ($MM)FY2017 Operating Plan Highlight
$1,000 Exploration & Production Segment (1)Upstream
Gathering SegmentAppalachia:
Pipeline & Storage Segment Current activity:1-rig program / daylight-only frac crew
Utility Segment
$750 Energy Marketing & Other Plans to add 2nd rig by end of fiscal 2017
Marcellus development pace designed to utilize new FT capacity in FY18
$535 - $64510-well Utica appraisal program concurrent with Marcellus drilling
California:$35- $45 million capex to keep production flat
$500 $180 - $220
Midstream
$366
$65 - $75 Gathering:Just-in-time installation of gathering pipelines and compression
$99facilities to accommodate Seneca production growth
$250 $54 Pipeline & Storage: Construction of Northern Access (2Q FY18in-service)
$200 - $250 ~$125 million to be spent in FY17 ($455 million total project)
$114 Federal and state regulatory approvals pending
$98$90—$100
$0 Downstream
FY 2016FY 2017 Utility: Considering acceleration of pipeline replacement in NY from 90
Forecastmiles to 110 miles per year
(1) FY 2016 actual capital expenditures reflects the netting of $157 million ofup-front proceeds received from joint development partner for working interest in joint development wells. FY 2017 guidance also reflects the netting of anticipated proceeds
received from the joint development partner. 9
Note: A reconciliation to Capital Expenditures as presented on the Consolidated Statement of Cash Flows is included at the end of this presentation.
Appalachia Overview
Exploration & Production ~ Gathering ~ Pipeline & Storage
10
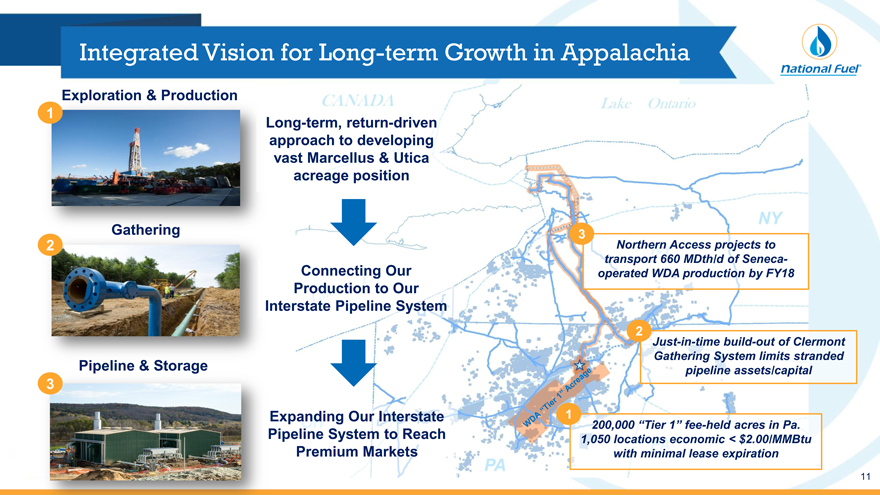
Integrated Vision for Long-term Growth in Appalachia
Exploration & Production
1 Long-term, return-driven
approach to developing
vast Marcellus & Utica
acreage position
3
2 Northern Access projects to
transport 660 MDth/d of Seneca-
Connecting Our operated WDA production by FY18
Production to Our
Interstate Pipeline System
2 Just-in-time build-out of Clermont
Gathering System limits stranded
pipeline assets/capital
3
Expanding Our Interstate 1 200,000 “Tier 1” fee-held acres in Pa.
Pipeline System to Reach 1,050 locations economic < $2.00/MMBtu
Premium Markets with minimal lease expiration
11
Upstream
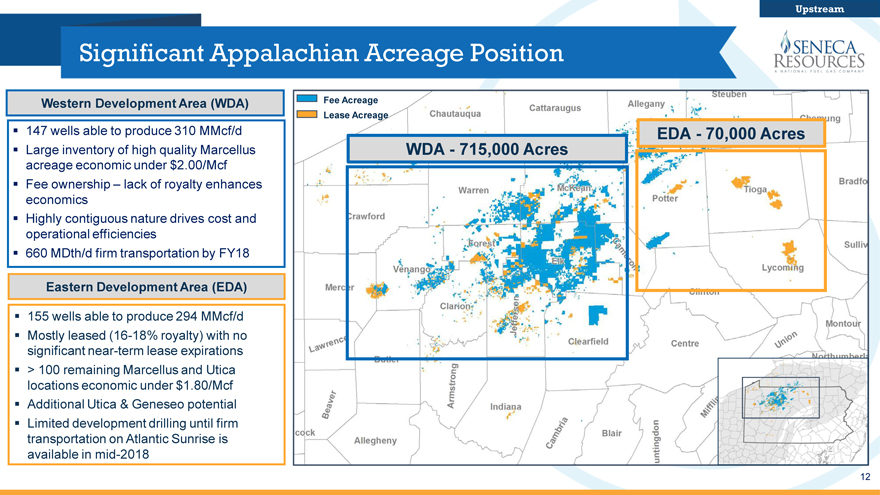
Significant Appalachian Acreage Position
Western Development Area (WDA) Fee Acreage
Lease Acreage
147 wells able to produce 310 MMcf/d EDA—70,000 Acres
Large inventory of high quality Marcellus WDA—715,000 Acres
acreage economic under $2.00/Mcf
Fee ownership – lack of royalty enhances
economics
Highly contiguous nature drives cost and
operational efficiencies
660 MDth/d firm transportation by FY18
Eastern Development Area (EDA)
155 wells able to produce 294 MMcf/d
Mostly leased(16-18% royalty) with no
significant near-term lease expirations
> 100 remaining Marcellus and Utica
locations economic under $1.80/Mcf
Additional Utica & Geneseo potential
Limited development drilling until firm
transportation on Atlantic Sunrise is
available inmid-2018
12
Marcellus Shale: Western Development Area
Upstream
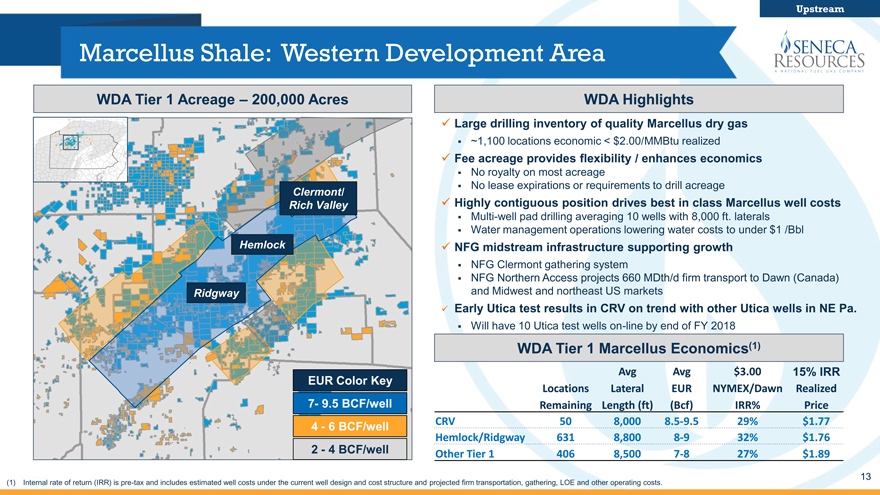
WDA Tier 1 Acreage – 200,000 Acres
Clermont/
Rich Valley
Hemlock
Ridgway
EUR Color Key
7- 9.5 BCF/well
4—6 BCF/well
2—4 BCF/well
WDA Highlights
Large drilling inventory of quality Marcellus dry gas
~1,100 locations economic < $2.00/MMBtu realized
Fee acreage provides flexibility / enhances economics
No royalty on most acreage
No lease expirations or requirements to drill acreage
Highly contiguous position drives best in class Marcellus well costs
Multi-well pad drilling averaging 10 wells with 8,000 ft. laterals
Water management operations lowering water costs to under $1 /Bbl
NFG midstream infrastructure supporting growth
NFG Clermont gathering system
NFG Northern Access projects 660 MDth/d firm transport to Dawn (Canada) and Midwest and northeast US markets
Early Utica test results in CRV on trend with other Utica wells in NE Pa.
Will have 10 Utica test wells on-line by end of FY 2018
WDA Tier 1 Marcellus Economics(1)
Avg Avg $3.00 15% IRR
Locations Lateral EUR NYMEX/Dawn Realized
Remaining Length (ft)(Bcf) IRR% Price
CRV 50 8,000 8.5-9.5 29% $ 1.77
Hemlock/Ridgway 631 8,800 8-9 32% $ 1.76
Other Tier 1 406 8,500 7-8 27% $ 1.89
(1) Internal rate of return (IRR) is pre-tax and includes estimated well costs under the current well design and cost structure and projected firm transportation, gathering, LOE and other operating costs.
13
WDA Clermont/Rich Valley Development
Upstream
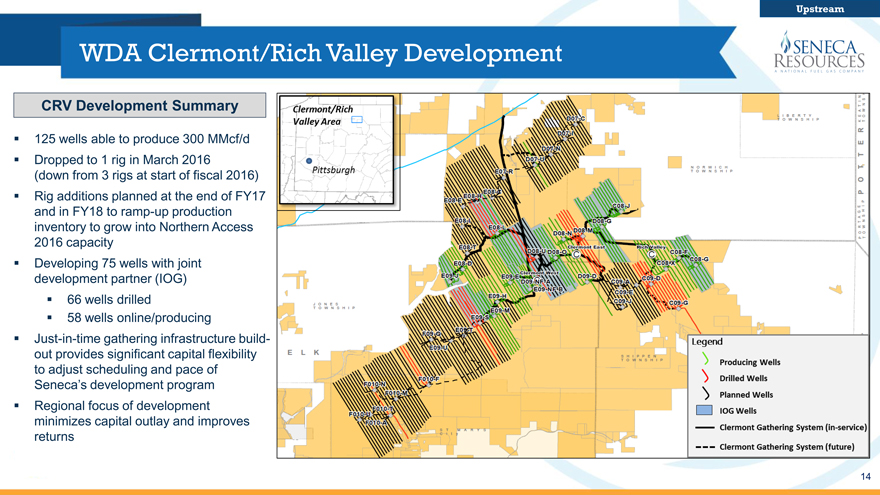
CRV Development Summary
125 wells able to produce 300 MMcf/d Dropped to 1 rig in March 2016 (down from 3 rigs at start of fiscal 2016) Rig additions planned at the end of FY17 and in FY18 to ramp-up production inventory to grow into Northern Access 2016 capacity Developing 75 wells with joint development partner (IOG) 66 wells drilled 58 wells online/producing Just-in-time gathering infrastructure build-out provides significant capital flexibility to adjust scheduling and pace of
Seneca’s development program
Regional focus of development minimizes capital outlay and improves returns
14
Upstream
Marcellus Shale: Eastern Development Area
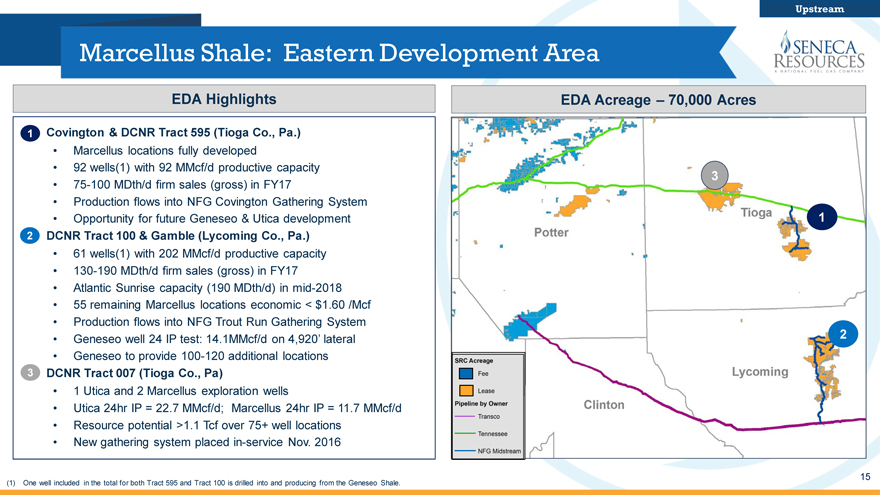
EDA Highlights EDA Acreage – 70,000 Acres
1 Covington & DCNR Tract 595 (Tioga Co., Pa.)
Marcellus locations fully developed
92 wells(1) with 92 MMcf/d productive capacity
3
75-100 MDth/d firm sales (gross) in FY17
Production flows into NFG Covington Gathering System
Opportunity for future Geneseo & Utica development 1
2 DCNR Tract 100 & Gamble (Lycoming Co., Pa.)
61 wells(1) with 202 MMcf/d productive capacity
130-190 MDth/d firm sales (gross) in FY17
Atlantic Sunrise capacity (190 MDth/d) inmid-2018
55 remaining Marcellus locations economic < $1.60 /Mcf
Production flows into NFG Trout Run Gathering System 2
Geneseo well 24 IP test: 14.1MMcf/d on 4,920’ lateral
Geneseo to provide100-120 additional locations
3 DCNR Tract 007 (Tioga Co., Pa)
1 Utica and 2 Marcellus exploration wells
Utica 24hr IP = 22.7 MMcf/d; Marcellus 24hr IP = 11.7 MMcf/d
Resource potential >1.1 Tcf over 75+ well locations
New gathering system placedin-service Nov. 2016
15
(1) One well included in the total for both Tract 595 and Tract 100 is drilled into and producing from the Geneseo Shale.
Best in Class Marcellus Well Costs
Upstream
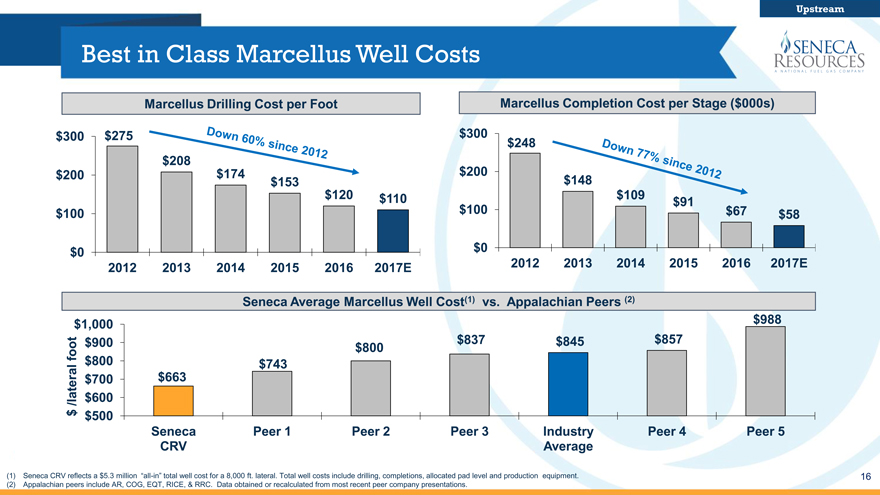
Marcellus Drilling Cost per Foot Marcellus Completion Cost per Stage ($000s)
$300 $275 $300 $248
$208
$200 $174 $200
$153 $148
$120 $110 $109 $91
$100 $100 $67 $58
$0 $0
2012 2013 2014 2015 2016 2017E 2012 2013 2014 2015 2016 2017E
Seneca Average Marcellus Well Cost(1) vs. Appalachian Peers (2)
$1,000 $988
foot $900 $800 $837 $845 $857
$800 $743
$700 $ 663
/lateral $600
$ $500
Seneca Peer 1 Peer 2 Peer 3 Industry Peer 4 Peer 5
CRV Average
Seneca CRV reflects a $5.3 million “all-in” total well cost for a 8,000 ft. lateral. Total well costs include drilling, completions, allocated pad level and production equipment.
Appalachian peers include AR, COG, EQT, RICE, & RRC. Data obtained or recalculated from most recent peer company presentations.
16
Utica Shale Opportunities
Upstream
Pennsylvania Utica Activity
JKLM Shell
Seneca
EDA
Seneca
WDA
Hilcorp
CNX SRC Producer
CHK SRC Planned
SRC Vertical
Permitted
TD’d
Completed
Production
RRC
High Pressure Zone
EQT
Ordovician Outcrop
CNX
50 MILES
Seneca’s Utica Opportunities
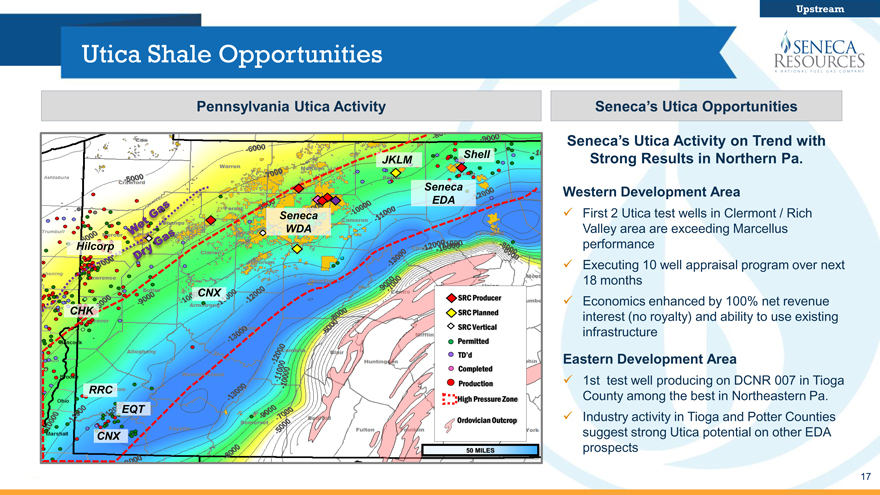
Seneca’s Utica Activity on Trend with
Strong Results in Northern Pa.
Western Development Area
First 2 Utica test wells in Clermont / Rich
Valley area are exceeding Marcellus
performance
Executing 10 well appraisal program over next
18 months
Economics enhanced by 100% net revenue
interest (no royalty) and ability to use existing
infrastructure
Eastern Development Area
1st test well producing on DCNR 007 in Tioga
County among the best in Northeastern Pa.
Industry activity in Tioga and Potter Counties
suggest strong Utica potential on other EDA
prospects
17
Upstream
WDA Utica Update
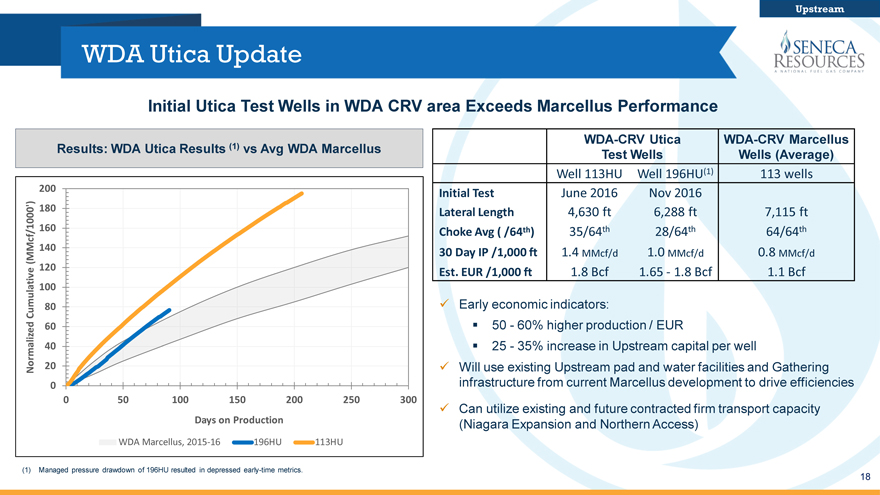
Initial Utica Test Wells in WDA CRV area Exceeds Marcellus Performance
WDA-CRVUticaWDA-CRV Marcellus
Results: WDA Utica Results (1) vs Avg WDA Marcellus Test WellsWells (Average)
Well 113HUWell 196HU(1)113 wells
200 Initial TestJune 2016Nov 2016
180 Lateral Length4,630 ft6,288 ft7,115 ft
160 Choke Avg ( /64th)35/64th28/64th64/64th
(MMcf/1000’) 140 30 Day IP /1,000 ft1.4 MMcf/d1.0 MMcf/d0.8 MMcf/d
120 Est. EUR /1,000 ft1.8 Bcf1.65—1.8 Bcf1.1 Bcf
100
Cumulative 80 ?Early economic indicators:
60 50—60% higher production / EUR
40 25—35% increase in Upstream capital per well
Normalized 20 ?Will use existing Upstream pad and water facilities and Gathering
0 infrastructure from current Marcellus development to drive efficiencies
0 50100150200250300
?Can utilize existing and future contracted firm transport capacity
Days on Production(Niagara Expansion and Northern Access)
WDA Marcellus,2015-16196HU113HU
(1) Managed pressure drawdown of 196HU resulted in depressed early-time metrics.
18
WDA Utica Appraisal Program
Upstream
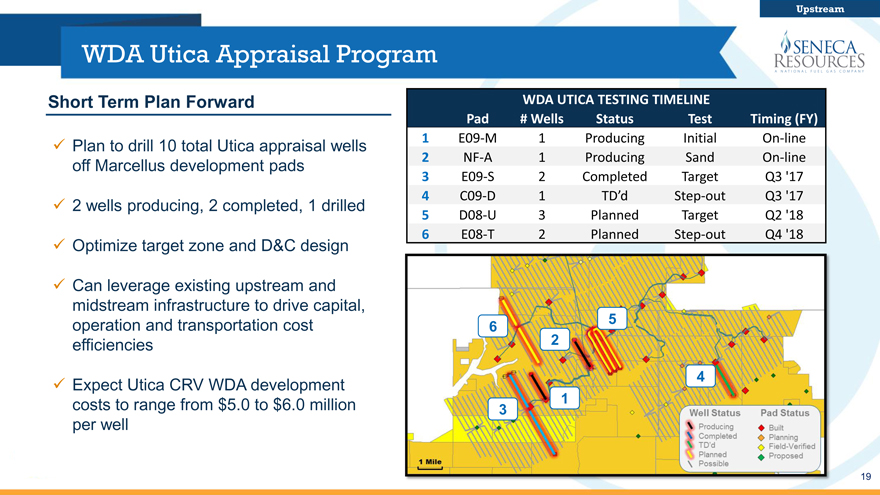
Short Term Plan Forward
Plan to drill 10 total Utica appraisal wells off Marcellus development pads
2 wells producing, 2 completed, 1 drilled
Optimize target zone and D&C design
Can leverage existing upstream and midstream infrastructure to drive capital, operation and transportation cost efficiencies
Expect Utica CRV WDA development costs to range from $5.0 to $6.0 million per well
WDA UTICA TESTING TIMELINE
Pad # Wells Status Test Timing (FY)
1 E09-M 1 Producing Initial On-line
2 NF-A 1 Producing Sand On-line
3 E09-S 2 Completed Target Q3 ‘17
4 C09-D 1 TD’d Step-out Q3 ‘17
5 D08-U 3 Planned Target Q2 ‘18
6 E08-T 2 Planned Step-out Q4 ‘18
6 5
2
4
1
3
19
EDA Utica Update
Upstream
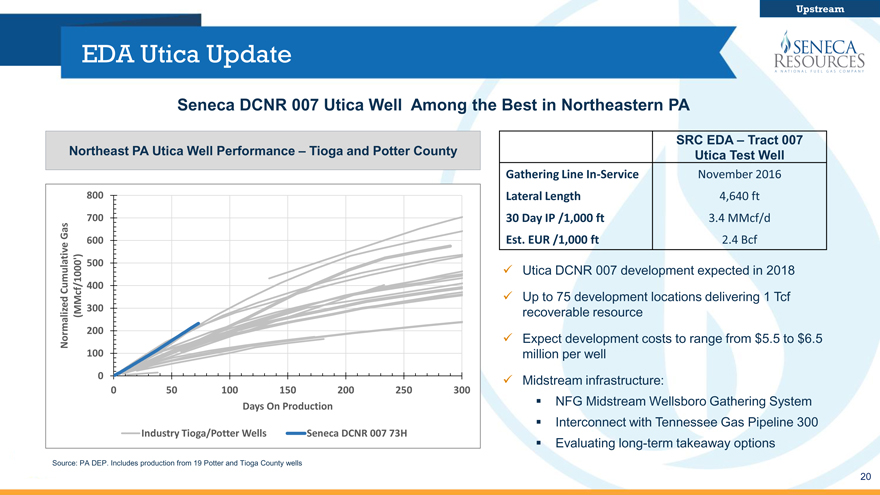
Seneca DCNR 007 Utica Well Among the Best in Northeastern PA
Northeast PA Utica Well Performance – Tioga and Potter County
800
700
Gas 600
500
Cumulative 400
(MMcf/1000’) 300
Normalized 200
100
0
0 50 100 150 200 250 300
Days On Production
Industry Tioga/Potter Wells Seneca DCNR 007 73H
SRC EDA – Tract 007
Utica Test Well
Gathering Line In-Service November 2016
Lateral Length 4,640 ft
30 Day IP /1,000 ft 3.4 MMcf/d
Est. EUR /1,000 ft 2.4 Bcf
Utica DCNR 007 development expected in 2018
Up to 75 development locations delivering 1 Tcf
recoverable resource
Expect development costs to range from $5.5 to $6.5
million per well
Midstream infrastructure:
NFG Midstream Wellsboro Gathering System
Interconnect with Tennessee Gas Pipeline 300
Evaluating long-term takeaway options
Source: PA DEP. Includes production from 19 Potter and Tioga County wells
20
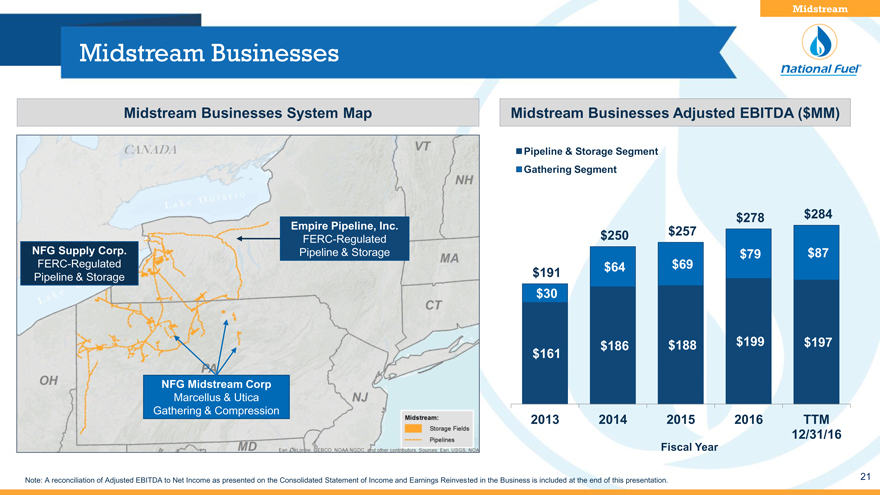
Midstream Businesses
Midstream
Midstream Businesses System Map
Empire Pipeline, Inc.
FERC-Regulated
NFG Supply Corp. Pipeline & Storage
FERC-Regulated
Pipeline & Storage
NFG Midstream Corp
Marcellus & Utica
Gathering & Compression
Midstream Businesses Adjusted EBITDA ($MM)
Pipeline & Storage Segment
Gathering Segment
$278 $284
$250 $257
$79 $87
$191 $64 $69
$30
$161 $186 $188 $199 $197
2013 2014 2015 2016 TTM
12/31/16
Fiscal Year
Note: A reconciliation of Adjusted EBITDA to Net Income as presented on the Consolidated Statement of Income and Earnings Reinvested in the Business is included at the end of this presentation.
21
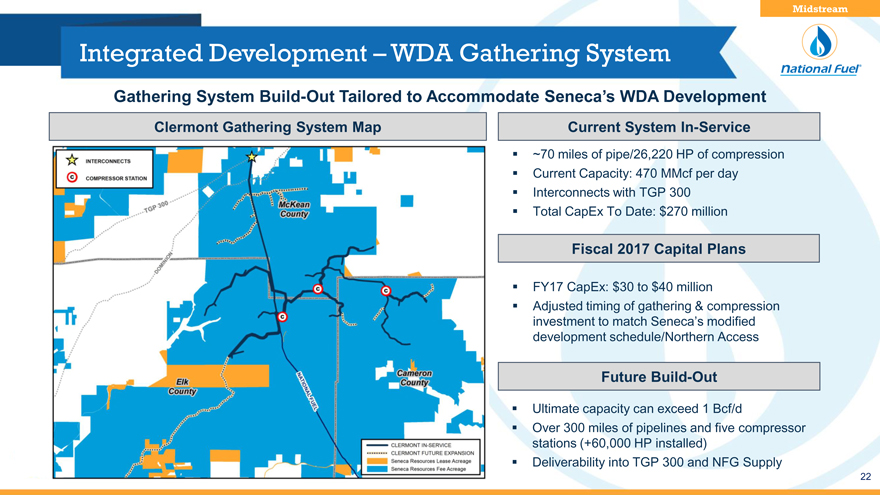
Integrated Development – WDA Gathering System
Midstream
Gathering System Build-Out Tailored to Accommodate Seneca’s WDA Developme
Clermont Gathering System Map
Current System In-Service
~70 miles of pipe/26,220 HP of compression Current Capacity: 470 MMcf per day Interconnects with TGP 300 Total CapEx To Date: $270 million
Fiscal 2017 Capital Plans
FY17 CapEx: $30 to $40 million
Adjusted timing of gathering & compression investment to match Seneca’s modified development schedule/Northern Access
Future Build-Out
Ultimate capacity can exceed 1 Bcf/d
Over 300 miles of pipelines and five compressor stations (+60,000 HP installed) Deliverability into TGP 300 and NFG Supply
22
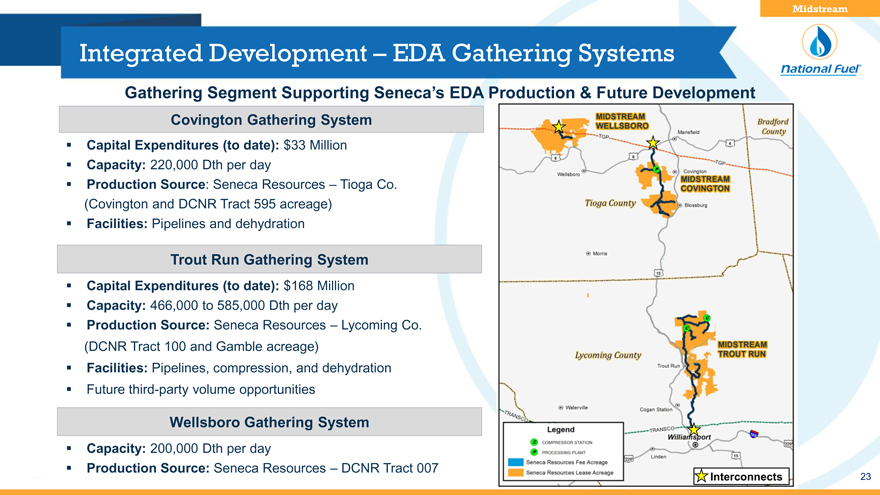
Integrated Development – EDA Gathering Systems
Midstream
Gathering Segment Supporting Seneca’s EDA Production & Future Development
Covington Gathering System
Capital Expenditures (to date): $33 Million
Capacity: 220,000 Dth per day
Production Source: Seneca Resources – Tioga Co. (Covington and DCNR Tract 595 acreage) Facilities: Pipelines and dehydration
Trout Run Gathering System
Capital Expenditures (to date): $168 Million
Capacity: 466,000 to 585,000 Dth per day
Production Source: Seneca Resources – Lycoming Co. (DCNR Tract 100 and Gamble acreage) Facilities: Pipelines, compression, and dehydration Future third-party volume opportunities
Wellsboro Gathering System
Capacity: 200,000 Dth per day
Production Source: Seneca Resources – DCNR Tract 007
23
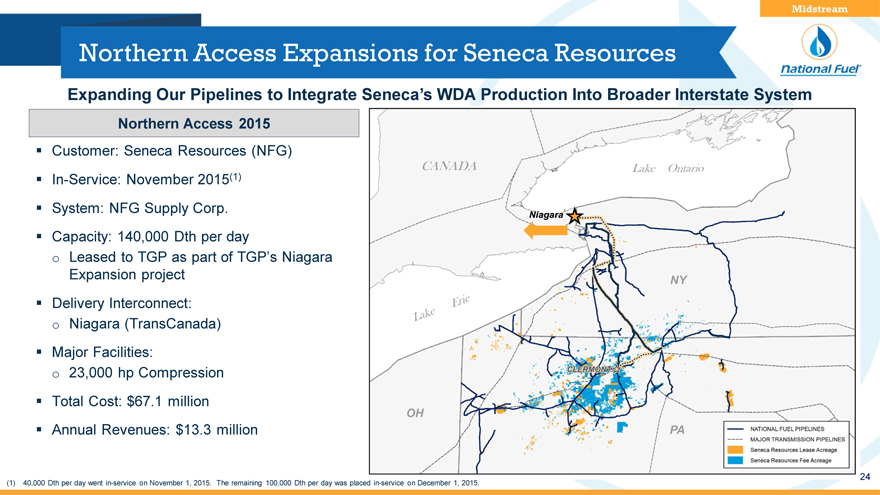
Northern Access Expansions for Seneca Resources
Midstream
Expanding Our Pipelines to Integrate Seneca’s WDA Production Into Broader Interstate System
Northern Access 2015
Customer: Seneca Resources (NFG) In-Service: November 2015(1) System: NFG Supply Corp.
Capacity: 140,000 Dth per day o Leased to TGP as part of TGP’s Niagara
Expansion project Delivery Interconnect: Niagara (TransCanada) Major Facilities: 23,000 hp Compression Total Cost: $67.1 million Annual Revenues: $13.3 million
Niagara
(1) 40,000 Dth per day went in-service on November 1, 2015. The remaining 100,000 Dth per day was placed in-service on December 1, 2015.
24
Northern Access Expansions for Seneca Resources
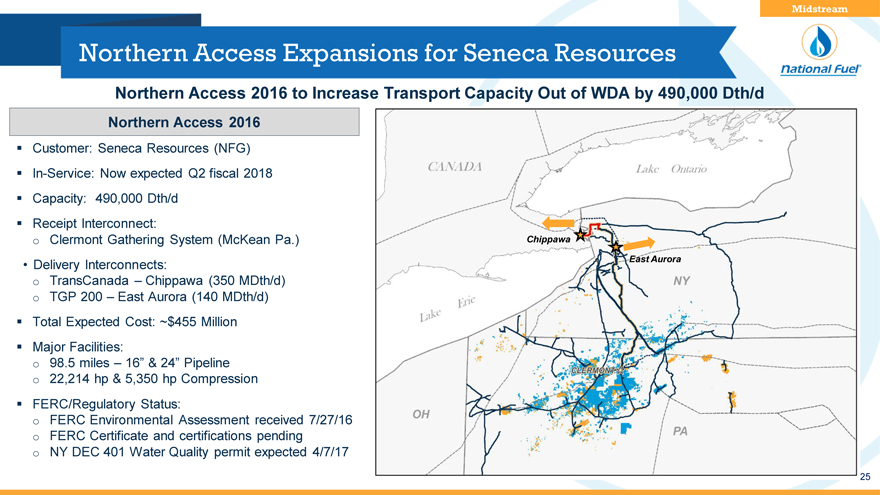
Northern Access 2016 to Increase Transport Capacity Out of WDA by 490,000 Dth
Northern Access 2016
Customer: Seneca Resources(NFG) In-Service: Now expected Q2 fiscal 2018 Capacity: 490,000 Dth/d Receipt Interconnect: o Clermont Gathering System (McKean Pa.) Chippawa
Delivery Interconnects: East Aurora o TransCanada – Chippawa (350 MDth/d) o TGP 200 – East Aurora (140 MDth/d) Total Expected Cost: ~$455 Million Major Facilities: o 98.5 miles – 16” & 24” Pipeline o 22,214 hp & 5,350 hp Compression FERC/Regulatory Status: o FERC Environmental Assessment received 7/27/16 o FERC Certificate and certifications pending o NY DEC 401 Water Quality permit expected 4/7/17
25
Recent 3rd Party Expansions Highly Successful
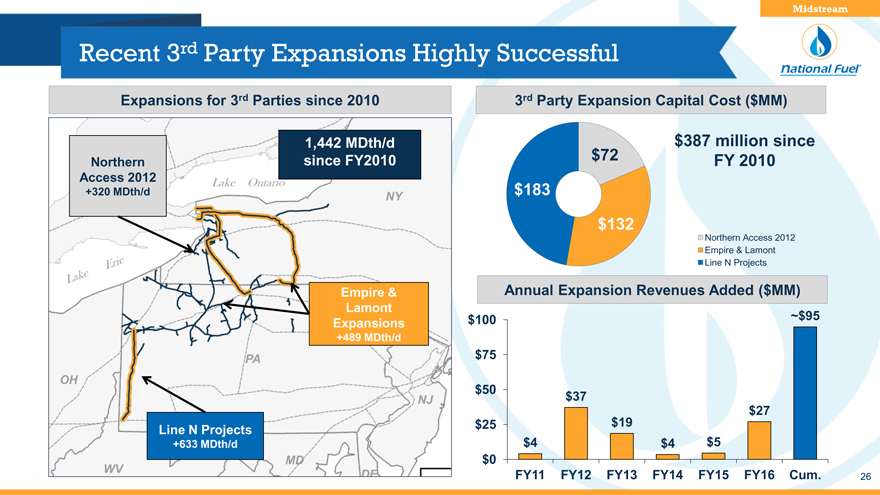
Expansions for 3rd Parties since 2010
1,442 MDth/d
Northern since FY2010
Access 2012
+320 MDth/d
Empire &
Lamont
Expansions
+489 MDth/d
Line N Projects
+633 MDth/d
Midstream
3rd Party Expansion Capital Cost ($MM)
$387 million since
$72 FY 2010
$183
$132
Northern Access 2012
Empire & Lamont
Line N Projects
Annual Expansion Revenues Added ($MM)
$100 ~$95
$75
$50 $37
$27
$25 $19
$4 $4 $5
$0
FY11 FY12 FY13 FY14 FY15 FY16 Cum.
26
Empire System Expansion
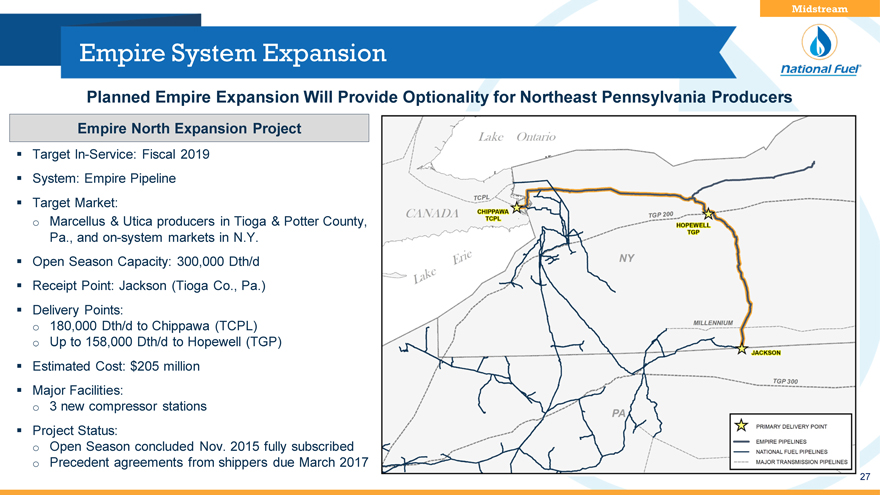
Planned Empire Expansion Will Provide Optionality for Northeast Pennsylvania Prod
Empire North Expansion Project
TargetIn-Service: Fiscal 2019 System: Empire Pipeline Target Market: o Marcellus & Utica producers in Tioga & Potter County, Pa., andon-system markets in N.Y.
Open Season Capacity: 300,000 Dth/d Receipt Point: Jackson (Tioga Co., Pa.) Delivery Points: o 180,000 Dth/d to Chippawa (TCPL) o Up to 158,000 Dth/d to Hopewell (TGP) Estimated Cost: $205 million Major Facilities: o 3 new compressor stations Project Status: o Open Season concluded Nov. 2015 fully subscribed o Precedent agreements from shippers due March 2017
27
2015 Pipeline Expansion Projects In-Service
Midstream
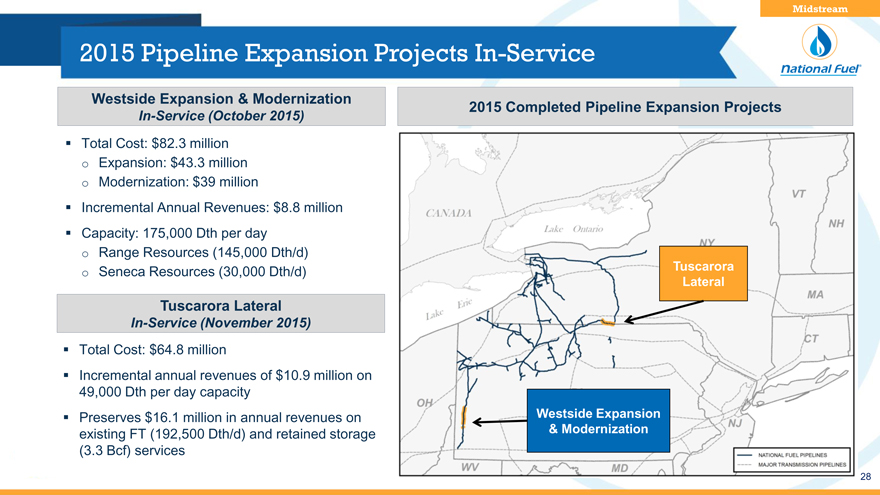
Westside Expansion & Modernization
In-Service (October 2015)
Total Cost: $82.3 million
Expansion: $43.3 million
Modernization: $39 million
Incremental Annual Revenues: $8.8 million
Capacity: 175,000 Dth per day
Range Resources (145,000 Dth/d)
Seneca Resources (30,000 Dth/d)
Tuscarora Lateral
In-Service (November 2015)
Total Cost: $64.8 million
Incremental annual revenues of $10.9 million on
49,000 Dth per day capacity
Preserves $16.1 million in annual revenues on existing FT (192,500 Dth/d) and retained storage (3.3 Bcf) services
2015 Completed Pipeline Expansion Project
Tuscarora
Lateral
Westside Expansion
& Modernization
28
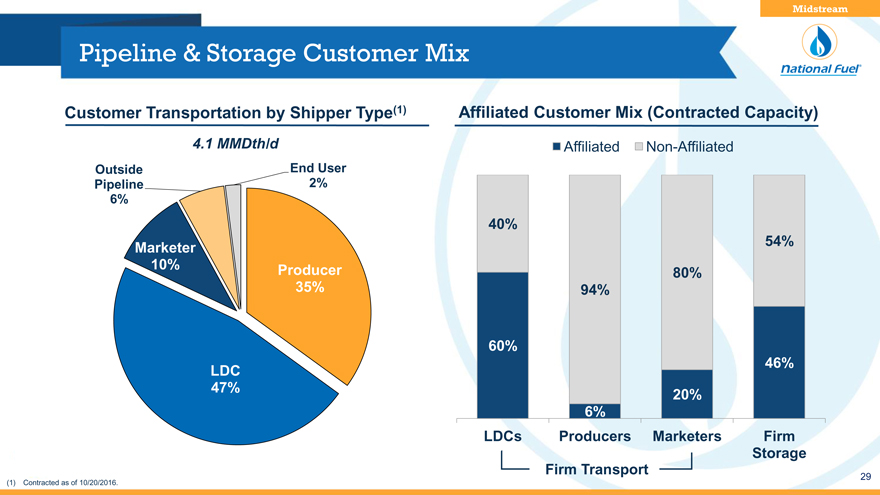
Pipeline & Storage Customer Mix
Midstream
Customer Transportation by Shipper Type(1)
4.1 MMDth/d
Outside
End User
Pipeline
2%
6%
Marketer
10%
Producer
35%
LDC
47%
Affiliated Customer Mix (Contracted Capacity)
Affiliated Non-Affiliated
40%
54%
80%
94%
60%
46%
20%
6%
LDCs Producers Marketers Firm
Storage
Firm Transport
(1) Contracted as of 10/20/2016.
29
California Overview
Exploration & Production
30
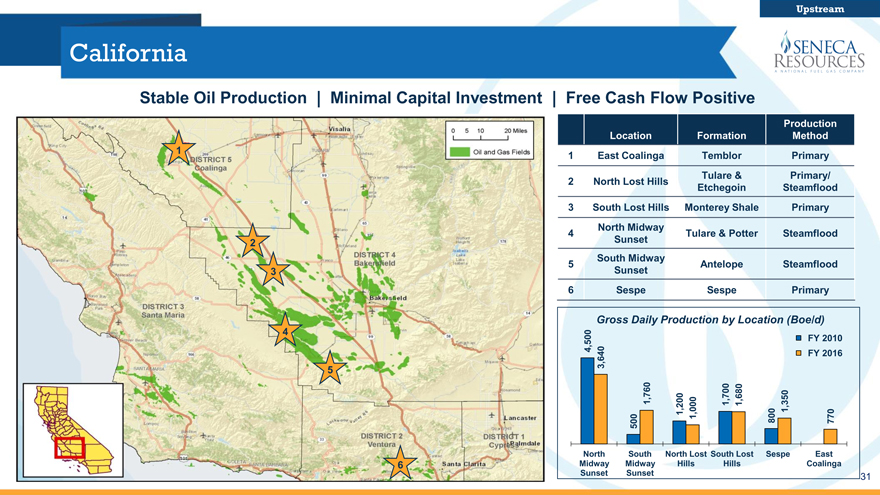
California
Upstream
Stable Oil Production | Minimal Capital Investment | Free Cash Flow Positive
1
2
3
4
5
6
Production
Location Formation Method
1 East Coalinga Temblor Primary
2 North Lost Hills Tulare & Primary/
Etchegoin Steamflood
3 South Lost Hills Monterey Shale Primary
North Midway
4 Tulare & Potter Steamflood
Sunset
South Midway
5 Antelope Steamflood
Sunset
6 Sespe Sespe Primary
Gross Daily Production by Location (Boe/d)
4,500 FY 2010
3,640 FY 2016
1,760 1,200 1,000 1,700 1,680 1,350
500 800 770
North South North Lost South Lost Sespe East
Midway Midway Hills Hills Coalinga
Sunset Sunset
31
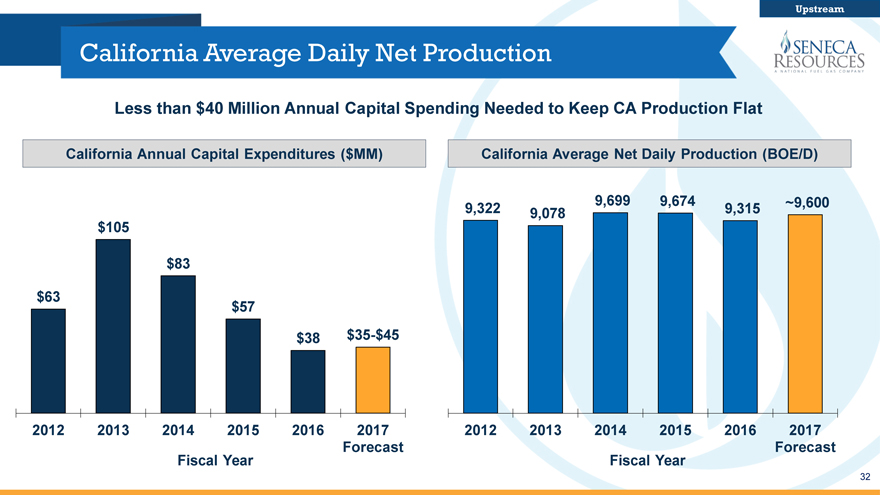
California Average Daily Net Production
Upstream
Less than $40 Million Annual Capital Spending Needed to Keep CA Production Flat
California Annual Capital Expenditures ($MM)
$105
$83
$63
$57
$38 $35-$45
2012 2013 2014 2015 2016 2017
Forecast
Fiscal Year
California Average Net Daily Production (BOE/D)
9,322 9,699 9,674 9,315 ~9,600
9,078
2012 2013 2014 2015 2016 2017
Forecast
Fiscal Year
32
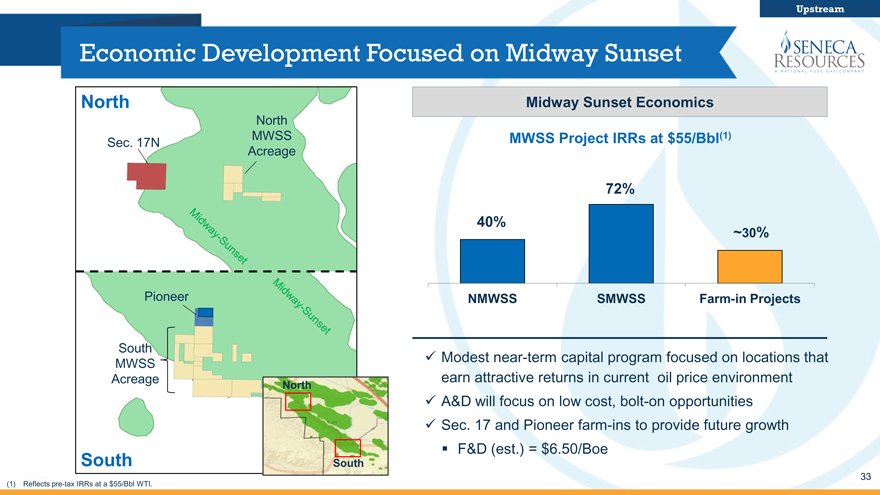
Economic Development Focused on Midway Sunset
Upstream
North
North
Sec. 17N MWSS
Acreage
Pioneer
South
MWSS
Acreage North
South South
Midway Sunset Economics
MWSS Project IRRs at $55/Bbl(1)
72%
40%
~30%
NMWSS SMWSS Farm-in Projects
Modest near-term capital program focused on locations that
earn attractive returns in current oil price environment
A&D will focus on low cost, bolt-on opportunities
Sec. 17 and Pioneer farm-ins to provide future growth
F&D (est.) = $6.50/Boe
(1) Reflects pre-tax IRRs at a $55/Bbl WTI.
33
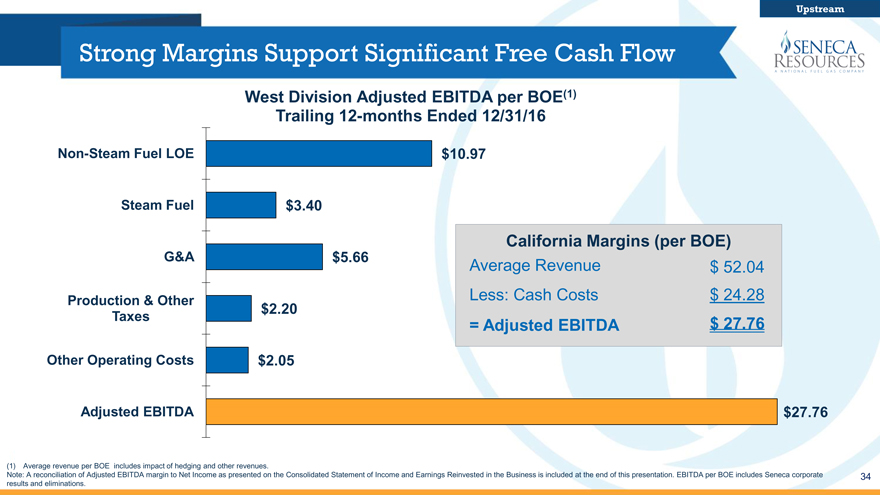
Strong Margins Support Significant Free Cash Flow
Upstream
West Division Adjusted EBITDA per BOE(1)
Trailing 12-months Ended 12/31/16
Non-Steam Fuel LOE $10.97
Steam Fuel $3.40
California Margins (per BOE)
G&A $5.66 Average Revenue $ 52.04
Production & Other Less: Cash Costs $ 24.28
$2.20
Taxes = Adjusted EBITDA $ 27.76
Other Operating Costs $2.05
Adjusted EBITDA $ 27.76
(1) Average revenue per BOE includes impact of hedging and other revenues.
Note: A reconciliation of Adjusted EBITDA margin to Net Income as presented on the Consolidated Statement of Income and Earnings Reinvested in the Business is included at the end of this presentation. EBITDA per BOE includes Seneca corporate results and eliminations.
34
Production and Marketing
Exploration & Production
35
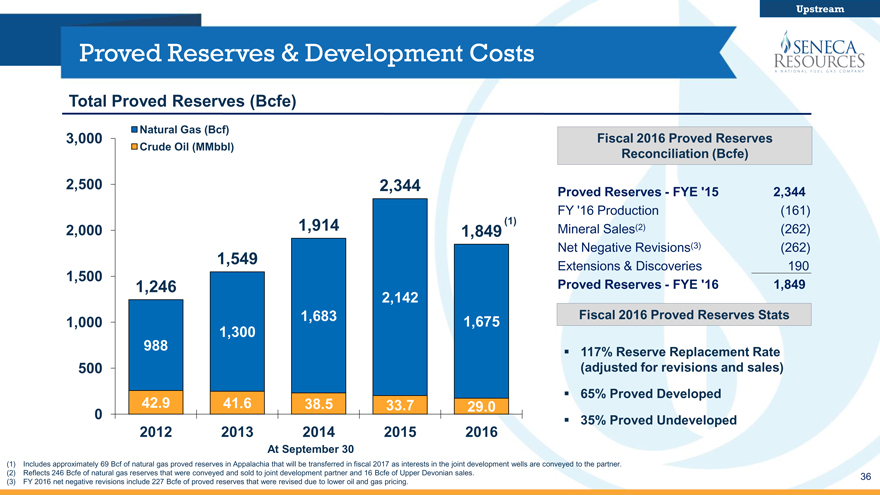
Proved Reserves & Development Costs
Upstream
Total Proved Reserves (Bcfe)
Natural Gas (Bcf)
3,000 Fiscal 2016 Proved Reserves
Crude Oil (MMbbl) Reconciliation (Bcfe)
2,500 2,344 Proved Reserves—FYE ‘15 2,344
FY ‘16 Production(161)
2,000 1,914 1,849 (1) Mineral Sales(2)(262)
Net Negative Revisions(3)(262)
1,549 Extensions & Discoveries 190
1,500
1,246 Proved Reserves—FYE ‘16 1,849
2,142
1,000 1,683 1,675 Fiscal 2016 Proved Reserves Stats
1,300
988 117% Reserve Replacement Rate
500(adjusted for revisions and sales)
65% Proved Developed
42.9 41.6 38.5 33.7 29.0
0 35% Proved Undeveloped
2012 2013 2014 2015 2016
At September 30
Includes approximately 69 Bcf of natural gas proved reserves in Appalachia that will be transferred in fiscal 2017 as interests in the joint development wells are conveyed to the partner.
Reflects 246 Bcfe of natural gas reserves that were conveyed and sold to joint development partner and 16 Bcfe of Upper Devonian sales.
FY 2016 net negative revisions include 227 Bcfe of proved reserves that were revised due to lower oil and gas pricing.
36
Seneca Production
Upstream
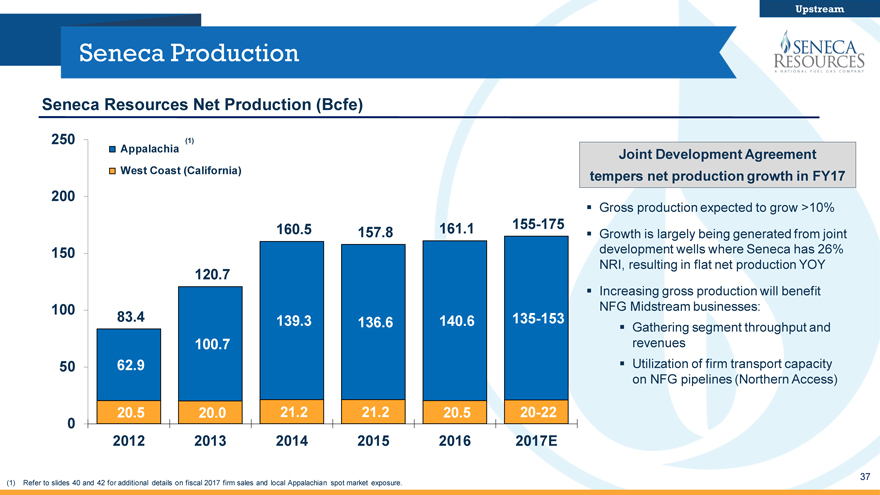
Seneca Resources Net Production (Bcfe)
250(1)
Appalachia
West Coast (California)
200
160.5 157.8 161.1 155-175
150
120.7
100 83.4 139.3 136.6 140.6 135-153
100.7
50 62.9
20.5 20.0 21.2 21.2 20.5 20-22
0
2012 2013 2014 2015 2016 2017E
Joint Development Agreement
tempers net production growth in FY17
Gross production expected to grow >10%
Growth is largely being generated from joint
development wells where Seneca has 26%
NRI, resulting in flat net production YOY
Increasing gross production will benefit NFG
Midstream businesses:
Gathering segment throughput and
revenues
Utilization of firm transport capacity
on NFG pipelines (Northern Access)
(1) Refer to slides 40 and 42 for additional details on fiscal 2017 firm sales and local Appalachian spot market exposure.
37
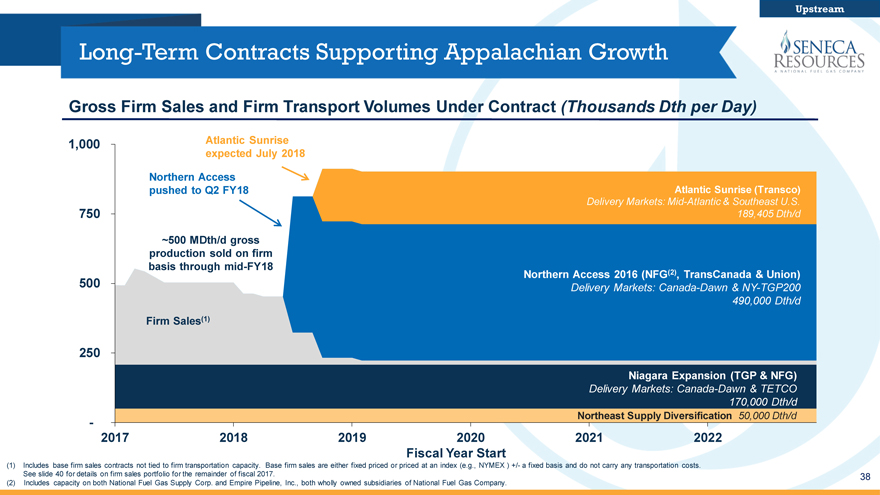
Long-Term Contracts Supporting Appalachian Growth
Gross Firm Sales and Firm Transport Volumes Under Contract (Thousands Dth per Day)
1,000 Atlantic Sunrise expected July 2018 Northern Access pushed to Q2 FY18 Atlantic Sunrise (Transco)
Delivery Markets: Mid-Atlantic & Southeast U.S. 750 189,405 Dth/d
~500 MDth/d gross production sold on firm basis through mid-FY18
500 Northern Access 2016 (NFG(2), TransCanada & Union)
Delivery Markets: Canada-Dawn & NY-TGP200 490,000 Dth/d
Firm Sales(1)
250
Niagara Expansion (TGP & NFG)
Delivery Markets: Canada-Dawn & TETCO 170,000 Dth/d
- Northeast Supply Diversification 50,000 Dth/d
2017 2018 2019 2020 2021 2022 Fiscal Year Start
(1) Includes base firm sales contracts not tied to firm transportation capacity. Base firm sales are either fixed priced or priced at an index (e.g., NYMEX ) +/- a fixed basis and do not carry any transportation costs.
See slide 40 for details on firm sales portfolio for the remainder of fiscal 2017. 38 (2) Includes capacity on both National Fuel Gas Supply Corp. and Empire Pipeline, Inc., both wholly owned subsidiaries of National Fuel Gas Company.
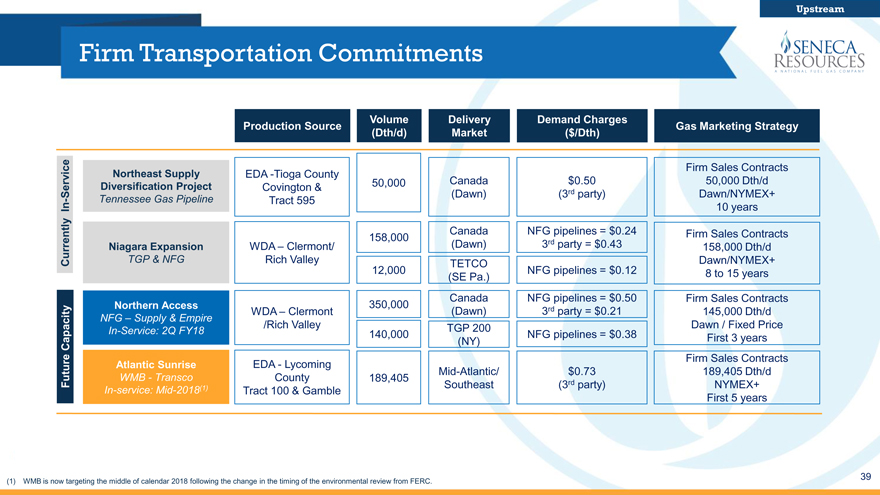
Firm Transportation Commitments
Upstream
Volume Delivery Demand Charges
Production Source Gas Marketing Strategy
(Dth/d) Market($/Dth)
Northeast Supply EDA -Tioga County Firm Sales Contracts
Diversification Project Covington & 50,000 Canada $0.50 50,000 Dth/d
Service(Dawn)(3rd party) Dawn/NYMEX+
- Tennessee Gas Pipeline Tract 595
In 10 years
158,000 Canada NFG pipelines = $0.24 Firm Sales Contracts
Niagara Expansion WDA – Clermont/(Dawn) 3rd party = $0.43 158,000 Dth/d
Currently TGP & NFG Rich Valley TETCO Dawn/NYMEX+
12,000(SE Pa.) NFG pipelines = $0.12 8 to 15 years
Northern Access 350,000 Canada NFG pipelines = $0.50 Firm Sales Contracts
WDA – Clermont(Dawn) 3rd party = $0.21 145,000 Dth/d
NFG In-Service: – Supply 2Q & FY18 Empire /Rich Valley TGP 200 Dawn / Fixed Price
140,000 NFG pipelines = $0.38
Capacity(NY) First 3 years
Atlantic Sunrise EDA—Lycoming Firm Sales Contracts
Future WMB—Transco County 189,405 Mid-Atlantic/ $0.73 189,405 Dth/d
In-service: Mid-2018(1) Tract 100 & Gamble Southeast(3rd party) NYMEX+
First 5 years
(1) WMB is now targeting the middle of calendar 2018 following the change in the timing of the environmental review from FERC.
39
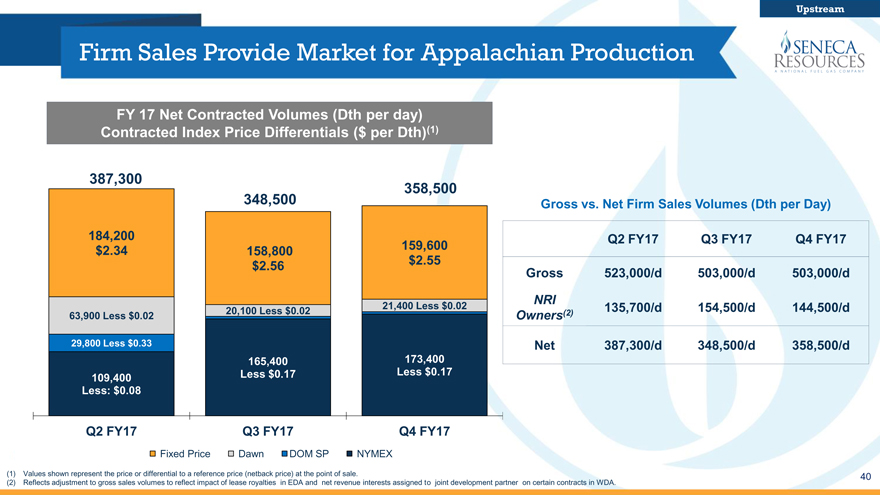
Firm Sales Provide Market for Appalachian Production
Upstream
FY 17 Net Contracted Volumes (Dth per day)
Contracted Index Price Differentials ($ per Dth)(1)
387,300 358,500
348,500
184,200
$2.34 158,800 159,600
$2.56 $2.55
21,400 Less $0.02
63,900 Less $0.02 20,100 Less $0.02
29,800 Less $0.33
165,400 173,400
109,400 Less $0.17 Less $0.17
Less: $0.08
Q2 FY17 Q3 FY17 Q4 FY17
Fixed Price Dawn DOM SP NYMEX
Gross vs. Net Firm Sales Volumes (Dth per Day)
Q2 FY17 Q3 FY17 Q4 FY17
Gross 523,000/d 503,000/d 503,000/d
NRI
Owners(2) 135,700/d 154,500/d 144,500/d
Net 387,300/d 348,500/d 358,500/d
Values shown represent the price or differential to a reference price (netback price) at the point of sale.
Reflects adjustment to gross sales volumes to reflect impact of lease royalties in EDA and net revenue interests assigned to joint development partner on certain contracts in WDA.
40
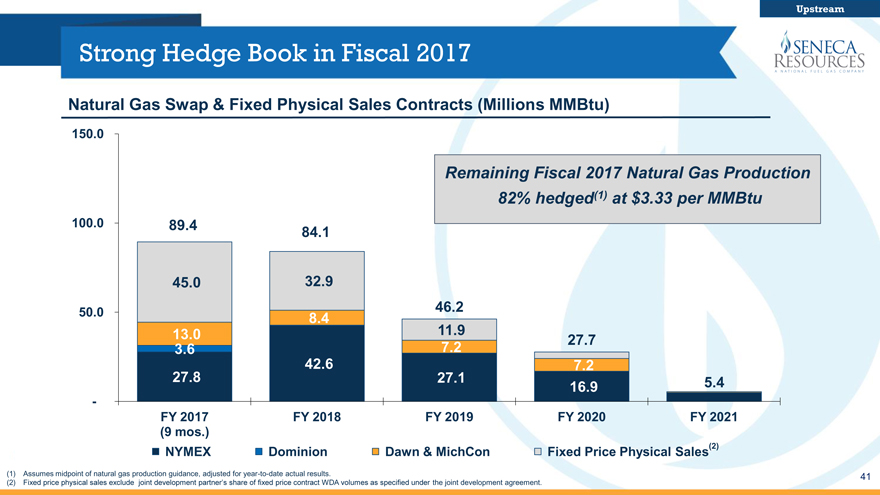
Strong Hedge Book in Fiscal 2017
Upstream
Natural Gas Swap & Fixed Physical Sales Contracts (Millions MMBtu)
150.0
Remaining Fiscal 2017 Natural Gas Production
82% hedged(1) at $3.33 per MMBtu
100.0 89.4 84.1
45.0 32.9
50.0 46.2
8.4
13.0 11.9 27.7
3.6 7.2
42.6 7.2
27.8 27.1 16.9 5.4
-
FY 2017 FY 2018 FY 2019 FY 2020 FY 2021
(9 mos.)
NYMEX Dominion Dawn & MichCon Fixed Price Physical Sales(2)
Assumes midpoint of natural gas production guidance, adjusted for year-to-date actual results.
Fixed price physical sales exclude joint development partner’s share of fixed price contract WDA volumes as specified under the joint development agreement.
41
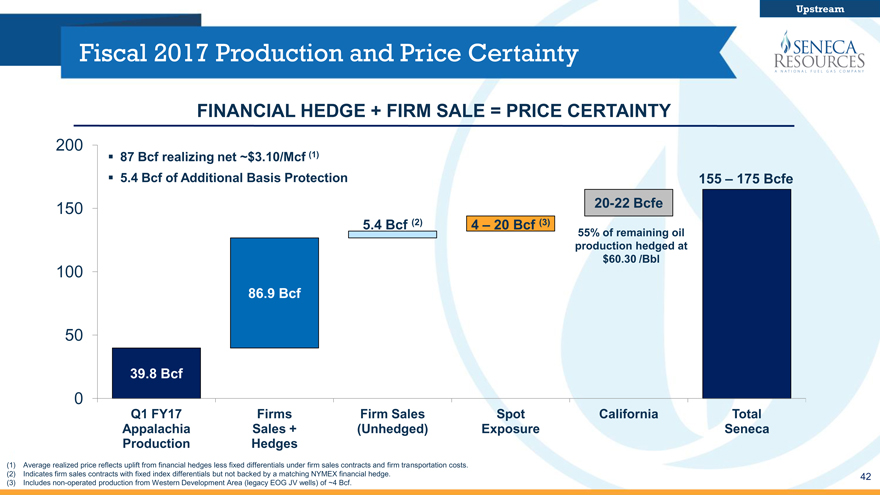
Fiscal 2017 Production and Price Certainty
Upstream
FINANCIAL HEDGE + FIRM SALE = PRICE CERTAINTY
200
? 87 Bcf realizing net ~$3.10/Mcf (1)
? 5.4 Bcf of Additional Basis Protection 155 – 175 Bcfe
150 20-22 Bcfe
5.4 Bcf (2) 4 – 20 Bcf (3) 55% of remaining oil
production hedged at
$60.30 /Bbl
100
86.9 Bcf
50
39.8 Bcf
0
Q1 FY17 Firms Firm Sales Spot California Total
Appalachia Sales +(Unhedged) Exposure Seneca
Production Hedges
Average realized price reflects uplift from financial hedges less fixed differentials under firm sales contracts and firm transportation costs.
Indicates firm sales contracts with fixed index differentials but not backed by a matching NYMEX financial hedge.
Includes non-operated production from Western Development Area (legacy EOG JV wells) of ~4 Bcf.
42
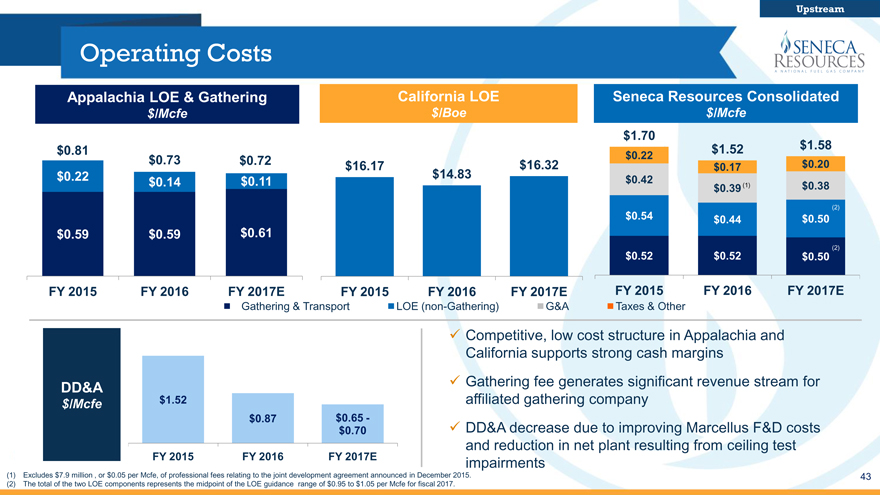
Operating Costs
Upstream
Appalachia LOE & Gathering California LOE Seneca Resources Consolidated
$/Mcfe $/Boe $/Mcfe
$1.70
$ 0.81 $1.52 $1.58
$0.73 $0.72 $16.17 $16.32 $0.22 $0.20
$0.17
$ 0.22 $0.14 $0.11 $14.83 $0.42 $0.38
(1) $0.39 (1)
(2)
$0.54 $0.44 $0.50
$ 0.59 $0.59 $0.61
(2)
$0.52 $0.52 $0.50
FY 2015 FY 2016 FY 2017E FY 2015 FY 2016 FY 2017E FY 2015 FY 2016 FY 2017E
Gathering & Transport LOE (non-Gathering) G&A Taxes & Other
DD&A
$/Mcfe $1.52
$0.87 $0.65 -
$0.70
FY 2015 FY 2016 FY 2017E
Competitive, low cost structure in Appalachia and California supports strong cash margins Gathering fee generates significant revenue stream for affiliated gathering company DD&A decrease due to improving Marcellus F&D costs and reduction in net plant resulting from ceiling test impairments
Excludes $7.9 million , or $0.05 per Mcfe, of professional fees relating to the joint development agreement announced in December 2015.
The total of the two LOE components represents the midpoint of the LOE guidance range of $0.95 to $1.05 per Mcfe for fiscal 2017.
43
Downstream Overview
Utility ~ Energy Marketing
44
New York & Pennsylvania Service Territories
Downstream
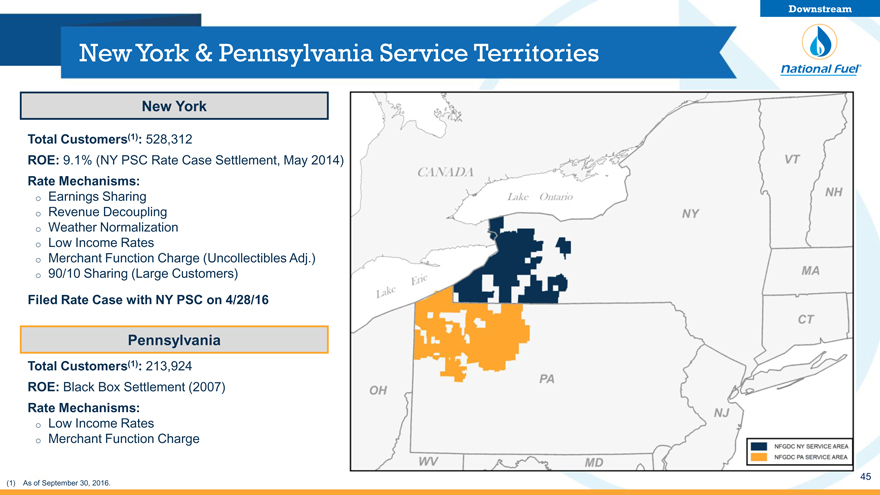
New York
Total Customers(1): 528,312
ROE: 9.1% (NY PSC Rate Case Settlement, May 2014)
Rate Mechanisms:
o Earnings Sharing
o Revenue Decoupling
o Weather Normalization
o Low Income Rates
o Merchant Function Charge (Uncollectibles Adj.)
o 90/10 Sharing (Large Customers)
Filed Rate Case with NY PSC on 4/28/16
Pennsylvania
Total Customers(1): 213,924
ROE: Black Box Settlement (2007)
Rate Mechanisms:
o Low Income Rates
o Merchant Function Charge
(1) As of September 30, 2016.
45
New York Rate Case
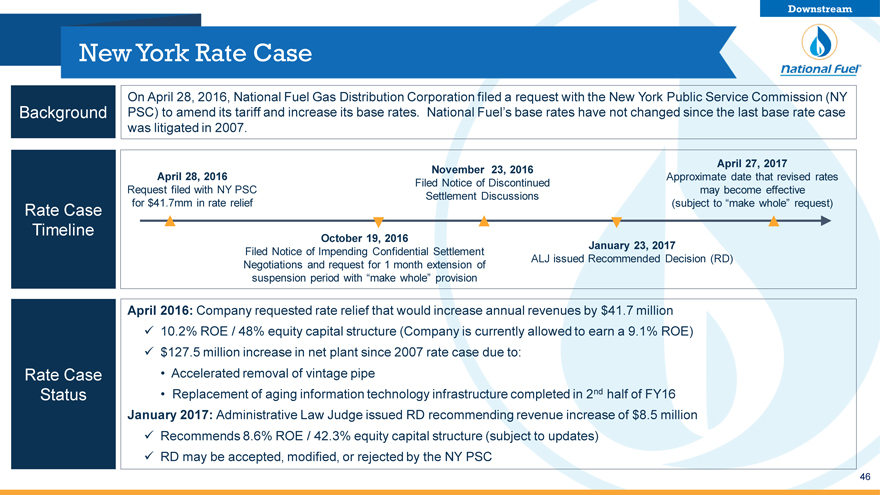
On April 28, 2016, National Fuel Gas Distribution Corporation filed a request with the New York Public Service
Background PSC) to amend its tariff and increase its base rates. National Fuel’s base rates have not changed since the last base rate case was litigated in 2007.
April 27, 2017 November 23, 2016
April 28, 2016 Approximate date that revised rates Filed Notice of Discontinued Request filed with NY PSC may become effective Settlement Discussions Rate Case for $41.7mm in rate relief (subject to “make whole” request)
Timeline
October 19, 2016
January 23, 2017
Filed Notice of Impending Confidential Settlement
ALJ issued Recommended Decision (RD) Negotiations and request for 1 month extension of suspension period with “make whole” provision
April 2016: Company requested rate relief that would increase annual revenues by $41.7 million ? 10.2% ROE / 48% equity capital structure (Company is currently allowed to earn a 9.1% ROE) ? $127.5 million increase in net plant since 2007 rate case due to: Rate Case Accelerated removal of vintage pipe Status Replacement of aging information technology infrastructure completed in 2nd half of FY16 January 2017: Administrative Law Judge issued RD recommending revenue increase of $8.5 million ? Recommends 8.6% ROE / 42.3% equity capital structure (subject to updates) ? RD may be accepted, modified, or rejected by the NY PSC
46
Utility: Shifting Trends in Customer Usage
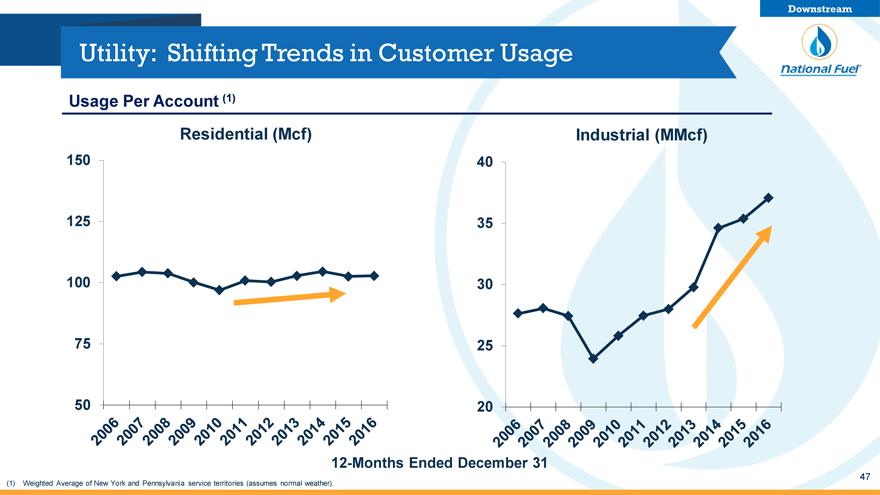
Usage Per Account (1)
Residential (Mcf) Industrial (MMcf)
150 40
125 35
100 30
75 25
50 20
12-Months Ended December 31
47
(1) Weighted Average of New York and Pennsylvania service territories (assumes normal weather).
Utility: Strong Commitment to Safety
Downstream
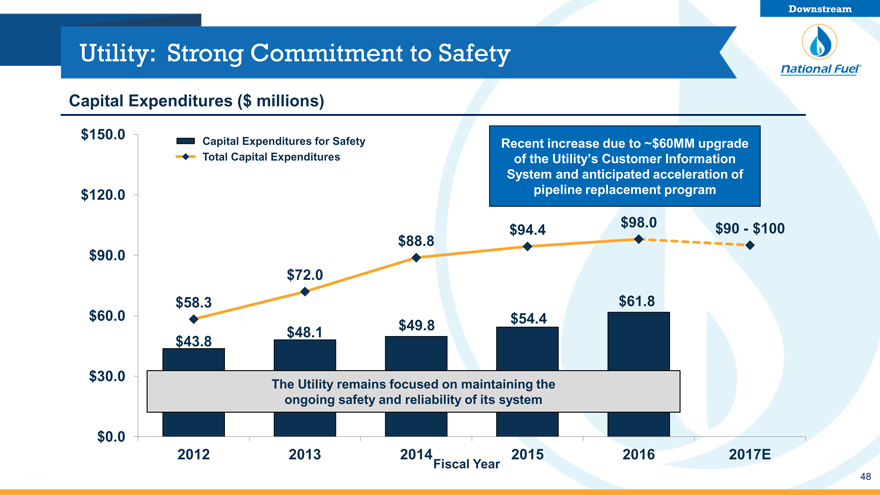
Capital Expenditures ($ millions)
$150.0 Capital Expenditures for Safety Recent increase due to ~$60MM upgrade
Total Capital Expenditures of the Utility’s Customer Information
System and anticipated acceleration of
$120.0 pipeline replacement program
$94.4 $98.0 $90—$100
$ 88.8
$90.0
$ 72.0
$ 58.3 $61.8
$60.0 $54.4
$ 48.1 $49.8
$ 43.8
$30.0 The Utility remains focused on maintaining the
ongoing safety and reliability of its system
$0.0
2012 2013 2014 2015 2016 2017E
Fiscal Year
48
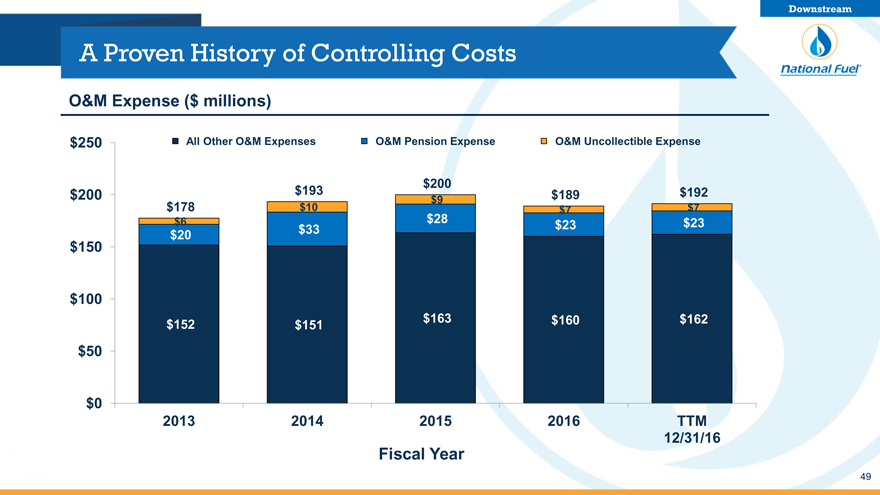
A Proven History of Controlling Costs
Downstream
O&M Expense ($ millions)
$250 All Other O&M Expenses O&M Pension Expense O&M Uncollectible Expense
$200
$200 $193 $9 $189 $192
$178 $10 $7 $7
$6 $28 $23 $23
$20 $33
$150
$100
$152 $151 $163 $160 $162
$50
$0
2013 2014 2015 2016 TTM
12/31/16
Fiscal Year
49
Appendix
50
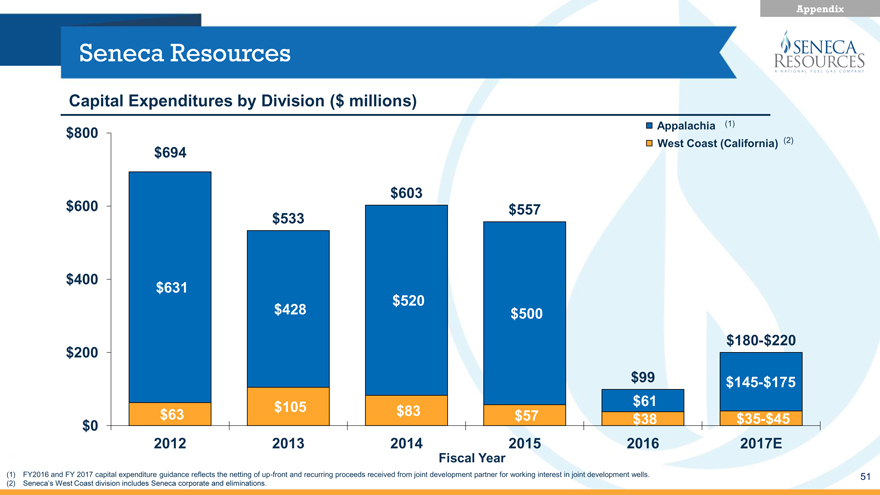
Seneca Resources
Appendix
Capital Expenditures by Division ($ millions)
$800 Appalachia(1)
West Coast (California) (2)
$694
$603
$600 $557
$533
$400 $631
$520
$428 $500
$180-$220
$200
$99 $145-$175
$105 $61
$0 $63 $83 $57 $38 $35-$45
2012 2013 2014 2015 2016 2017E
Fiscal Year
FY2016 and FY 2017 capital expenditure guidance reflects the netting of up-front and recurring proceeds received from joint development partner for working interest in joint development wells.
Seneca’s West Coast division includes Seneca corporate and eliminations.
51
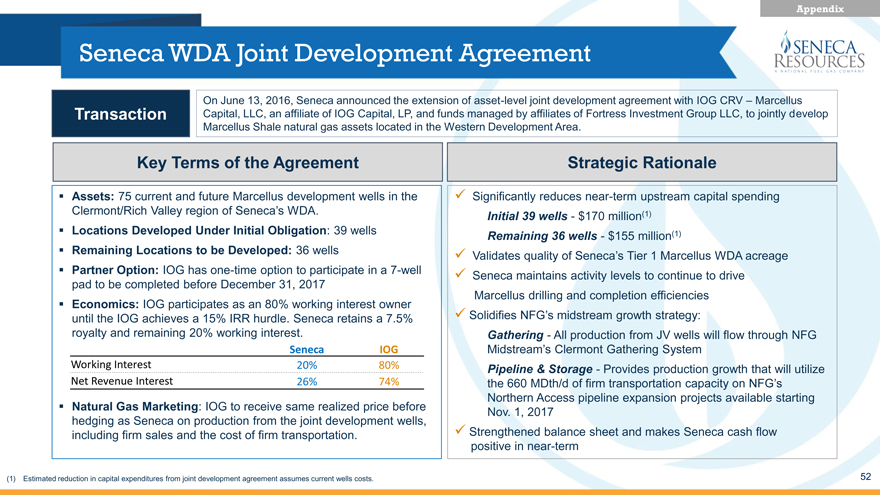
Seneca WDA Joint Development Agreement
Appendix
On June 13, 2016, Seneca announced the extension of asset-level joint development agreement with IOG CRV – Marcellus Transaction Capital, LLC, an affiliate of IOG Capital, LP, and funds managed by affiliates of Fortress Investment Group LLC, to jointly develop Marcellus Shale natural gas assets located in the Western Development Area.
Key Terms of the Agreement
Assets: 75 current and future Marcellus development wells in the
Clermont/Rich Valley region of Seneca’s WDA.
Locations Developed Under Initial Obligation: 39 wells
Remaining Locations to be Developed: 36 wells
Partner Option: IOG has one-time option to participate in a 7-well
pad to be completed before December 31, 2017
Economics: IOG participates as an 80% working interest owner
until the IOG achieves a 15% IRR hurdle. Seneca retains a 7.5%
royalty and remaining 20% working interest.
Seneca IOG
Working Interest 20% 80%
Net Revenue Interest 26% 74%
Natural Gas Marketing: IOG to receive same realized price before
hedging as Seneca on production from the joint development wells,
including firm sales and the cost of firm transportation.
Strategic Rationale
Significantly reduces near-term upstream capital spending
Initial 39 wells—$170 million(1)
Remaining 36 wells—$155 million(1)
Validates quality of Seneca’s Tier 1 Marcellus WDA acreage
Seneca maintains activity levels to continue to drive
Marcellus drilling and completion efficiencies
Solidifies NFG’s midstream growth strategy:
Gathering—All production from JV wells will flow through NFG
Midstream’s Clermont Gathering System
Pipeline & Storage—Provides production growth that will utilize
the 660 MDth/d of firm transportation capacity on NFG’s
Northern Access pipeline expansion projects available starting
Nov. 1, 2017
Strengthened balance sheet and makes Seneca cash flow
positive in near-term
(1) Estimated reduction in capital expenditures from joint development agreement assumes current wells costs.
52
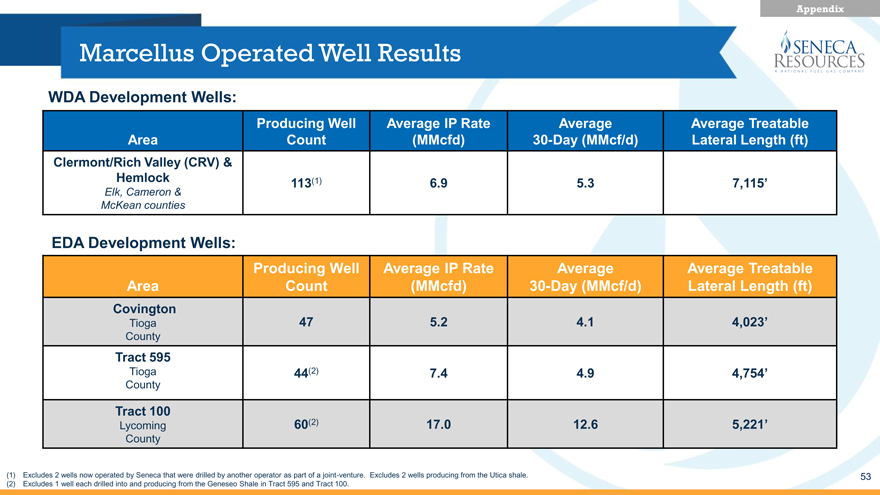
Marcellus Operated Well Results
Appendix
WDA Development Wells:
Producing Well Average IP Rate Average Average Treatable
Area Count(MMcfd) 30-Day (MMcf/d) Lateral Length (ft)
Clermont/Rich Valley (CRV) &
Hemlock 113(1) 6.9 5.3 7,115’
Elk, Cameron &
McKean counties
EDA Development Wells:
Producing Well Average IP Rate Average Average Treatable
Area Count(MMcfd) 30-Day (MMcf/d) Lateral Length (ft)
Covington
Tioga 47 5.2 4.1 4,023’
County
Tract 595
Tioga 44(2) 7.4 4.9 4,754’
County
Tract 100
Lycoming 60(2) 17.0 12.6 5,221’
County
Excludes 2 wells now operated by Seneca that were drilled by another operator as part of a joint-venture. Excludes 2 wells producing from the Utica shale.
Excludes 1 well each drilled into and producing from the Geneseo Shale in Tract 595 and Tract 100.
53
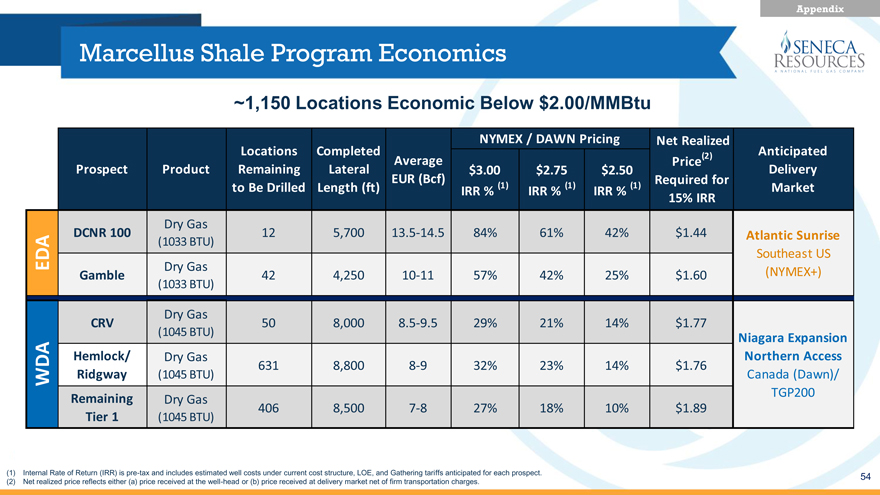
Marcellus Shale Program Economics
Appendix
~1,150 Locations Economic Below $2.00/MMBtu
NYMEX / DAWN Pricing Net Realized
Locations Completed(2) Anticipated
Average Price
Prospect Product Remaining Lateral $3.00 $2.75 $2.50 Delivery
EUR (Bcf) Required for
to Be Drilled Length (ft) IRR % (1) IRR % (1) IRR % (1) Market
15% IRR
Dry Gas
DCNR 100 12 5,700 13.5-14.5 84% 61% 42% $1.44 Atlantic Sunrise
A(1033 BTU)
ED Southeast US
Gamble Dry Gas 42 4,250 10-11 57% 42% 25% $1.60(NYMEX+)
(1033 BTU)
Dry Gas
CRV 50 8,000 8.5-9.5 29% 21% 14% $1.77
(1045 BTU) Niagara Expansion
Hemlock/ Dry Gas Northern Access
631 8,800 8-9 32% 23% 14% $1.76
WDA Ridgway(1045 BTU) Canada (Dawn)/
Remaining Dry Gas TGP200
406 8,500 7-8 27% 18% 10% $1.89
Tier 1(1045 BTU)
Internal Rate of Return (IRR) is pre-tax and includes estimated well costs under current cost structure, LOE, and Gathering tariffs anticipated for each prospect.
Net realized price reflects either (a) price received at the well-head or (b) price received at delivery market net of firm transportation charges.
54
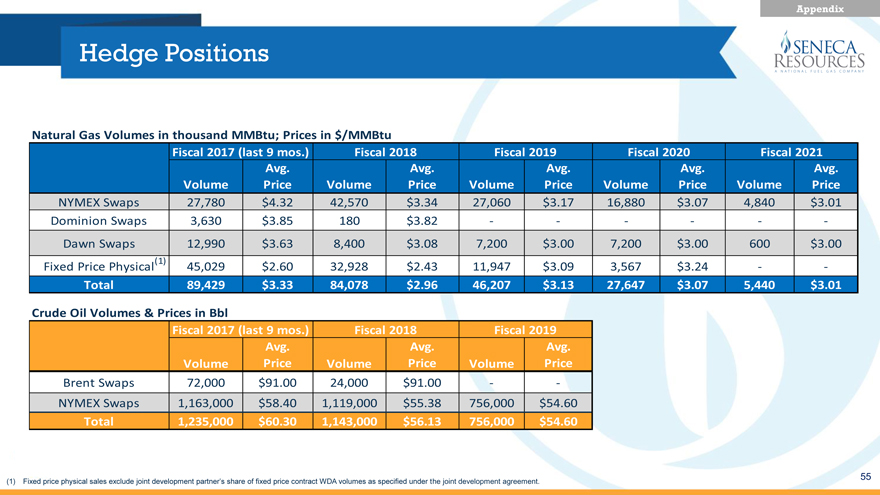
Hedge Positions
Appendix
Natural Gas Volumes in thousand MMBtu; Prices in $/MMBtu
Fiscal 2017 (last 9 mos.) Fiscal 2018 Fiscal 2019 Fiscal 2020 Fiscal 2021
Avg. Avg. Avg. Avg. Avg.
Volume Price Volume Price Volume Price Volume Price Volume Price
NYMEX Swaps 27,780 $4.32 42,570 $3.34 27,060 $3.17 16,880 $3.07 4,840 $3.01
Dominion Swaps 3,630 $3.85 180 $3.82 — — —
Dawn Swaps 12,990 $3.63 8,400 $3.08 7,200 $3.00 7,200 $3.00 600 $3.00
Fixed Price Physical(1) 45,029 $2.60 32,928 $2.43 11,947 $3.09 3,567 $3.24 —
Total 89,429 $3.33 84,078 $2.96 46,207 $3.13 27,647 $3.07 5,440 $3.01
Crude Oil Volumes & Prices in Bbl
Fiscal 2017 (last 9 mos.) Fiscal 2018 Fiscal 2019
Avg. Avg. Avg.
Volume Price Volume Price Volume Price
Brent Swaps 72,000 $91.00 24,000 $91.00 —
NYMEX Swaps 1,163,000 $58.40 1,119,000 $55.38 756,000 $54.60
Total 1,235,000 $60.30 1,143,000 $56.13 756,000 $54.60
(1) Fixed price physical sales exclude joint development partner’s share of fixed price contract WDA volumes as specified under the joint development agreement.
55
Comparable GAAP Financial Measure Slides & Reconciliations
Appendix
This presentation contains certain non-GAAP financial measures. For pages that contain non-GAAP financial measures, pages containing the most directly comparable GAAP financial measures and reconciliations are provided in the slides that follow.
The Company believes that its non-GAAP financial measures are useful to investors because they provide an alternative method for assessing the Company’s ongoing operating results and for comparing the Company’s financial performance to other companies. The Company’s management uses these non-GAAP financial measures for the same purpose, and for planning and forecasting purposes. The presentation of non-GAAP financial measures is not meant to be a substitute for financial measures prepared in accordance with GAAP.
The Company defines Adjusted EBITDA as reported GAAP earnings before the following items: interest expense, depreciation, depletion and amortization, interest and other income, impairments, items impacting comparability and income taxes.
56
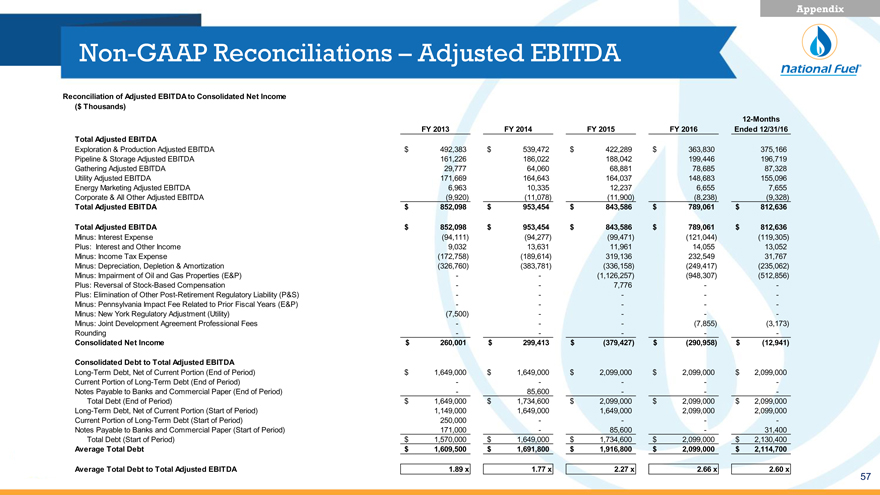
Non-GAAP Reconciliations – Adjusted EBITDA
Appendix
Reconciliation of Adjusted EBITDA to Consolidated Net Income
($ Thousands)
12-Months
FY 2013 FY 2014 FY 2015 FY 2016 Ended 12/31/16
Total Adjusted EBITDA
Exploration & Production Adjusted EBITDA $ 492,383 $ 539,472 $ 422,289 $ 363,830 375,166
Pipeline & Storage Adjusted EBITDA 161,226 186,022 188,042 199,446 196,719
Gathering Adjusted EBITDA 29,777 64,060 68,881 78,685 87,328
Utility Adjusted EBITDA 171,669 164,643 164,037 148,683 155,096
Energy Marketing Adjusted EBITDA 6,963 10,335 12,237 6,655 7,655
Corporate & All Other Adjusted EBITDA(9,920)(11,078)(11,900)(8,238)(9,328)
Total Adjusted EBITDA $ 852,098 $ 953,454 $ 843,586 $ 789,061 $ 812,636
Total Adjusted EBITDA $ 852,098 $ 953,454 $ 843,586 $ 789,061 $ 812,636
Minus: Interest Expense(94,111)(94,277)(99,471)(121,044)(119,305)
Plus: Interest and Other Income 9,032 13,631 11,961 14,055 13,052
Minus: Income Tax Expense(172,758)(189,614) 319,136 232,549 31,767
Minus: Depreciation, Depletion & Amortization(326,760)(383,781)(336,158)(249,417)(235,062)
Minus: Impairment of Oil and Gas Properties (E&P) —(1,126,257)(948,307)(512,856)
Plus: Reversal of Stock-Based Compensation — 7,776 —
Plus: Elimination of Other Post-Retirement Regulatory Liability (P&S) — — -
Minus: Pennsylvania Impact Fee Related to Prior Fiscal Years (E&P) — — -
Minus: New York Regulatory Adjustment (Utility)(7,500) — —
Minus: Joint Development Agreement Professional Fees — -(7,855)(3,173)
Rounding — — -
Consolidated Net Income $ 260,001 $ 299,413 $(379,427) $(290,958) $(12,941)
Consolidated Debt to Total Adjusted EBITDA
Long-Term Debt, Net of Current Portion (End of Period) $ 1,649,000 $ 1,649,000 $ 2,099,000 $ 2,099,000 $ 2,099,000
Current Portion of Long-Term Debt (End of Period) — — -
Notes Payable to Banks and Commercial Paper (End of Period)—85,600 — -
Total Debt (End of Period) $ 1,649,000 $ 1,734,600 $ 2,099,000 $ 2,099,000 $ 2,099,000
Long-Term Debt, Net of Current Portion (Start of Period) 1,149,000 1,649,000 1,649,000 2,099,000 2,099,000
Current Portion of Long-Term Debt (Start of Period) 250,000 — —
Notes Payable to Banks and Commercial Paper (Start of Period) 171,000—85,600—31,400
Total Debt (Start of Period) $ 1,570,000 $ 1,649,000 $ 1,734,600 $ 2,099,000 $ 2,130,400
Average Total Debt $ 1,609,500 $ 1,691,800 $ 1,916,800 $ 2,099,000 $ 2,114,700
Average Total Debt to Total Adjusted EBITDA 1.89 x 1.77 x 2.27 x 2.66 x 2.60 x
57
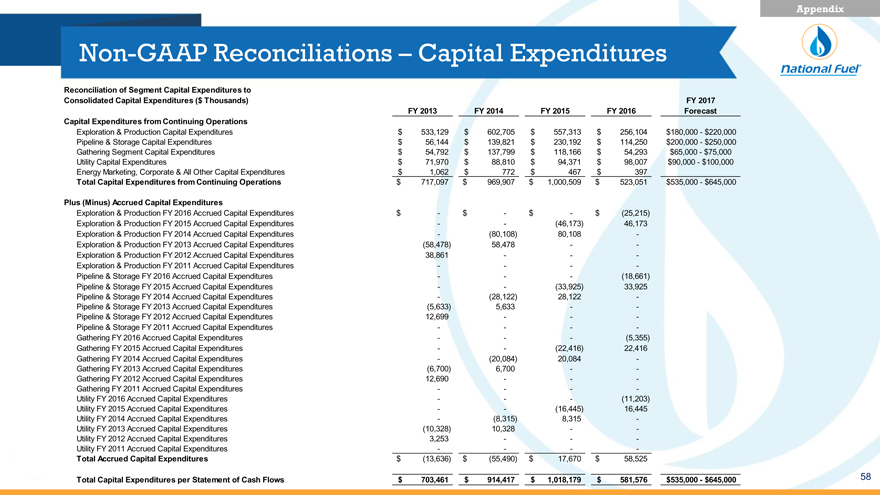
Non-GAAP Reconciliations – Capital Expenditures
Appendix
Reconciliation of Segment Capital Expenditures to
Consolidated Capital Expenditures ($ Thousands) FY 2017
FY 2013 FY 2014 FY 2015 FY 2016 Forecast
Capital Expenditures from Continuing Operations
Exploration & Production Capital Expenditures $ 533,129 $ 602,705 $ 557,313 $ 256,104 $180,000—$220,000
Pipeline & Storage Capital Expenditures $ 56,144 $ 139,821 $ 230,192 $ 114,250 $200,000—$250,000
Gathering Segment Capital Expenditures $ 54,792 $ 137,799 $ 118,166 $ 54,293 $65,000—$75,000
Utility Capital Expenditures $ 71,970 $ 88,810 $ 94,371 $ 98,007 $90,000—$100,000
Energy Marketing, Corporate & All Other Capital Expenditures $ 1,062 $ 772 $ 467 $ 397
Total Capital Expenditures from Continuing Operations $ 717,097 $ 969,907 $ 1,000,509 $ 523,051 $535,000—$645,000
Plus (Minus) Accrued Capital Expenditures
Exploration & Production FY 2016 Accrued Capital Expenditures $—$—$—$(25,215)
Exploration & Production FY 2015 Accrued Capital Expenditures —(46,173) 46,173
Exploration & Production FY 2014 Accrued Capital Expenditures -(80,108) 80,108 -
Exploration & Production FY 2013 Accrued Capital Expenditures(58,478) 58,478 —
Exploration & Production FY 2012 Accrued Capital Expenditures 38,861 — -
Exploration & Production FY 2011 Accrued Capital Expenditures — —
Pipeline & Storage FY 2016 Accrued Capital Expenditures — -(18,661)
Pipeline & Storage FY 2015 Accrued Capital Expenditures —(33,925) 33,925
Pipeline & Storage FY 2014 Accrued Capital Expenditures -(28,122) 28,122 -
Pipeline & Storage FY 2013 Accrued Capital Expenditures(5,633) 5,633 —
Pipeline & Storage FY 2012 Accrued Capital Expenditures 12,699 — -
Pipeline & Storage FY 2011 Accrued Capital Expenditures — —
Gathering FY 2016 Accrued Capital Expenditures — -(5,355)
Gathering FY 2015 Accrued Capital Expenditures —(22,416) 22,416
Gathering FY 2014 Accrued Capital Expenditures -(20,084) 20,084 -
Gathering FY 2013 Accrued Capital Expenditures(6,700) 6,700 —
Gathering FY 2012 Accrued Capital Expenditures 12,690 — -
Gathering FY 2011 Accrued Capital Expenditures — —
Utility FY 2016 Accrued Capital Expenditures — -(11,203)
Utility FY 2015 Accrued Capital Expenditures —(16,445) 16,445
Utility FY 2014 Accrued Capital Expenditures -(8,315) 8,315 -
Utility FY 2013 Accrued Capital Expenditures(10,328) 10,328 —
Utility FY 2012 Accrued Capital Expenditures 3,253 — -
Utility FY 2011 Accrued Capital Expenditures — —
Total Accrued Capital Expenditures $(13,636) $(55,490) $ 17,670 $ 58,525
Total Capital Expenditures per Statement of Cash Flows $ 703,461 $ 914,417 $ 1,018,179 $ 581,576 $535,000—$645,000
58
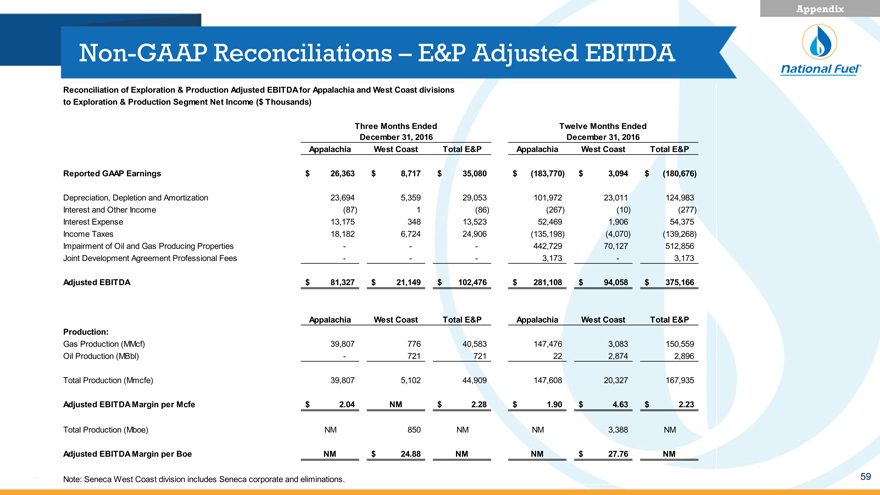
Non-GAAP Reconciliations – E&P Adjusted EBITDA
Appendix
Reconciliation of Exploration & Production Adjusted EBITDA for Appalachia and West Coast divisions
to Exploration & Production Segment Net Income ($ Thousands)
Three Months Ended Twelve Months Ended
December 31, 2016 December 31, 2016
Appalachia West Coast Total E&P Appalachia West Coast Total E&P
Reported GAAP Earnings $ 26,363 $ 8,717 $ 35,080 $ (183,770) $ 3,094 $(180,676)
Depreciation, Depletion and Amortization 23,694 5,359 29,053 101,972 23,011 124,983
Interest and Other Income(87) 1(86)(267)(10)(277)
Interest Expense 13,175 348 13,523 52,469 1,906 54,375
Income Taxes 18,182 6,724 24,906(135,198)(4,070)(139,268)
Impairment of Oil and Gas Producing Properties ——442,729 70,127 512,856
Joint Development Agreement Professional Fees ——3,173—3,173
Adjusted EBITDA $ 81,327 $ 21,149 $ 102,476 $ 281,108 $ 94,058 $ 375,166
Appalachia West Coast Total E&P Appalachia West Coast Total E&P
Production:
Gas Production (MMcf) 39,807 776 40,583 147,476 3,083 150,559
Oil Production (MBbl)—721 721 22 2,874 2,896
Total Production (Mmcfe) 39,807 5,102 44,909 147,608 20,327 167,935
Adjusted EBITDA Margin per Mcfe $ 2.04 NM $ 2.28 $ 1.90 $ 4.63 $ 2.23
Total Production (Mboe) NM 850 NM NM 3,388 NM
Adjusted EBITDA Margin per Boe NM $ 24.88 NM NM $ 27.76 NM
Note: Seneca West Coast division includes Seneca corporate and eliminations.
59
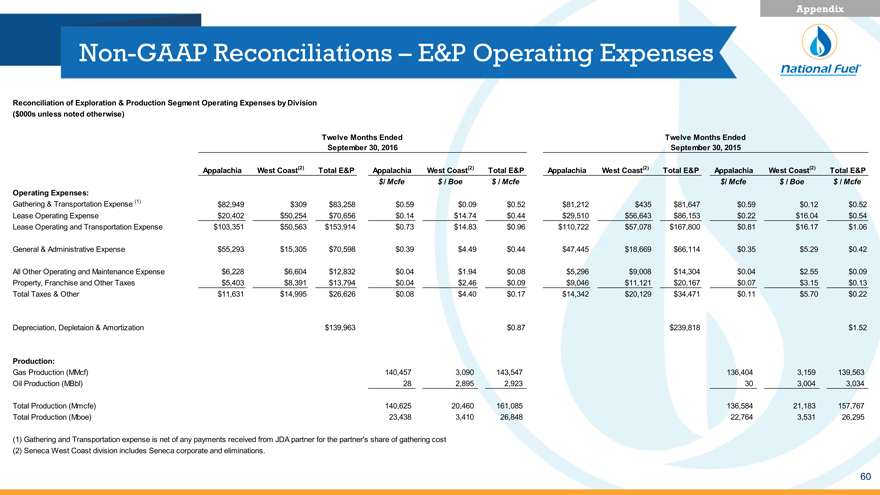
Non-GAAP Reconciliations – E&P Operating Expenses
Appendix
Reconciliation of Exploration & Production Segment Operating Expenses by Division
($000s unless noted otherwise)
Twelve Months Ended Twelve Months Ended
September 30, 2016 September 30, 2015
Appalachia West Coast(2) Total E&P Appalachia West Coast(2) Total E&P Appalachia West Coast(2) Total E&P Appalachia West Coast(2) Total E&P
$/ Mcfe $ / Boe $ / Mcfe $/ Mcfe $ / Boe $ / Mcfe
Operating Expenses:
Gathering & Transportation Expense (1) $82,949 $309 $83,258 $0.59 $0.09 $0.52 $81,212 $435 $81,647 $0.59 $0.12 $0.52
Lease Operating Expense $20,402 $50,254 $70,656 $0.14 $14.74 $0.44 $29,510 $56,643 $86,153 $0.22 $16.04 $0.54
Lease Operating and Transportation Expense $103,351 $50,563 $153,914 $0.73 $14.83 $0.96 $110,722 $57,078 $167,800 $0.81 $16.17 $1.06
General & Administrative Expense $55,293 $15,305 $70,598 $0.39 $4.49 $0.44 $47,445 $18,669 $66,114 $0.35 $5.29 $0.42
All Other Operating and Maintenance Expense $6,228 $6,604 $12,832 $0.04 $1.94 $0.08 $5,296 $9,008 $14,304 $0.04 $2.55 $0.09
Property, Franchise and Other Taxes $5,403 $8,391 $13,794 $0.04 $2.46 $0.09 $9,046 $11,121 $20,167 $0.07 $3.15 $0.13
Total Taxes & Other $11,631 $14,995 $26,626 $0.08 $4.40 $0.17 $14,342 $20,129 $34,471 $0.11 $5.70 $0.22
Depreciation, Depletaion & Amortization $139,963 $0.87 $239,818 $1.52
Production:
Gas Production (MMcf) 140,457 3,090 143,547 136,404 3,159 139,563
Oil Production (MBbl) 28 2,895 2,923 30 3,004 3,034
Total Production (Mmcfe) 140,625 20,460 161,085 136,584 21,183 157,767
Total Production (Mboe) 23,438 3,410 26,848 22,764 3,531 26,295
(1) Gathering and Transportation expense is net of any payments received from JDA partner for the partner’s share of gathering cost
(2) Seneca West Coast division includes Seneca corporate and eliminations.
60