UNITED STATES
SECURITIES AND EXCHANGE COMMISSION
Washington, D.C. 20549
FORM N-CSR
CERTIFIED SHAREHOLDER REPORT OF REGISTERED
MANAGEMENT INVESTMENT COMPANIES
Investment Company Act file number 811-3445
The Merger Fund
(Exact name of registrant as specified in charter)
100 Summit Lake Drive
Valhalla, New York 10595
(Address of principal executive offices) (Zip code)
Roy Behren and Michael T. Shannon
100 Summit Lake Drive
Valhalla, New York 10595
(Name and address of agent for service)
1-800-343-8959
Registrant's telephone number, including area code
Date of fiscal year end: December 31
Date of reporting period: June 30, 2013
Item 1. Reports to Stockholders.
THE
MERGER
FUND®
SEMI-ANNUAL REPORT
JUNE 30, 2013
| Chart 1 | Chart 2 |
| | |
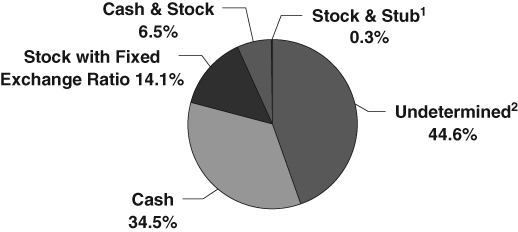
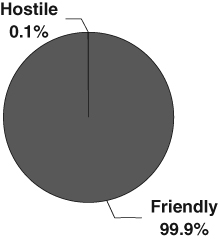
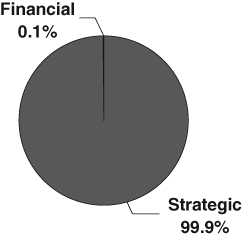
| PORTFOLIO COMPOSITION | PORTFOLIO COMPOSITION |
| By Type of Deal* | By Type of Buyer* |
| | |
 |  |
| | |
Chart 3
PORTFOLIO COMPOSITION
By Deal Terms*
| * | Data expressed as a percentage of long common stock, corporate bonds and swap contract positions as of June 30, 2013. |
| 1 | “Stub” includes assets other than cash and stock (e.g., escrow notes). |
| 2 | The compensation is undetermined because the compensation to be received (e.g., stock, cash, escrow notes, other) will be determined at a later date, potentially at the option of the Fund’s investment adviser. |
Chart 4
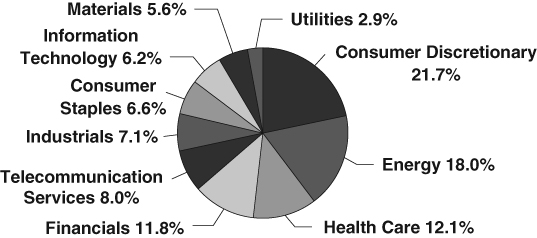
PORTFOLIO COMPOSITION
By Sector*
Chart 5
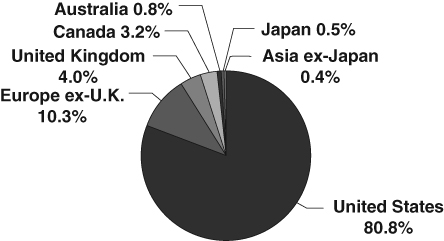
PORTFOLIO COMPOSITION
By Region*
| * | Data expressed as a percentage of long common stock, corporate bonds and swap contract positions as of June 30, 2013. |
The Global Industry Classification Standard (GICS®) was developed by and/or is the exclusive property of MSCI, Inc. and Standard & Poor Financial Services LLC (“S&P”). GICS is a service mark of MSCI and S&P and has been licensed for use by U.S. Bancorp Fund Services, LLC.
Chart 6
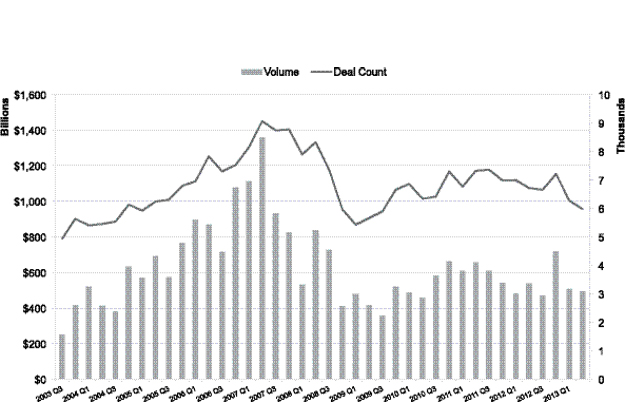
GLOBAL MERGER ACTIVITY
Quarterly volume of announced global mergers
and acquisitions July 2003 – June 2013
Source: Bloomberg, Global Financial Advisory Mergers & Acquisitions Rankings First Six-Months 2013
The Merger Fund
EXPENSE EXAMPLE
June 30, 2013
(Unaudited)
As a shareholder of the Fund, you incur two types of costs: (1) transaction costs as described below and (2) ongoing costs, including management fees, distribution and/or service fees, and other Fund expenses. This example is intended to help you understand your ongoing costs (in dollars) of investing in the Fund and to compare these costs with the ongoing costs of investing in other mutual funds. The example is based on an investment of $1,000 for the period 1/1/13– 6/30/13.
Actual Expenses
The first line of the table below provides information about actual account values and actual expenses. You may use the information in this line, together with the amount you invested, to estimate the expenses that you paid over the period. Simply divide your account value by $1,000 (for example, an $8,600 account value divided by $1,000 = 8.6), then multiply the result by the number in the first line under the heading entitled “Expenses Paid During Period” to estimate the expenses you paid on your account during this period. Although the Fund charges no sales load or transaction fees, you will be assessed transaction-related fees for outgoing wire transfers, returned checks and stop-payment orders at prevailing rates charged by U.S. Bancorp Fund Services, LLC, the Fund’s transfer agent. If you request that a redemption be made by wire transfer, a $15.00 fee will be charged by the Fund’s transfer agent. IRAs will be charged a $15.00 annual maintenance fee. These expenses are not included in the example below, but if they were, such expenses would lower the “Ending Account Value” below. The example below includes, among other fees, management fees, shareholder servicing fees, fund accounting, custody and transfer agent fees. However, the example below does not include portfolio trading commissions and related expenses, and extraordinary expenses as determined under generally accepted accounting principles.
Hypothetical Example for Comparison Purposes
The second line of the table below provides information about hypothetical account values and hypothetical expenses based on the Fund’s actual expense ratio and an assumed rate of return of 5% per year before expenses, which is not the Fund’s actual return. The hypothetical account values and expenses may not be used to estimate the actual ending account balance or expenses you paid for the period. You may use this information to compare the ongoing costs of investing in the Fund and other funds. To do so, compare this 5% hypothetical example with the 5% hypothetical examples that appear in the shareholder reports of the other funds. Please note that the expenses shown in the table are meant to highlight your ongoing costs only and do not reflect any transactional costs, such as redemption fees. Therefore, the second line of the table is useful in comparing ongoing costs only, and will not help you determine the relative total costs of owning different funds. In addition, if these transactional costs were included, your costs would have been higher.
| | Beginning Account | Ending Account | Expenses Paid During |
| | Value 1/1/13 | Value 6/30/13 | Period 1/1/13-6/30/13* |
Actual+(1) | $1,000.00 | $1,003.20 | $7.60 |
Hypothetical++(2) | $1,000.00 | $1,017.21 | $7.65 |
| + | Excluding dividends on securities sold short, borrowing expense on securities sold short and interest expense, your actual cost of investment in the Fund would be $6.41. |
| ++ | Excluding dividends on securities sold short, borrowing expense on securities sold short and interest expense, your hypothetical cost of investment in the Fund would be $6.45. |
| * | Expenses are equal to the Fund’s annualized expense ratio of 1.53%, multiplied by the average account value over the period, multiplied by 181/365 (to reflect the one-half year period). |
| (1) | Ending account values and expenses paid during the period based on a 0.32% return. This actual return is net of expenses. |
| (2) | Ending account values and expenses paid during period based on a 5.00% annual return before expenses. |
The Merger Fund
SCHEDULE OF INVESTMENTS
June 30, 2013
(Unaudited)
| Shares | | | | Value | |
| | | | |
| COMMON STOCKS — 72.82% | | | |
| | | | | | |
| | | ADVERTISING — 2.87% | | | |
| | 1,487,231 | | Arbitron, Inc. (i) | | $ | 69,081,880 | |
| | 1,406,300 | | Lamar Advertising Company Class A (a)(e) | | | 61,033,420 | |
| | | | | | | 130,115,300 | |
| | | | APPLICATION SOFTWARE — 0.61% | | | | |
| | 2,511,600 | | TiVo, Inc. (a)(e) | | | 27,753,180 | |
| | | | | | | | |
| | | | AUTOMOBILE MANUFACTURERS — 2.16% | | | | |
| | 2,944,700 | | General Motors Co. (a)(e) | | | 98,087,957 | |
| | | | | | | | |
| | | | AUTOMOTIVE RETAIL — 0.03% | | | | |
| | 48,034 | | CST Brands, Inc. (a) | | | 1,479,928 | |
| | | | | | | | |
| | | | BIOTECHNOLOGY — 0.58% | | | | |
| | 1,858,600 | | Elan Corporation plc — ADR (a)(e) | | | 26,280,604 | |
| | | | | | | | |
| | | | BROADCASTING & CABLE TV — 2.78% | | | | |
| | 2,205,394 | | Astral Media, Inc. Class A (b) | | | 104,765,127 | |
| | 303,100 | | Discovery Communications, Inc. Class C (a) | | | 21,113,946 | |
| | | | | | | 125,879,073 | |
| | | | CABLE & SATELLITE TV — 2.59% | | | | |
| | 1,687,702 | | Comcast Corporation Special Class A | | | 66,951,138 | |
| | 529,600 | | DISH Network Corporation Class A (e) | | | 22,518,592 | |
| | 200,207 | | Liberty Global plc Class A (a)(b)(e) | | | 14,831,367 | |
| | 189,807 | | Liberty Global plc Series C (a)(b) | | | 12,885,971 | |
| | | | | | | 117,187,068 | |
| | | | CASINOS & GAMING — 1.95% | | | | |
| | 163,260 | | Ameristar Casinos, Inc. | | | 4,292,105 | |
| | 232,400 | | Penn National Gaming, Inc. (a)(e) | | | 12,284,664 | |
| | 2,806,813 | | WMS Industries, Inc. (a)(i) | | | 71,601,800 | |
| | | | | | | 88,178,569 | |
| | | | COAL & CONSUMABLE FUELS — 0.27% | | | | |
| | 4,810,958 | | Uranium One, Inc. (a)(b) | | | 12,534,016 | |
| | | | | | | | |
| | | | COMPUTER HARDWARE — 0.63% | | | | |
| | 2,149,431 | | Dell, Inc. | | | 28,694,904 | |
| | | | | | | | |
| | | | COMPUTER STORAGE & PERIPHERALS — 0.11% | | | | |
| | 499,905 | | Intermec, Inc. (a) | | | 4,914,066 | |
The accompanying notes are an integral part of these financial statements.
The Merger Fund
SCHEDULE OF INVESTMENTS (continued)
June 30, 2013
(Unaudited)
| Shares | | | | Value | |
| | | | | | |
| | | CONSUMER ELECTRONICS — 0.42% | | | |
| | 896,700 | | Sony Corporation — ADR (e) | | $ | 19,001,073 | |
| | | | | | | | |
| | | | CONSUMER FINANCE — 0.86% | | | | |
| | 1,708,100 | | SLM Corporation (e) | | | 39,047,166 | |
| | | | | | | | |
| | | | DATA PROCESSING & OUTSOURCED SERVICES — 0.10% | | | | |
| | 139,271 | | Lender Processing Services, Inc. | | | 4,505,417 | |
| | | | | | | | |
| | | | DISTILLERS & VINTNERS — 1.12% | | | | |
| | 977,000 | | Constellation Brands, Inc. Class A (a)(e) | | | 50,921,240 | |
| | | | | | | | |
| | | | DIVERSIFIED CHEMICALS — 0.87% | | | | |
| | 2,370,904 | | Huntsman Corporation (e) | | | 39,262,170 | |
| | | | | | | | |
| | | | DIVERSIFIED METALS & MINING — 0.53% | | | | |
| | 853,518 | | Freeport-McMoRan Copper & Gold, Inc. (e) | | | 23,565,632 | |
| | 310,134 | | Pilot Gold, Inc. (a)(b) | | | 235,911 | |
| | | | | | | 23,801,543 | |
| | | | | | | | |
| | | | ELECTRIC UTILITIES — 2.20% | | | | |
| | 4,258,300 | | NV Energy, Inc. | | | 99,899,718 | |
| | | | | | | | |
| | | | HEALTH CARE FACILITIES — 0.70% | | | | |
| | 1,529,067 | | Vanguard Health Systems, Inc. (a) | | | 31,712,850 | |
| | | | | | | | |
| | | | INDUSTRIAL MACHINERY — 2.97% | | | | |
| | 769,400 | | Dover Corporation (e) | | | 59,751,604 | |
| | 46,552 | | Gardner Denver, Inc. | | | 3,499,779 | |
| | 1,280,933 | | Ingersoll-Rand plc (b)(e) | | | 71,117,400 | |
| | | | | | | 134,368,783 | |
| | | | | | | | |
| | | | INTEGRATED OIL & GAS — 5.94% | | | | |
| | 1,932,700 | | BP plc — ADR (e) | | | 80,670,898 | |
| | 1,738,200 | | Hess Corporation (e) | | | 115,572,918 | |
| | 757,600 | | Murphy Oil Corporation (e) | | | 46,130,264 | |
| | 302,800 | | Occidental Petroleum Corporation (e) | | | 27,018,844 | |
| | | | | | | 269,392,924 | |
| | | | | | | | |
| | | | INTEGRATED TELECOMMUNICATION SERVICES — 0.09% | | | | |
| | 77,300 | | AT&T, Inc. (e) | | | 2,736,420 | |
| | 37,100 | | CenturyLink, Inc. | | | 1,311,485 | |
| | | | | | | 4,047,905 | |
| | | | | | | | |
| | | | INTERNET RETAIL — 0.17% | | | | |
| | 92,768 | | Liberty Ventures (a) | | | 7,886,208 | |
The accompanying notes are an integral part of these financial statements.
The Merger Fund
SCHEDULE OF INVESTMENTS (continued)
June 30, 2013
(Unaudited)
| Shares | | | | Value | |
| | | | | | |
| | | INTERNET SOFTWARE & SERVICES — 1.62% | | | |
| | 366,200 | | Equinix, Inc. (a)(e) | | $ | 67,644,464 | |
| | 176,016 | | ExactTarget, Inc. (a) | | | 5,935,260 | |
| | | | | | | 73,579,724 | |
| | | | | | | | |
| | | | LIFE SCIENCES TOOLS & SERVICES — 3.47% | | | | |
| | 2,124,102 | | Life Technologies Corporation (a) | | | 157,204,789 | |
| | | | | | | | |
| | | | MOVIES & ENTERTAINMENT — 2.74% | | | | |
| | 1,875,992 | | News Corporation Class A (a)(e) | | | 61,157,339 | |
| | 1,924,208 | | News Corporation Class B (a) | | | 63,152,507 | |
| | | | | | | 124,309,846 | |
| | | | | | | | |
| | | | MULTI-LINE INSURANCE — 1.96% | | | | |
| | 1,985,100 | | American International Group, Inc. | | | 88,733,970 | |
| | | | | | | | |
| | | | OIL & GAS DRILLING — 1.86% | | | | |
| | 1,292,100 | | Noble Corporation (b)(e) | | | 48,557,118 | |
| | 744,600 | | Transocean, Ltd. (b) | | | 35,703,570 | |
| | | | | | | 84,260,688 | |
| | | | | | | | |
| | | | OIL & GAS EQUIPMENT & SERVICES — 2.00% | | | | |
| | 109,013 | | Lufkin Industries, Inc. | | | 9,644,380 | |
| | 876,900 | | Oil States International, Inc. (a)(e) | | | 81,236,016 | |
| | | | | | | 90,880,396 | |
| | | | | | | | |
| | | | OIL & GAS EXPLORATION & PRODUCTION — 2.32% | | | | |
| | 719,200 | | Anadarko Petroleum Corporation (e) | | | 61,800,856 | |
| | 1,023,100 | | Berry Petroleum Company (e) | | | 43,297,592 | |
| | | | | | | 105,098,448 | |
| | | | | | | | |
| | | | OIL & GAS REFINING & MARKETING — 0.60% | | | | |
| | 781,200 | | Valero Energy Corporation (e) | | | 27,162,324 | |
| | | | | | | | |
| | | | OIL & GAS STORAGE & TRANSPORTATION — 1.42% | | | | |
| | 188,681 | | Kinder Morgan Energy Partners, LP | | | 16,113,357 | |
| | 1,492,400 | | Williams Companies, Inc. (e) | | | 48,458,228 | |
| | | | | | | 64,571,585 | |
| | | | | | | | |
| | | | PACKAGED FOODS & MEATS — 2.91% | | | | |
| | 1,627,586 | | DE Master Blenders 1753 NV (a)(b) | | | 26,057,985 | |
| | 551,200 | | Dean Foods Company (a)(e) | | | 5,523,024 | |
| | 2,467,172 | | Smithfield Foods, Inc. (a)(e) | | | 80,799,883 | |
The accompanying notes are an integral part of these financial statements.
The Merger Fund
SCHEDULE OF INVESTMENTS (continued)
June 30, 2013
(Unaudited)
| Shares | | | | Value | |
| | | | | | |
| | | PACKAGED FOODS & MEATS — 2.91% (CONTINUED) | | | |
| | 1,262,819 | | WhiteWave Foods Company Class B (a) | | $ | 19,194,849 | |
| | | | | | | 131,575,741 | |
| | | | | | | | |
| | | | PAPER PRODUCTS — 1.20% | | | | |
| | 1,228,000 | | International Paper Company (e) | | | 54,412,680 | |
| | | | | | | | |
| | | | PHARMACEUTICALS — 4.75% | | | | |
| | 812,500 | | Eli Lilly & Company (e) | | | 39,910,000 | |
| | 3,000 | | Merck & Co., Inc. | | | 139,350 | |
| | 3,791,769 | | Pfizer, Inc. (e) | | | 106,207,450 | |
| | 3,486,500 | | Warner Chilcott plc (b)(e) | | | 69,311,620 | |
| | | | | | | 215,568,420 | |
| | | | REGIONAL BANKS — 0.13% | | | | |
| | 181,900 | | BB&T Corporation (e) | | | 6,162,772 | |
| | | | | | | | |
| | | | REITS — 1.51% | | | | |
| | 1,620,293 | | Colonial Properties Trust (d) | | | 39,081,467 | |
| | 464,340 | | CommonWealth REIT (e) | | | 10,735,541 | |
| | 650,600 | | Weyerhaeuser Company (e) | | | 18,535,594 | |
| | | | | | | 68,352,602 | |
| | | | | | | | |
| | | | SECURITY & ALARM SERVICES — 0.43% | | | | |
| | 582,075 | | Corrections Corporation of America (e) | | | 19,714,880 | |
| | | | | | | | |
| | | | SPECIALIZED CONSUMER SERVICES — 0.64% | | | | |
| | 2,209,869 | | Stewart Enterprises, Inc. Class A | | | 28,927,185 | |
| | | | | | | | |
| | | | SPECIALIZED FINANCE — 3.32% | | | | |
| | 3,636,807 | | NYSE Euronext (g) | | | 150,563,810 | |
| | | | | | | | |
| | | | SPECIALTY CHEMICALS — 1.43% | | | | |
| | 773,900 | | Ashland, Inc. (e) | | | 64,620,650 | |
| | | | | | | | |
| | | | SPECIALTY STORES — 0.68% | | | | |
| | 3,034,210 | | OfficeMax, Inc. (e) | | | 31,039,968 | |
| | | | | | | | |
| | | | SYSTEMS SOFTWARE — 1.49% | | | | |
| | 1,496,232 | | BMC Software, Inc. (a)(e) | | | 67,539,912 | |
| | | | | | | | |
| | | | THRIFTS & MORTGAGE FINANCE — 1.97% | | | | |
| | 9,745,612 | | Hudson City Bancorp, Inc. | | | 89,269,806 | |
| | | | | | | | |
| | | | WIRELESS TELECOMMUNICATION SERVICES — 3.82% | | | | |
| | 692,511 | | Clearwire Corporation Class A (a)(e) | | | 3,448,705 | |
| | | | | | | | |
The accompanying notes are an integral part of these financial statements.
The Merger Fund
SCHEDULE OF INVESTMENTS (continued)
June 30, 2013
(Unaudited)
| Shares | | | | Value | |
| | | | | | |
| | | WIRELESS TELECOMMUNICATION | | | |
| | | SERVICES — 3.82% (continued) | | | |
| | 15,597,022 | | Sprint Nextel Corporation (a)(e) | | $ | 109,491,095 | |
| | 2,416,400 | | T-Mobile U.S., Inc. (a)(e) | | | 59,950,884 | |
| | | | | | | 172,890,684 | |
| | | | TOTAL COMMON STOCKS | | | | |
| | | | (Cost $3,219,444,897) | | | 3,301,392,542 | |
| | | | | |
| WARRANTS — 0.00% | | | | |
| | 142,642 | | Kinross Gold Corporation (a)(b) | | | 11,528 | |
| | | | TOTAL WARRANTS | | | | |
| | | | (Cost $540,028) | | | 11,528 | |
| | | | | | | | |
| Principal Amount | | | | | | |
| | | | | |
| CORPORATE BONDS — 5.20% | | | | |
| | | | American Airlines, Inc. | | | | |
| $ | 48,838,000 | | 10.500%, 10/15/2012 (j) | | | 58,727,695 | |
| | 27,566,000 | | 7.500%, 3/15/2016 | | | | |
| | | | (Acquired 01/25/13 to 06/25/13, Cost $31,737,204) (h) | | | 32,183,305 | |
| | | | Clearwire Corporation | | | | |
| | 49,374,000 | | 12.000%, 12/1/2015 | | | | |
| | | | (Acquired 04/17/13 to 05/03/13, Cost $52,792,433) (h) | | | 52,583,310 | |
| | | | Dean Foods Company | | | | |
| | 6,685,000 | | 9.750%, 12/15/2018 | | | 7,587,475 | |
| | | | Lender Processing Services, Inc. | | | | |
| | 26,175,000 | | 5.750%, 4/15/2023 | | | 27,941,812 | |
| | | | McMoRan Exploration Company | | | | |
| | 13,460,000 | | 11.875%, 11/15/2014 | | | 13,999,840 | |
| | | | MetroPCS Wireless, Inc. | | | | |
| | 10,338,000 | | 6.625%, 11/15/2020 | | | 10,764,443 | |
| | | | Oil States International, Inc. | | | | |
| | 7,452,000 | | 5.125%, 1/15/2023 (Acquired 06/12/13, Cost $7,953,522) (h) | | | 7,824,600 | |
| | | | Vanguard Health Systems, Inc. | | | | |
| | 22,488,000 | | 7.750%, 2/1/2019 | | | 23,949,720 | |
| | | | TOTAL CORPORATE BONDS | | | | |
| | | | (Cost $236,404,791) | | | 235,562,200 | |
The accompanying notes are an integral part of these financial statements.
The Merger Fund
SCHEDULE OF INVESTMENTS (continued)
June 30, 2013
(Unaudited)
| Contracts (100 shares per contract) | | Value | |
| | | | |
| PURCHASED PUT OPTIONS — 0.57% | | | |
| | | | | | |
| | | American International Group, Inc. | | | |
| | 3,872 | | Expiration: July 2013, Exercise Price: $38.00 | | $ | 19,360 | |
| | 8,511 | | Expiration: August 2013, Exercise Price: $35.00 | | | 123,410 | |
| | 5,532 | | Expiration: August 2013, Exercise Price: $38.00 | | | 168,726 | |
| | | | Anadarko Petroleum Corporation | | | | |
| | 1,113 | | Expiration: August 2013, Exercise Price: $60.00 | | | 12,243 | |
| | 4,807 | | Expiration: August 2013, Exercise Price: $70.00 | | | 151,421 | |
| | 1,272 | | Expiration: August 2013, Exercise Price: $77.50 | | | 138,648 | |
| | | | Ashland, Inc. | | | | |
| | 5,136 | | Expiration: July 2013, Exercise Price: $75.00 | | | 102,720 | |
| | 1,055 | | Expiration: October 2013, Exercise Price: $70.00 | | | 139,788 | |
| | | | AT&T, Inc. | | | | |
| | 773 | | Expiration: September 2013, Exercise Price: $31.00 | | | 17,779 | |
| | | | BB&T Corporation | | | | |
| | 1,364 | | Expiration: September 2013, Exercise Price: $28.00 | | | 22,506 | |
| | | | Berry Petroleum Company | | | | |
| | 2,071 | | Expiration: July 2013, Exercise Price: $40.00 | | | 134,615 | |
| | 8,160 | | Expiration: August 2013, Exercise Price: $35.00 | | | 285,600 | |
| | | | BP plc — ADR | | | | |
| | 15,461 | | Expiration: October 2013, Exercise Price: $37.00 | | | 1,175,036 | |
| | | | CenturyLink, Inc. | | | | |
| | 8,439 | | Expiration: July 2013, Exercise Price: $29.00 | | | 21,098 | |
| | | | CommonWealth REIT | | | | |
| | 4,643 | | Expiration: July 2013, Exercise Price: $17.50 | | | 34,823 | |
| | | | Consumer Staples Select Sector SPDR Fund | | | | |
| | 2,789 | | Expiration: August 2013, Exercise Price: $39.00 | | | 156,184 | |
| | | | Corrections Corporation of America | | | | |
| | 2,019 | | Expiration: September 2013, Exercise Price: $28.00 | | | 50,475 | |
| | | | Dean Foods Company | | | | |
| | 5,512 | | Expiration: September 2013, Exercise Price: $13.00 | | | 68,900 | |
| | | | DISH Network Corporation Class A | | | | |
| | 3,514 | | Expiration: September 2013, Exercise Price: $32.00 | | | 158,130 | |
| | | | Dover Corporation | | | | |
| | 1,950 | | Expiration: July 2013, Exercise Price: $65.00 | | | 14,625 | |
| | 4,029 | | Expiration: September 2013, Exercise Price: $65.00 | | | 211,523 | |
| | | | Elan Corporation plc — ADR | | | | |
| | 9,294 | | Expiration: July 2013, Exercise Price: $11.00 | | | 46,470 | |
| | 7,434 | | Expiration: August 2013, Exercise Price: $11.00 | | | 111,510 | |
The accompanying notes are an integral part of these financial statements.
The Merger Fund
SCHEDULE OF INVESTMENTS (continued)
June 30, 2013
(Unaudited)
| Contracts (100 shares per contract) | | Value | |
| | | | | | |
| | | Eli Lilly & Company | | | |
| | 8,125 | | Expiration: July 2013, Exercise Price: $47.00 | | $ | 227,500 | |
| | | | Equinix, Inc. | | | | |
| | 222 | | Expiration: July 2013, Exercise Price: $180.00 | | | 88,800 | |
| | 464 | | Expiration: July 2013, Exercise Price: $185.00 | | | 283,040 | |
| | 504 | | Expiration: September 2013, Exercise Price: $165.00 | | | 277,200 | |
| | 1,789 | | Expiration: September 2013, Exercise Price: $170.00 | | | 1,216,520 | |
| | 235 | | Expiration: September 2013, Exercise Price: $175.00 | | | 203,275 | |
| | 397 | | Expiration: September 2013, Exercise Price: $180.00 | | | 424,790 | |
| | | | Financial Select Sector SPDR Fund | | | | |
| | 3,718 | | Expiration: August 2013, Exercise Price: $18.00 | | | 66,924 | |
| | 2,789 | | Expiration: August 2013, Exercise Price: $19.00 | | | 105,982 | |
| | | | Freeport-McMoRan Copper & Gold, Inc. | | | | |
| | 2,990 | | Expiration: August 2013, Exercise Price: $20.00 | | | 17,940 | |
| | | | General Motors Co. | | | | |
| | 10,428 | | Expiration: September 2013, Exercise Price: $21.00 | | | 67,782 | |
| | 63 | | Expiration: September 2013, Exercise Price: $24.00 | | | 693 | |
| | 4,869 | | Expiration: September 2013, Exercise Price: $25.00 | | | 73,035 | |
| | 7,316 | | Expiration: September 2013, Exercise Price: $26.00 | | | 146,320 | |
| | 6,771 | | Expiration: September 2013, Exercise Price: $27.00 | | | 186,202 | |
| | | | Hess Corporation | | | | |
| | 975 | | Expiration: July 2013, Exercise Price: $62.50 | | | 48,263 | |
| | 8,770 | | Expiration: August 2013, Exercise Price: $60.00 | | | 754,220 | |
| | 7,637 | | Expiration: August 2013, Exercise Price: $62.50 | | | 1,053,906 | |
| | | | Huntsman Corporation | | | | |
| | 5,652 | | Expiration: August 2013, Exercise Price: $14.00 | | | 113,040 | |
| | 16,551 | | Expiration: August 2013, Exercise Price: $15.00 | | | 662,040 | |
| | | | Ingersoll-Rand plc | | | | |
| | 11,136 | | Expiration: September 2013, Exercise Price: $40.00 | | | 111,360 | |
| | 1,674 | | Expiration: September 2013, Exercise Price: $45.00 | | | 58,590 | |
| | | | International Paper Company | | | | |
| | 2,055 | | Expiration: July 2013, Exercise Price: $37.00 | | | 13,357 | |
| | 8,195 | | Expiration: July 2013, Exercise Price: $40.00 | | | 139,315 | |
| | 2,030 | | Expiration: October 2013, Exercise Price: $37.00 | | | 158,340 | |
The accompanying notes are an integral part of these financial statements.
The Merger Fund
SCHEDULE OF INVESTMENTS (continued)
June 30, 2013
(Unaudited)
| Contracts (100 shares per contract) | | Value | |
| | | | |
| | | Lamar Advertising Company Class A | | | |
| | 1,311 | | Expiration: July 2013, Exercise Price: $31.00 | | $ | 9,832 | |
| | 3,011 | | Expiration: July 2013, Exercise Price: $37.00 | | | 22,583 | |
| | 1,583 | | Expiration: July 2013, Exercise Price: $38.00 | | | 15,830 | |
| | 4,766 | | Expiration: July 2013, Exercise Price: $40.00 | | | 95,320 | |
| | 623 | | Expiration: August 2013, Exercise Price: $39.00 | | | 41,741 | |
| | 3,391 | | Expiration: October 2013, Exercise Price: $35.00 | | | 228,892 | |
| | | | Materials Select Sector SPDR Trust | | | | |
| | 317 | | Expiration: September 2013, Exercise Price: $41.00 | | | 102,232 | |
| | | | Merck & Co., Inc. | | | | |
| | 1,494 | | Expiration: July 2013, Exercise Price: $39.00 | | | 2,241 | |
| | | | Murphy Oil Corporation | | | | |
| | 3,788 | | Expiration: July 2013, Exercise Price: $52.50 | | | 18,940 | |
| | | | News Corporation Class A | | | | |
| | 14,123 | | Expiration: July 2013, Exercise Price: $25.00 | | | 35,308 | |
| | 6,489 | | Expiration: October 2013, Exercise Price: $24.00 | | | 81,112 | |
| | 5,625 | | Expiration: October 2013, Exercise Price: $27.00 | | | 210,937 | |
| | 8,122 | | Expiration: October 2013, Exercise Price: $28.00 | | | 406,100 | |
| | | | Noble Corporation | | | | |
| | 12,921 | | Expiration: September 2013, Exercise Price: $28.00 | | | 290,723 | |
| | | | Occidental Petroleum Corporation | | | | |
| | 3,028 | | Expiration: August 2013, Exercise Price: $75.00 | | | 92,354 | |
| | | | Oil States International, Inc. | | | | |
| | 1,093 | | Expiration: September 2013, Exercise Price: $75.00 | | | 128,427 | |
| | 4,466 | | Expiration: September 2013, Exercise Price: $80.00 | | | 893,200 | |
| | 1,498 | | Expiration: September 2013, Exercise Price: $85.00 | | | 479,360 | |
| | | | Penn National Gaming, Inc. | | | | |
| | 2,324 | | Expiration: August 2013, Exercise Price: $45.00 | | | 75,530 | |
| | | | Pfizer, Inc. | | | | |
| | 3,128 | | Expiration: July 2013, Exercise Price: $25.00 | | | 9,384 | |
| | 10,423 | | Expiration: July 2013, Exercise Price: $26.00 | | | 72,961 | |
| | 5,926 | | Expiration: July 2013, Exercise Price: $35.00 | | | 4,142,274 | |
| | 3,251 | | Expiration: September 2013, Exercise Price: $23.00 | | | 42,263 | |
| | 3,250 | | Expiration: September 2013, Exercise Price: $24.00 | | | 60,125 | |
| | 12,163 | | Expiration: September 2013, Exercise Price: $25.00 | | | 328,401 | |
| | | | SLM Corporation | | | | |
| | 5,738 | | Expiration: July 2013, Exercise Price: $13.00 | | | 5,738 | |
| | 4,493 | | Expiration: July 2013, Exercise Price: $16.00 | | | 4,493 | |
| | 13,989 | | Expiration: July 2013, Exercise Price: $18.00 | | | 62,950 | |
The accompanying notes are an integral part of these financial statements.
The Merger Fund
SCHEDULE OF INVESTMENTS (continued)
June 30, 2013
(Unaudited)
| Contracts (100 shares per contract) | | Value | |
| | | | | | |
| | | Sony Corporation — ADR | | | |
| | 7,014 | | Expiration: July 2013, Exercise Price: $19.00 | | $ | 154,308 | |
| | 1,953 | | Expiration: July 2013, Exercise Price: $20.00 | | | 80,073 | |
| | | | SPDR S&P 500 ETF Trust | | | | |
| | 8,357 | | Expiration: July 2013, Exercise Price: $160.00 | | | 1,871,968 | |
| | 1,488 | | Expiration: July 2013, Exercise Price: $162.00 | | | 478,392 | |
| | 9,291 | | Expiration: August 2013, Exercise Price: $157.00 | | | 2,387,787 | |
| | | | TiVo, Inc. | | | | |
| | 3,569 | | Expiration: July 2013, Exercise Price: $8.00 | | | 10,707 | |
| | 24,400 | | Expiration: July 2013, Exercise Price: $10.00 | | | 122,000 | |
| | | | T-Mobile U.S., Inc. | | | | |
| | 8,517 | | Expiration: August 2013, Exercise Price: $17.00 | | | 63,878 | |
| | | | Transocean, Ltd. | | | | |
| | 3,634 | | Expiration: August 2013, Exercise Price: $46.00 | | | 428,812 | |
| | 1,906 | | Expiration: August 2013, Exercise Price: $48.00 | | | 373,576 | |
| | 1,906 | | Expiration: August 2013, Exercise Price: $49.00 | | | 486,030 | |
| | | | Valero Energy Corporation | | | | |
| | 1,745 | | Expiration: August 2013, Exercise Price: $29.00 | | | 47,115 | |
| | 2,203 | | Expiration: September 2013, Exercise Price: $33.00 | | | 160,819 | |
| | 2,120 | | Expiration: September 2013, Exercise Price: $35.00 | | | 263,940 | |
| | | | Verizon Communications, Inc. | | | | |
| | 1,661 | | Expiration: July 2013, Exercise Price: $38.00 | | | 830 | |
| | | | Vivendi SA | | | | |
| | 20,302 | | Expiration: July 2013, Exercise Price: EUR 13.00 (k) | | | 79,279 | |
| | 2,324 | | Expiration: August 2013, Exercise Price: EUR 12.50 (k) | | | 21,174 | |
| | 9,432 | | Expiration: August 2013, Exercise Price: EUR 13.00 (k) | | | 135,048 | |
| | | | Warner Chilcott plc | | | | |
| | 32,459 | | Expiration: July 2013, Exercise Price: $16.00 | | | 243,442 | |
| | 2,406 | | Expiration: August 2013, Exercise Price: $16.00 | | | 24,060 | |
| | | | Weyerhaeuser Company | | | | |
| | 6,506 | | Expiration: October 2013, Exercise Price: $23.00 | | | 243,975 | |
| | | | Williams Companies, Inc. | | | | |
| | 14,924 | | Expiration: August 2013, Exercise Price: $28.00 | | | 328,328 | |
| | | | TOTAL PURCHASED PUT OPTIONS | | | | |
| | | | (Cost $37,067,397) | | | 25,828,816 | |
The accompanying notes are an integral part of these financial statements.
The Merger Fund
SCHEDULE OF INVESTMENTS (continued)
June 30, 2013
(Unaudited)
| Shares | | | | Value | |
| | | | |
| SHORT-TERM INVESTMENTS — 24.54% | | | |
| | 259,000,000 | | BlackRock Liquidity Funds TempFund Portfolio, 0.04% (c)(e) | | $ | 259,000,000 | |
| | 259,000,000 | | Fidelity Institutional Government Portfolio, 0.01% (c)(d) | | | 259,000,000 | |
| | 76,573,835 | | Fidelity Institutional Money Market Portfolio, 0.08% (c)(d) | | | 76,573,835 | |
| | 259,000,000 | | Goldman Sachs Financial Square | | | | |
| | | | Money Market Fund, 0.07% (c)(f) | | | 259,000,000 | |
| | 259,000,000 | | The Liquid Asset Portfolio, 0.09% (c)(g) | | | 259,000,000 | |
| | | | TOTAL SHORT-TERM INVESTMENTS | | | | |
| | | | (Cost $1,112,573,835) | | | 1,112,573,835 | |
| | | | TOTAL INVESTMENTS | | | | |
| | | | (Cost $4,606,030,948) — 103.13% | | $ | 4,675,368,921 | |
ADR — American Depository Receipt
ETF — Exchange-Traded Fund
EUR — Euro
plc — Public Limited Company
REIT — Real Estate Investment Trust
| (a) | Non-income producing security. |
| (c) | The rate quoted is the annualized seven-day yield as of June 30, 2013. |
| (d) | All or a portion of the shares have been committed as collateral for open securities sold short. |
| (e) | All or a portion of the shares have been committed as collateral for written option contracts. |
| (f) | All or a portion of the shares have been committed as collateral for swap contracts. |
| (g) | All or a portion of the shares have been committed as collateral for forward currency exchange contracts. |
| (h) | Security exempt from registration under Rule 144A of the Securities Act of 1933. These securities may be resold in transactions exempt from registration normally to qualified institutional buyers. As of June 30, 2013, these securities represented 2.04% of total net assets. |
| (j) | Default or other conditions exist and the security is not presently accruing income. |
| (k) | Level 2 Security. Please see Note 2 of the Notes to the Financial Statements. |
The Global Industry Classification Standard (GICS®) was developed by and/or is the exclusive property of MSCI, Inc. and Standard & Poor Financial Services LLC (“S&P”). GICS is a service mark of MSCI and S&P and has been licensed for use by U.S. Bancorp Funds Services, LLC.
The accompanying notes are an integral part of these financial statements.
The Merger Fund
SCHEDULE OF SECURITIES SOLD SHORT
June 30, 2013
(Unaudited)
| Shares | | | | Value | |
| | | | | | | | |
| | 1,687,676 | | Comcast Corporation Special Class A | | $ | 70,679,871 | |
| | 303,100 | | Discovery Communications, Inc. Class A | | | 23,402,351 | |
| | 58,170 | | Expedia, Inc. | | | 3,498,925 | |
| | 619,424 | | IntercontinentalExchange, Inc. | | | 110,108,810 | |
| | 188,787 | | Kinder Morgan Management, LLC | | | 15,780,742 | |
| | 715,211 | | M&T Bank Corporation | | | 79,924,829 | |
| | 583,306 | | Mid-America Apartment Communities, Inc. | | | 39,530,648 | |
| | 1,145,694 | | Office Depot, Inc. | | | 4,433,836 | |
| | 79,647 | | TripAdvisor, Inc. | | | 4,848,113 | |
| | 888,625 | | WhiteWave Foods Company Class A | | | 14,440,156 | |
| | | | TOTAL SECURITIES SOLD SHORT | | | | |
| | | | (Proceeds $325,343,139) | | $ | 366,648,281 | |
The accompanying notes are an integral part of these financial statements.
The Merger Fund
SCHEDULE OF OPTIONS WRITTEN
June 30, 2013
(Unaudited)
| Contracts (100 shares per contract) | | Value | |
| | | | |
| CALL OPTIONS WRITTEN | | | |
| | | American International Group, Inc. | | | |
| | 5,808 | | Expiration: July 2013, Exercise Price: $43.00 | | $ | 1,318,416 | |
| | 8,511 | | Expiration: August 2013, Exercise Price: $40.00 | | | 4,468,275 | |
| | 5,532 | | Expiration: August 2013, Exercise Price: $43.00 | | | 1,665,132 | |
| | | | Anadarko Petroleum Corporation | | | | |
| | 1,113 | | Expiration: August 2013, Exercise Price: $72.50 | | | 1,569,330 | |
| | 4,807 | | Expiration: August 2013, Exercise Price: $82.50 | | | 2,860,165 | |
| | 1,272 | | Expiration: August 2013, Exercise Price: $85.00 | | | 572,400 | |
| | | | Ashland, Inc. | | | | |
| | 6,684 | | Expiration: July 2013, Exercise Price: $85.00 | | | 902,340 | |
| | 1,055 | | Expiration: October 2013, Exercise Price: $80.00 | | | 727,950 | |
| | | | AT&T, Inc. | | | | |
| | 773 | | Expiration: September 2013, Exercise Price: $36.00 | | | 51,018 | |
| | | | BB&T Corporation | | | | |
| | 1,819 | | Expiration: September 2013, Exercise Price: $32.00 | | | 434,741 | |
| | | | Berry Petroleum Company | | | | |
| | 2,071 | | Expiration: July 2013, Exercise Price: $45.00 | | | 93,195 | |
| | 8,160 | | Expiration: August 2013, Exercise Price: $45.00 | | | 775,200 | |
| | | | BMC Software, Inc. | | | | |
| | 7 | | Expiration: August 2013, Exercise Price: $47.00 | | | 17 | |
| | | | BP plc — ADR | | | | |
| | 19,327 | | Expiration: October 2013, Exercise Price: $41.00 | | | 4,483,864 | |
| | | | CenturyLink, Inc. | | | | |
| | 371 | | Expiration: July 2013, Exercise Price: $34.00 | | | 57,505 | |
| | | | Clearwire Corporation Class A | | | | |
| | 2,279 | | Expiration: July 2013, Exercise Price: $4.50 | | | 113,950 | |
| | 4,646 | | Expiration: September 2013, Exercise Price: $5.00 | | | 23,230 | |
| | | | CommonWealth REIT | | | | |
| | 3,250 | | Expiration: July 2013, Exercise Price: $20.00 | | | 1,040,000 | |
| | | | Constellation Brands, Inc. Class A | | | | |
| | 9,770 | | Expiration: July 2013, Exercise Price: $45.00 | | | 6,966,010 | |
| | | | Corrections Corporation of America | | | | |
| | 4,975 | | Expiration: September 2013, Exercise Price: $37.00 | | | 1,691,500 | |
| | | | Dean Foods Company | | | | |
| | 5,512 | | Expiration: September 2013, Exercise Price: $17.00 | | | 1,708,720 | |
| | | | DISH Network Corporation Class A | | | | |
| | 5,296 | | Expiration: September 2013, Exercise Price: $36.00 | | | 4,024,960 | |
The accompanying notes are an integral part of these financial statements.
The Merger Fund
SCHEDULE OF OPTIONS WRITTEN (continued)
June 30, 2013
(Unaudited)
| Contracts (100 shares per contract) | | Value | |
| | | | | | |
| | | Dover Corporation | | | |
| | 2,785 | | Expiration: July 2013, Exercise Price: $75.00 | | $ | 1,044,375 | |
| | 4,909 | | Expiration: September 2013, Exercise Price: $75.00 | | | 2,429,955 | |
| | | | Elan Corporation plc — ADR | | | | |
| | 9,294 | | Expiration: July 2013, Exercise Price: $13.00 | | | 1,254,690 | |
| | 9,292 | | Expiration: August 2013, Exercise Price: $13.00 | | | 1,328,756 | |
| | | | Eli Lilly & Company | | | | |
| | 8,125 | | Expiration: July 2013, Exercise Price: $55.00 | | | 40,625 | |
| | | | Equinix, Inc. | | | | |
| | 111 | | Expiration: July 2013, Exercise Price: $195.00 | | | 24,975 | |
| | 1,041 | | Expiration: September 2013, Exercise Price: $180.00 | | | 1,603,140 | |
| | 963 | | Expiration: September 2013, Exercise Price: $185.00 | | | 1,271,160 | |
| | 235 | | Expiration: September 2013, Exercise Price: $190.00 | | | 256,150 | |
| | 508 | | Expiration: September 2013, Exercise Price: $195.00 | | | 462,280 | |
| | 340 | | Expiration: September 2013, Exercise Price: $200.00 | | | 248,200 | |
| | | | Freeport-McMoRan Copper & Gold, Inc. | | | | |
| | 2,990 | | Expiration: August 2013, Exercise Price: $26.00 | | | 645,840 | |
| | | | General Motors Co. | | | | |
| | 3,271 | | Expiration: September 2013, Exercise Price: $26.00 | | | 2,485,960 | |
| | 7,157 | | Expiration: September 2013, Exercise Price: $27.00 | | | 4,723,620 | |
| | 4,932 | | Expiration: September 2013, Exercise Price: $30.00 | | | 1,997,460 | |
| | 7,316 | | Expiration: September 2013, Exercise Price: $31.00 | | | 2,395,990 | |
| | 6,771 | | Expiration: September 2013, Exercise Price: $33.00 | | | 1,364,356 | |
| | | | Hess Corporation | | | | |
| | 975 | | Expiration: July 2013, Exercise Price: $67.50 | | | 114,075 | |
| | 8,770 | | Expiration: August 2013, Exercise Price: $67.50 | | | 2,104,800 | |
| | 4,907 | | Expiration: August 2013, Exercise Price: $70.00 | | | 711,515 | |
| | | | Huntsman Corporation | | | | |
| | 2,038 | | Expiration: August 2013, Exercise Price: $17.00 | | | 163,040 | |
| | 20,165 | | Expiration: August 2013, Exercise Price: $18.00 | | | 1,008,250 | |
| | | | Ingersoll-Rand plc | | | | |
| | 3,860 | | Expiration: September 2013, Exercise Price: $50.00 | | | 2,431,800 | |
| | 8,950 | | Expiration: September 2013, Exercise Price: $52.50 | | | 3,938,000 | |
| | | | International Paper Company | | | | |
| | 2,055 | | Expiration: July 2013, Exercise Price: $42.00 | | | 554,850 | |
| | 8,195 | | Expiration: July 2013, Exercise Price: $45.00 | | | 631,015 | |
| | 2,030 | | Expiration: October 2013, Exercise Price: $42.00 | | | 832,300 | |
The accompanying notes are an integral part of these financial statements.
The Merger Fund
SCHEDULE OF OPTIONS WRITTEN (continued)
June 30, 2013
(Unaudited)
| Contracts (100 shares per contract) | | Value | |
| | | | | | |
| | | Lamar Advertising Company Class A | | | |
| | 4,594 | | Expiration: July 2013, Exercise Price: $41.00 | | $ | 1,251,865 | |
| | 2,442 | | Expiration: July 2013, Exercise Price: $45.00 | | | 122,100 | |
| | 623 | | Expiration: August 2013, Exercise Price: $42.00 | | | 182,228 | |
| | 4,703 | | Expiration: October 2013, Exercise Price: $41.00 | | | 2,210,410 | |
| | | | Liberty Global plc Class A | | | | |
| | 681 | | Expiration: July 2013, Exercise Price: $55.00 | | | 1,299,348 | |
| | 2,802 | | Expiration: July 2013, Exercise Price: $60.00 | | | 3,945,216 | |
| | 417 | | Expiration: August 2013, Exercise Price: $65.00 | | | 378,636 | |
| | | | M&T Bank Corporation | | | | |
| | 2 | | Expiration: July 2013, Exercise Price: $95.00 | | | 3,350 | |
| | 1,037 | | Expiration: October 2013, Exercise Price: $95.00 | | | 1,773,270 | |
| | | | Merck & Co., Inc. | | | | |
| | 30 | | Expiration: July 2013, Exercise Price: $44.00 | | | 7,890 | |
| | | | MetroPCS Wireless, Inc. | | | | |
| | 16,945 | | Expiration: August 2013, Exercise Price: $10.00 | | | 11,014,250 | |
| | 14,350 | | Expiration: August 2013, Exercise Price: $11.00 | | | 7,826,490 | |
| | | | Murphy Oil Corporation | | | | |
| | 7,576 | | Expiration: July 2013, Exercise Price: $57.50 | | | 3,068,280 | |
| | | | News Corporation Class A | | | | |
| | 14,123 | | Expiration: July 2013, Exercise Price: $30.00 | | | 3,813,210 | |
| | 6,489 | | Expiration: October 2013, Exercise Price: $30.00 | | | 2,271,150 | |
| | 2,840 | | Expiration: October 2013, Exercise Price: $31.00 | | | 788,100 | |
| | 14,550 | | Expiration: October 2013, Exercise Price: $32.00 | | | 3,128,250 | |
| | | | Noble Corporation | | | | |
| | 12,921 | | Expiration: September 2013, Exercise Price: $34.00 | | | 5,879,055 | |
| | | | Occidental Petroleum Corporation | | | | |
| | 3,028 | | Expiration: August 2013, Exercise Price: $85.00 | | | 1,831,940 | |
| | | | OfficeMax, Inc. | | | | |
| | 19,287 | | Expiration: August 2013, Exercise Price: $11.00 | | | 2,121,570 | |
| | 6,796 | | Expiration: August 2013, Exercise Price: $12.00 | | | 305,820 | |
| | | | Oil States International, Inc. | | | | |
| | 1,243 | | Expiration: September 2013, Exercise Price: $85.00 | | | 1,373,515 | |
| | 4,347 | | Expiration: September 2013, Exercise Price: $90.00 | | | 3,412,395 | |
| | 3,167 | | Expiration: September 2013, Exercise Price: $95.00 | | | 1,678,510 | |
| | | | Penn National Gaming, Inc. | | | | |
| | 2,324 | | Expiration: August 2013, Exercise Price: $50.00 | | | 906,360 | |
The accompanying notes are an integral part of these financial statements.
The Merger Fund
SCHEDULE OF OPTIONS WRITTEN (continued)
June 30, 2013
(Unaudited)
| Contracts (100 shares per contract) | | Value | |
| | | | | | |
| | | Pfizer, Inc. | | | |
| | 3,128 | | Expiration: July 2013, Exercise Price: $29.00 | | $ | 46,920 | |
| | 5,926 | | Expiration: July 2013, Exercise Price: $35.00 | | | 5,926 | |
| | 3,251 | | Expiration: September 2013, Exercise Price: $27.00 | | | 507,156 | |
| | 3,250 | | Expiration: September 2013, Exercise Price: $28.00 | | | 318,500 | |
| | 12,163 | | Expiration: September 2013, Exercise Price: $29.00 | | | 656,802 | |
| | | | SLM Corporation | | | | |
| | 3,168 | | Expiration: July 2013, Exercise Price: $19.00 | | | 1,251,360 | |
| | 13,913 | | Expiration: July 2013, Exercise Price: $20.00 | | | 4,097,378 | |
| | | | Smithfield Foods, Inc. | | | | |
| | 2,507 | | Expiration: July 2013, Exercise Price: $34.00 | | | 25,070 | |
| | 10,217 | | Expiration: October 2013, Exercise Price: $34.00 | | | 255,425 | |
| | | | Sony Corporation — ADR | | | | |
| | 7,014 | | Expiration: July 2013, Exercise Price: $21.00 | | | 701,400 | |
| | 1,953 | | Expiration: August 2013, Exercise Price: $22.00 | | | 207,018 | |
| | | | Sprint Nextel Corporation | | | | |
| | 19,834 | | Expiration: August 2013, Exercise Price: $7.00 | | | 317,344 | |
| | | | TiVo, Inc. | | | | |
| | 22,458 | | Expiration: July 2013, Exercise Price: $11.00 | | | 763,572 | |
| | 1,941 | | Expiration: July 2013, Exercise Price: $12.00 | | | 13,587 | |
| | | | T-Mobile U.S., Inc. | | | | |
| | 8,517 | | Expiration: August 2013, Exercise Price: $20.00 | | | 4,428,840 | |
| | | | Transocean, Ltd. | | | | |
| | 3,634 | | Expiration: August 2013, Exercise Price: $50.00 | | | 421,544 | |
| | 3,812 | | Expiration: August 2013, Exercise Price: $52.50 | | | 194,412 | |
| | | | Valero Energy Corporation | | | | |
| | 1,745 | | Expiration: August 2013, Exercise Price: $33.00 | | | 476,385 | |
| | 2,203 | | Expiration: September 2013, Exercise Price: $38.00 | | | 545,243 | |
| | 2,120 | | Expiration: September 2013, Exercise Price: $40.00 | | | 346,620 | |
| | | | Vivendi SA | | | | |
| | 20,302 | | Expiration: July 2013, Exercise Price: EUR 15.00 (a) | | | 475,676 | |
| | 2,324 | | Expiration: August 2013, Exercise Price: EUR 14.00 (a) | | | 263,177 | |
| | 9,432 | | Expiration: August 2013, Exercise Price: EUR 14.50 (a) | | | 687,518 | |
| | | | Warner Chilcott plc | | | | |
| | 32,459 | | Expiration: July 2013, Exercise Price: $19.00 | | | 2,921,310 | |
| | 2,406 | | Expiration: August 2013, Exercise Price: $19.00 | | | 336,840 | |
| | | | Weyerhaeuser Company | | | | |
| | 6,506 | | Expiration: October 2013, Exercise Price: $27.00 | | | 1,659,030 | |
| | | | | | | | |
The accompanying notes are an integral part of these financial statements.
The Merger Fund
SCHEDULE OF OPTIONS WRITTEN (continued)
June 30, 2013
(Unaudited)
| Contracts (100 shares per contract) | | Value | |
| | | | | | |
| | | Williams Companies, Inc. | | | |
| | 14,924 | | Expiration: August 2013, Exercise Price: $34.00 | | $ | 1,186,458 | |
| | | | | | | 155,318,814 | |
| PUT OPTIONS WRITTEN | | | | |
| | | | SPDR S&P 500 ETF Trust | | | | |
| | 6,501 | | Expiration: July 2013, Exercise Price: $155.00 | | | 578,589 | |
| | 9,291 | | Expiration: August 2013, Exercise Price: $151.00 | | | 1,170,666 | |
| | | | Sprint Nextel Corporation | | | | |
| | 9,394 | | Expiration: January 2014, Exercise Price: $4.00 | | | 14,091 | |
| | | | | | | 1,763,346 | |
| | | | TOTAL OPTIONS WRITTEN | | | | |
| | | | (Premiums received $158,666,056) | | $ | 157,082,160 | |
ADR — American Depository Receipt
ETF — Exchange-Traded Fund
EUR — Euro
plc — Public Limited Company
REIT — Real Estate Investment Trust
| (a) | Level 2 Security. Please see Note 2 on the Notes to the Financial Statements. |
The accompanying notes are an integral part of these financial statements.
The Merger Fund
SCHEDULE OF FORWARD CURRENCY EXCHANGE CONTRACTS*
June 30, 2013
(Unaudited)
| | | | | | | U.S. $ | | | | | | | U.S. $ | | | Unrealized | |
| Settlement | | Currency to | | Value at | | | Currency to | | Value at | | | Appreciation | |
| Date | | be Delivered | | June 30, 2013 | | | be Received | | June 30, 2013 | | | (Depreciation)** | |
| 7/10/13 | | | 29,744,238 | | Australian Dollars | | $ | 27,177,927 | | | | 30,013,424 | | U.S. Dollars | | $ | 30,013,424 | | | $ | 2,835,497 | |
| 8/15/13 | | | 47,703,561 | | Australian Dollars | | | 43,467,560 | | | | 48,412,273 | | U.S. Dollars | | | 48,412,273 | | | | 4,944,713 | |
| 8/15/13 | | | 41,744,390 | | U.S. Dollars | | | 41,744,390 | | | | 43,582,254 | | Australian Dollars | | | 39,712,219 | | | | (2,032,171 | ) |
| 9/26/13 | | | 2,627,932 | | Australian Dollars | | | 2,387,445 | | | | 2,410,169 | | U.S. Dollars | | | 2,410,169 | | | | 22,724 | |
| 7/24/13 | | | 22,443,627 | | British Pounds | | | 34,129,468 | | | | 34,621,764 | | U.S. Dollars | | | 34,621,764 | | | | 492,296 | |
| 9/12/13 | | | 8,187,234 | | British Pounds | | | 12,446,028 | | | | 12,723,894 | | U.S. Dollars | | | 12,723,894 | | | | 277,866 | |
| 7/12/13 | | | 15,725,388 | | Canadian Dollars | | | 14,947,269 | | | | 15,344,537 | | U.S. Dollars | | | 15,344,537 | | | | 397,268 | |
| 7/15/13 | | | 109,916,190 | | Canadian Dollars | | | 104,469,578 | | | | 107,233,738 | | U.S. Dollars | | | 107,233,738 | | | | 2,764,160 | |
| 9/18/13 | | | 931,002 | | Canadian Dollars | | | 883,442 | | | | 913,320 | | U.S. Dollars | | | 913,320 | | | | 29,878 | |
| 7/22/13 | | | 47,499,200 | | Euros | | | 61,833,057 | | | | 61,868,283 | | U.S. Dollars | | | 61,868,283 | | | | 35,226 | |
| 10/29/13 | | | 34,306,513 | | Euros | | | 44,681,352 | | | | 45,075,285 | | U.S. Dollars | | | 45,075,285 | | | | 393,934 | |
| 1/15/14 | | | 35,126,685 | | Euros | | | 45,770,804 | | | | 45,875,127 | | U.S. Dollars | | | 45,875,127 | | | | 104,323 | |
| 8/15/13 | | | 4,944,445 | | Malaysian Ringgit | | | 1,559,791 | | | | 1,631,291 | | U.S. Dollars | | | 1,631,291 | | | | 71,500 | |
| 8/30/13 | | | 366,257,208 | | Thai Baht | | | 11,768,897 | | | | 11,733,863 | | U.S. Dollars | | | 11,733,863 | | | | (35,035 | ) |
| | | | | | | | $ | 447,267,008 | | | | | | | | $ | 457,569,187 | | | $ | 10,302,179 | |
| * | JPMorgan Chase & Co. Inc. is the counterparty for all open forward currency exchange contracts held by the Fund as ofJune 30, 2013. |
| ** | Unrealized appreciation is a receivable and unrealized depreciation is a payable on the Statement of Assets and Liabilities. |
The accompanying notes are an integral part of these financial statements.
The Merger Fund
SCHEDULE OF SWAP CONTRACTS
June 30, 2013
(Unaudited)
| | | | | | | | | | | Unrealized | | |
| Termination | | | | | | | | | | Appreciation | | |
| Date | | Security | | Shares | | | Notional | | | (Depreciation)* | | Counterparty |
| LONG SWAP CONTRACTS | | | | | | | | | | | | |
| 9/19/13 | | Australian Infrastructure Fund | | | 14,431,210 | | | $ | 133,922 | | | $ | (46,046,671 | ) | JPMorgan Chase & Co. Inc. |
| 11/26/13 | | CNH Global NV | | | 521,747 | | | | 22,028,158 | | | | (3,331,131 | ) | Merrill Lynch & Co. Inc. |
| 5/30/14 | | DE Master Blenders 1753 NV | | | 1,116,935 | | | | 17,908,187 | | | | (220,299 | ) | JPMorgan Chase & Co. Inc. |
| 5/2/14 | | Glencore International plc | | | 6,801,099 | | | | 28,784,291 | | | | (5,300,701 | ) | JPMorgan Chase & Co. Inc. |
| 11/30/13 | | GrainCorp. Ltd. | | | 2,027,345 | | | | 29,629,712 | | | | (2,423,181 | ) | JPMorgan Chase & Co. Inc. |
| 10/18/13 | | Hillgrove Resources Ltd. | | | 13,139,699 | | | | 707,179 | | | | (568,827 | ) | JPMorgan Chase & Co. Inc. |
| 6/24/14 | | Kabel Deutschland Holding AG | | | 403,755 | | | | 44,335,720 | | | | (333,493 | ) | JPMorgan Chase & Co. Inc. |
| 3/15/14 | | MISC Berhad | | | 988,889 | | | | 1,582,222 | | | | (115,322 | ) | JPMorgan Chase & Co. Inc. |
| 6/7/14 | | Severn Trent plc | | | 372,147 | | | | 9,405,911 | | | | (2,306,300 | ) | JPMorgan Chase & Co. Inc. |
| 6/20/14 | | Siam Makro Public Company Ltd. | | | 465,384 | | | | 11,614,081 | | | | 121,182 | | JPMorgan Chase & Co. Inc. |
| 5/23/14 | | Sumitomo Light Metal Industries, Ltd. | | | 77,000 | | | | 68,943 | | | | (14,311 | ) | JPMorgan Chase & Co. Inc. |
| 3/19/14 | | Uranium One, Inc. | | | 687,430 | | | | 1,798,234 | | | | (62,074 | ) | Merrill Lynch & Co. Inc. |
| 5/15/14 | | Vivendi SA | | | 3,205,800 | | | | 60,826,753 | | | | (1,871,808 | ) | JPMorgan Chase & Co. Inc. |
| SHORT SWAP CONTRACTS | | | | | | | | | | | | | | | |
| 11/26/13 | | Fiat Industrial S.p.A | | | (1,997,698 | ) | | | (22,716,503 | ) | | | (965,041 | ) | Merrill Lynch & Co. Inc. |
| 5/23/14 | | Furukawa-Sky | | | | | | | | | | | | | |
| | | Aluminum Corporation | | | (27,000 | ) | | | (70,876 | ) | | | 14,120 | | JPMorgan Chase & Co. Inc. |
| | | | | | | | | | | | | $ | (63,423,857 | ) | |
plc — Public Limited Company
| * | Based on the net asset value of each counterparty’s position, unrealized appreciation is a receivable and unrealized depreciation is a payable on the Statement of Assets and Liabilities. |
The accompanying notes are an integral part of these financial statements.
The Merger Fund
STATEMENT OF ASSETS AND LIABILITIES
June 30, 2013
(Unaudited)
| ASSETS: | | | | | | |
| Investments, at value | | | | | | |
| Investments in non affiliates (Cost $4,466,299,579) | | | | | $ | 4,534,685,241 | |
| Investments in affiliates (Cost $139,731,369) | | | | | | 140,683,680 | |
| Deposits at brokers | | | | | | 129,304,171 | |
| Receivable from brokers | | | | | | 325,343,139 | |
| Receivable for investments sold | | | | | | 30,002,550 | |
| Receivable for forward currency exchange contracts | | | | | | 12,369,385 | |
| Receivable for fund shares issued | | | | | | 16,085,803 | |
| Dividends and interest receivable | | | | | | 14,028,361 | |
| Prepaid expenses and other receivables | | | | | | 185,026 | |
| Total Assets | | | | | | 5,202,687,356 | |
| LIABILITIES: | | | | | | | |
| Securities sold short, at value (proceeds of $325,343,139) | | $ | 366,648,281 | | | | | |
| Written option contracts, at value (premiums received $158,666,056) | | | 157,082,160 | | | | | |
| Payable to the investment adviser | | | 3,264,914 | | | | | |
| Payable to custodian | | | 2,267 | | | | | |
| Payable for forward currency exchange contracts | | | 2,067,206 | | | | | |
| Payable for swap contracts | | | 63,423,857 | | | | | |
| Payable for investments purchased | | | 61,519,710 | | | | | |
| Payable for fund shares redeemed | | | 7,814,620 | | | | | |
| Distribution fees payable | | | 3,960,845 | | | | | |
| Payable to independent trustees | | | 11,165 | | | | | |
| Dividends and interest payable | | | 499,947 | | | | | |
| Accrued expenses and other liabilities | | | 2,915,932 | | | | | |
| Total Liabilities | | | | | | | 669,210,904 | |
| NET ASSETS | | | | | | $ | 4,533,476,452 | |
| NET ASSETS CONSISTS OF: | | | | | | | | |
| Accumulated undistributed net investment income | | | | | | $ | 8,079,728 | |
| Accumulated net realized loss on investments, securities sold short, | | | | | | | | |
| written option contracts expired or closed, swap contracts, foreign | | | | | | | | |
| currency translation and forward currency exchange contracts | | | | | | | (25,013 | ) |
| Net unrealized appreciation (depreciation) on: | | | | | | | | |
| Investments | | $ | 69,337,973 | | | | | |
| Securities sold short | | | (41,305,142 | ) | | | | |
| Written option contracts | | | 1,583,896 | | | | | |
| Swap contracts | | | (63,423,857 | ) | | | | |
| Forward currency exchange contracts | | | 10,302,179 | | | | | |
| Net unrealized depreciation | | | | | | | (23,504,951 | ) |
| Paid-in capital | | | | | | | 4,548,926,688 | |
| Total Net Assets | | | | | | $ | 4,533,476,452 | |
| NET ASSET VALUE and offering price per share* | | | | | | | | |
| ($4,533,476,452 / 285,566,436 shares of beneficial interest outstanding) | | | | | | $ | 15.88 | |
| * | The redemption price per share may vary based on the length of time a shareholder holds Fund shares. |
The accompanying notes are an integral part of these financial statements.
The Merger Fund
STATEMENT OF OPERATIONS
For the Six Months Ended June 30, 2013
(Unaudited)
| INVESTMENT INCOME: | | | | | | |
| Interest | | | | | $ | 4,326,395 | |
| Dividend income on long positions: | | | | | | | |
| Non Affiliates (net of foreign withholding taxes of $23,095) | | | | | | 37,996,776 | |
| Affiliates | | | | | | 250,260 | |
| Total investment income | | | | | | 42,573,431 | |
| EXPENSES: | | | | | | | |
| Investment advisory fees | | $ | 22,064,068 | | | | | |
| Distribution fees | | | 3,916,017 | | | | | |
| Sub transfer agent fees | | | 2,139,583 | | | | | |
| Administration fees | | | 682,366 | | | | | |
| Transfer agent and shareholder servicing agent fees | | | 482,231 | | | | | |
| Miscellaneous expenses | | | 481,498 | | | | | |
| Professional fees | | | 470,192 | | | | | |
| Reports to shareholders | | | 355,910 | | | | | |
| Fund accounting expense | | | 194,447 | | | | | |
| Custody fees | | | 167,449 | | | | | |
| Trustees’ fees and expenses | | | 114,743 | | | | | |
| Federal and state registration fees | | | 109,341 | | | | | |
| Borrowing expense on securities sold short | | | 2,110,755 | | | | | |
| Dividends on securities sold short | | | 3,254,240 | | | | | |
| Total expenses before expense waiver by Adviser | | | | | | | 36,542,840 | |
| Less: Expense reimbursed by Adviser | | | | | | | (2,677,197 | ) |
| Net expenses | | | | | | | 33,865,643 | |
| NET INVESTMENT INCOME | | | | | | | 8,707,788 | |
| REALIZED AND UNREALIZED GAIN (LOSS) ON INVESTMENTS: | | | | | | | | |
| Realized gain (loss) on: | | | | | | | | |
| Investments | | | 135,464,334 | | | | | |
| Securities sold short | | | (51,216,274 | ) | | | | |
| Written option contracts expired or closed | | | (15,568,182 | ) | | | | |
| Swap contracts | | | 8,322,487 | | | | | |
| Foreign currency translation | | | 1,074,163 | | | | | |
| Forward currency exchange contracts | | | 9,863,870 | | | | | |
| Net realized gain | | | | | | | 87,940,398 | |
| Change in unrealized appreciation (depreciation) on: | | | | | | | | |
| Investments | | | (19,580,342 | ) | | | | |
| Securities sold short | | | (7,378,776 | ) | | | | |
| Written option contracts | | | (2,865,204 | ) | | | | |
| Swap contracts | | | (68,483,872 | ) | | | | |
| Foreign currency translation | | | 235,905 | | | | | |
| Forward currency exchange contracts | | | 14,750,376 | | | | | |
| Net unrealized depreciation | | | | | | | (83,321,913 | ) |
| NET REALIZED AND UNREALIZED GAIN ON INVESTMENTS | | | | | | | 4,618,485 | |
| NET INCREASE IN NET ASSETS RESULTING FROM OPERATIONS | | | | | | $ | 13,326,273 | |
The accompanying notes are an integral part of these financial statements.
The Merger Fund
STATEMENTS OF CHANGES IN NET ASSETS
| | | Six Months Ended | | | Year Ended | |
| | | June 30, 2013 | | | December 31, 2012 | |
| | | (Unaudited) | | | | |
| Net investment income (loss) | | $ | 8,707,788 | | | $ | (16,701,815 | ) |
| Net realized gain on investments, securities sold short, written | | | | | | | | |
| option contracts expired or closed, swap contracts, foreign | | | | | | | | |
| currency translation and forward currency exchange contracts | | | 87,940,398 | | | | 37,998,785 | |
| Change in unrealized appreciation (depreciation) on investments, | | | | | | | | |
| securities sold short, written option contracts, swap contracts, | | | | | | | | |
| foreign currency translation and forward currency exchange contracts | | | (83,321,913 | ) | | | 146,141,288 | |
| Net increase in net assets resulting from operations | | | 13,326,273 | | | | 167,438,258 | |
| Distributions to shareholders from: (Note 5) | | | | | | | | |
| Net investment income | | | — | | | | (71,370,998 | ) |
| Net realized gains | | | — | | | | (17,361,215 | ) |
| Total dividends and distributions | | | — | | | | (88,732,213 | ) |
| Net increase (decrease) in net assets | | | | | | | | |
| from capital share transactions (Note 4) | | | 104,460,320 | | | | (689,576,446 | ) |
| Net increase (decrease) in net assets | | | 117,786,593 | | | | (610,870,401 | ) |
| | | | | | | | | |
| NET ASSETS: | | | | | | | | |
| Beginning of period | | | 4,415,689,859 | | | | 5,026,560,260 | |
| End of period (including accumulated undistributed net investment | | | | | | | | |
| income (loss) of $8,079,728 and $(628,060), respectively) | | $ | 4,533,476,452 | | | $ | 4,415,689,859 | |
| | | | | | | | | |
The accompanying notes are an integral part of these financial statements.
The Merger Fund
FINANCIAL HIGHLIGHTS
Selected per share data is based on a share of beneficial interest outstanding throughout each period.
| | | Six | | | | | | Three | | | | | | | | | | | | | |
| | | Months | | | Year | | | Months | | | | | | | | | | | | | |
| | | Ended | | | Ended | | | Ended | | | | | | | | | | | | | |
| | | June 30, | | | Dec. 31, | | | Dec. 31, | | | Year Ended September 30, | |
| | | 2013 | | | 2012 | | | | 2011* | | | | 2011 | | | | 2010(1) | | | | 2009(1) | | | | 2008(1) | |
| | | (Unaudited) | | | | | | | | | | | | | | | | | | | | | | | | |
| Per Share Data: | | | | | | | | | | | | | | | | | | | | | | | | | | |
| Net Asset Value, | | | | | | | | | | | | | | | | | | | | | | | | | | |
| beginning of period | | $ | 15.83 | | | $ | 15.59 | | | $ | 15.59 | | | $ | 15.93 | | | $ | 15.26 | | | $ | 14.79 | | | $ | 16.55 | |
| Income from | | | | | | | | | | | | | | | | | | | | | | | | | | | | |
| investment operations: | | | | | | | | | | | | | | | | | | | | | | | | | | | | |
| Net investment | | | | | | | | | | | | | | | | | | | | | | | | | | | | |
income (loss)(2) | | | 0.03 | (3) | | | (0.05 | )(3) | | | (0.02 | )(3) | | | (0.18 | )(3) | | | (0.02 | )(4) | | | 0.24 | (4) | | | 0.00 | (5)(6) |
| Net realized and unrealized | | | | | | | | | | | | | | | | | | | | | | | | | | | | |
| gain (loss) on investments | | | 0.02 | | | | 0.61 | | | | 0.47 | | | | 0.13 | | | | 0.69 | | | | 0.58 | | | | (0.70 | ) |
| Total from | | | | | | | | | | | | | | | | | | | | | | | | | | | | |
| investment operations | | | 0.05 | | | | 0.56 | | | | 0.45 | | | | (0.05 | ) | | | 0.67 | | | | 0.82 | | | | (0.70 | ) |
| Redemption fees | | | — | | | | 0.00 | (6) | | | 0.00 | (6) | | | 0.00 | (6) | | | 0.00 | (6) | | | 0.00 | (6) | | | 0.00 | (6) |
| | | | | | | | | | | | | | | | | | | | | | | | | | | | | |
| Less distributions: | | | | | | | | | | | | | | | | | | | | | | | | | | | | |
| Distributions from | | | | | | | | | | | | | | | | | | | | | | | | | | | | |
| net investment income | | | — | | | | (0.26 | ) | | | (0.08 | ) | | | — | | | | (0.00 | )(6) | | | (0.06 | ) | | | (0.37 | ) |
| Distributions from | | | | | | | | | | | | | | | | | | | | | | | | | | | | |
| net realized gains | | | — | | | | (0.06 | ) | | | (0.37 | ) | | | (0.29 | ) | | | — | | | | (0.05 | ) | | | (0.69 | ) |
| Distributions from | | | | | | | | | | | | | | | | | | | | | | | | | | | | |
| return of capital | | | — | | | | — | | | | — | | | | — | | | | — | | | | (0.24 | ) | | | — | |
| Total dividends | | | | | | | | | | | | | | | | | | | | | | | | | | | | |
| and distributions | | | — | | | | (0.32 | ) | | | (0.45 | ) | | | (0.29 | ) | | | (0.00 | )(6) | | | (0.35 | ) | | | (1.06 | ) |
| Net Asset Value, end of period | | $ | 15.88 | | | $ | 15.83 | | | $ | 15.59 | | | $ | 15.59 | | | $ | 15.93 | | | $ | 15.26 | | | $ | 14.79 | |
| | | | | | | | | | | | | | | | | | | | | | | | | | | | | |
| Total Return | | | 0.32 | %(7) | | | 3.61 | % | | | 2.90 | %(7) | | | (0.34 | )% | | | 4.39 | % | | | 5.78 | % | | | (4.32 | )% |
| | | | | | | | | | | | | | | | | | | | | | | | | | | | | |
Footnotes To Financial Highlights On Following Page
The accompanying notes are an integral part of these financial statements.
The Merger Fund
FINANCIAL HIGHLIGHTS (continued)
| | | Six | | | | | | Three | | | | | | | | | | | | | |
| | | Months | | | Year | | | Months | | | | | | | | | | | | | |
| | | Ended | | | Ended | | | Ended | | | | |
| | | June 30, | | | Dec. 31, | | | Dec. 31, | | | Year Ended September 30, | |
| | | 2013 | | | 2012 | | | | 2011* | | | | 2011 | | | | 2010(1) | | | | 2009(1) | | | | 2008(1) | |
| | | (Unaudited) | | | | | | | | | | | | | | | | | | | | | | | | |
| Supplemental data and ratios: | | | | | | | | | | | | | | | | | | | | | |
| Net assets, end | | | | | | | | | | | | | | | | | | | | | | | | | | |
| of period (000’s) | | $ | 4,533,476 | | | $ | 4,415,690 | | | $ | 5,026,560 | | | $ | 4,913,854 | | | $ | 3,573,582 | | | $ | 1,811,380 | | | $ | 1,414,165 | |
| Ratio of operating expenses | | | | | | | | | | | | | | | | | | | | | |
| to average net assets | | | 1.53 | %(8) | | | 1.69 | % | | | 1.64 | %(8) | | | 1.96 | % | | | 2.57 | % | | | 4.22 | % | | | 1.66 | % |
| Ratio of dividends on short | | | | | | | | | | | | | | | | | | | | | |
| positions and borrowing | | | | | | | | | | | | | | | | | | | | | |
| expense on securities sold | | | | | | | | | | | | | | | | | | | | | | | | | |
| short to average net assets | | | 0.24 | %(8) | | | 0.42 | % | | | 0.31 | %(8) | | | 0.62 | % | | | 1.16 | % | | | 2.68 | % | | | 0.19 | % |
| Ratio of operating expense to | | | | | | | | | | | | | | | | | | | | | |
| average net assets excluding | | | | | | | | | | | | | | | | | | | | | |
| dividends on short positions | | | | | | | | | | | | | | | | | | | | | |
| and borrowing expense on | | | | | | | | | | | | | | | | | | | | | |
| securities sold short: | | | | | | | | | | | | | | | | | | | | | | | | | | | | |
| Before expense waiver | | | 1.41 | %(8) | | | 1.40 | % | | | 1.46 | %(8) | | | 1.46 | % | | | 1.48 | % | | | 1.54 | % | | | 1.48 | % |
| After expense waiver | | | 1.29 | %(8) | | | 1.27 | % | | | 1.33 | %(8) | | | 1.34 | % | | | 1.41 | % | | | 1.54 | % | | | 1.47 | % |
| Ratio of net investment | | | | | | | | | | | | | | | | | | | | | | | | | | | | |
| income (loss) to average | | | | | | | | | | | | | | | | | | | | | |
| net assets: | | | | | | | | | | | | | | | | | | | | | |
| Before expense waiver | | | 0.27 | %(8) | | | (0.47 | )% | | | (0.72 | )%(8) | | | (1.25 | )% | | | (1.35 | )% | | | (2.49 | )% | | | (0.10 | )% |
| After expense waiver | | | 0.39 | %(8) | | | (0.34 | )% | | | (0.59 | )%(8) | | | (1.13 | )% | | | (1.28 | )% | | | (2.49 | )% | | | (0.09 | )% |
Portfolio turnover rate(9) | | | 93.40 | %(7) | | | 240.32 | % | | | 48.13 | %(7) | | | 292.79 | % | | | 192.21 | % | | | 318.45 | % | | | 300.24 | % |
| | | | | | | | | | | | | | | | | | | | | | | | | | | | | |
| (1) | Performance data included for periods prior to 2011 reflect that of Westchester Capital Management, Inc. the Fund’s prior investment adviser. See Note 1 for additional information. |
| (2) | Net investment income (loss) before interest expense, borrowing expense on securities sold short and dividends on securities sold short for the six months ended June 30, 2013, the year ended December 31, 2012, the three months ended December 31, 2011 and the years ended September 30, 2011, 2010, 2009 and 2008 was $0.05, $0.01, $(0.01), $(0.08), $0.12, $0.55, and $0.02, respectively. |
| (3) | Net investment income (loss) per share represents net investment income (loss) divided by the average shares outstanding throughout the period. |
| (4) | Net investment income (loss) per share is calculated using ending balance after consideration of adjustments for permanent book and tax differences. |
| (5) | Net investment income (loss) per share is calculated using ending balance prior to consideration of adjustments for permanent book and tax differences. |
| (6) | Amount is less than $0.005 per share. |
| (9) | The numerator for the portfolio turnover rate includes the lesser of purchases or sales (excluding short positions). The denominator includes the average long positions throughout the period. |
| * | Stub period from October 1, 2011 through December 31, 2011. |
The accompanying notes are an integral part of these financial statements.
The Merger Fund
NOTES TO THE FINANCIAL STATEMENTS
June 30, 2013 (Unaudited)
Note 1 — ORGANIZATION
The Merger Fund (the “Fund”) is a no-load, open-end, diversified investment company organized as a trust under the laws of the Commonwealth of Massachusetts on April 12, 1982, and registered under the Investment Company Act of 1940, as amended (the “1940 Act”). The Fund was formerly known as the Risk Portfolio of The Ayco Fund. In January of 1989, the Fund’s fundamental investment policies were amended to permit the Fund to engage in merger arbitrage. At the same time, Westchester Capital Management, Inc. became the Fund’s investment adviser, and the Fund began to do business as The Merger Fund. In a transaction that closed on December 31, 2010, Westchester Capital Management, Inc. transferred substantially all of its business and assets to Westchester Capital Management, LLC (the “Adviser”), which became the Fund’s investment adviser. Therefore, the performance information included herein for periods prior to 2011 reflect the performance of Westchester Capital Management, Inc. Mr. Roy Behren and Mr. Michael Shannon, the Fund’s current portfolio managers, were named portfolio managers of the Fund in January 2007, and each has performed portfolio management duties for the Fund since May of 2006. The investment objective of the Fund is to seek to achieve capital growth by engaging in merger arbitrage. Merger arbitrage is a highly specialized investment approach generally designed to profit from the successful completion of publicly announced mergers, takeovers, tender offers, leveraged buyouts, spin-offs, liquidations and other corporate reorganizations.
Note 2 — SIGNIFICANT ACCOUNTING POLICIES
The following is a summary of significant accounting policies followed by the Fund in the preparation of its financial statements. These policies are in conformity with U.S. generally accepted accounting principles (“GAAP”). In preparing these financial statements, the Fund has evaluated events and transactions for potential recognition or disclosure through the date the financial statements were available to be issued. The presentation of financial statements in conformity with GAAP requires management to make estimates and assumptions that affect the reported amount of assets and liabilities at the date of the financial statements and the reported amounts of revenues and expenses during the reporting period. Actual results could differ from those estimates and assumptions.
Securities listed on the NASDAQ are valued at the NASDAQ Official Closing Price (“NOCP”). Investments in registered open-end investment companies other than exchange-traded funds are valued at their reported net asset value (“NAV”). Equity securities that are traded on a national securities exchange are valued at the last sale price at the close of that exchange. The securities valued using quoted prices in active markets are classified as Level 1 investments. Securities not listed on an exchange, but for which market transaction prices are reported, are valued at the last sale price as of the close of the New York Stock Exchange. Non-exchange listed securities are valued based on evaluations provided by a third party, when available, or at the mean of the closing bid and asked prices. These securities are classified as Level 2 investments. In pricing corporate bonds and other debt securities, that are not obligations of the U.S. Government or its agencies, the mean of the reported closing bid and ask prices is used. These securities are classified as Level 2 investments. As a secondary source, an individual broker bid or ask may be used to value debt securities if the Adviser
The Merger Fund
NOTES TO THE FINANCIAL STATEMENTS (continued)
June 30, 2013 (Unaudited)
Note 2 — SIGNIFICANT ACCOUNTING POLICIES (continued)
reasonably believes such bid or ask is an actionable bid or ask in that the broker would be willing to transact at that price. These securities are generally classified as Level 2 or Level 3 investments. Exchange-traded options are valued at the higher of the intrinsic value of the option (i.e., what the Fund can receive upon exercising the option) or the last reported composite sale price. If no sales are reported or if the last sale is outside the bid and ask parameters, the higher of the intrinsic value of the option or the mean between the last reported bid and asked prices is used. Non-exchange-traded options will be valued at the higher of the intrinsic value of the option or at the price supplied by the counterparty. Options for which there is an active market are classified as Level 1 investments, but options not listed on an exchange are classified as Level 2 investments. Investments in United States government securities (other than short-term securities) are valued at the mean of the quoted bid and asked prices in the over-the-counter market. Short-term debt investments are carried at amortized cost, which approximates market value. Money market funds are valued at the reported NAV.
The Adviser monitors and reviews the pricing of securities and makes determinations of fair value when such procedures call for judgment and analysis. Securities for which there are no market quotations readily available or such quotations are unreliable are valued at fair value as determined in accordance with procedures adopted by the Board of Trustees and under the supervision of the Board of Trustees. The factors for fair valuation the Adviser may consider include, among other things: fundamental analytical data; the nature and duration of restrictions on disposition; an evaluation of forces that influence the market in which the securities are purchased and sold; intrinsic value and public trading in similar securities of the issuer or comparable issuers. When fair-value pricing is employed, the prices of securities used by the Fund to calculate its NAV may differ from quoted or published prices for the same securities. These securities are generally classified as Level 2 or 3 depending on the inputs as described below. At June 30, 2013, the Fund did not have any fair valued securities.
The Fund has performed an analysis of all existing investments to determine the significance and character of all inputs to their fair value determination. Various inputs are used in determining the value of the Fund’s investments. These inputs are summarized in the three broad levels listed below:
| | Level 1 — | Quoted prices in active markets for identical securities. |
| | Level 2 — | Other significant observable inputs (including quoted prices for similar securities, interest rates, prepayment speeds, credit risk, etc.). |
| | Level 3 — | Model derived valuations in which one or more significant inputs or significant value drivers are unobservable. Unobservable inputs are those inputs that reflect the Fund’s own assumptions that market participants would use to price the asset or liability based on the best available information. |
The inputs or methodology used for valuing securities are not an indication of the risk associated with investing in those securities.
The Merger Fund
NOTES TO THE FINANCIAL STATEMENTS (continued)
June 30, 2013 (Unaudited)
Note 2 — SIGNIFICANT ACCOUNTING POLICIES (continued)
The following tables provide the fair value measurements of applicable Fund assets and liabilities by level within the fair value hierarchy for the Fund as of June 30, 2013. These assets and liabilities are measured on a recurring basis.
| | | Level 1 | | | Level 2 | | | Level 3 | | | Total | |
| Assets | | | | | | | | | | | | |
| Common Stocks* | | $ | 3,301,392,542 | | | $ | — | | | $ | — | | | $ | 3,301,392,542 | |
| Warrants | | | 11,528 | | | | — | | | | — | | | | 11,528 | |
| Corporate Bonds | | | — | | | | 235,562,200 | | | | — | | | | 235,562,200 | |
| Purchased Put Options | | | 25,593,315 | | | | 235,501 | | | | — | | | | 25,828,816 | |
| Short-Term Investments | | | 1,112,573,835 | | | | — | | | | — | | | | 1,112,573,835 | |
| Forward Currency | | | | | | | | | | | | | | | | |
| Exchange Contracts** | | | — | | | | 12,369,385 | | | | — | | | | 12,369,385 | |
| Liabilities | | | | | | | | | | | | | | | | |
| Common Stocks Sold Short | | $ | 366,648,281 | | | $ | — | | | $ | — | | | $ | 366,648,281 | |
| Written Option Contracts | | | 155,655,789 | | | | 1,426,371 | | | | — | | | | 157,082,160 | |
| Swap Contracts** | | | — | | | | 63,423,857 | | | | — | | | | 63,423,857 | |
| Forward Currency | | | | | | | | | | | | | | | | |
| Exchange Contracts** | | | — | | | | 2,067,206 | | | | — | | | | 2,067,206 | |
| * | Please refer to the Schedule of Investments to view common stocks segregated by industry type. |
| ** | Swap contracts and forward currency exchange contracts are valued at the net unrealized appreciation (depreciation) on the instrument. |
The Level 2 securities are priced using inputs such as current yields, discount rates, credit quality, yields on a comparable security, trading volume and maturity date. The Fund did not have transfers into or out of Level 1, Level 2 or Level 3 during the year. Transfers between levels are recognized at the end of the reporting period. The Fund did not hold any Level 3 securities at the end of the period.
Level 3 Reconciliation Disclosure
The following is a reconciliation of Level 3 assets for which significant unobservable inputs were used to determine fair value.
| Description | | Investments | |
| Balance as of December 31, 2012 | | $ | 420,840 | |
| Realized gain | | | 390,743 | |
| Change in unrealized (depreciation) | | | (420,840 | ) |
| Sales | | | (390,743 | ) |
| Balance as of June 30, 2013 | | $ | — | |
The Fund may sell securities or currencies short for economic hedging purposes or any other investment purpose. For financial statement purposes, an amount equal to the settlement amount is
The Merger Fund
NOTES TO THE FINANCIAL STATEMENTS (continued)
June 30, 2013 (Unaudited)
Note 2 — SIGNIFICANT ACCOUNTING POLICIES (continued)
initially included in the Statement of Assets and Liabilities as an asset and an equivalent liability. The amount of the liability is subsequently priced to reflect the current value of the short position. Subsequent fluctuations in the market prices of securities or currencies sold, but not yet purchased, may require purchasing the securities or currencies at prices which may differ from the market value reflected on the Statement of Assets and Liabilities. Short sale transactions result in off balance sheet risk because the ultimate obligation may exceed the related amounts shown in the Statement of Assets and Liabilities. The Fund will incur a loss if the price of the security increases between the date of the short sale and the date on which the Fund purchases the security to replace the borrowed security. The Fund’s loss on a short sale is potentially unlimited because there is no upward limit on the price a borrowed security could attain.
The Fund is liable for any dividends payable on securities while those securities are sold short. Until the security is replaced, the Fund is required to pay to the lender any income earned, which is recorded as an expense by the Fund. The Fund generally segregates liquid assets in an amount equal to the market value of the securities sold short. These assets are required to be adjusted daily to reflect changes in the value of the securities or currencies sold short.
| C. | Transactions with Brokers for Securities Sold Short |
The Fund’s receivables from brokers for proceeds on securities sold short and deposits at brokers for securities sold short are with two securities dealers. The Fund does not require the brokers to maintain collateral in support of the receivable from the brokers for proceeds on securities sold short. The Fund is required by the brokers to maintain collateral at the brokers for securities sold short. The receivable from brokers on the Statement of Assets and Liabilities represents the collateral for securities sold short. The Fund maintains cash deposits at brokers beyond the receivable for short sales. These cash deposits are presented as deposits at brokers on the Statement of Assets and Liabilities. These transactions may involve market risk in excess of the amount of receivable or payable reflected on the Statement of Assets and Liabilities.
No provision for federal income taxes has been made since the Fund has complied to date with the provisions of Subchapter M of the Internal Revenue Code applicable to regulated investment companies and intends to continue to so comply in future years and to distribute investment company net taxable income and net capital gains to shareholders. Additionally, the Fund intends to make all required distributions to avoid federal excise tax.
The Fund has reviewed all open tax years in major jurisdictions and concluded that there is no impact on the Fund’s net assets and no tax liability resulting from unrecognized tax benefits relating to uncertain income tax positions taken or expected to be taken on a tax return. The Fund is also not aware of any tax positions for which it is reasonably possible that the total amounts of unrecognized tax benefits will significantly change in the next six months. As of June 30, 2013, open Federal and New York tax years include the tax years ended September 30, 2009 through 2012. The Fund has no tax examination in progress.
The Merger Fund
NOTES TO THE FINANCIAL STATEMENTS (continued)
June 30, 2013 (Unaudited)
Note 2 — SIGNIFICANT ACCOUNTING POLICIES (continued)
| E. | Written Option Contracts |
The Fund is subject to equity price risk in the normal course of pursuing its investment objectives. The Fund may write (sell) call options, including to hedge portfolio investments. Uncovered put options can also be written by the Fund as part of a merger arbitrage strategy involving a pending corporate reorganization. When the Fund writes (sells) an option, an amount equal to the premium received by the Fund is included in the Statement of Assets and Liabilities as an asset and an equivalent liability. The amount of the liability is subsequently priced daily to reflect the current value of the option written. By writing an option, the Fund may become obligated during the term of the option to deliver or purchase the securities underlying the option at the exercise price if the option is exercised. Written option contracts are valued at the higher of the intrinsic value of the option or the last sales price reported by a third party valuation service on the date of valuation. If no sale is reported or if the last sale is outside the parameters of the closing bid and asked prices, the written option contract is valued at the higher of the intrinsic value of the option or the mean between the last reported bid and asked prices on the day of valuation. When an option expires on its stipulated expiration date or the Fund enters into a closing purchase transaction, the Fund realizes a gain or loss if the cost of the closing purchase transaction differs from the premium received when the option was sold without regard to any unrealized gain or loss on the underlying security, and the liability related to such option is eliminated. When an option is exercised, the premium originally received decreases the cost basis of the security (or increases the proceeds on a sale of the security), and the Fund realizes a gain or loss from the sale of the underlying security. Written option contracts sold on an exchange typically involve less credit risk than over-the-counter options. These contracts may involve market risk in excess of the amount of receivable or payable reflected on the Statement of Assets and Liabilities. Refer to Note 2 R. for further derivative disclosures.
The Fund is subject to equity price risk in the normal course of pursuing its investment objectives. The Fund may purchase put or call options to hedge portfolio investments or for other investment purposes. Premiums paid for option contracts purchased are included in the Statement of Assets and Liabilities as an asset. Exchange-traded option contracts are valued daily at the higher of the intrinsic value of the option or the last reported composite sale price on the date of valuation. If no sale is reported or if the last sale is outside the parameters of the closing bid and asked prices, the option contract purchased is valued at the higher of the intrinsic value of the option or the mean between the last reported bid and asked prices on the day of valuation. When option contracts expire or are closed, realized gains or losses are recognized without regard to any unrealized gains or losses on the underlying securities. Purchased options sold on an exchange typically include less credit risk than over-the-counter options. Refer to Note 2 R. for further derivative disclosures.
| G. | Forward Currency Exchange Contracts |
The Fund is subject to foreign currency exchange rate risk in the normal course of pursuing its investment objectives. The Fund may use forward currency exchange contracts to hedge against changes in the value of foreign currencies. The Fund may enter into forward currency exchange
The Merger Fund
NOTES TO THE FINANCIAL STATEMENTS (continued)
June 30, 2013 (Unaudited)
Note 2 — SIGNIFICANT ACCOUNTING POLICIES (continued)
contracts obligating the Fund to deliver and receive a currency at a specified future date. Forward contracts are valued daily, and unrealized appreciation or depreciation is recorded daily as the difference between the contract exchange rate and the closing forward rate applied to the face amount of the contract. A realized gain or loss is recorded at the time the forward contract expires. Credit risk may arise as a result of the failure of the counterparty to comply with the terms of the contract. The Fund considers the creditworthiness of each counterparty to a contract in evaluating potential credit risk quarterly. The counterparty risk to the Fund includes the amount of any net unrealized gain on the contract.
The use of forward currency exchange contracts does not eliminate fluctuations in the underlying prices of the Fund’s investment securities. The use of forward currency exchange contracts involves the risk that anticipated currency movements will not be accurately predicted. A forward currency exchange contract would limit the risk of loss due to a decline in the value of a particular currency; however it would also limit any potential gain that might result should the value of the currency increase instead of decrease. These contracts may involve market risk in excess of the amount of receivable or payable reflected on the Statement of Assets and Liabilities. Refer to Note 2 R. for further derivative disclosures.
The Fund is subject to equity price risk and interest rate risk in the normal course of pursuing its investment objectives. The Fund may enter into both long and short equity swap contracts with multiple broker-dealers. A long equity swap contract entitles the Fund to receive from the counterparty any appreciation and dividends paid on an individual security, while obligating the Fund to pay the counterparty any depreciation on the security as well as interest on the notional amount of the contract at a rate equal to LIBOR plus an agreed upon spread (generally between 25 to 100 basis points). A short equity swap contract obligates the Fund to pay the counterparty any appreciation and dividends paid on an individual security, while entitling the Fund to receive from the counterparty any depreciation on the security, and to pay to or receive from the counterparty interest on the notional value of the contract at a rate equal to LIBOR less an agreed upon spread (generally between 25 to 100 basis points).
The Fund may also enter into equity swap contracts whose value may be determined by the spread between a long equity position and a short equity position. This type of swap contract obligates the Fund to pay the counterparty an amount tied to any increase in the spread between the two securities over the term of the contract. The Fund is also obligated to pay the counterparty any dividends paid on the short equity holding as well as any net financing costs. This type of swap contract entitles the Fund to receive from the counterparty any gains based on a decrease in the spread as well as any dividends paid on the long equity holding and any net interest income.
Fluctuations in the value of an open contract are recorded daily as a net unrealized gain or loss. The Fund will realize a gain or loss upon termination or reset of the contract. Either party, under certain conditions, may terminate the contract prior to the contract’s expiration date.
Credit risk may arise as a result of the failure of the counterparty to comply with the terms of the contract. The Fund considers the creditworthiness of each counterparty to a contract in evaluating potential credit risk quarterly. The counterparty risk to the Fund includes the risk of loss of the full
The Merger Fund
NOTES TO THE FINANCIAL STATEMENTS (continued)
June 30, 2013 (Unaudited)
Note 2 — SIGNIFICANT ACCOUNTING POLICIES (continued)
amount of any net unrealized gain on the contract, along with dividends receivable on long equity contracts and interest receivable on short equity contracts. Additionally, risk may arise from unanticipated movements in interest rates or in the value of the underlying securities. These contracts may involve market risk in excess of the amount of receivable or payable reflected on the Statement of Assets and Liabilities. Refer to Note 2 R. for further derivative disclosures.
| I. | Distributions to Shareholders |
Dividends from net investment income and net realized capital gains, if any, are declared and paid at least annually. Income and capital gain distributions are determined in accordance with income tax regulations which may differ from GAAP. These differences are due primarily to wash sale-loss deferrals, constructive sales, straddle-loss deferrals, adjustments on swap contracts, and unrealized gains or losses on Section 1256 contracts, which were realized, for tax purposes, at December 31, 2012.
Investing in securities of foreign companies and foreign governments involves special risks and considerations not typically associated with investing in U.S. companies and the U.S. government. These risks include revaluation of currencies and adverse political and economic developments. Moreover, securities of many foreign companies and their markets may be less liquid and their prices more volatile than those of securities of comparable U.S. companies and the U.S. government.
| K. | Foreign Currency Translation |
The books and records of the Fund are maintained in U.S. dollars. Foreign currency transactions are translated into U.S. dollars on the following basis: (i) market value of investment securities, assets and liabilities at the daily rates of exchange, and (ii) purchases and sales of investment securities, dividend and interest income and certain expenses at the rates of exchange prevailing on the respective dates of such transactions. For financial reporting purposes, the Fund does not isolate changes in the exchange rate of investment securities from the fluctuations arising from changes in the market prices of securities. However, for federal income tax purposes, the Fund does isolate and treat as ordinary income the effect of changes in foreign exchange rates on realized gain or loss from the sale of investment securities and payables and receivables arising from trade-date and settlement-date differences.
The Fund considers highly liquid temporary cash investments purchased with an original maturity of less than three months to be cash equivalents. Cash equivalents are included in short-term investments on the Schedule of Investments as well as in investments on the Statement of Assets and Liabilities.
��
| M. | Guarantees and Indemnifications |
In the normal course of business, the Fund enters into contracts with service providers that contain general indemnification clauses. The Fund’s maximum exposure under these arrangements is unknown, as this would involve future claims that may be made against the Fund that have not yet occurred. The Fund has not historically incurred material expenses in respect of those provisions.
The Merger Fund
NOTES TO THE FINANCIAL STATEMENTS (continued)
June 30, 2013 (Unaudited)
Note 2 — SIGNIFICANT ACCOUNTING POLICIES (continued)
The preparation of financial statements in conformity with GAAP requires the Adviser to make estimates and assumptions that affect the reported amounts of assets and liabilities and disclosure of contingent assets and liabilities at the date of the financial statements and the reported amounts of revenues and expenses during the reporting period. Actual results could differ from those estimates.
Transactions are recorded for financial statement purposes on the trade date. Realized gains and losses from security transactions are recorded on the identified cost basis. Dividend income and distributions to shareholders are recorded on the ex-dividend date. Interest is accounted for on the accrual basis and includes amortization of premiums and discounts on the effective interest method. Expenses include $2,110,755 of borrowing expense on securities sold short. The Fund may utilize derivative instruments such as options, forward currency exchange contracts and other instruments with similar characteristics to the extent that they are consistent with the Fund’s investment objectives and limitations. The use of these instruments may involve additional investment risks, including the possibility of illiquid markets or imperfect correlation between the value of the instruments and the underlying securities.
The Fund helps manage counterparty credit risk by entering into agreements only with counterparties the Adviser believes have the financial resources to honor their obligations and by having the Adviser monitor the financial stability of the counterparties. Collateral pledges are monitored and subsequently adjusted if and when the valuations fluctuate, either up or down, by at least the predetermined threshold amount.
Financial assets and liabilities as well as cash collateral received and posted are offset by counterparty, and the net amount is reported in the Statement of Assets and Liabilities when the Fund believes there exists a legally enforceable right to set off the recognized amounts.
The Fund has adopted authoritative standards regarding disclosure about derivatives and hedging activities and how they affect the Fund’s Statement of Assets and Liabilities and Statement of Operations. For the six months ended June 30, 2013: long option contracts (1,186,100 contracts) were purchased and $88,233,063 in premiums were paid, written option contracts (1,724,851 contracts) were opened and $323,457,850 in premiums were received, equity swap contracts were opened with a notional value of $735,532,772 and closed with a notional value of $945,380,272 and an average of 12 forward currency exchange contract positions were open during the period.
The Merger Fund
NOTES TO THE FINANCIAL STATEMENTS (continued)
June 30, 2013 (Unaudited)
Note 2 — SIGNIFICANT ACCOUNTING POLICIES (continued)
Statement of Assets and Liabilities
Fair values of derivative instruments as of June 30, 2013:
| | | Asset Derivatives | | | Liability Derivatives | |
| | | Statement of Assets | | | | | | Statement of Assets | | | | |
| Derivatives | | and Liabilities Location | | | Fair Value | | | and Liabilities Location | | | Fair Value | |
| Equity Contracts: | | | | | | | | | | | | |
| Purchased Options | | Investments | | | $ | 25,828,816 | | | N/A | | | $ | — | |
| Written Option Contracts | | | N/A | | | | — | | | Written Options | | | | 157,082,160 | |
| Swap Contracts | | | N/A | | | | — | | | Payables | | | | 63,423,857 | |
| Foreign exchange contracts: | | | | | | | | | | | | | | | | |
| Forward Currency | | | | | | | | | | | | | | | | |
| Exchange Contracts | | Receivables | | | | 12,369,385 | | | Payables | | | | 2,067,206 | |
| Total | | | | | | $ | 38,198,201 | | | | | | | $ | 222,573,223 | |
Statement of Operations
The effect of derivative instruments on the Statement of Operations for the six month period ended June 30, 2013:
Amount of Realized Gain (Loss) on Derivatives
| | | | | | | | | Forward | | | | | | | |
| | | | | | Written | | | Currency | | | | | | | |
| | | Purchased | | | Option | | | Exchange | | | Swap | | | | |
| Derivatives | | Options | | | Contracts | | | Contracts | | | Contracts | | | Total | |
| Equity contracts | | $ | (89,792,436 | ) | | $ | (15,568,182 | ) | | $ | — | | | $ | 8,322,487 | | | $ | (97,038,131 | ) |
| Foreign exchange | | | | | | | | | | | | | | | | | | | | |
| contracts | | | — | | | | — | | | | 9,863,870 | | | | — | | | | 9,863,870 | |
| Total | | $ | (89,792,436 | ) | | $ | (15,568,182 | ) | | $ | 9,863,870 | | | $ | 8,322,487 | | | $ | (87,174,261 | ) |
Change in Unrealized Appreciation (Depreciation) on Derivatives
| | | | | | | | | Forward | | | | | | | |
| | | | | | Written | | | Currency | | | | | | | |
| | | Purchased | | | Option | | | Exchange | | | Swap | | | | |
| Derivatives | | Options | | | Contracts | | | Contracts | | | Contracts | | | Total | |
| Equity contracts | | $ | (1,415,068 | ) | | $ | (2,865,204 | ) | | $ | — | | | $ | (68,483,872 | ) | | $ | (72,764,144 | ) |
| Foreign exchange | | | | | | | | | | | | | | | | | | | | |
| contracts | | | — | | | | — | | | | 14,750,376 | | | | — | | | | 14,750,376 | |
| Total | | $ | (1,415,068 | ) | | $ | (2,865,204 | ) | | $ | 14,750,376 | | | $ | (68,483,872 | ) | | $ | (58,013,768 | ) |
The Merger Fund
NOTES TO THE FINANCIAL STATEMENTS (continued)
June 30, 2013 (Unaudited)
Note 3 —AGREEMENTS AND INVESTMENT ADVISER TRANSACTION
The Fund’s investment adviser is Westchester Capital Management, LLC pursuant to an investment advisory agreement with the Adviser dated as of January 1, 2011 (the “Advisory Agreement”). Under the terms of this Advisory Agreement, the Adviser is entitled to receive a fee, calculated daily and payable monthly, at the annual rate of 1.00% of the Fund’s average daily net assets. The Adviser has agreed to reduce its advisory fee so that the advisory fee will be: (i) 1.0% on an annualized basis of the average daily net assets of the Fund on net assets below $1.5 billion; (ii) 0.9% on an annualized basis of the average daily net assets of the Fund on net assets between $1.5 billion and $2.0 billion; (iii) 0.8% on an annualized basis of the average daily net assets of the Fund on net assets between $2.0 billion and $5.0 billion and (iv) 0.75% on an annualized basis of the average daily net assets of the Fund on net assets over $5.0 billion. Investment advisory fees voluntarily waived by the Adviser for the six months ended June 30, 2013 were $2,677,197. Certain officers of the Fund are also officers of the Adviser. The Advisory Agreement was approved for an initial term of two years and thereafter will remain in effect from year to year provided that such continuance is specifically approved at least annually by the vote of a majority of the Fund’s Trustees who are not interested persons of the Adviser or the Fund or by a vote of a majority of the outstanding voting securities of the Fund.
U.S. Bancorp Fund Services, LLC, a subsidiary of U.S. Bancorp, a publicly held bank holding company, serves as transfer agent, administrator, accountant, dividend paying agent and shareholder servicing agent for the Fund. U.S. Bank, N.A. serves as custodian for the Fund.
Distribution services are performed pursuant to distribution contracts with broker-dealers and other qualified institutions.
Note 4 — SHARES OF BENEFICIAL INTEREST
The Board of Trustees has the authority to issue an unlimited amount of shares of beneficial interest without par value.
Changes in shares of beneficial interest were as follows:
| | | Six Months Ended | | | Year Ended | |
| | | June 30, 2013 | | | December 31, 2012 | |
| | | Shares | | | Amount | | | Shares | | | Amount | |
| Issued | | | 60,361,029 | | | $ | 955,823,943 | | | | 99,051,598 | | | $ | 1,564,853,341 | |
| Issued as reinvestment | | | | | | | | | | | | | | | | |
| of dividends | | | — | | | | — | | | | 4,438,197 | | | | 69,990,348 | |
| Redemption fee | | | — | | | | — | | | | — | | | | 14,104 | |
| Redeemed | | | (53,789,704 | ) | | | (851,363,623 | ) | | | (146,954,200 | ) | | | (2,324,434,239 | ) |
| Net increase (decrease) | | | 6,571,325 | | | $ | 104,460,320 | | | | (43,464,405 | ) | | $ | (689,576,446 | ) |
NOTES TO THE FINANCIAL STATEMENTS (continued)
June 30, 2013 (Unaudited)
Note 5 — INVESTMENT TRANSACTIONS AND INCOME TAX INFORMATION
Purchases and sales of securities for the six months ended June 30, 2013 (excluding short-term investments, options, forward currency contracts, swap contracts and short positions) aggregated $3,774,211,917, and $3,070,162,198, respectively. There were no purchases or sales of U.S. Government securities.
At December 31, 2012, the components of accumulated earnings (losses) on a tax basis were as follows:
| | Cost of investments | | $ | 4,114,514,584 | |
| | Gross unrealized appreciation | | | 131,939,897 | |
| | Gross unrealized depreciation | | | (82,327,973 | ) |
| | Net unrealized depreciation | | $ | 49,611,924 | |
| | Undistributed ordinary income | | | — | |
| | Undistributed long-term capital gain | | | — | |
| | Total distributable earnings | | $ | — | |
| | Other accumulated losses | | | (78,388,433 | ) |
| | Total accumulated losses | | $ | (28,776,509 | ) |
The tax components of dividends paid during the six months ended June 30, 2013 and the fiscal year ended December 31, 2012 were as follows:
| | | 2013 | | | 2012 | |
| Ordinary Income | | $ | — | | | $ | 88,732,213 | |
| Long-Term Capital Gains | | | — | | | | — | |
| Total Distributions Paid | | $ | — | | | $ | 88,732,213 | |
The Fund designated as long-term capital gain dividend, pursuant to Internal Revenue Case Section 852(b)(3), the amount necessary to reduce the earnings and profits of the Fund related to net capital gain to zero for the tax year ended December 31, 2012. The Fund utilized earnings and profits distributed to shareholders on redemptions of shares as part of the dividend paid deduction. The amount designated as long-term capital gains was $6,622,076.
As of December 31, 2012, the Fund did not have a post-October capital loss or a capital loss carryforward.
For the fiscal year ended December 31, 2012, certain dividends paid by the Fund may be subject to a maximum tax rate of 15% as provided for by the Jobs and Growth Tax Relief Reconciliation Act of 2003. The percentage of dividends declared from net investment income designated as qualified dividend income for the fiscal year ended December 31, 2012 was 55.73% (unaudited) for the Fund.
The Merger Fund
NOTES TO THE FINANCIAL STATEMENTS (continued)
June 30, 2013 (Unaudited)
Note 5 — INVESTMENT TRANSACTIONS AND INCOME TAX INFORMATION (continued)
For corporate shareholders, the percent of ordinary income distributions qualifying for the corporate dividends-received deduction for the fiscal year ended December 31, 2012 was 46.14% (unaudited) for the Fund. The percentage of taxable ordinary income distributions that are designated as short-term capital gain distributions under Internal Revenue Code Section 871(k)(2)(c) for the fiscal year ended December 31, 2012 was 23.49% (unaudited) for the Fund.
Note 6 — WRITTEN OPTION CONTRACTS
The premium amount and the number of written option contracts during the six months ended June 30, 2013 were as follows:
| | | Number of Contracts | | | Premium Amount | |
| Options outstanding at December 31, 2012 | | | 804,080 | | | $ | 202,586,126 | |
| Options written | | | 1,724,851 | | | | 323,457,850 | |
| Options closed | | | (1,248,367 | ) | | | (224,383,924 | ) |
| Options exercised | | | (531,179 | ) | | | (133,495,040 | ) |
| Options expired | | | (120,752 | ) | | | (9,498,956 | ) |
| Options outstanding at June 30, 2013 | | | 628,633 | | | $ | 158,666,056 | |
Note 7 — DISTRIBUTION PLAN
The Fund has adopted an Amended and Restated Plan of Distribution (the “Plan”) dated July 19, 2005, pursuant to Rule 12b-1 under the 1940 Act. Under the Plan, the Fund will compensate broker dealers or other qualified institutions with whom the Fund has entered into a contract to distribute Fund shares. Under the Plan, the amount of such compensation paid in any one year shall not exceed 0.25% annually of the average daily net assets of the Fund, which may be payable as a distribution fee or a service fee for providing permitted recordkeeping, subaccounting, subtransfer agency and/or shareholder liaison services. For the six months ended June 30, 2013, incurred $3,916,017 pursuant to the Plan. The Plan will remain in effect from year to year provided such continuance is approved at least annually by a vote either of a majority of the Trustees, including a majority of the non-interested Trustees, or a majority of the Fund’s outstanding shares.
The Merger Fund
NOTES TO THE FINANCIAL STATEMENTS (continued)
June 30, 2013 (Unaudited)
Note 8 — TRANSACTIONS WITH AFFILIATES
Pursuant to Section (2)(a)(3) of the 1940 Act, if the Fund owns 5% or more of the outstanding voting securities of an issuer, the issuer is deemed to be an affiliate of the Fund. During the six months ended June 30, 2013, the Fund owned the following positions in such companies for investment purposes only:
| | | Share | | | | | | | | | Share | | | Market | | | | | | | |
| | | Balance at | | | | | | | | | Balance at | | | Value at | | | | | | Realized | |
| | | December 31, | | | | | | | | | June 30, | | | June 30, | | | Dividend | | | Gain | |
| Issuer Name | | 2012 | | | Purchases | | | Sales | | | 2013 | | | 2013 | | | Income | | | (Loss) | |
| Arbitron, Inc. | | | 691,532 | | | | 795,699 | | | | — | | | | 1,487,231 | | | $ | 69,081,880 | | | $ | 250,260 | | | | — | |
| WMS Industries, Inc. | | | — | | | | 2,806,813 | | | | — | | | | 2,806,813 | | | | 71,601,800 | | | | — | | | | — | |
| | | | | | | | | | | | | | | | | | | $ | 140,683,680 | | | $ | 250,260 | | | $ | — | |
Note 9 — OFFSETTING ASSETS AND LIABILITIES
The Fund is subject to various Master Netting Arrangements, which govern the terms of certain transactions with select counterparties. The Master Netting Arrangements allow the Fund to close out and net its total exposure to a counterparty in the event of a default with respect to all the transactions governed under a single agreement with a counterparty. The Master Netting Arrangements also specify collateral posting arrangements at pre-arranged exposure levels. Under the Master Netting Arrangements, collateral is routinely transferred if the total net exposure to certain transactions (net of existing collateral already in place) governed under the relevant Master Netting Arrangement with a counterparty in a given account exceeds a specified threshold depending on the counterparty and the type of Master Netting Arrangement.
Assets:
| | | | | | | | | | | | Gross Amounts not offset | | | | |
| | | | | | | | | | | | in the Statement | | | | |
| | | | | | | | | | | | of Assets and Liabilities | | | | |
| | | | | | Gross Amounts | | | Net Amounts | | | | | | | | | | |
| | | Gross | | | Offset in the | | | Presented in | | | | | | | | | | |
| | | Amounts of | | | Statement | | | the Statement | | | | | | | | | | |
| | | Recognized | | | of Assets | | | of Assets | | | Financial | | | Collateral | | | Net | |
| | | Assets | | | and Liabilities | | | and Liabilities | | | Instruments | | | Received | | | Amount | |
| Description | | | | | | | | | | | | | | | | | | |
| Forward Contracts | | $ | 12,369,385 | | | $ | — | | | $ | 12,369,385 | | | $ | 2,067,206 | | | $ | — | | | $ | 10,302,179 | |
| Swap Contracts — | | | | | | | | | | | | | | | | | | | | | | | | |
| JPMorgan Chase | | | | | | | | | | | | | | | | | | | | | | | | |
| & Co. Inc. | | | 135,302 | | | | — | | | | 135,302 | | | | 135,302 | | | | — | | | | — | |
| | | $ | 12,504,687 | | | $ | — | | | $ | 12,504,687 | | | $ | 2,202,508 | | | $ | — | | | $ | 10,302,179 | |
The Merger Fund
NOTES TO THE FINANCIAL STATEMENTS (continued)
June 30, 2013 (Unaudited)
Note 9 — OFFSETTING ASSETS AND LIABILITIES (continued)
Liabilities:
| | | | | | | | | | | | Gross Amounts not offset | | | | |
| | | | | | | | | | | | in the Statement | | | | |
| | | | | | | | | | | | of Assets and Liabilities | | | | |
| | | | | | Gross Amounts | | | Net Amounts | | | | | | | | | | |
| | | Gross | | | Offset in the | | | Presented in | | | | | | | | | | |
| | | Amounts of | | | Statement | | | the Statement | | | | | | | | | | |
| | | Recognized | | | of Assets | | | of Assets | | | Financial | | | Collateral | | | Net | |
| | | Liabilities | | | and Liabilities | | | and Liabilities | | | Instruments | | | Pledged | | | Amount | |
| Description | | | | | | | | | | | | | | | | | | |
| Forward Contracts | | $ | 2,067,206 | | | $ | — | | | $ | 2,067,206 | | | $ | 2,067,206 | | | $ | — | | | $ | — | |
| Swap Contracts — | | | | | | | | | | | | | | | | | | | | | | | | |
| JPMorgan Chase | | | | | | | | | | | | | | | | | | | | | | | | |
| & Co. Inc. | | | 59,200,913 | | | | — | | | | 59,200,913 | | | | 135,302 | | | | 59,065,611 | | | | — | |
| Swap Contracts — | | | | | | | | | | | | | | | | | | | | | | | | |
| Merrill Lynch | | | | | | | | | | | | | | | | | | | | | | | | |
| & Co. Inc. | | | 4,358,246 | | | | — | | | | 4,358,246 | | | | — | | | | 4,358,246 | | | | — | |
| Written Options | | | 157,082,160 | | | | — | | | | 157,082,160 | | | | — | | | | 157,082,160 | | | | — | |
| | | $ | 222,708,525 | | | $ | — | | | $ | 222,708,525 | | | $ | 2,202,508 | | | $ | 220,506,017 | | | $ | — | |
Note 10 — SUBSEQUENT EVENTS
On August 1, 2013 the Fund began to offer a new class of shares, classified as Institutional Class shares. These shares are offered subject to a $1,000,000 minimum investment and certain other conditions. The Fund’s existing class of shares has been designated Investor Class shares.
On July 16, 2013, Roy Behren and Barry Hamerling were reelected and Michael T. Shannon, Richard V. Silver and Christianna Wood were elected to the Board of Trustees. Mr. Shannon’s term as a Trustee of the Fund is expected to begin on January 1, 2014. Below are the details of the shareholder meeting.
VOTING RESULTS OF SPECIAL MEETING OF SHAREHOLDERS
A Special Meeting of Shareholders of the Fund was held on July 16, 2013. The proposal to reelect Messrs. Roy Behren and Barry Hamerling and to elect Messrs. Michael T. Shannon, Richard V. Silver and Ms. Christianna Wood to the Fund’s Board of Trustees, was approved by the affirmative vote of shareholders owning of record a plurality of the total number of Fund shares voted at the meeting. A summary of voting results follows:
ELECTION OF THE FUND’S BOARD OF TRUSTEES
| Roy Behren | For | 280,793,457 | Withhold | 1,518,075 |
| Barry Hamerling | For | 280,700,476 | Withhold | 1,611,056 |
| Michael T. Shannon | For | 280,802,746 | Withhold | 1,508,786 |
| Richard V. Silver | For | 281,065,261 | Withhold | 1,246,271 |
| Christianna Wood | For | 280,924,441 | Withhold | 1,387,091 |
The Merger Fund
AVAILABILITY OF PROXY VOTING INFORMATION
Information regarding how the Fund generally votes proxies relating to portfolio securities may be obtained without charge by calling the Fund’s Transfer Agent at 1-800-343-8959 or by visiting the SEC’s website at www.sec.gov. Information regarding how the Fund voted proxies during the most recent 12-month period ended June 30 is available on the SEC’s website or by calling the toll-free number listed above.
AVAILABILITY OF QUARTERLY PORTFOLIO SCHEDULE
The Fund files its complete schedule of portfolio holdings with the SEC for the first and third quarters of each fiscal year on Form N-Q. The Fund’s Forms N-Q are available on the SEC’s website at www.sec.gov and may be reviewed and copied at the SEC’s Public Reference Room in Washington, DC. Information on the operation of the Public Reference Room may be obtained by calling 1-800-SEC-0330.
(This Page Intentionally Left Blank.)
Investment Adviser
Westchester Capital Management, LLC
100 Summit Lake Drive
Valhalla, NY 10595
(914) 741-5600
www.mergerfund.com
Administrator, Transfer Agent, Accountant,
Dividend Paying Agent and Shareholder Servicing Agent
U.S. Bancorp Fund Services, LLC
615 East Michigan Street
P.O. Box 701
Milwaukee, WI 53201-0701
(800) 343-8959
Custodian
U.S. Bank, N.A.
1555 North Rivercenter Drive, Suite 302
Milwaukee, WI 53212
(800) 343-8959
Trustees
Roy Behren
James P. Logan, III
Barry Hamerling
Richard V. Silver
Christianna Wood
Executive Officers
Roy Behren, Co-President and Treasurer
Michael T. Shannon, Co-President
Bruce Rubin, Vice President and
Chief Compliance Officer
Abraham R. Cary, Secretary
Counsel
Ropes & Gray LLP
1211 Avenue of the Americas
New York, NY 10036
Independent Registered Public Accounting Firm
PricewaterhouseCoopers LLP
100 East Wisconsin Avenue
Milwaukee, WI 53202
Item 2. Code of Ethics.
Not applicable for semi-annual reports.
Item 3. Audit Committee Financial Expert.
Not applicable for semi-annual reports.
Item 4. Principal Accountant Fees and Services.
Not applicable for semi-annual reports.
Item 5. Audit Committee of Listed Registrants.
Not applicable.
Item 6. Investments.
The registrant’s Schedule of Investments is included as part of the report to shareholders filed under Item 1 of this Form.
Item 7. Disclosure of Proxy Voting Policies and Procedures for Closed-End Management Investment Companies.
Not applicable.
Item 8. Portfolio Managers of Closed-End Management Investment Companies.
Not applicable.
Item 9. Purchases of Equity Securities by Closed-End Management Investment Company and Affiliated Purchasers.
Not applicable.
Item 10. Submission of Matters to a Vote of Security Holders.
There have been no material changes to the procedures by which shareholders may recommend nominees to the registrant’s board of trustees.
Item 11. Controls and Procedures.
| (a) | The Registrant’s Co-Presidents/Chief Executive Officers and Treasurer/Chief Financial Officer have reviewed the Registrant's disclosure controls and procedures (as defined in Rule 30a-3(c) under the Investment Company Act of 1940 (the “Act”)) as of a date within 90 days of the filing of this report, as required by Rule 30a-3(b) under the Act and Rules 13a-15(b) or 15d-15(b) under the Securities Exchange Act of 1934. Based on their review, such officers have concluded that the disclosure controls and procedures are effective in ensuring that information required to be disclosed in this report is appropriately recorded, processed, summarized and reported and made known to them by others within the registrant and by the registrant’s service provider. |
| (b) | There were no changes in the registrant's internal control over financial reporting (as defined in Rule 30a-3(d) under the Act) that occurred during the second fiscal quarter of the period covered by this report that has materially affected, or is reasonably likely to materially affect, the Registrant's internal control over financial reporting. |
Item 12. Exhibits.
(1) Any code of ethics or amendment thereto, that is the subject of the disclosure required by Item 2, to the extent that the registrant intends to satisfy Item 2 requirements through filing an exhibit. Filed herewith.
(2) A separate certification for each principal executive and principal financial officer pursuant to Section 302 of the Sarbanes-Oxley Act of 2002. Filed herewith.
(3) Any written solicitation to purchase securities under Rule 23c-1 under the Act sent or given during the period covered by the report by or on behalf of the registrant to 10 or more persons. Not applicable to open-end investment companies.
| (a) | Certifications pursuant to Section 906 of the Sarbanes-Oxley Act of 2002. Furnished herewith. |
SIGNATURES
Pursuant to the requirements of the Securities Exchange Act of 1934 and the Investment Company Act of 1940, the registrant has duly caused this report to be signed on its behalf by the undersigned, thereunto duly authorized.
(Registrant) The Merger Fund
By (Signature and Title)*/s/ Michael T. Shannon
Michael T. Shannon, Co-President
Date 8/29/2013
By (Signature and Title)*/s/ Roy Behren
Roy Behren, Co-President and Treasurer
Date 8/29/2013
Pursuant to the requirements of the Securities Exchange Act of 1934 and the Investment Company Act of 1940, this report has been signed below by the following persons on behalf of the registrant and in the capacities and on the dates indicated.
By (Signature and Title)*/s/ Michael T. Shannon
Michael T. Shannon, Co-President
Date 8/29/2013
By (Signature and Title)*/s/ Roy Behren
Roy Behren, Co-President and Treasurer
Date 8/29/2013
* Print the name and title of each signing officer under his or her signature.