UNITED STATES
SECURITIES AND EXCHANGE COMMISSION
Washington, D.C. 20549
FORM N-CSR
CERTIFIED SHAREHOLDER REPORT OF REGISTERED MANAGEMENT INVESTMENT
COMPANIES
Investment Company Act file number 811-03445
The Merger Fund
(Exact name of registrant as specified in charter)
100 Summit Lake Drive
Valhalla, New York 10595
(Address of principal executive offices) (Zip code)
Roy Behren and Michael T. Shannon
100 Summit Lake Drive
Valhalla, New York 10595
(Name and address of agent for service)
1-800-343-8959
Registrant's telephone number, including area code
Date of fiscal year end: December 31, 2017
Date of reporting period: June 30, 2017
Item 1. Reports to Stockholders.
June 30, 2017
THE MERGER FUND
WCM ALTERNATIVES:
EVENT-DRIVEN FUND
DEAL COMPOSITION
The Merger Fund (Unaudited)
| Type of Buyer | | | | Deal Terms* | | |
| Strategic | 100.0% | | | | Cash & Stock | 38.0% | |
| Financial | 0.0% | | | | Cash | 35.4% | |
| | | | | | Stock and Stub(1) | 18.7% | |
| By Deal Type | | | | Stock with Fixed Exchange Ratio | 5.0% | |
| Friendly | 100.0% | | | | Undetermined(2) | 2.8% | |
| Hostile | 0.0% | | | | Stock with Flexible | | |
| | | | | | Exchange Ratio (Collar) | 0.1% | |
| * | Data expressed as a percentage of long common stock, corporate bonds and swap contract positions as of June 30, 2017. |
| 1 | “Stub” includes assets other than cash and stock (e.g., escrow notes). |
| 2 | The compensation is undetermined because the compensation to be received (e.g., stock, cash, escrow notes, other) will be determined at a later date, potentially at the option of the Fund’s investment adviser. |
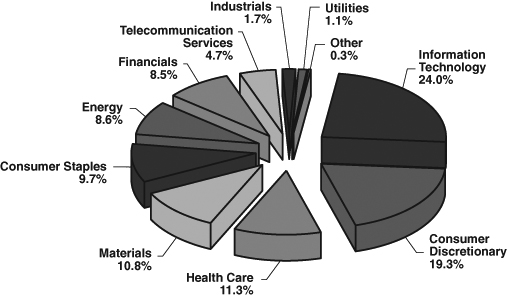
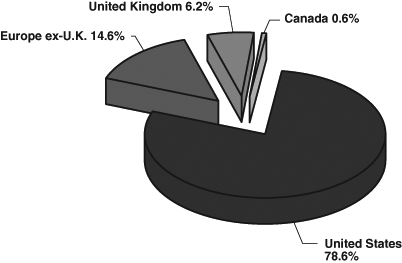
PORTFOLIO COMPOSITION*
The Merger Fund (Unaudited)
By Sector
By Region
| * | Data expressed as a percentage of long common stock, corporate bonds and swap contract positions as of June 30, 2017. Data expressed excludes short-term investments, short investments, written options, forward currency exchange contracts and short total return swap contracts. Please refer to the Schedule of Investments, Schedule of Options Written, Schedule of Forward Currency Exchange Contracts and Schedule of Swap Contracts for more details on the Fund’s individual holdings. |
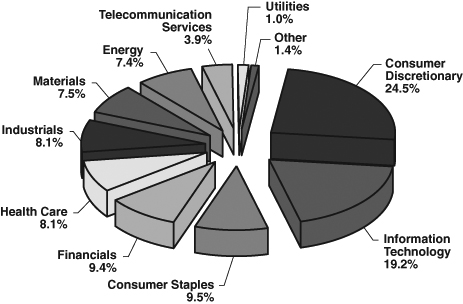
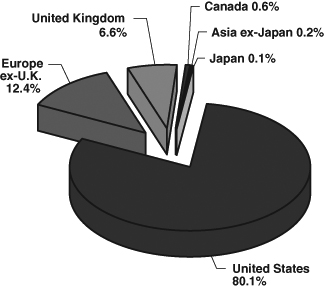
PORTFOLIO COMPOSITION*
WCM Alternatives: Event-Driven Fund (Unaudited)
By Sector
By Region
| * | Data expressed as a percentage of long common stock, corporate bonds and swap contract positions as of June 30, 2017. Data expressed excludes short-term investments, short investments, written options, forward currency exchange contracts and short total return swap contracts. Please refer to the Schedule of Investments, Schedule of Options Written, Schedule of Forward Currency Exchange Contracts and Schedule of Swap Contracts for more details on the Fund’s individual holdings. |
The Global Industry Classification Standard (GICS®) was developed by and/or is the exclusive property of MSCI, Inc. and Standard & Poor’s Financial Services LLC (“S&P”). GICS is a service mark of MSCI and S&P and has been licensed for use by U.S. Bancorp Fund Services, LLC.
The Merger Fund and WCM Alternatives: Event-Driven Fund
EXPENSE EXAMPLE
June 30, 2017 (Unaudited)
As a shareholder of The Merger Fund and/or WCM Alternatives: Event-Driven Fund (the “Funds”), you incur two types of costs: (1) transaction costs and (2) ongoing costs, including management fees, and other fund specific expenses. The expense example is intended to help a shareholder understand ongoing costs (in dollars) of investing in a fund and to compare these costs with the ongoing costs of investing in other mutual funds. The example is based on an investment of $1,000 invested at the beginning of the period and held for the most recent six-month period.
The Actual Expenses comparison provides information about actual account values and actual expenses. A shareholder may use the information in this line, together with the amount invested, to estimate the expenses paid over the period. A shareholder may divide his/her account value by $1,000 (e.g., an $8,600 account value divided by $1,000 = 8.6), then multiply the result by the number in the first line under the heading entitled “Expenses Paid During Period” to estimate the expenses paid on his/her account during this period. The example below includes, among other fees, management fees, fund accounting, custody and transfer agent fees. However, the example does not include portfolio trading commissions and related expenses or extraordinary expenses.
The Hypothetical Example for Comparison Purposes provides information about hypothetical account values and hypothetical expenses based on each Funds’ actual expense ratios and assumed rates of return of 5% per year before expenses, which are not the Funds’ actual returns. The hypothetical account values and expenses may not be used to estimate the actual ending account balance or expenses paid for the period. A shareholder may use this information to compare the ongoing costs of investing in the Funds and other funds. To do so, a shareholder would compare this 5% hypothetical example with the 5% hypothetical examples that appear in the shareholder reports of other funds.
The expenses shown in the table are meant to highlight your ongoing costs only and do not reflect any transactional costs, such as sales charges (loads), redemptions fees, or exchange fees. Therefore, the Hypothetical Example for Comparison Purposes is useful in comparing ongoing costs only, and will not help to determine the relevant total costs of owning different funds. In addition, if these transactional costs were included, shareholder costs would have been higher.
The Merger Fund and WCM Alternatives: Event-Driven Fund
EXPENSE EXAMPLE (continued)
June 30, 2017 (Unaudited)
| | Annualized | Beginning | Ending | Expenses Paid |
| | Net Expense | Account | Account | During Period |
| | Ratio | Value | Value | 1/1/17- |
| | 6/30/17 | 1/1/17 | 6/30/17 | 6/30/17(1) |
| The Merger Fund |
| Investor Class | | | | |
Actual Expenses(2)(3) | 1.75% | $1,000.00 | $1,021.10 | $8.77 |
| Hypothetical Example for | | | | |
| Comparison Purposes | | | | |
| (5% return before | | | | |
expenses)(3) | 1.75% | $1,000.00 | $1,016.12 | $8.75 |
| Institutional Class | | | | |
Actual Expenses(2)(3) | 1.43% | $1,000.00 | $1,023.10 | $7.17 |
| Hypothetical Example for | | | | |
| Comparison Purposes | | | | |
| (5% return before | | | | |
expenses)(3) | 1.43% | $1,000.00 | $1,017.70 | $7.15 |
| | | | | |
| | Annualized | Beginning | Ending | Expenses Paid |
| | Net Expense | Account | Account | During Period |
| | Ratio | Value | Value | 3/23/17- |
| | 6/30/17 | 3/23/17 | 6/30/17 | 6/30/17(1) |
| WCM Alternatives: Event-Driven Fund |
| Investor Class | | | | |
Actual Expenses(2)(4) | 2.53% | $1,000.00 | $1,032.40 | $7.04 |
| Hypothetical Example for | | | | |
| Comparison Purposes | | | | |
| (5% return before | | | | |
expenses)(4) | 2.53% | $1,000.00 | $1,006.77 | $6.95 |
| | | | | |
| | Annualized | Beginning | Ending | Expenses Paid |
| | Net Expense | Account | Account | During Period |
| | Ratio | Value | Value | 1/1/17- |
| | 6/30/17 | 1/1/17 | 6/30/17 | 6/30/17(1) |
| WCM Alternatives: Event-Driven Fund |
| Institutional Class | | | | |
Actual Expenses(2)(4) | 2.22% | $1,000.00 | $1,041.80 | $11.24 |
| Hypothetical Example for | | | | |
| Comparison Purposes | | | | |
| (5% return before | | | | |
expenses)(4) | 2.22% | $1,000.00 | $1,013.79 | $11.08 |
The Merger Fund and WCM Alternatives: Event-Driven Fund
EXPENSE EXAMPLE (continued)
June 30, 2017 (Unaudited)
| (1) | Expenses are equal to the Fund’s annualized net expense ratio, multiplied by the average account value over the period, multiplied by 181/365 to reflect the one-half year period, with the exception of the WCM Alternatives: Event Driven Fund’s Investor Class which is multiplied by the average account value over the period, multiplied by 100/365 to reflect the period March 22, 2017 through June 30, 2017. |
| (2) | Based on the actual returns of 2.11%, 2.31%, and 4.18% for the six month-period ended June 30, 2017 for The Merger Fund Investor and Institutional Classes and WCM Alternatives: Event-Driven Fund Institutional Class, respectively. Based on the actual returns of 3.24% for the period March 22, 2017 through June 30, 2017 for WCM Alternatives: Event-Driven Fund Investor Class. |
| (3) | Excluding dividends and interest on short positions and borrowing expense on securities sold short, your actual cost of investment and your hypothetical cost of investment would have been $7.12 and $7.10, respectively in the The Merger Fund Investor Class and $5.52 and $5.51, respectively in The Merger Fund Institutional Class. |
| (4) | Excluding dividends and interest on short positions and borrowing expense on securities sold short, your actual cost of investment and your hypothetical cost of investment would have been $5.54 and $5.47, respectively in WCM Alternatives: Event-Driven Fund Investor Class and $8.81 and $8.70, respectively in WCM Alternatives: Event-Driven Fund Institutional Class. |
The Merger Fund
SCHEDULE OF INVESTMENTS
June 30, 2017 (Unaudited)
| | | Shares | | | Value | |
| | | | | | | |
| LONG INVESTMENTS — 103.44% | | | | | | |
| | | | | | | |
| COMMON STOCKS — 66.16% | | | | | | |
| | | | | | | |
| AEROSPACE & DEFENSE — 0.29% | | | | | | |
| DigitalGlobe, Inc. (a) | | | 243,806 | | | $ | 8,118,740 | |
| | | | | | | | | |
| ALTERNATIVE CARRIERS — 3.35% | | | | | | | | |
| Level 3 Communications, Inc. (a)(e) | | | 1,601,552 | | | | 94,972,034 | |
| | | | | | | | | |
| APPLICATION SOFTWARE — 3.42% | | | | | | | | |
| Mobileye NV (a)(b) | | | 1,545,483 | | | | 97,056,332 | |
| | | | | | | | | |
| ASSET MANAGEMENT & CUSTODY BANKS — 1.69% | | | | | | | | |
| Fortress Investment Group LLC Class A | | | 6,001,753 | | | | 47,954,006 | |
| | | | | | | | | |
| BIOTECHNOLOGY — 0.00% | | | | | | | | |
| Mersana Therapeutics, Inc. (a) | | | 413 | | | | 5,770 | |
| | | | | | | | | |
| COMMODITY CHEMICALS — 0.54% | | | | | | | | |
| Valvoline, Inc. | | | 640,647 | | | | 15,196,145 | |
| | | | | | | | | |
| DIVERSIFIED CHEMICALS — 5.42% | | | | | | | | |
| The Dow Chemical Company | | | 2,394 | | | | 150,990 | |
| E. I. du Pont de Nemours and Company | | | 991,103 | | | | 79,991,923 | |
| Huntsman Corporation | | | 2,846,200 | | | | 73,545,808 | |
| | | | | | | | 153,688,721 | |
| | | | | | | | | |
| DRUG RETAIL — 0.18% | | | | | | | | |
| Rite Aid Corporation (a)(e) | | | 1,751,455 | | | | 5,166,792 | |
| | | | | | | | | |
| FERTILIZERS & AGRICULTURAL CHEMICALS — 1.02% | | | | | | | | |
| Monsanto Company | | | 243,600 | | | | 28,832,496 | |
| | | | | | | | | |
| FOOD RETAIL — 0.13% | | | | | | | | |
| Whole Foods Market, Inc. | | | 86,243 | | | | 3,631,693 | |
| | | | | | | | | |
| HEALTH CARE EQUIPMENT — 5.06% | | | | | | | | |
| C.R. Bard, Inc. (e) | | | 453,428 | | | | 143,333,125 | |
| | | | | | | | | |
| HEALTH CARE FACILITIES — 1.35% | | | | | | | | |
| VCA, Inc. (a) | | | 413,996 | | | | 38,215,971 | |
| | | | | | | | | |
| HEALTH CARE SUPPLIES — 1.79% | | | | | | | | |
| Alere, Inc. (a) | | | 1,010,532 | | | | 50,718,601 | |
| | | | | | | | | |
| HOUSEWARES & SPECIALTIES — 4.49% | | | | | | | | |
| Jarden Corporation (a)(d)(g)(j) | | | 2,025,678 | | | | 127,374,430 | |
| | | | | | | | | |
| INVESTMENT COMPANIES — 0.28% | | | | | | | | |
| Forum Merger Corporation (a) | | | 284,888 | | | | 2,903,009 | |
| Modern Media Acquisition Corporation (a) | | | 477,701 | | | | 4,901,212 | |
| | | | | | | | 7,804,221 | |
The accompanying notes are an integral part of these financial statements.
The Merger Fund
SCHEDULE OF INVESTMENTS (continued)
June 30, 2017 (Unaudited)
| | | Shares | | | Value | |
| MOVIES & ENTERTAINMENT — 6.78% | | | | | | |
| Time Warner, Inc. (e) | | | 1,914,297 | | | $ | 192,214,562 | |
| | | | | | | | | |
| MULTI-LINE INSURANCE — 2.52% | | | | | | | | |
| American International Group, Inc. (e) | | | 1,143,700 | | | | 71,504,124 | |
| | | | | | | | | |
| OIL & GAS EQUIPMENT & SERVICES — 2.14% | | | | | | | | |
| Baker Hughes, Inc. (e) | | | 1,111,831 | | | | 60,605,908 | |
| | | | | | | | | |
| OIL & GAS EXPLORATION & PRODUCTION — 1.08% | | | | | | | | |
| Rice Energy, Inc. (a) | | | 1,155,240 | | | | 30,764,041 | |
| | | | | | | | | |
| OIL & GAS REFINING & MARKETING — 0.03% | | | | | | | | |
| Showa Shell Sekiyu K.K. (b) | | | 93,792 | | | | 868,915 | |
| | | | | | | | | |
| OIL & GAS STORAGE & TRANSPORTATION — 3.41% | | | | | | | | |
| Columbia Pipeline Group, Inc. (a)(d)(g)(j) | | | 2,276,354 | | | | 58,561,551 | |
| ONEOK Partners LP | | | 497,036 | | | | 25,383,628 | |
| Veresen, Inc. (b) | | | 309,131 | | | | 4,371,887 | |
| VTTI Energy Partners LP (b) | | | 424,341 | | | | 8,338,301 | |
| | | | | | | | 96,655,367 | |
| | | | | | | | | |
| PAPER PACKAGING — 1.36% | | | | | | | | |
| Sealed Air Corporation | | | 859,000 | | | | 38,448,840 | |
| | | | | | | | | |
| REGIONAL BANKS — 0.07% | | | | | | | | |
| Stonegate Bank | | | 43,244 | | | | 1,997,008 | |
| | | | | | | | | |
| REITs — 0.97% | | | | | | | | |
| Care Capital Properties, Inc. | | | 8,341 | | | | 222,705 | |
| FelCor Lodging Trust, Inc. | | | 2,465,280 | | | | 17,774,669 | |
| Starwood Property Trust, Inc. (e) | | | 424,863 | | | | 9,512,682 | |
| | | | | | | | 27,510,056 | |
| | | | | | | | | |
| SEMICONDUCTORS — 7.57% | | | | | | | | |
| NXP Semiconductors NV (a)(b)(e) | | | 1,961,239 | | | | 214,657,608 | |
| | | | | | | | | |
| SPECIALTY CHEMICALS — 1.37% | | | | | | | | |
| Ashland Global Holdings, Inc. (e) | | | 590,600 | | | | 38,926,446 | |
| | | | | | | | | |
| TECHNOLOGY HARDWARE, | | | | | | | | |
| STORAGE & PERIPHERALS — 2.50% | | | | | | | | |
| Hewlett Packard Enterprise Company (e) | | | 4,276,300 | | | | 70,943,817 | |
| | | | | | | | | |
| TOBACCO — 7.19% | | | | | | | | |
| Reynolds American, Inc. (e) | | | 3,133,047 | | | | 203,773,377 | |
| | | | | | | | | |
| TRUCKING — 0.16% | | | | | | | | |
| Swift Transportation Company (a) | | | 172,551 | | | | 4,572,602 | |
| TOTAL COMMON STOCKS (Cost $1,809,473,960) | | | | | | | 1,875,511,748 | |
The accompanying notes are an integral part of these financial statements.
The Merger Fund
SCHEDULE OF INVESTMENTS (continued)
June 30, 2017 (Unaudited)
| | | Shares | | | Value | |
| CLOSED-END FUNDS — 8.11% | | | | | | |
| Altaba, Inc. (a)(e) | | | 4,223,009 | | | $ | 230,069,530 | |
| TOTAL CLOSED-END FUNDS (Cost $189,937,335) | | | | | | | 230,069,530 | |
| | | | | | | | | |
| CONTINGENT VALUE RIGHTS — 0.09% (a)(g) | | | | | | | | |
| Casa Ley, S.A. de C.V. | | | 1,713,496 | | | | 831,046 | |
| Media General, Inc. | | | 891,153 | | | | 1,804,585 | |
| Property Development Centers LLC | | | 1,713,496 | | | | 25,702 | |
| TOTAL CONTINGENT VALUE RIGHTS (Cost $431,892) | | | | | | | 2,661,333 | |
| | | | | | | | | |
| | | Principal | | | | | |
| | | Amount | | | | | |
| BANK LOANS — 0.55% (f) | | | | | | | | |
| Bass Pro Group LLC | | | | | | | | |
| 6.274%, 12/16/2023 (k) | | $ | 16,112,000 | | | | 15,683,018 | |
| TOTAL BANK LOANS (Cost $16,011,300) | | | | | | | 15,683,018 | |
| | | | | | | | | |
| CORPORATE BONDS — 6.38% (f) | | | | | | | | |
| Alere, Inc. | | | | | | | | |
| 6.500%, 6/15/2020 | | | 17,951,000 | | | | 18,287,581 | |
| Caesars Growth Properties Holdings LLC | | | | | | | | |
| 9.375%, 5/1/2022 | | | 6,372,000 | | | | 6,929,550 | |
| CST Brands, Inc. | | | | | | | | |
| 5.000%, 5/1/2023 (e) | | | 4,667,000 | | | | 4,924,618 | |
| Energy Future Intermediate Holding Company LLC | | | | | | | | |
| 11.000%, 10/1/2021 (h) | | | 2,012,922 | | | | 2,616,799 | |
| FairPoint Communications, Inc. | | | | | | | | |
| 8.750%, 8/15/2019 (i) | | | 13,596,000 | | | | 13,984,846 | |
| IASIS Healthcare LLC | | | | | | | | |
| 8.375%, 5/15/2019 | | | 22,303,000 | | | | 22,425,666 | |
| Level 3 Financing, Inc. | | | | | | | | |
| 4.939%, 1/15/2018 (e)(k) | | | 11,870,000 | | | | 11,925,789 | |
| Lloyds Bank plc | | | | | | | | |
| 6.850%, 7/17/2027 (b)(k) | | | 19,784,000 | | | | 20,110,040 | |
| Rice Energy, Inc. | | | | | | | | |
| 6.250%, 5/1/2022 | | | 20,040,000 | | | | 20,966,850 | |
| Rite Aid Corporation | | | | | | | | |
| 6.125%, 4/1/2023 (i) | | | 3,991,000 | | | | 3,941,113 | |
| Terraform Global Operating, LLC | | | | | | | | |
| 9.750%, 8/15/2022 (i) | | | 22,076,000 | | | | 24,835,500 | |
| Tribune Media Company | | | | | | | | |
| 5.875%, 7/15/2022 | | | 2,033,000 | | | | 2,139,733 | |
The accompanying notes are an integral part of these financial statements.
The Merger Fund
SCHEDULE OF INVESTMENTS (continued)
June 30, 2017 (Unaudited)
| | | Principal | | | | |
| | | Amount | | | Value | |
| West Corporation | | | | | | |
| 5.375%, 7/15/2022 (i) | | $ | 27,320,000 | | | $ | 27,661,500 | |
| TOTAL CORPORATE BONDS (Cost $181,139,005) | | | | | | | 180,749,585 | |
| | | | | | | | | |
| | | Contracts | | | | | |
| | | (100 shares | | | | | |
| | | per contract) | | | | | |
| PURCHASED CALL OPTIONS — 0.01% | | | | | | | | |
| Mead Johnson Nutrition Company | | | | | | | | |
| Expiration: January 2019, Exercise Price: $90.00 (f) | | | 480 | | | | — | |
| SPDR S&P 500 ETF Trust | | | | | | | | |
| Expiration: August 2017, Exercise Price: $248.00 | | | 2,398 | | | | 158,268 | |
| | | | | | | | 158,268 | |
| PURCHASED PUT OPTIONS — 0.19% | | | | | | | | |
| American International Group, Inc. | | | | | | | | |
| Expiration: July 2017, Exercise Price: $57.50 | | | 343 | | | | 2,401 | |
| Expiration: August 2017, Exercise Price: $55.00 | | | 7,936 | | | | 134,912 | |
| Ashland Global Holdings, Inc. | | | | | | | | |
| Expiration: July 2017, Exercise Price: $105.00 (l) | | | 2,324 | | | | 87,150 | |
| Expiration: October 2017, Exercise Price: $55.00 | | | 3,222 | | | | 185,265 | |
| AT&T, Inc. | | | | | | | | |
| Expiration: October 2017, Exercise Price: $37.00 | | | 15,589 | | | | 2,151,282 | |
| Baker Hughes, Inc. | | | | | | | | |
| Expiration: July 2017, Exercise Price: $52.50 | | | 10,588 | | | | 518,812 | |
| Expiration: August 2017, Exercise Price: $45.00 | | | 530 | | | | 7,178 | |
| The Dow Chemical Company | | | | | | | | |
| Expiration: September 2017, Exercise Price: $52.50 | | | 3,446 | | | | 96,488 | |
| Expiration: September 2017, Exercise Price: $57.50 | | | 74 | | | | 4,884 | |
| E. I. du Pont de Nemours and Company | | | | | | | | |
| Expiration: July 2017, Exercise Price: $72.50 | | | 2,878 | | | | 31,658 | |
| Hewlett Packard Enterprise Company | | | | | | | | |
| Expiration: August 2017, Exercise Price: $15.00 | | | 22,383 | | | | 223,830 | |
| Expiration: August 2017, Exercise Price: $16.00 | | | 18,078 | | | | 451,950 | |
| Huntsman Corporation | | | | | | | | |
| Expiration: August 2017, Exercise Price: $17.00 | | | 3,140 | | | | 7,850 | |
| Expiration: August 2017, Exercise Price: $20.00 | | | 13,869 | | | | 69,345 | |
| Expiration: August 2017, Exercise Price: $21.00 | | | 13,996 | | | | 104,970 | |
| MetLife, Inc. | | | | | | | | |
| Expiration: August 2017, Exercise Price: $50.00 | | | 1,237 | | | | 55,665 | |
The accompanying notes are an integral part of these financial statements.
The Merger Fund
SCHEDULE OF INVESTMENTS (continued)
June 30, 2017 (Unaudited)
| | | Contracts | | | | |
| | | (100 shares | | | | |
| | | per contract) | | | Value | |
| Sealed Air Corporation | | | | | | |
| Expiration: July 2017, Exercise Price: $38.00 | | | 8,590 | | | $ | 21,475 | |
| SPDR S&P 500 ETF Trust | | | | | | | | |
| Expiration: July 2017, Exercise Price: $239.50 | | | 2,109 | | | | 263,625 | |
| Expiration: July 2017, Exercise Price: $242.00 | | | 2,866 | | | | 573,200 | |
| VanEck Vectors Semiconductor ETF | | | | | | | | |
| Expiration: August 2017, Exercise Price: $86.00 | | | 808 | | | | 412,080 | |
| | | | | | | | 5,404,020 | |
| TOTAL PURCHASED OPTIONS (Cost $7,799,272) | | | | | | | 5,562,288 | |
| | | | | | | | | |
| | | Principal | | | | | |
| | | Amount | | | | | |
| ESCROW NOTES — 0.07% | | | | | | | | |
| AMR Corporation (a)(d)(g) | | $ | 1,243,406 | | | | 1,927,279 | |
| TOTAL ESCROW NOTES (Cost $679,555) | | | | | | | 1,927,279 | |
| | | | | | | | | |
| | | Shares | | | | | |
| SHORT-TERM INVESTMENTS — 21.88% | | | | | | | | |
| MONEY MARKET FUNDS — 18.25% | | | | | | | | |
| First American Government Obligations Fund, | | | | | | | | |
| Institutional Share Class, 0.84% (c) | | | 58,586,118 | | | | 58,586,118 | |
| The Government & Agency Portfolio, | | | | | | | | |
| Institutional Share Class, 0.89% (c) | | | 138,808,000 | | | | 138,808,000 | |
| JPMorgan Prime Money Market Fund, | | | | | | | | |
| Institutional Share Class, 1.20% (c) | | | 42,479,256 | | | | 42,496,028 | |
| JPMorgan U.S. Government Money Market Fund, | | | | | | | | |
| Institutional Share Class, 0.88% (c) | | | 138,808,000 | | | | 138,808,000 | |
| Morgan Stanley Institutional Liquidity Funds — | | | | | | | | |
| Government Portfolio, Institutional | | | | | | | | |
| Share Class, 0.84% (c) | | | 138,808,000 | | | | 138,808,000 | |
| | | | | | | | 517,506,146 | |
| | | | | | | | | |
| | | Principal | | | | | |
| | | Amount | | | | | |
| U.S. TREASURY BILLS — 3.63% (f) | | | | | | | | |
| United States Treasury Bill | | | | | | | | |
| 0.78%, 7/27/2017 | | $ | 15,000,000 | | | | 14,991,855 | |
| 0.83%, 8/24/2017 | | | 15,000,000 | | | | 14,980,395 | |
| 0.88%, 9/28/2017 | | | 15,000,000 | | | | 14,963,565 | |
The accompanying notes are an integral part of these financial statements.
The Merger Fund
SCHEDULE OF INVESTMENTS (continued)
June 30, 2017 (Unaudited)
| | | Principal | | | | |
| | | Amount | | | Value | |
| 0.94%, 10/26/2017 | | $ | 24,210,000 | | | $ | 24,131,318 | |
| 0.95%, 11/02/2017 | | | 100,000 | | | | 99,653 | |
| 0.94%, 11/09/2017 | | | 4,500,000 | | | | 4,483,291 | |
| 1.00%, 11/24/2017 | | | 14,200,000 | | | | 14,139,849 | |
| 1.00%, 11/30/2017 | | | 1,600,000 | | | | 1,592,978 | |
| 1.03%, 12/7/2017 | | | 2,900,000 | | | | 2,886,529 | |
| 1.02%, 12/21/2017 | | | 8,000,000 | | | | 7,959,304 | |
| 1.07%, 12/28/2017 | | | 2,600,000 | | | | 2,585,697 | |
| | | | | | | | 102,814,434 | |
| TOTAL SHORT-TERM INVESTMENTS | | | | | | | | |
| (Cost $620,337,554) | | | | | | | 620,320,580 | |
| TOTAL LONG INVESTMENTS | | | | | | | | |
| (Cost $2,825,809,873) — 103.44% | | | | | | | 2,932,485,361 | |
| | | | | | | | | |
| | | Shares | | | | | |
| SHORT INVESTMENTS — (13.82)% | | | | | | | | |
| COMMON STOCKS — (13.82)% | | | | | | | | |
| AEROSPACE & DEFENSE — (0.14)% | | | | | | | | |
| MacDonald, Dettwiler and Associates Ltd. (b)(f) | | | (76,360 | ) | | | (3,955,448 | ) |
| | | | | | | | | |
| AIRLINES — (0.12)% | | | | | | | | |
| American Airlines Group, Inc. | | | (65,211 | ) | | | (3,281,418 | ) |
| | | | | | | | | |
| DIVERSIFIED BANKS — (0.00)% | | | | | | | | |
| Canadian Imperial Bank of Commerce | | | (1 | ) | | | (81 | ) |
| | | | | | | | | |
| HEALTH CARE EQUIPMENT — (1.58)% | | | | | | | | |
| Becton, Dickinson and Company | | | (230,197 | ) | | | (44,913,737 | ) |
| | | | | | | | | |
| INTEGRATED TELECOMMUNICATION SERVICES — (1.59)% | | | | | | | | |
| AT&T, Inc. | | | (282,199 | ) | | | (10,647,368 | ) |
| CenturyLink, Inc. | | | (1,446,033 | ) | | | (34,531,268 | ) |
| | | | | | | | (45,178,636 | ) |
| INTERNET SOFTWARE & SERVICES — (7.26)% | | | | | | | | |
| Alibaba Group Holding Ltd. — ADR | | | (1,461,568 | ) | | | (205,934,931 | ) |
| | | | | | | | | |
| OIL & GAS EXPLORATION & PRODUCTION — (0.88)% | | | | | | | | |
| EQT Corporation | | | (427,439 | ) | | | (25,043,651 | ) |
| | | | | | | | | |
| OIL & GAS REFINING & MARKETING — (0.05)% | | | | | | | | |
| Idemitsu Kosan Company Ltd. (b) | | | (46,809 | ) | | | (1,327,590 | ) |
| | | | | | | | | |
| OIL & GAS STORAGE & TRANSPORTATION — (1.02)% | | | | | | | | |
| ONEOK, Inc. | | | (489,509 | ) | | | (25,532,789 | ) |
| Pembina Pipeline Corporation (b) | | | (98,057 | ) | | | (3,247,648 | ) |
| | | | | | | | (28,780,437 | ) |
The accompanying notes are an integral part of these financial statements.
The Merger Fund
SCHEDULE OF INVESTMENTS (continued)
June 30, 2017 (Unaudited)
| | | Shares | | | Value | |
| REGIONAL BANKS — (0.03)% | | | | | | |
| Home BancShares, Inc. | | | (28,587 | ) | | $ | (711,816 | ) |
| | | | | | | | | |
| REITs — (0.63)% | | | | | | | | |
| RLJ Lodging Trust | | | (892,431 | ) | | | (17,732,604 | ) |
| Sabra Health Care REIT, Inc. | | | (9,377 | ) | | | (225,986 | ) |
| | | | | | | | (17,958,590 | ) |
| TOBACCO — (0.36)% | | | | | | | | |
| British American Tobacco plc — ADR | | | (149,139 | ) | | | (10,221,987 | ) |
| | | | | | | | | |
| TRUCKING — (0.16)% | | | | | | | | |
| Knight Transportation, Inc. | | | (124,237 | ) | | | (4,602,981 | ) |
| TOTAL COMMON STOCKS | | | | | | | | |
| (Proceeds $314,012,471) | | | | | | | (391,911,303 | ) |
| TOTAL SHORT INVESTMENTS | | | | | | | | |
| (Proceeds $314,012,471) — (13.82)% | | | | | | | (391,911,303 | ) |
| TOTAL NET INVESTMENTS | | | | | | | | |
| (Cost $2,511,797,402) — 89.62% | | | | | | | 2,540,574,058 | |
| OTHER ASSETS IN EXCESS OF LIABILITIES — 10.38% | | | | | | | 294,414,040 | |
| TOTAL NET ASSETS — 100.00% | | | | | | $ | 2,834,988,098 | |
ADR – American Depository Receipt
ETF – Exchange-Traded Fund
plc – Public Limited Company
REIT – Real Estate Investment Trust
| (a) | Non-income producing security. |
| (b) | Foreign security. |
| (c) | The rate quoted is the annualized seven-day yield as of June 30, 2017. |
| (d) | Security fair valued by the Valuation Group in good faith in accordance with the policies adopted by the Board of Trustees. |
| (e) | All or a portion of the shares have been committed as collateral for open securities sold short, written option contracts, swap contacts, and forward currency exchange contracts. |
| (f) | Level 2 Security. Please see Note 2 in the Notes to the Financial Statements for more information. |
| (g) | Level 3 Security. Please see Note 2 in the Notes to the Financial Statements for more information. |
| (h) | Default or other conditions exist and the security is not presently accruing income. |
| (i) | Security exempt from registration under Rule 144A of the Securities Act of 1933. These securities may be resold in transactions exempt from registration normally to qualified institutional buyers. As of June 30, 2017, these securities represent 2.48% of total net assets. |
The accompanying notes are an integral part of these financial statements.
The Merger Fund
SCHEDULE OF INVESTMENTS (continued)
June 30, 2017 (Unaudited)
| (j) | Restricted security. Please see Note 2 in the Notes to the Financial Statements for more information. As of June 30, 2017, these securities represent 6.56% of total net assets. |
| (k) | The coupon rate shown on variable rate securities represents the rates as of June 30, 2017. |
| (l) | As the result of a corporate action on the underlying holding, the option’s underlying security is 100 shares of Ashland Global Holding, Inc., 274 shares of Valvoline, Inc. and cash in lieu of fractional shares. |
The accompanying notes are an integral part of these financial statements.
WCM Alternatives: Event-Driven Fund
SCHEDULE OF INVESTMENTS
June 30, 2017 (Unaudited)
| | | Shares | | | Value | |
| LONG INVESTMENTS — 103.89% | | | | | | |
| COMMON STOCKS — 55.69% | | | | | | |
| AEROSPACE & DEFENSE — 0.30% | | | | | | |
| DigitalGlobe, Inc. (a)(e) | | | 10,080 | | | $ | 335,664 | |
| | | | | | | | | |
| ALTERNATIVE CARRIERS — 4.44% | | | | | | | | |
| Level 3 Communications, Inc. (a)(e) | | | 83,614 | | | | 4,958,310 | |
| | | | | | | | | |
| AUTOMOBILE MANUFACTURERS — 1.54% | | | | | | | | |
| General Motors Company (e) | | | 49,200 | | | | 1,718,556 | |
| | | | | | | | | |
| BIOTECHNOLOGY — 0.00% | | | | | | | | |
| Mersana Therapeutics, Inc. (a) | | | 16 | | | | 223 | |
| | | | | | | | | |
| BROADCASTING — 2.32% | | | | | | | | |
| CBS Corporation Class B | | | 40,700 | | | | 2,595,846 | |
| | | | | | | | | |
| BUILDING PRODUCTS — 1.02% | | | | | | | | |
| Johnson Controls International plc (b)(e) | | | 26,200 | | | | 1,136,032 | |
| | | | | | | | | |
| CABLE & SATELLITE — 2.07% | | | | | | | | |
| Liberty Media Corporation-Liberty | | | | | | | | |
| SiriusXM Class A (a)(e) | | | 55,034 | | | | 2,310,327 | |
| | | | | | | | | |
| COMMODITY CHEMICALS — 1.45% | | | | | | | | |
| Valvoline, Inc. (e) | | | 68,403 | | | | 1,622,525 | |
| | | | | | | | | |
| CONSTRUCTION & ENGINEERING — 2.90% | | | | | | | | |
| Chicago Bridge & Iron Company N.V. (b)(e) | | | 164,300 | | | | 3,241,639 | |
| | | | | | | | | |
| DATA PROCESSING & OUTSOURCED SERVICES — 0.55% | | | | | | | | |
| MoneyGram International, Inc. (a) | | | 35,340 | | | | 609,615 | |
| | | | | | | | | |
| DIVERSIFIED CHEMICALS — 4.05% | | | | | | | | |
| The Dow Chemical Company | | | 118 | | | | 7,442 | |
| E. I. du Pont de Nemours and Company (e) | | | 48,972 | | | | 3,952,530 | |
| Huntsman Corporation | | | 22,100 | | | | 571,064 | |
| | | | | | | | 4,531,036 | |
| DRUG RETAIL — 2.06% | | | | | | | | |
| Rite Aid Corporation (a) | | | 779,072 | | | | 2,298,262 | |
| | | | | | | | | |
| FERTILIZERS & AGRICULTURAL CHEMICALS — 1.97% | | | | | | | | |
| Monsanto Company (e) | | | 18,600 | | | | 2,201,496 | |
| | | | | | | | | |
| FOOD PRODUCTS — 0.44% | | | | | | | | |
| Pinnacle Foods, Inc. | | | 8,300 | | | | 493,020 | |
| | | | | | | | | |
| HOTELS, RESORTS & CRUISE LINES — 0.98% | | | | | | | | |
| ILG, Inc. | | | 40,031 | | | | 1,100,452 | |
The accompanying notes are an integral part of these financial statements.
WCM Alternatives: Event-Driven Fund
SCHEDULE OF INVESTMENTS (continued)
June 30, 2017 (Unaudited)
| | | Shares | | | Value | |
| HOUSEHOLD DURABLES — 0.01% | | | | | | |
| Lennar Corporation Class B | | | 173 | | | $ | 7,780 | |
| | | | | | | | | |
| HOUSEWARES & SPECIALTIES — 3.47% | | | | | | | | |
| Jarden Corporation (a)(d)(g)(j) | | | 61,683 | | | | 3,878,621 | |
| | | | | | | | | |
| INDUSTRIAL CONGLOMERATES — 3.21% | | | | | | | | |
| General Electric Company (e) | | | 132,900 | | | | 3,589,629 | |
| | | | | | | | | |
| INVESTMENT COMPANIES — 1.94% | | | | | | | | |
| Bison Capital Acquisition Corporation (a)(b) | | | 35,538 | | | | 362,488 | |
| Forum Merger Corporation (a) | | | 105,675 | | | | 1,076,828 | |
| Modern Media Acquisition Corporation (a) | | | 71,497 | | | | 733,559 | |
| | | | | | | | 2,172,875 | |
| MEDIA — 1.09% | | | | | | | | |
| DISH Network Corporation Class A (a)(e) | | | 19,500 | | | | 1,223,820 | |
| | | | | | | | | |
| MOVIES & ENTERTAINMENT — 3.27% | | | | | | | | |
| News Corporation Class A (e) | | | 47,456 | | | | 650,147 | |
| Time Warner, Inc. (e) | | | 29,907 | | | | 3,002,962 | |
| | | | | | | | 3,653,109 | |
| MULTI-LINE INSURANCE — 2.11% | | | | | | | | |
| American International Group, Inc. (e) | | | 37,800 | | | | 2,363,256 | |
| | | | | | | | | |
| OIL & GAS EXPLORATION & PRODUCTION — 1.08% | | | | | | | | |
| Rice Energy, Inc. (a)(e) | | | 45,280 | | | | 1,205,806 | |
| | | | | | | | | |
| OIL & GAS REFINING & MARKETING — 0.09% | | | | | | | | |
| Showa Shell Sekiyu K.K. (b) | | | 10,508 | | | | 97,349 | |
| | | | | | | | | |
| OIL & GAS STORAGE & TRANSPORTATION — 2.02% | | | | | | | | |
| Columbia Pipeline Group, Inc. (a)(d)(g)(j) | | | 38,718 | | | | 996,061 | |
| Veresen, Inc. (b) | | | 12,176 | | | | 172,199 | |
| VTTI Energy Partners LP (b) | | | 55,160 | | | | 1,083,894 | |
| | | | | | | | 2,252,154 | |
| OIL, GAS & CONSUMABLE FUELS — 1.61% | | | | | | | | |
| Marathon Petroleum Corporation (e) | | | 34,400 | | | | 1,800,152 | |
| | | | | | | | | |
| REITs — 2.80% | | | | | | | | |
| Care Capital Properties, Inc. | | | 318 | | | | 8,491 | |
| Colony NorthStar, Inc. Class A (e) | | | 119,310 | | | | 1,681,078 | |
| FelCor Lodging Trust, Inc. | | | 92,874 | | | | 669,622 | |
| Starwood Property Trust, Inc. (e) | | | 34,314 | | | | 768,290 | |
| | | | | | | | 3,127,481 | |
The accompanying notes are an integral part of these financial statements.
WCM Alternatives: Event-Driven Fund
SCHEDULE OF INVESTMENTS (continued)
June 30, 2017 (Unaudited)
| | | Shares | | | Value | |
| ROAD & RAIL — 1.10% | | | | | | |
| CSX Corporation (e) | | | 20,500 | | | $ | 1,118,480 | |
| Hertz Global Holdings, Inc. (a) | | | 9,800 | | | | 112,700 | |
| | | | | | | | 1,231,180 | |
| SPECIALTY CHEMICALS — 2.96% | | | | | | | | |
| Ashland Global Holdings, Inc. (e) | | | 50,200 | | | | 3,308,682 | |
| | | | | | | | | |
| SYSTEMS SOFTWARE — 0.83% | | | | | | | | |
| Dell Technologies, Inc. Class V (a)(e) | | | 15,172 | | | | 927,161 | |
| | | | | | | | | |
| TECHNOLOGY HARDWARE, | | | | | | | | |
| STORAGE & PERIPHERALS — 1.77% | | | | | | | | |
| Hewlett Packard Enterprise Company (e) | | | 119,364 | | | | 1,980,249 | |
| | | | | | | | | |
| TOBACCO — 0.24% | | | | | | | | |
| Reynolds American, Inc. | | | 4,126 | | | | 268,355 | |
| TOTAL COMMON STOCKS (Cost $60,566,793) | | | | | | | 62,240,662 | |
| | | | | | | | | |
| CLOSED-END FUNDS — 8.52% (e) | | | | | | | | |
| Altaba, Inc. (a) | | | 138,951 | | | | 7,570,050 | |
| BlackRock Debt Strategies Fund, Inc. | | | 82,764 | | | | 955,097 | |
| Western Asset High Income Opportunity Fund, Inc. | | | 195,533 | | | | 991,352 | |
| TOTAL CLOSED-END FUNDS (Cost $9,170,808) | | | | | | | 9,516,499 | |
| | | | | | | | | |
| PREFERRED STOCKS — 1.26% | | | | | | | | |
| Colony NorthStar, Inc. Series B (e) | | | 32,071 | | | | 818,773 | |
| Colony NorthStar, Inc. Series E (e) | | | 21,830 | | | | 589,410 | |
| TOTAL PREFERRED STOCKS (Cost $1,365,927) | | | | | | | 1,408,183 | |
| | | | | | | | | |
| CONTINGENT VALUE RIGHTS — 0.08% (a)(g) | | | | | | | | |
| Casa Ley, S.A. de C.V. | | | 5,338 | | | | 2,589 | |
| Media General, Inc. | | | 42,852 | | | | 86,775 | |
| Property Development Centers LLC | | | 5,338 | | | | 80 | |
| TOTAL CONTINGENT VALUE RIGHTS (Cost $20,805) | | | | | | | 89,444 | |
| | | | | | | | | |
| RIGHTS — 0.02% (a)(b)(f) | | | | | | | | |
| Pacific Special Acquisition Corporation | | | 35,377 | | | | 20,873 | |
| TOTAL RIGHTS (Cost $8,171) | | | | | | | 20,873 | |
The accompanying notes are an integral part of these financial statements.
WCM Alternatives: Event-Driven Fund
SCHEDULE OF INVESTMENTS (continued)
June 30, 2017 (Unaudited)
| | | Shares | | | Value | |
| WARRANTS — 0.02% (a)(b)(f) | | | | | | |
| Pacific Special Acquisition Corporation | | | 35,377 | | | $ | 18,396 | |
| TOTAL WARRANTS (Cost $3,112) | | | | | | | 18,396 | |
| | | | | | | | | |
| | | Principal | | | | | |
| | | Amount | | | | | |
| BANK LOANS — 1.09% (f) | | | | | | | | |
| Bass Pro Group LLC | | | | | | | | |
| 6.274%, 12/16/2023 (k) | | $ | 1,246,000 | | | | 1,212,825 | |
| TOTAL BANK LOANS (Cost $1,238,212) | | | | | | | 1,212,825 | |
| | | | | | | | | |
| CORPORATE BONDS — 13.80% (f) | | | | | | | | |
| Alere, Inc. | | | | | | | | |
| 6.500%, 6/15/2020 | | | 633,000 | | | | 644,869 | |
| Caesars Entertainment Operating Company, Inc. | | | | | | | | |
| 10.750%, 2/1/2016 (h) | | | 1,030,000 | | | | 1,442,000 | |
| Caesars Growth Properties Holdings LLC | | | | | | | | |
| 9.375%, 5/1/2022 (e) | | | 2,919,000 | | | | 3,174,413 | |
| Energy Future Intermediate Holding Company LLC | | | | | | | | |
| 11.000%, 10/1/2021 (h) | | | 85,690 | | | | 111,397 | |
| FairPoint Communications, Inc. | | | | | | | | |
| 8.750%, 8/15/2019 (e)(i) | | | 1,104,000 | | | | 1,135,574 | |
| IASIS Healthcare LLC | | | | | | | | |
| 8.375%, 5/15/2019 | | | 1,173,000 | | | | 1,179,451 | |
| Rice Energy, Inc. | | | | | | | | |
| 6.250%, 5/1/2022 | | | 1,055,000 | | | | 1,103,794 | |
| Rite Aid Corporation | | | | | | | | |
| 6.750%, 6/15/2021 (e) | | | 747,000 | | | | 770,904 | |
| 6.125%, 4/1/2023 (e)(i) | | | 126,000 | | | | 124,425 | |
| Sinclair Television Group, Inc. | | | | | | | | |
| 6.125%, 10/1/2022 (e) | | | 1,000,000 | | | | 1,043,750 | |
| Terraform Global Operating, LLC | | | | | | | | |
| 9.750%, 8/15/2022 (e)(i) | | | 1,292,000 | | | | 1,453,500 | |
| Tribune Media Company | | | | | | | | |
| 5.875%, 7/15/2022 | | | 77,000 | | | | 81,043 | |
| West Corporation | | | | | | | | |
| 5.375%, 7/15/2022 (e)(i) | | | 3,124,000 | | | | 3,163,050 | |
| TOTAL CORPORATE BONDS (Cost $14,804,800) | | | | | | | 15,428,170 | |
The accompanying notes are an integral part of these financial statements.
WCM Alternatives: Event-Driven Fund
SCHEDULE OF INVESTMENTS (continued)
June 30, 2017 (Unaudited)
| | | Contracts | | | | |
| | | (100 shares | | | | |
| | | per contract) | | | Value | |
| PURCHASED CALL OPTIONS — 0.01% | | | | | | |
| Mead Johnson Nutrition Company | | | | | | |
| Expiration: January 2019, Exercise Price: $90.00 (f) | | | 20 | | | $ | — | |
| SPDR S&P 500 ETF Trust | | | | | | | | |
| Expiration: August 2017, Exercise Price: $248.00 | | | 127 | | | | 8,382 | |
| | | | | | | | 8,382 | |
| PURCHASED PUT OPTIONS — 0.63% | | | | | | | | |
| American International Group, Inc. | | | | | | | | |
| Expiration: August 2017, Exercise Price: $55.00 | | | 452 | | | | 7,684 | |
| Expiration: August 2017, Exercise Price: $57.50 | | | 119 | | | | 4,284 | |
| Ashland Global Holdings, Inc. | | | | | | | | |
| Expiration: July 2017, Exercise Price: $100.00 (l) | | | 98 | | | | 4,165 | |
| Expiration: July 2017, Exercise Price: $105.00 (l) | | | 32 | | | | 1,200 | |
| Expiration: July 2017, Exercise Price: $110.00 (l) | | | 116 | | | | 4,930 | |
| Expiration: October 2017, Exercise Price: $55.00 | | | 226 | | | | 12,995 | |
| AT&T, Inc. | | | | | | | | |
| Expiration: October 2017, Exercise Price: $37.00 | | | 362 | | | | 49,956 | |
| Baker Hughes, Inc. | | | | | | | | |
| Expiration: July 2017, Exercise Price: $52.50 | | | 544 | | | | 26,656 | |
| Expiration: August 2017, Exercise Price: $45.00 | | | 20 | | | | 271 | |
| CBS Corporation Class B | | | | | | | | |
| Expiration: August 2017, Exercise Price: $55.00 | | | 87 | | | | 2,349 | |
| Expiration: August 2017, Exercise Price: $57.50 | | | 185 | | | | 9,157 | |
| Chicago Bridge & Iron Company N.V. | | | | | | | | |
| Expiration: August 2017, Exercise Price: $15.00 | | | 1,643 | | | | 82,150 | |
| CSX Corporation | | | | | | | | |
| Expiration: July 2017, Exercise Price: $45.00 | | | 64 | | | | 512 | |
| Expiration: July 2017, Exercise Price: $50.00 | | | 205 | | | | 6,765 | |
| Delphi Automotive plc | | | | | | | | |
| Expiration: August 2017, Exercise Price: $75.00 | | | 438 | | | | 16,425 | |
| DISH Network Corporation Class A | | | | | | | | |
| Expiration: July 2017, Exercise Price: $57.50 | | | 169 | | | | 4,225 | |
| Expiration: September 2017, Exercise Price: $57.50 | | | 185 | | | | 30,987 | |
| The Dow Chemical Company | | | | | | | | |
| Expiration: September 2017, Exercise Price: $52.50 | | | 147 | | | | 4,116 | |
| E. I. du Pont de Nemours and Company | | | | | | | | |
| Expiration: July 2017, Exercise Price: $72.50 | | | 199 | | | | 2,189 | |
| General Electric Company | | | | | | | | |
| Expiration: July 2017, Exercise Price: $26.00 | | | 330 | | | | 4,620 | |
| Expiration: September 2017, Exercise Price: $26.00 | | | 306 | | | | 14,382 | |
The accompanying notes are an integral part of these financial statements.
WCM Alternatives: Event-Driven Fund
SCHEDULE OF INVESTMENTS (continued)
June 30, 2017 (Unaudited)
| | | Contracts | | | | |
| | | (100 shares | | | | |
| | | per contract) | | | Value | |
| Hertz Global Holdings, Inc. | | | | | | |
| Expiration: July 2017, Exercise Price: $17.50 | | | 154 | | | $ | 93,170 | |
| Hewlett Packard Enterprise Company | | | | | | | | |
| Expiration: August 2017, Exercise Price: $15.00 | | | 229 | | | | 2,290 | |
| Expiration: August 2017, Exercise Price: $16.00 | | | 264 | | | | 6,600 | |
| Expiration: August 2017, Exercise Price: $17.00 | | | 2,264 | | | | 160,744 | |
| Huntsman Corporation | | | | | | | | |
| Expiration: August 2017, Exercise Price: $17.00 | | | 221 | | | | 552 | |
| �� Expiration: August 2017, Exercise Price: $18.00 | | | 343 | | | | 1,715 | |
| Expiration: August 2017, Exercise Price: $19.00 | | | 570 | | | | 2,850 | |
| Expiration: August 2017, Exercise Price: $20.00 | | | 415 | | | | 2,075 | |
| Expiration: August 2017, Exercise Price: $22.00 | | | 221 | | | | 3,315 | |
| ILG, Inc. | | | | | | | | |
| Expiration: August 2017, Exercise Price: $24.00 | | | 363 | | | | 9,982 | |
| Johnson Controls International plc | | | | | | | | |
| Expiration: August 2017, Exercise Price: $38.00 | | | 262 | | | | 4,061 | |
| Magna International, Inc. | | | | | | | | |
| Expiration: July 2017, Exercise Price: $40.00 | | | 487 | | | | 1,218 | |
| Marathon Petroleum Corporation | | | | | | | | |
| Expiration: July 2017, Exercise Price: $42.50 | | | 43 | | | | 108 | |
| Expiration: July 2017, Exercise Price: $45.00 | | | 281 | | | | 1,405 | |
| Expiration: July 2017, Exercise Price: $47.50 | | | 695 | | | | 6,950 | |
| Expiration: August 2017, Exercise Price: $47.50 | | | 42 | | | | 2,310 | |
| MetLife, Inc. | | | | | | | | |
| Expiration: July 2017, Exercise Price: $45.00 | | | 106 | | | | 106 | |
| Expiration: August 2017, Exercise Price: $50.00 | | | 19 | | | | 855 | |
| Expiration: September 2017, Exercise Price: $47.50 | | | 736 | | | | 27,232 | |
| MGM Resorts International | | | | | | | | |
| Expiration: July 2017, Exercise Price: $27.00 | | | 87 | | | | 1,392 | |
| Pinnacle Foods, Inc. | | | | | | | | |
| Expiration: July 2017, Exercise Price: $57.50 | | | 83 | | | | 5,810 | |
| Sealed Air Corporation | | | | | | | | |
| Expiration: July 2017, Exercise Price: $38.00 | | | 976 | | | | 2,440 | |
| SPDR S&P 500 ETF Trust | | | | | | | | |
| Expiration: July 2017, Exercise Price: $239.50 | | | 79 | | | | 9,875 | |
| Expiration: July 2017, Exercise Price: $242.00 | | | 241 | | | | 48,200 | |
| VanEck Vectors Semiconductor ETF | | | | | | | | |
| Expiration: August 2017, Exercise Price: $86.00 | | | 36 | | | | 18,360 | |
The accompanying notes are an integral part of these financial statements.
WCM Alternatives: Event-Driven Fund
SCHEDULE OF INVESTMENTS (continued)
June 30, 2017 (Unaudited)
| | | Contracts | | | | |
| | | (100 shares | | | | |
| | | per contract) | | | Value | |
| Wyndham Worldwide Corporation | | | | | | |
| Expiration: July 2017, Exercise Price: $87.50 | | | 225 | | | $ | 1,688 | |
| | | | | | | | 705,321 | |
| TOTAL PURCHASED OPTIONS (Cost $958,798) | | | | | | | 713,703 | |
| | | | | | | | | |
| | | Principal | | | | | |
| | | Amount | | | | | |
| ESCROW NOTES — 0.23% (a)(d)(g) | | | | | | | | |
| AMR Corporation | | $ | 28,850 | | | | 44,717 | |
| Winthrop Realty Trust | | | 26,484 | | | | 215,183 | |
| TOTAL ESCROW NOTES (Cost $294,386) | | | | | | | 259,900 | |
| | | | | | | | | |
| | | Shares | | | | | |
| SHORT-TERM INVESTMENTS — 22.54% (e) | | | | | | | | |
| MONEY MARKET FUNDS — 6.11% | | | | | | | | |
| JPMorgan Prime Money Market Fund, | | | | | | | | |
| Institutional Share Class, 1.20% (c) | | | 1,376,585 | | | | 1,376,998 | |
| JPMorgan U.S. Government Money Market Fund, | | | | | | | | |
| Institutional Share Class, 0.88% (c) | | | 5,455,000 | | | | 5,455,000 | |
| | | | | | | | 6,831,998 | |
| | | | | | | | |
| | | Principal | | | | | |
| | | Amount | | | | | |
| U.S. TREASURY BILLS — 16.43% (e)(f) | | | | | | | | |
| United States Treasury Bills | | | | | | | | |
| 0.77%, 7/27/2017 | | $ | 2,000,000 | | | | 1,998,914 | |
| 0.83%, 8/24/2017 | | | 2,000,000 | | | | 1,997,386 | |
| 0.88%, 9/28/2017 | | | 2,000,000 | | | | 1,995,142 | |
| 0.94%, 10/26/2017 | | | 8,820,000 | | | | 8,791,335 | |
| 0.93%, 11/9/2017 | | | 300,000 | | | | 298,886 | |
| 1.00%, 11/24/2017 | | | 1,600,000 | | | | 1,593,222 | |
| 0.99%, 11/30/2017 | | | 600,000 | | | | 597,367 | |
| 1.05%, 12/7/2017 | | | 700,000 | | | | 696,749 | |
| 1.00%, 12/21/2017 | | | 100,000 | | | | 99,491 | |
| 1.07%, 12/28/2017 | | | 300,000 | | | | 298,350 | |
| | | | | | | | 18,366,842 | |
| TOTAL SHORT-TERM INVESTMENTS | | | | | | | | |
| (Cost $25,202,095) | | | | | | | 25,198,840 | |
| TOTAL LONG INVESTMENTS | | | | | | | | |
| (Cost $113,633,907) — 103.89% | | | | | | | 116,107,495 | |
The accompanying notes are an integral part of these financial statements.
WCM Alternatives: Event-Driven Fund
SCHEDULE OF INVESTMENTS (continued)
June 30, 2017 (Unaudited)
| | | Shares | | | Value | |
| SHORT INVESTMENTS — (11.64)% | | | | | | |
| COMMON STOCKS — (11.64)% | | | | | | |
| AEROSPACE & DEFENSE — (0.15)% | | | | | | |
| MacDonald, Dettwiler and Associates Ltd. (b)(f) | | | (3,157 | ) | | $ | (163,533 | ) |
| | | | | | | | | |
| AIRLINES — (0.06)% | | | | | | | | |
| American Airlines Group, Inc. | | | (1,443 | ) | | | (72,612 | ) |
| | | | | | | | | |
| CABLE & SATELLITE — (2.52)% | | | | | | | | |
| Sirius XM Holdings, Inc. | | | (514,633 | ) | | | (2,815,043 | ) |
| | | | | | | | | |
| HEALTH CARE EQUIPMENT — (1.73)% | | | | | | | | |
| Becton, Dickinson and Company | | | (9,918 | ) | | | (1,935,101 | ) |
| | | | | | | | | |
| HOUSEHOLD DURABLES — (0.01)% | | | | | | | | |
| Lennar Corporation Class A | | | (138 | ) | | | (7,358 | ) |
| | | | | | | | | |
| INTEGRATED TELECOMMUNICATION | | | | | | | | |
| SERVICES — (2.13)% | | | | | | | | |
| AT&T, Inc. | | | (15,966 | ) | | | (602,397 | ) |
| CenturyLink, Inc. | | | (74,506 | ) | | | (1,779,203 | ) |
| | | | | | | | (2,381,600 | ) |
| INTERNET SOFTWARE & SERVICES — (0.19)% | | | | | | | | |
| Alibaba Group Holding Ltd. — ADR | | | (1,514 | ) | | | (213,323 | ) |
| | | | | | | | | |
| MOVIES & ENTERTAINMENT — (0.60)% | | | | | | | | |
| News Corporation Class B | | | (47,456 | ) | | | (671,502 | ) |
| | | | | | | | | |
| OIL & GAS EXPLORATION & PRODUCTION — (0.88)% | | | | | | | | |
| EQT Corporation | | | (16,755 | ) | | | (981,675 | ) |
| | | | | | | | | |
| OIL & GAS REFINING & MARKETING — (0.13)% | | | | | | | | |
| Idemitsu Kosan Company Ltd. (b) | | | (5,154 | ) | | | (146,177 | ) |
| | | | | | | | | |
| OIL & GAS STORAGE & TRANSPORTATION — (1.24)% | | | | | | | | |
| ONEOK, Inc. | | | (24,051 | ) | | | (1,254,500 | ) |
| Pembina Pipeline Corporation (b) | | | (3,862 | ) | | | (127,910 | ) |
| | | | | | | | (1,382,410 | ) |
| REITs — (0.61)% | | | | | | | | |
| RLJ Lodging Trust | | | (33,622 | ) | | | (668,069 | ) |
| Sabra Health Care REIT, Inc. | | | (357 | ) | | | (8,604 | ) |
| | | | | | | | (676,673 | ) |
| SOFTWARE — (1.06)% | | | | | | | | |
| VMware, Inc. Class A | | | (13,610 | ) | | | (1,189,922 | ) |
The accompanying notes are an integral part of these financial statements.
WCM Alternatives: Event-Driven Fund
SCHEDULE OF INVESTMENTS (continued)
June 30, 2017 (Unaudited)
| | | Shares | | | Value | |
| TOBACCO — (0.33)% | | | | | | |
| British American Tobacco plc — ADR | | | (5,413 | ) | | $ | (371,007 | ) |
| TOTAL COMMON STOCKS | | | | | | | | |
| (Proceeds $11,420,522) | | | | | | | (13,007,936 | ) |
| TOTAL SHORT INVESTMENTS | | | | | | | | |
| (Proceeds $11,420,522) — (11.64)% | | | | | | | (13,007,936 | ) |
| TOTAL NET INVESTMENTS | | | | | | | | |
| (Cost $102,213,385) — 92.25% | | | | | | | 103,099,559 | |
| OTHER ASSETS IN EXCESS OF LIABILITIES — 7.75% | | | | | | | 8,659,961 | |
| TOTAL NET ASSETS — 100.00% | | | | | | $ | 111,759,520 | |
ADR – American Depository Receipt
ETF – Exchange-Traded Fund
plc – Public Limited Company
REIT – Real Estate Investment Trust
| (a) | Non-income producing security. |
| (b) | Foreign security. |
| (c) | The rate quoted is the annualized seven-day yield as of June 30, 2017. |
| (d) | Security fair valued by the Valuation Group in good faith in accordance with the policies adopted by the Board of Trustees. |
| (e) | All or a portion of the shares have been committed as collateral for open securities sold short, written option contracts, swap contacts, and forward currency exchange contracts. |
| (f) | Level 2 Security. Please see Note 2 in the Notes to the Financial Statements for more information. |
| (g) | Level 3 Security. Please see Note 2 in the Notes to the Financial Statements for more information. |
| (h) | Default or other conditions exist and the security is not presently accruing income. |
| (i) | Security exempt from registration under Rule 144A of the Securities Act of 1933. These securities may be resold in transactions exempt from registration normally to qualified institutional buyers. As of June 30, 2017, these securities represent 5.26% of total net assets. |
| (j) | Restricted security. Please see Note 2 in the Notes to the Financial Statements for more information. As of June 30, 2017, these securities represent 4.36% of total net assets. |
| (k) | The coupon rate shown on variable rate securities represents the rates as of June 30, 2017. |
| (l) | As the result of a corporate action on the underlying holding, the option’s underlying security is 100 shares of Ashland Global Holding, Inc., 274 shares of Valvoline, Inc. and cash in lieu of fractional shares. |
The accompanying notes are an integral part of these financial statements.
The Merger Fund
SCHEDULE OF OPTIONS WRITTEN
June 30, 2017 (Unaudited)
| | | Contracts | | | | |
| | | (100 shares | | | | |
| | | per contract) | | | Value | |
| CALL OPTIONS WRITTEN | | | | | | |
| American International Group, Inc. | | | | | | |
| Expiration: July 2017, Exercise Price: $62.50 | | | 2,276 | | | $ | 195,736 | |
| Expiration: July 2017, Exercise Price: $65.00 | | | 343 | | | | 4,116 | |
| Expiration: August 2017, Exercise Price: $62.50 | | | 8,818 | | | | 1,516,696 | |
| Ashland Global Holdings, Inc. | | | | | | | | |
| Expiration: July 2017, Exercise Price: $120.00 (a) | | | 2,326 | | | | 2,686,530 | |
| Expiration: October 2017, Exercise Price: $65.00 | | | 3,580 | | | | 1,396,200 | |
| AT&T, Inc. | | | | | | | | |
| Expiration: October 2017, Exercise Price: $41.00 | | | 21,602 | | | | 367,234 | |
| Baker Hughes, Inc. | | | | | | | | |
| Expiration: July 2017, Exercise Price: $57.50 | | | 10,588 | | | | 232,936 | |
| Expiration: August 2017, Exercise Price: $52.50 | | | 530 | | | | 161,359 | |
| CenturyLink, Inc. | | | | | | | | |
| Expiration: July 2017, Exercise Price: $24.00 | | | 6,228 | | | | 342,540 | |
| Expiration: September 2017, Exercise Price: $24.00 | | | 2,190 | | | | 229,950 | |
| The Dow Chemical Company | | | | | | | | |
| Expiration: September 2017, Exercise Price: $60.00 | | | 3,446 | | | | 1,533,470 | |
| Expiration: September 2017, Exercise Price: $65.00 | | | 147 | | | | 22,050 | |
| E. I. du Pont de Nemours and Company | | | | | | | | |
| Expiration: July 2017, Exercise Price: $77.50 | | | 718 | | | | 280,020 | |
| Expiration: July 2017, Exercise Price: $80.00 | | | 2,267 | | | | 396,725 | |
| Expiration: September 2017, Exercise Price: $82.50 | | | 758 | | | | 147,810 | |
| Hewlett Packard Enterprise Company | | | | | | | | |
| Expiration: August 2017, Exercise Price: $18.00 | | | 41,833 | | | | 313,747 | |
| Huntsman Corporation | | | | | | | | |
| Expiration: August 2017, Exercise Price: $23.00 | | | 11,326 | | | | 3,624,320 | |
| Expiration: August 2017, Exercise Price: $24.00 | | | 17,136 | | | | 4,026,960 | |
| Monsanto Company | | | | | | | | |
| Expiration: July 2017, Exercise Price: $115.00 | | | 2,436 | | | | 901,320 | |
| Sealed Air Corporation | | | | | | | | |
| Expiration: July 2017, Exercise Price: $42.00 | | | 8,590 | | | | 2,512,575 | |
| SPDR S&P 500 ETF Trust | | | | | | | | |
| Expiration: August 2017, Exercise Price: $242.00 | | | 2,398 | | | | 832,106 | |
| Whole Foods Market, Inc. | | | | | | | | |
| Expiration: August 2017, Exercise Price: $42.00 | | | 862 | | | | 38,790 | |
| | | | | | | | 21,763,190 | |
The accompanying notes are an integral part of these financial statements.
The Merger Fund
SCHEDULE OF OPTIONS WRITTEN (continued)
June 30, 2017 (Unaudited)
| | | Contracts | | | | |
| | | (100 shares | | | | |
| | | per contract) | | | Value | |
| PUT OPTIONS WRITTEN | | | | | | |
| MetLife, Inc. | | | | | | |
| Expiration: August 2017, Exercise Price: $52.50 | | | 1,375 | | | $ | 132,000 | |
| SPDR S&P 500 ETF Trust | | | | | | | | |
| Expiration: July 2017, Exercise Price: $234.00 | | | 2,190 | | | | 111,690 | |
| VanEck Vectors Semiconductor ETF | | | | | | | | |
| Expiration: August 2017, Exercise Price: $78.00 | | | 808 | | | | 122,008 | |
| | | | | | | | 365,698 | |
| TOTAL OPTIONS WRITTEN | | | | | | | | |
| (Premiums received $30,162,982) | | | | | | $ | 22,128,888 | |
ETF – Exchange-Traded Fund
| (a) | As the result of a corporate action on the underlying holding, the option’s underlying security is 100 shares of Ashland Global Holding, Inc., 274 shares of Valvoline, Inc. and cash in lieu of fractional shares. |
The accompanying notes are an integral part of these financial statements.
WCM Alternatives: Event-Driven Fund
SCHEDULE OF OPTIONS WRITTEN
June 30, 2017 (Unaudited)
| | Contracts | | | | |
| | | (100 shares | | | | |
| | | per contract) | | | Value | |
| CALL OPTIONS WRITTEN | | | | | | |
| American International Group, Inc. | | | | | | |
| Expiration: July 2017, Exercise Price: $62.50 | | | 69 | | | $ | 5,934 | |
| Expiration: August 2017, Exercise Price: $62.50 | | | 502 | | | | 86,344 | |
| Expiration: August 2017, Exercise Price: $65.00 | | | 121 | | | | 8,349 | |
| Ashland Global Holdings, Inc. | | | | | | | | |
| Expiration: July 2017, Exercise Price: $125.00 (a) | | | 151 | | | | 99,660 | |
| Expiration: July 2017, Exercise Price: $130.00 (a) | | | 98 | | | | 32,830 | |
| Expiration: October 2017, Exercise Price: $65.00 | | | 253 | | | | 98,670 | |
| AT&T, Inc. | | | | | | | | |
| Expiration: October 2017, Exercise Price: $41.00 | | | 863 | | | | 14,671 | |
| Baker Hughes, Inc. | | | | | | | | |
| Expiration: July 2017, Exercise Price: $57.50 | | | 35 | | | | 770 | |
| Expiration: July 2017, Exercise Price: $60.00 | | | 509 | | | | 7,635 | |
| Expiration: August 2017, Exercise Price: $52.50 | | | 20 | | | | 6,089 | |
| CBS Corporation Class B | | | | | | | | |
| Expiration: August 2017, Exercise Price: $60.00 | | | 87 | | | | 41,977 | |
| Expiration: August 2017, Exercise Price: $62.50 | | | 205 | | | | 62,833 | |
| Expiration: August 2017, Exercise Price: $65.00 | | | 148 | | | | 26,640 | |
| CenturyLink, Inc. | | | | | | | | |
| Expiration: July 2017, Exercise Price: $24.00 | | | 450 | | | | 24,750 | |
| Chicago Bridge & Iron Company N.V. | | | | | | | | |
| Expiration: August 2017, Exercise Price: $17.50 | | | 1,643 | | | | 566,835 | |
| CSX Corporation | | | | | | | | |
| Expiration: July 2017, Exercise Price: $52.50 | | | 205 | | | | 60,885 | |
| DISH Network Corporation Class A | | | | | | | | |
| Expiration: September 2017, Exercise Price: $62.50 | | | 185 | | | | 72,150 | |
| The Dow Chemical Company | | | | | | | | |
| Expiration: September 2017, Exercise Price: $60.00 | | | 97 | | | | 43,165 | |
| Expiration: September 2017, Exercise Price: $62.50 | | | 50 | | | | 13,000 | |
| E. I. du Pont de Nemours and Company | | | | | | | | |
| Expiration: July 2017, Exercise Price: $80.00 | | | 203 | | | | 35,525 | |
| Expiration: September 2017, Exercise Price: $82.50 | | | 31 | | | | 6,045 | |
| General Electric Company | | | | | | | | |
| Expiration: September 2017, Exercise Price: $28.00 | | | 306 | | | | 14,076 | |
| Expiration: September 2017, Exercise Price: $30.00 | | | 164 | | | | 1,476 | |
| General Motors Company | | | | | | | | |
| Expiration: August 2017, Exercise Price: $35.00 | | | 245 | | | | 26,460 | |
| Huntsman Corporation | | | | | | | | |
| Expiration: August 2017, Exercise Price: $25.00 | | | 221 | | | | 34,697 | |
The accompanying notes are an integral part of these financial statements.
WCM Alternatives: Event-Driven Fund
SCHEDULE OF OPTIONS WRITTEN (continued)
June 30, 2017 (Unaudited)
| | | Contracts | | | | |
| | | (100 shares | | | | |
| | �� | per contract) | | | Value | |
| ILG, Inc. | | | | | | |
| Expiration: August 2017, Exercise Price: $27.00 | | | 363 | | | $ | 63,525 | |
| Johnson Controls International plc | | | | | | | | |
| Expiration: August 2017, Exercise Price: $43.00 | | | 262 | | | | 38,645 | |
| Marathon Petroleum Corporation | | | | | | | | |
| Expiration: July 2017, Exercise Price: $52.50 | | | 302 | | | | 31,710 | |
| Expiration: August 2017, Exercise Price: $52.50 | | | 34 | | | | 6,630 | |
| Monsanto Company | | | | | | | | |
| Expiration: July 2017, Exercise Price: $115.00 | | | 186 | | | | 68,820 | |
| Pinnacle Foods, Inc. | | | | | | | | |
| Expiration: July 2017, Exercise Price: $70.00 | | | 41 | | | | 615 | |
| Rite Aid Corporation | | | | | | | | |
| Expiration: August 2017, Exercise Price: $3.00 | | | 7,479 | | | | 201,933 | |
| SPDR S&P 500 ETF Trust | | | | | | | | |
| Expiration: August 2017, Exercise Price: $242.00 | | | 127 | | | | 44,069 | |
| | | | | | | | 1,847,413 | |
| | | | | | | | | |
| PUT OPTIONS WRITTEN | | | | | | | | |
| American International Group, Inc | | | | | | | | |
| Expiration: July 2017, Exercise Price: $65.00 | | | 88 | | | | 21,956 | |
| CSX Corporation | | | | | | | | |
| Expiration: July 2017, Exercise Price: $49.00 | | | 64 | | | | 1,536 | |
| Delphi Automotive plc | | | | | | | | |
| Expiration: August 2017, Exercise Price: $82.50 | | | 216 | | | | 29,700 | |
| Expiration: August 2017, Exercise Price: $85.00 | | | 222 | | | | 46,620 | |
| DISH Network Corporation Class A | | | | | | | | |
| Expiration: July 2017, Exercise Price: $62.50 | | | 188 | | | | 31,020 | |
| Hertz Global Holdings, Inc. | | | | | | | | |
| Expiration: July 2017, Exercise Price: $20.00 | | | 56 | | | | 47,600 | |
| Hewlett Packard Enterprise Company | | | | | | | | |
| Expiration: August 2017, Exercise Price: $18.00 | | | 164 | | | | 23,780 | |
| Huntsman Corporation | | | | | | | | |
| Expiration: August 2017, Exercise Price: $21.00 | | | 111 | | | | 833 | |
| Expiration: August 2017, Exercise Price: $23.00 | | | 439 | | | | 10,975 | |
| Expiration: August 2017, Exercise Price: $24.00 | | | 1,050 | | | | 44,625 | |
| Magna International, Inc. | | | | | | | | |
| Expiration: July 2017, Exercise Price: $45.00 | | | 487 | | | | 23,376 | |
| Marathon Petroleum Corporation | | | | | | | | |
| Expiration: July 2017, Exercise Price: $50.00 | | | 281 | | | | 11,240 | |
| Expiration: July 2017, Exercise Price: $52.50 | | | 393 | | | | 47,160 | |
The accompanying notes are an integral part of these financial statements.
WCM Alternatives: Event-Driven Fund
SCHEDULE OF OPTIONS WRITTEN (continued)
June 30, 2017 (Unaudited)
| | | Contracts | | | | |
| | | (100 shares | | | | |
| | | per contract) | | | Value | |
| MetLife, Inc. | | | | | | |
| Expiration: August 2017, Exercise Price: $52.50 | | | 21 | | | $ | 2,016 | |
| Expiration: September 2017, Exercise Price: $52.50 | | | 864 | | | | 113,616 | |
| Sealed Air Corporation | | | | | | | | |
| Expiration: July 2017, Exercise Price: $43.00 | | | 124 | | | | 2,170 | |
| Expiration: July 2017, Exercise Price: $45.00 | | | 852 | | | | 66,030 | |
| SPDR S&P 500 ETF Trust | | | | | | | | |
| Expiration: July 2017, Exercise Price: $234.00 | | | 171 | | | | 8,721 | |
| VanEck Vectors Semiconductor ETF | | | | | | | | |
| Expiration: August 2017, Exercise Price: $78.00 | | | 36 | | | | 5,436 | |
| Wyndham Worldwide Corporation | | | | | | | | |
| Expiration: July 2017, Exercise Price: $95.00 | | | 225 | | | | 10,125 | |
| | | | | | | | 548,535 | |
| TOTAL OPTIONS WRITTEN | | | | | | | | |
| (Premiums received $3,383,122) | | | | | | $ | 2,395,948 | |
ETF – Exchange-Traded Fund
plc – Public Limited Company
| (a) | As the result of a corporate action on the underlying holding, the option’s underlying security is 100 shares of Ashland Global Holding, Inc., 274 shares of Valvoline, Inc. and cash in lieu of fractional shares. |
The accompanying notes are an integral part of these financial statements.
The Merger Fund
SCHEDULE OF FORWARD CURRENCY EXCHANGE CONTRACTS*
June 30, 2017 (Unaudited)
| | | | | | | USD Value at | | | | | | | USD Value at | | | Unrealized | |
| Settlement | | Currency to | | June 30, | | | Currency to | | June 30, | | | Appreciation | |
| Date | | be Delivered | | 2017 | | | be Received | | 2017 | | | (Depreciation)** | |
| 8/15/17 | | | 37,319,578 | | CAD | | $ | 28,802,015 | | | | 27,880,995 | | USD | | $ | 27,880,995 | | | $ | (921,020 | ) |
| 8/15/17 | | | 19,442,990 | | USD | | | 19,442,990 | | | | 25,707,694 | | CAD | | | 19,840,348 | | | | 397,358 | |
| 8/24/17 | | | 5,125,677 | | CAD | | | 3,956,295 | | | | 3,891,032 | | USD | | | 3,891,032 | | | | (65,263 | ) |
| 7/27/17 | | | 6,600,500 | | EUR | | | 7,550,185 | | | | 7,210,930 | | USD | | | 7,210,930 | | | | (339,255 | ) |
| 12/20/17 | | | 109,954,023 | | GBP | | | 143,973,413 | | | | 137,878,490 | | USD | | | 137,878,490 | | | | (6,094,923 | ) |
| 12/20/17 | | | 3,109,275 | | USD | | | 3,109,275 | | | | 2,381,491 | | GBP | | | 3,118,316 | | | | 9,041 | |
| 12/27/17 | | | 3,796,323 | | GBP | | | 4,971,937 | | | | 4,838,454 | | USD | | | 4,838,454 | | | | (133,483 | ) |
| | | | | | | | $ | 211,806,110 | | | | | | | | $ | 204,658,565 | | | $ | (7,147,545 | ) |
CAD – Canadian Dollar
EUR – Euro
GBP – British Pound
USD – U.S. Dollar
| * | JPMorgan Chase & Co., Inc. is the counterparty for all open forward currency exchange contracts held by the Fund as of June 30, 2017. |
| ** | Net unrealized appreciation (depreciation) is a receivable (payable). |
The accompanying notes are an integral part of these financial statements.
WCM Alternatives: Event-Driven Fund
SCHEDULE OF FORWARD CURRENCY EXCHANGE CONTRACTS*
June 30, 2017 (Unaudited)
| | | | | | | USD Value at | | | | | | | USD Value at | | | Unrealized | |
| Settlement | | Currency to | | June 30, | | | Currency to | | June 30, | | | Appreciation | |
| Date | | be Delivered | | 2017 | | | be Received | | 2017 | | | (Depreciation)** | |
| 8/15/17 | | | 1,343,590 | | CAD | | $ | 1,036,938 | | | | 1,003,736 | | USD | | $ | 1,003,736 | | | $ | (33,202 | ) |
| 8/15/17 | | | 706,478 | | USD | | | 706,478 | | | | 934,111 | | CAD | | | 720,916 | | | | 14,438 | |
| 8/24/17 | | | 303,351 | | CAD | | | 234,144 | | | | 229,891 | | USD | | | 229,891 | | | | (4,253 | ) |
| 7/27/17 | | | 619,716 | | EUR | | | 708,881 | | | | 677,364 | | USD | | | 677,364 | | | | (31,517 | ) |
| 12/13/17 | | | 339,933 | | GBP | | | 445,014 | | | | 436,731 | | USD | | | 436,731 | | | | (8,283 | ) |
| 12/20/17 | | | 6,076,143 | | GBP | | | 7,956,080 | | | | 7,680,902 | | USD | | | 7,680,902 | | | | (275,178 | ) |
| 12/20/17 | | | 122,387 | | USD | | | 122,387 | | | | 93,740 | | GBP | | | 122,743 | | | | 356 | |
| 12/27/17 | | | 223,205 | | GBP | | | 292,325 | | | | 284,477 | | USD | | | 284,477 | | | | (7,848 | ) |
| | | | | | | | $ | 11,502,247 | | | | | | | | $ | 11,156,760 | | | $ | (345,487 | ) |
CAD – Canadian Dollar
EUR – Euro
GBP – British Pound
USD – U.S. Dollar
| * | JPMorgan Chase & Co., Inc. is the counterparty for all open forward currency exchange contracts held by the Fund as of June 30, 2017. |
| ** | Net unrealized appreciation (depreciation) is a receivable (payable). |
The accompanying notes are an integral part of these financial statements.
The Merger Fund
SCHEDULE OF SWAP CONTRACTS
June 30, 2017 (Unaudited)
| | | | | | | | | | | Unrealized | | |
| Termination | | | | | | | Notional | | | Appreciation | | Counter- |
| Date | | Security | | Shares | | | Amount | | | (Depreciation)* | | party |
| LONG TOTAL RETURN SWAP CONTRACTS |
| 4/21/18 | | Allied World Assurance | | | | | | | | | | |
| | | Company Holdings AG | | | 918,078 | | | $ | 48,569,892 | | | $ | (28,761 | ) | BAML |
| 6/21/18 | | Booker Group plc | | | 8,398,944 | | | | 19,526,369 | | | | 837,279 | | JPM |
| 4/27/18 | | Christian Dior SE | | | 38,375 | | | | 10,562,363 | | | | 402,776 | | JPM |
| 6/16/18 | | Idorsia Ltd. | | | 26,715 | | | | — | | | | 504,267 | | JPM |
| 5/10/18 | | Luxottica Group S.p.A | | | 2,804 | | | | 163,420 | | | | (1,328 | ) | JPM |
| 4/21/18 | | Reynolds American, Inc. | | | 155,800 | | | | 9,907,322 | | | | 220,786 | | BAML |
| 12/12/17 | | Sky plc | | | 10,006,747 | | | | 122,843,868 | | | | 6,622,086 | | JPM |
| 4/21/18 | | VCA, Inc. | | | 157,718 | | | | 14,440,660 | | | | 110,820 | | BAML |
| 6/21/18 | | Veresen, Inc. | | | 717,761 | | | | 9,896,213 | | | | 253,505 | | BAML |
| | | | | | | | | | | | | | | | |
| SHORT TOTAL RETURN SWAP CONTRACTS |
| 1/18/18 | | British American | | | | | | | | | | | | | |
| | | Tobacco plc (a) | | | (1,151,693 | ) | | | (69,693,093 | ) | | | (8,848,201 | ) | JPM |
| 4/21/18 | | British American | | | | | | | | | | | | | |
| | | Tobacco plc (a) | | | (347,157 | ) | | | (23,059,001 | ) | | | (619,191 | ) | BAML |
| 4/21/18 | | British American | | | | | | | | | | | | | |
| | | Tobacco plc — ADR | | | (81,951 | ) | | | (5,457,937 | ) | | | (164,167 | ) | BAML |
| 5/10/18 | | Essilor International SA | | | (1,292 | ) | | | (168,251 | ) | | | 3,925 | | JPM |
| 4/21/18 | | Fairfax Financial | | | | | | | | | | | | | |
| | | Holdings Ltd. | | | (53,191 | ) | | | (23,483,979 | ) | | | 436,657 | | BAML |
| 4/27/18 | | Hermes International | | | (7,367 | ) | | | (3,542,244 | ) | | | (96,844 | ) | JPM |
| 6/21/18 | | Pembina Pipeline | | | | | | | | | | | | | |
| | | Corporation | | | (227,674 | ) | | | (7,349,128 | ) | | | (190,974 | ) | BAML |
| 6/21/18 | | Tesco plc | | | (7,228,836 | ) | | | (15,366,359 | ) | | | (524,132 | ) | JPM |
| | | | | | | | | | | | | $ | (1,081,497 | ) | |
ADR – American Depository Receipt
BAML – Bank of America Merrill Lynch & Co., Inc.
JPM – JPMorgan Chase & Co., Inc.
plc – Public Limited Company
| * | Based on the net swap value held at each counterparty, unrealized appreciation is a receivable and unrealized depreciation is a payable. |
| (a) | Security fair valued by the Valuation Group in good faith in accordance with the policies adopted by the Board of Trustees. |
The accompanying notes are an integral part of these financial statements.
WCM Alternatives: Event-Driven Fund
SCHEDULE OF SWAP CONTRACTS
June 30, 2017 (Unaudited)
| | | | | | | | | | | Unrealized | | |
| Termination | | | | | | | Notional | | | Appreciation | | Counter- |
| Date | | Security | | Shares | | | Amount | | | (Depreciation)* | | party |
| LONG TOTAL RETURN SWAP CONTRACTS |
| 5/19/18 | | Alere, Inc. | | | 57,863 | | | $ | 2,784,637 | | | $ | 118,493 | | BAML |
| 4/21/18 | | Allied World Assurance | | | | | | | | | | | | | |
| | | Company Holdings AG | | | 25,229 | | | | 1,335,613 | | | | (1,598 | ) | BAML |
| 6/19/18 | | Altaba, Inc. | | | 36,346 | | | | 1,841,165 | | | | 138,079 | | JPM |
| 8/26/17 | | American International | | | | | | | | | | | | | |
| | | Group, Inc. | | | 31,400 | | | | 1,842,057 | | | | 112,803 | | JPM |
| 4/21/18 | | Baker Hughes, Inc. | | | 56,481 | | | | 3,347,045 | | | | (269,732 | ) | BAML |
| 6/21/18 | | Booker Group plc | | | 493,817 | | | | 1,148,055 | | | | 49,228 | | JPM |
| 6/27/18 | | C.R. Bard, Inc. | | | 19,532 | | | | 6,181,241 | | | | (6,981 | ) | JPM |
| 4/21/18 | | CBS Corporation Class B | | | 3,300 | | | | 226,281 | | | | (15,909 | ) | BAML |
| 4/27/18 | | Christian Dior SE | | | 3,603 | | | | 990,970 | | | | 36,806 | | JPM |
| 2/16/18 | | Fortress Investment | | | | | | | | | | | | | |
| | | Group LLC Class A | | | 199,280 | | | | 1,572,758 | | | | 11,346 | | JPM |
| 4/21/18 | | Hewlett Packard | | | | | | | | | | | | | |
| | | Enterprise Company | | | 198,079 | | | | 3,596,615 | | | | (312,098 | ) | BAML |
| 6/16/18 | | Idorsia Ltd. | | | 1,336 | | | | — | | | | 25,218 | | JPM |
| 5/24/18 | | ILG, Inc. | | | 53,542 | | | | 1,438,251 | | | | 31,955 | | JPM |
| 6/26/18 | | Kennedy Wilson | | | | | | | | | | | | | |
| | | Europe Real Estate plc | | | 60,197 | | | | 851,904 | | | | 18,305 | | JPM |
| 5/10/18 | | Luxottica Group S.p.A | | | 106 | | | | 6,178 | | | | (59 | ) | JPM |
| 4/21/18 | | Mobileye N.V. | | | 78,337 | | | | 4,852,830 | | | | 64,728 | | BAML |
| 4/5/18 | | Monsanto Company | | | 1,827 | | | | 211,422 | | | | 4,113 | | JPM |
| 4/13/18 | | NXP Semiconductors NV | | | 82,177 | | | | 8,619,961 | | | | 370,473 | | BAML |
| 4/21/18 | | ONEOK Partners LP | | | 24,633 | | | | 1,279,931 | | | | (22,543 | ) | BAML |
| 4/26/18 | | ONEOK Partners LP | | | 3,328 | | | | 175,769 | | | | (6,364 | ) | JPM |
| 5/18/18 | | PAREXEL International | | | | | | | | | | | | | |
| | | Corporation | | | 3,444 | | | | 275,758 | | | | 23,253 | | JPM |
| 4/21/18 | | Reynolds American, Inc. | | | 148,005 | | | | 9,411,638 | | | | 210,384 | | BAML |
| 4/21/18 | | Rite Aid Corporation | | | 59,239 | | | | 241,695 | | | | (67,057 | ) | BAML |
| 12/12/17 | | Sky plc | | | 556,503 | | | | 6,900,130 | | | | 279,644 | | JPM |
| 4/21/18 | | Time Warner, Inc. | | | 51,128 | | | | 5,112,800 | | | | 18,668 | | BAML |
| 4/21/18 | | VCA, Inc. | | | 15,846 | | | | 1,450,860 | | | | 11,233 | | BAML |
| 6/23/18 | | Veresen, Inc. | | | 48,598 | | | | 671,709 | | | | 15,526 | | BAML |
| | | | | | | | | | | | | | | | |
| SHORT TOTAL RETURN SWAP CONTRACTS |
| 1/5/18 | | Alibaba Group | | | | | | | | | | | | | |
| | | Holding Ltd. — ADR | | | (59,306 | ) | | | (5,974,281 | ) | | | (2,373,753 | ) | JPM |
| 1/18/18 | | British American | | | | | | | | | | | | | |
| | | Tobacco plc (a) | | | (52,637 | ) | | | (3,193,043 | ) | | | (390,252 | ) | JPM |
| 4/21/18 | | British American | | | | | | | | | | | | | |
| | | Tobacco plc (a) | | | (19,753 | ) | | | (1,312,042 | ) | | | (35,238 | ) | BAML |
The accompanying notes are an integral part of these financial statements.
WCM Alternatives: Event-Driven Fund
SCHEDULE OF SWAP CONTRACTS (continued)
June 30, 2017 (Unaudited)
| | | | | | | | | | | Unrealized | | |
| Termination | | | | | | | Notional | | | Appreciation | | Counter- |
| Date | | Security | | Shares | | | Amount | | | (Depreciation)* | | party |
| 4/21/18 | | British American | | | | | | | | | | |
| | | Tobacco plc — ADR | | | (2,262 | ) | | $ | (150,649 | ) | | $ | (4,505 | ) | BAML |
| 5/10/18 | | Essilor International SA | | | (49 | ) | | | (6,381 | ) | | | 153 | | JPM |
| 4/21/18 | | Fairfax Financial | | | | | | | | | | | | | |
| | | Holdings Ltd. | | | (1,462 | ) | | | (646,698 | ) | | | 13,217 | | BAML |
| 4/27/18 | | Hermes International | | | (691 | ) | | | (331,582 | ) | | | (9,461 | ) | JPM |
| 6/30/18 | | Kennedy-Wilson | | | | | | | | | | | | | |
| | | Holdings, Inc. | | | (23,200 | ) | | | (440,652 | ) | | | — | | JPM |
| 4/21/18 | | ONEOK, Inc. | | | (211 | ) | | | (11,377 | ) | | | 374 | | BAML |
| 4/21/18 | | ONEOK, Inc. | | | (3,275 | ) | | | (179,084 | ) | | | 8,438 | | JPM |
| 6/23/18 | | Pembina Pipeline | | | | | | | | | | | | | |
| | | Corporation | | | (15,416 | ) | | | (499,723 | ) | | | (10,831 | ) | BAML |
| 6/21/18 | | Tesco plc | | | (425,021 | ) | | | (903,468 | ) | | | (30,817 | ) | JPM |
| | | | | | | | | | | | | $ | (1,994,761 | ) | |
ADR – American Depository Receipt
BAML – Bank of America Merrill Lynch & Co., Inc.
JPM – JPMorgan Chase & Co., Inc.
plc – Public Limited Company
| * | Based on the net swap value held at each counterparty, unrealized appreciation is a receivable and unrealized depreciation is a payable. |
| (a) | Security fair valued by the Valuation Group in good faith in accordance with the policies adopted by the Board of Trustees. |
The accompanying notes are an integral part of these financial statements.
(This Page Intentionally Left Blank.)
The Merger Fund and WCM Alternatives: Event-Driven Fund
STATEMENTS OF ASSETS AND LIABILITIES
June 30, 2017 (Unaudited)
| | | | | WCM Alternatives: | |
| | | The Merger Fund | | | Event-Driven Fund | |
| ASSETS: | | | | | | |
| Investments, at value (Cost $2,825,809,873 and | | | | | | |
| $113,633,907, respectively) | | $ | 2,932,485,361 | | | $ | 116,107,495 | |
| Cash held in foreign currency (Cost 8,818,344 | | | | | | | | |
| and $337,414, respectively) | | | 9,024,962 | | | | 342,749 | |
| Receivable at brokers | | | 311,768,209 | | | | 11,420,522 | |
| Deposits at brokers | | | — | | | | 7,715,834 | |
| Receivable for swap contracts | | | 18,675 | | | | 83,585 | |
| Receivable for investments sold | | | 10,439,131 | | | | 1,334,770 | |
| Dividends and interest receivable | | | 10,344,419 | | | | 528,636 | |
| Receivable for fund shares issued | | | 4,739,807 | | | | 325,158 | |
| Prepaid expenses and other receivables | | | 212,849 | | | | 32,226 | |
| Total Assets | | | 3,279,033,413 | | | | 137,890,975 | |
| LIABILITIES: | | | | | | | | |
| Securities sold short, at value (Proceeds of | | | | | | | | |
| $314,012,471 and $11,420,522, respectively) | | | 391,911,303 | | | | 13,007,936 | |
| Written option contracts, at value | | | | | | | | |
| (Premiums received $30,162,982 | | | | | | | | |
| and $3,383,122, respectively) | | | 22,128,888 | | | | 2,395,948 | |
| Payable for forward currency exchange contracts | | | 7,147,545 | | | | 345,487 | |
| Payable for swap contracts | | | 1,100,172 | | | | 2,078,346 | |
| Payable for investments purchased | | | 13,524,397 | | | | 8,025,050 | |
| Payable for fund shares redeemed | | | 3,658,550 | | | | 42,346 | |
| Payable to the investment adviser | | | 2,155,701 | | | | 125,151 | |
| Accrued expenses and other liabilities | | | 1,025,885 | | | | 77,860 | |
| Dividends and interest payable | | | 793,174 | | | | 31,982 | |
| Distribution fees payable | | | 599,700 | | | | 1,349 | |
| Total Liabilities | | | 444,045,315 | | | | 26,131,455 | |
| NET ASSETS | | $ | 2,834,988,098 | | | $ | 111,759,520 | |
The accompanying notes are an integral part of these financial statements.
The Merger Fund and WCM Alternatives: Event-Driven Fund
STATEMENTS OF ASSETS AND LIABILITIES (continued)
June 30, 2017 (Unaudited)
| | | | | | WCM Alternatives: | |
| | | The Merger Fund | | | Event-Driven Fund | |
| NET ASSETS CONSISTS OF: | | | | | | |
| Accumulated undistributed | | | | | | |
| net investment income | | $ | 3,144,049 | | | $ | 10,319 | |
| Accumulated net realized gain (loss) on | | | | | | | | |
| investments, securities sold short, written option | | | | | | | | |
| contracts expired or closed, forward currency | | | | | | | | |
| exchange contracts, swap contracts, and | | | | | | | | |
| foreign currency transaction | | | (105,799,026 | ) | | | 1,915,733 | |
| Net unrealized appreciation (depreciation) on: | | | | | | | | |
| Investments | | | 106,675,488 | | | | 2,473,588 | |
| Securities sold short | | | (77,898,832 | ) | | | (1,587,414 | ) |
| Written option contracts | | | 8,034,094 | | | | 987,174 | |
| Forward currency exchange contracts | | | (7,147,545 | ) | | | (345,487 | ) |
| Swap contracts | | | (1,081,497 | ) | | | (1,994,761 | ) |
| Foreign currency transaction | | | 206,618 | | | | 5,335 | |
| Net unrealized appreciation (depreciation) | | | 28,788,326 | | | | (461,565 | ) |
| Paid-in capital | | | 2,908,854,749 | | | | 110,295,033 | |
| Total Net Assets | | $ | 2,834,988,098 | | | $ | 111,759,520 | |
| | | | | | | | | |
| Investor Class | | | | | | | | |
| Net assets | | $ | 1,403,080,775 | | | $ | 4,152,837 | |
| Shares outstanding | | | 87,741,521 | | | | 406,586 | |
| Net asset value and offering price per share* | | $ | 15.99 | | | $ | 10.21 | |
| | | | | | | | | |
| Institutional Class | | | | | | | | |
| Net assets | | $ | 1,431,907,323 | | | $ | 107,606,683 | |
| Shares outstanding | | | 89,967,559 | | | | 10,529,251 | |
| Net asset value and offering price per share* | | $ | 15.92 | | | $ | 10.22 | |
| * | The redemption price per share may vary based on the length of time a shareholder holds Fund shares. |
The accompanying notes are an integral part of these financial statements.
The Merger Fund and WCM Alternatives: Event-Driven Fund
STATEMENTS OF OPERATIONS
For the Six Months Ended June 30, 2017 (Unaudited)
| | | | | | WCM Alternatives: | |
| | | The Merger Fund | | | Event-Driven Fund | |
| INVESTMENT INCOME: | | | | | | |
| Interest | | $ | 5,744,287 | | | $ | 370,784 | |
| Dividend income on long positions (net of | | | | | | | | |
| foreign withholding taxes of $215,767 | | | | | | | | |
| and $445, respectively) | | | 15,049,198 | | | | 734,921 | |
| Total investment income | | | 20,793,485 | | | | 1,105,705 | |
| | | | | | | | | |
| EXPENSES: | | | | | | | | |
| Investment advisory fees | | | 14,187,873 | | | | 683,954 | |
| Distribution fees (Investor Class) | | | 1,814,989 | | | | 2,090 | |
| Sub transfer agent fees (Investor Class) | | | 886,014 | | | | 791 | |
| Sub transfer agent fees (Institutional Class) | | | 339,458 | | | | 56,896 | |
| Administration fees | | | 495,055 | | | | 28,283 | |
| Professional fees | | | 305,467 | | | | 59,203 | |
| Transfer agent and shareholder | | | | | | | | |
| servicing agent fees | | | 225,337 | | | | 11,602 | |
| Fund accounting expenses | | | 144,575 | | | | 15,361 | |
| Custody fees | | | 129,019 | | | | 19,646 | |
| Federal and state registration fees | | | 121,425 | | | | 18,218 | |
| Trustees’ fees and expenses | | | 109,319 | | | | 7,752 | |
| Miscellaneous expenses | | | 105,944 | | | | 7,509 | |
| Compliance fees | | | 94,526 | | | | 3,630 | |
| Reports to shareholders | | | 53,324 | | | | 3,838 | |
| Dividends and interest on securities sold short | | | 3,737,032 | | | | 187,197 | |
| Borrowing expenses on securities sold short | | | 963,904 | | | | 75,632 | |
| Total expenses before expense | | | | | | | | |
| waiver/recoupment by adviser | | | 23,713,261 | | | | 1,181,602 | |
| Expense recouped (waived) | | | | | | | | |
| by adviser (Note 3) | | | (1,101,958 | ) | | | 35,380 | |
| Net expenses | | | 22,611,303 | | | | 1,216,982 | |
| NET INVESTMENT LOSS | | | (1,817,818 | ) | | | (111,277 | ) |
The accompanying notes are an integral part of these financial statements.
The Merger Fund and WCM Alternatives: Event-Driven Fund
STATEMENTS OF OPERATIONS (continued)
For the Six Months Ended June 30, 2017 (Unaudited)
| | | | | | WCM Alternatives: | |
| | | The Merger Fund | | | Event-Driven Fund | |
| REALIZED AND CHANGE IN UNREALIZED | | | | | | |
| GAIN (LOSS) ON INVESTMENTS: | | | | | | |
| Realized gain (loss) on: | | | | | | |
| Investments | | $ | 104,384,053 | | | $ | 6,783,401 | |
| Securities sold short | | | (43,258,605 | ) | | | (2,291,030 | ) |
| Written option contracts expired or closed | | | 14,508,728 | | | | (27,696 | ) |
| Forward currency exchange contracts | | | 131,357 | | | | 3,849 | |
| Swap contracts | | | (2,940,129 | ) | | | 2,868,122 | |
| Foreign currency transaction | | | (1,325 | ) | | | 1,228 | |
| Net realized gain | | | 72,824,079 | | | | 7,337,874 | |
| Change in unrealized | | | | | | | | |
| appreciation (depreciation) on: | | | | | | | | |
| Investments | | | 23,473,840 | | | | (2,892,070 | ) |
| Securities sold short | | | (42,135,959 | ) | | | 517,038 | |
| Written option contracts | | | 9,692,180 | | | | 1,165,051 | |
| Forward currency exchange contracts | | | (7,941,319 | ) | | | (403,931 | ) |
| Swap contracts | | | 8,451,647 | | | | (1,027,896 | ) |
| Foreign currency transaction | | | 206,633 | | | | 6,523 | |
| Net change in unrealized | | | | | | | | |
| appreciation (depreciation) | | | (8,252,978 | ) | | | (2,635,285 | ) |
| NET REALIZED AND CHANGE IN | | | | | | | | |
| UNREALIZED GAIN ON INVESTMENTS | | | 64,571,101 | | | | 4,702,589 | |
| NET INCREASE IN NET ASSETS | | | | | | | | |
| RESULTING FROM OPERATIONS | | $ | 62,753,283 | | | $ | 4,591,312 | |
The accompanying notes are an integral part of these financial statements.
The Merger Fund
STATEMENTS OF CHANGES IN NET ASSETS
| | | Six Months Ended | | | Year Ended | |
| | | June 30, 2017 | | | December 31, 2016 | |
| | | (Unaudited) | | | | |
| Net investment loss | | $ | (1,817,818 | ) | | $ | (18,503,003 | ) |
| Net realized gain on investments, securities | | | | | | | | |
| sold short, written option contracts | | | | | | | | |
| expired or closed, forward currency | | | | | | | | |
| exchange contracts, swap contracts, | | | | | | | | |
| and foreign currency transaction | | | 72,824,079 | | | | 40,909,822 | |
| Net change in unrealized appreciation | | | | | | | | |
| (depreciation) on investments, securities sold | | | | | | | | |
| short, written option contracts, forward | | | | | | | | |
| currency exchange contracts, swap contracts, | | | | | | | | |
| and foreign currency transaction | | | (8,252,978 | ) | | | 73,502,395 | |
| Net increase in net assets | | | | | | | | |
| resulting from operations | | | 62,753,283 | | | | 95,909,214 | |
| | | | | | | | | |
| Investor Class — | | | | | | | | |
| Distributions to shareholders from: (Note 5) | | | | | | | | |
| Net investment income | | | — | | | | (4,911,192 | ) |
| Net realized gains | | | — | | | | — | |
| Total dividends and distributions — | | | | | | | | |
| Investor Class | | | — | | | | (4,911,192 | ) |
| | | | | | | | | |
| Institutional Class — | | | | | | | | |
| Distributions to shareholders from: (Note 5) | | | | | | | | |
| Net investment income | | | — | | | | (12,300,844 | ) |
| Net realized gains | | | — | | | | — | |
| Total dividends and distributions — | | | | | | | | |
| Institutional Class | | | — | | | | (12,300,844 | ) |
| Net decrease in net assets from | | | | | | | | |
| capital share transactions (Note 4) | | | (145,271,625 | ) | | | (1,917,196,942 | ) |
| Net decrease in net assets | | | (82,518,342 | ) | | | (1,838,499,764 | ) |
| | | | | | | | | |
| NET ASSETS: | | | | | | | | |
| Beginning of period | | | 2,917,506,440 | | | | 4,756,006,204 | |
| End of period (including accumulated | | | | | | | | |
| undistributed net investment income of | | | | | | | | |
| $3,144,049 and $4,961,867, respectively) | | $ | 2,834,988,098 | | | $ | 2,917,506,440 | |
The accompanying notes are an integral part of these financial statements.
WCM Alternatives: Event-Driven Fund
STATEMENTS OF CHANGES IN NET ASSETS
| | | Six Months Ended | | | Year Ended | |
| | | June 30, 2017 | | | December 31, 2016 | |
| | | (Unaudited) | | | | |
| Net investment loss | | $ | (111,277 | ) | | $ | (513,660 | ) |
| Net realized gain (loss) on investments, | | | | | | | | |
| securities sold short, written option contracts | | | | | | | | |
| expired or closed, forward currency exchange | | | | | | | | |
| contracts, swap contracts, and foreign | | | | | | | | |
| currency transaction | | | 7,337,874 | | | | (676,431 | ) |
| Net change in unrealized appreciation | | | | | | | | |
| (depreciation) on investments, securities sold | | | | | | | | |
| short, written option contracts, forward | | | | | | | | |
| currency exchange contracts, swap contracts, | | | | | | | | |
| and foreign currency transaction | | | (2,635,285 | ) | | | 4,630,828 | |
| Net increase in net assets | | | | | | | | |
| resulting from operations | | | 4,591,312 | | | | 3,440,737 | |
| | | | | | | | | |
| Institutional Class — | | | | | | | | |
| Distributions to shareholders from: (Note 5) | | | | | | | | |
| Net investment income | | | — | | | | (968,948 | ) |
| Net realized gains | | | — | | | | — | |
| Total dividends and distributions — | | | | | | | | |
| Institutional Class | | | — | | | | (968,948 | ) |
| Net increase (decrease) in net assets | | | | | | | | |
| from capital share transactions (Note 4) | | | (5,778,497 | ) | | | 13,985,677 | |
| Net increase (decrease) in net assets | | | (1,187,185 | ) | | | 16,457,466 | |
| | | | | | | | | |
| NET ASSETS: | | | | | | | | |
| Beginning of period | | | 112,946,705 | | | | 96,489,239 | |
| End of period (including accumulated | | | | | | | | |
| undistributed net investment income of | | | | | | | | |
| $10,319 and $121,596, respectively) | | $ | 111,759,520 | | | $ | 112,946,705 | |
The accompanying notes are an integral part of these financial statements.
The Merger Fund
FINANCIAL HIGHLIGHTS
Selected per share data is based on a share of beneficial interest outstanding throughout each period.
Institutional Class
| | | | | | | | | | | | | | | For the | |
| | | | | | | | | | | | | | | Period from | |
| | | | | | | | | | | | | | | August 1, | |
| | | Six Months | | | | | | | | | | | | 2013^ | |
| | | Ended | | | | | | | | | | | | through | |
| | | June 30, | | | Year Ended December 31, | | | December 31, | |
| | | 2017 | | | 2016 | | | 2015 | | | 2014 | | | 2013 | |
| | | (Unaudited) | | | | | | | | | | | | | |
| Per Share Data: | | | | | | | | | | | | | | | |
| Net asset value, | | | | | | | | | | | | | | | |
| beginning of period | | $ | 15.56 | | | $ | 15.25 | | | $ | 15.58 | | | $ | 15.97 | | | $ | 16.06 | |
| Income from | | | | | | | | | | | | | | | | | | | | |
| investment operations: | | | | | | | | | | | | | | | | | | | | |
| Net investment | | | | | | | | | | | | | | | | | | | | |
income (loss)(1)(2) | | | 0.01 | | | | (0.04 | ) | | | (0.03 | ) | | | 0.37 | | | | 0.03 | |
| Net realized and | | | | | | | | | | | | | | | | | | | | |
| unrealized gain (loss) | | | | | | | | | | | | | | | | | | | | |
| on investments | | | 0.35 | | | | 0.49 | | | | (0.05 | ) | | | (0.10 | ) | | | 0.31 | |
| Total from | | | | | | | | | | | | | | | | | | | | |
| investment operations | | | 0.36 | | | | 0.45 | | | | (0.08 | ) | | | 0.27 | | | | 0.34 | |
| Less distributions: | | | | | | | | | | | | | | | | | | | | |
| From net | | | | | | | | | | | | | | | | | | | | |
| investment income | | | — | | | | (0.14 | ) | | | (0.18 | ) | | | (0.45 | ) | | | (0.35 | ) |
| From net realized gains | | | — | | | | — | | | | (0.07 | ) | | | (0.21 | ) | | | (0.08 | ) |
| Total dividends | | | | | | | | | | | | | | | | | | | | |
| and distributions | | | — | | | | (0.14 | ) | | | (0.25 | ) | | | (0.66 | ) | | | (0.43 | ) |
| Net Asset Value, | | | | | | | | | | | | | | | | | | | | |
| end of period | | $ | 15.92 | | | $ | 15.56 | | | $ | 15.25 | | | $ | 15.58 | | | $ | 15.97 | |
| Total Return | | | 2.31 | %(3) | | | 2.94 | % | | | (0.52 | )% | | | 1.63 | % | | | 2.20 | %(3) |
The accompanying notes are an integral part of these financial statements.
The Merger Fund
FINANCIAL HIGHLIGHTS (continued)
Institutional Class
| | | | | | | | | | | | | | | For the | |
| | | | | | | | | | | | | | | Period from | |
| | | | | | | | | | | | | | | August 1, | |
| | | Six Months | | | | | | | | | | | | 2013^ | |
| | | Ended | | | | | | | | | | | | through | |
| | | June 30, | | | Year Ended December 31, | | | December 31, | |
| | | 2017 | | | 2016 | | | 2015 | | | 2014 | | | 2013 | |
| | | (Unaudited) | | | | | | | | | | | | | |
| Supplemental data and ratios: | | | | | | | | | | | | | | | |
| Net assets, end | | | | | | | | | | | | | | | |
| of period (000’s) | | $ | 1,431,907 | | | $ | 1,377,041 | | | $ | 1,247,332 | | | $ | 1,332,078 | | | $ | 172,247 | |
| Ratio of gross expenses | | | | | | | | | | | | | | | | | | | | |
| to average net assets: | | | | | | | | | | | | | | | | | | | | |
| Before expense waiver | | | 1.51 | %(4) | | | 1.70 | % | | | 1.54 | % | | | 1.44 | % | | | 1.32 | %(4) |
| After expense waiver | | | 1.43 | %(4) | | | 1.59 | % | | | 1.41 | % | | | 1.28 | % | | | 1.19 | %(4) |
| Ratio of dividends and interest | | | | | | | | | | | | | | | | | | | | |
| on short positions and | | | | | | | | | | | | | | | | | | | | |
| borrowing expense on | | | | | | | | | | | | | | | | | | | | |
| securities sold short to | | | | | | | | | | | | | | | | | | | | |
| average net assets | | | 0.33 | %(4) | | | 0.52 | % | | | 0.40 | % | | | 0.29 | % | | | 0.19 | %(4) |
| Ratio of operating expense to | | | | | | | | | | | | | | | | | | | | |
| average net assets excluding | | | | | | | | | | | | | | | | | | | | |
| dividends and interest on | | | | | | | | | | | | | | | | | | | | |
| short positions and borrowing | | | | | | | | | | | | | | | | | | | | |
| expense on securities sold | | | | | | | | | | | | | | | | | | | | |
| short (after expense waiver) | | | 1.10 | %(4) | | | 1.07 | % | | | 1.01 | % | | | 0.99 | % | | | 1.00 | %(4) |
| Ratio of net investment | | | | | | | | | | | | | | | | | | | | |
| income (loss) to average | | | | | | | | | | | | | | | | | | | | |
| net assets | | | 0.04 | %(4) | | | (0.27 | )% | | | (0.21 | )% | | | 2.30 | % | | | 0.42 | %(4) |
| | | | | | | | | | | | | | | | | | | | | |
Portfolio turnover rate(5) | | | 91 | %(3) | | | 182 | % | | | 157 | % | | | 137 | % | | | 194 | %(3) |
| (1) | Net investment income before dividends and interest on short positions and borrowing expense on securities sold short for the six months ended June 30, 2017 and years ended December 31, 2016, 2015, 2014 and the period ended December 31, 2013 were $0.03, $0.04, $0.03, $0.42 and $0.04, respectively. |
| (2) | Net investment income (loss) per share has been calculated based on average shares outstanding during the period. |
| (3) | Not annualized. |
| (4) | Annualized. |
| (5) | The numerator for the portfolio turnover rate includes the lesser of purchases or sales (excluding short-term investments, short-term options, forward currency contracts, swap contracts and short positions). The denominator includes the average long positions throughout the period. |
| ^ | Commencement of operations. |
The accompanying notes are an integral part of these financial statements.
The Merger Fund
FINANCIAL HIGHLIGHTS
Selected per share data is based on a share of beneficial interest outstanding throughout each period.
Investor Class
| | | Six Months | | | | | | | | | | | | | | | | |
| | | Ended | | | | | | | | | | | | | | | | |
| | | June 30, | | | Year Ended December 31, | |
| | | 2017 | | | 2016 | | | 2015 | | | 2014 | | | 2013 | | | 2012 | |
| | | (Unaudited) | | | | | | | | | | | | | | | | |
| Per Share Data: | | | | | | | | | | | | | | | | | | |
| Net asset value, | | | | | | | | | | | | | | | | | | |
| beginning of period | | $ | 15.66 | | | $ | 15.31 | | | $ | 15.63 | | | $ | 16.01 | | | $ | 15.83 | | | $ | 15.59 | |
| Income from | | | | | | | | | | | | | | | | | | | | | | | | |
| investment operations: | | | | | | | | | | | | | | | | | | | | | | | | |
| Net investment | | | | | | | | | | | | | | | | | | | | | | | | |
income (loss)(1)(2) | | | (0.02 | ) | | | (0.09 | ) | | | (0.08 | ) | | | 0.33 | | | | 0.04 | | | | (0.05 | ) |
| Net realized and | | | | | | | | | | | | | | | | | | | | | | | | |
| unrealized gain (loss) | | | | | | | | | | | | | | | | | | | | | | | | |
| on investments | | | 0.35 | | | | 0.49 | | | | (0.05 | ) | | | (0.10 | ) | | | 0.53 | | | | 0.61 | |
| Total from | | | | | | | | | | | | | | | | | | | | | | | | |
| investment operations | | | 0.33 | | | | 0.40 | | | | (0.13 | ) | | | 0.23 | | | | 0.57 | | | | 0.56 | |
| Redemption fees | | | — | | | | — | | | | — | | | | — | | | | — | | | | 0.00 | (3) |
| Less distributions: | | | | | | | | | | | | | | | | | | | | | | | | |
| From net | | | | | | | | | | | | | | | | | | | | | | | | |
| investment income | | | — | | | | (0.05 | ) | | | (0.12 | ) | | | (0.40 | ) | | | (0.31 | ) | | | (0.26 | ) |
| From net realized gains | | | — | | | | — | | | | (0.07 | ) | | | (0.21 | ) | | | (0.08 | ) | | | (0.06 | ) |
| Total dividends | | | | | | | | | | | | | | | | | | | | | | | | |
| and distributions | | | — | | | | (0.05 | ) | | | (0.19 | ) | | | (0.61 | ) | | | (0.39 | ) | | | (0.32 | ) |
| Net Asset Value, | | | | | | | | | | | | | | | | | | | | | | | | |
| end of period | | $ | 15.99 | | | $ | 15.66 | | | $ | 15.31 | | | $ | 15.63 | | | $ | 16.01 | | | $ | 15.83 | |
| Total Return | | | 2.11 | %(4) | | | 2.61 | % | | | (0.82 | )% | | | 1.43 | % | | | 3.61 | % | | | 3.61 | % |
The accompanying notes are an integral part of these financial statements.
The Merger Fund
FINANCIAL HIGHLIGHTS (continued)
Investor Class
| | | Six Months | | | | | | | | | | | | | | | | |
| | | Ended | | | | | | | | | | | | | | | | |
| | | June 30, | | | Year Ended December 31, | |
| | | 2017 | | | 2016 | | | 2015 | | | 2014 | | | 2013 | | | 2012 | |
| | | (Unaudited) | | | | | | | | | | | | | | | | |
| Supplemental data and ratios: | | | | | | | | | | | | | | | | | | |
| Net assets, end | | | | | | | | | | | | | | | | | | |
| of period (in millions) | | $ | 1,403 | | | $ | 1,540 | | | $ | 3,509 | | | $ | 4,069 | | | $ | 4,843 | | | $ | 4,416 | |
| Ratio of gross expenses | | | | | | | | | | | | | | | | | | | | | | | | |
| to average net assets: | | | | | | | | | | | | | | | | | | | | | | | | |
| Before expense waiver | | | 1.83 | %(5) | | | 2.03 | % | | | 1.87 | % | | | 1.68 | % | | | 1.61 | % | | | 1.82 | % |
| After expense waiver | | | 1.75 | %(5) | | | 1.92 | % | | | 1.74 | % | | | 1.52 | % | | | 1.48 | % | | | 1.69 | % |
| Ratio of dividends and interest | | | | | | | | | | | | | | | | | | | | | | | | |
| on short positions and | | | | | | | | | | | | | | | | | | | | | | | | |
| borrowing expense on | | | | | | | | | | | | | | | | | | | | | | | | |
| securities sold short to | | | | | | | | | | | | | | | | | | | | | | | | |
| average net assets | | | 0.33 | %(5) | | | 0.52 | % | | | 0.40 | % | | | 0.29 | % | | | 0.22 | % | | | 0.42 | % |
| Ratio of operating expense to | | | | | | | | | | | | | | | | | | | | | | | | |
| average net assets excluding | | | | | | | | | | | | | | | | | | | | | | | | |
| dividends and interest on | | | | | | | | | | | | | | | | | | | | | | | | |
| short positions and borrowing | | | | | | | | | | | | | | | | | | | | | | | | |
| expense on securities sold | | | | | | | | | | | | | | | | | | | | | | | | |
| short (after expense waiver) | | | 1.42 | %(5) | | | 1.40 | % | | | 1.34 | % | | | 1.23 | % | | | 1.26 | % | | | 1.27 | % |
| Ratio of net investment | | | | | | | | | | | | | | | | | | | | | | | | |
| income (loss) to average | | | | | | | | | | | | | | | | | | | | | | | | |
| net assets | | | (0.29 | )%(5) | | | (0.60 | )% | | | (0.53 | )% | | | 2.06 | % | | | 0.22 | % | | | (0.34 | )% |
Portfolio turnover rate(6) | | | 91 | %(4) | | | 182 | % | | | 157 | % | | | 137 | % | | | 194 | % | | | 240 | % |
| (1) | Net investment income before dividends and interest on short positions and borrowing expense on securities sold short for the six months ended June 30, 2017 and years ended December 31, 2016, 2015, 2014, 2013, 2012 were $0.00, $(0.01), $(0.02), $0.38, $0.07, and $0.01, respectively. |
| (2) | Net investment income (loss) per share has been calculated based on average shares outstanding during the year. |
| (3) | Amount less than $0.005 per share. |
| (4) | Not annualized. |
| (5) | Annualized. |
| (6) | The numerator for the portfolio turnover rate includes the lesser of purchases or sales (excluding short-term investments, short-term options, forward currency contracts, swap contracts and short positions). The denominator includes the average long positions throughout the year. |
The accompanying notes are an integral part of these financial statements.
WCM Alternatives: Event-Driven Fund
FINANCIAL HIGHLIGHTS
Selected per share data is based on a share of beneficial interest outstanding throughout each period.
Institutional Class
| | | | | | | | | | | | For the | |
| | | | | | | | | | | | Period from | |
| | | | | | | | | | | | January 2, | |
| | | Six Months | | | | | | | | | 2014^ | |
| | | Ended | | | Year Ended | | | through | |
| | | June 30, | | | December 31, | | | December 31, | |
| | | 2017 | | | 2016 | | | 2015 | | | 2014 | |
| | | (Unaudited) | | | | | | | | | | |
| Per Share Data: | | | | | | | | | | | | |
| Net asset value, beginning of period | | $ | 9.81 | | | $ | 9.62 | | | $ | 10.14 | | | $ | 10.00 | |
| Income from investment operations: | | | | | | | | | | | | | | | | |
Net investment income (loss)(1)(2) | | | (0.01 | ) | | | (0.04 | ) | | | 0.01 | | | | 0.05 | |
| Net realized and unrealized | | | | | | | | | | | | | | | | |
| gain (loss) on investments | | | 0.42 | | | | 0.31 | | | | (0.22 | ) | | | 0.34 | |
| Total from investment operations | | | 0.41 | | | | 0.27 | | | | (0.21 | ) | | | 0.39 | |
| Less distributions: | | | | | | | | | | | | | | | | |
| From net investment income | | | — | | | | (0.08 | ) | | | (0.09 | ) | | | — | |
| From net realized gains | | | — | | | | — | | | | (0.22 | ) | | | (0.25 | ) |
| Total dividends and distributions | | | — | | | | (0.08 | ) | | | (0.31 | ) | | | (0.25 | ) |
| Net Asset Value, end of period | | $ | 10.22 | | | $ | 9.81 | | | $ | 9.62 | | | $ | 10.14 | |
| Total Return | | | 4.18 | %(3) | | | 2.86 | % | | | (2.08 | )% | | | 3.87 | %(3) |
The accompanying notes are an integral part of these financial statements.
WCM Alternatives: Event-Driven Fund
FINANCIAL HIGHLIGHTS (continued)
Institutional Class
| | | | | | | | | | | | For the | |
| | | | | | | | | | | | Period from | |
| | | | | | | | | | | | January 2, | |
| | | Six Months | | | | | | | | | 2014^ | |
| | | Ended | | | Year Ended | | | through | |
| | | June 30, | | | December 31, | | | December 31, | |
| | | 2017 | | | 2016 | | | 2015 | | | 2014 | |
| | | (Unaudited) | | | | | | | | | | |
| Supplemental data and ratios: | | | | | | | | | | | | |
| Net assets, end of period (000’s) | | $ | 107,607 | | | $ | 112,947 | | | $ | 96,489 | | | $ | 12,085 | |
| Ratio of gross expenses | | | | | | | | | | | | | | | | |
| to average net assets: | | | | | | | | | | | | | | | | |
| Before expense recoupment/waiver | | | 2.16 | %(4) | | | 2.37 | % | | | 2.23 | % | | | 7.95 | %(4) |
| After expense recoupment/waiver | | | 2.22 | %(4) | | | 2.36 | % | | | 2.09 | % | | | 2.39 | %(4) |
| Ratio of dividends and interest on | | | | | | | | | | | | | | | | |
| short positions and borrowing | | | | | | | | | | | | | | | | |
| expense on securities sold short | | | | | | | | | | | | | | | | |
| to average net assets | | | 0.48 | %(4) | | | 0.62 | % | | | 0.35 | % | | | 0.65 | %(4) |
| Ratio of operating expense to average | | | | | | | | | | | | | | | | |
| net assets excluding dividends and | | | | | | | | | | | | | | | | |
| interest on short positions and | | | | | | | | | | | | | | | | |
| borrowing expense on securities sold | | | | | | | | | | | | | | | | |
| short (after expense recoupment) | | | 1.74 | %(4) | | | 1.74 | % | | | 1.74 | % | | | 1.74 | %(4) |
| Ratio of net investment income (loss) | | | | | | | | | | | | | | | | |
| to average net assets | | | (0.20 | )%(4) | | | (0.46 | )% | | | 0.05 | % | | | 0.52 | %(4) |
Portfolio turnover rate(5) | | | 158 | %(3) | | | 217 | % | | | 199 | % | | | 212 | %(3) |
| (1) | Net investment income before dividends and interest on short positions and borrowing expense on securities sold short for the six month ended June 30, 2017 and years ended December 31, 2016, 2015 and period ended December 31, 2014 were $0.01, $0.02, $0.04 and $0.12, respectively. |
| (2) | Net investment income (loss) per share has been calculated based on average shares outstanding during the period. |
| (3) | Not annualized. |
| (4) | Annualized. |
| (5) | The numerator for the portfolio turnover rate includes the lesser of purchases or sales (excluding short-term investments, short-term options, forward currency contracts, swap contracts and short positions). The denominator includes the average long positions throughout the period. |
| ^ | Commencement of operations. |
The accompanying notes are an integral part of these financial statements.
WCM Alternatives: Event-Driven Fund
FINANCIAL HIGHLIGHTS
Selected per share data is based on a share of beneficial interest outstanding throughout each period.
Investor Class
| | | For the Period from | |
| | | March 22, 2017^ | |
| | | through | |
| | | June 30, 2017 | |
| | | (Unaudited) | |
| Per Share Data: | | | |
| Net asset value, beginning of period | | $ | 9.89 | |
| Income from investment operations: | | | | |
Net investment loss(1)(2) | | | (0.01 | ) |
| Net realized and unrealized gain on investments | | | 0.33 | |
| Total from investment operations | | | 0.32 | |
| Less distributions: | | | | |
| From net investment income | | | — | |
| From net realized gains | | | — | |
| Total dividends and distributions | | | — | |
| Net Asset Value, end of period | | $ | 10.21 | |
| Total Return | | | 3.24 | %(3) |
| | | | | |
| Supplemental data and ratios: | | | | |
| Net assets, end of period (000’s) | | $ | 4,153 | |
| Ratio of gross expenses to average net assets: | | | | |
| Before expense recoupment | | | 2.44 | %(4) |
| After expense recoupment | | | 2.53 | %(4) |
| Ratio of dividends and interest on short positions and borrowing | | | | |
| expense on securities sold short to average net assets | | | 0.54 | %(4) |
| Ratio of operating expense to average net assets excluding | | | | |
| dividends and interest on short positions and borrowing | | | | |
| expense on securities sold short (after expense recoupment) | | | 1.99 | %(4) |
| Ratio of net investment loss to average net assets | | | (0.48 | )%(4) |
Portfolio turnover rate(5) | | | 158 | %(3) |
| (1) | Net investment income before dividends and interest on short positions and borrowing expense on securities sold short for the period ended June 30, 2017 was $0.00. |
| (2) | Net investment loss per share has been calculated based on average shares outstanding during the period. |
| (3) | Not annualized. |
| (4) | Annualized. |
| (5) | The numerator for the portfolio turnover rate includes the lesser of purchases or sales (excluding short-term investments, short-term options, forward currency contracts, swap contracts and short positions). The denominator includes the average long positions throughout the period. |
| ^ | Commencement of operations. |
The accompanying notes are an integral part of these financial statements.
The Merger Fund and WCM Alternatives: Event-Driven Fund
NOTES TO THE FINANCIAL STATEMENTS
June 30, 2017 (Unaudited)
Note 1 — ORGANIZATION
The Merger Fund (“TMF”) is a no-load, open-end, diversified investment company organized as a trust under the laws of the Commonwealth of Massachusetts on April 12, 1982, and registered under the Investment Company Act of 1940, as amended (the “1940 Act”). TMF was formerly known as the Risk Portfolio of The Ayco Fund. In January of 1989, TMF’s fundamental investment policies were amended to permit TMF to engage in merger arbitrage. At the same time, Westchester Capital Management, Inc. became TMF’s investment adviser, and TMF began to do business as The Merger Fund. In a transaction that closed on December 31, 2010, Westchester Capital Management, Inc. transferred substantially all of its business and assets to Westchester Capital Management, LLC (the “Adviser”), which became TMF’s investment adviser. Therefore, the performance information included herein for periods prior to 2011 reflects the performance of Westchester Capital Management, Inc. Roy Behren and Michael Shannon, TMF’s current portfolio managers, have served as co-portfolio managers of TMF since January 2007. The Investor Class inception date was January 31, 1989, and the Institutional Class inception date was August 1, 2013. The investment objective of TMF is to seek to achieve capital growth by engaging in merger arbitrage. Merger arbitrage is a highly specialized investment approach generally designed to profit from the successful completion of publicly announced mergers, takeovers, tender offers, leveraged buyouts, spin-offs, liquidations and other corporate reorganizations. At June 30, 2017, 82.5% of the shares outstanding of TMF’s Investor Class were owned by 6 omnibus accounts. At June 30, 2017, 82.9% of the shares outstanding of TMF’s Institutional Class were owned by 3 omnibus accounts.
Westchester Capital Funds (“WCF”) is an open-end series management investment company organized under the laws of the Commonwealth of Massachusetts on March 20, 2013, and registered under the 1940 Act. WCM Alternatives: Event-Driven Fund (“EDF”), a series of WCF, is a no-load, open-end, non-diversified investment company with two classes of shares, Investor Class shares and Institutional Class shares. The Institutional Class inception date was January 2, 2014. The Investor Class inception date was March 22, 2017. The investment objective of EDF is to seek to provide attractive risk-adjusted returns with low relative volatility in virtually all market environments. Risk-adjusted return is a concept that considers not only an investment’s return, but also the amount of potential risk involved in producing that return. At June 30, 2017, 99.5% of the shares outstanding of EDF’s Investor Class were owned by 2 omnibus accounts. At June 30, 2017, 98.8% of the shares outstanding of EDF’s Institutional Class were owned by 3 omnibus accounts.
The Merger Fund and WCM Alternatives: Event-Driven Fund
NOTES TO THE FINANCIAL STATEMENTS (continued)
June 30, 2017 (Unaudited)
Note 1 — ORGANIZATION (continued)
Each class of shares of TMF and EDF (each a “Fund” and together, the “Funds”) has different eligibility and minimum investment requirements. The underlying assets attributable to a class of a Fund are charged with the expenses attributable to that class of the Fund and with a share of the general expenses of the Fund. Any general expenses of a Fund that are not readily identifiable as belonging to a particular class of the Fund are allocated by or under the direction of the Boards of Trustees of the Funds (the “Board of Trustees” or “Trustees”) in such manner as the Trustees determine. Shares of classes may have different voting rights, such as (i) when required by the 1940 Act, or (ii) when the Trustees determine that such a matter affects only the interests of a particular class. Shares have no preemptive or subscription rights. The Institutional Class shares do not have a distribution fee. Income, expenses (other than expenses attributable to a specific class), and realized and unrealized gains or losses on investments of a Fund are allocated to each class of a Fund based on its relative net assets.
Note 2 — SIGNIFICANT ACCOUNTING POLICIES
The following is a summary of significant accounting policies followed by the Funds in the preparation of their financial statements. These policies are in conformity with U.S. generally accepted accounting principles (“GAAP”). The Funds are investment companies and, accordingly, follow the investment company accounting and reporting guidance of the Financial Accounting Standards Board Accounting Standards Codification Topic 946 – Investment Companies. The presentation of financial statements in conformity with GAAP requires management to make estimates and assumptions that affect the reported amount of assets and liabilities at the date of the financial statements and the reported amounts of revenues and expenses during the reporting period. Actual results could differ from those estimates and assumptions.
The following is a summary of the Funds’ pricing procedures. It is intended to be a general discussion and may not necessarily reflect all pricing procedures followed by the Funds.
Equity securities that trade on an exchange will typically be valued based on the last reported sale price. Securities listed on NASDAQ are typically valued using the NASDAQ Official Closing Price. The securities valued using quoted prices in active markets are classified as Level 1 investments. If, on a particular day, an exchange-listed security does not trade, then the mean between the closing bid and asked prices will typically be used to value the security. These securities are classified as Level 2
The Merger Fund and WCM Alternatives: Event-Driven Fund
NOTES TO THE FINANCIAL STATEMENTS (continued)
June 30, 2017 (Unaudited)
Note 2 — SIGNIFICANT ACCOUNTING POLICIES (continued)
investments. Fixed income securities having a maturity of greater than 60 days are typically valued based on evaluations provided by a pricing vendor approved by the Board. These are classified as Level 2 investments.
Exchange-traded options are typically valued at the higher of the intrinsic value of the option (i.e., what a Fund would pay or can receive upon the option being exercised) or the last reported composite sale price when such sale falls between the bid and asked prices. When the last sale of an exchange-traded option is outside the bid and asked prices, the Funds will typically value the option at the higher of the intrinsic value of the option or the mean between the highest end of day option bid price and the lowest end of day option ask price. Options for which there is an active market are classified as Level 1 investments, but options not listed on an exchange are classified as Level 2 investments. Investments in United States government securities (other than short-term securities) are valued at the mean between the 4:00 PM New York time bid and asked prices supplied by a third party vendor. Investments in registered open-end investment companies, including money market funds, are typically valued at their reported net asset value (“NAV”) per share. Short-term fixed-income securities having a maturity of less than 60 days are valued at market quotations or based on valuations supplied by a third party pricing service. If a reliable price from a third party pricing service is unavailable, amortized cost may be used if it is determined that the instrument’s amortized cost value represents approximately the fair value of the security. Forward currency contracts are valued daily at the prevailing forward exchange rate. These securities are generally classified as Level 2. Total return swap prices are determined using the same methods as would be used to price the underlying security. These securities are generally classified as Level 2.
The Funds typically fair value securities and assets for which (a) market quotations are not readily available or (b) market quotations are believed to be unrepresentative of market value. For example, a Fund may fair value a security that primarily trades on an exchange that closes before the New York Stock Exchange (“NYSE”) if a significant event occurs after the close of the exchange on which the security primarily trades but before the NYSE closes. Fair valuations are determined in good faith by the Valuation Group (the “Valuation Group”), a committee comprised of persons who are officers of the Fund or representatives of the Adviser, acting pursuant to procedures adopted by the Board. When fair-value pricing is employed, the prices of securities used by the Funds to calculate their NAV may differ from quoted or published prices for the same securities. In addition, due to the subjective nature of fair-value pricing, it is possible that the value determined for a particular asset may be materially different from the value
The Merger Fund and WCM Alternatives: Event-Driven Fund
NOTES TO THE FINANCIAL STATEMENTS (continued)
June 30, 2017 (Unaudited)
Note 2 — SIGNIFICANT ACCOUNTING POLICIES (continued)
realized upon such asset’s sale. These securities are generally classified as Level 2 or 3 depending on the inputs as described below.
The Funds have performed analyses of all existing investments to determine the significance and character of all inputs to their fair value determination. Various inputs are used in determining the value of the Funds’ investments. These inputs are summarized in the three broad levels listed below:
| | Level 1 — | Quoted prices in active markets for identical securities. |
| | Level 2 — | Other significant observable inputs (including quoted prices for similar securities, interest rates, prepayment speeds, credit risk, etc.). |
| | Level 3 — | Significant unobservable inputs are those inputs that reflect the applicable Fund’s own assumptions that market participants would use to price the asset or liability based on the best available information. |
The inputs or methodology used for valuing securities are not an indication of the risk associated with investing in those securities.
The following tables provide the fair value measurements of applicable Fund assets and liabilities by level within the fair value hierarchy for the Fund as of June 30, 2017. These assets and liabilities are measured on a recurring basis.
| The Merger Fund | |
| | | | | | | | | | | | | |
Investments at Fair Value | | Level 1 | | | Level 2 | | | Level 3 | | | Total | |
| Assets | | | | | | | | | | | | |
| Common Stocks* | | $ | 1,689,575,767 | | | $ | — | | | $ | 185,935,981 | | | $ | 1,875,511,748 | |
| Closed-End Funds | | | 230,069,530 | | | | — | | | | — | | | | 230,069,530 | |
| Contingent Value Rights | | | — | | | | — | | | | 2,661,333 | | | | 2,661,333 | |
| Bank Loans | | | — | | | | 15,683,018 | | | | — | | | | 15,683,018 | |
| Corporate Bonds | | | — | | | | 180,749,585 | | | | — | | | | 180,749,585 | |
| Purchased Option Contracts | | | 5,562,288 | | | | — | | | | — | | | | 5,562,288 | |
| Escrow Notes | | | — | | | | — | | | | 1,927,279 | | | | 1,927,279 | |
| Short-Term Investments | | | 517,506,146 | | | | 102,814,434 | | | | — | | | | 620,320,580 | |
| Swap Contracts** | | | — | | | | 18,675 | | | | — | | | | 18,675 | |
| Total | | $ | 2,442,713,731 | | | $ | 299,265,712 | | | $ | 190,524,593 | | | $ | 2,932,504,036 | |
| | | | | | | | | | | | | | | | | |
| Liabilities | | | | | | | | | | | | | | | | |
| Short Common Stock* | | $ | 387,955,855 | | | $ | 3,955,448 | | | $ | — | | | $ | 391,911,303 | |
| Written Option Contracts | | | 22,128,888 | | | | — | | | | — | | | | 22,128,888 | |
| Forward Currency | | | | | | | | | | | | | | | | |
| Exchange Contracts** | | | — | | | | 7,147,545 | | | | — | | | | 7,147,545 | |
| Swap Contracts** | | | — | | | | 1,100,172 | | | | — | | | | 1,100,172 | |
| Total | | $ | 410,084,743 | | | $ | 12,203,165 | | | $ | — | | | $ | 422,287,908 | |
The Merger Fund and WCM Alternatives: Event-Driven Fund
NOTES TO THE FINANCIAL STATEMENTS (continued)
June 30, 2017 (Unaudited)
Note 2 — SIGNIFICANT ACCOUNTING POLICIES (continued)
| WCM Alternatives: Event-Driven Fund | |
| | |
Investments at Fair Value | | Level 1 | | | Level 2 | | | Level 3 | | | Total | |
| Assets | | | | | | | | | | | | |
| Common Stocks* | | $ | 57,365,980 | | | $ | — | | | $ | 4,874,682 | | | $ | 62,240,662 | |
| Closed-End Funds | | | 9,516,499 | | | | — | | | | — | | | | 9,516,499 | |
| Preferred Stocks | | | 1,408,183 | | | | — | | | | — | | | | 1,408,183 | |
| Contingent Value Rights | | | — | | | | — | | | | 89,444 | | | | 89,444 | |
| Rights | | | — | | | | 20,873 | | | | — | | | | 20,873 | |
| Warrants | | | — | | | | 18,396 | | | | — | | | | 18,396 | |
| Bank Loans | | | — | | | | 1,212,825 | | | | — | | | | 1,212,825 | |
| Corporate Bonds | | | — | | | | 15,428,170 | | | | — | | | | 15,428,170 | |
| Purchased Option Contracts | | | 713,703 | | | | — | | | | — | | | | 713,703 | |
| Escrow Notes | | | — | | | | — | | | | 259,900 | | | | 259,900 | |
| Short-Term Investments | | | 6,831,998 | | | | 18,366,842 | | | | — | | | | 25,198,840 | |
| Swap Contracts** | | | — | | | | 83,585 | | | | — | | | | 83,585 | |
| Total | | $ | 75,836,363 | | | $ | 35,130,691 | | | $ | 5,224,026 | | | $ | 116,191,080 | |
| | | | | | | | | | | | | | | | | |
| Liabilities | | | | | | | | | | | | | | | | |
| Short Common Stock* | | $ | 12,844,403 | | | $ | 163,533 | | | $ | — | | | $ | 13,007,936 | |
| Written Option Contracts | | | 2,395,948 | | | | — | | | | — | | | | 2,395,948 | |
| Forward Currency | | | | | | | | | | | — | | | | | |
| Exchange Contracts** | | | — | | | | 345,487 | | | | | | | | 345,487 | |
| Swap Contracts** | | | — | | | | 2,078,346 | | | | — | | | | 2,078,346 | |
| Total | | $ | 15,240,351 | | | $ | 2,587,366 | | | $ | — | | | $ | 17,827,717 | |
| * | | Please refer to the Schedules of Investments to view long/short common stocks segregated by industry type. |
| ** | | Swap contracts and forward currency exchange contracts are valued at the net unrealized appreciation (depreciation) on the instrument by counterparty. |
The Level 2 securities are priced using inputs such as current yields, discount rates, credit quality, yields on comparable securities, trading volume, maturity date, market bid and ask prices, prices on comparable securities and other significant inputs. Level 3 securities are valued by brokers using broker quotes or such other pricing sources or data as are permitted by the Fund’s pricing procedures. At June 30, 2017, the value of these securities held by TMF and EDF were $190,524,593 and $5,224,026, respectively. The inputs for these securities are not readily available or cannot be reasonably estimated and are generally those inputs as described in Note 2 A. The appropriateness of fair values for these securities is monitored by the Valuation Group on an ongoing basis.
There were no transfers between levels during the six months ended June 30, 2017. Transfers are recorded at the end of the reporting period.
The Merger Fund and WCM Alternatives: Event-Driven Fund
NOTES TO THE FINANCIAL STATEMENTS (continued)
June 30, 2017 (Unaudited)
Note 2 — SIGNIFICANT ACCOUNTING POLICIES (continued)
Level 3 Reconciliation Disclosure
The following is a reconciliation of Level 3 assets for which significant unobservable inputs were used to determine fair value.
| The Merger Fund | |
| | | Common | | | Contingent | | | Escrow | | | Total | |
Description | | Stock | | | Value Rights | | | Notes | | | Investment | |
| Balance as of December 31, 2016 | | $ | 185,723,846 | | | $ | 930,150 | | | $ | 1,678,598 | | | $ | 188,332,594 | |
| Purchases on Investments | | | — | | | | 431,892 | | | | — | | | | 431,892 | |
| (Sales) of Investments | | | — | | | | — | | | | — | | | | — | |
| Realized (Gain) Loss | | | — | | | | (244,752 | ) | | | — | | | | (244,752 | ) |
| Transfers Into Level 3 | | | — | | | | — | | | | — | | | | — | |
| (Transfer Out) of Level 3 | | | — | | | | — | | | | — | | | | — | |
| Change in Unrealized Appreciation | | | 212,135 | | | | 1,544,043 | | | | 248,681 | | | | 2,004,859 | |
| Balance as of June 30, 2017 | | $ | 185,935,981 | | | $ | 2,661,333 | | | $ | 1,927,279 | | | $ | 190,524,593 | |
| | |
| WCM Alternatives: Event-Driven Fund | |
| | | Common | | | Contingent | | | Escrow | | | Total | |
Description | | Stock | | | Value Rights | | | Notes | | | Investment | |
| Balance as of December 31, 2016 | | $ | 4,868,519 | | | $ | 2,135 | | | $ | 257,440 | | | $ | 5,128,094 | |
| Purchases on Investments | | | — | | | | 20,805 | | | | — | | | | 20,805 | |
| (Sales) of Investments | | | — | | | | — | | | | — | | | | — | |
| Realized (Gain) Loss | | | — | | | | — | | | | — | | | | — | |
| Transfers Into Level 3 | | | — | | | | — | | | | — | | | | — | |
| (Transfer Out) of Level 3 | | | — | | | | — | | | | — | | | | — | |
| Change in Unrealized Appreciation | | | 6,163 | | | | 66,504 | | | | 2,460 | | | | 75,127 | |
| Balance as of June 30, 2017 | | $ | 4,874,682 | | | $ | 89,444 | | | $ | 259,900 | | | $ | 5,224,026 | |
The realized and unrealized gains and losses from Level 3 transactions are included with the net realized gain (loss) on investments and net change in unrealized appreciation (depreciation) on investments on the Statements of Operations. The net change in unrealized appreciation (depreciation) on investments related to Level 3 securities held by TMF and EDF at June 30, 2017 totals $2,004,859 and $75,127, respectively.
Significant unobservable valuation inputs monitored by the Valuation Group under the supervision of the Board of Trustees for restricted securities or material Level 3 investments as of June 30, 2017 for both TMF and EDF are as follows:
The Merger Fund and WCM Alternatives: Event-Driven Fund
NOTES TO THE FINANCIAL STATEMENTS (continued)
June 30, 2017 (Unaudited)
Note 2 — SIGNIFICANT ACCOUNTING POLICIES (continued)
| | Fair Value at | Valuation | Unobservable |
Description | June 30, 2017 | Technique | Input |
| Common Stock | $127,374,430 | Discounted Cash | Discount Rates |
| | | Flow Model | Terminal Value |
| | | | Cash Flow Projections |
| | | | |
| Common Stock | $ 58,561,551 | Discounted Cash | Discount Rates |
| | | Flow Model | Terminal Value |
| | | | Cash Flow Projections |
| WCM Alternatives: Event-Driven Fund |
| | Fair Value at | Valuation | Unobservable |
Description | June 30, 2017 | Technique | Input |
| Common Stock | $3,878,621 | Discounted Cash | Discount Rates |
| | | Flow Model | Terminal Value |
| | | | Cash Flow Projections |
| | | | |
| Common Stock | $ 996,061 | Discounted Cash | Discount Rates |
| | | Flow Model | Terminal Value |
| | | | Cash Flow Projections |
The tables above do not include certain Level 3 investments that are valued by brokers and pricing services. At June 30, 2017, the value of these securities for TMF and EDF were $4,588,612 and $349,344, respectively. The inputs for these investments are not readily available or cannot be reasonably estimated and are generally those inputs described in Note 2.
No provision for federal income taxes has been made since the Funds have complied to date with the provisions of Subchapter M of the Internal Revenue Code applicable to regulated investment companies and intends to continue to so comply in future years and to distribute investment company net taxable income and net capital gains to shareholders. Additionally, the Funds intend to make all required distributions to avoid federal excise tax.
The Funds have reviewed all open tax years in major jurisdictions and concluded that there is no impact on the Funds’ net assets and there is no tax liability resulting from unrecognized tax benefits relating to uncertain income tax positions taken or expected to be taken on a tax return. The Funds are also not aware of any tax positions for which it is reasonably possible that the total amounts of unrecognized tax benefits will significantly change in the next twelve months. As of June 30, 2017, TMF’s open Federal and New York tax years include the tax years ended December 31, 2013 through December 31, 2016, and EDF’s open Federal and New York tax years include the tax years ended December 31, 2014 through December 31, 2016. The Funds have no tax examination in progress.
The Merger Fund and WCM Alternatives: Event-Driven Fund
NOTES TO THE FINANCIAL STATEMENTS (continued)
June 30, 2017 (Unaudited)
Note 2 — SIGNIFICANT ACCOUNTING POLICIES (continued)
| C. | �� Transactions with Brokers |
The Funds’ receivables from brokers for proceeds on securities sold short and deposits at brokers for securities sold short are with two securities dealers. The Funds do not require the brokers to maintain collateral in support of the receivables from the brokers for proceeds on securities sold short. The Funds are required by the brokers to maintain collateral for securities sold short. The receivable from brokers on the Statements of Assets and Liabilities represents the proceeds from securities sold short that is maintained at the broker. The Funds may maintain cash deposits at brokers beyond the receivables for short sales. The Funds may be required by the brokers with which it executes short sales to maintain an additional amount of collateral in a special tri-party custody arrangement for the benefit of the broker.
The Funds’ equity swap contracts’ and forward currency exchange contracts’ cash deposits are monitored daily by the Adviser and counterparty. Cash deposits by the Funds are presented as deposits at brokers on the Statements of Assets and Liabilities. These transactions may involve market risk in excess of the amounts receivable or payable reflected on the Statements of Assets and Liabilities.
The Funds sell securities or currencies short for economic hedging purposes or any other investment purpose. For financial statement purposes, an amount equal to the settlement amount is initially included in the Statements of Assets and Liabilities as an asset and an equivalent liability. The amount of the liability is subsequently priced to reflect the current value of the short position. Subsequent fluctuations in the market prices of securities or currencies sold, but not yet purchased, may require purchasing the securities or currencies at prices which may differ from the market value reflected on the Statements of Assets and Liabilities. Short sale transactions result in off balance sheet risk because the ultimate obligation may exceed the related amounts shown in the Statements of Assets and Liabilities. The Funds will incur losses if the price of the security increases between the date of the short sale and the date on which the Funds purchase the securities to replace the borrowed securities. The Funds’ losses on short sales are potentially unlimited because there is no upward limit on the price a borrowed security could attain.
The Merger Fund and WCM Alternatives: Event-Driven Fund
NOTES TO THE FINANCIAL STATEMENTS (continued)
June 30, 2017 (Unaudited)
Note 2 — SIGNIFICANT ACCOUNTING POLICIES (continued)
The Funds are liable for any dividends payable on securities while those securities are sold short. Until the security is replaced, the Funds are required to pay to the lender any income earned, which is recorded as an expense by the Funds. The Funds segregate liquid assets in an amount equal to the market value of securities sold short, which is reflected in the Schedules of Investments. These assets are required to be adjusted daily to reflect changes in the value of the securities or currencies sold short.
| E. | Written Option Contracts |
The Funds are subject to equity price risk in the normal course of pursuing their investment objectives. The Funds write (sell) put or call options for hedging purposes, volatility management purposes, or otherwise to gain, or reduce, long or short exposure to one or more asset classes or issuers. When a Fund writes (sells) an option, an amount equal to the premium received by the Fund is included in the Statement of Assets and Liabilities as an asset and an equivalent liability. The amount of the liability is subsequently priced daily to reflect the current value of the option written. Refer to Note 2 A. for a pricing description. By writing an option, a Fund may become obligated during the term of the option to deliver or purchase the securities underlying the option at the exercise price if the option is exercised. These contracts may involve market risk in excess of the amounts receivable or payable reflected on the Statements of Assets and Liabilities. Refer to Note 2 Q. for further derivative disclosures, and Note 2 O. for further counterparty risk disclosure.
When an option expires on its stipulated expiration date or the Funds enter into a closing purchase transaction, the Funds realize gains or losses if the cost of the closing purchase transaction differs from the premium received when the option was sold without regard to any unrealized appreciation or depreciation on the underlying security, and the liability related to such option is eliminated. When a written call option is exercised, the premium originally received decreases the cost basis of the security and the Funds realize gains or losses from the sale of the underlying security. When a written put option is exercised, the cost of the security acquired is decreased by the premium received for the put.
| F. | Purchased Option Contracts |
The Funds are subject to equity price risk in the normal course of pursuing their investment objectives. The Funds purchase put or call options for hedging purposes, volatility management purposes, or
The Merger Fund and WCM Alternatives: Event-Driven Fund
NOTES TO THE FINANCIAL STATEMENTS (continued)
June 30, 2017 (Unaudited)
Note 2 — SIGNIFICANT ACCOUNTING POLICIES (continued)
otherwise to gain, or reduce, long or short exposure to one or more asset classes or issuers. When the Funds purchase an option contract, an amount equal to the premiums paid is included in the Statements of Assets and Liabilities as an investment, and is subsequently priced daily to reflect the value of the purchased option. Refer to Note 2 A. for a pricing description. Refer to Note 2 Q. for further derivative disclosures, and Note 2 O. for further counterparty risk disclosure.
When option contracts expire or are closed, realized gains or losses are recognized without regard to any unrealized appreciation or depreciation on the underlying securities that may be held by the Funds. If the Fund exercises a call option, the cost of the security acquired is increased by the premium paid for the call. If the Fund exercises a put option, the premium paid for the put option increases the cost of the underlying security and a gain or loss is realized from the sale of the underlying security.
| G. | Forward Currency Exchange Contracts |
The Funds are subject to foreign currency exchange rate risk in the normal course of pursuing their investment objectives. During the six months ended June 30, 2017, the Funds used forward currency exchange contracts to hedge against changes in the value of foreign currencies. The Funds may enter into forward currency exchange contracts obligating the Funds to deliver and receive a currency at a specified future date. Forward contracts are valued daily, and unrealized appreciation or depreciation is recorded daily as the difference between the contract exchange rate and the closing forward rate applied to the face amount of the contract. Refer to Note 2 A. for a pricing description. A realized gain or loss is recorded at the time the forward contract expires. Credit risk may arise as a result of the failure of the counterparty to comply with the terms of the contract. Refer to Note 2 O. for further counterparty risk disclosure.
The use of forward currency exchange contracts does not eliminate fluctuations in the underlying prices of the Funds’ investment securities. The use of forward currency exchange contracts involves the risk that anticipated currency movements will not be accurately predicted. A forward currency exchange contract would limit the risk of loss due to a decline in the value of a particular currency; however, it would also limit any potential gain that might result should the value of the currency increase instead of decrease. These contracts may involve market risk in excess of the amounts receivable or payable reflected on the Statements of Assets and Liabilities. Refer to Note 2 Q. for further derivative disclosures.
The Merger Fund and WCM Alternatives: Event-Driven Fund
NOTES TO THE FINANCIAL STATEMENTS (continued)
June 30, 2017 (Unaudited)
Note 2 — SIGNIFICANT ACCOUNTING POLICIES (continued)
The Funds are subject to equity price risk and interest rate risk in the normal course of pursuing their investment objectives. During the six months ended June 30, 2017, the Funds entered into both long and short equity swap contracts with multiple broker-dealers. A long equity swap contract entitles the Funds to receive from the counterparty any appreciation and dividends paid on an individual security, while obligating the Funds to pay the counterparty any depreciation on the security as well as interest on the notional amount of the contract at a rate equal to LIBOR plus an agreed upon spread (generally between 25 to 100 basis points). A short equity swap contract obligates the Funds to pay the counterparty any appreciation and dividends paid on an individual security, while entitling the Funds to receive from the counterparty any depreciation on the security, and to pay to or receive from the counterparty interest on the notional value of the contract at a rate equal to LIBOR less an agreed upon spread (generally between 25 to 100 basis points). Refer to Note 2 A. for a pricing description.
The Funds may also enter into equity swap contracts whose value may be determined by the spread between a long equity position and a short equity position. This type of swap contract obligates the Funds to pay the counterparty an amount tied to any increase in the spread between the two securities over the term of the contract. The Funds are also obligated to pay the counterparty any dividends paid on the short equity holding as well as any net financing costs. This type of swap contract entitles the Funds to receive from the counterparty any gains based on a decrease in the spread as well as any dividends paid on the long equity holding and any net interest income.
Fluctuations in the value of an open contract are recorded daily as net unrealized appreciation or depreciation. The Funds will realize gains or losses upon termination or reset of the contract. Either party, under certain conditions, may terminate the contract prior to the contract’s expiration date. Equity swap contracts are typically valued based on market quotations or pricing service evaluations for the underlying reference asset. The Valuation Group monitors the credit quality of the Funds’ counterparties and may adjust the valuation of a swap in the Valuation Group’s discretion due to, among other things, changes in a counterparty’s credit quality.
Credit risk may arise as a result of the failure of the counterparty to comply with the terms of the contract. Refer to Note 2 O. for further counterparty risk disclosure. Additionally, risk may arise from unanticipated movements in interest rates or in the value of the underlying securities. These contracts may involve market risk in excess of
The Merger Fund and WCM Alternatives: Event-Driven Fund
NOTES TO THE FINANCIAL STATEMENTS (continued)
June 30, 2017 (Unaudited)
Note 2 — SIGNIFICANT ACCOUNTING POLICIES (continued)
the amounts receivable or payable reflected on the Statements of Assets and Liabilities. Refer to Note 2 Q. for further derivative disclosures.
| I. | Distributions to Shareholders |
Dividends from net investment income and net realized capital gains, if any, are declared and paid at least annually. Income and capital gain distributions are determined in accordance with income tax regulations which may differ from GAAP. These differences are due primarily to wash sale-loss deferrals, constructive sales, straddle-loss deferrals, adjustments on swap contracts, and unrealized gains or losses on Section 1256 contracts, which were realized, for tax purposes, at the end of each Fund’s fiscal year.
Investing in securities of foreign companies and foreign governments involves special risks and considerations not typically associated with investing in U.S. companies and the U.S. government. These risks include fluctuations in currency exchange rates and adverse political, cultural, regulatory, legal, tax, and economic developments as well as different custody and/or settlement practices or delayed settlements in some foreign markets. Moreover, securities of many foreign companies and their markets may be less liquid and their prices more volatile than those of securities of comparable U.S. companies and the U.S. government.
| K. | Foreign Currency Translations |
The books and records of the Funds are maintained in U.S. dollars. Foreign currency transactions are translated into U.S. dollars on the following basis: (i) market value of investment securities, assets and liabilities at the daily rates of exchange, and (ii) purchases and sales of investment securities, dividend and interest income and certain expenses at the rates of exchange prevailing on the respective dates of such transactions. For financial reporting purposes, the Funds do not isolate changes in the exchange rate of investment securities from the fluctuations arising from changes in the market prices of securities. However, for federal income tax purposes, the Funds do isolate and treat as ordinary income the effect of changes in foreign exchange rates on realized gain or loss from the sale of investment securities and payables and receivables arising from trade-date and settlement-date differences. Foreign currency held as cash by the Funds’ custodian is reported separately on the Statements of Assets and Liabilities and on the Statements of Operations.
| L. | Cash and Cash Equivalents |
The Funds consider highly liquid short-term fixed income investments purchased with an original maturity of less than three months to be cash
The Merger Fund and WCM Alternatives: Event-Driven Fund
NOTES TO THE FINANCIAL STATEMENTS (continued)
June 30, 2017 (Unaudited)
Note 2 — SIGNIFICANT ACCOUNTING POLICIES (continued)
equivalents. Cash equivalents are included in short-term investments on the Schedule of Investments as well as in investments on the Statements of Assets and Liabilities. Temporary cash overdrafts are reported as payable to custodian.
| M. | Guarantees and Indemnifications |
In the normal course of business, the Funds enter into contracts with service providers that contain general indemnification clauses. The Funds’ maximum exposure under these arrangements is unknown, as this would involve future claims that may be made against the Funds that have not yet occurred. The Funds have not historically incurred material expenses in respect of those provisions.
| N. | Security Transactions, Investment Income and Expenses |
Transactions are recorded for financial statement purposes on the trade date. Realized gains and losses from security transactions are recorded on the identified cost basis. Distributions to shareholders are recorded on the ex-dividend date. Dividend income is recorded on the ex-dividend date, except for certain dividends on foreign securities, which are recorded as soon as the Fund is informed after the ex-dividend date. Interest is accounted for on the accrual basis and includes amortization of premiums and discounts on the effective interest method. At June 30, 2017, expenses include $963,904 and $75,632 of borrowing expenses on securities sold short for TMF and EDF, respectively.
The Funds help manage counterparty credit risk by entering into agreements only with counterparties the Adviser believes have the financial resources to honor their obligations. The Adviser considers the creditworthiness of each counterparty to a contract in evaluating potential credit risk. The counterparty risk for forward currency exchange contracts to the Funds includes the amount of any net unrealized appreciation on the contract. The counterparty risk for equity swaps contracts to the Funds includes the risk of loss of the full amount of any net unrealized appreciation on the contract, along with dividends receivable on long equity contracts and interest receivable on short equity contracts. Written and purchased options sold on an exchange expose the Funds to counterparty risk; however, exchange’s clearinghouse guarantees the options against default. Over-the-counter options counterparty risk includes the risk of loss of the full amount of any net unrealized appreciation.
The Merger Fund and WCM Alternatives: Event-Driven Fund
NOTES TO THE FINANCIAL STATEMENTS (continued)
June 30, 2017 (Unaudited)
Note 2 — SIGNIFICANT ACCOUNTING POLICIES (continued)
Financial assets and liabilities, as well as cash collateral received by the Funds’ counterparties and posted are offset by the respective counterparty, and the net amount is reported in the Statements of Assets and Liabilities when the Funds believe there exists a legally enforceable right to offset the recognized amounts.
The Funds may utilize derivative instruments such as options, swaps, futures, forward contracts and other instruments with similar characteristics to the extent that they are consistent with the Funds’ respective investment objectives and limitations. The use of these instruments may involve additional investment risks, including the possibility of illiquid markets or imperfect correlation between the value of the instruments and the underlying securities. Derivatives also may create leverage which will amplify the effect of their performance on the Funds and may produce significant losses.
The Funds have adopted authoritative standards regarding disclosure about derivatives and hedging activities and how they affect the Funds’ Statements of Assets and Liabilities and Statements of Operations. For the six months ended June 30, 2017, each Fund’s monthly average quantity and notional value are described below:
| The Merger Fund | |
| | | | | | Monthly Average | |
| | | Monthly Average | | | Premium/ | |
| | | Quantity | | | Notional Value* | |
| Purchased Option Contracts | | | 106,763 | | | $ | 8,418,548 | |
| Written Option Contracts | | | 126,231 | | | $ | 27,909,119 | |
| Forward Currency Exchange Contracts | | | 3 | | | $ | 141,880,428 | |
| Long Total Return Swap Contracts | | | 12,401,680 | | | $ | 267,664,392 | |
| Short Total Return Swap Contracts | | | 2,696,600 | | | $ | 103,990,779 | |
| | |
| WCM Alternatives: Event-Driven Fund | |
| | | | | | | Monthly Average | |
| | | Monthly Average | | | Premium/ | |
| | | Quantity | | | Notional Value* | |
| Purchased Option Contracts | | | 15,431 | | | $ | 908,025 | |
| Written Option Contracts | | | 16,806 | | | $ | 3,506,184 | |
| Forward Currency Exchange Contracts | | | 4 | | | $ | 7,067,022 | |
| Long Total Return Swap Contracts | | | 1,845,148 | | | $ | 68,190,674 | |
| Short Total Return Swap Contracts | | | 194,890 | | | $ | 9,823,755 | |
| * | Purchased and written options present monthly average premiums and forward currency exchange contracts and total return swaps present monthly average notional value. |
The Merger Fund and WCM Alternatives: Event-Driven Fund
NOTES TO THE FINANCIAL STATEMENTS (continued)
June 30, 2017 (Unaudited)
Note 2 — SIGNIFICANT ACCOUNTING POLICIES (continued)
Statements of Assets and Liabilities
Fair values of derivative instruments as of June 30, 2017:
| | Asset Derivatives | |
| | Statements of Assets | | | |
Derivatives | and Liabilities Location | | Fair Value | |
| The Merger Fund | | | | |
| Equity Contracts: | | | | |
| Purchased Option Contracts | Investments | | $ | 5,562,288 | |
| Swap Contracts | Receivables | | | 18,675 | |
| Total | | | $ | 5,580,963 | |
| | | | | | |
| WCM Alternatives: Event-Driven Fund | | | | | |
| Equity Contracts: | | | | | |
| Purchased Option Contracts | Investments | | $ | 713,703 | |
| Swap Contracts | Receivables | | | 83,585 | |
| Total | | | $ | 797,288 | |
| | | |
| | Liability Derivatives | |
| | Statements of Assets | | | | |
Derivatives | and Liabilities Location | | Fair Value | |
| The Merger Fund | | | | | |
| Equity Contracts: | | | | | |
| Written Option Contracts | Written Option Contracts | | $ | 22,128,888 | |
| Swap Contracts | Payables | | | 1,100,172 | |
| Foreign Exchange Contracts: | | | | | |
| Forward Currency Exchange Contracts | Payables | | | 7,147,545 | |
| Total | | | $ | 30,376,605 | |
| | | | | | |
| WCM Alternatives: Event-Driven Fund | | | | | |
| Equity Contracts: | | | | | |
| Written Option Contracts | Written Option Contracts | | $ | 2,395,948 | |
| Swap Contracts | Payables | | | 2,078,346 | |
| Foreign Exchange Contracts: | | | | | |
| Forward Currency Exchange Contracts | Payables | | | 345,487 | |
| Total | | | $ | 4,819,781 | |
The Merger Fund and WCM Alternatives: Event-Driven Fund
NOTES TO THE FINANCIAL STATEMENTS (continued)
June 30, 2017 (Unaudited)
Note 2 — SIGNIFICANT ACCOUNTING POLICIES (continued)
Statements of Operations
The effect of derivative instruments on the Statements of Operations for the six months ended June 30, 2017:
| Amount of Realized Gain (Loss) on Derivatives | |
| | |
| | | | | | | | | Forward | | | | | | | |
| | | Purchased | | | Written | | | Currency | | | | | | | |
| | | Option | | | Option | | | Exchange | | | Swap | | | | |
Derivatives | | Contracts* | | | Contracts | | | Contracts | | | Contracts | | | Total | |
| The Merger Fund | | | | | | | | | | | | | | | |
| Equity Contracts | | $ | (17,184,599 | ) | | $ | 14,508,728 | | | $ | — | | | $ | (2,940,129 | ) | | $ | (5,616,000 | ) |
| Foreign Exchange | | | | | | | | | | | | | | | | | | | | |
| Contracts | | | — | | | | — | | | | 131,357 | | | | — | | | | 131,357 | |
| Total | | $ | (17,184,599 | ) | | $ | 14,508,728 | | | $ | 131,357 | | | $ | (2,940,129 | ) | | $ | (5,484,643 | ) |
| | | | | | | | | | | | | | | | | | | | | |
| WCM Alternatives: | | | | | | | | | | | | | | | | | | | | |
| Event-Driven Fund | | | | | | | | | | | | | | | | | | | | |
| Equity Contracts | | $ | (1,786,655 | ) | | $ | (27,696 | ) | | $ | — | | | $ | 2,868,122 | | | $ | 1,053,771 | |
| Foreign Exchange | | | | | | | | | | | | | | | | | | | | |
| Contracts | | | — | | | | — | | | | 3,849 | | | | — | | | | 3,849 | |
| Total | | $ | (1,786,655 | ) | | $ | (27,696 | ) | | $ | 3,849 | | | $ | 2,868,122 | | | $ | 1,057,620 | |
| * | The amounts disclosed are included in the realized gain (loss) on investments. |
| Change in Unrealized Appreciation (Depreciation) on Derivatives | |
| | | | | | | | | | | | | | | | |
| | | | | | | | | Forward | | | | | | | |
| | | Purchased | | | Written | | | Currency | | | | | | | |
| | | Option | | | Option | | | Exchange | | | Swap | | | | |
Derivatives | | Contracts* | | | Contracts | | | Contracts | | | Contracts | | | Total | |
| The Merger Fund | | | | | | | | | | | | | | | |
| Equity Contracts | | $ | (970,743 | ) | | $ | 9,692,180 | | | $ | — | | | $ | 8,451,647 | | | $ | 17,173,084 | |
| Foreign Exchange | | | | | | | | | | | | | | | | | | | | |
| Contracts | | | — | | | | — | | | | (7,941,319 | ) | | | — | | | | (7,941,319 | ) |
| Total | | $ | (970,743 | ) | | $ | 9,692,180 | | | $ | (7,941,319 | ) | | $ | 8,451,647 | | | $ | 9,231,765 | |
| | | | | | | | | | | | | | | | | | | | | |
| WCM Alternatives: | | | | | | | | | | | | | | | | | | | | |
| Event-Driven Fund | | | | | | | | | | | | | | | | | | | | |
| Equity Contracts | | $ | (62,246 | ) | | $ | 1,165,051 | | | $ | — | | | $ | (1,027,896 | ) | | $ | 74,909 | |
| Foreign Exchange | | | | | | | | | | | | | | | | | | | | |
| Contracts | | | — | | | | — | | | | (403,931 | ) | | | — | | | | (403,931 | ) |
| Total | | $ | (62,246 | ) | | $ | 1,165,051 | | | $ | (403,931 | ) | | $ | (1,027,896 | ) | | $ | (329,022 | ) |
| * | The amounts disclosed are included in the change in unrealized appreciation (depreciation) on investments. |
Note 3 — AGREEMENTS
The Funds’ investment adviser is Westchester Capital Management, LLC pursuant to an investment advisory agreement between TMF and the Adviser dated as of January 1, 2011 (the “TMF Advisory Agreement”) and
The Merger Fund and WCM Alternatives: Event-Driven Fund
NOTES TO THE FINANCIAL STATEMENTS (continued)
June 30, 2017 (Unaudited)
Note 3 — AGREEMENTS (continued)
pursuant to an investment advisory agreement between WCF, with respect to EDF, and the Adviser dated as of July 30, 2013 (the “EDF Advisory Agreement” and together with the TMF Advisory Agreement, the “Advisory Agreements”).
Under the terms of the TMF Advisory Agreement, the Adviser is entitled to receive a fee, calculated daily and payable monthly, at the annual rate of 1.00% of TMF’s average daily net assets. The Adviser has agreed until April 30, 2018 to reduce its advisory fee so that the advisory fee will be: (i) 1.0% on an annualized basis of the average daily net assets of TMF on net assets below $1.5 billion; (ii) 0.9% on an annualized basis of the average daily net assets of TMF on net assets between $1.5 billion and $2.0 billion; (iii) 0.8% on an annualized basis of the average daily net assets of TMF on net assets between $2.0 billion and $5.0 billion and (iv) 0.75% on an annualized basis of the average daily net assets of TMF on net assets over $5.0 billion (the “TMF Fee Waiver Agreement”). Investment advisory fees waived by the Adviser on behalf of TMF for the six months ended June 30, 2017 were $1,101,958.
Under the terms of the EDF Advisory Agreement, the Adviser is entitled to receive a fee, calculated daily and payable monthly, at the annual rate of 1.25% of EDF’s average daily net assets. The Adviser has contractually agreed until April 30, 2018 to waive its investment advisory fee and to reimburse EDF for other ordinary operating expenses to the extent necessary to limit ordinary operating expenses to an amount not to exceed 1.74% for Institutional Class shares and 1.99% for Investor Class shares (the “EDF Expense Limitation Agreement”). Ordinary operating expenses exclude taxes, commissions, mark-ups, litigation expenses, indemnification expenses, interest expenses, borrowing expenses, including on securities sold short, dividend expenses on securities sold short, trading or investment expenses, acquired fund fees and expenses, and any extraordinary expenses. To the extent that the Adviser waives its investment advisory fee for EDF and/or reimburses EDF for other ordinary operating expenses, it may seek reimbursement of a portion or all of such amounts at any time within three fiscal years after the fiscal year in which such amounts were waived or reimbursed, subject to the expense limitation in place at the time such amounts were waived or reimbursed. For the six months ended June 30, 2017, the Adviser recouped $35,380 of advisory fees to EDF.
Investment advisory fees waived and expenses reimbursed on behalf of EDF that are subject to potential recovery by the Adviser are shown in the following table by year of expiration.
The Merger Fund and WCM Alternatives: Event-Driven Fund
NOTES TO THE FINANCIAL STATEMENTS (continued)
June 30, 2017 (Unaudited)
Note 3 — AGREEMENTS (continued)
| | Year of Expiration | Potential Recovery | |
| | 12/31/2017 | $416,469 | |
| | 12/31/2018 | $ 89,167 | |
| | 12/31/2019 | $ 5,319 | |
Each of the TMF Fee Waiver Agreement and the EDF Expense Limitation Agreement may be terminated at any time by such Fund’s Board of Trustees. Certain officers of the Funds are also officers of the Adviser. Each Advisory Agreement was approved for an initial term of two years and thereafter will remain in effect from year to year provided that such continuance is specifically approved at least annually by the vote of a majority of the relevant Fund’s Trustees who are not interested persons of the Adviser or such Fund or by a vote of a majority of the outstanding voting securities of such Fund.
U.S. Bancorp Fund Services, LLC, a subsidiary of U.S. Bancorp, a publicly held bank holding company, serves as transfer agent, administrator, accountant, dividend paying agent and shareholder servicing agent for the Funds. U.S. Bank, N.A. serves as custodian for the Funds.
Distribution services are performed pursuant to distribution contracts with broker-dealers and other qualified institutions.
Note 4 — SHARES OF BENEFICIAL INTEREST
The Board of Trustees of each Fund has the authority to issue an unlimited amount of shares of beneficial interest without par value.
Changes in shares of beneficial interest were as follows:
| | | Six Months Ended | | | Year Ended | |
| The Merger Fund | | June 30, 2017 | | | December 31, 2016 | |
| Investor Class | | Shares | | | Amount | | | Shares | | | Amount | |
| Issued | | | 8,249,349 | | | $ | 130,271,514 | | | | 37,333,469 | | | $ | 573,783,416 | |
| Issued as reinvestment | | | | | | | | | | | | | | | | |
| of dividends | | | — | | | | — | | | | 271,281 | | | | 4,253,698 | |
| Redeemed | | | (18,903,221 | ) | | | (298,652,180 | ) | | | (168,451,278 | ) | | | (2,598,144,269 | ) |
| Net Decrease | | | (10,653,872 | ) | | $ | (168,380,666 | ) | | | (130,846,528 | ) | | $ | (2,020,107,155 | ) |
| | | | | | | | | | | | | | | | | |
| | | Six Months Ended | | | Year Ended | |
| | | June 30, 2017 | | | December 31, 2016 | |
| Institutional Class | | Shares | | | Amount | | | Shares | | | Amount | |
| Issued | | | 14,916,184 | | | $ | 234,825,103 | | | | 37,830,299 | | | $ | 582,506,131 | |
| Issued as reinvestment | | | | | | | | | | | | | | | | |
| of dividends | | | — | | | | — | | | | 366,625 | | | | 5,712,011 | |
| Redeemed | | | (13,463,498 | ) | | | (211,716,062 | ) | | | (31,496,025 | ) | | | (485,307,929 | ) |
| Net Increase | | | 1,452,686 | | | $ | 23,109,041 | | | | 6,700,899 | | | $ | 102,910,213 | |
The Merger Fund and WCM Alternatives: Event-Driven Fund
NOTES TO THE FINANCIAL STATEMENTS (continued)
June 30, 2017 (Unaudited)
Note 4 — SHARES OF BENEFICIAL INTEREST (continued)
| | | For the Period from | | | | | | | |
| | | March 22, 2017^ | | | | | | | |
| | | through | | | Year Ended | |
| WCM Alternatives: | | June 30, 2017 | | | December 31, 2016 | |
| Event-Driven Fund | | Shares | | | Amount | | | Shares | | | Amount | |
| Investor Class | | | | | | | | | | | | |
| Issued | | | 410,357 | | | $ | 4,096,100 | | | | — | | | $ | — | |
| Issued as reinvestment | | | | | | | | | | | | | | | | |
| of dividends | | | — | | | | — | | | | — | | | | — | |
| Redeemed | | | (3,771 | ) | | | (38,155 | ) | | | — | | | | — | |
| Net Increase | | | 406,586 | | | $ | 4,057,945 | | | | — | | | $ | — | |
| | | | | | | | | | | | | | | | | |
| | | Six Months Ended | | | Year Ended | |
| | | June 30, 2017 | | | December 31, 2016 | |
| Institutional Class | | Shares | | | Amount | | | Shares | | | Amount | |
| Issued | | | 1,686,807 | | | $ | 16,839,668 | | | | 3,982,395 | | | $ | 38,316,375 | |
| Issued as reinvestment | | | | | | | | | | | | | | | | |
| of dividends | | | — | | | | — | | | | 98,571 | | | | 968,948 | |
| Redeemed | | | (2,665,198 | ) | | | (26,676,110 | ) | | | (2,601,444 | ) | | | (25,299,646 | ) |
| Net Increase (Decrease) | | | (978,391 | ) | | $ | (9,836,442 | ) | | | 1,479,522 | | | $ | 13,985,677 | |
| ^ | Commencement of operations. |
Note 5 — INVESTMENT TRANSACTIONS AND INCOME TAX INFORMATION
TMF’s purchases and sales of securities for the six months ended June 30, 2017 (excluding short-term investments, short-term options, forward currency contracts, swap contracts and short positions) in the aggregate were $2,183,057,429 and $2,346,505,321, respectively. EDF’s purchases and sales of securities for the six months ended June 30, 2017 (excluding short-term investments, short-term options, forward currency contracts, swap contracts and short positions) in the aggregate were $142,763,316 and $158,454,609, respectively. There were no purchases or sales of long-term U.S. Government securities for the Funds.
The Merger Fund and WCM Alternatives: Event-Driven Fund
NOTES TO THE FINANCIAL STATEMENTS (continued)
June 30, 2017 (Unaudited)
Note 5 — INVESTMENT TRANSACTIONS AND INCOME TAX INFORMATION (continued)
At December 31, 2016, the components of accumulated earnings (losses) on a tax basis were as follows:
| | | | | | WCM Alternatives: | |
| | | The Merger Fund | | | Event-Driven Fund | |
| Cost of investments* | | $ | 3,188,975,665 | | | $ | 103,790,801 | |
| Gross unrealized appreciation | | | 171,732,645 | | | | 6,884,384 | |
| Gross unrealized depreciation | | | (104,864,219 | ) | | | (2,381,996 | ) |
| Net unrealized appreciation | | $ | 66,868,426 | | | $ | 4,502,388 | |
| Undistributed ordinary income | | | — | | | | — | |
| Undistributed long-term capital gain | | | — | | | | — | |
| Total distributable earnings | | $ | — | | | $ | — | |
| Other accumulated losses | | | (203,488,360 | ) | | | (7,629,213 | ) |
| Total accumulated losses | | $ | (136,619,934 | ) | | $ | (3,126,825 | ) |
| * | Represents cost for federal income tax purposes and differs from the cost for financial reporting purposes due to wash sales and constructive sales. |
GAAP requires that certain components of net assets relating to permanent differences be reclassified between financial and tax reporting. Permanent differences are primarily related to foreign currency transactions and swap treatment. These reclassifications have no effect on net assets or net asset value per share. For the year ended December 31, 2016, the following table shows the reclassifications made:
| | | Accumulated Net | |
| | | Realized Loss on | |
| | | Investment, Securities | |
| | | Sold Short, Written Option | |
| | | Contracts Expired or | |
| | Accumulated | Closed, Forward Currency | |
| | Undistributed | Exchange Contracts, | |
| | Net Investment | Swap Contracts and | |
| | Income | Foreign Currency Translation | Paid-in Capital |
| The Merger Fund | $45,222,066 | $(41,642,025) | $(3,580,041) |
| WCM Alternatives: | | | |
| Event Driven Fund | $ 2,453,566 | $ (1,827,084) | $ (626,482) |
The Merger Fund and WCM Alternatives: Event-Driven Fund
NOTES TO THE FINANCIAL STATEMENTS (continued)
June 30, 2017 (Unaudited)
Note 5 — INVESTMENT TRANSACTIONS AND INCOME TAX INFORMATION (continued)
The tax components of dividends paid during the six months ended June 30, 2017 and the year ended December 31, 2016 were as follows:
| | | | | | | | | WCM Alternatives: | |
| | | The Merger Fund | | | Event-Driven Fund | |
| | | 2017 | | | 2016 | | | 2017 | | | 2016 | |
| Investor Class | | | | | | | | | | | | |
| Ordinary Income | | $ | — | | | $ | 4,911,192 | | | $ | — | | | | N/A | |
| Long-Term Capital Gains | | | — | | | | — | | | | — | | | | N/A | |
| Total Distributions Paid | | $ | — | | | $ | 4,911,192 | | | $ | — | | | | N/A | |
| | | | | | | | | | | | | | | | | |
| | | | 2017 | | | | 2016 | | | | 2017 | | | | 2016 | |
| Institutional Class | | | | | | | | | | | | | | | | |
| Ordinary Income | | $ | — | | | $ | 12,300,844 | | | $ | — | | | $ | 968,948 | |
| Long-Term Capital Gains | | | — | | | | — | | | | — | | | | — | |
| Total Distributions Paid | | $ | — | | | $ | 12,300,844 | | | $ | — | | | $ | 968,948 | |
TMF designated as long-term capital gain dividend, pursuant to Internal Revenue Case Section 852(b)(3), the amount necessary to reduce the earnings and profits of the Fund related to net capital gain to zero for the tax year ended December 31, 2016.
As of December 31, 2016, TMF and EDF did not have any post-October ordinary losses deferred, on a tax basis. As of December 31, 2016, TMF and EDF had post-October ordinary losses of $3,777,502 and $746,672, respectively. As of December 31, 2016, TMF had no short term and $148,357,995 of long term capital loss carryover. As of December 31, 2016, EDF had $1,425,366 of short term and $1,830,739 of long term capital loss carryover.
Note 6 — WRITTEN OPTION CONTRACTS
The premium amount and the number of written option contracts during the six months ended June 30, 2017 were as follows:
| | | | | | | | | WCM Alternatives: | |
| | | The Merger Fund | | | Event-Driven Fund | |
| | | Number of | | | Premium | | | Number of | | | Premium | |
| | | Contracts | | | Amount | | | Contracts | | | Amount | |
| Options outstanding at December 31, 2016 | | | 149,863 | | | $ | 38,764,439 | | | | 8,306 | | | $ | 2,044,405 | |
| Options written | | | 331,995 | | | | 87,754,471 | | | | 59,052 | | | | 13,682,591 | |
| Options closed | | | (232,903 | ) | | | (74,866,773 | ) | | | (37,822 | ) | | | (10,479,626 | ) |
| Options exercised | | | (77,090 | ) | | | (17,270,308 | ) | | | (4,977 | ) | | | (1,297,589 | ) |
| Options expired | | | (17,094 | ) | | | (4,218,847 | ) | | | (2,852 | ) | | | (566,659 | ) |
| Options outstanding at June 30, 2017 | | | 154,771 | | | $ | 30,162,982 | | | | 21,707 | | | $ | 3,383,122 | |
The Merger Fund and WCM Alternatives: Event-Driven Fund
NOTES TO THE FINANCIAL STATEMENTS (continued)
June 30, 2017 (Unaudited)
Note 7 — DISTRIBUTION PLAN
TMF has adopted an Amended and Restated Plan of Distribution (the “TMF Plan”) dated July 30, 2013, pursuant to Rule 12b-1 under the 1940 Act that applies to TMF’s Investor Class shares. EDF has adopted a Plan of Distribution (the “EDF Plan” and together with the TMF Plan, the “Plans”) dated July 30, 2013, pursuant to Rule 12b-1 under the 1940 Act that applies to EDF’s Investor Class shares. Under each Plan, the respective Fund will compensate broker dealers or other qualified institutions with whom the Fund has entered into a contract to distribute the Fund’s Investor Class shares. Under each Plan, the amount of such compensation paid in any one year shall not exceed 0.25% annually of the average daily net assets attributable to the respective Fund’s Investor Class shares, which may be payable as a distribution fee or a service fee for providing permitted recordkeeping, subaccounting, subtransfer agency and/or shareholder liaison services. For the six months ended June 30, 2017, TMF incurred $1,814,989 pursuant to the TMF Plan in respect of TMF’s Investor Class shares. For the six months ended June 30, 2017, EDF incurred $2,090 pursuant to the EDF Plan in respect of EDF’s Investor Class shares. Each Plan will remain in effect from year to year provided such continuance is approved at least annually by a vote either of a majority of the relevant Fund’s Trustees, including a majority of the non-interested Trustees, or a majority of the relevant Fund’s outstanding Investor Class shares.
Note 8 — OFFSETTING ASSETS AND LIABILITIES
Each Fund is subject to various Master Netting Arrangements, which govern the terms of certain transactions with select counterparties. The Master Netting Arrangements allow each Fund to close out and net its total exposure to a counterparty in the event of a default with respect to all the transactions governed under a single agreement with a counterparty. The Master Netting Arrangements also specify collateral posting arrangements at pre-arranged exposure levels. Under the Master Netting Arrangements, collateral is routinely transferred if the total net exposure to certain transactions (net of existing collateral already in place) governed under the relevant Master Netting Arrangement with a counterparty in a given account exceeds a specified threshold depending on the counterparty and the type of Master Netting Arrangement.
The Merger Fund and WCM Alternatives: Event-Driven Fund
NOTES TO THE FINANCIAL STATEMENTS (continued)
June 30, 2017 (Unaudited)
Note 8 — OFFSETTING ASSETS AND LIABILITIES (continued)
The Merger Fund
| | | | | | Gross | | | Net | | | | | | | | | | |
| | | | | | Amounts | | | Amounts | | | | | | | | | | |
| | | | | | Offset | | | Presented | | | Gross Amounts not | | | | |
| | | Gross | | | in the | | | in the | | | offset in the Statement | | | | |
| | | Amounts of | | | Statement | | | Statement | | | of Assets and Liabilities | | | | |
| | | Recognized | | | of Assets | | | of Assets | | | | | | Collateral | | | | |
| | | Assets/ | | | and | | | and | | | Financial | | | Received/ | | | Net | |
| | | Liabilities | | | Liabilities | | | Liabilities | | | Instruments | | | Pledged* | | | Amount | |
| Assets: | | | | | | | | | | | | | | | | | | |
| Description | | | | | | | | | | | | | | | | | | |
| Forward | | | | | | | | | | | | | | | | | | |
| Currency | | | | | | | | | | | | | | | | | | |
| Exchange | | | | | | | | | | | | | | | | | | |
| Contracts** | | $ | 406,399 | | | $ | 406,399 | | | $ | — | | | $ | — | | | $ | — | | | $ | — | |
| Swap | | | | | | | | | | | | | | | | | | | | | | | | |
| Contracts — | | | | | | | | | | | | | | | | | | | | | | | | |
| Bank of America | | | | | | | | | | | | | | | | | | | | | | | | |
| Merrill Lynch | | | | | | | | | | | | | | | | | | | | | | | | |
| & Co., Inc. | | | 1,021,768 | | | | 1,003,093 | | | | 18,675 | | | | — | | | | — | | | | 18,675 | |
| Swap | | | | | | | | | | | | | | | | | | | | | | | | |
| Contracts — | | | | | | | | | | | | | | | | | | | | | | | | |
| JPMorgan | | | | | | | | | | | | | | | | | | | | | | | | |
| Chase & | | | | | | | | | | | | | | | | | | | | | | | | |
| Co., Inc. | | | 8,370,333 | | | | 8,370,333 | | | | — | | | | — | | | | — | | | | — | |
| | | $ | 9,798,500 | | | $ | 9,779,825 | | | $ | 18,675 | | | $ | — | | | $ | — | | | $ | 18,675 | |
| | | | | | | | | | | | | | | | | | | | | | | | | |
| Liabilities: | | | | | | | | | | | | | | | | | | | | | | | | |
| Description | | | | | | | | | | | | | | | | | | | | | | | | |
| Written | | | | | | | | | | | | | | | | | | | | | | | | |
| Option | | | | | | | | | | | | | | | | | | | | | | | | |
| Contracts** | | $ | 22,128,888 | | | $ | — | | | $ | 22,128,888 | | | $ | — | | | $ | 22,128,888 | | | $ | — | |
| Forward | | | | | | | | | | | | | | | | | | | | | | | | |
| Currency | | | | | | | | | | | | | | | | | | | | | | | | |
| Exchange | | | | | | | | | | | | | | | | | | | | | | | | |
| Contracts** | | | 7,553,944 | | | | 406,399 | | | | 7,147,545 | | | | — | | | | 7,147,545 | | | | — | |
| Swap | | | | | | | | | | | | | | | | | | | | | | | | |
| Contracts — | | | | | | | | | | | | | | | | | | | | | | | | |
| Bank of America | | | | | | | | | | | | | | | | | | | | | | | | |
| Merrill Lynch | | | | | | | | | | | | | | | | | | | | | | | | |
| & Co., Inc. | | | 1,003,093 | | | | 1,003,093 | | | | — | | | | — | | | | — | | | | — | |
| Swap | | | | | | | | | | | | | | | | | | | | | | | | |
| Contracts — | | | | | | | | | | | | | | | | | | | | | | | | |
| JPMorgan | | | | | | | | | | | | | | | | | | | | | | | | |
| Chase & | | | | | | | | | | | | | | | | | | | | | | | | |
| Co., Inc. | | | 9,470,505 | | | | 8,370,333 | | | | 1,100,172 | | | | — | | | | 1,100,172 | | | | — | |
| | | $ | 40,156,430 | | | $ | 9,779,825 | | | $ | 30,376,605 | | | $ | — | | | $ | 30,376,605 | | | $ | — | |
| * | | In some instances, the actual collateral received/pledged may be more than amount shown. |
| ** | | JPMorgan Chase & Co., Inc. is the counterparty for all open forward currency exchange contracts and prime broker for all written option contracts held by the Funds as of June 30, 2017. |
The Merger Fund and WCM Alternatives: Event-Driven Fund
NOTES TO THE FINANCIAL STATEMENTS (continued)
June 30, 2017 (Unaudited)
Note 8 — OFFSETTING ASSETS AND LIABILITIES (continued)
WCM Alternatives: Event-Driven Fund
| | | | | | Gross | | | Net | | | | | | | | | | |
| | | | | | Amounts | | | Amounts | | | | | | | | | | |
| | | | | | Offset | | | Presented | | | Gross Amounts not | | | | |
| | | Gross | | | in the | | | in the | | | offset in the Statement | | | | |
| | | Amounts of | | | Statement | | | Statement | | | of Assets and Liabilities | | | | |
| | | Recognized | | | of Assets | | | of Assets | | | | | | Collateral | | | | |
| | | Assets/ | | | and | | | and | | | Financial | | | Received/ | | | Net | |
| | | Liabilities | | | Liabilities | | | Liabilities | | | Instruments | | | Pledged* | | | Amount | |
| Assets: | | | | | | | | | | | | | | | | | | |
| Description | | | | | | | | | | | | | | | | | | |
| Forward | | | | | | | | | | | | | | | | | | |
| Currency | | | | | | | | | | | | | | | | | | |
| Exchange | | | | | | | | | | | | | | | | | | |
| Contracts** | | $ | 14,794 | | | $ | 14,794 | | | $ | — | | | $ | — | | | $ | — | | | $ | — | |
| Swap | | | | | | | | | | | | | | | | | | | | | | | | |
| Contracts — | | | | | | | | | | | | | | | | | | | | | | | | |
| Bank of America | | | | | | | | | | | | | | | | | | | | | | | | |
| Merrill Lynch | | | | | | | | | | | | | | | | | | | | | | | | |
| & Co., Inc. | | | 823,096 | | | | 739,511 | | | | 83,585 | | | | — | | | | — | | | | 83,585 | |
| Swap | | | | | | | | | | | | | | | | | | | | | | | | |
| Contracts — | | | | | | | | | | | | | | | | | | | | | | | | |
| JPMorgan | | | | | | | | | | | | | | | | | | | | | | | | |
| Chase & | | | | | | | | | | | | | | | | | | | | | | | | |
| Co., Inc. | | | 739,341 | | | | 739,341 | | | | — | | | | — | | | | — | | | | — | |
| | | $ | 1,577,231 | | | $ | 1,493,646 | | | $ | 83,585 | | | $ | — | | | $ | — | | | $ | 83,585 | |
| Liabilities: | | | | | | | | | | | | | | | | | | | | | | | | |
| Description | | | | | | | | | | | | | | | | | | | | | | | | |
| Written | | | | | | | | | | | | | | | | | | | | | | | | |
| Option | | | | | | | | | | | | | | | | | | | | | | | | |
| Contracts** | | $ | 2,395,948 | | | $ | — | | | $ | 2,395,948 | | | $ | — | | | $ | 2,395,948 | | | $ | — | |
| Forward | | | | | | | | | | | | | | | | | | | | | | | | |
| Currency | | | | | | | | | | | | | | | | | | | | | | | | |
| Exchange | | | | | | | | | | | | | | | | | | | | | | | | |
| Contracts** | | | 360,281 | | | | 14,794 | | | | 345,487 | | | | — | | | | 345,487 | | | | — | |
| Swap | | | | | | | | | | | | | | | | | | | | | | | | |
| Contracts — | | | | | | | | | | | | | | | | | | | | | | | | |
| Bank of America | | | | | | | | | | | | | | | | | | | | | | | | |
| Merrill Lynch | | | | | | | | | | | | | | | | | | | | | | | | |
| & Co., Inc. | | | 739,511 | | | | 739,511 | | | | — | | | | — | | | | — | | | | — | |
| Swap | | | | | | | | | | | | | | | | | | | | | | | | |
| Contracts — | | | | | | | | | | | | | | | | | | | | | | | | |
| JPMorgan | | | | | | | | | | | | | | | | | | | | | | | | |
| Chase & | | | | | | | | | | | | | | | | | | | | | | | | |
| Co., Inc. | | | 2,817,687 | | | | 739,341 | | | | 2,078,346 | | | | — | | | | 2,078,346 | | | | — | |
| | | $ | 6,313,427 | | | $ | 1,493,646 | | | $ | 4,819,781 | | | $ | — | | | $ | 4,819,781 | | | $ | — | |
| * | | In some instances, the actual collateral received/pledged may be more than amount shown. |
| ** | | JPMorgan Chase & Co., Inc. is the counterparty for all open forward currency exchange contracts and prime broker for all written option contracts held by the Funds as of June 30, 2017. |
The Merger Fund and WCM Alternatives: Event-Driven Fund
NOTES TO THE FINANCIAL STATEMENTS (continued)
June 30, 2017 (Unaudited)
Note 9 — ACCOUNTING PRONOUNCEMENTS
In March 2017, the Financial Accounting Standards Board (“FASB”) issued Accounting Standards Update (“ASU”) No. 2017-08, Receivables—Nonrefundable Fees and Other Costs (Subtopic 310-20): Premium Amortization on Purchased Callable Debt Securities. The amendments in the ASU shorten the amortization period for certain callable debt securities, held at a premium, to be amortized to the earliest call date. The ASU does not require an accounting change for securities held at a discount; which continues to be amortized to maturity. The ASU is effective for fiscal years and interim periods within those fiscal years beginning after December 15, 2018. Management is currently evaluating the impact, if any, of applying this provision.
Note 10 — SUBSEQUENT EVENTS
Management has evaluated events and transactions occurring after June 30, 2017 through the date that the financial statements were issued, and has determined that no additional disclosure in the financial statements is required.
ADDITIONAL INFORMATION (Unaudited)
For the fiscal year ended December 31, 2016, certain dividends paid by TMF may be subject to a maximum tax rate of 15% as provided for by the Jobs and Growth Tax Relief Reconciliation Act of 2003. The percentage of dividends declared from ordinary income designated as qualified dividend income for the fiscal year ended December 31, 2016 was 100.00% for TMF and 100.00% for EDF.
For corporate shareholders, the percent of ordinary income distributions qualifying for the corporate dividends-received deduction for the fiscal year ended December 31, 2016 was 100.00% for TMF and 100.00% for EDF.
The percentage of taxable ordinary income distributions that are designated as short-term capital gain distributions under Internal Revenue Code Section 871(k)(2)(c) for the fiscal year ended December 31, 2016 was 0.00% for TMF and 0.00% for EDF.
AVAILABILITY OF PROXY VOTING INFORMATION
Information regarding how the Funds generally votes proxies relating to portfolio securities may be obtained without charge by calling the Funds’ Transfer Agent at 1-800-343-8959 or by visiting the SEC’s website at www.sec.gov. Information regarding how the Funds voted proxies during the most recent 12-month period ended June 30 is available on the SEC’s website or by calling the toll-free number listed above.
AVAILABILITY OF QUARTERLY PORTFOLIO SCHEDULE
The Funds file their complete schedule of portfolio holdings with the SEC for the first and third quarters of each fiscal year on Form N-Q. The Funds’ Forms N-Q are available on the SEC’s website at www.sec.gov and may be reviewed and copied at the SEC’s Public Reference Room in Washington, DC. Information on the operation of the Public Reference Room may be obtained by calling 1-800-SEC-0330.
The Merger Fund and WCM Alternatives: Event-Driven Fund
PRIVACY POLICY
We collect the following non-public personal information about you:
| | • | Information we receive from you on or in applications or other forms, correspondence, or conversations, including, but not limited to, your name, address, phone number, social security number, assets, income and date of birth; and |
| | | |
| | • | Information about your transactions with us, our affiliates, or others, including, but not limited to, your account number and balance, payments history, parties to transactions, cost basis information, and other financial information. |
We do not disclose any non-public personal information about our current or former shareholders to non-affiliated third parties, except as permitted by law. For example, we are permitted by law to disclose all of the information we collect, as described above, to our transfer agent to process your transactions. Furthermore, we restrict access to your non-public personal information to those persons who require such information to provide products or services to you. We maintain physical, electronic, and procedural safeguards that comply with federal standards to guard your non-public personal information.
In the event that you hold shares of the Fund through a financial intermediary, including, but not limited to, a broker-dealer, bank, or trust company, the privacy policy of your financial intermediary would govern how your non-public personal information would be shared with non-affiliated third parties.
THIS PRIVACY POLICY IS NOT A PART OF THE SEMI-ANNUAL REPORT.
| Investment Adviser |
| | Westchester Capital Management, LLC |
| | 100 Summit Lake Drive |
| | Valhalla, NY 10595 |
| | (914) 741-5600 |
| | www.westchestercapitalfunds.com |
| | |
| Administrator, Transfer Agent, Accountant, |
| Dividend Paying Agent and Shareholder Servicing Agent |
| | U.S. Bancorp Fund Services, LLC |
| | 615 East Michigan Street |
| | P.O. Box 701 |
| | Milwaukee, WI 53201-0701 |
| | (800) 343-8959 |
| | |
| Custodian |
| | U.S. Bank, N.A. |
| | 1555 North Rivercenter Drive, Suite 302 |
| | Milwaukee, WI 53212 |
| | (800) 343-8959 |
| | |
| Distributor |
| | Quasar Distributors, LLC |
| | 777 East Wisconsin Avenue |
| | Milwaukee, WI 53202 |
| | |
| Trustees |
| | Roy Behren |
| | Michael T. Shannon |
| | Barry Hamerling |
| | Richard V. Silver |
| | Christianna Wood |
| | |
| Executive Officers |
| | Roy Behren, Co-President and Treasurer |
| | Michael T. Shannon, Co-President |
| | Bruce Rubin, Vice President and |
| | Chief Compliance Officer |
| | Abraham R. Cary, Secretary |
| | |
| Counsel |
| | Ropes & Gray LLP |
| | 1211 Avenue of the Americas |
| | New York, NY 10036 |
| | |
| Independent Registered |
| Public Accounting Firm |
| | PricewaterhouseCoopers LLP |
| | 300 Madison Avenue |
| | New York, NY 10017 |
Item 2. Code of Ethics.
Not applicable for semi-annual reports.
Item 3. Audit Committee Financial Expert.
Not applicable for semi-annual reports.
Item 4. Principal Accountant Fees and Services.
Not applicable for semi-annual reports.
Item 5. Audit Committee of Listed Registrants.
Not applicable.
Item 6. Investments.
The registrant’s Schedule of Investments is included as part of the report to shareholders filed under Item 1 of this Form.
Item 7. Disclosure of Proxy Voting Policies and Procedures for Closed-End Management Investment Companies.
Not applicable to open-end investment companies.
Item 8. Portfolio Managers of Closed-End Management Investment Companies.
Not applicable to open-end investment companies.
Item 9. Purchases of Equity Securities by Closed‑End Management Investment Company and Affiliated Purchasers.
Not applicable to open-end investment companies.
Item 10. Submission of Matters to a Vote of Security Holders.
There have been no material changes to the procedures by which shareholders may recommend nominees to the registrant’s board of trustees.
Item 11. Controls and Procedures.
| (a) | The registrant’s Co-Presidents/Chief Executive Officers and Treasurer/Chief Financial Officer have reviewed the registrant's disclosure controls and procedures (as defined in Rule 30a-3(c) under the Investment Company Act of 1940 (the “Act”)) as of a date within 90 days of the filing of this report, as required by Rule 30a-3(b) under the Act and Rules 13a-15(b) or 15d‑15(b) under the Securities Exchange Act of 1934. Based on their review, such officers have concluded that the disclosure controls and procedures are effective in ensuring that information required to be disclosed in this report is appropriately recorded, processed, summarized and reported and made known to them by others within the registrant and by the registrant’s service provider. |
| (a) | There were no changes in the registrant's internal control over financial reporting (as defined in Rule 30a-3(d) under the Act) that occurred during the second fiscal quarter of the period covered by this report that has materially affected, or is reasonably likely to materially affect, the registrant's internal control over financial reporting. |
Item 12. Exhibits.
| (a) | (1) Any code of ethics or amendment thereto, that is the subject of the disclosure required by Item 2, to the extent that the registrant intends to satisfy Item 2 requirements through filing an exhibit. Not Applicable. |
(2) A separate certification for each principal executive officer and principal financial officer pursuant to Section 302 of the Sarbanes-Oxley Act of 2002. Filed herewith.
(3) Any written solicitation to purchase securities under Rule 23c‑1 under the Act sent or given during the period covered by the report by or on behalf of the registrant to 10 or more persons. Not applicable to open-end investment companies.
| (b) | Certifications pursuant to Section 906 of the Sarbanes‑Oxley Act of 2002. Furnished herewith. |
SIGNATURES
Pursuant to the requirements of the Securities Exchange Act of 1934 and the Investment Company Act of 1940, the registrant has duly caused this report to be signed on its behalf by the undersigned, thereunto duly authorized.
(Registrant) The Merger Fund
By (Signature and Title)* /s/ Michael T. Shannon
Michael T. Shannon, Co-President
Date September 6, 2017
By (Signature and Title)*/s/ Roy Behren
Roy Behren, Co-President and Treasurer
Date September 6, 2017
Pursuant to the requirements of the Securities Exchange Act of 1934 and the Investment Company Act of 1940, this report has been signed below by the following persons on behalf of the registrant and in the capacities and on the dates indicated.
By (Signature and Title)* /s/ Michael T. Shannon
Michael T. Shannon, Co-President
Date September 6, 2017
By (Signature and Title)* /s/ Roy Behren
Roy Behren, Co-President and Treasurer
Date September 6, 2017
* Print the name and title of each signing officer under his or her signature.