UNITED STATES
SECURITIES AND EXCHANGE COMMISSION
Washington, D.C. 20549
Form 10-K
| x | ANNUAL REPORT PURSUANT TO SECTION 13 OR 15(d) OF THE SECURITIES EXCHANGE ACT OF 1934 |
FOR THE FISCAL YEAR ENDED JANUARY 31, 2011
COMMISSION FILE NUMBER 1 – 34795
MENTOR GRAPHICS CORPORATION
(Exact name of registrant as specified in its charter)
| | |
| Oregon | | 93-0786033 |
(State or other jurisdiction of incorporation or organization) | | (IRS Employer Identification No.) |
| | |
8005 SW Boeckman Road Wilsonville, Oregon | | 97070-7777 |
| (Address of principal executive offices) | | (Zip Code) |
(503) 685-7000
(Registrant’s telephone number, including area code)
Securities registered pursuant to Section 12(b) of the Act:
| | |
| Title of Each Class | | Name of Each Exchange on which Registered |
| Common Stock, without par value | | NASDAQ Global Select Market |
| Incentive Stock Purchase Rights | | NASDAQ Global Select Market |
Securities registered pursuant to Section 12(g) of the Act:
None
Indicate by check mark if the registrant is a well-known seasoned issuer, as defined in Rule 405 of the Securities Act. Yes x No ¨
Indicate by check mark if the registrant is not required to file reports pursuant to Section 13 or Section 15(d) of the Act. Yes ¨ No x
Indicate by check mark whether the registrant has submitted electronically and posted on its corporate Web site, if any, every Interactive Data File required to be submitted and posted pursuant to Rule 405 of Regulation S-T during the preceding 12 months (or for such shorter period that the registrant was required to submit and post such files). Yes x No ¨
Indicate by check mark whether the registrant (1) has filed all reports required to be filed by Section 13 or 15(d) of the Securities Exchange Act of 1934 during the preceding twelve months (or for such shorter period that the registrant was required to file such reports), and (2) has been subject to such filing requirements for the past 90 days. Yes x No ¨
Indicate by check mark if disclosure of delinquent filers pursuant to Item 405 of Regulation S-K is not contained herein, and will not be contained, to the best of Registrant’s knowledge, in definitive proxy or information statements incorporated by reference in Part III of this Form 10-K or in any amendment to this Form 10-K. ¨
Indicate by check mark whether the registrant is a large accelerated filer, an accelerated filer, a non-accelerated filer, or a smaller reporting company. See the definitions of “large accelerated filer,” “accelerated filer” and “smaller reporting company” in Rule 12b-2 of the Exchange Act. (Check one):
| | | | | | |
| Large Accelerated Filer | | x | | Accelerated Filer | | ¨ |
| | | |
| Non-accelerated filer | | ¨ (Do not check if a smaller reporting company) | | Smaller reporting company | | ¨ |
Indicate by check mark whether the Registrant is a shell company (as defined in Rule 12b-2 of the Exchange Act). Yes ¨ No x
The aggregate market value of the voting stock held by non-affiliates of the registrant was approximately $1,051,159,266 on July 31, 2010 based upon the last price of the Common Stock on that date reported in The NASDAQ Global Select Market. On March 11, 2011, there were 112,357,843 shares of the Registrant’s Common Stock outstanding.
DOCUMENTS INCORPORATED BY REFERENCE
| | |
Document | | Part of Form 10-K into which incorporated |
Portions of the 2011 Proxy Statement | | Part III |
Table of Contents
2
Part I
This Form 10-K contains forward-looking statements that involve risks and uncertainties. Actual results may differ materially from the forward-looking statements. Factors that could cause or contribute to such differences include, but are not limited to, those set forth under Part I, Item 1A. “Risk Factors.”
GENERAL
Mentor Graphics Corporation is a technology leader in electronic design automation (EDA). We provide software and hardware design solutions that enable our customers to develop better electronic products faster and more cost effectively. We market our products and services worldwide, primarily to large companies in the military/aerospace, communications, computer, consumer electronics, semiconductor, networking, multimedia, and transportation industries.
The electronic components and systems that our customers create with our products include printed circuit boards (PCBs), integrated circuits (ICs), field programmable gate arrays (FPGAs), embedded software solutions, wire harness systems, and computers. Our products are used in the design and development of a diverse set of electronic products, including automotive electronics, video game consoles, digital cameras, cellular telephones, medical devices, smart phones, and e-book readers. As silicon manufacturing process geometries shrink, our customers are creating entire electronic systems on a single IC. These are called system-on-chip (SoC) devices. This trend becomes apparent to the everyday consumer as consumer electronics become smaller and more sophisticated. This trend also poses significant opportunities and challenges for the EDA industry.
We were incorporated in Oregon in 1981, and our common stock is traded on The NASDAQ Global Select Market under the symbol “MENT.” Our executive offices are located at 8005 S.W. Boeckman Road, Wilsonville, Oregon 97070-7777. The telephone number at that address is (503) 685-7000. Our website address iswww.mentor.com. Electronic copies of our reports filed with the Securities and Exchange Commission (SEC) are available through our website as soon as reasonably practicable after the reports are filed with the SEC. Our Director Code of Ethics, Standards of Business Conduct, Guidelines for Corporate Disclosure, Corporate Governance Guidelines, and our Audit, Compensation, and Nominating and Corporate Governance Committee Charters are also posted on our website.
PRODUCTS
We design our products to enable engineers to overcome increasingly complex electronic design challenges by improving the accuracy of complex designs and shrinking product time-to-market schedules. A hardware design process is typically as follows:
| | • | | Electrical engineers begin the design process by describing and specifying the architectural, behavioral, functional, and structural characteristics of an IC, PCB, or electronic system and components. |
| | • | | Engineers then create the component designs according to stated specifications. |
| | • | | Engineers verify the design to reveal defects and then modify the component’s design until it is correct and meets the previously stated specifications. |
| | • | | Engineers assemble components and test the components and the entire system. |
| | • | | The system then goes to production. During the manufacturing process, engineers work to identify defective parts and improve yields. “Yields” refer to the percentage of working ICs on a silicon wafer or PCBs working compared to the total of those manufactured. |
Scalable Verification
The Mentor Graphics® Scalable Verification™ tools allow engineers to verify that their complex IC designs function as intended. Functional errors are a leading cause of design revisions that slow down an electronic system’s time-to-market and reduce its profitability. We offer the following digital simulation products:
| | • | | The ModelSim® software tool is a leading hardware description language (HDL) mixed-language digital simulator that helps hardware designers verify that their IC design functions correctly before the design is completed, and is used for application-specific integrated circuits (ASICs), SoCs, FPGAs, and other IC design verification, as well as verification of entire systems. |
3
| | • | | The Questa® scalable verification platform includes support for HDLs, including System Verilog, simulation, and new verification methodologies including assertions and formal methods. The Questa platform is used for more extended verification of systems and ICs including ASICs, SoCs, and FPGAs. |
Along with digital simulation products, we offer analog/mixed-signal simulators. Complex electronic designs often require different types of circuits, such as analog and digital, to work together. An example is a CD or DVD player which uses a digital input and produces an analog output of sounds or images. Our analog/mixed signal simulation products include the Eldo®, ADVance MSTM, and ADiT™ tools.
We provide hardware emulation systems, such as our Veloce® product, which allow users to create functional and logical equivalent models of actual electronic circuits to verify the function and timing of those circuits. Hardware emulation systems typically allow faster verification of complex electronic circuits when compared to software simulation tools. Our Veloce product allows customers to verify complex designs containing up to 512 million logic gates.
IC Design to Silicon
Shrinking geometries and increasing design size in the nanometer era have enabled ever increasing functionality on a single IC. Feature sizes of today’s advanced ICs are typically less than 50 nanometers (nm). Nanometer process geometries cause design challenges in the creation of ICs which are not present at larger geometries. As a result, nanometer process technologies, used to deliver the majority of today’s ICs, are the product of careful design and precision manufacturing. The increasing complexity and smaller size of designs have changed how those responsible for the physical layout of an IC design deliver their design to the IC manufacturer or foundry. In older technologies, this handoff was a relatively simple layout database check when the design went to manufacturing. Now it is a multi-step process where the layout database is checked and modified so the design can be manufactured with cost-effective yields of ICs.
To address these challenges, we offer the Calibre® tool family, which is a standard for most of the world’s largest integrated device manufacturers and foundries:
| | • | | The Calibre physical verification tool suite, Calibre DRCTM and Calibre LVSTM, helps ensure that a particular IC layout accurately corresponds to the original schematic or circuit diagram of the design and conforms to stringent manufacturing rules at wafer fabs where ICs are manufactured. |
| | • | | The Calibre xRC™ and xACT products, transistor-level extraction and device modeling tools, compute the values of detailed circuit parameters including interconnect resistances, capacitances, and inductances to enable customers to more accurately simulate the performance of a design before it is manufactured. |
| | • | | The Calibre lithography tools allow engineers to model, enhance, and verify layouts using lithography resolution enhancement techniques, including optical and process correction, phase-shift mask, scattering bars, and off-axis illumination. Use of these tools substantially increases the yields of ICs and is required at the lower geometries to achieve any yield at all. |
| | • | | In the Design For Manufacturing (DFM) area, the Calibre LFD™ product can help customers produce higher yields at nanometer process geometries where variations in manufacturing can cause yield reductions. The Calibre CMPAnalyzer tool allows customers to model the expected planarity (i.e., thickness variation) of ICs and identify where modifications to the layout will improve a chip’s flatness. This helps prevent manufacturing defects and reduces variations in performance from one chip to the next. |
| | • | | The Calibre PERC is a tool for checking the electrical design of an IC. It is useful in verifying the completeness of electrostatic discharge protection circuitry which affects both manufacturing yield and long-term reliability of an IC. |
We also offer the Olympus-SoC™ place and route product targeted at customers designing ICs using geometries of 65 nm and below. The Olympus-SoC product addresses IC design challenges such as manufacturing variability, design size and complexity, and low power requirements. The Olympus-SoC place and route solution addresses these issues with technology such as Design Rule Checkers-, DFM-, power-aware routing, lithography-friendly layout, and multi-corner multi-mode timing analysis, which concurrently optimizes for timing, power, and signal integrity across multiple process corners and design modes. In 2010 we introduced the Calibre InRoute design and verification platform which enables designers to increase their productivity by invoking Calibre tools within the Olympus-SoC place and route tool.
4
Integrated System Design
As ICs grow in complexity and function and PCB fabrication technology advances to include embedded components and high-density interconnect layers within the PCB, the design of PCBs is becoming increasingly complex. This complexity can be a source of design bottlenecks.
Our PCB-FPGA Systems Design software products support the PCB design process from schematic entry, where the electronic circuit is defined by engineers, through physical layout of the PCB, to providing digital output data for manufacturing, assembly, and test. Most types of designs, including analog, radio frequency, and high-speed digital and mixed signal, are supported by our PCB design tools. We have specific integrated software tool flows for process management, component library creation, simulation, and verification of the PCB design:
| | • | | The Expedition Series® product line is our principal PCB design family of products used by larger enterprise customers. |
| | • | | We also offer the “ready to use” PADS® product line which provides a lower cost Windows-based PCB design and layout solution. |
| | • | | Our I/O Designer TM product integrates FPGA input/output planning with our PCB design tools to help improve routing in large complex designs. |
| | • | | The XtremePCBTM tool offers a method for simultaneous design where multiple designers can edit the same design at the same time and view each others’ edits in real-time. |
| | • | | Our XtremeAR product is a PCB routing product that improves the routing time of large designs. This product allows improved designs by running more simultaneous routing iterations during the design cycle. |
Our AutoActiveTM place and route technology is available on both UNIX and Windows platforms and is used to replace older generation routers in PCB design flows. The AutoActive technology, which is incorporated into the Expedition product line, is intended to help improve design quality, shorten design cycles, and increase manufacturability. Our Hyperlynx® high-speed design technology tools address signal integrity and timing challenges of complex, high-speed PCB designs.
Our Precision® Synthesis product family allows a designer to use HDL descriptions of functionality to efficiently program an FPGA to perform a specific set of functions.
Our Mechanical Analysis Division offers a line of products that provide simulation of mechanical engineering design processes involving heat transfer and fluid flow which help reduce costs, eliminate design mistakes, and accelerate design cycle time. The FloEFD TM product is embedded in a range of commercial mechanical computer aided design software products and enables design engineers to conduct computational fluid dynamics analysis throughout the product’s lifecycle. The FloTHERM® 3D computational fluid dynamics software provides bottleneck and shortcut fields so engineers can identify where and why heat flow congestion occurs in an electronic design.
Our Valor® Division offers a line of products for printed circuit board, design for manufacturing, and manufacturing execution systems. Valor’s solutions target three key segments in the PCB manufacturing market: design of the physical layout of the PCB, fabrication of the bare PCB, and assembly of PCB components.
New and Emerging Products
Engineers are trying to reduce the design and verification complexity associated with next generation applications found in technologies such as broadband wireless, image/video processing, and military products. One response to this trend is leading designers toward methodologies based on ANSI C/C++ language which can offer a more abstract and efficient way to create and verify designs. Our Catapult® C Synthesis tool can help engineering teams produce ASIC or FPGA hardware that can be smaller in size, use less power, reduce overall design cycle time, and reduce overall verification effort.
Our Integrated Electrical Systems Division provides specialized software for design, analysis, manufacture, and data management of complex wire harness systems used by automotive, aerospace, and other industries. We also offer a variety of software tools targeting the automotive market that focus on the functional design of the electronic components of cars.
5
We offer a suite of products for companies developing embedded software for products such as smart phones and medical devices. Our offerings in this area are real-time operating systems, Linux and Android (Google TM) products and services, middleware, and associated development and debugging tools.
We also offer tools to test IC designs. Our Tessent™ suite of integrated silicon test products are used to test a design’s logic and memories after manufacturing to ensure that a manufactured IC is functioning correctly. Our suite of tools includes scan insertion, automatic test pattern generation, logic and memory built-in self-test, and our patented Tessent TestKompress® product for the EDT™ (Embedded Deterministic Test). A suite of test analysis products is also available that leverages test data and layout-aware diagnosis capabilities for silicon debug and yield analysis.
PLATFORMS
Our software products are available on UNIX, Windows, and LINUX platforms in a broad range of price and performance levels. Customers purchase platforms from leading workstation and personal computer suppliers.
MARKETING AND CUSTOMERS
Our sales and marketing emphasizes large corporate account penetration in the military/aerospace, communications, computer, consumer electronics, semiconductor, networking, multimedia, and transportation industries. We license our products worldwide through our direct sales force, distributors, and sales representatives. During the year ended January 31, 2011, revenues outside of North America accounted for 56% of total revenues compared to 57% for fiscal 2010 and 61% for fiscal 2009. See “Geographic Revenues Information” in Part II, Item 7. “Management’s Discussion and Analysis of Financial Condition and Results of Operations” and the footnotes to our financial statements included in Part II, Item 8. “Financial Statements and Supplementary Data” for more information. We enter into foreign currency exchange contracts in an effort to mitigate the impact of foreign currency fluctuations.
We segregate revenues into five categories of similar products and services. These categories include IC Design to Silicon, Integrated System Design, Scalable Verification, New and Emerging Products, and Services and Other. Each category includes both product and support revenues. See the discussion in Note 21. “Segment Reporting” in Part II, Item 8. “Financial Statements and Supplementary Data” for further detail of revenue by product and service category.
Over time, no material portion of our business is dependent on a single or a few customers. We do not believe that the competitive loss of one or more product lines at one or more of our customers would have a material adverse effect on our revenues. We have traditionally experienced some seasonal fluctuations of orders, with orders typically stronger in the fourth quarter of each year. Due to the complexity of our products, the selling cycle can be six months or longer. During the selling cycle our account managers, application engineers, and technical specialists make technical presentations and product demonstrations to the customer. At some point during the selling cycle, our products may also be loaned to customers for short-term on-site evaluation. We generally ship our products to customers within 180 days after receipt of an order and a substantial portion of quarterly shipments tend to be made in the last month of each quarter. We license our products and some third-party products pursuant to end-user license agreements.
BACKLOG
Our backlog of firm orders was approximately $129 million as of January 31, 2011 compared to $71 million as of January 31, 2010. This backlog includes products requested for delivery within six months and unfulfilled professional services and training requested for delivery within one year. We do not track backlog for support services. The January 31, 2011 backlog of orders is expected to ship before the end of our fiscal year ending January 31, 2012.
MANUFACTURING OPERATIONS
Our manufacturing operations primarily consist of reproduction of our software and documentation. In North America, manufacturing is substantially outsourced with distribution to North American and Japanese customers occurring primarily from Wilsonville, Oregon. Our line of emulation products, which has a large hardware component, is manufactured in the United States and France on an outsourced basis. Mentor Graphics (Ireland)
6
Limited, a wholly owned subsidiary of Mentor Graphics Corporation, manufactures, or contracts with third-parties to manufacture, our products and distributes these products to markets outside North America and Japan through our established sales channels. See the discussion in Note 21. “Segment Reporting” in Part II, Item 8. “Financial Statements and Supplementary Data” for further detail of the location of property, plant, and equipment.
PRODUCT DEVELOPMENT
Our research and development is focused on continued improvement of our existing products and the development of new products. During the year ended January 31, 2011, we expensed $285 million related to product research and development compared to $256 million for fiscal 2010 and $260 million for fiscal 2009. We also seek to expand existing product offerings and pursue new lines of business through acquisitions. During fiscal 2011, we amortized purchased technology of $14 million compared to $12 million for fiscal 2010 and $12 million for fiscal 2009. During fiscal 2009 we expensed in-process research and development of $22 million. Our future success depends on our ability to develop or acquire competitive new products that satisfy customer requirements.
CUSTOMER SUPPORT AND CONSULTING
We have a worldwide support organization to meet our customers’ needs for software support, hardware support, and customer training. Most of our customers enter into support contracts that deliver regular software updates with the latest improvements, technical assistance from experienced experts, access to a self-service support site, and participation in Mentor’s interactive communities. Hardware support is available for emulation products. Mentor Graphics Education Services offers a wide range of learning solutions developed specifically for electronics designers and engineers.
Mentor Consulting, our professional services division, is comprised of a worldwide team of consulting professionals. The services provided to customers are concentrated around our products. In addition, Mentor Consulting provides methodology development and refinement services that help customers improve their product development processes.
COMPETITION
The markets for our products are characterized by price competition, rapid technological advances in application software, and new market entrants. The EDA industry tends to be labor intensive rather than capital intensive. This means that the number of actual and potential competitors is significant. While our two principal competitors are large companies with extensive capital and marketing resources, we also compete with small companies with little capital but innovative ideas. Our principal competitors are Cadence Design Systems, Inc. and Synopsys, Inc.
We believe the main competitive factors affecting our business are breadth and quality of application software, product integration, ability to respond to technological change, quality of a company’s sales force, price, size of the installed base, level of customer support, and professional services. We can give no assurance, however, that we will have financial resources, marketing, distribution and service capability, depth of key personnel, or technological knowledge to compete successfully in our markets.
EMPLOYEES
We employed approximately 4,700 people full time as of January 31, 2011. Our future success will depend in part on our ability to attract and retain employees. None of our United States (U.S.) employees are covered by collective bargaining agreements. Employees in some jurisdictions outside the U.S. are represented by local or national union organizations. We continue to have satisfactory employee relations.
PATENTS AND LICENSES
We regard our products as proprietary and protect our rights in our products and technology in a variety of ways. We currently hold approximately 500 U.S. and 30 non-U.S. patents on inventions embodied in our products or that are otherwise relevant to EDA technology. In addition, we hold approximately 460 patent applications pending in the U.S. and abroad. While we believe the patent applications relate to patentable technology, we cannot predict whether any patent will issue on a pending application, nor can we assure that any patent can be successfully defended.
7
We also rely on contractual and technical safeguards to protect our proprietary rights in our products. We typically include restrictions on disclosure, use, and transferability in our agreements with customers and other parties. In addition, we use our trademark, copyright, and trade secret rights to protect our interests in our products and technology.
Some of our products include software or other intellectual property licensed from other parties. We also license software from other parties for internal use. We may have to seek new licenses or renew these licenses in the future.
The forward-looking statements contained under “Outlook for Fiscal 2012” in Part II, Item 7. “Management’s Discussion and Analysis of Financial Condition and Results of Operations” and all other statements contained in this report that are not statements of historical fact, including without limitation, statements containing the words “believes,” “expects,” “projections,” and words of similar meaning, constitute forward-looking statements that involve a number of risks and uncertainties that are difficult to predict. Moreover, from time to time, we may issue other forward-looking statements. Forward-looking statements regarding financial performance in future periods, including the statements under “Outlook for Fiscal 2012,” do not reflect potential impacts of mergers or acquisitions or other significant transactions or events that have not been announced as of the time the statements are made. Actual outcomes and results may differ materially from what is expressed or forecast in forward-looking statements. We disclaim any obligation to update forward-looking statements to reflect future events or revised expectations. Our business faces many risks, and set forth below are some of the factors that could cause actual results to differ materially from the results expressed or implied by our forward-looking statements. Forward-looking statements should be considered in light of these factors.
Weakness in the United States (U.S.) and international economies may harm our business.
Our revenue levels are generally dependent on the level of technology capital spending, which includes worldwide expenditures for electronic design automation (EDA) software, hardware, and consulting services. Periods of economic uncertainty, such as the recession experienced in 2008 and much of 2009, can adversely affect our customers and postpone decisions to license or purchase our products, decrease our customers’ spending, and jeopardize or delay our customers’ ability or willingness to make payment obligations, any of which could adversely affect our business.
Our forecasts of our revenues and earnings outlook may be inaccurate.
Our revenues, particularly new software license revenues, are difficult to forecast. We use a “pipeline” system, a common industry practice, to forecast revenues and trends in our business. Sales personnel monitor the status of potential business and estimate when a customer will make a purchase decision, the dollar amount of the sale, and the products or services to be sold. These estimates are aggregated periodically to generate a sales pipeline. Our pipeline estimates may prove to be unreliable either in a particular quarter or over a longer period of time, in part because the “conversion rate” of the pipeline into contracts can be very difficult to estimate and requires management judgment. A variation in the conversion rate could cause us to plan or budget incorrectly and materially adversely impact our business or our planned results of operations. In particular, a slowdown in customer spending or weak economic conditions generally can reduce the conversion rate in a particular quarter as purchasing decisions are delayed, reduced in amount, or cancelled. The conversion rate can also be affected by the tendency of some of our customers to wait until the end of a fiscal quarter attempting to obtain more favorable terms. This may result in failure to agree to terms within the fiscal quarter and cause expected revenue to slip into a subsequent quarter.
Our business could be impacted by fluctuations in quarterly results of operations due to customer seasonal purchasing patterns, the timing of significant orders, and the mix of licenses and products purchased by our customers.
We have experienced, and may continue to experience, varied quarterly operating results. Various factors affect our quarterly operating results and some of these are not within our control, including customer demand and the timing of significant orders. We typically experience seasonality in demand for our products, due to the purchasing cycles of our customers, with revenues in the fourth quarter generally being the highest. If planned contract renewals are delayed or the average size of renewed contracts do not increase as we anticipate, we could fail to meet our and investors’ expectations, which could have a material adverse impact on our stock price.
8
Our revenues are also affected by the mix of licenses entered into where we recognize software revenues as payments become due and payable, on a cash basis, or ratably over the license term as compared to revenues recognized at the beginning of the license term. We recognize revenues ratably over the license term, for instance, when the customer is provided with rights to unspecified or unreleased future products. A shift in the license mix toward increased ratable, due and payable, and/or cash-based revenue recognition could result in increased deferral of software revenues to future periods and would decrease current revenues, which could result in us not meeting near-term revenue expectations.
The gross margin on our software is greater than that for our emulation hardware systems, software support, and professional services. Therefore, our gross margin may vary as a result of the mix of products and services sold. We also have a significant amount of fixed or relatively fixed costs, such as employee costs and purchased technology amortization, and costs which are committed in advance and can only be adjusted periodically. As a result, a small failure to reach planned revenues would likely have a relatively large negative effect on resulting earnings. If anticipated revenues do not materialize as expected, our gross margins and operating results could be materially adversely impacted.
We face intense price competition in the EDA industry.
Price competition in the EDA industry is intense, which can lead to, among other things, price reductions, longer selling cycles, lower product margins, loss of market share, and additional working capital requirements. If our competitors offer significant discounts on certain products, we may need to lower our prices or offer other favorable terms to compete successfully. Any such changes would likely reduce margins and could materially adversely impact our operating results. Any broad-based changes to our prices and pricing policies could cause new software license and service revenues to decline or be delayed as the sales force implements and our customers adjust to the new pricing policies. Some of our competitors may bundle certain software products at low prices for promotional purposes or as a long-term pricing strategy. These practices could significantly reduce demand for our products or limit prices we can charge.
We currently compete primarily with two large companies: Synopsys, Inc. and Cadence Design Systems, Inc. We also compete with smaller companies and compete with manufacturers of electronic devices that have developed their own EDA products internally. Some large customers may also develop internal tools, thereby reducing demand for our products.
Our international operations and the effects of foreign currency fluctuations expose us to additional risks.
We typically generate about half of our revenues from customers outside the U.S. and we generate approximately one-third of our expenses outside the U.S. Significant changes in currency exchange rates, particularly in the Japanese yen, euro, and the British pound, could have an adverse impact on us. In addition, international operations subject us to other risks including longer receivables collection periods, changes in a specific country’s or region’s economic or political conditions, trade protection measures, local labor laws, import or export licensing requirements, loss or modification of exemptions for taxes and tariffs, limitations on repatriation of earnings, and difficulties with licensing and protecting our intellectual property rights.
We derive a substantial portion of our revenues from relatively few product groups.
We derive a substantial portion of our revenues from sales of relatively few product groups and related support services. As a result, any factor adversely affecting sales of these products, including the product release cycles, market acceptance, product competition, performance and reliability, reputation, price competition, and economic and market conditions, could harm our operating results.
We are subject to the cyclical nature of the integrated circuit (IC) and electronics systems industries.
Purchases of our products and services are highly dependent upon new design projects initiated by customers in the IC and electronics systems industries. These industries are highly cyclical and are subject to constant and rapid technological change, rapid product obsolescence, price erosion, evolving standards, short product life cycles, and wide fluctuations in product supply and demand. The increasing complexity of ICs and resulting increase in costs to
9
design and manufacture ICs have in recent years led to fewer design starts, which could cause a reduced demand for our products. In addition, the IC and electronics systems industries regularly experience significant downturns, often connected with, or in anticipation of, maturing product cycles within such companies or decline in general economic conditions. These downturns could cause diminished demand for our products and services.
Shortages of components for our hardware products may delay or reduce our sales and increase our costs.
The inability to obtain sufficient quantities of components and other materials necessary for the production of our hardware products could result in reduced or delayed sales or lost orders. Any delay in or loss of sales could adversely impact our operating results. From time to time, materials and components used in our production or in other aspects of our customers’ products may become subject to allocation because of shortages of these materials and components. Future shortages of materials and components, including potential supply constraints of silicon, could cause delayed shipments, customer dissatisfaction, and lower revenue.
Customer payment defaults could adversely affect our timing of revenue recognition.
We use fixed-term license agreements as standard business practices with customers we believe are creditworthy. These multi-year, multi-element term license agreements have payments spread over the license term and are typically about three years in length for semiconductor companies and about four years in length for military and aerospace companies. The complexity of these agreements tends to increase the risk associated with collectibility from customers that can arise for a variety of reasons including ability to pay, product dissatisfaction, and disputes. If we are unable to collect under these agreements, our results of operations could be materially adversely impacted. We use these fixed-term license agreements as a standard business practice and have a history of successfully collecting under the original payment terms without making concessions on payments, products, or services. If we no longer had a history of collecting without providing concessions on the terms of the agreements, then revenue would be required to be recognized under U.S. generally accepted accounting principles as the payments become due and payable over the license term. This change could have a material adverse impact on our near-term results.
IC and printed circuit board (PCB) technology evolves rapidly.
The complexity of ICs and PCBs continues to rapidly increase. In response to this increasing complexity, new design tools and methodologies must be invented or acquired quickly to remain competitive. If we fail to quickly respond to new technological developments, our products could become obsolete or uncompetitive, which could materially adversely impact our business.
Errors or defects in our products and services could expose us to liability and harm our reputation.
Our customers use our products and services in designing and developing products that involve a high degree of technological complexity and have unique specifications. Due to the complexity of the systems and products with which we work, some of our products and designs can be adequately tested only when put to full use in the marketplace. As a result, our customers or their end users may discover errors or defects in our software, or the products or systems designed with or manufactured using tools that may not operate as expected. Errors or defects could result in:
| | • | | Loss of current customers and loss of, or delay in, revenue and loss of market share; |
| | • | | Failure to attract new customers or achieve market acceptance; |
| | • | | Diversion of development resources to resolve the problems resulting from errors or defects; and |
| | • | | Increased support or service costs. |
In addition, we include limited amounts of third-party technology in our products and we rely on those third parties to provide support services to us. Failure of those third parties to provide necessary support services could materially adversely impact our business.
10
Long sales cycles and delay in customer completion of projects make the timing of our revenues difficult to predict.
We have a lengthy sales cycle. A lengthy customer evaluation and approval process is generally required due to the complexity and expense associated with our products and services. Consequently, we may incur substantial expenses and devote significant management effort and expense to develop potential relationships that do not result in agreements or revenues and may prevent us from pursuing other opportunities. In addition, sales of our products and services is sometimes discretionary and may be delayed if customers delay approval or commencement of projects due to budgetary constraints, internal acceptance review procedures, timing of budget cycles, or timing of competitive evaluation processes.
Any loss of our leadership position in certain segments of the EDA market could harm our business.
The industry in which we compete is characterized by very strong leadership positions in specific segments of the EDA market. For example, one company may have a large percentage of sales in the physical verification segment of the market while another may have a similarly strong position in mixed-signal simulation. These strong leadership positions can be maintained for significant periods of time as the software is difficult to master and customers are disinclined to make changes once their employees, as well as others in the industry, have developed familiarity with a particular software product. For these reasons, much of our profitability arises from niche areas in which we are the leader. Conversely, it is difficult for us to achieve significant profits in niche areas where other companies are the leaders. If for any reason we lose our leadership position in a niche, we could be materially adversely impacted.
Accounting rules governing revenue recognition are complex and may change.
The accounting rules governing software revenue recognition are complex and have been subject to authoritative interpretations that have generally made it more difficult to recognize software revenues at the beginning of the license period.
We may have additional tax liabilities.
Significant judgments and estimates are required in determining the provision for income taxes and other tax liabilities. Our tax expense may be impacted if our intercompany transactions, which are required to be computed on an arm’s-length basis, are challenged and successfully disputed by the tax authorities. Also, our tax expense could be impacted depending on the applicability of withholding taxes on software licenses and related intercompany transactions in certain jurisdictions. In determining the adequacy of income taxes, we assess the likelihood of adverse outcomes resulting from the Internal Revenue Service (IRS) and other tax authorities’ examinations. The IRS and tax authorities in countries where we do business regularly examine our tax returns. The ultimate outcome of these examinations cannot be predicted with certainty. Should the IRS or other tax authorities assess additional taxes as a result of examinations, we may be required to record charges to operations that could have a material impact on the results of operations, financial position, or cash flows.
Forecasting our income tax rate is complex and subject to uncertainty.
The computation of income tax expense (benefit) is complex as it is based on the laws of numerous taxing jurisdictions and requires significant judgment on the application of complicated rules governing accounting for tax provision under U.S. generally accepted accounting principles. Income tax expense (benefit) for interim quarters is based on a forecast of our global tax rate for the year, which includes forward looking financial projections, including the expectations of profit and loss by jurisdiction, and contains numerous assumptions. Various items cannot be accurately forecasted, and may be treated as discrete accounting. Examples of items which could cause variability in the rate include tax deductions for stock option expense, application of transfer pricing rules, and changes in our valuation allowance for deferred tax assets. Future events, such as changes in our business and the tax law in the jurisdictions where we do business, could also affect our rate. For these reasons, our global tax rate may be materially different than our forecast.
There are limitations on the effectiveness of controls.
We do not expect that disclosure controls or internal control over financial reporting will prevent all errors and all fraud. A control system, no matter how well designed and operated, can provide only reasonable, not absolute, assurance that the control system’s objectives will be met. Further, the design of a control system must reflect the fact that there are resource constraints and the benefits of controls must be considered relative to their costs. Because of the inherent limitations in all control systems, no evaluation of controls can provide absolute assurance that all control issues and instances of fraud, if any, have been detected. Failure of our control systems to prevent error or fraud could materially adversely impact us.
11
We may not realize revenues as a result of our investments in research and development.
We incur substantial expense to develop new software products. Research and development activities are often performed over long periods of time. This effort may not result in a successful product offering. As a result, we could realize little or no revenues related to our investment in research and development.
We may acquire other companies and may not successfully integrate them.
The industry in which we compete has experienced significant consolidation in recent years. During this period, we have acquired numerous businesses and have frequently been in discussions with potential acquisition candidates, and we may acquire other businesses in the future. While we expect to carefully analyze all potential transactions before committing to them, we cannot assure that any completed transaction will result in long-term benefits to us or our shareholders or that we will be able to manage the acquired businesses effectively. In addition, growth through acquisition involves a number of risks. If any of the following events occurs after we acquire another business, it could materially adversely impact us:
| | • | | Difficulties in combining previously separate businesses into a single unit; |
| | • | | The substantial diversion of management’s attention from ongoing business when integrating the acquired business; |
| | • | | The failure to realize anticipated benefits, such as cost savings and increases in revenues; |
| | • | | The failure to retain key personnel of the acquired business; |
| | • | | Difficulties related to assimilating the products of an acquired business in, for example, distribution, engineering, and customer support areas; |
| | • | | Unanticipated liabilities or litigation in connection with or as a result of an acquisition, including claims from terminated employees, customers, or third parties; |
| | • | | Adverse impacts on existing relationships with suppliers and customers; and |
| | • | | Failure to understand and compete effectively in markets in which we have limited experience. |
Acquired businesses may not perform as projected, which could result in impairment of acquisition-related intangible assets. Additional challenges include integration of sales channels, training and education of the sales force for new product offerings, integration of product development efforts, integration of systems of internal controls, and integration of information systems. Accordingly, in any acquisition there will be uncertainty as to the achievement and timing of projected synergies, cost savings, and sales levels for acquired products. All of these factors could impair our ability to forecast, meet revenues and earnings targets, and manage effectively our business for long-term growth. We cannot assure that we can effectively meet these challenges.
We may not adequately protect our proprietary rights or we may fail to obtain software or other intellectual property licenses.
Our success depends, in large part, upon our proprietary technology. We generally rely on patents, copyrights, trademarks, trade secret laws, licenses, and restrictive agreements to establish and protect our proprietary rights in technology and products. Despite precautions we may take to protect our intellectual property, we cannot assure that third parties will not try to challenge, invalidate, or circumvent these protections. The companies in the EDA industry, as well as entities and persons outside the industry, are obtaining patents at a rapid rate. We cannot predict if any of these patents will cover any of our products. In addition, many of these entities have substantially larger patent portfolios than we have. As a result, we may on occasion be forced to engage in costly patent litigation to protect our rights or defend our customers’ rights. We may also need to settle these claims on terms that are unfavorable; such settlements could result in the payment of significant damages or royalties, or force us to stop selling or redesign one or more products. We cannot assure that the rights granted under our patents will provide us with any competitive advantage, that patents will be issued on any of our pending applications, or that future patents will be sufficiently broad to protect our technology. Furthermore, the laws of foreign countries may not protect our proprietary rights in those countries to the same extent as U.S. law protects these rights in the U.S.
12
Some of our products include software or other intellectual property licensed from third parties, and we may have to seek new licenses or renew existing licenses for software and other intellectual property in the future. Failure to obtain software or other intellectual property licenses or rights from third parties on favorable terms could materially adversely impact us.
Our use of open source software could negatively impact our ability to sell our products and may subject us to unanticipated obligations.
The products, services or technologies we acquire, license, provide or develop may incorporate or use open source software. We monitor our use of open source software in an effort to avoid unintended consequences, such as reciprocal license grants, patent retaliation clauses, and the requirement to license our products at no cost. Nevertheless, we may be subject to unanticipated obligations regarding our products which incorporate open source software.
Our failure to attract and retain key employees may harm us.
We depend on the efforts and abilities of our senior management, our research and development staff, and a number of other key management, sales, support, technical, and services personnel. Competition for experienced, high-quality personnel is intense, and we cannot assure that we can continue to recruit and retain such personnel. Our failure to hire and retain such personnel could impair our ability to develop new products and manage our business effectively.
We have global sales and research and development offices in parts of the world that are not as politically stable as the United States.
We have global sales and research and development offices, some of which are in parts of the world that are not as politically stable as the United States. In particular our offices in Egypt and Pakistan may be subject to disruption or closure from time to time. As a result, we may face a greater risk of business interruption as a result of potential unrest, terrorist acts, or military conflicts than businesses located domestically.
Oregon law and our shareholder rights plan may have anti-takeover effects.
The Oregon Control Share Act and the Business Combination Act limit the ability of parties who acquire a significant amount of voting stock to exercise control over us. These provisions may have the effect of lengthening the time required to acquire control of us through a proxy contest or the election of a majority of the Board of Directors. In June 2010, we adopted a shareholder rights plan, which has the effect of making it more difficult for a person to acquire control of us in a transaction not approved by our board of directors. The provisions of the Oregon Control Share Act and the Business Combination Act and our shareholder rights plan could have the effect of delaying, deferring, or preventing a change of control of us, could discourage bids for our common stock at a premium over the market price of our common stock and could materially adversely impact the market price of, and the voting and other rights of the holders of, our common stock.
Our revolving credit facility has financial and non-financial covenants, and default of any covenant could materially adversely impact us.
Our bank revolving credit facility imposes operating restrictions on us in the form of financial and non-financial covenants. Financial covenants include adjusted quick ratio, minimum tangible net worth, leverage ratio, senior leverage ratio, and minimum cash and accounts receivable ratio. If we were to fail to comply with the financial covenants and did not obtain a waiver from our lenders, we would be in default under the revolving credit facility and our lenders could terminate the facility and demand immediate repayment of all outstanding loans under the revolving credit facility. The declaration of an event of default could have a material adverse effect on our financial condition. We could also find it difficult to obtain other bank lines or credit facilities on comparable terms.
Our bank revolving credit facility terminates June 1, 2011. We could find it difficult to obtain comparable terms on a new revolving credit facility.
13
We have a substantial level of indebtedness.
As of January 31, 2011, we had $231.9 million of outstanding indebtedness, which includes $196.5 million of 6.25% Convertible Subordinated Debentures (6.25% Debentures) due 2026, $18.5 million under a term loan, $15.6 million in short-term borrowings, and $1.3 million in other notes payable. This level of indebtedness among other things could:
| | • | | Make it difficult for us to satisfy our payment obligations on our debt; |
| | • | | Make it difficult for us to incur additional indebtedness or obtain any necessary financing in the future for working capital, capital expenditures, debt service, acquisitions, or general corporate purposes; |
| | • | | Limit our flexibility in planning for or reacting to changes in our business; |
| | • | | Reduce funds available for use in our operations; |
| | • | | Make us more vulnerable in the event of a downturn in our business; |
| | • | | Make us more vulnerable in the event of an increase in interest rates if we must incur new debt to satisfy our obligations under the 6.25% Debentures and term loan; and |
| | • | | Place us at a possible competitive disadvantage relative to less leveraged competitors and competitors that have greater access to capital resources. |
We may also be unable to borrow funds as a result of an inability of financial institutions to lend due to restrictive lending policies and/or institutional liquidity concerns.
If we experience a decline in revenues, we could have difficulty paying amounts due on our indebtedness. Any default under our indebtedness could have a material adverse impact on our business, operating results, and financial condition.
Our stock price could become more volatile, and your investment could lose value.
All of the factors discussed in this “Risk Factors” section could affect our stock price. The timing of announcements in the public market regarding new products, product enhancements, or technological advances by our competitors or us, and any announcements by us of acquisitions, major transactions, or management changes could also affect our stock price. Our stock price is subject to speculation in the press and the analyst community, changes in recommendations or earnings estimates by financial analysts, changes in investors’ or analysts’ valuation measures for our stock, our credit ratings, and market trends unrelated to our performance. A significant drop in our stock price could also expose us to the risk of securities class actions lawsuits, which could result in substantial costs and divert management’s attention and resources, which could adversely affect our business.
Our business could be negatively affected as a result of a proxy fight and the actions of activist shareholders.
We recently received a notice from Icahn Partners LP and certain of its affiliates that announces their intent to nominate three individuals for election to our Board of Directors and to propose to amend our bylaws. Subsequently, we received an unsolicited conditional proposal from Carl Icahn and certain of his affiliated entities to purchase all of the outstanding shares of our company. If a proxy contest results from this notice or proposal or if other activist activities continue, our business could be adversely affected because:
| | • | | Responding to proxy contests and other actions by activist shareholders can be costly and time-consuming, disrupting our operations and diverting the attention of management and our employees; |
| | • | | Perceived uncertainties as to our future direction may result in the loss of potential business opportunities, and may make it more difficult to attract and retain qualified personnel and business partners; and |
| | • | | If individuals are elected to our Board of Directors with a specific agenda, it may adversely affect our ability to effectively and timely implement our strategic plans. |
14
| Item 1B. | Unresolved Staff Comments |
None.
We own six buildings on 43 acres of land in Wilsonville, Oregon. We occupy approximately 405,000 square feet in four of those buildings, as our corporate headquarters. We also own an additional 69 acres of undeveloped land adjacent to our headquarters. Most administrative functions and a significant amount of our domestic research and development operations are located at the Wilsonville site. We also own three buildings totaling 196,000 square feet in Fremont, California which house research and development, sales and administrative staff.
We lease additional space in Longmont, Colorado; Redmond, Washington; Huntsville and Mobile, Alabama; and Marlboro and Waltham, Massachusetts where some of our domestic research and development takes place; and in various locations throughout the United States and in other countries, primarily for sales and customer service operations. Additional research and development is done in locations outside the United States including locations in Armenia, Egypt, France, India, Israel, Pakistan, Poland, Sweden, Finland, Germany, Russia, Hungary, Austria, Taiwan, and the United Kingdom. We believe that we will be able to renew or replace our existing leases as they expire and that our current facilities will be adequate through at least the year ending January 31, 2012.
From time to time, we are involved in various disputes and litigation matters that arise from the ordinary course of business. These include disputes and lawsuits relating to intellectual property rights, licensing, contracts, and employee relations matters.
The Company is currently engaged in patent litigation in Japan and federal court in the U.S. with EVE SA (EVE), a provider of emulation products and services. The Company is the plaintiff in these legal actions and seeks injunctions and damages from EVE. There can be no assurance that this litigation will be successful or result in a positive outcome for the Company.
We believe that the outcome of current litigation, individually and in the aggregate, will not have a material effect on our financial position or results of operations.
15
| Item 4. | (Removed and Reserved) |
EXECUTIVE OFFICERS OF THE REGISTRANT
The following are the executive officers of Mentor Graphics Corporation:
| | | | |
Name | | Position | | Age |
| Walden C. Rhines | | Chairman of the Board and Chief Executive Officer | | 64 |
| Gregory K. Hinckley | | President and Director | | 64 |
| L. Don Maulsby | | Senior Vice President, World Trade | | 59 |
| Brian Derrick | | Vice President, Corporate Marketing | | 47 |
| Dean Freed | | Vice President, General Counsel and Secretary | | 52 |
| Alan J. Friedman | | Vice President, Human Resources | | 63 |
The executive officers are elected by our Board of Directors annually. Officers hold their positions until they resign, are terminated, or their successors are elected. There are no arrangements or understandings between the officers or any other person pursuant to which officers were elected. There are no family relationships among any of our executive officers or directors.
Dr. Rhines has served as our Chairman of the Board and Chief Executive Officer since 2000. Dr. Rhines served as our Director, President, and Chief Executive Officer from 1993 to 2000. Dr. Rhines is currently a director of Triquint Semiconductor, Inc., a semiconductor manufacturer, and served as director of Cirrus Logic, Inc., also a semiconductor manufacturer, from 1995 to 2009.
Mr. Hinckley has served as our President, Chief Operating Officer, and Director since 2000. Mr. Hinckley has served as our Chief Financial Officer since 2008. He has primary responsibility for the operations of our corporate centers, sales, and research and development divisions. Mr. Hinckley is a director of Intermec Inc., a provider of integrated systems solutions, Super Micro Computer, Inc., a server board, chassis, and server systems supplier, and SI Bone, Inc., a privately held medical device company, and served as a director of Amkor Technology, Inc., a provider of semiconductor packaging and test services, from 1997 to 2007.
Mr. Maulsby has served as our Senior Vice President, World Trade since 1999.
Mr. Derrick has served as our Vice President, Corporate Marketing since 2002. From 2000 to 2001 he was Vice President and General Manager of our Physical Verification Division. Since 2008, Mr. Derrick has served as a director of Calypto Design Systems, Inc., a sequential analysis technology company.
Mr. Freed has served as our Vice President, General Counsel, and Secretary since 1995.
Mr. Friedman has served as our Vice President, Human Resources since 2009. From 2001 to 2009, Mr. Friedman was the Senior Vice President, People for Novell, Inc., an integrated IT management software company.
16
PART II
| Item 5. | Market for the Registrant’s Common Equity, Related Stockholder Matters, and Issuer Purchases of Equity Securities |
Our common stock trades on The NASDAQ Global Select Market under the symbol “MENT.” The following table sets forth for the periods indicated the high and low sales prices for our common stock, as reported by The NASDAQ Global Select Market:
| | | | | | | | | | | | | | | | |
Quarter ended | | April 30 | | | July 31 | | | October 31 | | | January 31 | |
Fiscal 2011 | | | | | | | | | | | | | | | | |
High | | $ | 9.59 | | | $ | 9.95 | | | $ | 11.09 | | | $ | 12.85 | |
Low | | $ | 7.60 | | | $ | 7.81 | | | $ | 8.76 | | | $ | 10.42 | |
| | | | |
Quarter ended | | April 30 | | | July 31 | | | October 31 | | | January 31 | |
Fiscal 2010 | | | | | | | | | | | | | | | | |
High | | $ | 6.86 | | | $ | 7.34 | | | $ | 9.55 | | | $ | 9.25 | |
Low | | $ | 3.44 | | | $ | 5.09 | | | $ | 7.26 | | | $ | 7.16 | |
As of March 11, 2011, we had 556 stockholders of record.
No dividends were paid in fiscal 2011 or fiscal 2010. Our revolving credit facility prohibits the payment of dividends.
17
The following graph compares the cumulative 5-year total stockholder return on our common stock relative to the cumulative total return of the S&P Application Software index, and the NASDAQ Market index.
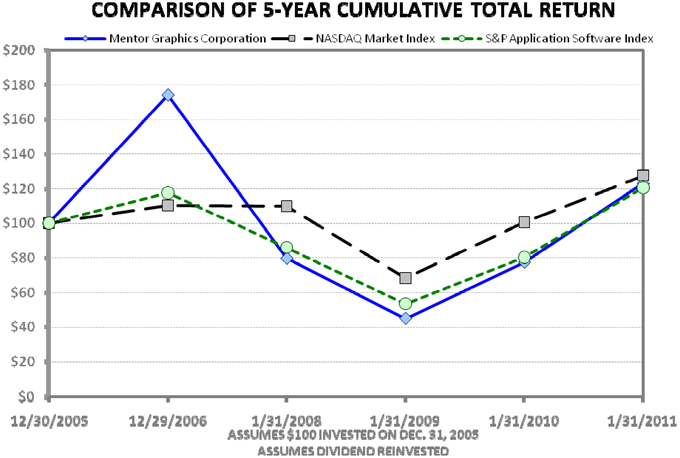
Note: the stock price shown on the above graph is not necessarily indicative of future performance
| | | | | | | | | | | | | | | | | | | | | | | | |
| | | Period Ending | | | | |
Company/Market/Peer Group | | 12/30/2005 | | | 12/29/2006 | | | 1/31/2008 | | | 1/31/2009 | | | 1/31/2010 | | | 1/31/2011 | |
Mentor Graphics Corporation | | $ | 100.00 | | | $ | 174.37 | | | $ | 79.79 | | | $ | 45.07 | | | $ | 77.56 | | | $ | 123.16 | |
NASDAQ Market Index | | $ | 100.00 | | | $ | 110.26 | | | $ | 109.86 | | | $ | 68.46 | | | $ | 100.56 | | | $ | 127.64 | |
S&P Application Software Index | | $ | 100.00 | | | $ | 117.52 | | | $ | 86.17 | | | $ | 53.58 | | | $ | 80.45 | | | $ | 120.58 | |
18
| Item 6. | Selected Consolidated Financial Data |
In thousands, except percentages and per share data
| | | | | | | | | | | | | | | | | | | | |
Year ended | | January 31,
2011 | | | January 31,
2010 | | | January 31,
2009 | | | January 31,
2008(1) | | | December 31,
2006 | |
Statement of Operations Data | | | | | | | | | | | | | | | | | | | | |
Total revenues | | $ | 914,753 | | | $ | 802,727 | | | $ | 789,101 | | | $ | 879,732 | | | $ | 802,839 | |
Operating income (loss) | | $ | 52,539 | | | $ | (1,167 | ) | | $ | (65,558 | ) | | $ | 72,366 | | | $ | 62,290 | |
Net income (loss) | | $ | 28,584 | | | $ | (21,889 | ) | | $ | (91,252 | ) | | $ | 24,309 | | | $ | 25,131 | |
Gross margin percent | | | 85 | % | | | 85 | % | | | 84 | % | | | 85 | % | | | 86 | % |
Operating income (loss) as a percent of revenues | | | 6 | % | | | 0 | % | | | (8 | %) | | | 8 | % | | | 8 | % |
| | | | | |
Per Share Data | | | | | | | | | | | | | | | | | | | | |
Net income (loss) per share – basic | | $ | 0.27 | | | $ | (0.23 | ) | | $ | (0.99 | ) | | $ | 0.28 | | | $ | 0.31 | |
Net income (loss) per share – diluted | | $ | 0.26 | | | $ | (0.23 | ) | | $ | (0.99 | ) | | $ | 0.27 | | | $ | 0.30 | |
Weighted average number of shares outstanding – basic | | | 107,743 | | | | 96,474 | | | | 91,829 | | | | 88,086 | | | | 81,303 | |
Weighted average number of shares outstanding – diluted | | | 109,861 | | | | 96,474 | | | | 91,829 | | | | 89,981 | | | | 82,825 | |
| | | | | |
As of | | January 31,
2011 | | | January 31,
2010 | | | January 31,
2009 | | | January 31,
2008(1) | | | December 31,
2006 | |
Balance Sheet Data | | | | | | | | | | | | | | | | | | | | |
Cash, cash equivalents, and short-term investments | | $ | 133,113 | | | $ | 99,343 | | | $ | 95,639 | | | $ | 126,215 | | | $ | 129,857 | |
Working capital | | $ | 178,898 | | | $ | 71,416 | | | $ | 101,680 | | | $ | 187,082 | | | $ | 111,692 | |
Property, plant, and equipment, net | | $ | 139,340 | | | $ | 121,795 | | | $ | 100,991 | | | $ | 100,421 | | | $ | 86,100 | |
Total assets | | $ | 1,427,798 | | | $ | 1,223,041 | | | $ | 1,186,070 | | | $ | 1,237,656 | | | $ | 1,125,566 | |
Short-term borrowings and current portion of notes payable | | $ | 17,544 | | | $ | 70,146 | | | $ | 36,998 | | | $ | 14,178 | | | $ | 7,181 | |
Long-term portion of notes payable, deferred revenue, and other noncurrent liabilities | | $ | 291,377 | | | $ | 223,827 | | | $ | 283,505 | | | $ | 264,165 | | | $ | 247,950 | |
Stockholders’ equity | | $ | 776,714 | | | $ | 640,017 | | | $ | 586,445 | | | $ | 654,182 | | | $ | 554,206 | |
| (1) | On July 19, 2006, we changed our fiscal year to January 31 from December 31, effective for the year ended January 31, 2008. We believe that the twelve months ended December 31, 2006 provides a meaningful comparison to the years ended January 31, 2011, 2010, 2009, and 2008. There are no factors, of which we are aware, seasonal or otherwise, that would impact the comparability of information or trends, if results for the twelve months ended January 31, 2007 were presented in lieu of the results for the twelve months ended December 31, 2006. |
19
| Item 7. | Management’s Discussion and Analysis of Financial Condition and Results of Operations |
Unless otherwise indicated, numerical references are in millions, except for percentages and per share data.
OVERVIEW
The following discussion should be read in conjunction with the consolidated financial statements and notes included elsewhere in this Form 10-K. Certain of the statements below contain forward-looking statements. These statements are predictions based upon our current expectations about future trends and events. Actual results could vary materially as a result of certain factors, including but not limited to, those expressed in these statements. In particular, we refer you to the risks discussed in Part I, Item 1A. “Risk Factors” and in our other Securities and Exchange Commission filings, which identify important risks and uncertainties that could cause our actual results to differ materially from those contained in the forward-looking statements.
We urge you to consider these factors carefully in evaluating the forward-looking statements contained in this Form 10-K. All subsequent written or spoken forward-looking statements attributable to our company or persons acting on our behalf are expressly qualified in their entirety by these cautionary statements. The forward-looking statements included in this Form 10-K are made only as of the date of this Form 10-K. We do not intend, and undertake no obligation, to update these forward-looking statements.
THE COMPANY
We are a supplier of electronic design automation (EDA) systems — advanced computer software and emulation hardware systems used to automate the design, analysis, and testing of electronic hardware and embedded systems software in electronic systems and components. We market our products and services worldwide, primarily to large companies in the military/aerospace, communications, computer, consumer electronics, semiconductor, networking, multimedia, and transportation industries. Through the diversification of our customer base among these various customer markets, we attempt to reduce our exposure to fluctuations within each market. We sell and license our products through our direct sales force and a channel of distributors and sales representatives. In addition to our corporate offices in Wilsonville, Oregon, we have sales, support, software development, and professional service offices worldwide.
We focus on products and design platforms where we have leading market share, enabling us to spend more effort to cause adoption of our technology in new applications, especially for new markets in which EDA companies have not participated. We believe this strategy leads to a more diversified product and customer mix and can help reduce the volatility of our business and our credit risk while increasing our potential for growth. System customers make up a much larger percentage of our business than that of most of our EDA competitors.
We derive system and software revenues primarily from the sale of term software license contracts, which are typically three to four years in length. We generally recognize revenue for these arrangements upon product delivery at the beginning of the license term. Larger enterprise-wide customer contracts, which typically represent as much as 50% of our system and software revenue, drive the majority of our period-to-period revenue variances. We identify term licenses where collectibility is not probable and recognize revenue on those licenses when cash is received. Ratable license revenues also include short-term term licenses as well as other term licenses where we provide the customer with rights to unspecified or unreleased future products. For these reasons, the timing of large contract renewals, customer circumstances, and license terms are the primary drivers of revenue changes from period to period, with revenue changes also being driven by new contracts and increases in the capacity of existing contracts, to a lesser extent.
The EDA industry is competitive and is characterized by very strong leadership positions in specific segments of the EDA market. These strong leadership positions can be maintained for significant periods of time as the software can be difficult to master and customers are disinclined to make changes once their employees, as well as others in the industry, have developed familiarity with a particular software product. For these reasons, much of our profitability arises from areas in which we are the leader. We will continue our strategy of developing high quality tools with number one market share potential, rather than being a broad-line supplier with undifferentiated product offerings. This strategy allows us to focus investment in areas where customer needs are greatest and where we have the opportunity to build significant market share.
20
Our products and services are dependent to a large degree on new design projects initiated by customers in the integrated circuit and electronics system industries. These industries can be cyclical and are subject to constant and rapid technological change, rapid product obsolescence, price erosion, evolving standards, short product life cycles, and wide fluctuations in product supply and demand. Furthermore, extended economic downturns can result in reduced funding for development due to downsizing and other business restructurings. These pressures are offset by the need for the development and introduction of next generation products once an economic recovery occurs.
Our revenue has historically fluctuated quarterly and has generally been the highest in the fourth quarter of our fiscal year due to our customers’ corporate calendar year-end spending trends and the timing of contract renewals.
Known Trends and Uncertainties Impacting Future Results of Operations
Our top ten accounts make up approximately 40% of our receivables, including both short and long-term balances and we have not experienced and do not presently expect to experience collection issues with these customers. Net of reserves, we have no receivables greater than 60 days past due, and continue to experience no difficulty in factoring our higher quality receivables.
Bad debt expense recorded for the year ended January 31, 2011 was not material. However, we do have exposures within our receivables portfolio to customers with weak credit ratings. These receivables balances do not represent a material portion of our portfolio but could have a material adverse effect on earnings in any given quarter, should additional allowances for doubtful accounts be necessary.
A multi-quarter increase or decrease in service and support revenue can be an early indicator that our business is either strengthening or weakening. Our experience is that customers will scale back on the purchase of outsourcing services in times of economic decline or weakness. For the year ended January 31, 2011 and the last six months of fiscal 2010, we noted an increase in software maintenance revenues.
Bookings during the year ended January 31, 2011 increased by approximately 30% compared to fiscal 2010. Bookings are the value of executed orders during a period for which revenue has been or will be recognized within six months for products and within twelve months for professional services and training. The ten largest transactions for fiscal 2011 and fiscal 2010 accounted for approximately 40% of total system and software bookings. The number of new customers for fiscal 2011, excluding PADS (our ready to use printed circuit board design tools) increased approximately 10% from the levels experienced during fiscal 2010.
We are focused on continued expense control in the operation of our business. We have plans to reduce sales, general, and administrative expenses as a percentage of revenue over the next three fiscal years.
Product Developments
During the year ended January 31, 2011, we continued to execute our strategy of focusing on challenges encountered by customers, as well as building upon our well-established product families. We believe that customers, faced with leading-edge design challenges in creating new products, generally choose the best EDA products in each category to build their design environment. Through both internal development and strategic acquisitions, we have focused on areas where we believe we can build a leading market position or extend an existing leading market position.
We believe that the development and commercialization of EDA software tools is generally a three to five year process with limited customer adoption and sales in the first years of tool availability. Once tools are adopted, however, their life spans tend to be long. We introduced new products and upgrades to existing products during fiscal 2011, including solutions acquired as a result of the Valor Computerized Systems, Ltd. (Valor) acquisition which target the printed circuit board manufacturing market. During the year ended January 31, 2011, we did not have any significant products reaching the end of their useful economic life.
CRITICAL ACCOUNTING POLICIES
We base our discussion and analysis of our financial condition and results of operations upon our financial statements which have been prepared in accordance with U.S. generally accepted accounting principles. The preparation of these financial statements requires us to make estimates and judgments that affect the reported amounts of assets, liabilities, and contingencies as of the date of the financial statements and the reported amounts of revenues and expenses during the reporting periods. We evaluate our estimates on an on-going basis. We base our estimates on historical experience, current facts, and on various other assumptions that we believe to be reasonable under the circumstances, the results of which form the basis for making judgments about the carrying values of assets and liabilities and the recording of revenue, costs, and expenses that are not readily apparent from other sources. As future events and their effects cannot be determined with precision, actual results could differ from those estimates.
21
We believe that the accounting for revenue recognition, valuation of trade accounts receivable, valuation of deferred tax assets, income tax reserves, goodwill, intangible assets, long-lived assets, special charges, and accounting for stock-based compensation are the critical accounting estimates and judgments used in the preparation of our consolidated financial statements. For further information on our significant accounting policies, see Note 2. “Summary of Significant Accounting Policies” in Part II, Item 8. “Financial Statements and Supplementary Data.”
Revenue Recognition
We report revenue in two categories based on how the revenue is generated: (i) system and software and (ii) service and support.
System and software revenues – We derive system and software revenues from the sale of licenses of software products, emulation hardware systems, and finance fee revenues from our long-term installment receivables resulting from product sales. We primarily license our products using two different license types:
1. Term licenses – We use this license type primarily for software sales. This license type provides the customer with the right to use a fixed list of software products for a specified time period, typically three years, with payments spread over the license term, and does not provide the customer with the right to use the products after the end of the term. Term license arrangements may allow the customer to share products between multiple locations and remix product usage from the fixed list of products at regular intervals during the license term. We generally recognize product revenue from term license arrangements upon product delivery and start of the license term. In a term license agreement where we provide the customer with rights to unspecified or unreleased future products, we recognize revenue ratably over the license term. When all other criteria for revenue recognition have been met, we recognize revenue from emulation hardware system sales upon delivery.
2. Perpetual licenses – We use this license type for software and emulation hardware system sales. This license type provides the customer with the right to use the product in perpetuity and typically does not provide for extended payment terms. We generally recognize product revenue from perpetual license arrangements upon product delivery assuming all other criteria for revenue recognition have been met.
We include finance fee revenues from the accretion on the discount of long-term installment receivables in system and software revenues.
Service and support revenues – We derive service and support revenues from software and hardware post-contract maintenance or support services and professional services, which include consulting, training, and other services. We recognize support revenue ratably over the support services term. We record professional service revenue as the services are provided to the customer.
We apply the Financial Accounting Standards Board (FASB) guidance in Accounting Standards Codification 985 “Revenue Recognition – Software” to the sale of licenses of software products. Beginning February 1, 2010, we adopted FASB Accounting Standards Update (ASU) No. 2009-13 Revenue Recognition (Topic 605)- “Multiple-Deliverable Revenue Arrangements” and ASU No. 2009-14 Software (Topic 985)- “Certain Revenue Arrangements That Include Software Elements,” (together the ASUs). The adoption of the ASUs did not have a material impact to revenue in periods subsequent to adoption. However, it may result in recognition of revenue into periods earlier than revenue would have been recognized prior to the adoption of the ASUs. We apply the authoritative guidance in Topic 605 applicable to multiple-element arrangements to the sale of our emulation hardware systems that contain software components and non-software components that function together to deliver the hardware’s essential functionality.
22
We determine whether product revenue recognition is appropriate based upon the evaluation of whether the following four criteria have been met:
1. Persuasive evidence of an arrangement exists – Generally, we use either a customer signed contract or qualified customer purchase order as evidence of an arrangement for both term and perpetual licenses. For professional service engagements, we generally use a signed professional services agreement and a statement of work to evidence an arrangement. Sales through our distributors are evidenced by an agreement governing the relationship, together with binding purchase orders from the distributor on a transaction-by-transaction basis.
2. Delivery has occurred – We generally deliver software and the corresponding access keys to customers electronically. Electronic delivery occurs when we provide the customer access to the software. We may also deliver the software on a compact disc. With respect to emulation hardware systems, we transfer title to the customer upon shipment. Our software license and emulation hardware system agreements generally do not contain conditions for acceptance.
3. Fee is fixed or determinable – We assess whether a fee is fixed or determinable at the outset of the arrangement, primarily based on the payment terms associated with the transaction. We have established a history of collecting under the original contract with installment terms without providing concessions on payments, products, or services. Additionally, for installment contracts, we determine that the fee is fixed or determinable if the arrangement has a payment schedule that is within the term of the licenses and the payments are collected in equal or nearly equal installments, when evaluated on a cumulative basis. If the fee is not deemed to be fixed or determinable, we recognize revenue as payments become due and payable.
Significant judgment is involved in assessing whether a fee is fixed or determinable. We must also make these judgments when assessing whether a contract amendment to a term arrangement (primarily in the context of a license extension or renewal) constitutes a concession. Our experience has been that we are able to determine whether a fee is fixed or determinable for term licenses. If we no longer were to have a history of collecting under the original contract without providing concessions on term licenses, revenue from term licenses would be required to be recognized when payments under the installment contract become due and payable. Such a change could have a material impact on our results of operations.
4. Collectibility is probable – To recognize revenue, we must judge collectibility of the arrangement fees on a customer-by-customer basis pursuant to our credit review process. We typically sell to customers with whom there is a history of successful collection. We evaluate the financial position and a customer’s ability to pay whenever an existing customer purchases new products, renews an existing arrangement, or requests an increase in credit terms. For certain industries for which our products are not considered core to the industry or the industry is generally considered troubled, we impose higher credit standards. If we determine that collectibility is not probable based upon our credit review process or the customer’s payment history, we recognize revenue as payments are received.
Multiple element arrangements involving software licenses – For multiple element arrangements involving software and other software-related deliverables, vendor-specific objective evidence of fair value (VSOE) must exist to allocate the total fee among all delivered and non-essential undelivered elements of the arrangement. If undelivered elements of the arrangement are essential to the functionality of the product, we defer revenue until the essential elements are delivered. If VSOE does not exist for one or more non-essential undelivered elements, we defer revenue until such evidence exists for the undelivered elements, or until all elements are delivered, whichever is earlier. If VSOE of all non-essential undelivered elements exist but VSOE does not exist for one or more delivered elements, we recognize revenue using the residual method. Under the residual method, we defer revenue related to the undelivered elements based upon VSOE and we recognize the remaining portion of the arrangement fee as revenue for the delivered elements, assuming all other criteria for revenue recognition are met. If we could no longer establish VSOE for non-essential undelivered elements of multiple element arrangements, we would be required to defer revenue until all elements are delivered or VSOE was established for the undelivered elements, whichever is earlier.
We base our VSOE for certain product elements of an arrangement upon the pricing in comparable transactions when the element is sold separately. We primarily base our VSOE for term and perpetual support services upon customer renewal history where the services are sold separately. We also base VSOE for professional services and training upon the price charged when the services are sold separately.
Prior to February 1, 2010, for emulation hardware systems where the software was determined to be more than incidental under prior authoritative guidance, we recognized revenue consistent with the discussion above for multiple element arrangements involving software licenses.
23
Multiple element arrangements involving hardware – Effective February 1, 2010, for multiple element arrangements involving our emulation hardware systems, we allocate revenue to each element based on the relative selling price of each deliverable. In order to meet the separation criteria to allocate revenue to each element we must determine the standalone selling price of each element using a hierarchy of evidence. The authoritative guidance requires that, in the absence of VSOE or third-party evidence (TPE), a company must develop an estimated selling price (ESP). ESP is defined as the price at which the vendor would transact if the deliverable was sold by the vendor regularly on a standalone basis. The vendor should consider market conditions as well as entity-specific factors when estimating a selling price.
When VSOE or TPE does not exist, we base our ESP for certain elements in arrangements on either costs incurred to manufacture a product plus a reasonable profit margin or standalone sales to similar customers. In determining profit margins, we consider current market conditions, pricing strategies related to the class of customer, and the level of penetration we have with the customer. In other cases, we may have limited sales on a standalone basis to the same or similar customers and/or guaranteed pricing on future purchases of the same item. If we are not able to develop ESP for one or more elements or we are unable to demonstrate value on a standalone basis of an element, we could be required to combine elements which could impact the timing of revenue recognition if not delivered together. We no longer apply the residual method for hardware arrangements.
Valuation of Trade Accounts Receivable
We maintain allowances for doubtful accounts on trade accounts receivable and term receivables, long-term for estimated losses resulting from the inability of our customers to make required payments. We regularly evaluate the collectibility of our trade accounts receivable based on a combination of factors. When we become aware of a specific customer’s inability to meet its financial obligations, such as in the case of bankruptcy or deterioration in the customer’s operating results, financial position, or credit rating, we record a specific reserve for bad debt to reduce the related receivable to the amount believed to be collectible. We also record unspecified reserves for bad debt for all other customers based on a variety of factors including length of time the receivables are past due, the financial health of the customers, the current business environment, and historical experience. Current economic conditions we have considered include forecasted spending in the semiconductor industry, consumer spending for electronics, integrated circuit research and development spending, and volatility in gross domestic product. If these factors change or circumstances related to specific customers change, we adjust the estimates of the recoverability of receivables resulting in either additional selling expense or a reduction in selling expense in the period such determination is made.
Valuation of Deferred Tax Assets
Deferred tax assets are recognized for deductible temporary differences, net operating loss carryforwards, and credit carryforwards if it is more likely than not that the tax benefits will be realized. We have considered future taxable income and ongoing prudent and feasible tax planning strategies in assessing the need for valuation allowances. We have recorded a valuation allowance to reduce our deferred tax assets to the amount that is more likely than not to be realized. In the event we determine that we would be able to realize our deferred tax assets in the future in excess of our net recorded amount, we would reverse the valuation allowance associated with such deferred tax assets in the period such determination was made. Also, if we were to determine that we would not be able to realize all or part of our net deferred tax assets in the future, we would record a valuation allowance on such net deferred tax assets with an offset to expense in the period such determination was made.
Income Tax Reserves
We are subject to income taxes in the United States (U.S.) and in numerous foreign jurisdictions, and in the ordinary course of business there are many transactions and calculations where the ultimate tax determination is uncertain. While we believe the positions we have taken are appropriate, we have reserves for taxes to address potential exposures involving tax positions that are being challenged or that could be challenged by taxing authorities. We recognize a tax position when we determine that it is more likely than not that the position is sustainable upon examination, including resolution of any related appeals or litigation processes, based on the technical merits of the position. For tax positions that are more likely than not to be sustained, we measure the tax position at the largest amount of benefit that has a greater than 50 percent likelihood of being realized when it is effectively settled. We review the tax reserves as circumstances warrant and adjust the reserves as events occur that affect our potential liability for additional taxes. We follow the applicable FASB guidance on derecognition, classification, interest and penalties, accounting in interim periods, disclosure, and transition with respect to tax positions. We reflect interest and penalties related to income tax liabilities as income tax expense.
24
Goodwill, Intangible Assets, and Long-Lived Assets
We review long-lived assets, including intangible assets with definite lives, for impairment whenever events or changes in circumstances indicate the carrying amount of such assets may not be recoverable. We assess the recoverability of our long-lived assets by determining whether their carrying values are greater than the forecasted undiscounted net cash flows of the related assets. If we determine the assets are impaired, we write down the assets to their estimated fair value. We determine fair value based on forecasted undiscounted net cash flows or appraised values, depending upon the nature of the assets. Significant management judgment is required in the forecasts of future operating results that are used in the undiscounted cash flow method of valuation. The estimates we have used are consistent with the plans and estimates that we use to manage our business. It is possible, however, that the plans may change and estimates used may prove to be inaccurate. If our actual results, or the plans and estimates used in future impairment analyses, are lower than the original estimates used to assess the recoverability of these assets, we could incur impairment charges.
We test goodwill and intangible assets with indefinite lives for impairment at least annually and whenever events or changes in circumstances indicate an impairment may exist. The value of our intangible assets, including goodwill, could be impacted by future adverse changes such as: (i) any future declines in our operating results, (ii) a decline in the valuation of technology company stocks, (iii) a significant slowdown in the worldwide economy or the semiconductor industry, or (iv) any failure to meet the performance projections included in our forecasts of future operating results. In the event that we determine that our goodwill, intangible assets, or other long-lived assets are impaired, we make an adjustment that results in a charge to earnings for the write-down in the period that determination is made.
Special Charges
We record restructuring charges within special charges in the consolidated statements of operations in connection with our plans to better align our cost structure with projected operations in the future. We have recorded restructuring charges in connection with employee rebalances based on estimates of the expected costs associated with severance benefits. If the actual cost incurred exceeds the estimated cost, an addition to special charges will be recognized. If the actual cost is less than the estimated cost, a benefit to special charges will be recognized.
We have also recorded restructuring charges in connection with excess leased facilities to offset future rent, net of estimated sublease income that could be reasonably obtained. Additionally, we also write-off leasehold improvements on abandoned office space. We work with external real estate experts in each of the markets where properties are located to develop assumptions used to determine a reasonable estimate of the net loss. Our estimates of expected sublease income could change based on factors that affect our ability to sublease those facilities such as general economic conditions and the local real estate market. If the real estate markets worsen and we are not able to sublease the properties as expected, an addition to special charges will be recognized in the period such determination is made. Likewise, if the real estate market strengthens and we are able to sublease the properties earlier or at more favorable rates than projected, a benefit to special charges will be recognized.
Accounting for Stock-Based Compensation
We measure stock-based compensation cost at the grant date, based on the fair value of the award, and recognize the expense on a straight-line basis over the employee’s requisite service period. For options and stock awards that vest fully on any termination of service, there is no requisite service period and consequently we recognize the expense fully in the period in which the award is granted.
We estimate the fair value of stock options and purchase rights under our employee stock purchase plans using a Black-Scholes option-pricing model. The Black-Scholes option-pricing model incorporates several highly subjective assumptions including expected volatility, expected term, and interest rates.
In reaching our determination of expected volatility for options we include the following elements:
| | • | | Historical volatility of our shares of common stock; |
| | • | | Historical volatility of shares of comparable companies; |
| | • | | Implied volatility of our traded options; and |
| | • | | Implied volatility of traded options of comparable companies. |
25
In reaching our determination of expected volatility for purchase rights under our employee stock plans, we use the historical volatility of our shares of common stock.
We base the expected term of our stock options on historical experience.
The input factors used in the valuation model are based on subjective future expectations combined with management judgment. If there is a difference between the assumptions used in determining stock-based compensation cost and the actual factors which become known over time, we may change the input factors used in determining stock-based compensation costs. These changes may materially impact the results of operations in the period such changes are made. In addition, if we were to modify any awards, additional charges would be taken.
RECENT BUSINESS COMBINATIONS
For each business we acquire, the excess of the fair value of the consideration transferred over the fair value of the net tangible assets acquired and net tangible liabilities assumed is allocated to various identifiable intangible assets and goodwill. Identifiable intangible assets typically consist of purchased technology and customer-related intangibles, which are amortized to expense over their useful lives. Goodwill, representing the excess of the purchase consideration over the fair value of net tangible and identifiable intangible assets, is not amortized.
Acquisitions during the year ended January 31, 2011
| | | | | | | | | | | | | | | | | | | | |
Acquisition | | Total
Consideration | | | Net Tangible
Assets
Acquired | | | Identifiable
Intangible
Assets
Acquired | | | Deferred Tax
Liability | | | Goodwill | |
Valor | | $ | 86.9 | | | $ | 47.4 | | | $ | 18.6 | | | $ | (11.6 | ) | | $ | 32.5 | |
CodeSourcery | | | 18.5 | | | | 2.0 | | | | 4.1 | | | | — | | | | 12.4 | |
Other | | | 7.7 | | | | — | | | | 2.2 | | | | — | | | | 5.5 | |
| | | | | | | | | | | | | | | | | | | | |
Total | | $ | 113.1 | | | $ | 49.4 | | | $ | 24.9 | | | $ | (11.6 | ) | | $ | 50.4 | |
| | | | | | | | | | | | | | | | | | | | |
On March 18, 2010, we acquired all of the outstanding common shares of Valor, a provider of productivity improvement software solutions for the printed circuit board manufacturing supply chain. The acquisition was an investment aimed at extending our scope into the market for printed circuit board systems manufacturing solutions. Under the terms of the merger agreement, Valor shareholders received 5.6 shares of our common stock and cash of $32.7. The common stock issued to the former common shareholders of Valor had a fair value of $47.2, based on our closing price on March 18, 2010 of $8.39 per share. Additionally, under the merger agreement, we converted Valor’s outstanding stock options into options to purchase shares of our common stock, resulting in additional consideration of $7.0. Included in net tangible assets acquired was the fair value of the Frontline investment of $29.5 and cash acquired of $27.1.
The identified intangible assets acquired consisted of purchase technology of $12.3 and other intangibles of $6.3. We are amortizing purchased technology to cost of revenues over three years and other intangibles to operating expenses over one to four years. The goodwill created by the transaction is not deductible for tax purposes. Key factors that make up the goodwill created by the transaction include expected synergies from the combination of operations and the knowledge and experience of the acquired workforce and infrastructure.
On November 5, 2010, we acquired the technology and certain other related assets of CodeSourcery, Inc. (Code Sourcery), a provider of open source GNU-based toolchains and services for advanced systems development. The acquisition was an investment aimed at increasing the value of our embedded solutions. Under the terms of the purchase agreement, total consideration consisted of $10.0 in cash at closing, deferred payments valued at $5.2, and contingent consideration with a fair value of $3.3. Payment of the contingent consideration is based upon the acquired business’ achievement of certain revenue goals. We have estimated the fair value of this contingent consideration as the present value of the expected contingent payments over the term of the arrangement. The total contingent payments cannot exceed $6.0 over the term of the arrangement.
The identified intangible assets acquired consisted of purchase technology of $0.5 and other intangibles of $3.6. We are amortizing purchased technology to cost of revenues over four years and other intangibles to operating expenses over one to five years. The goodwill created by the transaction is deductible for tax purposes. Key factors that make up the goodwill created by the transaction include expected synergies from the combination of operations and the knowledge and experience of the acquired workforce.
26
Other acquisitions for the year end January 31, 2011 consisted of three privately-held companies, which were not material individually or in the aggregate.
RESULTS OF OPERATIONS
Revenues and Gross Margins
| | | | | | | | | | | | | | | | | | | | |
Year ended January 31, | | 2011 | | | Change | | | 2010 | | | Change | | | 2009 | |
System and software revenues | | $ | 562.4 | | | | 17 | % | | $ | 479.5 | | | | 7 | % | | $ | 447.6 | |
System and software gross margin | | $ | 517.4 | | | | 16 | % | | $ | 444.9 | | | | 7 | % | | $ | 417.4 | |
Gross margin percent | | | 92 | % | | | | | | | 93 | % | | | | | | | 93 | % |
Service and support revenues | | $ | 352.4 | | | | 9 | % | | $ | 323.2 | | | | (5 | %) | | $ | 341.5 | |
Service and support gross margin | | $ | 256.7 | | | | 8 | % | | $ | 238.0 | | | | (3 | %) | | $ | 244.5 | |
Gross margin percent | | | 73 | % | | | | | | | 74 | % | | | | | | | 72 | % |
Total revenues | | $ | 914.8 | | | | 14 | % | | $ | 802.7 | | | | 2 | % | | $ | 789.1 | |
Total gross margin | | $ | 774.1 | | | | 13 | % | | $ | 682.9 | | | | 3 | % | | $ | 661.9 | |
Gross margin percent | | | 85 | % | | | | | | | 85 | % | | | | | | | 84 | % |
System and Software
| | | | | | | | | | | | | | | | | | | | |
Year ended January 31, | | 2011 | | | Change | | | 2010 | | | Change | | | 2009 | |
Upfront license revenues | | $ | 473.9 | | | | 17 | % | | $ | 406.5 | | | | 11 | % | | $ | 365.0 | |
Ratable license revenues | | | 88.5 | | | | 21 | % | | | 73.0 | | | | (12 | %) | | | 82.6 | |
| | | | | | | | | | | | | | | | | | | | |
Total system and software revenues | | $ | 562.4 | | | | 17 | % | | $ | 479.5 | | | | 7 | % | | $ | 447.6 | |
| | | | | | | | | | | | | | | | | | | | |
We derive system and software revenues from the sale of licenses of software products and emulation hardware systems, including finance fee revenues from our long-term installment receivables resulting from product sales. Upfront license revenues consist of perpetual licenses and term licenses for which we recognize revenue upon product delivery at the start of a license term. We identify term licenses where collectability is not probable and recognize revenue on those licenses when cash is received. Additionally, ratable license revenues also include short-term term licenses, term licenses where we provide the customer with rights to unspecified or unreleased future products, and finance fees from the accretion of the discount on long-term installment receivables.
Our top ten customers accounted for approximately 35% of system and software revenues for fiscal 2011 compared to approximately 45% for fiscal 2010 and approximately 35% for fiscal 2009. The decrease in percentage for fiscal 2011 from fiscal 2010 was due to revenue growth outside of the top ten customers in fiscal 2011.
System and software revenues increased for fiscal 2011 compared to fiscal 2010 as a result of an increase in perpetual license revenues of $32.0, due in part to an increase in emulation revenues; an increase in term license revenues of $26.5, driven by contract renewals in fiscal 2011 compared to fiscal 2010; and the effect of acquisitions completed in fiscal 2011 and fiscal 2010 of $25.2. System and software revenues increased for fiscal 2010 compared to fiscal 2009 primarily due to two large new transactions.
For fiscal 2011, fiscal 2010, and fiscal 2009, no single customer accounted for 10% or more of total revenues.
During fiscal 2011, system and software bookings exceeded system and software revenues. Accordingly, our backlog of firm orders for system and software increased significantly from $54.5 as of January 31, 2010 to $105.3 as of January 31, 2011. System and software revenues exceeded system and software bookings during fiscal 2010 as our backlog of firm orders decreased slightly from $55.5 as of January 31, 2009 to $54.5 as of January 31, 2010.
System and software gross margin percentage was lower for fiscal 2011 compared to fiscal 2010 primarily due to a change in product mix as a result of higher emulation hardware product revenues. Emulation hardware product revenues typically have lower gross margin percentages compared to our software product revenues. System and software gross margin percentage was flat for fiscal 2010 compared to fiscal 2009.
27
Amortization of purchased technology to system and software cost of revenues was $13.8 for fiscal 2011, $12.0 for fiscal 2010, and $12.4 for fiscal 2009. The increase in amortization for fiscal 2011 compared to fiscal 2010 and fiscal 2009 was due to new purchased technology from acquisitions completed during fiscal 2011 and the second half of fiscal 2010, partially offset by certain purchased technology being fully amortized during fiscal 2011 and fiscal 2010.
Service and Support
We derive service and support revenues from software and hardware post-contract maintenance or support services and professional services, which includes consulting, training, and other services. Professional services are a lower margin offering which is staffed according to fluctuations in demand. Support services operate under a less variable cost structure.
The increase in service and support revenues for fiscal 2011 compared to fiscal 2010 was driven by increased support revenues of $21.5 due to an increase in installed base, primarily resulting from the effect of acquisitions completed in fiscal 2011 and in fiscal 2010 of $12.8. Consulting and training revenues increased by $7.2 for fiscal 2011 compared to fiscal 2010 primarily due to increased customer demand for services. The decrease in service and support revenues of $18.3 for fiscal 2010 compared to fiscal 2009 was primarily as a result of the softening of the global economy as our customers scaled back on annual maintenance renewals and purchases of outsourced services. The decrease for fiscal 2010 from fiscal 2009 was partially offset by increased service and support revenues of $7.5 resulting from acquisitions during fiscal 2010 and fiscal 2009.
Service and support gross margin percentage decreased slightly for fiscal 2011 compared to fiscal 2010 primarily due to increased labor related costs. Service and support gross margin percentage increased for fiscal 2010 compared to fiscal 2009 as decreased costs more than offset the impact of a reduction in revenues. Lower costs in fiscal 2010 included reductions in outside services, headcount-related costs, travel, and infrastructure expenses.
Geographic Revenues Information
Revenue by Geography
| | | | | | | | | | | | | | | | | | | | |
Year ended January 31, | | 2011 | | | Change | | | 2010 | | | Change | | | 2009 | |
North America | | $ | 401.1 | | | | 17 | % | | $ | 342.8 | | | | 10 | % | | $ | 310.6 | |
Europe | | | 223.2 | | | | 9 | % | | | 205.5 | | | | (21 | %) | | | 261.0 | |
Japan | | | 124.3 | | | | 3 | % | | | 120.3 | | | | 4 | % | | | 115.2 | |
Pacific Rim | | | 166.2 | | | | 24 | % | | | 134.1 | | | | 31 | % | | | 102.3 | |
| | | | | | | | | | | | | | | | | | | | |
Total revenue | | $ | 914.8 | | | | 14 | % | | $ | 802.7 | | | | 2 | % | | $ | 789.1 | |
| | | | | | | | | | | | | | | | | | | | |
For fiscal 2011 and fiscal 2010, approximately one-third of European and substantially all Japanese revenues were subject to exchange fluctuations as they were booked in local currencies. For fiscal 2009, approximately one-fourth of European and approximately ninety percent of Japanese revenues were subject to exchange fluctuations. We recognize additional revenues in periods when the U.S. dollar weakens in value against foreign currencies. Likewise, we recognize lower revenues in periods when the U.S. dollar strengthens in value against foreign currencies.
Foreign currency had a favorable impact of $7.4 for fiscal 2011 compared to fiscal 2010 primarily as a result of the strengthening Japanese yen against the U.S. dollar. The effects of exchange rate differences from foreign currencies to the U.S. dollar were negligible for fiscal 2010 compared to fiscal 2009.
For additional description of how changes in foreign exchange rates affect our consolidated financial statements, see discussion in Part II, Item 7A., “Quantitative and Qualitative Disclosures About Market Risk–Foreign Currency Risk.”
28
Operating Expenses
| | | | | | | | | | | | | | | | | | | | |
Year ended January 31, | | 2011 | | | Change | | | 2010 | | | Change | | | 2009 | |
Research and development | | $ | 284.9 | | | | 11 | % | | $ | 255.5 | | | | (2 | %) | | $ | 260.3 | |
Marketing and selling | | | 320.8 | | | | 6 | % | | | 303.7 | | | | (4 | %) | | | 317.5 | |
General and administration | | | 100.4 | | | | 9 | % | | | 92.3 | | | | (3 | %) | | | 95.0 | |
Equity in earnings of Frontline | | | (2.1 | ) | | | — | | | | — | | | | — | | | | — | |
Amortization of intangible assets | | | 7.3 | | | | (35 | %) | | | 11.2 | | | | 1 | % | | | 11.1 | |
Special charges | | | 10.3 | | | | (52 | %) | | | 21.3 | | | | 26 | % | | | 16.9 | |
Impairment of long-lived assets | | | — | | | | — | | | | — | | | | (100 | %) | | | 4.6 | |
In-process research and development | | | — | | | | — | | | | — | | | | (100 | %) | | | 22.1 | |
| | | | | | | | | | | | | | | | | | | | |
Total operating expenses | | $ | 721.6 | | | | 5 | % | | $ | 684.0 | | | | (6 | %) | | $ | 727.5 | |
| | | | | | | | | | | | | | | | | | | | |
Selected Operating expenses as a percentage of Total Revenues
| | | | | | | | | | | | |
Year ended January 31, | | 2011 | | | 2010 | | | 2009 | |
Research and development | | | 31 | % | | | 32 | % | | | 33 | % |
Marketing and selling | | | 35 | % | | | 38 | % | | | 40 | % |
General and administration | | | 11 | % | | | 11 | % | | | 12 | % |
| | | | | | | | | | | | |
Total selected operating expenses | | | 77 | % | | | 81 | % | | | 85 | % |
| | | | | | | | | | | | |
Research and Development
Research and development expenses increased by $29.4 for fiscal 2011 compared to fiscal 2010 and decreased by $4.8 for fiscal 2010 compared to fiscal 2009. The components of these changes are summarized as follows:
| | | | | | | | |
| | | Change | |
Year ended January 31, | | 2011 vs 2010 | | | 2010 vs 2009 | |
Salaries, variable compensation, and benefits expenses | | $ | 20.1 | | | $ | (3.4 | ) |
Expenses associated with acquired businesses | | | 14.6 | | | | 6.0 | |
Stock based compensation | | | (3.1 | ) | | | (1.1 | ) |
Outside services expenses | | | (3.0 | ) | | | (2.0 | ) |
Travel expenses | | | 0.1 | | | | (2.0 | ) |
Other expenses | | | 0.7 | | | | (2.3 | ) |
| | | | | | | | |
Total change in research and development expenses | | $ | 29.4 | | | $ | (4.8 | ) |
| | | | | | | | |
Marketing and Selling
Marketing and selling expenses increased by $17.1 for fiscal 2011 compared to fiscal 2010 and decreased by $13.8 for fiscal 2010 compared to fiscal 2009. The components of these changes are summarized as follows:
| | | | | | | | |
| | | Change | |
Year ended January 31, | | 2011 vs 2010 | | | 2010 vs 2009 | |
Salaries, variable compensation, and benefits expenses | | $ | 8.8 | | | $ | (3.7 | ) |
Expenses associated with acquired businesses | | | 12.9 | | | | 6.5 | |
Travel expenses | | | (0.2 | ) | | | (6.2 | ) |
Marketing and advertising expenses | | | (0.1 | ) | | | (3.0 | ) |
Depreciation expenses | | | (1.0 | ) | | | (1.8 | ) |
Other expenses | | | (3.3 | ) | | | (5.6 | ) |
| | | | | | | | |
Total change in marketing and selling expenses | | $ | 17.1 | | | $ | (13.8 | ) |
| | | | | | | | |
29
General and Administration
General and administration expenses increased by $8.1 for fiscal 2011 compared to fiscal 2010 and decreased by $2.8 for fiscal 2010 compared to fiscal 2009. The components of these changes are summarized as follows:
| | | | | | | | |
| | | Change | |
Year ended January 31, | | 2011 vs 2010 | | | 2010 vs 2009 | |
Salaries, variable compensation, and benefits expenses | | $ | 4.3 | | | $ | 2.5 | |
Expenses associated with acquired businesses | | | 1.8 | | | | — | |
Facilities and infrastructure related costs | | | (0.3 | ) | | | (2.6 | ) |
Outside services | | | 2.0 | | | | (1.2 | ) |
Other expenses | | | 0.3 | | | | (1.5 | ) |
| | | | | | | | |
Total change in general and administration expenses | | $ | 8.1 | | | $ | (2.8 | ) |
| | | | | | | | |
We incur a substantial portion of our operating expenses outside the U.S. in various foreign currencies. When currencies weaken against the U.S. dollar, our operating expense performance is positively affected and when currencies strengthen, our operating expense performance is adversely affected. For fiscal 2011 compared to fiscal 2010, we experienced unfavorable currency movements of $4.3 in total operating expenses. For fiscal 2010 compared to fiscal 2009, we experienced favorable currency movements of $19.7 in total operating expenses. The impact of these currency effects is reflected in the movements in operating expenses detailed above.
Equity in Earnings of Frontline
In connection with our acquisition of Valor on March 18, 2010, we acquired Valor’s 50% interest in a joint venture, Frontline P.C.B. Solutions Limited Partnership (Frontline). Frontline is owned equally by Valor and Orbotech, Ltd., an Israeli company.
The following presents the summarized financial information of our 50% interest in Frontline for the period from March 18, 2010 through December 31, 2010:
| | | | |
| | | For the period from
March 18, 2010
through
December 31, 2010 | |
Net income-as reported | | $ | 6.4 | |
Amortization of purchased technology and other identified intangible assets | | | (4.3 | ) |
| | | | |
Equity in earnings of Frontline | | $ | 2.1 | |
| | | | |
Adjustment to Earnings Release
On February 24, 2011, we issued a press release with results of operations for fiscal 2011. In the course of our internal review process for this Annual Report on Form 10-K, we subsequently identified a benefit of $1.4 million resulting from a reduction in the amount of stock-based compensation expense recorded in fiscal 2011, which was not reflected in the February 24th earnings release. This benefit did not result in any additional income tax expense and did not affect cash flow from operations. Accordingly, this benefit increased our net income as reported in this Annual Report on Form 10-K by $1.4 million for fiscal 2011, from the net income reported in our earnings release, and increased our diluted net income per share by $0.01 for fiscal 2011, from the net income per share reported in our earnings release.
30
Amortization of Intangible Assets
For fiscal 2011 compared to fiscal 2010, the decrease in amortization of intangible assets was primarily due to certain intangible assets being fully amortized during fiscal 2011 and fiscal 2010, partially offset by new intangible assets from our acquisitions completed during fiscal 2011 and the second half of fiscal 2010.
Amortization of intangible assets for fiscal 2010 was unchanged from fiscal 2009 as the amortization of certain intangible assets acquired in acquisitions in fiscal 2010 and fiscal 2009 was offset by the decreased amortization of certain intangible assets acquired in years prior to fiscal 2009.
Special Charges
| | | | | | | | | | | | | | | | | | | | |
Year ended January 31, | | 2011 | | | Change | | | 2010 | | | Change | | | 2009 | |
Employee severance and related costs | | $ | 6.1 | | | | (43 | %) | | $ | 10.7 | | | | 9 | % | | $ | 9.8 | |
Excess leased facility costs | | | 0.9 | | | | (64 | %) | | | 2.5 | | | | — | | | | 2.5 | |
Acquisition costs | | | 0.5 | | | | (76 | %) | | | 2.1 | | | | — | | | | — | |
Other costs | | | 2.7 | | | | (55 | %) | | | 6.0 | | | | 30 | % | | | 4.6 | |
| | | | | | | | | | | | | | | | | | | | |
Total special charges | | $ | 10.2 | | | | (52 | %) | | $ | 21.3 | | | | 26 | % | | $ | 16.9 | |
| | | | | | | | | | | | | | | | | | | | |
Special charges primarily consist of costs incurred for employee terminations and were due to a reduction of personnel resources driven by modifications of business strategy or business emphasis. Special charges may also include expenses incurred related to potential acquisitions, excess facility costs, and asset-related charges.
Employee severance and related costs of $6.1 for fiscal 2011 included severance benefits, notice pay, and outplacement services. The total rebalance charge represents the aggregate of numerous unrelated rebalance plans which impacted several employee groups, none of which was individually material to our financial position or results of operations. We determined termination benefit amounts based on employee status, years of service, and local statutory requirements. We communicated termination benefits to the affected employees prior to the end of the quarter in which we recorded the charge. Approximately 66% of the year to date costs were paid during fiscal 2011. We expect to pay the remainder during fiscal 2012. There have been no significant modifications to the amount of these charges.
Excess leased facility costs of $0.9 for fiscal 2011 were primarily due to the abandonment of leased facilities and changes in the estimate of sublease income for previously abandoned leased facilities.
Acquisition costs of $0.5 for fiscal 2011 represent legal and other costs related to acquisitions.
Other special charges for fiscal 2011 included costs of $2.1 related to advisory fees, leased facility restoration costs of $1.4 and $(0.8) representing adjustments to assumptions on an acquisition earnout accrual.
Employee severance and related costs of $10.7 for fiscal 2010 included severance benefits, notice pay, and outplacement services. The total rebalance charge represents the aggregate of numerous unrelated rebalance plans which impacted several employee groups, none of which was individually material to our financial position or results of operations. We determined termination benefit amounts based on employee status, years of service, and local statutory requirements. We communicated termination benefits to the affected employees prior to the end of the quarter in which we recorded the charge. Substantially all of these costs were paid during fiscal 2010. There have been no significant modifications to the amount of these charges.
Excess leased facility costs of $2.5 for fiscal 2010 were primarily due to the abandonment of leased facilities and changes in the estimate of sublease income for previously abandoned leased facilities.
Acquisition costs of $2.1 for fiscal 2010 represent legal and other costs related to acquisitions.
31
Other special charges for fiscal 2010 included costs of $4.7 for advisory fees, charges of $0.6 for a casualty loss, and other charges of $0.7.
Employee severance and related costs of $9.8 for fiscal 2009 included severance benefits, notice pay, and outplacement services. The total rebalance charge represents the aggregate of numerous unrelated rebalance plans which impacted several employee groups, none of which was individually material to our financial position or results of operations. We determined termination benefit amounts based on employee status, years of service, and local statutory requirements. We communicated termination benefits to the affected employees prior to the end of the quarter in which we recorded the charge. Substantially all of these costs were paid during fiscal 2009. There have been no significant modifications to the amount of these charges.
Excess leased facility costs of $2.5 for fiscal 2009 were primarily due to the abandonment of leased facilities and changes in the estimate of sublease income for previously abandoned leased facilities.
Other special charges for fiscal 2009 included costs of $4.5 for advisory fees.
Impairment of Long Lived Assets
At January 31, 2009, we completed a review of our long-lived assets for impairment due to the adverse market conditions and declines in our market capitalization. We assessed the recoverability of our long-lived assets by determining whether their carrying values were greater than the forecasted undiscounted net cash flows of the related assets. We determined the assets were impaired and wrote down the assets to their estimated fair value. We determined fair value based on forecasted discounted net cash flows or appraised values, depending upon the nature of the assets. For purposes of this evaluation, long-lived assets were grouped with other assets and liabilities at the lowest level for which identifiable cash flows are largely independent of the cash flows of other assets and liabilities. We determined that our cash flows can be subdivided into six separate asset groups for impairment testing. The long-lived assets of each group consisted primarily of purchased technology, other intangibles, and property, plant, and equipment. Based on this evaluation, it was determined that one of our asset groups was impaired.
We recorded an impairment loss during fiscal 2009 for the difference between the carrying value and the fair value of the long-lived assets of this asset group. We used an income approach and forecasted discounted net cash flows to determine the fair value of the assets. The sum of forecasted net cash flows of the asset group resulted in a negative value and the fair value of the assets was determined to be zero. An impairment loss was recorded for the full carrying value of the asset group’s long-lived assets. Accordingly, we recorded an impairment loss of $4.6 in operating expenses in our consolidated statement of operations for fiscal 2009. The impaired assets continue to be used in our operations.
At January 31, 2011 and 2010, we completed similar reviews of long-lived assets for impairment. Based on these reviews, no impairment was deemed necessary for fiscal 2011 or 2010.
Other Income (Expense), Net
| | | | | | | | | | | | | | | | | | | | |
Year ended January 31, | | 2011 | | | Change | | | 2010 | | | Change | | | 2009 | |
Interest income | | $ | 1.4 | | | | 40 | % | | $ | 1.0 | | | | (80 | %) | | $ | 5.1 | |
Foreign currency exchange gain (loss) | | | (1.2 | ) | | | (200 | %) | | | (0.4 | ) | | | (108 | %) | | | 4.8 | |
Impairment of cost-basis investments | | | — | | | | 100 | % | | | (0.1 | ) | | | 97 | % | | | (3.5 | ) |
Equity in losses of unconsolidated entities | | | (0.9 | ) | | | 10 | % | | | (1.0 | ) | | | 29 | % | | | (1.4 | ) |
Other, net | | | (1.4 | ) | | | (250 | %) | | | (0.4 | ) | | | 20 | % | | | (0.5 | ) |
| | | | | | | | | | | | | | | | | | | | |
Other income (expense), net | | $ | (2.1 | ) | | | (133 | %) | | $ | (0.9 | ) | | | (120 | %) | | $ | 4.5 | |
| | | | | | | | | | | | | | | | | | | | |
The change in foreign currency exchange gain (loss) for fiscal 2011 compared to fiscal 2010 was primarily due to unfavorable movements of exchange rates in fiscal 2011 on the U.S. dollar.
The decrease in interest income for fiscal 2010 compared to fiscal 2009 was due to a decrease in interest income for the time value of foreign currency contracts of approximately $2.1 as well as the decrease of interest earned on our cash, cash equivalents, and short-term investments of $2.0. The decrease in interest earned on cash, cash equivalents, and short-term investments resulted from a decrease in the amount of cash held in interest bearing accounts and short-term investments and a decrease in the interest rates earned on interest bearing accounts.
32
The change of foreign currency exchange gain (loss) for fiscal 2010 compared to fiscal 2009 was primarily due to favorable movement of exchange rates in fiscal 2009 on the U.S. dollar and unhedged balance sheet positions associated with our acquisition of Flomerics.
In fiscal 2010, we recognized impairment losses on one long-term investment maintained on a cost basis, as we determined that the investment had an other-than-temporary decline in value. In fiscal 2009, we recognized impairment losses on two long-term investments maintained on a cost basis, as we determined that both investments had an other-than-temporary decline in value.
Interest Expense
| | | | | | | | | | | | | | | | | | | | |
Year ended January 31, | | 2011 | | | Change | | | 2010 | | | Change | | | 2009 | |
Interest Expense | | $ | 18.4 | | | | 5 | % | | $ | 17.5 | | | | (10 | %) | | $ | 19.4 | |
The increase in interest expense for fiscal 2011 compared to fiscal 2010 was primarily due to the change in the premium (discount) on partial redemptions of our Floating Rate Convertible Subordinated Debentures (Floating Rate Debentures) due 2023.
The decrease in interest expense for fiscal 2010 compared to fiscal 2009 was primarily due to the decrease in interest expense on the time value of foreign currency contracts of approximately $0.9 and a decrease in interest expense of $0.8 primarily due to a decrease in the effective interest rate of our Floating Rate Debentures.
Provision for Income Taxes
| | | | | | | | | | | | | | | | | | | | |
Year ended January 31, | | 2011 | | | Change | | | 2010 | | | Change | | | 2009 | |
Income tax expense | | $ | 3.4 | | | | 55 | % | | $ | 2.2 | | | | (80 | %) | | $ | 10.9 | |
In fiscal 2011, our income before taxes of $32.0 consisted of $(56.8) of pre-tax loss in the U.S. and $88.8 of pre-tax income in foreign jurisdictions, reflecting the higher proportion of our operating expenses and financing costs that are incurred in the U.S. Generally, the provision for income taxes is the result of the mix of profits and losses earned by us and our subsidiaries in tax jurisdictions with a broad range of income tax rates, withholding taxes (primarily in certain foreign jurisdictions), changes in tax reserves, and the application of valuation allowances on deferred tax assets.
For fiscal 2011, our effective tax rate was 11%. This differs from tax computed at the U.S. federal statutory rate primarily due to:
| | • | | The benefit of lower tax rates on earnings of foreign subsidiaries; |
| | • | | The recognition of deferred tax benefits associated with the restructuring and integration of certain acquired companies; |
| | • | | Reduction in reserves for uncertain foreign tax positions; and |
| | • | | The application of tax incentives for research and development in certain foreign jurisdictions; |
These differences are partially offset by:
| | • | | U.S. losses for which no tax benefit has been recognized; |
| | • | | Non-deductible employee stock purchase plan compensation expense; and |
| | • | | Withholding taxes in certain foreign jurisdictions. |
We have not provided for income taxes on the undistributed earnings of our foreign subsidiaries to the extent they are considered permanently re-invested outside of the U.S. As of January 31, 2011, the cumulative amount of earnings upon which income taxes have not been provided for is approximately $390.0. Upon repatriation, some of these earnings may be sheltered by U.S. loss carryforwards, research and development credits and foreign tax credits, which may reduce the federal tax liability associated with any future foreign dividend. Determination of the
33
amount of unrecognized deferred U.S. income tax liability on permanently re-invested foreign earnings is not practicable. To the extent that the earnings of our foreign subsidiaries are not treated as permanently reinvested, which include earnings of certain countries, we have considered the impact in our provision.
As of January 31, 2011, for U.S. federal income tax purposes, we had net operating loss carryforwards of approximately $192.4, foreign tax credits of $4.2, research and experimentation credit carryforwards of $46.1, alternative minimum tax credits of $2.7, and childcare credits of $1.2. For state income tax purposes, we had net operating loss carryforwards totaling $13.7 from multiple jurisdictions, and research and experimentation and other miscellaneous state credits of $8.7. Portions of our loss carryforwards, inherited through various acquisitions, are subject to annual limitations due to the change in ownership provisions of the Internal Revenue Code. If we do not use the carryforwards to reduce U.S. taxable income in future periods, portions of the net operating loss carryforwards will expire in fiscal years ending 2019 through 2031. The foreign tax credits will expire in fiscal years ending 2015 through 2021, research and experimentation credit carryforwards will expire between fiscal years ending 2019 through 2031, and childcare credits will expire between fiscal years ending 2023 and 2031. The alternative minimum tax credits do not expire. As of January 31, 2011, we have net operating losses in multiple foreign jurisdictions of $13.6. In general, we can carry forward the net operating losses for these foreign jurisdictions indefinitely.
We determined deferred tax assets and liabilities based on differences between the financial reporting and tax basis of assets and liabilities. In addition, we record deferred tax assets for net operating loss carryforwards and tax credit carryovers. We calculated the deferred tax assets and liabilities using the enacted tax rates and laws that will be in effect when we expect the differences to reverse. A valuation allowance is recorded when it is more likely than not that all or some portion of the deferred tax asset will not be realized. Since 2004, we have determined it is uncertain whether our U.S. entity will generate sufficient taxable income and foreign source income to utilize net operating loss carryforwards, research and experimentation credit carryforwards, and foreign tax credit carryforwards before expiration. Accordingly, we recorded a valuation allowance against those deferred tax assets for which realization does not meet the more likely than not standard. We have established valuation allowances related to certain foreign deferred tax assets based on historical losses as well as future expectations in certain jurisdictions. We will continue to evaluate the realizability of the deferred tax assets on a periodic basis.
Net deferred tax assets of $16.9 as of January 31, 2011, reflect a net decrease of $2.0 compared to $18.9 as of January 31, 2010. Gross deferred tax assets increased by $29.9 from January 31, 2010 to January 31, 2011 principally due to the generation of net operating losses and tax credits in the U.S. and the timing of the deduction on the accrued expenses. There was a $9.5 increase in deferred tax liabilities from January 31, 2010 to January 31, 2011 principally related to our position regarding the earnings of certain jurisdictions that are not treated as permanently reinvested and other intangibles acquired with fiscal year 2011 acquisitions. The valuation allowance increased by $22.5 from January 31, 2010 to January 31, 2011.
We are subject to income taxes in the U.S. and in numerous foreign jurisdictions. In the ordinary course of business there are many transactions and calculations where the ultimate tax determination is uncertain. The statute of limitations for adjustments to our historic tax obligations varies from jurisdiction to jurisdiction. In some cases it may be extended or be unlimited. Furthermore, net operating loss and tax credit carryforwards may be subject to adjustment after the expiration of the statute of limitations of the year such net operating losses and tax credits originated. Our larger jurisdictions generally provide for a statute of limitations from three to five years. We are currently under examination in various jurisdictions. The examinations are in different stages and timing of their resolution is difficult to predict. For U.S. federal income tax purposes, the tax years that remain open are fiscal year 2008 and forward. The statute of limitations remains open for years on or after 2005 in Japan and 2006 in Ireland.
We have reserves for taxes to address potential exposures involving tax positions that are being challenged or that could be challenged by taxing authorities even though we believe that the positions we have taken are appropriate. We believe our tax reserves are adequate to cover potential liabilities. We review the tax reserves quarterly and as circumstances warrant and adjust the reserves as events occur that affect our potential liability for additional taxes. It is often difficult to predict the final outcome or timing of resolution of any particular tax matter. Various events, some of which cannot be predicted, such as clarifications of tax law by administrative or judicial means, may occur and could require us to increase or decrease our reserves and effective tax rate. We expect to record additional reserves in future periods with respect to our tax filing positions. It is reasonably possible that unrecognized tax positions may decrease from $0 to $12.0 due to settlements or expirations of the statute of limitations within the next twelve months. To the extent that uncertain tax positions resolve in our favor, it could have a positive impact on our effective tax rate. A portion of reserves, which could settle or expire within the next twelve months, may result in
34
the booking of deferred tax assets subject to a valuation allowance for which no benefit would be recognized. Income tax-related interest and penalties were an expense of $0.2 for the year ended January 31, 2011, a benefit of $1.6 for the year ended January 31, 2010, and an expense of $3.1 for the year ended January 31, 2009.
The liability for income taxes associated with uncertain tax positions was $44.1 as of January 31, 2011 and $36.8 as of January 31, 2010. Tax benefits that could offset this liability were $0.5 as of January 31, 2011 and $0.6 as of January 31, 2010. Such offsetting tax benefits consider the correlative effects of deductible interest and state income taxes. We expect uncertain tax positions of $40.3, if recognized, would favorably affect our effective tax rate. As of January 31, 2011, the full reserve for taxes of $44.1 was reflected in income tax liability.
LIQUIDITY AND CAPITAL RESOURCES
Our primary ongoing cash requirements are for product development, operating activities, capital expenditures, debt service, and acquisition opportunities that may arise. Our primary sources of liquidity are cash generated from operations and borrowings under our revolving credit facility.
At January 31, 2011, we had cash and cash equivalents of $133.1. The available cash and cash equivalents are held in accounts managed by third-party financial institutions and consist of cash in our operating accounts.
Invested cash is held in interest bearing funds managed by third-party financial institutions. To date, we have experienced no loss or lack of access to our invested cash; however, we can provide no assurances that access to our cash and cash equivalents will not be impacted by adverse conditions in the financial markets.
At any point in time, we have significant balances in operating accounts that are with individual third-party financial institutions, which may exceed the Federal Deposit Insurance Corporation insurance limits or other regulatory insurance program limits. While we monitor daily the cash balances in our operating accounts and adjust the cash balances as appropriate, these cash balances could be impacted if the underlying financial institutions fail or are subject to other adverse conditions in the financial markets.
We anticipate that the following will be sufficient to meet our working capital needs on a short-term (twelve months or less) and a long-term (more than twelve months) basis:
| | • | | Anticipated cash flows from operating activities, including the effects of selling and financing customer term receivables; |
| | • | | Amounts available under existing revolving credit facilities; and |
| | • | | Other available financing sources, such as the issuance of debt or equity securities. |
We have experienced no difficulties to date in raising debt. However, capital markets have been volatile, and we cannot assure you that we will be able to raise debt or equity capital on acceptable terms, if at all.
| | | | | | | | |
Year ended January 31, | | 2011 | | | 2010 | |
Cash provided by operating activities | | $ | 82.2 | | | $ | 37.9 | |
Cash used in investing activities | | $ | (72.8 | ) | | $ | (49.9 | ) |
Cash provided by financing activities | | $ | 22.1 | | | $ | 16.9 | |
Operating Activities
Cash flows from operating activities consist of our net income (loss), adjusted for certain non-cash items and changes in operating assets and liabilities. Our cash flows from operating activities are significantly influenced by the payment terms on our license agreements and by our sales of qualifying accounts receivable. Our customers’ inability to fulfill payment obligations could adversely affect our cash flow. Though we have not, to date, experienced a material level of defaults, material payment defaults by our customers as a result of negative economic conditions or otherwise could have a material adverse effect on our financial condition. We monitor our accounts receivable portfolio for customers with low or declining credit ratings and increase our collection efforts when necessary.
35
Trade Accounts and Term Receivables
| | | | | | | | |
As of January 31, | | 2011 | | | 2010 | |
Trade accounts receivable, net | | $ | 347.1 | | | $ | 289.8 | |
Term receivables, long-term | | $ | 167.4 | | | $ | 164.9 | |
Average days sales outstanding in short-term receivables | | | 102 days | | | | 110 days | |
Average days sales outstanding in trade accounts receivable, net, excluding the current portion of term receivables | | | 45 days | | | | 42 days | |
The decrease in the average days sales outstanding in short-term receivables and the increase in trade accounts receivable net and term receivables, long-term as of January 31, 2011 were due to an increase in revenue in the fourth quarter of fiscal 2011 compared to fiscal 2010.
The current portion of term receivables was $193.4 as of January 31, 2011 and $178.9 as of January 31, 2010. Term receivables are attributable to multi-year term license sales agreements. We include amounts for term agreements that are due within one year in trade accounts receivable, net, and balances that are due in more than one year in term receivables, long-term. We use term agreements as a standard business practice and have a history of successfully collecting under the original payment terms without making concessions on payments, products, or services. Total term receivables were $360.8 as of January 31, 2011 compared to $343.8 as of January 31, 2010. The increase in term receivables as of January 31, 2011 compared to January 31, 2010 was due to an increase in revenue in the fourth quarter of fiscal 2011 compared to fiscal 2010.
We enter into agreements to sell qualifying accounts receivable from time to time to certain financing institutions on a non-recourse basis. We received net proceeds from the sale of receivables of $51.6 for fiscal 2011 compared to $31.8 for fiscal 2010. We have continued to be able to secure factoring sources and continue to evaluate the economics of the sale of accounts receivable. We have not set a target for the sale of accounts receivables for fiscal 2012.
Accrued Payroll and Related Liabilities
| | | | | | | | |
As of January 31, | | 2011 | | | 2010 | |
Accrued payroll and related liabilities | | $ | 109.2 | | | $ | 77.0 | |
The increase in accrued payroll and related liabilities was primarily due to higher variable compensation for fiscal 2011 compared to fiscal 2010 resulting from an increase in revenue.
Deferred Revenue
| | | | | | | | |
As of January 31, | | 2011 | | | 2010 | |
Deferred revenue | | $ | 185.4 | | | $ | 163.5 | |
The increase in deferred revenue is primarily due to increased current billings of support revenue to be recognized over the contract term on deals entered into during the fourth quarter of fiscal 2011.
Investing Activities
Cash used in investing activities for fiscal 2011 consisted of cash paid for capital expenditures and business acquisitions.
Expenditures for property, plant, and equipment increased to $47.2 for fiscal 2011 compared to $46.4 for fiscal 2010. The expenditures for property, plant, and equipment were primarily a result of spending on information technology and infrastructure improvements within facilities, including expenditures related to the renovation of office buildings in Fremont, California which were purchased in January 2010.
In fiscal 2011, we acquired Valor through the issuance of common stock of $47.2 and cash consideration of $5.6, net of cash received of $27.1. Also in fiscal 2011, we acquired CodeSourcery for a total purchase price of $18.5, which included $10.0 in cash consideration paid in fiscal 2011.
36
We plan to finance future business acquisitions through a combination of cash and common stock issuances. The cash expected to be utilized includes cash on hand, cash generated from operating activities, and borrowings on our revolving credit facility.
Financing Activities
For fiscal 2011, cash provided by financing activities consisted primarily of $20.0 in proceeds from a term loan incurred to refinance the January 2010 purchase of office buildings in Fremont, California and proceeds from the issuance of common stock of $27.5 resulting from the exercise of stock options and shares from the employee stock purchase plan. These proceeds were partially offset by net repayments of $20.0 on our revolving line of credit and a net decrease of $2.2 on our short-term borrowings. Additional discussion regarding the term loan is presented in the section below.
We may elect to purchase or otherwise retire some or all of our notes payable with cash, stock, or other assets from time to time in the open market or privately negotiated transactions, either directly or through intermediaries, or by tender offer when we believe that market conditions are favorable to do so. Such purchases may have a material effect on our liquidity, financial condition, and results of operations.
Other factors affecting liquidity and capital resources
6.25% Debentures due 2026
Interest on the 6.25% Convertible Subordinated Debentures (6.25% Debentures) due 2026 is payable semi-annually in March and September. The 6.25% Debentures are convertible, under certain circumstances, into our common stock at a conversion price of $17.968 per share for a total of 10.9 shares as of January 31, 2011. Upon conversion, in lieu of shares of our common stock, for each one thousand dollar principal amount of the 6.25% Debentures a holder will receive an amount of cash equal to the lesser of:
| | (i) | One thousand dollars or |
| | (ii) | The conversion value of the number of shares of our common stock equal to the conversion rate. |
If such conversion value exceeds one thousand dollars, we will also deliver, at our election, cash or common stock, or a combination of cash and common stock with a value equal to the excess. We may redeem some or all of the 6.25% Debentures for cash on or after March 6, 2011. The holders, at their option, may redeem some or all of the 6.25% Debentures for cash on March 1, 2013, 2016, or 2021. During the year ended January 31, 2011, we did not repurchase any 6.25% Debentures.
In July 2010, we issued $11.5 in aggregate principal amount of the 6.25% Debentures, plus a nominal cash amount, in exchange for $11.5 in aggregate principal amount of the Floating Rate Debentures. The terms of the 6.25% Debentures issued in this transaction are substantially the same as the terms of our existing 6.25% Debentures. We recorded a loss on the extinguishment of debt of $0.3 during the year ended January 31, 2011 for cash paid to debt holders in connection with this transaction.
In October 2010, we issued $20.0 in aggregate principal amount of the 6.25% Debentures for cash of $20.2. The terms of the 6.25% Debentures issued in this transaction are substantially the same as the terms of our existing 6.25% Debentures.
As of January 31, 2011, an aggregate principal amount of $196.5 of 6.25% Debentures is outstanding.
Floating Rate Debentures due 2023
During fiscal 2011, we exchanged $11.5 in aggregate principal amount of the Floating Rate Debentures as noted above and redeemed the remaining $20.8 of outstanding Floating Rate Debentures utilizing cash on hand. No balance remains outstanding following this redemption.
Term Loan due 2013
In April 2010, we entered into a three-year term loan (Term Loan) to repay borrowings under our revolving credit facility used to purchase office buildings in Fremont, California. Fixed principal of $0.5 and interest payments are payable quarterly in February, May, August, and November. The remaining principal balance is payable in April 2013. We have the option to pay interest based on:
| | (i) | London Interbank Offered Rate (LIBOR) plus 4.5%; or |
| | (ii) | A base rate plus 3.5%. |
37
The base rate is defined as the higher of:
| | (i) | The federal funds rate, as defined, plus 0.5%; |
| | (ii) | The prime rate of the lead bank; or |
| | (iii) | One-month LIBOR plus 1.0%. |
As a result of these interest rate options, our interest expense associated with borrowings under the Term Loan will vary with market interest rates. Additionally, the Term Loan requires us to have a minimum cash and cash equivalent balance as of the last day of the quarter. If we were to fail to comply with this covenant and did not obtain a waiver from our lenders, we would be in default under the Term Loan and our lenders could terminate the loan and demand immediate repayment of the outstanding loan. The Term Loan is collateralized by our Wilsonville, Oregon campus which includes land, buildings, and improvements with a carrying value of approximately $40.0. This amount is reported in our consolidated balance sheet within property, plant, and equipment, net.
During fiscal 2011, we repaid $1.5 on the Term Loan and a principal balance of $18.5 remains outstanding. The interest rate as of January 31, 2011 was 4.80%.
For further information on the 6.25% Debentures, the Floating Rate Debentures, and the Term Loan, see Note 9. “Notes Payable” in Part II, Item 8. “Financial Statements and Supplementary Data.”
Revolving Credit Facility
We are party to a syndicated, senior, unsecured, four-year revolving credit facility with a maximum borrowing capacity of $100.0 with an option to increase the borrowing capacity by $30.0 in the future. Under this revolving credit facility, we have the option to pay interest based on:
| | (i) | LIBOR with varying maturities which are commensurate with the borrowing period we select, plus a spread of between 1.0% and 1.6%, based on a pricing grid tied to a financial covenant; or |
| | (ii) | A base rate plus a spread of between 0.0% and 0.6%, based on a pricing grid tied to a financial covenant. |
The base rate is defined as the higher of:
| | (i) | The federal funds rate, as defined, plus 0.5%; |
| | (ii) | The prime rate of the lead bank; or |
| | (iii) | One-month LIBOR plus 1.0%. |
As a result of these interest rate options, our interest expense associated with borrowings under this revolving credit facility will vary with market interest rates. In addition, commitment fees are payable on the unused portion of the revolving credit facility at rates between 0.25% and 0.35% based on a pricing grid tied to a financial covenant.
We borrowed $60.0 against the revolving credit facility and repaid $80.0 during fiscal 2011. As of January 31, 2011, we had no outstanding balance against the revolving credit facility.
The revolving credit facility terminates June 1, 2011. We have opened dialogue with the current members of our lending group. Based on our ongoing relationship with our lenders, we do not anticipate having difficulties securing a renewal of the revolving credit facility at existing market rates.
For further information on the revolving credit facility, see Note 8. “Short-Term Borrowings” in Part II, Item 8. “Financial Statements and Supplementary Data.”
OFF-BALANCE SHEET ARRANGEMENTS
We do not have off-balance sheet arrangements, financings, or other similar relationships with unconsolidated entities or other persons, also known as special purpose entities. In the ordinary course of business, we lease certain real properties, primarily field sales offices, research and development facilities, and equipment.
38
CONTRACTUAL OBLIGATIONS
We are contractually obligated to make the following payments as of January 31, 2011:
| | | | | | | | | | | | | | | | | | | | |
| | | Payments due by period | |
| | | Total | | | Less than 1 year | | | 1-3 years | | | 3-5 years | | | More than 5
years | |
Notes payable | | | 216.3 | | | | 2.0 | | | | 17.8 | | | | — | | | | 196.5 | |
Interest on debt | | | 187.0 | | | | 13.2 | | | | 25.5 | | | | 24.5 | | | | 123.8 | |
Other liabilities (1) | | | 28.0 | | | | 4.4 | | | | 9.8 | | | | 5.0 | | | | 8.8 | |
Other borrowings | | | 15.5 | | | | 15.5 | | | | — | | | | — | | | | — | |
Operating leases | | | 70.1 | | | | 24.1 | | | | 25.9 | | | | 12.2 | | | | 7.9 | |
| | | | | | | | | | | | | | | | | | | | |
Total contractual obligations | | $ | 516.9 | | | $ | 59.2 | | | $ | 79.0 | | | $ | 41.7 | | | $ | 337.0 | |
| | | | | | | | | | | | | | | | | | | | |
| (1) | In addition, our balance sheet as of January 31, 2011 included additional long-term taxes payable of $46.3 related to tax positions for which the timing of the ultimate resolution is uncertain. At this time, we are unable to make a reasonably reliable estimate of the period of cash settlement with the respective taxing authorities and the total amount of taxes payable. The timing of such tax payments may depend on the resolution of current and future tax examinations which cannot be estimated. As a result, this amount is not included in the above table. |
OUTLOOK FOR FISCAL 2012
We expect revenues for the first quarter of fiscal 2012 to be approximately $225, with earnings per share for the same period of $0.06. For the full year fiscal 2012, we expect revenues to be approximately $1,000, with earnings per share of approximately $0.77. We are focused on continued expense control in the operation of our business.
39
| Item 7A. | Quantitative and Qualitative Disclosures About Market Risk |
Unless otherwise indicated, all numerical references are in millions, except interest rates and contract rates.
INTEREST RATE RISK
We are exposed to interest rate risk primarily through our investment portfolio, short-term borrowings, and notes payable. We do not use derivative financial instruments for speculative or trading purposes.
We place our investments in instruments that meet high quality credit standards, as specified in our investment policy. The policy also limits the amount of credit exposure to any one issuer and type of instrument. We do not expect any material loss with respect to our investment portfolio.
The table below presents the carrying amount and related weighted-average fixed interest rates for our investment portfolio. The carrying amount approximates fair value as of January 31, 2011. In accordance with our investment policy, all short-term investments mature in twelve months or less.
| | | | | | | | |
Principal (notional) amounts in United States dollars | | Carrying
Amount | | | Average Fixed
Interest Rate | |
Cash equivalents – fixed rate | | $ | 6.0 | | | | 0.05 | % |
We had convertible subordinated debentures with a principal balance of $196.5 outstanding with a fixed interest rate of 6.25% as of January 31, 2011 compared to a principal balance of $165.0 as of January 31, 2010. Interest rate changes for fixed rate debt affect the fair value of the debentures but do not affect future earnings or cash flow.
We had floating rate convertible subordinated debentures with no principal balance outstanding as of January 31, 2011 compared to a principal balance of $32.3 as of January 31, 2010. The floating rate convertible subordinated debenture had a variable interest rate of 3-month London Interbank Offered Rate (LIBOR) plus 1.65%. The effective interest rate was 1.95% for fiscal 2011 and 2.44% for fiscal 2010. Interest rate changes for variable interest rate debt generally do not affect the fair market value, but do affect future earnings and cash flow.
As of January 31, 2011, we have a syndicated, senior, unsecured, revolving credit facility, which expires on June 1, 2011. Borrowings under the revolving credit facility are permitted to a maximum of $100.0. Under this revolving credit facility, we have the option to pay interest based on:
| | (i) | LIBOR with varying maturities which are commensurate with the borrowing period we select, plus a spread of between 1.0% and 1.6%, based on a pricing grid tied to a financial covenant, or |
| | (ii) | A base rate plus a spread of between 0.0% and 0.6%, based on a pricing grid tied to a financial covenant. |
The base rate is defined as the higher of:
| | (i) | The federal funds rate, as defined, plus 0.5%, |
| | (ii) | The prime rate of the lead bank, or |
| | (iii) | One-month LIBOR plus 1.0%. |
As a result of these interest rate options, our interest expense associated with borrowings under this revolving credit facility will vary with market interest rates. This revolving credit facility contains certain financial and other covenants, including financial covenants requiring the maintenance of specified liquidity ratios, leverage ratios, and minimum tangible net worth, as well as restrictions on the payment of dividends. No amount was outstanding as of January 31, 2011. As of January 31, 2010, we had an outstanding balance of $20.0 against this revolving credit facility. Interest rate changes for variable interest rate debt generally do not affect the fair market value, but do affect future earnings and cash flow.
In April 2010, we entered into a three-year term loan. Under this term loan, we have the option to pay interest based on:
| | (ii) | A base rate plus 3.5%. |
40
The base rate is defined as the higher of:
| | (i) | The federal funds rate, as defined, plus 0.5%, |
| | (ii) | The prime rate of the lead bank, or |
| | (iii) | One-month LIBOR plus 1.0%. |
As a result of these interest rate options, our interest expense associated with borrowings under this term loan will vary with market interest rates. The term loan contains a covenant requiring the maintenance of minimum cash and cash equivalent balance. As of January 31, 2011, we had $18.5 outstanding against this term loan. The effective interest rate was 4.87% for the year ended January 31, 2011. Interest rate changes for variable interest rate debt generally do not affect the fair market value, but do affect future earnings and cash flow.
We had other short-term borrowings of $4.9 outstanding as of January 31, 2011 and $4.5 as of January 31, 2010 with variable rates based on market indexes. Interest rate changes for variable interest rate debt generally do not affect the fair market value, but do affect future earnings and cash flow.
If the interest rates as of January 31, 2011 were to increase or decrease by 1% and the level of borrowings outstanding remained constant, annual interest expense would increase or decrease on the above variable rate borrowings by approximately $0.2.
FOREIGN CURRENCY RISK
We transact business in various foreign currencies and have established a foreign currency hedging program to hedge certain foreign currency forecasted transactions and exposures from existing assets and liabilities. Our derivative instruments consist of short-term foreign currency exchange contracts, with a duration period of a year or less. We enter into contracts with counterparties who are major financial institutions and, as such we do not expect material losses as a result of defaults by our counterparties. We do not hold or issue derivative financial instruments for speculative or trading purposes.
We enter into foreign currency forward contracts to protect against currency exchange risk associated with expected future cash flows. Our practice is to hedge a majority of our existing material foreign currency transaction exposures, which generally represent the excess of expected euro and British pound denominated expenses over expected euro and British pound denominated revenues, and the excess of Japanese yen denominated revenue over expected Japanese yen denominated expenses. We also enter into foreign currency forward contracts to protect against currency exchange risk associated with existing assets and liabilities.
The following table provides volume information about our foreign currency forward program. The information provided is in U.S. dollar equivalent amounts. The table presents the gross notional amounts, at contract exchange rates, and the weighted average contractual foreign currency exchange rates. These forward contracts mature within the next twelve months.
| | | | | | | | | | | | | | | | |
As of January 31, | | 2011 | | | 2010 | |
| | | Gross Notional
Amount | | | Weighted
Average
Contract Rate | | | Gross Notional
Amount | | | Weighted
Average
Contract Rate | |
Forward Contracts: | | | | | | | | | | | | | | | | |
Japanese yen | | $ | 99.6 | | | | 82.99 | | | $ | 29.6 | | | | 90.67 | |
Euro | | | 40.7 | | | | 0.75 | | | | 77.2 | | | | 0.69 | |
British pound | | | 13.3 | | | | 0.63 | | | | 21.2 | | | | 0.61 | |
Swedish krona | | | 12.9 | | | | 6.65 | | | | 14.2 | | | | 7.04 | |
Indian rupee | | | 12.1 | | | | 45.78 | | | | 8.3 | | | | 45.68 | |
Canadian dollar | | | 8.4 | | | | 0.99 | | | | 6.6 | | | | 1.03 | |
Other (1) | | | 22.6 | | | | — | | | | 25.5 | | | | — | |
| | | | | | | | | | | | | | | | |
Total forward contracts | | $ | 209.6 | | | | | | | $ | 182.6 | | | | | |
| | | | | | | | | | | | | | | | |
| (1) | Other includes 11 currencies which are the Taiwan dollar, Korean wan, Israeli shekel, Danish kroner, Hungarian forints, Russian rubles, Polish zloty, Chinese yuan, Swiss franc, Norwegian kroner, and Singapore dollars. |
41
| Item 8. | Financial Statements and Supplementary Data |
Mentor Graphics Corporation
Consolidated Statements of Operations
| | | | | | | | | | | | |
Year ended January 31, | | 2011 | | | 2010 | | | 2009 | |
| In thousands, except per share data | | | | | | | | | |
Revenues: | | | | | | | | | | | | |
System and software | | $ | 562,355 | | | $ | 479,493 | | | $ | 447,551 | |
Service and support | | | 352,398 | | | | 323,234 | | | | 341,550 | |
| | | | | | | | | | | | |
Total revenues | | | 914,753 | | | | 802,727 | | | | 789,101 | |
| | | | | | | | | | | | |
| | | |
Cost of revenues: | | | | | | | | | | | | |
System and software | | | 31,119 | | | | 22,592 | | | | 17,787 | |
Service and support | | | 95,715 | | | | 85,265 | | | | 97,002 | |
Amortization of purchased technology | | | 13,771 | | | | 12,012 | | | | 12,403 | |
| | | | | | | | | | | | |
Total cost of revenues | | | 140,605 | | | | 119,869 | | | | 127,192 | |
| | | | | | | | | | | | |
Gross margin | | | 774,148 | | | | 682,858 | | | | 661,909 | |
| | | | | | | | | | | | |
| | | |
Operating expenses: | | | | | | | | | | | | |
Research and development | | | 284,851 | | | | 255,538 | | | | 260,351 | |
Marketing and selling | | | 320,825 | | | | 303,709 | | | | 317,473 | |
General and administration | | | 100,380 | | | | 92,260 | | | | 95,014 | |
Equity in earnings of Frontline | | | (2,051 | ) | | | — | | | | — | |
Amortization of intangible assets | | | 7,347 | | | | 11,184 | | | | 11,113 | |
Special charges | | | 10,257 | | | | 21,334 | | | | 16,888 | |
Impairment of long-lived assets | | | — | | | | — | | | | 4,553 | |
In-process research and development | | | — | | | | — | | | | 22,075 | |
| | | | | | | | | | | | |
Total operating expenses | | | 721,609 | | | | 684,025 | | | | 727,467 | |
| | | | | | | | | | | | |
| | | |
Operating income (loss) | | | 52,539 | | | | (1,167 | ) | | | (65,558 | ) |
Other income (expense), net | | | (2,116 | ) | | | (928 | ) | | | 4,510 | |
Interest expense | | | (18,411 | ) | | | (17,546 | ) | | | (19,354 | ) |
| | | | | | | | | | | | |
Income (loss) before income tax | | | 32,012 | | | | (19,641 | ) | | | (80,402 | ) |
Income tax expense | | | 3,428 | | | | 2,248 | | | | 10,850 | |
| | | | | | | | | | | | |
Net income (loss) | | $ | 28,584 | | | $ | (21,889 | ) | | $ | (91,252 | ) |
| | | | | | | | | | | | |
| | | |
Net income (loss) per share: | | | | | | | | | | | | |
Basic | | $ | 0.27 | | | $ | (0.23 | ) | | $ | (0.99 | ) |
| | | | | | | | | | | | |
Diluted | | $ | 0.26 | | | $ | (0.23 | ) | | $ | (0.99 | ) |
| | | | | | | | | | | | |
| | | |
Weighted average number of shares outstanding: | | | | | | | | | | | | |
Basic | | | 107,743 | | | | 96,474 | | | | 91,829 | |
| | | | | | | | | | | | |
Diluted | | | 109,861 | | | | 96,474 | | | | 91,829 | |
| | | | | | | | | | | | |
See accompanying notes to consolidated financial statements.
42
Mentor Graphics Corporation
Consolidated Balance Sheets
| | | | | | | | |
As of January 31, | | 2011 | | | 2010 | |
| In thousands | | | | | | |
Assets | | | | | | | | |
Current assets: | | | | | | | | |
Cash and cash equivalents | | $ | 133,113 | | | $ | 99,340 | |
Short-term investments | | | — | | | | 3 | |
Trade accounts receivable, net of allowance for doubtful accounts of $3,941 as of January 31, 2011 and $3,607 as of January 31, 2010 | | | 347,075 | | | | 289,750 | |
Other receivables | | | 14,278 | | | | 10,186 | |
Inventory | | | 8,255 | | | | 3,630 | |
Prepaid expenses and other | | | 20,072 | | | | 15,813 | |
Deferred income taxes | | | 15,992 | | | | 11,891 | |
| | | | | | | | |
Total current assets | | | 538,785 | | | | 430,613 | |
| | |
Property, plant, and equipment, net | | | 139,340 | | | | 121,795 | |
Term receivables | | | 167,425 | | | | 164,898 | |
Goodwill | | | 510,508 | | | | 458,313 | |
Intangible assets, net | | | 31,189 | | | | 26,029 | |
Deferred income taxes | | | 869 | | | | 7,047 | |
Other assets | | | 39,862 | | | | 14,346 | |
| | | | | | | | |
Total assets | | $ | 1,427,978 | | | $ | 1,223,041 | |
| | | | | | | | |
| | |
Liabilities and Stockholders’ Equity | | | | | | | | |
Current liabilities: | | | | | | | | |
Short-term borrowings | | $ | 15,544 | | | $ | 37,874 | |
Current portion of notes payable | | | 2,000 | | | | 32,272 | |
Accounts payable | | | 16,724 | | | | 9,985 | |
Income taxes payable | | | 5,517 | | | | 3,971 | |
Accrued payroll and related liabilities | | | 109,173 | | | | 77,008 | |
Accrued liabilities | | | 39,513 | | | | 44,122 | |
Deferred revenue | | | 171,416 | | | | 153,965 | |
| | | | | | | | |
Total current liabilities | | | 359,887 | | | | 359,197 | |
| | |
Notes payable | | | 207,348 | | | | 156,075 | |
Deferred revenue | | | 13,953 | | | | 9,534 | |
Income tax liability | | | 44,095 | | | | 36,791 | |
Other long-term liabilities | | | 25,981 | | | | 21,427 | |
| | | | | | | | |
Total liabilities | | | 651,264 | | | | 583,024 | |
| | | | | | | | |
| | |
Commitments and contingencies (Note 11) | | | | | | | | |
| | |
Stockholders’ equity: | | | | | | | | |
Common stock, no par value, 300,000 shares authorized as of January 31, 2011 and 200,000 shares authorized as of January 31, 2010; 111,249 shares issued and outstanding as of January 31, 2011 and 100,478 shares issued and outstanding as of January 31, 2010 | | | 765,179 | | | | 662,595 | |
Accumulated deficit | | | (20,158 | ) | | | (48,742 | ) |
Accumulated other comprehensive income | | | 31,693 | | | | 26,164 | |
| | | | | | | | |
Total stockholders’ equity | | | 776,714 | | | | 640,017 | |
| | | | | | | | |
Total liabilities and stockholders’ equity | | $ | 1,427,978 | | | $ | 1,223,041 | |
| | | | | | | | |
See accompanying notes to consolidated financial statements.
43
Mentor Graphics Corporation
Consolidated Statements of Cash Flows
| | | | | | | | | | | | |
Year ended January 31, | | 2011 | | | 2010 | | | 2009 | |
| In thousands | | | | | | | | | |
Operating Cash Flows: | | | | | | | | | | | | |
Net income (loss) | | $ | 28,584 | | | $ | (21,889 | ) | | $ | (91,252 | ) |
Adjustments to reconcile net income (loss) to net cash provided by operating activities: | | | | | | | | | | | | |
| | | |
Depreciation and amortization of property, plant, and equipment | | | 30,814 | | | | 31,120 | | | | 31,500 | |
Amortization | | | 26,129 | | | | 28,538 | | | | 28,554 | |
Write-off of debt issuance costs | | | 132 | | | | 26 | | | | — | |
Gain on debt extinguishment | | | — | | | | (380 | ) | | | — | |
Stock-based compensation | | | 20,511 | | | | 26,159 | | | | 28,223 | |
Deferred income taxes | | | (3,541 | ) | | | 13,962 | | | | (11,736 | ) |
Changes in other long-term liabilities | | | (7,054 | ) | | | (3,669 | ) | | | 283 | |
Impairment of long-lived assets | | | — | | | | — | | | | 4,553 | |
In-process research and development | | | 120 | | | | — | | | | 22,075 | |
Write-down of long-term investments | | | — | | | | 113 | | | | 3,488 | |
Equity in (income) loss of unconsolidated entities, net of dividends received | | | 3,587 | | | | 995 | | | | 1,432 | |
(Gain) loss on disposal of property, plant, and equipment, net | | | (30 | ) | | | 208 | | | | 140 | |
Changes in operating assets and liabilities, net of effect of acquired businesses: | | | | | | | | | | | | |
Trade accounts receivable, net | | | (44,735 | ) | | | (1,117 | ) | | | 41,410 | |
Prepaid expenses and other | | | (3,013 | ) | | | 20,056 | | | | (14,990 | ) |
Term receivables, long-term | | | (4,409 | ) | | | (9,479 | ) | | | (21,713 | ) |
Accounts payable and accrued liabilities | | | 20,951 | | | | (957 | ) | | | (16,978 | ) |
Income taxes payable | | | (1,424 | ) | | | (28,225 | ) | | | 13,008 | |
Deferred revenue | | | 15,586 | | | | (17,572 | ) | | | 4,675 | |
| | | | | | | | | | | | |
Net cash provided by operating activities | | | 82,208 | | | | 37,889 | | | | 22,672 | |
| | | | | | | | | | | | |
| | | |
Investing Cash Flows: | | | | | | | | | | | | |
Proceeds from sales and maturities of short-term investments | | | 3 | | | | 1,994 | | | | 25,631 | |
Purchases of short-term investments | | | — | | | | — | | | | (19,310 | ) |
Purchases of property, plant, and equipment | | | (47,175 | ) | | | (46,397 | ) | | | (40,402 | ) |
Acquisitions of businesses and equity interests, net of cash acquired | | | (25,578 | ) | | | (5,535 | ) | | | (55,997 | ) |
| | | | | | | | | | | | |
Net cash used in investing activities | | | (72,750 | ) | | | (49,938 | ) | | | (90,078 | ) |
| | | | | | | | | | | | |
| | | |
Financing Cash Flows: | | | | | | | | | | | | |
Proceeds from issuance of common stock | | | 27,530 | | | | 20,059 | | | | 22,336 | |
Tax effect of share options exercised | | | — | | | | (96 | ) | | | 93 | |
Net increase (decrease) in short-term borrowings | | | (2,162 | ) | | | 973 | | | | 2,875 | |
Debt and equity issuance costs | | | (1,220 | ) | | | (544 | ) | | | (794 | ) |
Proceeds from notes payable and revolving credit facility | | | 100,225 | | | | 20,000 | | | | 30,000 | |
Repayments of notes payable and revolving credit facility | | | (102,263 | ) | | | (23,450 | ) | | | (10,000 | ) |
| | | | | | | | | | | | |
Net cash provided by financing activities | | | 22,110 | | | | 16,942 | | | | 44,510 | |
| | | | | | | | | | | | |
Effect of exchange rate changes on cash and cash equivalents | | | 2,205 | | | | 805 | | | | (1,388 | ) |
| | | | | | | | | | | | |
Net change in cash and cash equivalents | | | 33,773 | | | | 5,698 | | | | (24,284 | ) |
Cash and cash equivalents at the beginning of the period | | | 99,340 | | | | 93,642 | | | | 117,926 | |
| | | | | | | | | | | | |
Cash and cash equivalents at the end of the period | | $ | 133,113 | | | $ | 99,340 | | | $ | 93,642 | |
| | | | | | | | | | | | |
See accompanying notes to consolidated financial statements.
44
Mentor Graphics Corporation
Consolidated Statements of Stockholders’ Equity
| | | | | | | | | | | | | | | | | | | | | | | | |
| | | Common Stock | | | Retained
Earnings
(Accumulated
Deficit) | | | Accumulated Other
Comprehensive
Income | | | | | | Total
Stockholders’
Equity | |
| | | Shares | | | Amount | | | | | Comprehensive
Income (Loss) | | |
| In thousands | | | | | | | | | | | | | | | | | | |
Balance as of January 31, 2008 | | | 90,742 | | | $ | 552,919 | | | $ | 64,399 | | | $ | 36,864 | | | | | | | $ | 654,182 | |
| | | | | | |
Net loss | | | | | | | | | | | (91,252 | ) | | | | | | $ | (91,252 | ) | | | (91,252 | ) |
Foreign currency translation adjustment | | | | | | | | | | | | | | | (18,844 | ) | | | (18,844 | ) | | | (18,844 | ) |
Change in pension liability, after tax benefit of $138 | | | | | | | | | | | | | | | (250 | ) | | | (250 | ) | | | (250 | ) |
Unrealized loss on derivatives, after tax benefit of $318 | | | | | | | | | | | | | | | (6,536 | ) | | | (6,536 | ) | | | (6,536 | ) |
| | | | | | | | | | | | | | | | | | | | | | | | |
Comprehensive loss | | | | | | | | | | | | | | | | | | $ | (116,882 | ) | | | | |
| | | | | | | | | | | | | | | | | | | | | | | | |
Stock issued under stock option and stock purchase plans | | | 3,384 | | | | 22,336 | | | | | | | | | | | | | | | | 22,336 | |
Stock compensation expense | | | | | | | 26,716 | | | | | | | | | | | | | | | | 26,716 | |
Tax benefit from share options exercised | | | | | | | 93 | | | | | | | | | | | | | | | | 93 | |
| | | | | | | | | | | | | | | | | | | | | | | | |
Balance as of January 31, 2009 | | | 94,126 | | | $ | 602,064 | | | $ | (26,853 | ) | | $ | 11,234 | | | | | | | $ | 586,445 | |
| | | | | | |
Net loss | | | | | | | | | | | (21,889 | ) | | | | | | $ | (21,889 | ) | | | (21,889 | ) |
Foreign currency translation adjustment | | | | | | | | | | | | | | | 10,689 | | | | 10,689 | | | | 10,689 | |
Change in pension liability, after tax benefit of $457 | | | | | | | | | | | | | | | (682 | ) | | | (682 | ) | | | (682 | ) |
Unrealized gain on derivatives, after tax expense of $108 | | | | | | | | | | | | | | | 4,923 | | | | 4,923 | | | | 4,923 | |
| | | | | | | | | | | | | | | | | | | | | | | | |
Comprehensive loss | | | | | | | | | | | | | | | | | | $ | (6,959 | ) | | | | |
| | | | | | | | | | | | | | | | | | | | | | | | |
Stock issued under stock option and stock purchase plans | | | 4,449 | | | | 20,059 | | | | | | | | | | | | | | | | 20,059 | |
Stock issued for acquisition | | | 1,903 | | | | 14,911 | | | | | | | | | | | | | | | | 14,911 | |
Stock compensation expense | | | | | | | 25,657 | | | | | | | | | | | | | | | | 25,657 | |
Reduction of tax benefit on share options exercised | | | | | | | (96 | ) | | | | | | | | | | | | | | | (96 | ) |
| | | | | | | | | | | | | | | | | | | | | | | | |
Balance as of January 31, 2010 | | | 100,478 | | | $ | 662,595 | | | $ | (48,742 | ) | | $ | 26,164 | | | | | | | $ | 640,017 | |
| | | | | | |
Net income | | | | | | | | | | | 28,584 | | | | | | | $ | 28,584 | | | | 28,584 | |
Foreign currency translation adjustment | | | | | | | | | | | | | | | 1,595 | | | | 1,595 | | | | 1,595 | |
Change in pension liability, after tax expense of $1,667 | | | | | | | | | | | | | | | 2,349 | | | | 2,349 | | | | 2,349 | |
Unrealized gain on derivatives, after tax expense of $279 | | | | | | | | | | | | | | | 1,585 | | | | 1,585 | | | | 1,585 | |
| | | | | | | | | | | | | | | | | | | | | | | | |
Comprehensive Income | | | | | | | | | | | | | | | | | | $ | 34,113 | | | | | |
| | | | | | | | | | | | | | | | | | | | | | | | |
Stock issued under stock option and stock purchase plans | | | 5,150 | | | | 27,530 | | | | | | | | | | | | | | | | 27,530 | |
Stock issued for acquisition | | | 5,621 | | | | 54,028 | | | | | | | | | | | | | | | | 54,028 | |
Stock compensation expense | | | | | | | 21,026 | | | | | | | | | | | | | | | | 21,026 | |
| | | | | | | | | | | | | | | | | | | | | | | | |
Balance as of January 31, 2011 | | | 111,249 | | | $ | 765,179 | | | $ | (20,158 | ) | | $ | 31,693 | | | | | | | $ | 776,714 | |
| | | | | | | | | | | | | | | | | | | | | | | | |
See accompanying notes to consolidated financial statements.
45
Mentor Graphics Corporation
Notes to Consolidated Financial Statements
All numerical references in thousands, except for employee data, percentages, and per share data.
1. Nature of Operations
We are a supplier of electronic design automation (EDA) systems — advanced computer software and emulation hardware systems used to automate the design, analysis, and testing of electronic hardware and embedded systems software in electronic systems and components. We market our products and services worldwide, primarily to large companies in the military/aerospace, communications, computer, consumer electronics, semiconductor, networking, multimedia, and transportation industries. We sell and license our products through our direct sales force and a channel of distributors and sales representatives. We were incorporated in Oregon in 1981 and our common stock is traded on The NASDAQ Global Select Market under the symbol “MENT.” In addition to our corporate offices in Wilsonville, Oregon, we have sales, support, software development, and professional service offices worldwide.
2. Summary of Significant Accounting Policies
Principles of Consolidation
The consolidated financial statements include our financial statements and those of our wholly-owned subsidiaries. All intercompany accounts and transactions have been eliminated in consolidation.
We do not have off-balance sheet arrangements, financings, or other similar relationships with unconsolidated entities or other persons, also known as special purpose entities. In the ordinary course of business, we lease certain real properties, primarily field sales offices, research and development facilities, and equipment, as described in Note 11. “Commitments and Contingencies.”
Foreign Currency Translation
Local currencies are the functional currencies for our foreign subsidiaries except for certain subsidiaries in Ireland, Singapore, Egypt, and Israel where the United States (U.S.) dollar is used as the functional currency. We translate assets and liabilities of foreign operations, excluding certain subsidiaries in Ireland, Singapore, Egypt, and Israel, to U.S. dollars at current rates of exchange and revenues and expenses are translated using weighted average rates. We include foreign currency translation adjustments in stockholders’ equity as a component of accumulated other comprehensive income. We maintain the accounting records for certain subsidiaries in Ireland, Singapore, Egypt, and Israel in the U.S. dollar and accordingly no translation is necessary. We include foreign currency transaction gains and losses as a component of other income (expense), net.
Use of Estimates
U.S. generally accepted accounting principles require management to make estimates and assumptions that affect the reported amount of assets, liabilities, and contingencies at the date of the financial statements and the reported amounts of revenues and expenses during the reporting periods. Such estimates include valuation of accounts receivable, goodwill, intangible assets, other long-lived assets, and assumptions used in the calculation of income taxes, among others. These estimates and assumptions are based on our best estimates and judgment. We evaluate our estimates and assumptions on an ongoing basis using historical experience and other factors, including the current economic environment, which we believe to be reasonable under the circumstances. We adjust such estimates and assumptions when facts and circumstances dictate. Actual results could differ from these estimates. Any changes in estimates will be reflected in the financial statements in future periods.
Cash Equivalents
Cash equivalents totaled $6,000 as of January 31, 2011 and $29,800 as of January 31, 2010 and included certificates of deposit and other highly liquid investments with original maturities of ninety days or less.
46
Investments
Long-term investments, included in other assets on the accompanying consolidated balance sheets, include investments with maturities in excess of one year from the balance sheet date, investments with indefinite lives, and equity securities. We determine the appropriate classification of our investments at the time of purchase. For investments in equity securities, we use the equity method of accounting when our investment gives us the ability to exercise significant influence over the operating and financial policies of the investee. Under the equity method, we currently record our share of earnings or losses as a component of other income (expense), net equal to our proportionate share of the earnings or losses of the investee. For debt securities with readily determinable fair values (marketable securities), we classify our investment as held-to-maturity when we have the positive intent and ability to hold the securities to maturity. We state held-to-maturity securities at cost, adjusted for amortization of premiums and discounts to maturity. Marketable securities not classified as held-to-maturity are classified as available-for-sale. We carry available-for-sale securities at fair value based on quoted market prices. We report unrealized gains and losses of available-for-sale securities, net of tax, in stockholders’ equity as a component of accumulated other comprehensive income. For investments in equity securities of private companies without a readily determinable fair value, and as to which we do not exercise significant influence over the investee, we record our investment under the cost method of accounting. Under the cost method of accounting, we carry the investment at historical cost and we periodically evaluate the fair value of the investment to determine if an other-than-temporary decline in value has occurred.
Investment in Frontline
In connection with our acquisition of Valor Computerized Systems, Ltd. (Valor) on March 18, 2010, we acquired Valor’s 50% interest in a joint venture, Frontline P.C.B. Solutions Limited Partnership (Frontline), a provider of engineering software solutions for the printed circuit board industry. We use the equity method of accounting for Frontline which results in reporting our investment as one line within other assets in the consolidated balance sheet and our share of earnings on one line in the consolidated statement of operations. Frontline reports on a calendar year basis. As such, we record our interest in the earnings or losses of Frontline in the subsequent month following incurrence.
We actively participate in regular and periodic activities with respect to Frontline such as budgeting, business planning, marketing, and direction of research and development projects. Accordingly, we have included our interest in the earnings of Frontline as a component of operating income (loss).
Term Receivables and Trade Accounts Receivable
We have long-term installment receivables that are attributable to multi-year, multi-element term license sales agreements. We include balances under term agreements that are due within one year in trade accounts receivable, net and balances that are due more than one year from the balance sheet date in term receivables, long-term. We discount the total product portion of the agreements to reflect the interest component of the transaction. We amortize the interest component of the transaction, using the effective interest method, to system and software revenues over the period in which payments are made and balances are outstanding. We determine the discount rate at the outset of the arrangement based upon the current credit rating of the customer. We reset the discount rate periodically considering changes in prevailing interest rates but do not adjust previously discounted balances.
Term receivable and trade accounts receivable balances were as follows:
| | | | | | | | |
As of January 31, | | 2011 | | | 2010 | |
Trade accounts receivable | | $ | 153,733 | | | $ | 110,839 | |
Term receivables, short-term | | | 193,342 | | | | 178,911 | |
Term receivables, long-term | | | 167,425 | | | | 164,898 | |
Trade accounts receivable include billed amounts whereas term receivables, short-term is comprised of unbilled amounts. Term receivables, short term represent the portion of long-term installment agreements that are due within one year. Billings for term agreements typically occur 30 days prior to the contractual due date, in accordance with individual contract installment terms. Term receivables, long-term represent unbilled amounts which are scheduled to be collected beyond one year.
We perform a credit risk assessment of all customers using the S&P credit rating as our primary credit-quality indicator. The S&P credit ratings are based on the most recent S&P score available. For customers that do not have an S&P credit rating, we base our credit risk assessment on an internal credit assessment which is based on selected short-term financial ratios. Our internal credit assessment is based upon results provided in the customers’ most recent financial statements.
47
The credit risk assessment of our long-term receivables was as follows:
| | | | |
As of January 31, | | 2011 | |
S&P credit rating: | | | | |
AAA+ through BBB- | | $ | 84,685 | |
BB+ and lower | | | 19,473 | |
| | | | |
| | | 104,158 | |
Internal credit assessment | | | 63,267 | |
| | | | |
Total long-term term receivables | | $ | 167,425 | |
| | | | |
Valuation of Trade Accounts Receivable
We maintain allowances for doubtful accounts on trade accounts receivable and term receivables, long-term for estimated losses resulting from the inability of our customers to make required payments. We regularly evaluate the collectibility of our trade accounts receivable based on a combination of factors. When we become aware of a specific customer’s inability to meet its financial obligations, such as in the case of bankruptcy or deterioration in the customer’s operating results, financial position, or credit rating, we record a specific reserve for bad debt to reduce the related receivable to the amount believed to be collectible. We also record unspecified reserves for bad debt for all other customers based on a variety of factors including length of time the receivables are past due, the financial health of the customers, the current business environment, and historical experience. Current economic conditions we have considered include forecasted spending in the semiconductor industry, consumer spending for electronics, integrated circuit research and development spending, and volatility in gross domestic product. If these factors change or circumstances related to specific customers change, we adjust the estimates of the recoverability of receivables resulting in either additional selling expense or a reduction in selling expense in the period such determination is made.
Concentrations of Credit Risk
We place our cash, cash equivalents, and short-term investments with major banks and financial institutions. Our investment policy limits our credit exposure to any one financial institution. We do not believe we are exposed to significant credit risk or market risk on our financial instruments.
Our concentrations of credit risk with respect to trade receivables are limited due to the large number of customers comprising our customer base and their dispersion across different businesses and geographic areas. However, the allowance for doubtful accounts, which is based on management’s best estimates, could be adjusted in the near term depending on actual experience. An adjustment could be material to our consolidated financial statements.
Fair Value of Financial Instruments
The carrying amounts of cash equivalents, short-term investments, trade accounts receivable, net, term receivables, short-term borrowings, accounts payable, and accrued liabilities approximate fair value because of the short-term nature of these instruments or because amounts have been appropriately discounted. We record foreign currency exchange contracts based on quoted market prices. We based the fair value of long-term notes payable on the quoted market price or rates available to us for instruments with similar terms and maturities.
48
We measure derivative instruments at fair value on a quarterly basis. The Financial Accounting Standard Board’s (FASB) authoritative guidance established a hierarchy of valuation techniques based on whether the inputs to those valuation techniques are observable or unobservable. Observable inputs reflect market data obtained from independent sources. Unobservable inputs reflect our market assumptions. The fair value hierarchy consists of the following three levels:
| | • | | Level 1—Quoted prices for identical instruments in active markets; |
| | • | | Level 2—Quoted prices for similar instruments in active markets, quoted prices for identical or similar instruments in markets that are not active, and model-derived valuations whose significant inputs are observable; and |
| | • | | Level 3—One or more significant inputs to the valuation model are unobservable. |
We use an income approach to determine the fair value of our foreign currency exchange contracts. The net gains or losses for foreign currency exchange contracts designated as cash flow hedges, which are linked to a specific transaction, are reported in accumulated other comprehensive income in stockholders’ equity until the forecasted transaction occurs or the hedge is no longer effective. Once the forecasted transaction occurs or the hedge is no longer effective, we reclassify the gains or losses attributable to the foreign currency exchange contracts to our consolidated statement of operations. We record foreign currency exchange contracts based on quoted market prices for similar instruments.
We recognize changes in fair value for foreign currency exchange contracts entered into to offset the variability in exchange rates on certain short-term monetary assets and liabilities in other income (expense), net, in our consolidated statement of operations. The fair value of foreign currency exchange contracts is included in other receivables, if the balance is an asset, or accrued liabilities, if the balance is a liability, on our consolidated balance sheet.
Property, Plant, and Equipment, Net
We state property, plant, and equipment at cost. We capitalize expenditures for additions to property, plant, and equipment. We expense maintenance and repairs which do not improve or extend the life of the respective asset as incurred. We compute depreciation on a straight-line basis over lives of forty years for buildings and twenty years for land improvements. We compute depreciation of computer equipment and furniture principally on a straight-line basis over the estimated useful lives of the assets, generally three to five years. We amortize leasehold improvements on a straight-line basis over the lesser of the term of the lease or estimated useful lives of the improvements, generally three to ten years.
Goodwill, Intangible Assets, and Long-Lived Assets
Goodwill represents the excess of the aggregate purchase price over the fair value of the tangible and other intangible assets acquired in our business combinations. Intangible assets, net primarily includes purchased technology, in-process research and development, trademarks, and customer relationships acquired in our business combinations. We review long-lived assets, including intangible assets with definite lives, for impairment whenever events or changes in circumstances indicate the carrying amount of such assets may not be recoverable. We assess the recoverability of our long-lived assets by determining whether the carrying values of the asset groups are greater than the forecasted undiscounted net cash flows of the related asset group. If we determine the assets are impaired, we write down the assets to their estimated fair value. We determine fair value based on forecasted discounted net cash flows or appraised values, depending upon the nature of the assets. In the event we determine our long-lived assets have been impaired, we would make an adjustment that would result in a charge for the write-down in the period that such determination was made. We determined that certain long-lived assets were impaired as of January 31, 2009. See further discussion in Note 3. “Impairment of Long-Lived Assets.”
Goodwill is not amortized, but is tested for impairment at least annually and as necessary if changes in facts and circumstances indicate that the fair value of our reporting unit may be less than the carrying amount. We operate as a single reporting unit for purposes of goodwill evaluation. We completed our annual goodwill impairment test as of January 31, 2011, 2010, and 2009. As of January 31, 2011, 2010, and 2009, our annual impairment analysis of goodwill provided no indicators that a potential impairment existed for our reporting unit and accordingly no impairment charge was recognized during fiscal 2011, 2010, or 2009.
We amortize purchased technology over three to five years to system and software cost of revenues and other intangible asset costs over one to five years to operating expenses. For capitalized in-process research and development, upon completion of the in-process research and development projects, we will amortize in-process research and development to cost of revenues over the life of the projects. Alternatively, if we abandon, the project, the in-process research and development costs will be expensed to operating expense when such determination is made. Total purchased technology and other intangible asset amortization expenses were as follows:
| | | | | | | | | | | | |
Year ended January 31, | | 2011 | | | 2010 | | | 2009 | |
Purchased technology and other intangible asset amortization expenses | | $ | 21,118 | | | $ | 23,196 | | | $ | 23,516 | |
49
As of January 31, 2011, the carrying value of goodwill, intangible assets, and long-lived assets was as follows:
| | | | | | | | |
As of January 31, | | 2011 | | | 2010 | |
Goodwill | | $ | 510,508 | | | $ | 458,313 | |
Net purchased technology and in-process research and development(1) | | $ | 17,852 | | | $ | 16,912 | |
Net other intangible assets(2) | | $ | 13,337 | | | $ | 9,117 | |
| (1) | Includes accumulated amortization of $103,343 for the year ended January 31, 2011 and $89,572 for the year ended January 31, 2010. |
| (2) | Includes accumulated amortization of $53,138 for the year ended January 31, 2011 and $45,791 for the year ended January 31, 2010. |
The following table summarizes goodwill activity:
| | | | |
Balance as of January 31, 2009 | | $ | 441,221 | |
Acquisitions | | | 13,583 | |
Earnouts | | | 2,716 | |
Foreign exchange | | | 793 | |
| | | | |
Balance as of January 31, 2010 | | | 458,313 | |
Acquisitions | | | 50,430 | |
Earnouts | | | 1,469 | |
Foreign exchange | | | 296 | |
| | | | |
Balance as of January 31, 2011 | | $ | 510,508 | |
| | | | |
We estimate the aggregate amortization expense related to purchased technology and other intangible assets will be as follows:
| | | | |
Fiscal years ending January 31, | | | |
2012 | | $ | 15,204 | |
2013 | | | 10,112 | |
2014 | | | 3,620 | |
2015 | | | 1,506 | |
2016 | | | 652 | |
Thereafter | | | 95 | |
| | | | |
Aggregate amortization expense | | $ | 31,189 | |
| | | | |
Income Taxes
We use the asset and liability method of accounting for income taxes. Under this method, we recognize deferred income taxes for the future tax consequences attributable to temporary differences between the financial statement carrying amounts and tax balances of existing assets and liabilities. We calculate deferred tax assets and liabilities
50
using enacted tax rates and laws that will be in effect when we expect the differences to reverse and be applied to taxable income in the years in which those temporary differences are expected to be recovered or settled. The effect on deferred taxes of a change in tax rates is recognized in income in the period that includes the enactment date. Deferred tax assets are recognized for deductible temporary differences, net operating loss carryforwards, and credit carryforwards if it is more likely than not that the tax benefits will be realized. Deferred tax assets are not recorded, however, in the following circumstances:
| | • | | A deferred tax asset is not recorded for net operating loss carryforwards created by excess tax benefits from the exercise of stock options. To the extent such net operating loss carryforwards are utilized, we will increase Stockholders’ equity. For presentation purposes, the historical and current deferred tax assets related to excess tax benefits from stock option exercises are excluded. |
| | • | | Deferred tax assets are not recorded to the extent they are attributed to uncertain tax positions. |
For deferred tax assets that cannot be recognized under the more-likely-than-not-standard, we have established a valuation allowance. In the event we determine that we would be able to realize our deferred tax assets in the future in excess of our net recorded amount, we would reverse the valuation allowance associated with such deferred tax assets in the period such determination was made. Also, if we were to determine that we would not be able to realize all or part of our net deferred tax assets in the future, we would record a valuation allowance on such net deferred tax assets with an offset to expense in the period such determination was made.
Derivative Financial Instruments
We are exposed to fluctuations in foreign currency exchange rates and have established a foreign currency hedging program to hedge certain foreign currency forecasted transactions and exposures from existing assets and liabilities. Our derivative instruments consist of foreign currency exchange contracts. By using derivative instruments, we subject ourselves to credit risk. If a counterparty fails to fulfill its performance obligations under a derivative contract, our credit risk will equal the fair value of the derivative instrument. Generally, when the fair value of our derivative contracts is a net asset, the counterparty owes us, thus creating a receivable risk. We minimize counterparty credit risk by entering into derivative transactions with major financial institutions and, as such, we do not expect material losses as a result of default by our counterparties. We execute foreign currency transactions in exchange-traded or over-the-counter markets for which quoted prices exist. We do not hold or issue derivative financial instruments for speculative or trading purposes.
To manage the foreign currency volatility, we aggregate exposures on a consolidated basis to take advantage of natural offsets. The primary exposures are the Japanese yen, where we are in a long position, and the euro and the British pound, where we are in a short position. Most large European revenue contracts are denominated and paid to us in U.S. dollars while our European expenses, including substantial research and development operations, are paid in local currencies causing a short position in the euro and the British pound. In addition, we experience greater inflows than outflows of Japanese yen as almost all Japanese-based customers contract and pay us in Japanese yen. While these exposures are aggregated on a consolidated basis to take advantage of natural offsets, substantial exposures remain.
To partially offset the net exposures in the euro, British pound, and the Japanese yen, we enter into foreign currency exchange contracts of less than one year which are designated as cash flow hedges. Any gain or loss on Japanese yen contracts is classified as product revenue when the hedged transaction occurs while any gain or loss on euro and British pound contracts is classified as operating expense when the hedged transaction occurs.
We report the fair value of derivatives as a net asset or liability in the consolidated balance sheet. The accounting for changes in the fair value of a derivative depends upon whether it has been designated in a hedging relationship and on the type of hedging relationship. To qualify for designation in a hedging relationship, specific criteria must be met and the appropriate documentation maintained. Hedging relationships, if designated, are established pursuant to our risk management policy and are initially and regularly evaluated to determine whether they are expected to be, and have been, highly effective hedges. We formally document all relationships between foreign currency exchange contracts and hedged items as well as our risk management objectives and strategies for undertaking various hedge transactions. All hedges designated as cash flow hedges are linked to forecasted transactions and we assess, both at inception of the hedge and on an ongoing basis, the effectiveness of the foreign currency exchange contracts in offsetting changes in the cash flows of the hedged items. We report the effective portions of the net gains or losses
51
on foreign currency exchange contracts as a component of accumulated other comprehensive income in stockholders’ equity. Accumulated other comprehensive income associated with hedges of forecasted transactions is reclassified to the consolidated statement of operations in the same period the forecasted transaction occurs.
We discontinue hedge accounting prospectively when we determine that a derivative is not highly effective as a hedge and recognize future changes in the fair value of the derivative in earnings each period. We recognize changes in the fair value of derivatives not designated in a hedging relationship or derivatives that do not qualify for hedge accounting in earnings each period. For derivatives designated as a hedge of a forecasted transaction (cash flow hedge), we report the effective portion of the change in the fair value of the derivative in stockholders’ equity as a component of accumulated other comprehensive income and reclassify it into earnings in the period in which the forecasted transaction occurs. We expect substantially all of the hedge balance in accumulated other comprehensive income to be reclassified to the consolidated statement of operations within the next twelve months.
We recognize amounts excluded from the effectiveness calculation and any ineffective portion of the change in fair value of the derivative currently in earnings. We regularly evaluate forecasted transactions designated as the hedged item in a cash flow hedge to assess whether they continue to be probable of occurring. To the extent a forecasted transaction is no longer deemed probable of occurring, we prospectively discontinue hedge accounting treatment and we reclassify deferred amounts to other income (expense), net in the consolidated statement of operations. We noted no such instance during the years ended January 31, 2011, 2010, or 2009.
Revenue Recognition
We report revenue in two categories based on how the revenue is generated: (i) system and software and (ii) service and support.
System and software revenues – We derive system and software revenues from the sale of licenses of software products, emulation hardware systems, and finance fee revenues from our long-term installment receivables resulting from product sales. We primarily license our products using two different license types:
1. Term licenses – We use this license type primarily for software sales. This license type provides the customer with the right to use a fixed list of software products for a specified time period, typically three years, with payments spread over the license term, and does not provide the customer with the right to use the products after the end of the term. Term license arrangements may allow the customer to share products between multiple locations and remix product usage from the fixed list of products at regular intervals during the license term. We generally recognize product revenue from term license arrangements upon product delivery and start of the license term. In a term license agreement where we provide the customer with rights to unspecified or unreleased future products, we recognize revenue ratably over the license term.
2. Perpetual licenses – We use this license type for software and emulation hardware system sales. This license type provides the customer with the right to use the product in perpetuity and typically does not provide for extended payment terms. We generally recognize product revenue from perpetual license arrangements upon product delivery assuming all other criteria for revenue recognition have been met.
We include finance fee revenues from the accretion on the discount of long-term installment receivables in system and software revenues. Finance fee revenues were 2.0% of total revenues for fiscal 2011, 1.9% of total revenues for fiscal 2010 and 2.1% of total revenues for fiscal 2009.
Service and support revenues – We derive service and support revenues from software and hardware post-contract maintenance or support services and professional services, which include consulting, training, and other services. We recognize revenue ratably over the support services term. We record professional service revenue as the services are provided to the customer.
We apply the FASB guidance in Accounting Standards Codification (ASC) 985 “Revenue Recognition – Software” to the sale of licenses of software products. Beginning February 1, 2010, we adopted FASB Accounting Standards Update (ASU) No. 2009-13 Revenue Recognition (Topic 605)- “Multiple-Deliverable Revenue Arrangements” and ASU No. 2009-14 Software (Topic 985)- “Certain Revenue Arrangements That Include Software Elements,” (together the ASUs). The adoption of the ASUs did not have a material impact to revenue in periods subsequent to adoption. However, it may result in recognition of revenue into periods earlier than that revenue would have been recognized prior to the adoption of the ASUs. We apply the authoritative guidance in Topic 605 applicable to multiple-element arrangements to the sale of our emulation hardware systems that contain software components and non-software components that function together to deliver the hardware’s essential functionality.
52
We determine whether product revenue recognition is appropriate based upon the evaluation of whether the following four criteria have been met:
1. Persuasive evidence of an arrangement exists – Generally, we use either a customer signed contract or qualified customer purchase order as evidence of an arrangement for both term and perpetual licenses. For professional service engagements, we generally use a signed professional services agreement and a statement of work to evidence an arrangement. Sales through our distributors are evidenced by an agreement governing the relationship, together with binding purchase orders from the distributor on a transaction-by-transaction basis.
2. Delivery has occurred – We generally deliver software and the corresponding access keys to customers electronically. Electronic delivery occurs when we provide the customer access to the software. We may also deliver the software on a compact disc. With respect to emulation hardware systems, we transfer title to the customer upon shipment. Our software license and emulation hardware system agreements generally do not contain conditions for acceptance.
3. Fee is fixed or determinable – We assess whether a fee is fixed or determinable at the outset of the arrangement, primarily based on the payment terms associated with the transaction. We have established a history of collecting under the original contract with installment terms without providing concessions on payments, products, or services. Additionally, for installment contracts, we determine that the fee is fixed or determinable if the arrangement has a payment schedule that is within the term of the licenses and the payments are collected in equal or nearly equal installments, when evaluated on a cumulative basis. If the fee is not deemed to be fixed or determinable, we recognize revenue as payments become due and payable.
Significant judgment is involved in assessing whether a fee is fixed or determinable. We must also make these judgments when assessing whether a contract amendment to a term arrangement (primarily in the context of a license extension or renewal) constitutes a concession. Our experience has been that we are able to determine whether a fee is fixed or determinable for term licenses. If we no longer were to have a history of collecting under the original contract without providing concessions on term licenses, revenue from term licenses would be required to be recognized when payments under the installment contract become due and payable. Such a change could have a material impact on our results of operations.
4. Collectibility is probable – To recognize revenue, we must judge collectibility of the arrangement fees on a customer-by-customer basis pursuant to our credit review process. We typically sell to customers with whom there is a history of successful collection. We evaluate the financial position and a customer’s ability to pay whenever an existing customer purchases new products, renews an existing arrangement, or requests an increase in credit terms. For certain industries for which our products are not considered core to the industry or the industry is generally considered troubled, we impose higher credit standards. If we determine that collectibility is not probable based upon our credit review process or the customer’s payment history, we recognize revenue as payments are received.
Multiple element arrangements involving software licenses – For multiple element arrangements involving software and other software-related deliverables, vendor-specific objective evidence of fair value (VSOE) must exist to allocate the total fee among all delivered and non-essential undelivered elements of the arrangement. If undelivered elements of the arrangement are essential to the functionality of the product, we defer revenue until the essential elements are delivered. If VSOE does not exist for one or more non-essential undelivered elements, we defer revenue until such evidence exists for the undelivered elements, or until all elements are delivered, whichever is earlier. If VSOE of all non-essential undelivered elements exist but VSOE does not exist for one or more delivered elements, we recognize revenue using the residual method. Under the residual method, we defer revenue related to the undelivered elements based upon VSOE and we recognize the remaining portion of the arrangement fee as revenue for the delivered elements, assuming all other criteria for revenue recognition are met. If we can no longer establish VSOE for non-essential undelivered elements of multiple element arrangements, we defer revenue until all elements are delivered or VSOE was established for the undelivered elements, whichever is earlier.
We base our VSOE for certain product elements of an arrangement upon the pricing in comparable transactions when the element is sold separately. We primarily base our VSOE for term and perpetual support services upon customer renewal history where the services are sold separately. We also base VSOE for professional services and installation services for emulation hardware systems upon the price charged when the services are sold separately.
Prior to February 1, 2010, for emulation hardware systems where the software was determined to be more than incidental under prior authoritative guidance, we recognized revenue consistent with the discussion above for multiple element arrangements involving software licenses.
53
Multiple element arrangements involving hardware – Effective February 1, 2010, for multiple element arrangements involving our emulation hardware systems, we allocate revenue to each element based on the relative selling price of each deliverable. In order to meet the separation criteria to allocate revenue to each element we must determine the standalone selling price of each element using a hierarchy of evidence. The authoritative guidance requires that, in the absence of VSOE or third-party evidence (TPE), a company must develop an estimated selling price (ESP). ESP is defined as the price at which the vendor would transact if the deliverable was sold by the vendor regularly on a standalone basis. A company should consider market conditions as well as entity-specific factors when estimating a selling price.
When VSOE or TPE does not exist, we base our ESP for certain elements in arrangements based on either costs incurred to manufacture a product plus a reasonable profit margin or standalone sales to similar customers. In determining profit margins, we consider current market conditions, pricing strategies related to the class of customer, and the level of penetration we have with the customer. In other cases, we may have limited sales on a standalone basis to the same or similar customers and/or guaranteed pricing on future purchases of the same item. If we are not able to develop ESP for one or more elements or we are unable to demonstrate value on a standalone basis of an element, we could be required to combine elements which could impact the timing of revenue recognition if not delivered together. We no longer apply the residual method for hardware arrangements.
Software Development Costs
We capitalize software development costs beginning when a product’s technological feasibility has been established by either completion of a detail program design or completion of a working model of the product and ending when a product is available for general release to customers. The period between the achievement of technological feasibility and the general release of our products has historically been of short duration. As a result, such capitalizable software development costs were insignificant and have been charged to Research and development expense in all periods in the accompanying consolidated statements of operations. We capitalized acquired technology costs of $468 during fiscal 2009. We did not capitalize any acquired technology costs during fiscal 2011 or fiscal 2010.
Leases
For lease agreements with escalation clauses, we record the total rent to be paid under the lease on a straight-line basis over the term of the lease, with the difference between the expense recognized and the cash paid recorded as a deferred rent liability included in accrued liabilities, for amounts to be recognized within twelve months, and other long-term liabilities, for amounts to be recognized after twelve months from the balance sheet date, in the consolidated balance sheets.
Advertising Costs
We expense all advertising costs as incurred. Advertising expense is included in marketing and selling expense in the accompanying consolidated statement of operations and was as follows:
| | | | | | | | | | | | |
Year ended January 31, | | 2011 | | | 2010 | | | 2009 | |
Advertising expense | | $ | 3,528 | | | $ | 3,668 | | | $ | 4,447 | |
Special Charges
We record restructuring charges within special charges in the consolidated statements of operations in connection with our plans to better align our cost structure with projected operations in the future. Special charges primarily consist of costs incurred for employee terminations due to a reduction of personnel resources driven by modifications of business strategy or business emphasis. Special charges may also include expenses incurred related to acquisitions, excess facility costs, asset-related charges, post-acquisition rebalance costs and restructuring costs, including severance and benefits.
Net Income (Loss) Per Share
We compute basic net income (loss) per share using the weighted average number of common shares outstanding during the period. We compute diluted net income (loss) per share using the weighted average number of common shares and potentially dilutive common shares outstanding during the period. Potentially dilutive common shares
54
consist of common shares issuable upon exercise of employee stock options, purchase rights from employee stock purchase plans, and warrants using the treasury stock method and common shares issuable upon conversion of the convertible subordinated debentures, if dilutive. See additional discussion in Note 14. “Net Income (Loss) Per Share.”
Accounting for Stock-Based Compensation
We measure stock-based compensation cost at the grant date, based on the fair value of the award, and recognize the expense on a straight-line basis over the employee’s requisite service period. For options and stock awards that vest fully on any termination of service, there is no requisite service period and consequently we recognize the expense fully in the period in which the award is granted. We present the excess tax benefit from the exercise of stock options when such benefit is utilized that was previously recorded as a financing activity in the consolidated statements of cash flows.
We have elected to compute the timing of excess tax benefits from the exercise of stock options on the “with-and-without” approach. Under this approach, we will not record an excess tax benefit until such time as a cash tax benefit is recognized. Further, we will include the impact of these excess tax benefits in the calculation of indirect tax attributes, such as the research and development credit and the domestic manufacturing deduction. We will compute the pool of excess tax benefits available to offset any future shortfalls in the tax benefits actually realized on exercises of stock options as a single pool for employees and non-employees.
We estimate the fair value of stock options and purchase rights under our employee stock purchase plans (ESPPs) using a Black-Scholes option-pricing model. The Black-Scholes option-pricing model incorporates several highly subjective assumptions including expected volatility, expected term, and interest rates.
In reaching our determination of expected volatility for options, we include the following elements:
| | • | | Historical volatility of our shares of common stock; |
| | • | | Historical volatility of shares of comparable companies; |
| | • | | Implied volatility of our traded options; and |
| | • | | Implied volatility of traded options of comparable companies. |
In determining expected volatility for purchase rights under our ESPP, we use the historical volatility of our shares of common stock. Prior to the July 1, 2010 offering, we based the expected term of our ESPP on the average term of the series of offerings. Beginning with the July 1, 2010 offering, we based the expected term on the six month offering period. The change to the ESPP is further described in Note 12. “Employee stock and Savings Plan”.
We base the expected term of our stock options on historical experience.
The risk-free interest rate for periods within the contractual life of the award is based on the U.S. Treasury yield curve in effect at the time of the grant.
The fair value of restricted stock units is the market value as of the grant date.
Other Comprehensive Income (Loss)
We record comprehensive income (loss) in accordance with the applicable FASB guidance, which defines comprehensive income (loss) as the change in equity during a period from transactions and other events and circumstances from nonowner sources, including net income (loss) as well as foreign currency translation adjustments, adjustments to the minimum pension liability, unrecognized actuarial losses not included in periodic benefit costs for a defined benefit plan in Japan, and unrealized gain (loss) on derivative contracts.
Transfer of Financial Assets
We finance certain software license agreements with customers through the sale, assignment, and transfer of the future payments under those agreements to financing institutions on a non-recourse basis. We retain no interest in the transferred receivable. We record such transfers as sales of the related accounts receivable when we are considered to have surrendered control of such receivables. The gain or loss on the sale of receivables is included in general and adminstration in operating expenses in our consolidated statement of operations. The gain or loss on the sale of receivables consists of two components: (i) the discount on sold receivables, which is the difference between the undiscounted balance of the receivables, and the net proceeds received from the financing institution and (ii) the unaccreted interest on the receivables sold. We impute interest on the receivables based on prevailing market rates and record this as a discount against the receivable.
55
We sold the following trade receivables to financing institutions on a non-recourse basis and recognized the following (gain) loss on the sale of those receivables:
| | | | | | | | | | | | |
Year ended January 31, | | 2011 | | | 2010 | | | 2009 | |
Trade receivables, short-term | | $ | 27,011 | | | $ | 14,557 | | | $ | 28,059 | |
Term receivables, long-term | | | 26,554 | | | | 19,452 | | | | 29,128 | |
| | | | | | | | | | | | |
Total receivables sold | | | 53,565 | | | | 34,009 | | | | 57,187 | |
Net proceeds | | | 51,601 | | | | 31,838 | | | | 54,200 | |
| | | | | | | | | | | | |
Discount on sold receivables | | | (1,964 | ) | | | (2,171 | ) | | | (2,987 | ) |
Unaccreted interest on sold receivables | | | 2,133 | | | | 1,549 | | | | 3,011 | |
| | | | | | | | | | | | |
Gain (loss) on sale of receivables | | $ | 169 | | | $ | (622 | ) | | $ | 24 | |
| | | | | | | | | | | | |
3. Impairment of Long-Lived Assets
As of January 31, 2009, due to the adverse market conditions and declines in our market capitalization, we completed a review of our long-lived assets for impairment. We assessed the recoverability of our long-lived asset groups by determining whether their carrying values were greater than the forecasted undiscounted net cash flows of the related assets. If we determined the assets were impaired, we wrote down the assets to their estimated fair value. We determined fair value based on forecasted discounted net cash flows or appraised values, depending upon the nature of the assets. For purposes of this evaluation, long-lived assets were grouped with other assets and liabilities at the lowest level for which identifiable cash flows are largely independent of the cash flows of other assets and liabilities. We determined that our cash flows can be subdivided into six separate asset groups for impairment testing. The long-lived assets of each group consist primarily of purchased technology, other intangibles and property, plant, and equipment. Based on this evaluation, it was determined that one of our asset groups was impaired.
We recorded an impairment loss during fiscal 2009 for the difference between the carrying value and the fair value of the long-lived assets of this asset group. We used an income approach and forecasted discounted net cash flows to determine the fair value of the assets. The sum of forecasted net cash flows of the division resulted in a negative value and the fair value of the assets was determined to be zero. An impairment loss was recorded for the full carrying value of the group’s long-lived assets. Accordingly, we recorded an impairment loss of $4,553 in Operating expenses in our consolidated statement of operations for fiscal 2009. The impaired assets continue to be used in our operations.
At January 31, 2011 and 2010, we completed similar reviews of long-lived assets for impairment. Based on these reviews, no impairment was deemed necessary for fiscal 2011 or 2010.
4. Fair Value Measurement
The following table presents information about financial assets and liabilities required to be carried at fair value on a recurring basis as of January 31, 2011:
| | | | | | | | | | | | | | | | |
| | | Fair Value | | | Level 1 | | | Level 2 | | | Level 3 | |
Foreign currency exchange contracts | | $ | 826 | | | $ | — | | | $ | 826 | | | $ | — | |
Contingent consideration | | | (5,342 | ) | | | — | | | | — | | | | (5,342 | ) |
| | | | | | | | | | | | | | | | |
Total | | $ | (4,516 | ) | | $ | — | | | $ | 826 | | | $ | (5,342 | ) |
| | | | | | | | | | | | | | | | |
56
The following table presents information about financial assets and liabilities required to be carried at fair value on a recurring basis as of January 31, 2010:
| | | | | | | | | | | | | | | | |
| | | Fair Value | | | Level 1 | | | Level 2 | | | Level 3 | |
Foreign currency exchange contracts | | $ | (4,619 | ) | | $ | — | | | $ | (4,619 | ) | | $ | — | |
Contingent consideration | | | (1,822 | ) | | | — | | | | — | | | | (1,822 | ) |
| | | | | | | | | | | | | | | | |
Total | | $ | (6,441 | ) | | $ | — | | | $ | (4,619 | ) | | $ | (1,822 | ) |
| | | | | | | | | | | | | | | | |
In connection with certain acquisitions in fiscal 2011 and fiscal 2010, payment of a portion of the purchase price is contingent upon the acquired business’ achievement of certain revenue goals. We have estimated the fair value of this contingent consideration as the present value of the expected contingent payments over the term of the arrangements and have included the balance in other long-term liabilities on our consolidated balance sheet. During the year ended January 31, 2011, we recorded a decrease in our fiscal 2010 liability for contingent consideration resulting in a gain of $760 in special charges in our consolidated statement of operations. The change in the liability was due to a change in the timing of a future product release.
The following table summarizes Level 3 activity:
| | | | |
Balance as of January 31, 2009 | | $ | — | |
Contingent consideration | | | 1,770 | |
Interest accretion | | | 52 | |
| | | | |
Balance as of January 31, 2010 | | | 1,822 | |
Contingent consideration | | | 4,260 | |
Change in estimate | | | (760 | ) |
Interest accretion | | | 20 | |
| | | | |
Balance as of January 31, 2011 | | $ | 5,342 | |
| | | | |
The following table summarizes the fair value and carrying value of notes payable:
| | | | | | | | |
As of January 31, | | 2011 | | | 2010 | |
Fair value of notes payable | | $ | 221,291 | | | $ | 192,321 | |
Carrying value of notes payable | | $ | 209,348 | | | $ | 188,347 | |
We based the fair value of notes payable on the quoted market price or rates available to us for instruments with similar terms and maturities. Of the total carrying value of notes payable, $2,000 as of January 31, 2011 and $32,272 as of January 31, 2010, was classified as current on our consolidated balance sheets. The carrying amount of Short-term borrowings of $15,544 as of January 31, 2011 and $37,874 as of January 31, 2010 approximates fair value because of the short-term nature of the instruments.
5. Business Combinations
For each business we acquire, the excess of the fair value of the consideration transferred over the fair value of the net tangible assets acquired and net tangible liabilities assumed was allocated to various identifiable intangible assets and goodwill. Identifiable intangible assets typically consist of purchased technology and customer-related intangibles, which are amortized to expense over their useful lives. Goodwill, representing the excess of the purchase consideration over the fair value of net tangible and identifiable intangible assets, is not amortized.
57
Acquisitions during the year ended January 31, 2011
| | | | | | | | | | | | | | | | | | | | |
Acquisition | | Total
Consideration | | | Net Tangible
Assets
Acquired | | | Identifiable
Intangible
Assets
Acquired | | | Deferred Tax
Liability | | | Goodwill | |
Valor | | $ | 86,903 | | | $ | 47,423 | | | $ | 18,600 | | | $ | (11,636 | ) | | $ | 32,516 | |
CodeSourcery | | | 18,497 | | | | 1,981 | | | | 4,060 | | | | — | | | | 12,456 | |
Other | | | 7,720 | | | | 22 | | | | 2,240 | | | | — | | | | 5,458 | |
| | | | | | | | | | | | | | | | | | | | |
Total | | $ | 113,120 | | | $ | 49,426 | | | $ | 24,900 | | | $ | (11,636 | ) | | $ | 50,430 | |
| | | | | | | | | | | | | | | | | | | | |
On March 18, 2010, we acquired all of the outstanding common shares of Valor, a provider of productivity improvement software solutions for the printed circuit board manufacturing supply chain. The acquisition was an investment aimed at extending our scope into the market for printed circuit board systems manufacturing solutions. Under the terms of the merger agreement, Valor shareholders received 5,621 shares of our common stock and cash of $32,715. The common stock issued to the former common shareholders of Valor had a fair value of $47,163, based on our closing price on March 18, 2010 of $8.39 per share. Additionally, under the merger agreement, we converted Valor’s outstanding stock options into options to purchase shares of our common stock, resulting in additional consideration of $7,025. Included in net tangible assets acquired was the fair value of the Frontline investment of $29,500 and cash acquired of $27,110.
The identified intangible assets acquired consisted of purchase technology of $12,300 and other intangibles of $6,300. We are amortizing purchased technology to cost of revenues over three years and other intangibles to operating expenses over one to four years. The goodwill created by the transaction is not deductible for tax purposes. Key factors that make up the goodwill created by the transaction include expected synergies from the combination of operations and the knowledge and experience of the acquired workforce and infrastructure.
On November 5, 2010, we acquired the technology and certain other related assets of CodeSourcery, Inc., a provider of open source GNU-based toolchains and services for advanced systems development. The acquisition was an investment aimed at increasing the value of our embedded solutions. Under the terms of the purchase agreement, total consideration consisted of $10,000 in cash at closing, deferred payments valued at $5,247, and contingent consideration with a fair value of $3,250. Payment of the contingent consideration is based upon the acquired business’ achievement of certain revenue goals. We have estimated the fair value of this contingent consideration as the present value of the expected contingent payments over the term of the arrangement. The total contingent payments cannot exceed $6,000 over the term of the arrangement.
The identified intangible assets acquired consisted of purchase technology of $530 and other intangibles of $3,530. We are amortizing purchased technology to cost of revenues over four years and other intangibles to operating expenses over one to five years. The goodwill created by the transaction is deductible for tax purposes. Key factors that make up the goodwill created by the transaction include expected synergies from the combination of operations and the knowledge and experience of the acquired workforce.
Other acquisitions for the year end January 31, 2011 consisted of three privately-held companies, which were not material individually or in the aggregate.
Acquisitions during the year ended January 31, 2010
| | | | | | | | | | | | | | | | | | | | |
Acquisition | | Total
Consideration | | | Net Tangible
Assets
Acquired | | | Identifiable
Intangible
Assets
Acquired | | | Deferred Tax
Liability | | | Goodwill | |
LogicVision, Inc. | | $ | 15,352 | | | $ | 1,151 | | | $ | 7,470 | | | $ | — | | | $ | 6,731 | |
Other | | | 9,310 | | | | 190 | | | | 2,490 | | | | (222 | ) | | | 6,852 | |
| | | | | | | | | | | | | | | | | | | | |
| | $ | 24,662 | | | $ | 1,341 | | | $ | 9,960 | | | $ | (222 | ) | | $ | 13,583 | |
| | | | | | | | | | | | | | | | | | | | |
On August 18, 2009, we acquired all of the outstanding common shares of LogicVision, Inc. (LogicVision), a test and yield learning company in the semiconductor design-for-test sector. The acquisition was an investment aimed at extending our product offerings within the EDA industry. Under the terms of the purchase agreement, LogicVision
58
shareholders received 0.2006 of a share of our common stock for each LogicVision common share. Accordingly, we issued 1,903 shares of our common stock to the former common shareholders of LogicVision, resulting in consideration transferred for the common stock issued of $14,289, at our closing price on August 18, 2009 of $7.51 per share. The purchase agreement also required that we exchange our stock options for LogicVision’s outstanding stock options resulting in additional consideration of $1,063, representing the fair value of stock options issued that are attributable to the pre-combination service period. The identified intangible assets acquired consisted of purchased technology of $5,260 and other intangibles of $2,210. The goodwill created by the transaction is not deductible for tax purposes. Key factors that make up the goodwill created by the transaction include expected synergies from the combination of operations, future technologies, and the knowledge and experience of the acquired workforce. We included the results of the LogicVision operations in our consolidated financial statements from the date of acquisition forward.
Other acquisitions for the year ended January 31, 2010 consisted of three privately-held companies, which were not material individually or in the aggregate.
Acquisitions during the year ended January 31, 2009
| | | | | | | | | | | | | | | | | | | | | | | | |
Acquisition | | Total
Consideration | | | Net Tangible
Assets
Acquired /
(Liabilities
Assumed) | | | Identifiable
Intangible
Assets
Acquired | | | Deferred Tax
Liability | | | In-Process
Research &
Development | | | Goodwill | |
Flomerics Group, PLC | | $ | 58,588 | | | $ | 13,549 | | | $ | 25,870 | | | $ | (7,281 | ) | | $ | 6,790 | | | $ | 19,660 | |
Other | | | 5,687 | | | | (567 | ) | | | 1,970 | | | | — | | | | 1,300 | | | | 2,984 | |
| | | | | | | | | | | | | | | | | | | | | | | | |
| | $ | 64,275 | | | $ | 12,982 | | | $ | 27,840 | | | $ | (7,281 | ) | | $ | 8,090 | | | $ | 22,644 | |
| | | | | | | | | | | | | | | | | | | | | | | | |
In May 2008, our Board of Directors announced a cash offer to acquire all of the issued or to be issued ordinary shares of Flomerics Group, PLC (Flomerics), a publicly traded company headquartered in Surrey, United Kingdom. Flomerics was a market leader in the computer simulation of mechanical engineering design processes including heat transfer and fluid flow simulation. On July 9, 2008, we obtained greater than 50% of the then outstanding ordinary shares of Flomerics and we began including Flomerics in our results of operations. As of January 31, 2009, we had acquired all of the outstanding or to be outstanding, ordinary shares of Flomerics. The identifiable intangible assets of Flomerics consist of purchased technology of $17,870 and other identified assets of $8,000. The goodwill created by the transaction is not deductible for tax purposes.
Other acquisitions for the year ended January 31, 2009 consisted of a privately-held company we acquired for cash, which was not individually material.
The value assigned to in-process research and development for the charges incurred related to business acquisitions in the year ended January 31, 2009 related to research projects for which technological feasibility had not been established. The value was determined by estimating the net cash flows from the sale of products resulting from the completion of such projects and discounting the net cash flows back to their present value. The rate used to discount the net cash flows was based on the weighted average cost of capital. Other factors considered were the inherent uncertainties in future revenue estimates from technology investments including the uncertainty surrounding the successful development of the acquired in-process technology, the useful life of the technology, the profitability levels of the technology, and the stage of completion of the technology. The stage of completion of the products at the date of the acquisition were estimated based on research and development costs that had been expended as of the date of acquisition as compared to total research and development costs expected at completion. The percentages derived from this calculation were then applied to the net present value of future cash flows to determine the in-process charge. The nature of the efforts to develop the in-process technology into commercially viable products principally related to the completion of all planning, designing, prototyping, verification, and testing activities that are necessary to establish that the product can be produced to meet its design specification, including function, features, and technical performance requirements. The estimated net cash flows from these products were based on estimates of related revenues, cost of sales, research and development costs, selling, general and administration costs, and income taxes. These estimates are subject to change, given the uncertainties of the development process, and no assurance can be given that deviations from these estimates will not occur or that we will realize any anticipated benefits of the acquisition. The risks associated with acquired research and development are considered high and no assurance can be made that these products will generate any benefit or meet market expectations.
59
The separate results of operations for the acquisitions during the years ended January 31, 2011, 2010, and 2009 were not material, individually or in the aggregate, compared to our overall results of operations and accordingly pro-forma financial statements of the combined entities have been omitted.
6. Property, Plant, and Equipment, Net
A summary of property, plant, and equipment, net follows:
| | | | | | | | |
As of January 31, | | 2011 | | | 2010 | |
| Computer equipment and furniture | | $ | 265,450 | | | $ | 247,211 | |
| Buildings and building equipment | | | 75,211 | | | | 62,363 | |
| Land and improvements | | | 21,044 | | | | 20,782 | |
| Leasehold improvements | | | 35,211 | | | | 43,708 | |
| | | | | | | | |
| | | 396,916 | | | | 374,064 | |
| Less accumulated depreciation and amortization | | | (257,576 | ) | | | (252,269 | ) |
| | | | | | | | |
Property, plant, and equipment, net | | $ | 139,340 | | | $ | 121,795 | |
| | | | | | | | |
In January 2010, we purchased three buildings in Fremont, California. We have capitalized $31,569 in acquisition costs which is included in Buildings and building equipment and land and improvements. We relocated all of our San Jose research and development, sales, and administrative operations to Fremont at the termination of our existing San Jose leases in the third quarter of fiscal 2011 and began depreciation of the facilities upon occupation.
7. Derivative Instruments and Hedging Activities
The fair values and balance sheet presentation of our derivative instruments as of January 31, 2011 are summarized as follows:
| | | | | | | | | | |
| | | Location | | Asset
Derivatives | | | Liability
Derivatives | |
Derivatives designated as hedging instruments Cash flow forwards | | Other receivables | | $ | 575 | | | $ | (414 | ) |
Derivatives not designated as hedging instruments Non-designated forwards | | Other receivables | | | 1,125 | | | | (460 | ) |
| | | | | | | | | | |
| Total derivatives | | | | $ | 1,700 | | | $ | (874 | ) |
| | | | | | | | | | |
The fair values and balance sheet presentation of our derivative instruments as of January 31, 2010 are summarized as follows:
| | | | | | | | | | | | |
| | | Location | | | Asset
Derivatives | | | Liability
Derivatives | |
Derivatives designated as hedging instruments Cash flow forwards | | | Accrued liabilities | | | $ | 91 | | | $ | (1,867 | ) |
Derivatives not designated as hedging instruments Non-designated forwards | | | Accrued liabilities | | | | 159 | | | | (3,002 | ) |
| | | | | | | | | | | | |
Total derivatives | | | | | | $ | 250 | | | $ | (4,869 | ) |
| | | | | | | | | | | | |
60
During the year ended January 31, 2011, we entered into 1,370 new foreign currency forward contracts, of which 37 contracts were outstanding as of January 31, 2011 with a gross notional value of $209,605. For the year ended January 31, 2010, we entered into 15 new foreign currency option contracts and 1,340 new foreign currency forward contracts, of which 43 foreign currency forward contracts were outstanding as of January 31, 2010 with a gross notional value of $182,572. Notional amounts do not quantify risk or represent our assets or liabilities but are used in the calculation of cash settlements under the contracts.
The pre-tax effect of derivative instruments in cash flow hedging relationships on income and other comprehensive income (OCI) for the year ended January 31, 2011 is as follows:
| | | | | | | | | | | | | | | | |
Derivatives Designated as Hedging Instruments | | Loss Recognized in OCI on
Derivatives
(Effective Portion) | | | Loss Reclassified from Accumulated OCI into Income (Effective Portion) | | | Gain Recognized in Income on Derivatives
(Ineffective Portion and Amount Excluded from Effectiveness Testing) | |
| | | Amount | | | Location | | Amount | | | Location | | Amount | |
Cash flow forwards | | $ | (3,101 | ) | | Revenues | | $ | (1,967 | ) | | Other income (expense), net | | $ | 101 | |
| | | | | | Operating expenses | | | (2,997 | ) | | | | | | |
| | | | | | | | | | | | | | | | |
Total | | $ | (3,101 | ) | | | | $ | (4,964 | ) | | | | $ | 101 | |
| | | | | | | | | | | | | | | | |
Included in the gain on cash flow forwards of $101 recognized in other income (expense), net for the year ended January 31, 2011 is $100 related to the time value exclusion of foreign currency forward contracts from our assessment of hedge effectiveness.
The pre-tax effect of derivative instruments in cash flow hedging relationships on income and OCI for the year ended January 31, 2010 is as follows:
| | | | | | | | | | | | | | | | |
Derivatives Designated as Hedging Instruments | | Gain Recognized in OCI on
Derivatives
(Effective Portion) | | | Gain (Loss) Reclassified from
Accumulated OCI into Income (Effective Portion) | | | Gain (Loss) Recognized in Income on Derivatives
(Ineffective Portion and Amount Excluded from Effectiveness Testing) | |
| | | Amount | | | Location | | Amount | | | Location | | Amount | |
Cash flow forwards | | $ | 3,641 | | | Revenues | | $ | (2,350 | ) | | Other income (expense), net | | $ | 180 | |
| | | | | | Operating expenses | | | 2,450 | | | | | | | |
Cash flow options | | | 13 | | | Revenues | | | (419 | ) | | Other income (expense), net | | | (5 | ) |
| | | | | | Operating expenses | | | (1,031 | ) | | | | | | |
| | | | | | | | | | | | | | | | |
Total | | $ | 3,654 | | | | | $ | (1,350 | ) | | | | $ | 175 | |
| | | | | | | | | | | | | | | | |
Included in the gain on cash flow forwards and options of $175 recognized in other income (expense), net for the year ended January 31, 2011 is $179 related to the time value exclusion of foreign currency forward contracts from our assessment of hedge effectiveness.
The hedge balance in accumulated other comprehensive income was as follows:
| | | | | | | | |
As of January 31, | | 2011 | | | 2010 | |
Accumulated OCI before tax effect | | $ | (69 | ) | | $ | 1,794 | |
Accumulated OCI after tax effect | | $ | (2 | ) | | $ | 1,587 | |
The balance represents a net unrealized loss on foreign currency exchange contracts related to hedges of forecasted revenues and expenses expected to occur within the next twelve months.
We enter into foreign currency exchange contracts to offset the earnings impact relating to the variability in exchange rates on certain short-term monetary assets and liabilities denominated in non-functional currencies. We do not designate these foreign currency contracts as hedges. The effect of derivative instruments not designated as hedging instruments on income is as follows:
| | | | | | | | | | |
Derivatives Not Designated as Hedging Instruments | | Gain Recognized in Income on Derivatives | |
| | | Location | | Amount as of
January 31, 2011 | | | Amount as of
January 31, 2010 | |
Non-designated forwards | | Other income (expense), net | | $ | 2,083 | | | $ | 5,924 | |
61
8. Short-Term Borrowings
Short-term borrowings consisted of the following:
| | | | | | | | |
As of January 31, | | 2011 | | | 2010 | |
Senior revolving credit facility | | $ | — | | | $ | 20,000 | |
Collections of previously sold accounts receivable | | | 10,680 | | | | 13,388 | |
Other borrowings | | | 4,864 | | | | 4,486 | |
| | | | | | | | |
Short-term borrowings | | $ | 15,544 | | | $ | 37,874 | |
| | | | | | | | |
We have a syndicated, senior, unsecured, revolving credit facility that terminates June 1, 2011. In April 2010, we amended the revolving credit facility to reduce the maximum borrowing capacity from $140,000 to $100,000 and retained an option to increase the maximum borrowing capacity by $30,000. Under this revolving credit facility, we have the option to pay interest based on:
| | (i) | London Interbank Offered Rate (LIBOR) with varying maturities commensurate with the borrowing period we select, plus a spread of between 1.0% and 1.6%, based on a pricing grid tied to a financial covenant, or |
| | (ii) | A base rate plus a spread of between 0.0% and 0.6%, based on a pricing grid tied to a financial covenant. |
The base rate is defined as the higher of:
| | (i) | The federal funds rate, as defined, plus 0.5%, |
| | (ii) | The prime rate of the lead bank, or |
| | (iii) | One-month LIBOR plus 1.0%. |
As a result of these interest rate options, our interest expense associated with borrowings under this revolving credit facility will vary with market interest rates. In addition, commitment fees are payable on the unused portion of the revolving credit facility at rates between 0.25% and 0.35% based on a pricing grid tied to a financial covenant. We paid commitment fees as follows:
| | | | | | | | | | | | |
Year ended January 31, | | 2011 | | | 2010 | | | 2009 | |
Commitment fees | | $ | 241 | | | $ | 386 | | | $ | 327 | |
This revolving credit facility contains certain financial and other covenants, including the following:
| | • | | Our adjusted quick ratio (ratio of the sum of cash and cash equivalents, short-term investments, and net current receivables to total current liabilities) shall not be less than 0.85; |
| | • | | Our tangible net worth (stockholders’ equity less goodwill and other intangible assets) must exceed the calculated required tangible net worth as defined in the credit agreement, which establishes a fixed level of required tangible net worth. Each quarter the required level increases by 70% of any positive net income in the quarter (but in the aggregate no more than 70% of positive net income for any full fiscal year), 100% of the amortization of intangible assets in the quarter, and 100% of certain stock issuance proceeds. The required level also decreases each quarter by certain amounts of acquired intangible assets; |
| | • | | Our leverage ratio (ratio of total liabilities less subordinated debt to the sum of subordinated debt and tangible net worth) shall be less than 2.20; |
| | • | | Our senior leverage ratio (ratio of total debt less subordinated debt to the sum of subordinated debt and tangible net worth) shall not be greater than 0.90; and |
| | • | | Our minimum cash and accounts receivable ratio (ratio of the sum of cash and cash equivalents, short-term investments, and 47.5% of net current accounts receivable, to outstanding credit agreement borrowings) shall not be less than 1.25. |
The revolving credit facility prevents us from paying dividends.
We were in compliance with all financial covenants as of January 31, 2011. If we were to fail to comply with the financial covenants and did not obtain a waiver from our lenders, we would be in default under the revolving credit facility and our lenders could terminate the facility and demand immediate repayment of all outstanding loans under the revolving credit facility.
62
We borrowed $60,000 against the revolving credit facility and repaid $80,000 during fiscal 2011. We borrowed $20,000 against the revolving credit facility and repaid $20,000 during fiscal 2010.
The interest rate was 3.25% on the outstanding borrowings as of January 31, 2010.
Short-term borrowings include amounts collected from customers on accounts receivable previously sold on a non-recourse basis to financial institutions. These amounts are remitted to the financial institutions in the following quarter.
We generally have other short-term borrowings, including multi-currency lines of credit, capital leases, and other borrowings. Interest rates are generally based on the applicable country’s prime lending rate, depending on the currency borrowed.
9. Notes Payable
Notes payable consisted of the following:
| | | | | | | | |
As of January 31, | | 2011 | | | 2010 | |
6.25% Debentures due 2026, issued 2006 | | $ | 157,843 | | | $ | 154,832 | |
6.25% Debentures due 2026, issued fiscal 2011 | | | 31,705 | | | | — | |
Floating Rate Debentures due 2023 | | | — | | | | 32,272 | |
Term Loan due 2013 | | | 18,500 | | | | — | |
Other | | | 1,300 | | | | 1,243 | |
| | | | | | | | |
Notes payable | | | 209,348 | | | | 188,347 | |
Floating Rate Debentures due 2023, current portion | | | — | | | | (32,272 | ) |
Term Loan due 2013, current portion | | | (2,000 | ) | | | — | |
| | | | | | | | |
Notes payable, long-term | | $ | 207,348 | | | $ | 156,075 | |
| | | | | | | | |
Annual maturities of our notes payable are scheduled as follows:
| | | | |
Fiscal years ending January 31, | | | |
2012 | | $ | 2,000 | |
2013 | | | 3,300 | |
2014 | | | 14,500 | |
2015 | | | — | |
2016 | | | — | |
Thereafter | | | 196,509 | |
| | | | |
| | $ | 216,309 | |
| | | | |
6.25% Debentures due 2026: In March 2006, we issued $200,000 of 6.25% Convertible Subordinated Debentures (6.25% Debentures) due 2026 in a private offering pursuant to Securities and Exchange Commission (SEC) Rule 144A under the Securities Act of 1933. Interest on the 6.25% Debentures is payable semi-annually in March and September.
63
The principal amount, unamortized debt discount, net carrying amount of the liability component, and carrying amount of the equity component of the 6.25% Debentures, issued 2006, are as follows:
| | | | | | | | |
As of January 31, | | 2011 | | | 2010 | |
Principal amount | | $ | 165,000 | | | $ | 165,000 | |
Unamortized debt discount | | | (7,157 | ) | | | (10,168 | ) |
| | | | | | | | |
Net carrying amount of the liability component | | $ | 157,843 | | | $ | 154,832 | |
| | | | | | | | |
Equity component | | $ | 21,766 | | | $ | 21,766 | |
| | | | | | | | |
The unamortized debt discount will be amortized to interest expense using the effective interest method through February 2013.
We recognized the following amounts in interest expense in the consolidated statements of operations related to the 6.25% Debentures, issued 2006:
| | | | | | | | | | | | |
Year ended January 31, | | 2011 | | | 2010 | | | 2009 | |
Interest expense at the contractual interest rate | | $ | 10,322 | | | $ | 10,312 | | | $ | 10,312 | |
Amortization of debt discount | | | 3,010 | | | | 2,764 | | | | 2,540 | |
The effective interest rate on the 6.25% Debentures was 8.60% for the years ended January 31, 2011, 2010, and 2009.
In July 2010, we issued $11,509 in aggregate principal amount of the 6.25% Debentures, plus a nominal cash amount, in exchange for $11,509 in aggregate principal of the Floating Rate Convertible Subordinated Debentures (Floating Rate Debentures). In accordance with the FASB guidance in ASC 470-50, “Debt – Modification and Extinguishment,” the exchange was treated as the extinguishment of the original debt and the issuance of new debt. The terms of the new 6.25% Debentures issued in this transaction are substantially the same as the terms of our existing 6.25% Debentures. We recorded a loss on the extinguishment of debt of $345 during the year ended January 31, 2011 for cash paid to debt holders in connection with this transaction. This loss was included in interest expense in our consolidated statement of operations.
In October 2010, we issued $20,000 of 6.25% Debentures in a private offering pursuant to SEC Rule 144A under the Securities Act of 1933. The terms of the new 6.25% Debentures issued in this transaction are substantially the same as the terms of our existing 6.25% Debentures. We received $20,225 in cash upon issuance of the debentures.
No equity component was recorded for the 6.25% Debentures, issued fiscal 2011, as the conversion feature was deemed to be non-beneficial when the debt was issued.
The principal amount, unamortized premium, and net carrying amount of the 6.25% Debentures, issued fiscal 2011, are as follows:
| | | | |
As of January 31, | | 2011 | |
Principal amount | | $ | 31,509 | |
Unamortized debt premium | | | 196 | |
| | | | |
Net carrying amount of the liability component | | $ | 31,705 | |
| | | | |
The unamortized debt premium will be amortized to interest expense using the effective interest method through February 2013.
The 6.25% Debentures are convertible, under certain circumstances, into our common stock at a conversion price of $17.968 per share for a total of 10,937 shares as of January 31, 2011. These circumstances include:
| | • | | The market price of our common stock exceeding 120% of the conversion price; |
| | • | | The market price of the 6.25% Debentures declining to less than 98% of the value of the common stock into which the 6.25% Debentures are convertible; |
| | • | | A call for the redemption of the 6.25% Debentures; |
| | • | | Specified distributions to holders of our common stock; |
64
| | • | | If a fundamental change, such as a change of control, occurs; or |
| | • | | During the ten trading days prior to, but not on, the maturity date. |
Upon conversion, in lieu of shares of our common stock, for each $1 principal amount of the 6.25% Debentures a holder will receive an amount of cash equal to the lesser of:
| | (ii) | The conversion value of the number of shares of our common stock equal to the conversion rate. |
If such conversion value exceeds $1, we will also deliver, at our election, cash or common stock, or a combination of cash and common stock with a value equal to the excess. If a holder elects to convert 6.25% Debentures in connection with a fundamental change in the company that occurs prior to March 6, 2011, the holder will also be entitled to receive a make whole premium upon conversion in some circumstances. We may redeem some or all of the 6.25% Debentures for cash on or after March 6, 2011. The holders, at their option, may redeem some or all of the 6.25% Debentures for cash on March 1, 2013, 2016, or 2021. During the year ended January 31, 2011, we did not repurchase any 6.25% Debentures.
Floating Rate Debentures due 2023: In August 2003, we issued $110,000 of Floating Rate Debentures in a private offering pursuant to SEC Rule 144A under the Securities Act of 1933. Interest on the Floating Rate Debentures was payable quarterly in February, May, August, and November at a variable interest rate equal to 3-month LIBOR plus 1.65%.
As noted above, we exchanged $11,509 in aggregate principal amount of the Floating Rate Debentures during fiscal 2011. We retired the remaining obligation of $20,763 during fiscal 2011 utilizing cash on hand.
During the year ended January 31, 2010, we purchased on the open market and retired Floating Rate Debentures with a principal balance of $3,830 for a total purchase price of $3,450. In connection with this purchase, during the year ended January 31, 2010, we incurred a before tax net gain on the early extinguishment of debt of $354, which included a $380 discount on the repurchased Floating Rate Debentures and a write-off of $26 for a portion of unamortized deferred debt issuance costs.
Term Loan due 2013: In April 2010, we entered into a three-year term loan (Term Loan) for $20,000 to repay borrowings under our revolving credit facility used to purchase office buildings in Fremont, California. Fixed principal of $500 and accrued interest payments are payable quarterly in February, May, August, and November. The remaining principal balance is payable in April 2013. We have the option to pay interest based on:
| | (ii) | A base rate plus 3.5%. |
The base rate is defined as the higher of:
| | (i) | The federal funds rate, as defined, plus 0.5%, |
| | (ii) | The prime rate of the lead bank, or |
| | (iii) | One-month LIBOR plus 1.0%. |
As a result of these interest rate options, our interest expense associated with borrowings under the Term Loan will vary with market interest rates. Additionally, the term loan requires us to have a minimum cash and cash equivalent balance as of the last day of the quarter. If we fail to comply with this covenant and do not obtain a waiver from our lenders, we would be in default under the Term Loan and our lenders could terminate the loan and demand immediate repayment of the outstanding loan. The Term Loan is collateralized by our Wilsonville, Oregon campus which includes land, buildings, and improvements with a carrying value of approximately $40,000. This amount is reported in our consolidated balance sheet within property, plant, and equipment, net.
During the year ended January 31, 2011, we repaid $1,500 on the Term Loan and the principal amount of $18,500 remains outstanding. The effective interest rate was 4.87% for the year ended January 31, 2011.
Other Notes Payable: In November 2009, we issued a subordinated note payable as part of a business combination. The note bears interest at a rate of 3.875% and is due in full along with all accrued interest on November 17, 2012.
65
10. Income Taxes
Domestic and foreign pre-tax income (loss) was as follows:
| | | | | | | | | | | | |
Year ended January 31, | | 2011 | | | 2010 | | | 2009 | |
| | | |
Domestic | | $ | (56,810 | ) | | $ | (75,899 | ) | | $ | (130,600 | ) |
Foreign | | | 88,822 | | | | 56,258 | | | | 50,198 | |
| | | | | | | | | | | | |
Total pre-tax income (loss) | | $ | 32,012 | | | $ | (19,641 | ) | | $ | (80,402 | ) |
| | | | | | | | | | | | |
The provision (benefit) for income taxes was as follows:
| | | | | | | | | | | | |
Year ended January 31, | | 2011 | | | 2010 | | | 2009 | |
Current: | | | | | | | | | | | | |
Federal | | $ | (826 | ) | | $ | (1,846 | ) | | $ | (367 | ) |
State | | | 250 | | | | 407 | | | | 327 | |
Foreign | | | 9,028 | | | | 3,501 | | | | 13,100 | |
| | | | | | | | | | | | |
Total current | | | 8,452 | | | | 2,062 | | | | 13,060 | |
| | | | | | | | | | | | |
Deferred: | | | | | | | | | | | | |
Federal and state | | | 468 | | | | (163 | ) | | | (915 | ) |
Foreign | | | (5,492 | ) | | | 349 | | | | (1,295 | ) |
| | | | | | | | | | | | |
Total deferred | | | (5,024 | ) | | | 186 | | | | (2,210 | ) |
| | | | | | | | | | | | |
Total provision for income taxes | | $ | 3,428 | | | $ | 2,248 | | | $ | 10,850 | |
| | | | | | | | | | | | |
The effective tax rate differs from the federal tax rate as follows:
| | | | | | | | | | | | |
Year ended January 31, | | 2011 | | | 2010 | | | 2009 | |
Federal tax, at statutory rate | | $ | 11,204 | | | $ | (6,875 | ) | | $ | (28,141 | ) |
State tax, net of federal benefit | | | 251 | | | | 833 | | | | 1,219 | |
Impact of international operations including withholding taxes and other reserves | | | (27,784 | ) | | | (16,897 | ) | | | (9,546 | ) |
Costs incurred for stock of acquired business | | | (3 | ) | | | 562 | | | | — | |
In-process research and development write-off | | | — | | | | — | | | | 1,929 | |
Tax credits (excluding foreign tax credits) | | | (9,697 | ) | | | (7,610 | ) | | | (7,956 | ) |
Amortization of deferred charge | | | 657 | | | | 1,349 | | | | 46 | |
U.S. losses and tax credits for which no benefit has been realized | | | 24,574 | | | | 25,196 | | | | 48,129 | |
Stock based compensation expense | | | 2,663 | | | | 4,986 | | | | 4,979 | |
Executive compensation deduction limitation | | | 207 | | | | — | | | | — | |
Non-deductible meals and entertainment | | | 1,117 | | | | 943 | | | | 1,185 | |
Other, net | | | 239 | | | | (239 | ) | | | (994 | ) |
| | | | | | | | | | | | |
Provision for income taxes | | $ | 3,428 | | | $ | 2,248 | | | $ | 10,850 | |
| | | | | | | | | | | | |
66
The significant components of the deferred income tax provision (benefit) were as follows:
| | | | | | | | | | | | |
Year ended January 31, | | 2011 | | | 2010 | | | 2009 | |
| | | |
Net changes in gross deferred tax assets and liabilities | | $ | (20,381 | ) | | $ | (19,765 | ) | | $ | (49,220 | ) |
Deferred tax assets reducing/(increasing) goodwill | | | (5,618 | ) | | | (567 | ) | | | (6,725 | ) |
Deferred tax assets reducing/(increasing) equity | | | (1,178 | ) | | | 506 | | | | 67 | |
Deferred tax assets reducing/(increasing) deferred charge and other liabilities | | | (305 | ) | | | (13,823 | ) | | | 9,153 | |
Increase (decrease) in beginning-of-year balance of the valuation allowance for deferred tax assets | | | 22,458 | | | | 33,835 | | | | 44,515 | |
| | | | | | | | | | | | |
Total deferred income tax provision (benefit) | | $ | (5,024 | ) | | $ | 186 | | | $ | (2,210 | ) |
| | | | | | | | | | | | |
The tax effects of temporary differences and carryforwards, which gave rise to significant portions of deferred tax assets and liabilities, were as follows:
| | | | | | | | |
As of January 31, | | 2011 | | | 2010 | |
Deferred tax assets: | | | | | | | | |
Depreciation of property, plant, and equipment | | $ | 1,393 | | | $ | 5,822 | |
Reserves and allowances | | | 3,746 | | | | 4,606 | |
Accrued expenses not currently deductible | | | 25,337 | | | | 18,453 | |
Stock-based compensation expense | | | 14,832 | | | | 13,260 | |
Net operating loss carryforwards | | | 56,221 | | | | 47,447 | |
Tax credit carryforwards | | | 47,163 | | | | 36,725 | |
Purchased technology and other intangible assets | | | 19,173 | | | | 15,405 | |
Deferred revenue | | | 1,793 | | | | 3,671 | |
Other, net | | | 5,619 | | | | — | |
| | | | | | | | |
Total gross deferred tax assets | | | 175,277 | | | | 145,389 | |
Less valuation allowance | | | (133,036 | ) | | | (110,578 | ) |
| | | | | | | | |
Deferred tax assets | | | 42,241 | | | | 34,811 | |
| | | | | | | | |
Deferred tax liabilities: | | | | | | | | |
Intangible assets | | | (25,380 | ) | | | (15,873 | ) |
| | | | | | | | |
Deferred tax liabilities | | | (25,380 | ) | | | (15,873 | ) |
| | | | | | | | |
Net deferred tax assets | | $ | 16,861 | | | $ | 18,938 | |
| | | | | | | | |
As of January 31, 2011, we had the following U.S. Federal and state carryforwards for income tax purposes:
| | | | | | | | |
Credit or carryforward | | As of January 31,
2011 | | | Expiration | |
Federal credits and carryforwards: | | | | | | | | |
Research & expermination credit carryforward | | $ | 46,096 | | | | Fiscal 2019 -2031 | |
Net operating loss carryforward | | $ | 192,432 | | | | Fiscal 2019 -2031 | |
Foreign tax credits | | $ | 4,166 | | | | Fiscal 2015 -2021 | |
Alternative minimum tax credits | | $ | 2,683 | | | | No expiration | |
Childcare credits | | $ | 1,213 | | | | Fiscal 2023 and 2031 | |
State income tax credits and carryforwards: | | | | | | | | |
Net operating loss carryforward | | $ | 13,751 | | | | Fiscal 2019 - 2031 | |
Research and experimentation | | $ | 7,975 | | | | Fiscal 2012 - 2031 | |
Miscellaneous | | $ | 733 | | | | Various | |
67
We have net operating losses in multiple foreign jurisdictions of $13,578. In general, we can carryforward the net operating losses for these foreign jurisdictions indefinitely. Net operating loss carryforwards created by excess tax benefits from the exercise of stock options are not recorded as deferred tax assets. To the extent such net operating loss carryforwards are utilized, we will increase stockholders’ equity. For presentation purposes, we have elected to exclude the historic deferred tax assets related to excess tax benefits from stock option exercises. Our deferred tax assets related to net operating losses and tax credit carryforwards have been accordingly reduced by $25,606 as of January 31, 2011 and $25,192 as of January 31, 2010. We had a total valuation allowance of $133,036 as of January 31, 2011 and $110,578 as of January 31, 2010. The increase in the valuation allowance largely resulted from an increase in tax credit and net operating loss carryforwards in the U.S., the timing of the deduction on the accrued expenses, and the movement of the reserves in our tax position. We have determined the amount of the valuation allowance based on our estimates of taxable income by jurisdiction in which we operate over the periods in which the related deferred tax assets will be recoverable. We determined it is more likely than not that our U.S. entities will not generate sufficient taxable income and foreign source income to fully utilize foreign tax credit carryforwards, research and experimentation credit carryforwards, and net operating loss carryforwards before expiration. Accordingly, we recorded a valuation allowance against those deferred tax assets for which realization does not meet the more-likely-than-not standard. Similarly, there is a valuation allowance on the state deferred tax assets due to the same uncertainties regarding future taxable U.S. income. We determine valuation allowances related to certain foreign deferred tax assets based on historical losses as well as future expectations in certain jurisdictions. We have not provided for income tax on the undistributed earnings of our foreign subsidiaries to the extent they are considered permanently re-invested outside the U.S. As of January 31, 2011, the cumulative amount of earnings upon which U.S. income taxes have not been provided for is approximately $390,628. Upon repatriation, some of these earnings may be sheltered by U.S. loss carryforwards or the carryforward of foreign tax credits, which may reduce the federal tax liability associated with any future foreign dividend. Determination of the amount of unrecognized deferred U.S. income tax liability on permanently re-invested earnings is not practicable. To the extent that the earnings of our foreign subsidiaries are not treated as permanently reinvested, which include earnings of certain subsidiaries, we have considered the impact in our tax provision.
We are subject to income taxes in the U.S. and in numerous foreign jurisdictions; in the ordinary course of business there are many transactions and calculations where the ultimate tax determination is uncertain. The statute of limitations for adjustments to our historic tax obligations will vary from jurisdiction to jurisdiction. In some cases it may be extended or be unlimited. Furthermore, net operating loss and tax credit carryforwards may be subject to adjustment after the expiration of the statute of limitations of the year such net operating losses and tax credits originated. Our larger jurisdictions generally provide for a statute of limitation from three to five years. The tax years for U.S. federal income tax purposes, which remain open for examination are fiscal years 2008 and forward. We are currently under examination in various jurisdictions. The examinations are in different stages and timing of their resolution is difficult to predict. The statute of limitations remains open for years on or after 2005 in Japan and 2006 in Ireland.
We have reserves for taxes to address potential exposures involving tax positions that are being challenged or that could be challenged by taxing authorities even though we believe the positions we have taken are appropriate. We believe our tax reserves are adequate to cover potential liabilities. We review the tax reserves as circumstances warrant and adjust the reserves as events occur that affect our potential liability for additional taxes. It is often difficult to predict the final outcome or timing of resolution of any particular tax matter. Various events, some of which cannot be predicted, such as clarification of tax law by administrative or judicial means, may occur and would require us to increase or decrease our reserves and effective tax rate. We expect to record additional reserves in future periods with respect to our tax filing positions. It is reasonably possible that unrecognized tax positions may decrease from $0 to $12,000 due to settlements or expiration of the statute of limitations within the next twelve months. To the extent that uncertain tax positions resolve in our favor, it could have a positive impact on our effective tax rate. A portion of reserves, which could settle or expire within the next twelve months, may result in the booking of deferred tax assets subject to a valuation allowance for which no benefit would be recognized. Income tax-related interest and penalties were an expense of $211 for the year ended January 31, 2011 and a benefit of $1,560 for the year ended January 31, 2010 and an expense of $3,122 for the year ended January 31, 2009.
The liability for uncertain tax positions (including liabilities for associated interest and penalties and excluding uncertain tax positions that resulted in credits or net operating losses) and corresponding deferred tax assets, which result if the authorities were able to successfully challenge our tax positions, are as follows:
| | | | | | | | |
As of January 31, | | 2011 | | | 2010 | |
Liability for uncertain tax positions | | $ | 44,095 | | | $ | 36,791 | |
Deferred tax asset for offsetting tax benefits | | $ | 530 | | | $ | 592 | |
68
The potential tax benefits, giving rise to the offsetting deferred tax assets, include deductible state income taxes and interest. We expect $40,303 of the reserve for the uncertain tax positions, if recognized, would favorably affect our effective tax rate. As of January 31, 2011, the full reserve for taxes of $44,095 was reflected in income taxes payable.
The total gross amount of unrecognized tax benefits was $50,696 as of January 31, 2011 and $39,910 as of January 31, 2010, which excludes accrued interest and penalties related to such positions of $9,664 as of January 31, 2011 and $9,067 as of January 31, 2010. These amounts represent the gross amount of exposure in individual jurisdictions and do not reflect any additional benefits expected to be realized if such positions were not sustained, such as the federal deduction that could be realized if an unrecognized state deduction was not sustained.
The below schedule shows the gross changes in unrecognized tax position for the year ended January 31, 2011:
| | | | | | | | |
| | | 2011 | | | 2010 | |
Unrecognized tax benefits as of January 31, 2010 and 2009 respectively | | $ | 39,910 | | | $ | 60,765 | |
Prior period tax positions: | | | | | | | | |
Increases | | | 6,771 | | | | 1,964 | |
Decreases | | | (931 | ) | | | (3,234 | ) |
Additions based on tax positions related to the current year | | | 6,099 | | | | 6,463 | |
Settlements | | | (141 | ) | | | (20,932 | ) |
Lapse of statute of limitations | | | (3,481 | ) | | | (6,192 | ) |
Cumulative translation adjustment | | | 2,469 | | | | 1,076 | |
| | | | | | | | |
Unrecognized tax benefits as of January 31, 2011 | | $ | 50,696 | | | $ | 39,910 | |
| | | | | | | | |
11. Commitments and Contingencies
Leases
We lease a majority of our field sales offices and research and development facilities under non-cancelable operating leases. In addition, we lease certain equipment used in our research and development activities. This equipment is generally leased on a month-to-month basis after meeting a six-month lease minimum.
Rent expense under operating leases was as follows:
| | | | | | | | | | | | |
Year ended January 31, | | 2011 | | | 2010 | | | 2009 | |
Rent expense | | $ | 29,446 | | | $ | 32,283 | | | $ | 33,225 | |
We entered into agreements to sublease portions of our facility sites. Rental income under these agreements was as follows:
| | | | | | | | | | | | |
Year ended January 31, | | 2011 | | | 2010 | | | 2009 | |
Rental income | | $ | 1,691 | | | $ | 1,497 | | | $ | 1,401 | |
69
Future minimum lease payments and sublease income under all non-cancelable operating leases are approximately as follows:
| | | | | | | | |
Fiscal years ending January 31, | | Lease Payments | | | Sublease Income | |
2012 | | $ | 24,066 | | | $ | 422 | |
2013 | | | 15,641 | | | | 362 | |
2014 | | | 10,275 | | | | 135 | |
2015 | | | 6,837 | | | | — | |
2016 | | | 5,338 | | | | — | |
Thereafter | | | 7,943 | | | | — | |
| | | | | | | | |
Total | | $ | 70,100 | | | $ | 919 | |
| | | | | | | | |
Income Taxes
As of January 31, 2011, we had a liability of approximately $44,095 for income taxes associated with uncertain income tax positions. All of these tax positions are classified as long-term liabilities in our consolidated balance sheet, as we generally do not anticipate the settlement of the liabilities will require payment of cash within the next twelve months. Further, certain liabilities may result in the reduction of deferred tax assets rather than settlement in cash. We are not able to reasonably estimate the timing of any cash payments required to settle these liabilities and do not believe that the ultimate settlement of these obligations will materially affect our liquidity.
Indemnifications
Our license and services agreements generally include a limited indemnification provision for claims from third parties relating to our intellectual property. The indemnification is generally limited to the amount paid by the customer or a set cap. As of January 31, 2011, we were not aware of any material liabilities arising from these indemnifications.
Legal Proceedings
From time to time, we are involved in various disputes and litigation matters that arise from the ordinary course of business. These include disputes and lawsuits relating to intellectual property rights, contracts, distributorships, and employee relations matters. Periodically, we review the status of various disputes and litigation matters and assess each potential exposure. When we consider the potential loss from any dispute or legal matter probable and the amount or the range of loss can be estimated, we will accrue a liability for the estimated loss. Legal proceedings are subject to uncertainties and the outcomes are difficult to predict. Because of such uncertainties, we base accruals on the best information available at the time. As additional information becomes available, we reassess the potential liability related to pending claims and litigation matters and may revise estimates. We believe that the outcome of current litigation, individually and in the aggregate, will not have a material effect on our results of operations.
12. Employee Stock and Savings Plans
Stock Options Plans and Stock Plans
On July 1, 2010, our shareholders approved the 2010 Omnibus Incentive Plan (Incentive Plan) which replaces our prior 1982 Stock Option Plan, Nonqualified Stock Option Plan, 1986 Stock Plan, and 1987 Non-Employee Directors’ Stock Plan. The Incentive Plan is administered by the Compensation Committee of our Board of Directors and permits accelerated vesting of outstanding options, restricted stock units, restricted stock awards, and other equity incentives upon the occurrence of certain changes in control of our company. The implementation of the Incentive Plan did not modify the terms of any awards granted under prior plans.
Stock options under the Incentive Plan are generally expected to vest over four years, have an expiration date of ten years from the date of grant, and an exercise price not less than the fair market value of the shares on the date of grant.
As of January 31, 2011, a total of 8,912 shares of common stock were available for future grant under the above Incentive Plan.
70
We assumed the stock plans of Valor on March 18, 2010. Under the terms of our merger agreement with Valor, options outstanding under these plans were converted to options to purchase shares of our common stock. Options issued under these plans vest over four years from the original grant date and have an expiration date of 10 years from the original grant date. The exercise price of each converted option is equal to the product of the original exercise price and the original number of options granted divided by the number of converted options received. These stock plans have been suspended and no future awards will be granted under these plans. Options for a total of 2,160 shares of our common stock have been authorized and issued under the Valor plans.
On December 14, 2009, our shareholders approved the exchange of certain options for restricted stock units. Eligible for the exchange were options held by non-executive employees with an exercise price equal to or greater than $11.00 which were granted prior to January 7, 2009 and expire after August 15, 2010. The offer expired February 5, 2010. Effective February 8, 2010 a total of 6,945 options were exchanged for 557 restricted stock units. Total incremental cost of $491 resulted from this exchange. The incremental cost will be amortized over two years.
71
Stock options outstanding, the weighted average exercise price, and transactions involving the stock option plans are summarized as follows:
| | | | | | | | | | | | | | | | |
| | | Options
Outstanding | | | Weighted
Average
Exercise Price | | | Weighted Average
Remaining
Contractual Terms
(Years) | | | Aggregate
Intrinsic Value | |
Balance as of January 31, 2008 | | | 19,693 | | | $ | 14.18 | | | | 5.46 | | | $ | 3,647 | |
| | | | | | | | | | | | | | | | |
Granted | | | 3,188 | | | | 6.17 | | | | | | | | | |
Exercised | | | (653 | ) | | | 8.74 | | | | | | | | | |
Forfeited | | | (403 | ) | | | 12.49 | | | | | | | | | |
Expired | | | (1,228 | ) | | | 13.31 | | | | | | | | | |
| | | | | | | | | | | | | | | | |
Balance as of January 31, 2009 | | | 20,597 | | | $ | 13.19 | | | | 5.33 | | | $ | 8 | |
| | | | | | | | | | | | | | | | |
Granted | | | 970 | | | | 7.90 | | | | | | | | | |
Assumed in acquisition | | | 285 | | | | 9.19 | | | | | | | | | |
Exercised | | | (259 | ) | | | 7.08 | | | | | | | | | |
Forfeited | | | (246 | ) | | | 10.10 | | | | | | | | | |
Expired | | | (2,365 | ) | | | 13.23 | | | | | | | | | |
| | | | | | | | | | | | | | | | |
Balance as of January 31, 2010 | | | 18,982 | | | $ | 12.98 | | | | 3.75 | | | $ | 10,347 | |
| | | | | | | | | | | | | | | | |
Granted | | | 508 | | | | 10.14 | | | | | | | | | |
Assumed in acquisition | | | 2,160 | | | | 5.05 | | | | | | | | | |
Exercised | | | (1,640 | ) | | | 5.27 | | | | | | | | | |
Forfeited | | | (84 | ) | | | 7.23 | | | | | | | | | |
Expired | | | (1,114 | ) | | | 16.86 | | | | | | | | | |
Exchanged | | | (6,945 | ) | | | 16.77 | | | | | | | | | |
| | | | | | | | | | | | | | | | |
Balance as of January 31, 2011 | | | 11,867 | | | $ | 9.94 | | | | 5.35 | | | $ | 44,780 | |
| | | | | | | | | | | | | | | | |
Options exercisable as of January 31, 2011 | | | 9,041 | | | $ | 10.63 | | | | 4.48 | | | $ | 30,007 | |
| | | | | | | | | | | | | | | | |
Options vested as of January 31, 2011 and options expected to vest afterJanuary 31, 2011 | | | 11,867 | | | $ | 9.94 | | | | 5.35 | | | $ | 44,780 | |
| | | | | | | | | | | | | | | | |
The total intrinsic value of options exercised and cash received by us from options exercised was as follows:
| | | | | | | | | | | | |
Year ended January 31, | | 2011 | | | 2010 | | | 2009 | |
Intrinsic value | | $ | 7,812 | | | $ | 511 | | | $ | 3,531 | |
Cash received | | $ | 8,639 | | | $ | 1,830 | | | $ | 5,727 | |
The following table summarizes restricted stock activity:
| | | | | | | | | | | | | | | | |
| | | Restricted
Stock Awards | | | Weighted
Average Grant
Date Fair Value | | | Weighted Average
Remaining
Contractual Term
(Years) | | | Aggregate
Intrinsic
Value | |
Nonvested as of January 31, 2009 | | | 36 | | | $ | 14.26 | | | | 3.76 | | | $ | 170 | |
| | | | | | | | | | | | | | | | |
Granted | | | 198 | | | | 8.78 | | | | | | | | | |
Vested | | | (8 | ) | | | 14.17 | | | | | | | | | |
| | | | | | | | | | | | | | | | |
Nonvested as of January 31, 2010 | | | 226 | | | $ | 9.46 | | | | 2.26 | | | $ | 1,816 | |
| | | | | | | | | | | | | | | | |
Granted | | | 1,990 | | | | 9.61 | | | | | | | | | |
Vested | | | (58 | ) | | | 9.56 | | | | | | | | | |
Cancelled | | | (27 | ) | | | 8.52 | | | | | | | | | |
| | | | | | | | | | | | | | | | |
Nonvested as of January 31, 2011 | | | 2,131 | | | $ | 9.61 | | | | 1.72 | | | $ | 27,130 | |
| | | | | | | | | | | | | | | | |
72
Employee Stock Purchase Plans
We have an employee stock purchase plan (ESPP) for U.S. employees and an ESPP for certain foreign subsidiary employees. Prior to July 1, 2010, the ESPPs generally provided for overlapping two-year offerings commencing on January 1 and July 1 of each year with purchases every six months during those offering periods. On July 1, 2010, the ESPPs were amended. Beginning July 1, 2010, the ESPPs provide for six month offerings commencing on January 1 and July 1 of each year with purchases on June 30 and December 31 of each year. Each eligible employee may purchase up to six thousand shares of stock on each purchase date at prices no less than 85% of the lesser of the fair market value of the shares on the offering date or on the purchase date. Offerings in process as of July 1, 2010 with two year terms extending beyond that date were replaced by the six month offering beginning on July 1, 2010. There was no incremental value associated with the replacement of unexpired ESPP purchase rights. As of January 31, 2011, 3,934 shares remain available for future purchase under the ESPPs. The following table summarizes shares issued under the ESPPs:
| | | | | | | | | | | | |
Year ended January 31, | | 2011 | | | 2010 | | | 2009 | |
Shares issued under the ESPPs | | | 3,461 | | | | 4,143 | | | | 2,732 | |
Cash received for the purchase of shares under the ESPPs | | $ | 19,019 | | | $ | 18,237 | | | $ | 16,609 | |
Weighted average purchase price per share | | $ | 5.50 | | | $ | 4.40 | | | $ | 6.08 | |
Stock-Based Compensation Expense
We estimate the fair value of stock options and purchase rights under our ESPPs using a Black-Scholes option-pricing model. The Black-Scholes option-pricing model incorporates several highly subjective assumptions including expected volatility, expected term, and interest rates.
In determining expected volatility for options, we include the following elements:
| | • | | Historical volatility of our shares of common stock; |
| | • | | Historical volatility of shares of comparable companies; |
| | • | | Implied volatility of our traded options; and |
| | • | | Implied volatility of traded options of comparable companies. |
In determining expected volatility for purchase rights under our ESPP, we use the historical volatility of our shares of common stock. Prior to the July 1, 2010 offering, we based the expected term of our ESPP on the average term of the series of offerings. Beginning with the July 1, 2010 offering, the expected term is the 6 month offering period. We base the expected term of our stock options on historical experience.
The risk-free interest rate for periods within the contractual life of the award is based on the U.S. Treasury yield curve in effect at the time of the grant.
The fair value of restricted stock units is the market value as of the grant date.
The weighted average grant date fair values are summarized as follows:
| | | | | | | | | | | | |
Year ended January 31, | | 2011 | | | 2010 | | | 2009 | |
Options granted | | $ | 5.02 | | | $ | 4.06 | | | $ | 2.79 | |
Restricted stock granted | | $ | 9.61 | | | $ | 8.78 | | | $ | 15.29 | |
ESPP purchase rights | | $ | 2.17 | | | $ | 2.77 | | | $ | 4.43 | |
73
The fair value calculations used the following assumptions:
| | | | | | | | | | | | |
Year ended January 31, | | 2011 | | | 2010 | | | 2009 | |
Stock Option Plans | | | | | | | | | | | | |
Risk-free interest rate | | | 1.4% - 2.6 | % | | | 2.3% - 3.1 | % | | | 1.9% - 3.6 | % |
Dividend yield | | | 0 | % | | | 0 | % | | | 0 | % |
Expected life (in years) | | | 5.5 - 6.5 | | | | 5.0 - 6.5 | | | | 5.0 - 6.5 | |
Volatility (range) | | | 50% -55 | % | | | 45% - 55 | % | | | 45% - 50 | % |
Volatility (weighted average) | | | 51 | % | | | 51 | % | | | 47 | % |
| | | |
Year ended January 31, | | 2011 | | | 2010 | | | 2009 | |
Employee Stock Purchase Plans | | | | | | | | | | | | |
Risk-free interest rate | | | 0.2 | % | | | 0.2% - 1.0 | % | | | 0.7% - 2.4 | % |
Dividend yield | | | 0 | % | | | 0 | % | | | 0 | % |
Expected life (in years) | | | 0.5 | | | | 1.3 | | | | 1.3 | |
Volatility (range) | | | 38% - 64 | % | | | 46% - 72 | % | | | 42% - 48 | % |
Volatility (weighted average) | | | 40 | % | | | 56 | % | | | 47 | % |
| | | |
Year ended January 31, | | 2011 | | | 2010 | | | 2009 | |
Acquired Company Options Exchange | | | | | | | | | | | | |
Risk-free interest rate | | | 0.1% - 3.3 | % | | | 1.6% - 3.2 | % | | | — | |
Dividend yield | | | 0 | % | | | 0 | % | | | — | |
Expected life (in years) | | | 0.1 - 7.7 | | | | 3.5 - 8.4 | | | | — | |
Volatility (range) | | | 35% - 72 | % | | | 54% - 59 | % | | | — | |
Volatility (weighted average) | | | 60 | % | | | 57 | % | | | — | |
| | | |
Year ended January 31, | | 2011 | | | 2010 | | | 2009 | |
Employee Options Exchange | | | | | | | | | | | | |
Risk-free interest rate | | | 0.2% - 2.7 | % | | | — | | | | — | |
Dividend yield | | | 0 | % | | | — | | | | — | |
Expected life (in years) | | | 0.5 - 5.9 | | | | — | | | | — | |
Volatility (range) | | | 43% - 77 | % | | | — | | | | — | |
Volatility (weighted average) | | | 43 | % | | | — | | | | — | |
We issued 222 shares of common stock valued at $3,014 to the founders of a company we acquired in June 2007. These shares were subject to forfeiture if their employment terminated prior to June 2009. The value of these shares was amortized over a two year period.
The following table summarizes stock-based compensation expense included in the results of operations and the tax benefit associated with the exercise of stock options:
| | | | | | | | | | | | |
Year ended January 31, | | 2011 | | | 2010 | | | 2009 | |
Cost of revenues: | | | | | | | | | | | | |
Service and support | | $ | 888 | | | $ | 1,618 | | | $ | 1,544 | |
Operating expense: | | | | | | | | | | | | |
Research and development | | | 7,785 | | | | 10,931 | | | | 12,005 | |
Marketing and selling | | | 6,112 | | | | 8,406 | | | | 8,627 | |
General and administration | | | 5,726 | | | | 5,204 | | | | 6,047 | |
| | | | | | | | | | | | |
Equity plan-related compensation expense(1) | | $ | 20,511 | | | $ | 26,159 | | | $ | 28,223 | |
| | | | | | | | | | | | |
Tax effect of the exercise of stock options | | $ | — | | | $ | (96 | ) | | $ | 93 | |
| | | | | | | | | | | | |
| (1) | Equity plan-related compensation expense for the year ended January 31, 2011 includes $20,511 relating to stock options, stock awards, and the ESPPs. Equity plan-related compensation expense for the year ended January 31, 2010 includes $25,657 relating to stock options, stock awards, and the ESPPs and $502 relating to the amortization of expense associated with stock issued to the founders of a company we acquired during the year ended January 31, 2008. Equity plan-related compensation expense for fiscal 2009 includes $26,716 relating to stock options, stock awards, and the ESPPs and $1,507 relating to the amortization of expense associated with stock issued to the founders of a company we acquired during the year ended January 31, 2008. |
74
As of January 31, 2011, we had $8,413 in unrecognized compensation cost related to nonvested options which is expected to be recognized over a weighted average period of 1.5 years and $16,024 in unrecognized compensation cost related to nonvested restricted stock which is expected to be recognized over a weighted average period of 2.6 years.
Employee Savings Plan
We have an employee savings plan (the Savings Plan) that qualifies as a deferred salary arrangement under Section 401(k) of the Internal Revenue Code. Under the Savings Plan, participating U.S. employees may defer a portion of their pretax earnings, up to the Internal Revenue Service annual contribution limit. We currently match 50% of eligible employee’s contributions, up to a maximum of 6% of the employee’s earnings. Employer matching contributions vest over five years, 20% for each year of service completed. Our matching contributions to the Savings Plan were as follows:
| | | | | | | | | | | | |
Year ended January 31, | | 2011 | | | 2010 | | | 2009 | |
Employer matching contribution | | $ | 6,413 | | | $ | 4,928 | | | $ | 5,910 | |
13. Incentive Stock Rights
Our Board of Directors has the authority to issue incentive stock in one or more series and to determine the relative rights and preferences of the incentive stock. On June 24, 2010, we adopted an Incentive Stock Purchase Rights Plan and declared a dividend distribution of one Right for each outstanding share of common stock, payable to holders of record on July 6, 2010. As long as the Rights are attached to our common stock, we will issue one Right with each new share of common stock so that all such shares will have attached Rights. Under certain conditions, each Right may be exercised to purchase 1/10,000 of a share of Series B Junior Participating Incentive Stock at a purchase price of fifty dollars, subject to adjustment. The Rights are not presently exercisable and will only become exercisable if a person or group acquires or commences a tender offer to acquire 15% or more of our common stock. If a person or group acquires 15% or more of the common stock, each Right will be adjusted to entitle its holder to receive, upon exercise, common stock (or, in certain circumstances, other assets of ours) having a value equal to two times the exercise price of the Right or each Right will be adjusted to entitle its holder to receive, upon exercise, common stock of the acquiring company having a value equal to two times the exercise price of the Right, depending on the circumstances. The Rights expire on December 31, 2011 and may be redeemed by us for $0.001 per Right. The Rights do not have voting or dividend rights and have no dilutive effect on our earnings.
75
14. Net Income (Loss) Per Share
The following provides the computation of basic and diluted net income (loss) per share:
| | | | | | | | | | | | |
Year ended January 31, | | 2011 | | | 2010 | | | 2009 | |
Net income (loss) | | $ | 28,584 | | | $ | (21,889 | ) | | $ | (91,252 | ) |
| | | | | | | | | | | | |
Weighted average common shares used to calculate basic net income (loss) per share | | | 107,743 | | | | 96,474 | | | | 91,829 | |
Employee stock options and employee stock purchase plans | | | 2,118 | | | | — | | | | — | |
| | | | | | | | | | | | |
Weighted average common and potential common shares used to calculate diluted net income (loss) per share | | | 109,861 | | | | 96,474 | | | | 91,829 | |
| | | | | | | | | | | | |
Basic net income (loss) per share | | $ | 0.27 | | | $ | (0.23 | ) | | $ | (0.99 | ) |
| | | | | | | | | | | | |
Diluted net income (loss) per share | | $ | 0.26 | | | $ | (0.23 | ) | | $ | (0.99 | ) |
| | | | | | | | | | | | |
We excluded from the computation of diluted net income (loss) per share stock options and ESPP purchase rights to purchase 6,921 shares of common stock for the year ended January 31, 2011, 19,382 for fiscal 2010, and 20,995 for fiscal 2009. The stock options and ESPP purchase rights were anti-dilutive either because we incurred a net loss for the period or the stock options were determined to be anti-dilutive as a result of applying the treasury stock method.
The effect of the conversion of the Floating Rate Debentures and the 6.25% Debentures was anti-dilutive and therefore excluded from the computation of diluted net income (loss) per share. We assume that the 6.25% Debentures will be settled in common stock for purposes of calculating the dilutive effect of the 6.25% Debentures. If the Floating Rate Debentures and the 6.25% Debentures had been dilutive we would have included additional income and additional incremental common shares as shown in the following table:
| | | | | | | | | | | | |
Year ended January 31, | | 2011 | | | 2010 | | | 2009 | |
Floating Rate Debentures | | | | | | | | | | | | |
Additional income | | $ | — | | | $ | 633 | | | $ | 1,144 | |
Additional incremental common shares | | | — | | | | 1,415 | | | | 1,543 | |
| | | |
Year ended January 31, | | 2011 | | | 2010 | | | 2009 | |
6.25% Debentures | | | | | | | | | | | | |
Additional income | | $ | 3,062 | | | $ | 2,643 | | | $ | 2,643 | |
Additional incremental common shares(1) | | | — | | | | — | | | | — | |
| (1) | Dilutive net income (loss) would have included no incremental shares for the years ended January 31, 2011, 2010, or 2009 as the stock price was below the conversion rate. |
The conversion features of the 6.25% Debentures, which allow for settlement in cash, common stock, or a combination of cash and common stock, are further described in Note 9. “Notes Payable.”
76
15. Accumulated Other Comprehensive Income
The following tables summarize the components of Accumulated other comprehensive income:
| | | | | | | | | | | | |
Year ended January 31, 2011 | | Beginning of
Year Balance | | | Changes During
Year | | | End of Year
Balance | |
| | | |
Foreign currency translation adjustment (Note 2) | | $ | 29,627 | | | $ | 1,595 | | | $ | 31,222 | |
Unrealized loss on derivatives (Note 7) | | | (1,587 | ) | | | 1,585 | | | | (2 | ) |
Pension liability | | | (1,876 | ) | | | 2,349 | | | | 473 | |
| | | | | | | | | | | | |
Accumulated other comprehensive income | | $ | 26,164 | | | $ | 5,529 | | | $ | 31,693 | |
| | | | | | | | | | | | |
| | | |
| | | Beginning of
Year Balance | | | Changes During
Year | | | End of Year
Balance | |
Year ended January 31, 2010 | | | |
Foreign currency translation adjustment (Note 2) | | $ | 18,938 | | | $ | 10,689 | | | $ | 29,627 | |
Unrealized loss on derivatives (Note 7) | | | (6,510 | ) | | | 4,923 | | | | (1,587 | ) |
Pension liability | | | (1,194 | ) | | | (682 | ) | | | (1,876 | ) |
| | | | | | | | | | | | |
Accumulated other comprehensive income | | $ | 11,234 | | | $ | 14,930 | | | $ | 26,164 | |
| | | | | | | | | | | | |
| | | |
Year ended January 31, 2009 | | Beginning of
Year Balance | | | Changes During
Year | | | End of Year
Balance | |
Foreign currency translation adjustment (Note 2) | | $ | 37,782 | | | $ | (18,844 | ) | | $ | 18,938 | |
Unrealized gain (loss) on derivatives (Note 7) | | | 26 | | | | (6,536 | ) | | | (6,510 | ) |
Pension liability | | | (944 | ) | | | (250 | ) | | | (1,194 | ) |
| | | | | | | | | | | | |
Accumulated other comprehensive income | | $ | 36,864 | | | $ | (25,630 | ) | | $ | 11,234 | |
| | | | | | | | | | | | |
77
16. Special Charges
The following is a summary of the components of the special charges:
| | | | | | | | | | | | |
Year ended January 31, | | 2011 | | | 2010 | | | 2009 | |
Employee severance and related costs | | $ | 6,114 | | | $ | 10,713 | | | $ | 9,792 | |
Excess leased facility costs | | | 900 | | | | 2,530 | | | | 2,548 | |
Acquisitions | | | 529 | | | | 2,067 | | | | — | |
Other | | | 2,714 | | | | 6,024 | | | | 4,548 | |
| | | | | | | | | | | | |
Total special charges | | $ | 10,257 | | | $ | 21,334 | | | $ | 16,888 | |
| | | | | | | | | | | | |
Special charges primarily consist of costs incurred for employee terminations due to a reduction of personnel resources driven by modifications of business strategy or business emphasis. Special charges may also include expenses incurred related to acquisitions, excess facility costs, and asset related charges.
Employee severance and related costs of $6,114 for the year ended January 31, 2011 included severance benefits, notice pay, and outplacement services. The total rebalance charge represents the aggregate of numerous unrelated rebalance plans which impacted several employee groups, none of which was individually material to our financial position or results of operations. We determined termination benefit amounts based on employee status, years of service, and local statutory requirements. We communicated termination benefits to the affected employees prior to the end of the quarter in which we recorded the charge. Approximately 66% of these costs were paid during the year ended January 31, 2011. We expect to pay the remainder during fiscal 2012. There have been no significant modifications to the amount of these charges.
Excess leased facility costs of $900 for the year ended January 31, 2011 were primarily due to the abandonment of leased facilities and changes in the estimate of sublease income for previously abandoned leased facilities.
Acquisition costs of $529 for the year ended January 31, 2011 represent legal and other costs related to acquisitions.
Other special charges for the year ended January 31, 2011 included costs of $2,083 related to advisory fees, leased facility restoration costs of $1,432, and other costs and adjustments of $(41). Also included in other special charges was $(760) representing adjustments to assumptions on an acquisition earnout accrual.
Accrued special charges are included in accrued liabilities and other long-term liabilities in the consolidated balance sheets. The following table shows changes in accrued special charges during the year ended January 31, 2011:
| | | | | | | | | | | | | | | | |
| | | Accrued special
charges as of
January 31, 2010 | | | Charges during
the year ended
January 31, 2011 | | | Payments during
the year ended
January 31, 2011 | | | Accrued special
charges as of
January 31, 2010(1) | |
Employee severence and related costs | | $ | 2,616 | | | $ | 6,114 | | | $ | (6,066 | ) | | $ | 2,664 | |
Excess leased facility costs | | | 4,110 | | | | 900 | | | | (3,080 | ) | | | 1,930 | |
Other costs | | | 2,298 | | | | 3,243 | | | | (3,205 | ) | | | 2,336 | |
| | | | | | | | | | | | | | | | |
Accrued special charges | | $ | 9,024 | | | $ | 10,257 | | | $ | (12,351 | ) | | $ | 6,930 | |
| | | | | | | | | | | | | | | | |
| (1) | Of the $6,930 total accrued special charges as of January 31, 2011, $1,201 represented the long-term portion of accrued lease termination fees and other facility costs, net of sublease income. The remaining balance of $5,729 represented the short-term portion of accrued special charges. |
Employee severance and related costs of $10,713 for the year ended January 31, 2010 included severance benefits, notice pay, and outplacement services. The total rebalance charge represents the aggregate of numerous unrelated rebalance plans which impacted several employee groups, none of which was individually material to our financial position or results of operations. We determined termination benefit amounts based on employee status, years of service, and local statutory requirements. We communicated termination benefits to the affected employees prior to the end of the quarter in which we recorded the charge. Approximately 96% of these costs were paid as of January 31, 2011. We expect to pay the remainder during fiscal 2012. There have been no significant modifications to the amount of these charges.
Excess leased facility costs of $2,530 for the year ended January 31, 2010 were primarily due to the abandonment of leased facilities and changes in the estimate of sublease income for previously abandoned leased facilities.
78
Other special charges for the year ended January 31, 2010 included costs of $4,700 for advisory fees, charges of $566 for a casualty loss, charges of $405 related to an asset abandonment, charges of $302 for facility restoration and other charges of $51. Also included in other special charges was $2,067 for the year ended January 31, 2010 representing legal and other costs related to acquisitions.
The following table shows changes in accrued special charges during the year ended January 31, 2010:
| | | | | | | | | | | | | | | | |
| | | Accrued special
charges as of
January 31, 2009 | | | Charges during
the year ended
January 31, 2010 | | | Payments during
the year ended
January 31, 2010 | | | Accrued special
charges as of
January 31, 2010(1) | |
Employee severence and related costs | | $ | 3,183 | | | $ | 10,713 | | | $ | (11,280 | ) | | $ | 2,616 | |
Excess leased facility costs | | | 4,456 | | | | 2,530 | | | | (2,876 | ) | | | 4,110 | |
Other costs | | | 692 | | | | 8,091 | | | | (6,485 | ) | | | 2,298 | |
| | | | | | | | | | | | | | | | |
Accrued special charges | | $ | 8,331 | | | $ | 21,334 | | | $ | (20,641 | ) | | $ | 9,024 | |
| | | | | | | | | | | | | | | | |
| (1) | Of the $9,024 total accrued special charges as of January 31, 2010, $1,515 represented the long-term portion of accrued lease termination fees and other facility costs, net of sublease income. The remaining balance of $7,509 represented the short-term portion of accrued special charges. |
Employee severance and related costs of $9,792 for the year ended January 31, 2009 included severance benefits, notice pay, and outplacement services. The total rebalance charge represents the aggregate of numerous unrelated rebalance plans which impacted several employee groups, none of which was individually material to our financial position or results of operations. We determined termination benefit amounts based on employee status, years of service, and local statutory requirements. We communicated termination benefits to the affected employees prior to the end of the quarter in which we recorded the charge. Costs remaining as of January 31, 2010 were paid in fiscal 2011.
Excess leased facility costs of $2,548 for the year ended January 31, 2009 were primarily due to the abandonment of leased facilities and changes in the estimate of sublease income for previously abandoned leased facilities.
Other special charges for the year ended January 31, 2009 included costs of $4,535 for advisory fees and other costs of $13.
The following table shows changes in accrued special charges during the year ended January 31, 2009:
| | | | | | | | | | | | | | | | |
| | | Accrued special
charges as of
January 31, 2008 | | | Charges during
the year ended
January 31, 2009 | | | Payments during
the year ended
January 31, 2009 | | | Accrued special
charges as of
January 31, 2009(1) | |
Employee severence and related costs | | $ | 3,903 | | | $ | 9,792 | | | $ | (10,512 | ) | | $ | 3,183 | |
Excess leased facility costs | | | 3,507 | | | | 2,548 | | | | (1,599 | ) | | | 4,456 | |
Other costs | | | — | | | | 4,548 | | | | (3,856 | ) | | | 692 | |
| | | | | | | | | | | | | | | | |
Accrued special charges | | $ | 7,410 | | | $ | 16,888 | | | $ | (15,967 | ) | | $ | 8,331 | |
| | | | | | | | | | | | | | | | |
| (1) | Of the $8,331 total accrued special charges as of January 31, 2009, $2,798 represented the long-term portion of accrued lease termination fees and other facility costs, net of sublease income. The remaining balance of $5,533 represented the short-term portion of accrued special charges. |
79
17. Other Income (Expense), Net
Other income (expense), net was comprised of the following:
| | | | | | | | | | | | |
Year ended January 31, | | 2011 | | | 2010 | | | 2009 | |
Interest income | | $ | 1,390 | | | $ | 1,003 | | | $ | 5,107 | |
Foreign currency exchange gain (loss) | | | (1,148 | ) | | | (423 | ) | | | 4,781 | |
Impairment of cost-basis investments | | | — | | | | (113 | ) | | | (3,488 | ) |
Equity in losses of unconsolidated entities | | | (938 | ) | | | (995 | ) | | | (1,432 | ) |
Other, net | | | (1,420 | ) | | | (400 | ) | | | (458 | ) |
| | | | | | | | | | | | |
Other income (expense), net | | $ | (2,116 | ) | | $ | (928 | ) | | $ | 4,510 | |
| | | | | | | | | | | | |
18. In-Process Research and Development
We incurred $13,985 of in-process research and development charges during fiscal 2009 related to undeveloped technology acquired through a joint development agreement with IBM addressing technological challenges of integrated circuit design at 22 nanometer geometries. We based the value of the charge on the present value of the four year payment obligation as defined in the agreement. We made a payment of $2,500 during fiscal 2011 and are required to make annual payments of $2,500 during each of fiscal 2012 through fiscal 2013. The joint development agreement provides access to technology which has not yet reached technological feasibility and provides no alternative future use. The technology is expected to be the basis for a new offering in our Calibre® product family once development is completed.
Other in-process research and development charges for fiscal 2009 relates to acquisitions of businesses. See further discussion of these amounts in Note 5. “Business Combinations.”
19. Related Party Transactions
Certain members of our Board of Directors also serve on the board of directors of certain of our customers. Management believes the transactions between these customers and us were carried out on an arm’s-length basis. The following table shows revenue recognized from these customers:
| | | | | | | | | | | | |
Year ended January 31, | | 2011 | | | 2010 | | | 2009 | |
Revenue from customers | | $ | 37,726 | | | $ | 33,104 | | | $ | 44,500 | |
Percentage of total revenue | | | 4.1 | % | | | 4.1 | % | | | 5.6 | % |
20. Supplemental Cash Flow Information
The following provides information concerning supplemental disclosures of cash flow activities:
| | | | | | | | | | | | |
Year ended January 31, | | 2011 | | | 2010 | | | 2009 | |
Cash paid for: | | | | | | | | | | | | |
Interest | | $ | 13,701 | | | $ | 14,135 | | | $ | 15,763 | |
Income taxes | | $ | 10,627 | | | $ | 11,270 | | | $ | 6,395 | |
As part of the Valor acquisition, we acquired an investment in Frontline. During the year ended January 31, 2011, we received returns on investment of $4,700 from Frontline which is included in net cash provided by operating activities in our consolidated statement of cash flows.
21. Segment Reporting
Our Chief Operating Decision Makers (CODMs), which consist of the Chief Executive Officer and the President, review our consolidated results within one operating segment. In making operating decisions, our CODMs primarily consider consolidated financial information accompanied by disaggregated revenue information by geographic region.
80
We eliminate all intercompany revenues in computing revenues by geographic regions. Revenues and property, plant and equipment, net, related to operations in the United States and other geographic areas were:
| | | | | | | | | | | | |
Year ended January 31, | | 2011 | | | 2010 | | | 2009 | |
Revenues: | | | | | | | | | | | | |
United States | | $ | 386,265 | | | $ | 320,244 | | | $ | 292,230 | |
Other North America | | | 14,787 | | | | 22,542 | | | | 18,377 | |
| | | | | | | | | | | | |
Total North America | | | 401,052 | | | | 342,786 | | | | 310,607 | |
Europe | | | 223,156 | | | | 205,512 | | | | 260,964 | |
Japan | | | 124,298 | | | | 120,344 | | | | 115,189 | |
Pacific Rim | | | 166,247 | | | | 134,085 | | | | 102,341 | |
| | | | | | | | | | | | |
Total revenues | | $ | 914,753 | | | $ | 802,727 | | | $ | 789,101 | |
| | | | | | | | | | | | |
81
No single customer accounted for 10% or more of total revenues for the years ended January 31, 2011, 2010, or 2009.
| | | | | | | | |
As of January 31, | | 2011 | | | 2010 | |
Property, plant, and equipment, net: | | | | | | | | |
United States | | $ | 112,657 | | | $ | 97,223 | |
Other North America | | | 79 | | | | 150 | |
| | | | | | | | |
Total North America | | | 112,736 | | | | 97,373 | |
Europe | | | 20,718 | | | | 18,887 | |
Japan | | | 1,610 | | | | 1,341 | |
Pacific Rim | | | 4,276 | | | | 4,194 | |
| | | | | | | | |
Total property, plant, and equipment, net | | $ | 139,340 | | | $ | 121,795 | |
| | | | | | | | |
We segregate revenue into five categories of similar products and services. Each category includes both product and related support revenues. Revenue information is as follows:
| | | | | | | | | | | | |
Year ended January 31, | | 2011 | | | 2010 | | | 2009 | |
Revenues: | | | | | | | | | | | | |
IC Design to Silicon | | $ | 252,654 | | | $ | 286,250 | | | $ | 250,386 | |
Integrated System Design | | | 244,842 | | | | 192,075 | | | | 185,095 | |
Scalable Verification | | | 227,107 | | | | 180,798 | | | | 203,374 | |
New & Emerging Products | | | 124,121 | | | | 92,743 | | | | 83,522 | |
Services & Other | | | 66,029 | | | | 50,861 | | | | 66,724 | |
| | | | | | | | | | | | |
Total revenues | | $ | 914,753 | | | $ | 802,727 | | | $ | 789,101 | |
| | | | | | | | | | | | |
22. Quarterly Financial Information – Unaudited
A summary of quarterly financial information follows:
| | | | | | | | | | | | | | | | |
Quarter ended | | April 30 | | | July 31 | | | October 31 | | | January 31 | |
Fiscal 2011 | | | | | | | | | | | | | | | | |
Total revenues | | $ | 180,577 | | | $ | 187,934 | | | $ | 238,937 | | | $ | 307,305 | |
Gross margin | | $ | 150,734 | | | $ | 156,391 | | | $ | 199,975 | | | $ | 267,048 | |
Operating income (loss) | | $ | (14,994 | ) | | $ | (10,491 | ) | | $ | 20,641 | | | $ | 57,383 | |
Net income (loss) | | $ | (23,025 | ) | | $ | (14,247 | ) | | $ | 15,257 | | | $ | 50,599 | |
Net income (loss) per share, basic | | $ | (0.22 | ) | | $ | (0.13 | ) | | $ | 0.14 | | | $ | 0.46 | |
Net income (loss) per share, diluted | | $ | (0.22 | ) | | $ | (0.13 | ) | | $ | 0.14 | | | $ | 0.45 | |
| | | | |
Quarter ended | | April 30 | | | July 31 | | | October 31 | | | January 31 | |
Fiscal 2010 | | | | | | | | | | | | | | | | |
Total revenues | | $ | 193,775 | | | $ | 182,621 | | | $ | 189,196 | | | $ | 237,135 | |
Gross margin | | $ | 164,735 | | | $ | 149,664 | | | $ | 161,727 | | | $ | 206,732 | |
Operating income (loss) | | $ | (6,146 | ) | | $ | (11,497 | ) | | $ | (7,268 | ) | | $ | 23,744 | |
Net income (loss) | | $ | (12,956 | ) | | $ | (21,266 | ) | | $ | (27,034 | ) | | $ | 39,367 | |
Net income (loss) per share, basic | | $ | (0.14 | ) | | $ | (0.22 | ) | | $ | (0.28 | ) | | $ | 0.40 | |
Net income (loss) per share, diluted | | $ | (0.14 | ) | | $ | (0.22 | ) | | $ | (0.28 | ) | | $ | 0.39 | |
82
REPORT OF INDEPENDENT REGISTERED PUBLIC ACCOUNTING FIRM
To the Stockholders and Board of Directors
Mentor Graphics Corporation:
We have audited the accompanying consolidated balance sheets of Mentor Graphics Corporation and subsidiaries as of January 31, 2011 and 2010, and the related consolidated statements of operations, stockholders’ equity, and cash flows for each of the years in the three-year period ended January 31, 2011. In connection with our audits of the consolidated financial statements, we also have audited financial statement Schedule II. These consolidated financial statements and financial statement schedule are the responsibility of the Company’s management. Our responsibility is to express an opinion on these consolidated financial statements and financial statement schedule based on our audits.
We conducted our audits in accordance with the standards of the Public Company Accounting Oversight Board (United States). Those standards require that we plan and perform the audit to obtain reasonable assurance about whether the financial statements are free of material misstatement. An audit includes examining, on a test basis, evidence supporting the amounts and disclosures in the financial statements. An audit also includes assessing the accounting principles used and significant estimates made by management, as well as evaluating the overall financial statement presentation. We believe that our audits provide a reasonable basis for our opinion.
In our opinion, the consolidated financial statements referred to above present fairly, in all material respects, the financial position of Mentor Graphics Corporation and subsidiaries as of January 31, 2011 and 2010, and the results of their operations and their cash flows for each of the years in the three-year period ended January 31, 2011, in conformity with U.S. generally accepted accounting principles. Also in our opinion, the related financial statement schedule, when considered in relation to the basic consolidated financial statements taken as a whole, presents fairly, in all material respects, the information set forth therein.
We also have audited, in accordance with the standards of the Public Company Accounting Oversight Board (United States), Mentor Graphics Corporation’s internal control over financial reporting as of January 31, 2011, based on criteria established inInternal Control—Integrated Frameworkissued by the Committee of Sponsoring Organizations of the Treadway Commission, and our report dated March 17, 2011, expressed an unqualified opinion on the effectiveness of the Company’s internal control over financial reporting.
/s/ KPMG LLP
March 17, 2011
Portland, Oregon
| Item 9. | Changes in and Disagreements with Accountants on Accounting and Financial Disclosure |
None.
| Item 9A. | Controls and Procedures |
(1)Management’s Report on Internal Control Over Financial Reporting
Our management is responsible for establishing and maintaining adequate internal control over financial reporting as defined in Rules 13a-15(f) and 15d-15(f) under the Securities Exchange Act of 1934, as amended (the Exchange Act). Our internal control over financial reporting is designed to provide reasonable assurance regarding the reliability of financial reporting and the preparation of financial statements for external purposes in accordance with United States generally accepted accounting principles.
Because of its inherent limitations, internal control over financial reporting may not prevent or detect misstatements. Also, projections of any evaluation of effectiveness to future periods are subject to the risk that controls may become inadequate because of changes in conditions, or that the degree of compliance with the policies or procedures may deteriorate.
83
Management assessed the effectiveness of our internal control over financial reporting as of January 31, 2011, and has concluded that our internal control over financial reporting was effective. In making its assessment of internal control over financial reporting, management used the criteria issued by the Committee of Sponsoring Organizations of the Treadway Commission inInternal Control-Integrated Framework.
Our independent registered public accounting firm, KPMG LLP, has audited our internal control over financial reporting as of January 31, 2011, as stated in their report included in this Annual Report on Form 10-K.
REPORT OF INDEPENDENT REGISTERED PUBLIC ACCOUNTING FIRM
To the Stockholders and Board of Directors
Mentor Graphics Corporation:
We have audited Mentor Graphics Corporation’s internal control over financial reporting as of January 31, 2011, based on criteria established inInternal Control—Integrated Frameworkissued by the Committee of Sponsoring Organizations of the Treadway Commission (COSO). The management of Mentor Graphics Corporation is responsible for maintaining effective internal control over financial reporting and for its assessment of the effectiveness of internal control over financial reporting. Our responsibility is to express an opinion on the Company’s internal control over financial reporting based on our audit.
We conducted our audit in accordance with the standards of the Public Company Accounting Oversight Board (United States). Those standards require that we plan and perform the audit to obtain reasonable assurance about whether effective internal control over financial reporting was maintained in all material respects. Our audit included obtaining an understanding of internal control over financial reporting, assessing the risk that a material weakness exists, and testing and evaluating the design and operating effectiveness of internal control based on the assessed risk. Our audit also included performing such other procedures as we considered necessary in the circumstances. We believe that our audit provides a reasonable basis for our opinion.
A company’s internal control over financial reporting is a process designed to provide reasonable assurance regarding the reliability of financial reporting and the preparation of financial statements for external purposes in accordance with generally accepted accounting principles. A company’s internal control over financial reporting includes those policies and procedures that (1) pertain to the maintenance of records that, in reasonable detail, accurately and fairly reflect the transactions and dispositions of the assets of the company; (2) provide reasonable assurance that transactions are recorded as necessary to permit preparation of financial statements in accordance with generally accepted accounting principles, and that receipts and expenditures of the company are being made only in accordance with authorizations of management and directors of the company; and (3) provide reasonable assurance regarding prevention or timely detection of unauthorized acquisition, use, or disposition of the company’s assets that could have a material effect on the financial statements.
Because of its inherent limitations, internal control over financial reporting may not prevent or detect misstatements. Also, projections of any evaluation of effectiveness to future periods are subject to the risk that controls may become inadequate because of changes in conditions, or that the degree of compliance with the policies or procedures may deteriorate.
In our opinion, Mentor Graphics Corporation maintained, in all material respects, effective internal control over financial reporting as of January 31, 2011, based on criteria established inInternal Control—Integrated Frameworkissued by the COSO.
We also have audited, in accordance with the standards of the Public Company Accounting Oversight Board (United States), the consolidated balance sheets of Mentor Graphics Corporation and subsidiaries as of January 31, 2011 and 2010, and the related consolidated statements of operations, stockholders’ equity, and cash flows for each of the years in the three-year period ended January 31, 2011, and our report dated March 17, 2011 expressed an unqualified opinion on those consolidated financial statements.
/s/ KPMG LLP
March 17, 2011
Portland, Oregon
84
(2)Changes in Internal Control Over Financial Reporting
There has been no change in our internal control over financial reporting that occurred during the last fiscal quarter that has materially affected, or is reasonably likely to materially affect, our internal control over financial reporting.
(3)Evaluation of Disclosure Controls and Procedures
We maintain disclosure controls and procedures, as defined by Exchange Act Rules 13a–15(e) and 15d-15(e), that are designed to ensure that information required to be disclosed in our Exchange Act reports is recorded, processed, summarized, and reported within the time periods specified in the Securities and Exchange Commission’s rules and forms, and that such information is accumulated and communicated to our management, including our Chief Executive Officer and Chief Financial Officer, as appropriate, to allow timely decisions regarding required disclosure. In designing and evaluating the disclosure controls and procedures, management recognized that any controls and procedures, no matter how well designed and operated, can provide only reasonable assurance of achieving the desired control objectives, and management necessarily was required to apply its judgment in evaluating the cost-benefit relationship of possible controls and procedures.
We carried out an evaluation, under the supervision and with the participation of our management, including our Chief Executive Officer and our Chief Financial Officer, of the effectiveness of the design and operation of our disclosure controls and procedures as of the end of the period covered by this report. Based on the foregoing, our Chief Executive Officer and Chief Financial Officer concluded that our disclosure controls and procedures were effective at the reasonable assurance level as of the end of the period covered by this report.
| Item 9B. | Other Information |
None.
Part III
| Item 10. | Directors, Executive Officers, and Corporate Governance |
The information required by this item concerning our Directors will be included under “Election of Directors” in our 2011 Proxy Statement and is incorporated herein by reference. The information concerning our Executive Officers is included in the section titled “Executive Officers of the Registrant.” The information required by Item 405 of Regulation S-K will be included under “Section 16(a) Beneficial Ownership Reporting Compliance” in our 2011 Proxy Statement and is incorporated herein by reference. The information required by Item 406 of Regulation S-K will be included under “Ethics Policies” in our 2011 Proxy Statement and is incorporated herein by reference. The information required by Items 407(c)(3), 407(d)(4), and 407(d)(5) of Regulation S-K will be included under “Information Regarding the Board of Directors – Board Independence, Committees and Meetings” in our 2011 Proxy Statement and is incorporated herein by reference.
| Item 11. | Executive Compensation |
The information required by this item will be included under “Information Regarding Executive Officer Compensation,” “Compensation Discussion and Analysis,” “Compensation Committee Report,” and “Compensation Risk Assessment” in our 2011 Proxy Statement and is incorporated herein by reference.
85
| Item 12. | Security Ownership of Certain Beneficial Owners and Management and Related Stockholder Matters |
The information required by this item will be included under “Election of Directors,” “Information Regarding Beneficial Ownership of Principal Shareholders and Management,” and “Equity Compensation Plan Information” in our 2011 Proxy Statement and is incorporated herein by reference.
| Item 13. | Certain Relationships and Related Transactions, and Director Independence |
The information required by this item will be included under “Information Regarding the Board of Directors – Board Independence, Committees and Meetings” in our 2011 Proxy Statement and is incorporated herein by reference.
| Item 14. | Principal Accountant Fees and Services |
The information required by this item will be included under “Independent Auditors” in our 2011 Proxy Statement and is incorporated herein by reference.
Part IV
| Item 15. | Exhibits, Financial Statement Schedules |
(a) 1 Financial Statements:
The following consolidated financial statements are included in Part II, Item 8. “Financial Statements and Supplementary Data”:
| | | | |
| | | Page | |
Consolidated Statements of Operations for the years ended January 31, 2011, 2010, and 2009 | | | 42 | |
Consolidated Balance Sheets as of January 31, 2011 and 2010 | | | 43 | |
Consolidated Statements of Cash Flows for the years ended January 31, 2011, 2010, and 2009 | | | 44 | |
Consolidated Statements of Stockholders’ Equity for the years ended January 31, 2011, 2010, and 2009 | | | 45 | |
Notes to Consolidated Financial Statements | | | 46 | |
Report of Independent Registered Public Accounting Firm | | | 84 | |
(a) 2 Financial Statement Schedule:
The schedule listed below is filed as part of this report on the pages indicated:
All other financial statement schedules have been omitted since they are not required, not applicable, or the information is included in the Consolidated Financial Statements or Notes.
86
(a) 3 Exhibits
| | | | |
| 3. | | A. | | 1987 Restated Articles of Incorporation, as amended. Incorporated by reference to Exhibit 3A to the Company’s Quarterly Report on Form 10-Q for the quarter ended July 31, 2010. |
| | |
| | B. | | Bylaws of the Company. Incorporated by reference to Exhibit 3.B to the Company’s Current Report on Form 8-K filed on March 15, 2011. |
| | |
| 4. | | A. | | Credit Agreement dated as of June 1, 2005 between the Company, Bank of America, N.A. as agent and the other lenders. Incorporated by reference to Exhibit 4.F to the Company’s Current Report on Form 8-K filed on June 7, 2005. |
| | |
| | B. | | First Amendment to Credit Agreement dated as of November 8, 2005 between the Company, Bank of America, N.A. as agent and the other lenders. Incorporated by reference to Exhibit 4.G to the Company’s Annual Report on Form 10-K for the fiscal year ended December 31, 2005. |
| | |
| | C. | | Second Amendment to Credit Agreement dated as of June 20, 2006 between the Company, Bank of America, N.A. as agent and the other lenders. Incorporated by reference to Exhibit 4.A to the Company’s Quarterly Report on Form 10-Q for the quarter ended June 30, 2006. |
87
| | | | |
| | D. | | Third Amendment to Credit Agreement dated as of April 12, 2007 between the Company, Bank of America, N.A. as agent and the other lenders. Incorporated by reference to Exhibit 4.A to the Company’s Quarterly Report on Form 10-Q for the quarter ended April 30, 2007. |
| | |
| | E. | | Fourth Amendment to Credit Agreement dated as of June 22, 2007 between the Company, Bank of America, N.A. as agent and the other lenders. Incorporated by reference to Exhibit 4.H to the Company’s Current Report on Form 8-K filed on April 25, 2008. |
| | |
| | F. | | Fifth Amendment to Credit Agreement dated as of April 23, 2008 between the Company, Bank of America, N.A. as Agent and the other lenders. Incorporated by reference to Exhibit 4.I to the Company’s Current Report on Form 8-K filed on April 25, 2008. |
| | |
| | G. | | Sixth Amendment to Credit Agreement dated as of March 9, 2009 between the Company, Bank of America, N.A. as Agent and the other lenders. Incorporated by reference to Exhibit 4.I to the Company’s Current Report on Form 8-K filed on March 12, 2009. |
| | |
| | H. | | Election dated as of March 31, 2010 to reduce commitment under revolving Credit Agreement between the Company, Bank of America, N.A., as agent, and other lenders. Incorporated by reference to Exhibit 4.L to the Company’s Quarterly Report on Form 10-Q for the quarter ended April 30, 2010. |
| | |
| | I. | | Credit agreement for $20 million term loan dated as of April 6, 2010 between the Company, Bank of America, N.A. as agent, and other lenders. Incorporated by reference to Exhibit 4.M to the Company’s Quarterly Report on Form 10-Q for the quarter ended April 30, 2010. |
| | |
| | J. | | Indenture dated as of March 3, 2006 between the Company and Wilmington Trust Company, as Trustee, related to 6.25% Convertible Subordinated Debentures due 2026. Incorporated by reference to Exhibit 4.1 to the Company’s Current Report on Form 8-K filed on March 9, 2006. |
| | |
| | K. | | Registration Rights Agreement dated March 3, 2006, between the Company and Merrill Lynch, Pierce Fenner & Smith Incorporated, Banc of America Securities LLC and UBS Securities LLC. Incorporated by reference to Exhibit 10.1 to the Company’s Current Report on Form 8-K filed on March 9, 2006. |
| | |
| | L. | | Indenture dated July 27, 2010, between the Company and Wilmington Trust Company, as Trustee, related to 6.25% Convertible Subordinated Debentures due 2026. Incorporated by reference to Exhibit 4.1 to the Company’s Current Report on Form 8-K filed on July 27, 2010. |
| | |
| | M. | | First Supplemental Indenture dated October 13, 2010, between the Company and Wilmington Trust Company, as Trustee, related to the 6.25% Convertible Subordinated Debentures due 2026. Incorporated by reference to Exhibit 4.1 to the Company’s Current Report on Form 8-K filed on October 13, 2010. |
| | |
| | N. | | Rights Agreement dated as of June 24, 2010 between the Company and American Stock Transfer & Trust Company, LLC, as Trustee, related to the Incentive Stock Purchase Rights Plan. Incorporated by reference to Exhibit 4.1 to the Company’s Current Report on Form 8-K filed on June 25, 2010. |
| | |
| 10. | | *A. | | 2010 Omnibus Incentive Plan. Incorporated by reference to Exhibit 10.A to the Company’s Current Report on Form 8-K filed on July 2, 2010. |
88
| | | | |
| | *B. | | Form of Restricted Stock Unit Award Agreement for grants of restricted stock units to non-employee directors under our 2010 Omnibus Incentive Plan. Incorporated by reference to Exhibit 10.B to the Company’s Quarterly Report on Form 10-Q for the quarter ended July 31, 2010. |
| | |
| | *C. | | Form of Stock Option Agreement for grants of stock options to non-employee directors under our 2010 Omnibus Incentive Plan. Incorporated by reference to Exhibit 10.C to the Company’s Quarterly Report on Form 10-Q for the quarter ended July 31, 2010. |
| | |
| | *D. | | Form of Deferral Agreement and Distribution Election related to non-employee director July 1, 2010 restricted stock unit awards. Incorporated by reference to Exhibit 10.D to the Company’s Quarterly Report on Form 10-Q for the quarter ended July 31, 2010. |
| | |
| | *E. | | Form of Stock Option Agreement Terms and Conditions containing standard terms of stock options granted to our executive officers under our 2010 Omnibus Incentive Plan. |
| | |
| | *F. | | Form of Stock Option Agreement Terms and Conditions containing standard terms of stock options granted in fiscal years 2009 and 2010 to executive officers under the Company’s stock option plans. Incorporated by reference to Exhibit 10.1 to the Company’s Quarterly Report on Form 10-Q for the quarter ended April 30, 2009. |
| | |
| | *G. | | Form of Stock Option Agreement Terms and Conditions containing standard terms of stock options granted on October 9, 2007 to executive officers under our stock option plans. Incorporated by reference to Exhibit 10.A to the Company’s Quarterly Report on Form 10-Q for the quarter ended October 31, 2007. |
| | |
| | *H. | | Form of Amendment to Nonqualified Stock Options containing additional standard terms of nonqualified stock options granted to executives under the Company’s stock option plans. Incorporated by reference to Exhibit 10.B to the Company’s Current Report on Form 8-K filed on November 2, 2004. |
| | |
| | *I. | | Form of Restricted Stock Unit Award Agreement Terms and Conditions containing standard terms of restricted stock units granted to executive officers under our stock incentive plans. Incorporated by reference to the Company’s Current Report on Form 8-K filed on December 29, 2009. |
| | |
| | *J. | | Form of Restricted Stock Unit Award Agreement Terms and Conditions containing standard terms of restricted stock units granted to executive officers under our 2010 Omnibus Incentive Plan. Incorporated by reference to Exhibit 10.A to the Company’s Quarterly Report on Form 10-Q for the quarter ended July 31, 2010. |
| | |
| | *K. | | Executive Variable Incentive Plan. Incorporated by reference to Exhibit 10.G to the Company’s Current Report on Form 8-K filed on June 15, 2007. |
| | |
| | *L. | | Form of Indemnity Agreement entered into between the Company and each of its executive officers and current and future directors. Incorporated by reference to Exhibit 10.I to the Company’s Quarterly Report on Form 10-Q for the quarter ended July 31, 2008. |
| | |
| | *M. | | Form of Severance Agreement entered into between the Company and each executive officer of the Company and certain other employees. Incorporated by reference to Exhibit 10.A to the Company’s Current Report on Form 8-K filed on March 16, 2010. |
| | |
| | *N. | | Officer Stock Ownership Policy. |
| | |
| | *O. | | Form of Agreement to Policy for Recovery of Incentive Compensation. |
| | |
| 21. | | | | List of Subsidiaries of the Company. |
| | |
| 23. | | | | Consent of KPMG, LLP Independent Registered Public Accounting Firm. |
89
| | |
| 31.1 | | Certification of Chief Executive Officer of Registrant Pursuant to SEC Rule 13a-14(a)/15d-14(a), as Adopted Pursuant to Section 302 of the Sarbanes-Oxley Act of 2002. |
| |
| 31.2 | | Certification of Chief Financial Officer of Registrant Pursuant to SEC Rule 13a-14(a)/15d-14(a), as Adopted Pursuant to Section 302 of the Sarbanes-Oxley Act of 2002. |
| |
| 32. | | Certification of Chief Executive Officer and Chief Financial Officer of Registrant Pursuant to 18 U.S.C. Section 1350, as Adopted Pursuant to Section 906 of the Sarbanes-Oxley Act of 2002. |
| |
| 101.INS | | XBRL Instance Document |
| |
| 101.SCH | | XBRL Taxonomy Extension Schema Document |
| |
| 101.CAL | | XBRL Taxonomy Extension Calculation Linkbase Document |
| |
| 101.DEF | | XBRL Taxonomy Extension Definition Linkbase Document |
| |
| 101.LAB | | XBRL Taxonomy Extension Label Linkbase Document |
| |
| 101.PRE | | XBRL Taxonomy Extension Presentation Linkbase Document |
|
* Management contract or compensatory plan or arrangement. |
90
SIGNATURES
Pursuant to the requirements of Section 13 or 15(d) of the Securities Exchange Act of 1934, the registrant has duly caused this report to be signed on its behalf by the undersigned, thereunto duly authorized.
| | | | | | |
| | | | MENTOR GRAPHICS CORPORATION |
| | | |
| Dated: March 14, 2011 | | | | By | | /S/WALDEN C. RHINES |
| | | | | | Walden C. Rhines |
| | | | | | Chief Executive Officer |
Pursuant to the requirements of the Securities Exchange Act of 1934, this report has been signed by the following persons on behalf of the registrant in the capacities and on the dates indicated.
| | | | | | |
| (1) | | Principal Executive Officer: | | | | |
| | | |
| | /S/ WALDEN C. RHINES | | Chief Executive Officer | | March 14, 2011 |
| | Walden C. Rhines | | | | |
| | | |
| (2) | | Principal Financial and Accounting Officer: | | | | |
| | | |
| | /S/ GREGORY K. HINCKLEY | | President, Chief Financial Officer | | March 14, 2011 |
| | Gregory K. Hinckley | | | | |
| | | |
| (3) | | Directors: | | | | |
| | | |
| | /S/ WALDEN C. RHINES | | Chairman of the Board | | March 14, 2011 |
| | Walden C. Rhines | | | | |
| | | |
| | /S/ GREGORY K. HINCKLEY | | Director | | March 14, 2011 |
| | Gregory K. Hinckley | | | | |
| | | |
| | /S/ SIR PETER BONFIELD | | Director | | March 14, 2011 |
| | Sir Peter Bonfield | | | | |
| | | |
| | /S/ MARSHA B. CONGDON | | Director | | March 16, 2011 |
| | Marsha B. Congdon | | | | |
| | | |
| | /S/ JAMES R. FIEBIGER | | Director | | March 14, 2011 |
| | James R. Fiebiger | | | | |
| | | |
| | /S/ KEVIN C. MCDONOUGH | | Director | | March 14, 2011 |
| | Kevin C. McDonough | | | | |
| | | |
| | /S/ PATRICK B. MCMANUS | | Director | | March 14, 2011 |
| | Patrick B. McManus | | | | |
| | | |
| | /S/ FONTAINE K. RICHARDSON | | Director | | March 14, 2011 |
| | Fontaine K. Richardson | | | | |
91
SCHEDULE II
MENTOR GRAPHICS CORPORATION AND SUBSIDIARIES
Valuation and Qualifying Accounts
| | | | | | | | | | | | | | | | |
In Thousands | | Beginning
Balance | | | Additions | | | Deductions | | | Ending Balance | |
Year ended January 31, 2009 | | | | | | | | | | | | | | | | |
| | | | |
Allowance for doubtful accounts1 | | $ | 4,577 | | | $ | 1,069 | | | $ | 131 | | | $ | 5,515 | |
Accrued restructuring costs | | $ | 7,410 | | | $ | 16,888 | | | $ | 15,967 | | | $ | 8,331 | |
| | | | |
Year ended January 31, 2010 | | | | | | | | | | | | | | | | |
| | | | |
Allowance for doubtful accounts1 | | $ | 5,515 | | | $ | (15 | ) | | $ | 1,893 | | | $ | 3,607 | |
Accrued restructuring costs | | $ | 8,331 | | | $ | 21,334 | | | $ | 20,641 | | | $ | 9,024 | |
| | | | |
Year ended January 31, 2011 | | | | | | | | | | | | | | | | |
| | | | |
Allowance for doubtful accounts1 | | $ | 3,607 | | | $ | 369 | | | $ | 35 | | | $ | 3,941 | |
Accrued restructuring costs | | $ | 9,024 | | | $ | 10,257 | | | $ | 12,351 | | | $ | 6,930 | |
| (1) | Deductions primarily represent accounts written off during the period. |
92