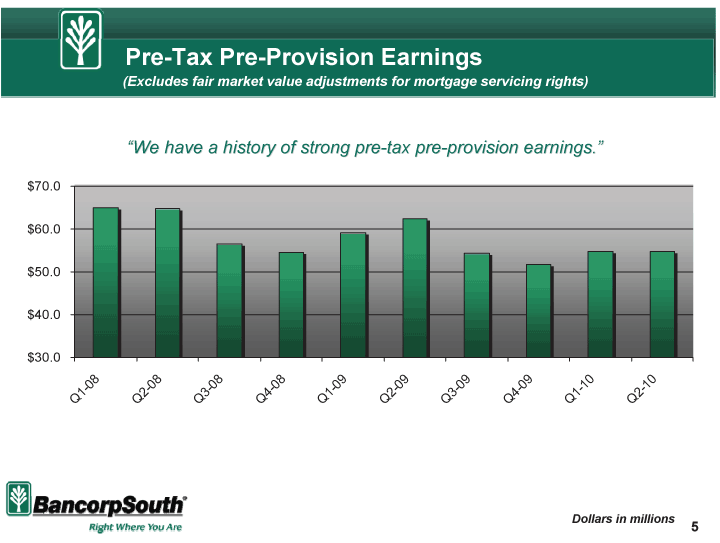
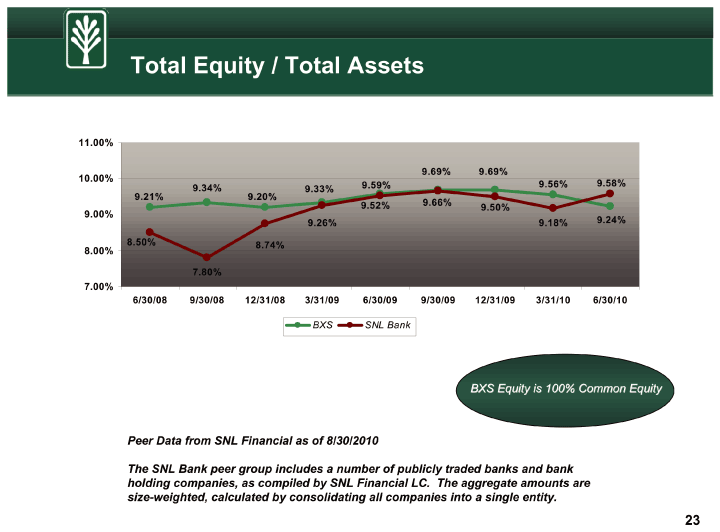
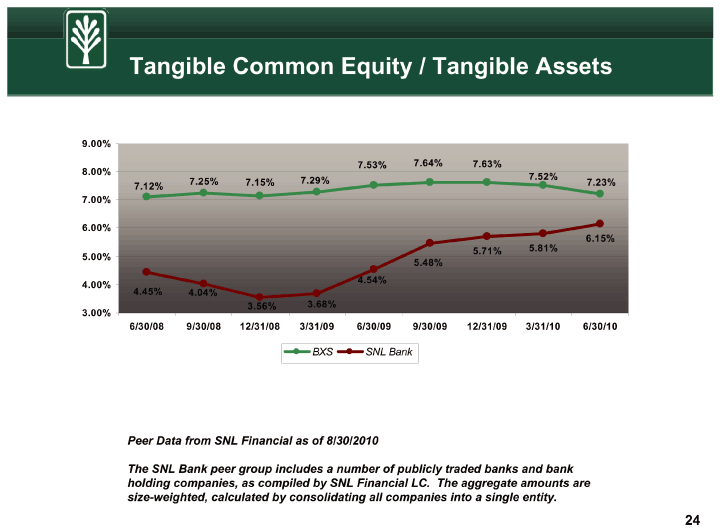
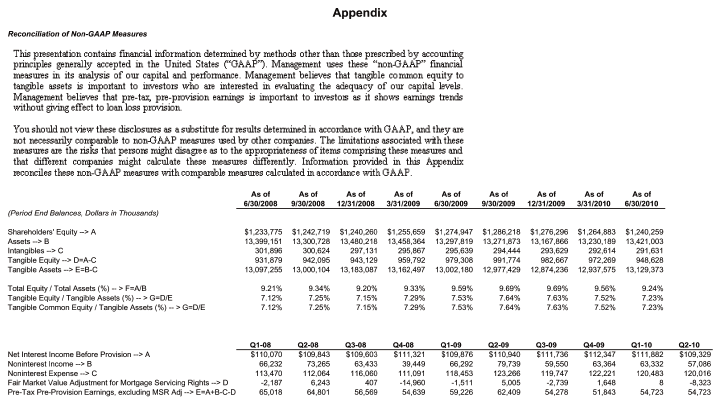
| Appendix Reconciliation of Non-GAAP Measures This presentation contains financial information determined by methods other than those prescribed by accounting principles generally accepted in the United States (“GAAP’^J. Management uses these “non-GAAP” financial measures in its analysis of oui capital and performance. Management believes that tangible common equity to tangible assets is important to investors who are interested in evaluating the adequacy of our capital levels. Management believes that pre-tax, pre-provision earnings is important to investoE as it shows earnings trends without giving effect to loan loss provision. You should not view these disclosures as a substitute for results determined in accordance with GAAP, and they are not necessarily comparable to non-GAAP measures used by other companies. The limitations associated with these measures are the risks that persons might disagree as to the appropriateness of items comprising these measures and that different companies might calculate these measures differently. Information provided in this Appendix reconciles these non-GAAP measures with comparable measures calculated in accordance with GAAP. As of As of As of As of As of As of As of As of As of 6/30/2008 9/30/2008 12/31/2008 3/31/2009 6/30/2009 9/30/2009 12/31/2009 3/31/2010 6/30/2010 (Period End Balances, Dollars in Thousands) Shareholders’ Equity —> A $1,233,775 $1,242,719 $1,240,260 $1,255,659 $1,274,947 $1,286,218 $1,276,296 $1,264,883 $1,240,259 Assets —> B 13,399,151 13,300,728 13,480,218 13,458,364 13,297,819 13,271,873 13,167,866 13,230,189 13,421,003 Intangibles —> C 301,896 300,624 297,131 295,867 295,639 294,444 293,629 292,614 291,631 Tangible Equity —> D=A-C 931,879 942,095 943,129 959,792 979,308 991,774 982,667 972,269 948,628 Tangible Assets —> E=B-C 13,097,255 13,000,104 13,183,087 13,162,497 13,002,180 12,977,429 12,874,236 12,937,575 13,129,373 Total Equity / Total Assets (%) — > F=A/B 9.21% 9.34% 9.20% 9.33% 9.59% 9.69% 9.69% 9.56% 9.24% Tangible Equity / Tangible Assets (%) — > G=D/E 7.12% 7.25% 7.15% 7.29% 7.53% 7.64% 7.63% 7.52% 7.23% Tangible Common Equity / Tangible Assets (%) — > G=D/E 7.12% 7.25% 7.15% 7.29% 7.53% 7.64% 7.63% 7.52% 7.23% Q1-08 Q2-08 Q3-08 Q4-08 Q1-09 Q2-09 Q3-09 Q4-09 Q1-10 Q2-10 Net Interest Income Before Provision —> A $110,070 $109,843 $109,603 $111,321 $109,876 $110,940 $111,736 $112,347 $111,882 $109,329 Noninterest Income —> B 66,232 73,265 63,433 39,449 66,292 79,739 59,550 63,364 63,332 57,086 Noninterest Expense —> C 113,470 112,064 116,060 111,091 118,453 123,266 119,747 122,221 120,483 120,016 Fair Market Value Adjustment for Mortgage Servicing Rights —> D -2,187 6,243 407 -14,960 -1,511 5,005 -2,739 1,648 8 -8,323 Pre-Tax Pre-Provision Earnings, excluding MSR Adj —> E=A+B-C-D 65,018 64,801 56,569 54,639 59,226 62,409 54,278 51,843 54,723 54,723 |
