![]() BancorpSouth, Inc. Investor Presentation November 2011 Exhibit 99.1 |
![]() Certain statements contained in this presentation and the accompanying slides may not be based on historical facts and are “forward-looking statements” within the meaning of Section 27A of the Securities Act of 1933, as amended, and Section 21E of the Securities Exchange Act of 1934, as amended. These forward-looking statements may be identified by reference to a future period or by the use of forward-looking terminology, such as “anticipate,” “believe,” “estimate,” “expect,” “foresee,” “may,” “might,” “will,” “intend,” “could,” “would” or “plan,” or future or conditional verb tenses, and variations or negatives of such terms. These forward- looking statements include, without limitation, statements about the Company’s strategic focus, long-term prospects for shareholder value, the impact of the prevailing economy, the use of non-GAAP financial measures, results of operations, and financial condition. We caution you not to place undue reliance on the forward-looking statements contained in this presentation, in that actual results could differ materially from those indicated in such forward-looking statements as a result of a variety of factors. These factors include, but are not limited to, conditions in the financial markets and economic conditions generally, the soundness of other financial institutions, the availability of capital on favorable terms if and when needed, liquidity risk, the credit risk associated with real estate construction, acquisition and development loans, estimates of costs and values associated with real estate construction, acquisition and development loans in the Company’s loan portfolio, the adequacy of the Company’s allowance for credit losses to cover actual credit losses, governmental regulation and supervision of the Company’s operations, the impact of recent legislation on service charges on core deposit accounts, the susceptibility of the Company’s business to local economic conditions, changes in interest rates, the impact of monetary policies and economic factors on the Company’s ability to attract deposits or make loans, volatility in capital and credit markets, the impact of hurricanes or other adverse weather events, risks in connection with completed or potential acquisitions, dilution caused by the Company’s issuance of any additional shares of its common stock to raise capital or acquire other banks, bank holding companies, financial holding companies and insurance agencies, restrictions on the Company’s ability to declare and pay dividends, the Company’s growth strategy, diversification in the types of financial services the Company offers, competition with other financial services companies, interruptions or breaches in security of the Company’s information systems, the failure of certain third party vendors to perform, the Company’s ability to improve its internal controls adequately, any requirement that the Company write down goodwill or other intangible assets, other factors generally understood to affect the financial results of financial services companies, and other factors detailed from time to time in the Company’s press releases and filings with the Securities and Exchange Commission. Forward-looking statements speak only as of the date they were made, and, except as required by law, we do not undertake any obligation to update or revise forward-looking statements to reflect events or circumstances after the date of this presentation. Certain tabular presentations may not reconcile because of rounding. Unless otherwise noted, any statements in this presentation can be attributed to company management. Forward Looking Information 2 |
![]() This presentation contains financial information determined by methods other than those prescribed by accounting principles generally accepted in the United States ("GAAP'). Management uses these "non-GAAP" financial measures in its analysis of the Company's capital and performance. Management believes that the ratio of tangible shareholders’ equity to tangible assets is important to investors who are interested in evaluating the adequacy of the Company's capital levels. Management believes that tangible book value per share is important to investors who are interested in changes from period to period in book value per share exclusive of changes in tangible assets. Management believes that pre-tax, pre-provision earnings is important to investors as it shows earnings trends without giving effect to provision for credit losses. You should not view these disclosures as a substitute for results determined in accordance with GAAP, and they are not necessarily comparable to non-GAAP measures used by other companies. The limitations associated with these measures are the risks that persons might disagree as to the appropriateness of items comprising these measures and that different companies might calculate these measures differently. Information provided in the Appendix of this presentation reconciles these non-GAAP measures with comparable measures calculated in accordance with GAAP. Non-GAAP Financial Disclaimer 3 |
![]() Strong core capital base Common equity $1.3 billion (no preferred) Tangible shareholders’ equity / tangible assets: 7.58% Total risk-based capital ratio: 12.62% Overview of BancorpSouth, Inc. 4 Data as of September 30, 2011 Insurance ranking from Business Insurance Magazine as of December 31, 2010 $13.2 billion in assets 290 locations with reach throughout an 8-state footprint Customer-focused business model with comprehensive line of financial products and banking services for individuals and small to mid-size businesses Nation’s 26 th largest insurance agency / brokerage operation Strong mortgage operations with production totaling $823 million through the first three quarters of 2011 Consistent core earnings with YTD pre-tax, pre-provision earnings of $51 million (excluding MSR impairment) |
![]() 5 Regional Management Structure |
![]() 9/30/11 6/30/11 9/30/10 Net interest revenue $108.1 $109.9 $109.7 (1.5) % Provision for credit losses 25.1 32.2 54.9 (54.2) Noninterest revenue 62.1 75.1 69.8 (11.0) Noninterest expense 130.7 137.1 123.1 6.2 Income before income taxes 14.3 15.7 1.5 Income tax provision (benefit) 2.4 2.9 (9.8) Net income $11.9 $12.8 $11.3 Net income per share: diluted $0.14 $0.15 $0.13 Three Months Ended, Q3'11 vs. Q3'10 September 2011 and 2010 numbers reflect $2.1 million and $2.3 million of net securities gains, respectively. June 2011 numbers reflect $10.0 million of net securities gains as well as a $9.8 million pre-payment penalty related to repaying $75.0 million of FHLB borrowings. 6 Recent Operating Results Dollars in millions, except per share data |
![]() $53 $55 $46 $56 $61 $48 $48 $39 $52 $55 $55 $61 $52 $45 $52 $51 $0 $10 $20 $30 $40 $50 $60 $70 12/31/09 3/31/10 6/30/10 9/30/10 12/31/10 3/31/11 6/30/11 9/30/11 Pre-tax, Pre-provision Earnings Pre-tax, Pre-Provision Earnings (ex. MSR impairment) 7 Dollars in millions Data for quarters ended as of dates shown Stable and Consistent Pre-tax, Pre-provision Earnings |
![]() Diversified Revenue Stream 8 Percentages based on data for the nine months ended September 30, 2011 Excludes net securities gains of $12.1 million YTD Noninterest Revenue Composition Insurance and mortgage businesses provide significant sources of noninterest revenue Historically, over 35% of total revenue has been derived from noninterest sources Insurance commissions were up 5% for the first nine months of 2011, compared to the first nine months of 2010 Mortgage production volume totaled $823 million for 2011 YTD $193.4M YTD Mortgage lending 4% Card and merchant fees 18% Service charges 25% Trust income 5% Insurance commissions 35% Other 13% |
![]() Noninterest revenue continues to be a stable and significant source of revenue. Insurance business continues to perform well and typically makes up over 1/3 of current noninterest revenue. Noninterest Revenue 9 Dollars in millions Excludes net securities gains and MSR Impairment Data for quarters ended as of dates shown $18M $22M $22M $21M $18M $23M $23M $22M $0 $20 $40 $60 $80 12/31/09 3/31/10 6/30/10 9/30/10 12/31/10 3/31/11 6/30/11 9/30/11 Insurance Commissions Other $63M $62M $66M $72M $66M $66M $69M $72M |
![]() 10 Balance Sheet Summary Dollars in millions, except per share Based on period end balances 09/30/11 06/30/11 09/30/10 % Change Total assets $13,199 $13,367 $13,583 (2.8) % Cash and equivalents 500 471 339 47.5 Securities 2,482 2,561 2,274 9.1 Loans, net of unearned income 9,056 9,215 9,515 (4.8) Allowance for credit losses (200) (198) (205) (2.4) Total deposits 11,063 11,308 11,197 (1.2) Short-term borrowings 451 427 654 (31.0) Shareholders' equity 1,267 1,247 1,236 2.5 Book value per share 15.17 14.93 14.80 2.5 Tangible book value per share 11.71 11.46 11.32 3.4 Q3 ‘11 vs Q3 ‘10 |
![]() Non-Interest Bearing 20% Interest Bearing DDA 43% Time 28% Savings 9% Core Deposit Franchise 11 Approximately 72% of total deposits are non-time Non-interest bearing deposits have grown approximately 12% since September 30, 2010 Cost of total deposits for the quarter ended September 30, 2011 was 0.75% Over $1.3 billion in CDs are maturing over the next two quarters at a weighted average rate of approximately 1.40% As of September 30, 2011 $11.1B Total Deposit Composition |
![]() Stable Net Interest Margin 12 Fiscal Year Quarter Ended Shown on a fully taxable equivalent basis |
![]() Building A Stronger Deposit Base 13 De-emphasizing commoditized deposits Increasing multi-service household accounts Dollars in millions Account balances based on quarterly averages Savings Noninterest DDAs Interest Bearing DDAs CDs |
![]() AL & FL Panhandle 8% AR 14% MS 27% MO 6% Greater Memphis 6% N.E. TN 8% TX & LA 18% Other 13% Commercial & Industrial 16% Consumer Mortgages 22% Home Equity 6% Agricultural 3% C&I Owner-Occupied 15% Construction, Acquisition & Dev. 11% Commercial Real Estate 19% Credit Cards 1% Other 7% Diversified Loan Portfolio 14 Net loans and leases as of September 30, 2011 *”Other” includes all other geographic regions and lines of business not managed by a geographic region $9.1B Portfolio Loans By Category Loans By Geography * |
![]() % Change Three Months Ended Linked YOY 9/30/11 6/30/11 9/30/10 Q3'11 vs. Q2'11 Q3'11 vs. Q3'10 Commercial and industrial 1,503 $ 1,527 $ 1,438 $ (1.6%) 4.5% Real estate: Consumer mortgages 1,966 1,971 1,972 (0.3%) (0.3%) Home equity 523 532 552 (1.7%) (5.3%) Agricultural 250 255 262 (2.1%) (4.6%) Commercial and industrial-owner occupied 1,330 1,367 1,375 (2.7%) (3.3%) Construction, acquisition and development 977 1,061 1,336 (7.9%) (26.9%) Commercial 1,772 1,765 1,811 0.4% (2.1%) Credit Cards 103 102 103 1.0% 0.3% Other 632 635 665 (0.5%) (5.0%) Total 9,056 $ 9,215 $ 9,515 $ (1.7%) (4.8%) Loan Portfolio Growth Increase in commercial and industrial lending Continue to decrease exposure in the CAD portfolio Excluding the impact of CAD portfolio - total loans declined 1.2% since September 2010 15 Dollars in millions Net loans and leases |
![]() Credit Quality Continues to Improve 16 At and for the three months ended September 30, 2011 “Paying as agreed” includes loans < 30 days past due with payments occurring at least quarterly Non-performing loans decreased 4.5% from the previous quarter 48% of non-accrual loans were paying as agreed Net charge-offs declined $9.9 million, or 30%, from the previous quarter Both net charge-offs and NPLs have declined for two consecutive quarters Sales of OREO properties during the quarter totaled $13.1 million, resulting in no material net gain/loss |
![]() 3Q11 NPL Improvement 17 Dollars in millions As of 9/30/11 6/30/11 Change Non-accrual loans and leases $314.5 $331.1 ($16.6) Loans and leases 90+ days past due, still accruing 7.3 4.0 3.3 Restructured loans and leases, still accruing 41.0 44.8 (3.8) Total non-performing loans and leases $362.8 $379.8 ($17.0) Allowance for credit losses to net loans and leases 2.21% 2.14% Allowance for credit losses to non-performing loans and leases 55.04% 52.03% Non-performing loans and leases to net loans and leases 4.01% 4.12% |
![]() AL & FL Panhandle 18% AR 8% MS 14% MO 14% Greater Memphis 16% N.E. TN 11% TX & LA 14% Other 5% NPLs By Type & Location NPLs By Category NPLs By Geography As of September 30, 2011 NPLs include nonaccrual loans, loans 90+ days PD and restructured loans *“Other” includes all other geographic regions and lines of business not managed by a geographic region 18 * |
![]() ![]() Loan Impairment Analysis 89% of non-accrual loans are impaired and are carried at 70% of UPB As of September 30, 2011 Dollars in millions 19 Total Unpaid principal balance of impaired loans $342.8 Cumulative charge-offs on impaired loans (62.9) Allowance for impaired loans (38.7) Net book value of impaired loans $241.2 Net book value / UPB 70% |
![]() 20 Newly Identified Non-Accrual Loans Dollars in millions $166M $131M $111M $50M $61M $74M $60M $52M $48M $54M $0 $20 $40 $60 $80 $100 $120 $140 $160 $180 9/30/10 12/31/10 3/31/11 6/30/11 9/30/11 Newly Identified Non-Accrual Loans Loans 30-89 Days PD, Still Accruing |
![]() Aging of Loan Portfolio by Internal Classifications 21 Dollars in thousands Net loans and leases 30-59 Days 60-89 Days 90+ Days Current Past Due Past Due Past Due Total Pass 8,068,380 $ - $ - $ - $ 8,068,380 $ Special Mention 76,952 1,755 - 11 78,718 Substandard 551,766 43,093 12,975 8,807 616,641 Doubtful 6,873 1,713 302 1,540 10,428 Loss 1,342 256 - 251 1,849 Impaired 163,142 22,060 9,493 85,194 279,889 Total 8,868,455 $ 68,877 $ 22,770 $ 95,803 $ 9,055,905 $ September 30, 2011 |
![]() $0 $100 $200 $300 $400 9/30/10 12/31/10 3/31/10 6/30/11 9/30/11 Non-Accrual Lns Paying as Agreed All Other Non-Accrual Lns Non-Accrual Loans 22 Dollars in millions “Paying as Agreed” includes loans < 30 days past due with payments occurring at least quarterly 42% 36% 37% 47% 48% 48% of non-accrual loans were paying as agreed as of September 30, 2011 |
![]() Outstanding NPLs NPLs as a Percent of Outstanding Multi-Family Construction $10 $0.0 1-4 Family Construction 181 18.5 Recreation and All Other Loans 61 0.7 Commercial Construction 141 10.2 Commercial Acquisition and Development 207 33.3 Residential Acquisition and Development 377 111.4 Real Estate Construction, Acquisition and Development $977 $174.0 16.1 29.6 17.8% 0.0% 10.2 1.2 7.2 Real Estate Construction, Acquisition and Development Dollars in millions As of September 30, 2011 $0 $100 $200 $300 $400 $500 Multi-Family Construction 1-4 Family Construction Recreation & All Other Loans Commercial Construction Commercial A & D Residential A & D 23 |
![]() $523 $456 $420 $393 $377 $300 $375 $450 $525 $600 9/30/10 12/31/10 3/31/11 6/30/11 9/30/11 Residential Acquisition and Development 24 Dollars in millions |
![]() Dollars in millions 25 Net Charge-offs are Improving % Avg. Loans $51 $51 $52 $33 $23 0.0% 0.5% 1.0% 1.5% 2.0% 2.5% 3.0% $0 $10 $20 $30 $40 $50 $60 9/30/10 12/31/10 3/31/11 6/30/11 9/30/11 Net Charge-Offs Net Charge-offs / Average loans |
![]() ![]() Other Real Estate Owned 26 As of September 30, 2011 Dollars in millions Total Unpaid principal balance at time of foreclosure $288.9 Cumulative charge-offs and writedowns of OREO (126.2) Current book value of OREO $162.7 Current book value / UPB 56% OREO is carried at 56% of aggregate loan balances at time of foreclosure |
![]() Strategic Focus Preserve strong capital and position the Company for economic recovery Relentless focus on asset quality Pursue quality loan growth Take advantage of market disruption Grow core earnings through margin expansion and revenue growth Expense control and reduction 27 |
![]() 28 Leading Mid-South Regional Bank Diversified Revenue Stream Over 35% of the revenue stream is derived from noninterest sources High Quality Deposit Franchise with a Stable Core Deposit Base 20% NIB Deposits / Cost of total deposits of 0.75% (for the quarter ended September 30, 2011) Proven and Experienced Management Team Positive Asset Quality Trends 4.5% decline in non-performing loans in the most recent quarter Both net charge-offs and NPLs have declined for two consecutive quarters 48% of nonaccrual loans are paying as agreed Consistent Pre-tax, Pre-Provision Earnings Summary At and for the three months ended September 30, 2011 |
![]() Appendix |
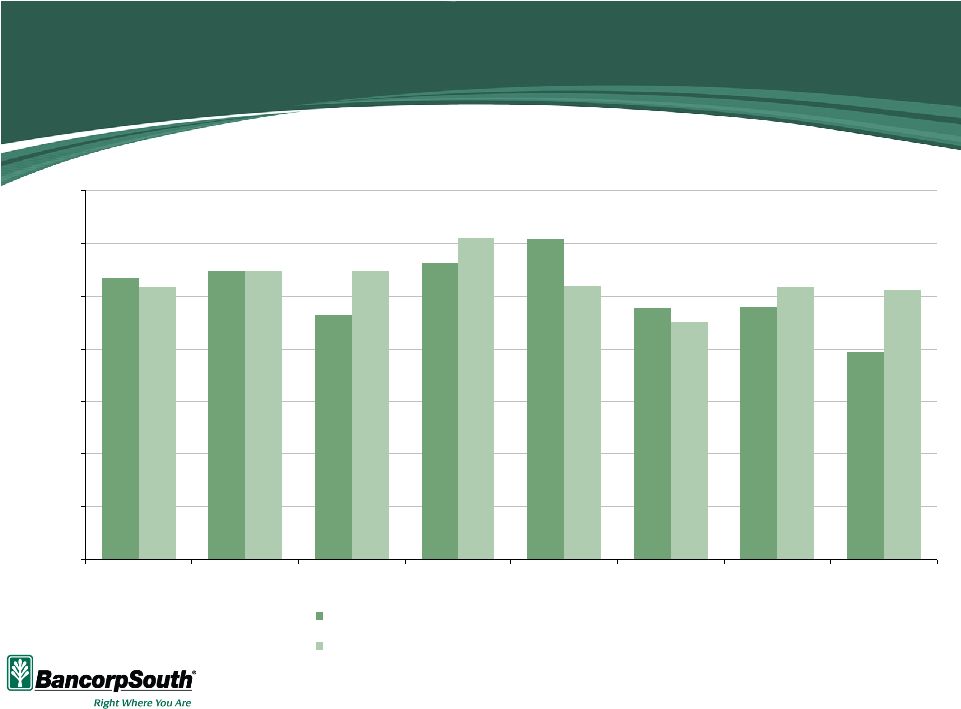
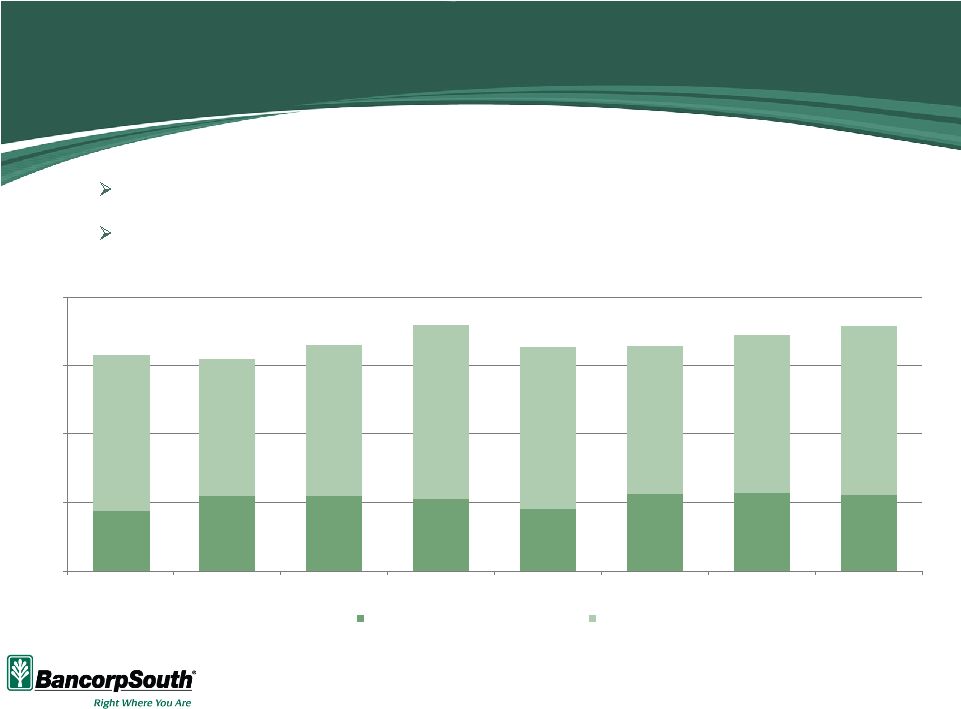
![]() 30 Non-GAAP Financial Reconciliation Pre-Tax, Pre-Provision Earnings Reconciliation Q4-09 Q1-10 Q2-10 Q3-10 Q4-10 Q1-11 Q2-11 Q3-11 (Dollars in Thousands) Net Interest Income Before Provision --> A $112,347 $111,882 $109,329 $109,678 $110,253 $109,437 $109,912 $108,075 Noninterest Income --> B 64,505 63,332 57,086 69,752 73,974 68,311 75,144 62,055 Noninterest Expense --> C 123,361 120,483 120,016 123,087 123,447 130,010 137,069 130,698 Pre-Tax Pre-Provision Earnings --> D=A+B-C 53,491 54,731 46,399 56,343 60,780 47,738 47,987 39,432 MSR Valuation Adjustment --> E 1,648 8 (8,323) (4,609) 8,895 2,540 (3,839) (11,676) Pre-Tax Pre-Provision Earnings (Excluding MSR Adjustment) --> F=D-E 51,843 54,723 54,722 60,952 51,885 45,198 51,826 51,108 Tangible Shareholders' Equity / Tangible Assets As of As of As of 9/30/2010 6/30/2011 9/30/2011 (Dollars in Thousands) Shareholders' Equity --> A $1,235,705 $1,246,703 $1,266,753 Assets --> B 13,583,016 13,367,050 13,198,518 Intangibles --> C 290,670 289,546 288,723 Tangible Shareholders' Equity --> D=A-C 945,034 957,157 978,030 Tangible Assets --> E=B-C 13,292,346 13,077,504 12,909,795 Tangible Book Value Per Share Total Equity / Total Assets (%) -- > F=A/B 9.10% 9.33% 9.60% Tangible Common Equity / Tangible Assets (%) -- > G=D/E 7.11% 7.32% 7.58% Common Shares Outstanding -- > H 83,482 83,489 83,489 Tangible Book Value Per Share -- > I=D/H 11.32 11.46 11.71 |