 BancorpSouth, Inc. Investor Presentation February 2012 Exhibit 99.1 |
 Forward Looking Information 2 Certain statements contained in this presentation and the accompanying slides may not be based on historical facts and are “forward-looking statements” within the meaning of Section 27A of the Securities Act of 1933, as amended, and Section 21E of the Securities Exchange Act of 1934, as amended. These forward- looking statements may be identified by reference to a future period or by the use of forward-looking terminology, such as “anticipate,” “believe,” “estimate,” “expect,” “foresee,” “may,” “might,” “will,” “intend,” “could,” “would” or “plan,” or future or conditional verb tenses, and variations or negatives of such terms. These forward-looking statements include, without limitation, statements about the use of non-GAAP financial measures, maturities of our CDs, pro forma capital ratios, our strategic focus, results of operations and financial condition. We caution you not to place undue reliance on the forward-looking statements contained in this presentation, in that actual results could differ materially from those indicated in such forward-looking statements as a result of a variety of factors. These factors include, but are not limited to, conditions in the financial markets and economic conditions generally, the adequacy of the Company’s provision and allowance for credit losses to cover actual credit losses, the credit risk associated with real estate construction, acquisition and development loans, the impact of legal or administrative proceedings, the availability of capital on favorable terms if and when needed, liquidity risk, the Company’s ability to improve its internal controls adequately, governmental regulation, including the Dodd Frank Act, and supervision of the Company’s operations, the impact of regulations on service charges on the Company’s core deposit accounts, the susceptibility of the Company’s business to local economic conditions, the soundness of other financial institutions, changes in interest rates, the impact of monetary policies and economic factors on the Company’s ability to attract deposits or make loans, volatility in capital and credit markets, reputational risk, the impact of hurricanes or other adverse weather events, any requirement that the Company write down goodwill or other intangible assets, diversification in the types of financial services the Company offers, competition with other financial services companies, risks in connection with completed or potential acquisitions, the Company’s growth strategy, interruptions or breaches in security of the Company’s information systems, the failure of certain third party vendors to perform, limitations on the Company’s ability to declare and pay dividends, dilution caused by the Company’s issuance of any additional shares of its common stock to raise capital or acquire other banks, bank holding companies, financial holding companies and insurance agencies, other factors generally understood to affect the financial results of financial services companies and other factors detailed from time to time in the Company’s press releases and filings with the Securities and Exchange Commission. Forward-looking statements speak only as of the date they were made, and, except as required by law, we do not undertake any obligation to update or revise forward-looking statements to reflect events or circumstances after the date of this presentation. Certain tabular presentations may not reconcile because of rounding. Unless otherwise noted, any quotes in this presentation can be attributed to company management. |
 Non-GAAP Financial Disclaimer 3 This presentation contains financial information determined by methods other than those prescribed by accounting principles generally accepted in the United States ("GAAP'). Management uses these "non-GAAP" financial measures in its analysis of the Company's capital and performance. Management believes that the ratio of tangible shareholders’ equity to tangible assets is important to investors who are interested in evaluating the adequacy of the Company's capital levels. Management believes that tangible book value per share is important to investors who are interested in changes from period to period in book value per share exclusive of changes in tangible assets. Management believes that pre-tax, pre-provision earnings is important to investors as it shows earnings trends without giving effect to provision for credit losses. You should not view these disclosures as a substitute for results determined in accordance with GAAP, and they are not necessarily comparable to non-GAAP measures used by other companies. The limitations associated with these measures are the risks that persons might disagree as to the appropriateness of items comprising these measures and that different companies might calculate these measures differently. Information provided in the Appendix of this presentation reconciles these non-GAAP measures with comparable measures calculated in accordance with GAAP. |
 Strong core capital base Overview of BancorpSouth, Inc. $13.0 billion in assets 287 locations with reach throughout a 9-state footprint Customer-focused business model with comprehensive line of financial products and banking services for individuals and small to mid-size businesses Nation’s 26 th largest insurance agency / brokerage operation Strong mortgage operations with production totaling $1.2 billion for 2011 Consistent core earnings with pre-tax, pre-provision earnings of $186.1 million (excluding MSR impairment) 4 Data as of and for the year ended December 31, 2011 Insurance ranking from Business Insurance Magazine as of December 31, 2010 Common equity: $1.3 billion Tangible shareholders’ equity / tangible assets: 7.67% Total risk-based capital ratio: 13.03% |
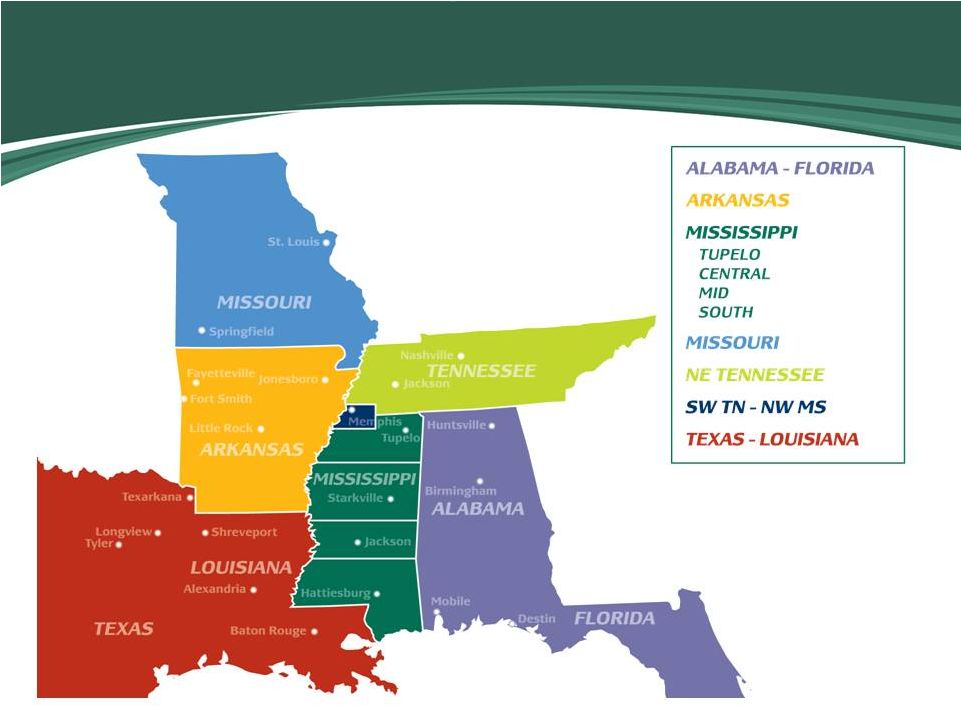 5 Regional Management Structure |
 6 Balance Sheet Summary Dollars in millions, except per share 12/31/11 9/30/11 12/31/10 Total assets $12,996 $13,199 $13,615 (4.5) % Cash and equivalents 499 500 272 83.5 Securities 2,514 2,482 2,709 (7.2) Loans, net of unearned income 8,870 9,056 9,333 (5.0) Allowance for credit losses (195) (200) (197) (1.0) Total deposits 10,955 11,063 11,490 (4.7) Short-term borrowings 375 451 443 (15.3) Shareholders' equity 1,263 1,267 1,222 3.4 Book value per share 15.13 15.17 14.64 3.3 Tangible book value per share 11.68 11.71 11.17 4.6 12/31/11 vs 12/31/10 % Change |
 Common Stock Offering Pro forma capital ratios assume $109 million of net proceeds. Closed $115 million common stock offering on January 24, 2012 Improves capitalization at the Holding Company and maintains flexibility at the Bank Increases Holding Company liquidity Enhances strategic flexibility Positioned for recovery Ability to invest Opportunistic M&A Holding Company Capital Ratios 7 TCE / TA Tier 1 Common Ratio Tier 1 Ratio 12/31/11 12/31/11 Pro Forma 7.67% 10.15% 11.77% 8.46% 11.28% 12.90% 6.00% 8.00% 10.00% 12.00% 14.00% |
  8 Recent Operating Results 12/31/11 9/30/11 6/30/11 3/31/11 12/31/10 Net interest revenue $107.5 $108.1 $109.9 $109.4 $110.2 Provision for credit losses 19.3 25.1 32.2 53.5 43.3 Noninterest revenue 65.3 62.1 75.1 68.3 74.0 Noninterest expense 135.9 130.7 137.1 130.0 123.5 Income (loss) before income taxes 17.7 14.3 15.7 (5.8) 17.4 Income tax provision (benefit) 4.4 2.4 2.9 (5.3) 1.6 Net income (loss) $13.3 $11.9 $12.8 ($0.5) $15.8 Net income (loss) per share: diluted $0.16 $0.14 $0.15 ($0.01) $0.19 Nonrecurring/Noncash Items* MSR valuation adjustment ($1.0) ($11.7) ($3.8) $2.5 $8.9 Security gains (losses), net - 2.0 10.0 - (0.5) Prepayment penalty on FHLB borrowings - - (9.8) - - Branch closure expense - (3.1) - - - Total nonrecurring/noncash items ($1.0) ($12.8) ($3.6) $2.5 $8.4 Three Months Ended Dollars in millions, except per share data *Represents both nonrecurring and noncash items that are included in income before taxes but are not considered to be a component of core operating earnings |
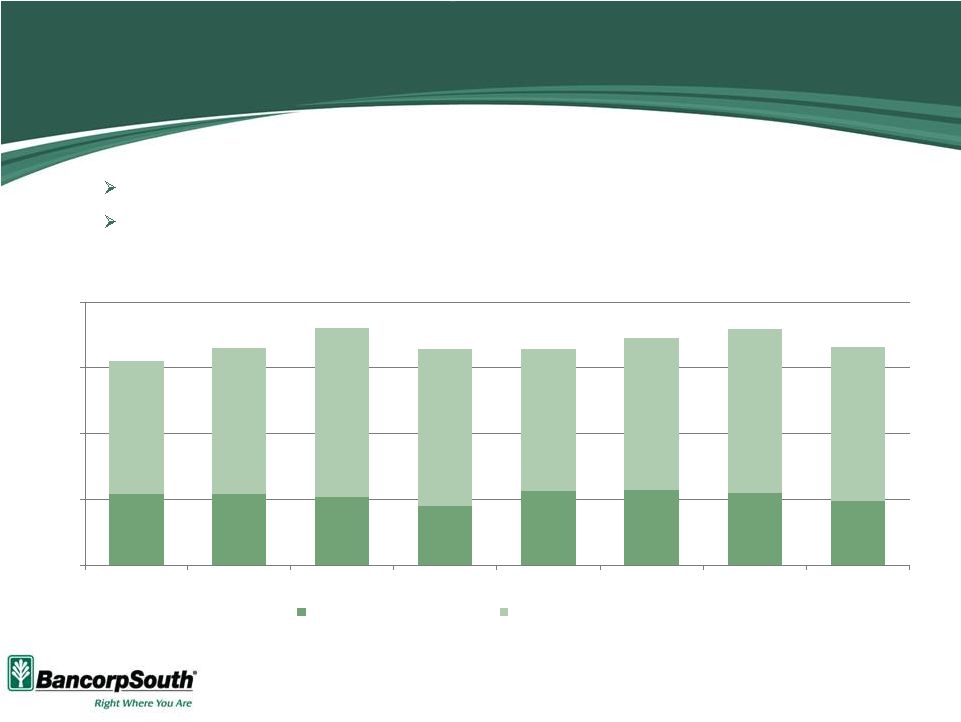
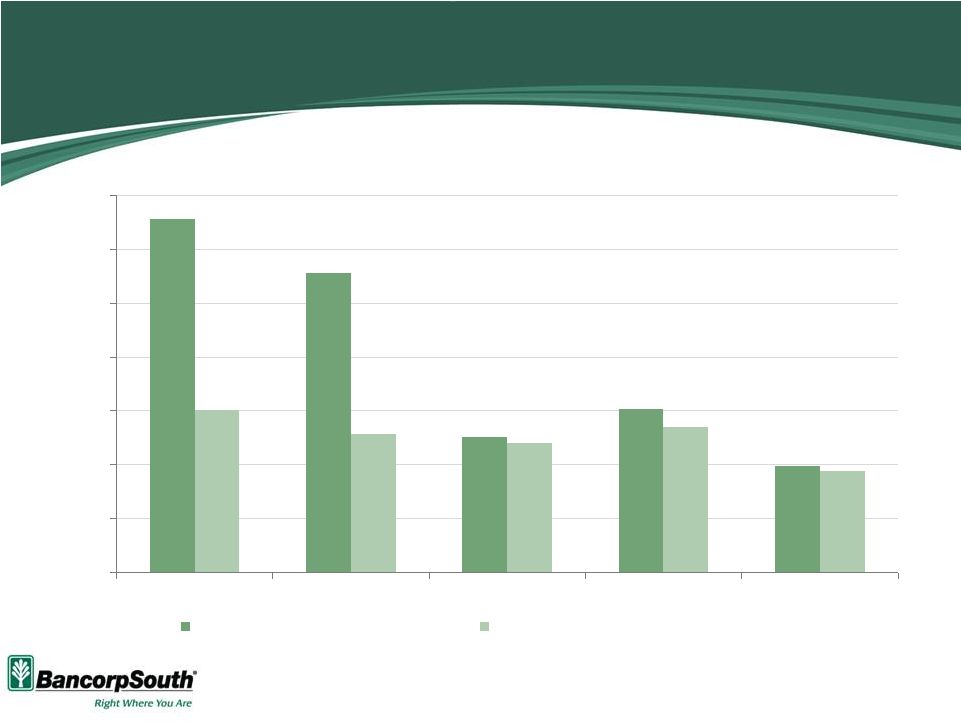
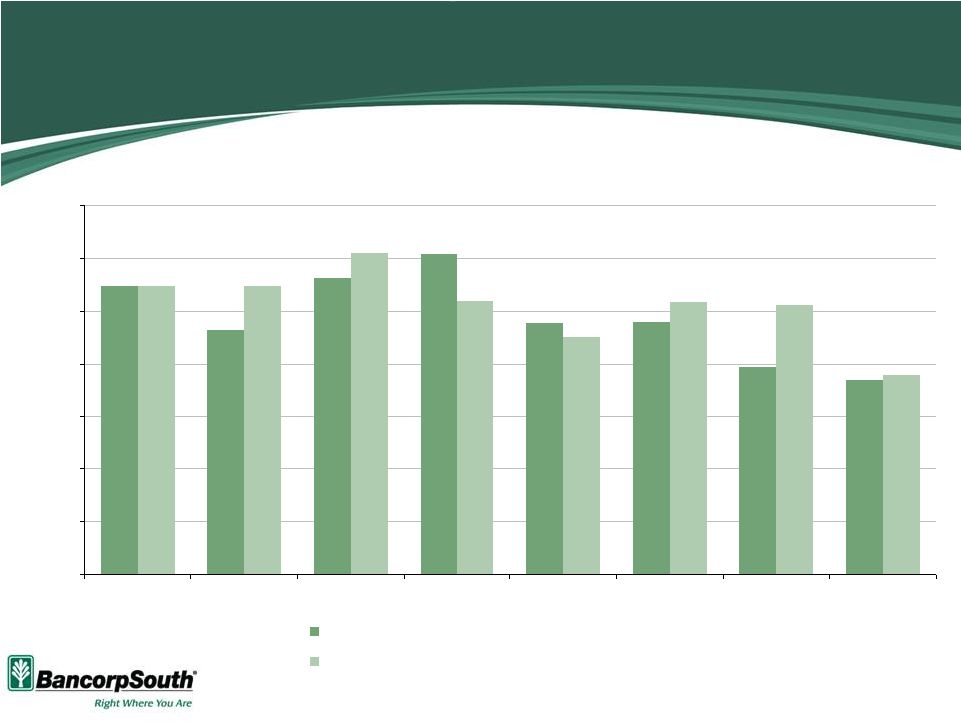 $55 $46 $56 $61 $48 $48 $39 $37 $55 $55 $61 $52 $45 $52 $51 $38 $0 $10 $20 $30 $40 $50 $60 $70 3/31/10 6/30/10 9/30/10 12/31/10 3/31/11 6/30/11 9/30/11 12/31/11 Pre-tax, Pre-provision Earnings Pre-tax, Pre-provision Earnings (excl. MSR impairment) 9 Stable and Consistent Pre-tax, Pre-provision Earnings Dollars in millions Data for quarters ended as of dates shown |
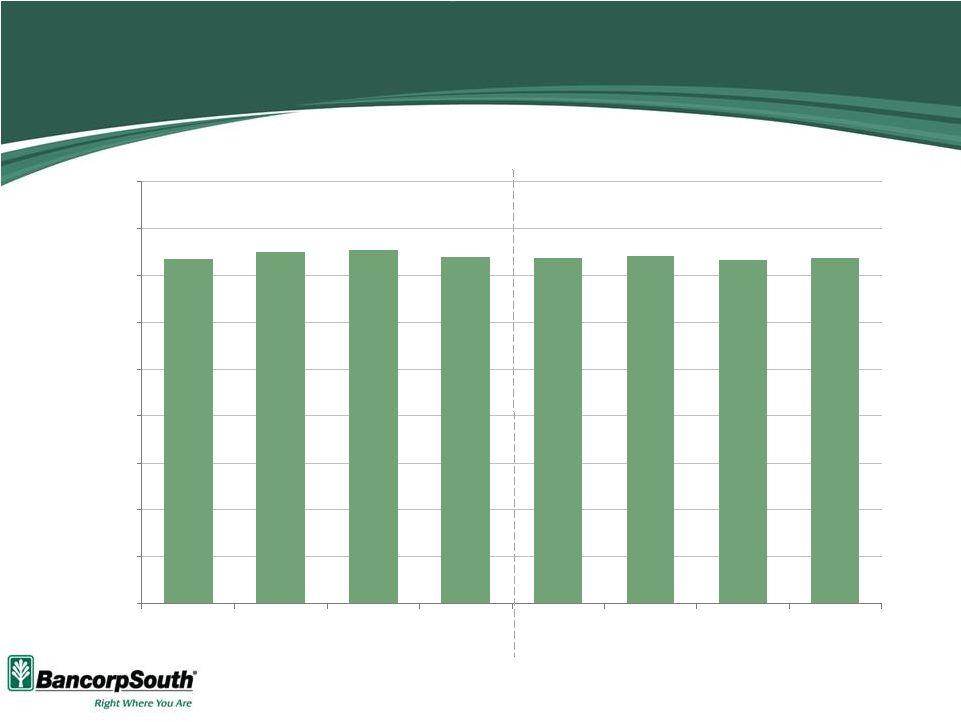 Stable Net Interest Margin Fiscal Year Quarter Ended Shown on a fully taxable equivalent basis 10 3.68% 3.75% 3.77% 3.70% 3.69% 3.71% 3.66% 3.69% 0.00% 0.50% 1.00% 1.50% 2.00% 2.50% 3.00% 3.50% 4.00% 4.50% 2007 2008 2009 2010 3/31/11 6/30/11 9/30/11 12/31/11 |
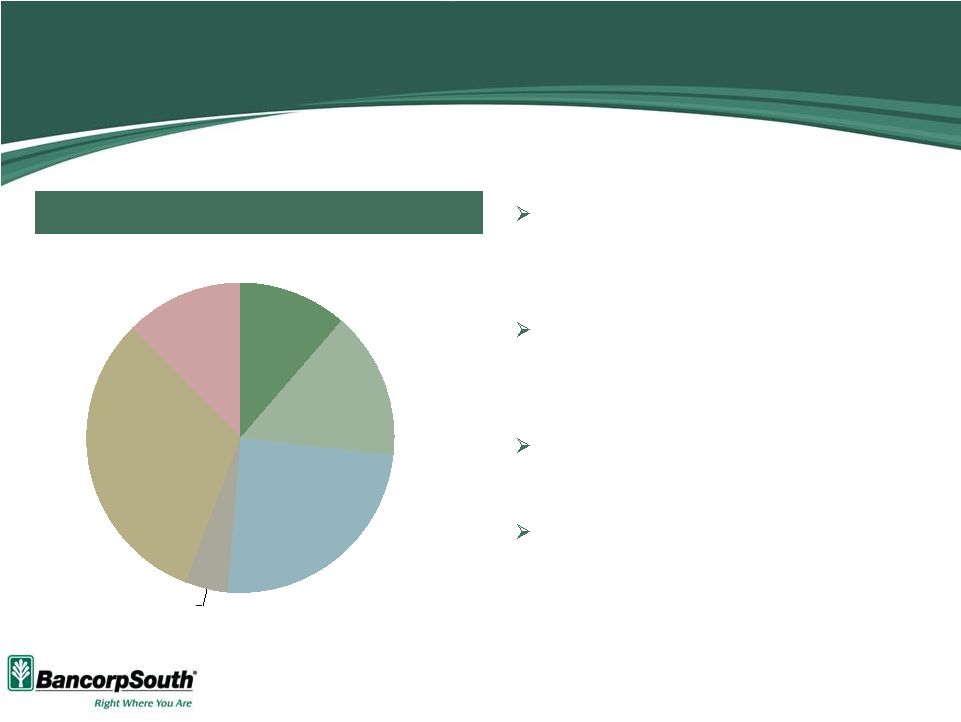 Mortgage lending 11% Card and merchant fees 16% Service charges 25% Trust income 4% Insurance commissions 32% Other 12% Diversified Revenue Stream Noninterest Revenue Composition Insurance and mortgage businesses provide significant sources of noninterest revenue Historically, over 35% of total revenue has been derived from noninterest sources Insurance commissions were up 6% for 2011 compared to 2010 Mortgage production volume totaled $1.2 billion for 2011 Total Noninterest Revenue of $272.4M* 11 Percentages and amounts based on data for the twelve months ended December 31, 2011 *Excludes net securities gains of $12.1 million and MSR impairment of $13.7 million |
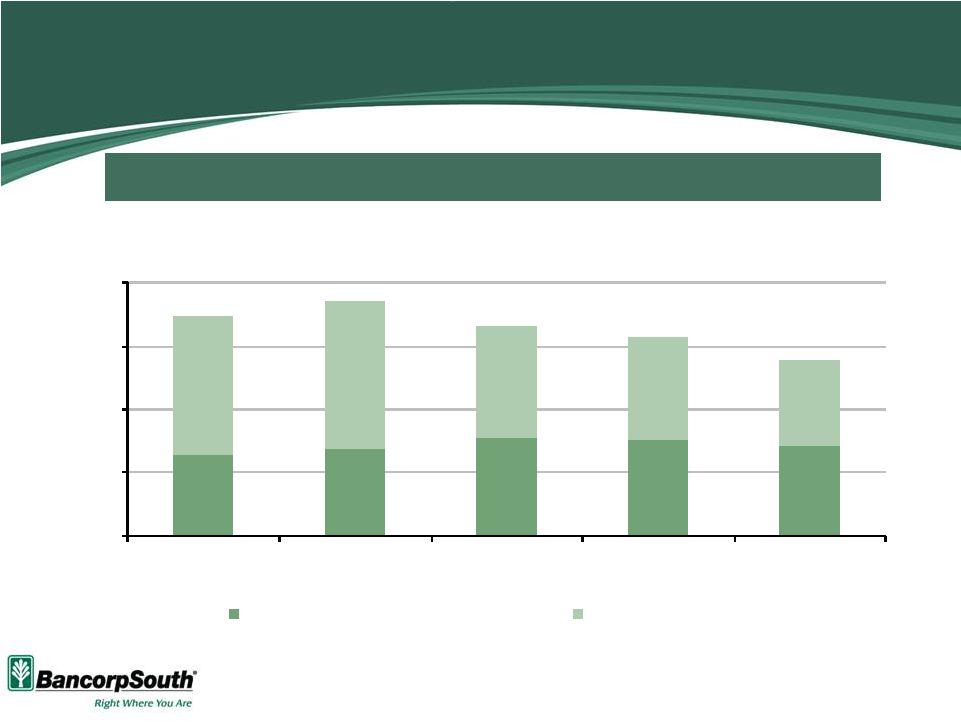
 Noninterest Revenue 12 Excludes net securities gains and MSR impairment Data for quarters ended as of dates shown $22M $22M $21M $18M $23M $23M $22M $19M $0 $20 $40 $60 $80 3/31/10 6/30/10 9/30/10 12/31/10 3/31/11 6/30/11 9/30/11 12/31/11 Insurance Commissions All Other Noninterest Revenue $62M $66M $72M $66M $66M $69M $72M $66M Noninterest revenue continues to be a stable and significant source of revenue. Insurance business continues to perform well and typically makes up approximately 1/3 of noninterest revenue. |
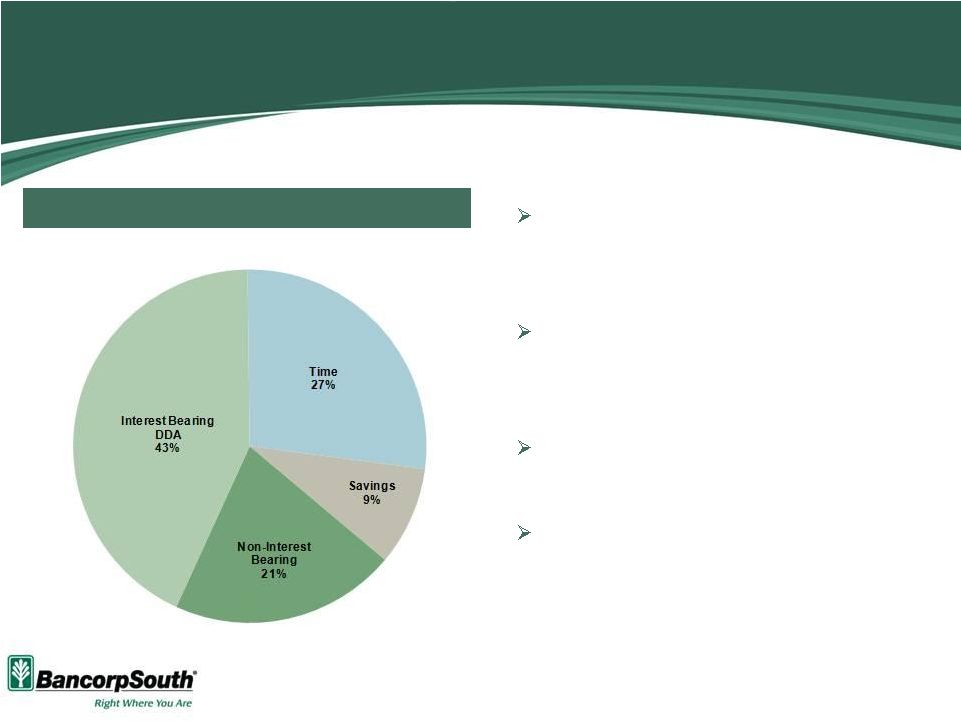 Core Deposit Franchise As of and for the periods ended December 31, 2011 $11.0B Total Deposit Composition 13 Approximately 87% of total deposits are core, yielding a 92% loan / core deposit ratio Noninterest bearing deposits have grown approximately 10% since December 31, 2010 Cost of total deposits for the quarter ended December 31, 2011 was 0.67% Over $1 billion in CDs are maturing over the next two quarters at a weighted average rate of approximately 1.26% |
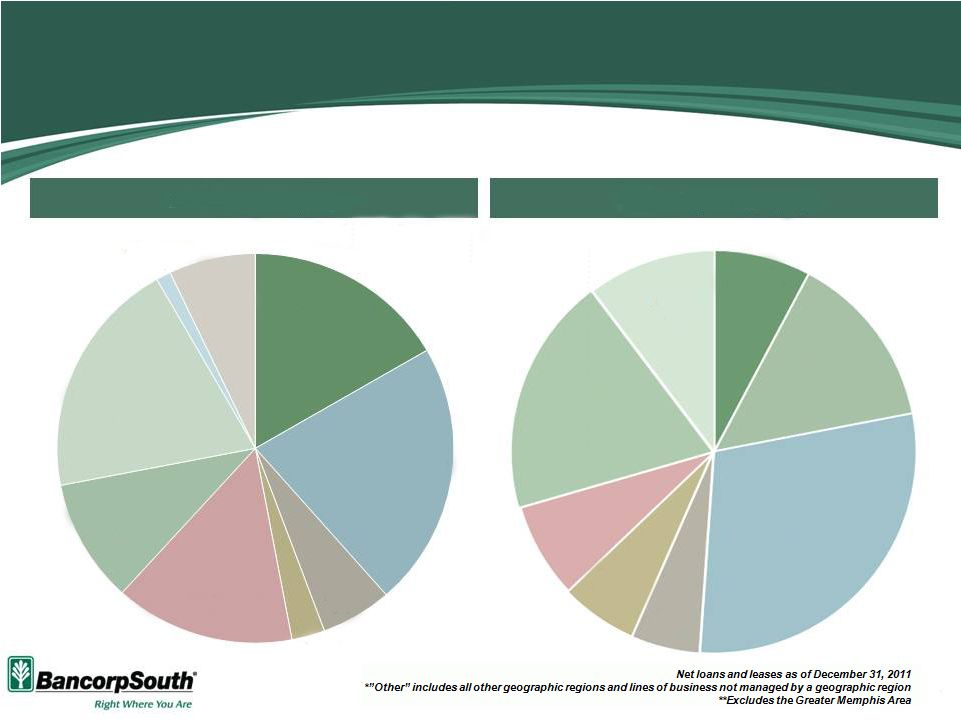 Diversified Loan Portfolio $8.9B Portfolio Loans By Category Loans By Geography 14 Commercial & Industrial 16% Consumer Mortgages 22% Home Equity 6% Agricultural 3% C&I Owner- 15% Construction, Acquisition & Dev. 10% Commercial Real Estate 20% Credit Cards 1% Other 7% AL & FL Panhandle 8% AR** 14% MS** 29% MO 6% Greater Memphis 6% TN** 8% TX & LA 19% Other* 10% Occupied |
 % Change As of Linked YOY 12/31/11 9/30/11 12/31/10 12/31/11 vs. 9/30/11 12/31/11 vs. 12/31/10 Commercial and industrial 1,474 $ 1,503 $ 1,491 $ (2.0%) (1.2%) Real estate: Consumer mortgages 1,945 1,966 1,952 (1.1%) (0.3%) Home equity 514 523 543 (1.7%) (5.3%) Agricultural 239 250 252 (4.1%) (5.1%) Commercial and industrial-owner occupied 1,302 1,330 1,331 (2.1%) (2.2%) Construction, acquisition and development 908 977 1,175 (7.0%) (22.7%) Commercial 1,754 1,772 1,817 (1.0%) (3.5%) Credit Cards 106 103 106 3.0% (0.1%) Other 627 632 665 (0.8%) (5.7%) Total 8,870 $ 9,056 $ 9,333 $ (2.0%) (5.0%) Loan Portfolio Continue to decrease exposure in the CAD portfolio Excluding the impact of CAD portfolio - total loans declined 2.4% from December 31, 2010 15 Dollars in millions Net loans and leases |
 Credit Quality Improvement Non-performing loans decreased 11.2% from the previous quarter Non-performing assets decreased 5.6% from the previous quarter Both NPLs and NPAs have declined for three consecutive quarters 51% of non-accrual loans paying as agreed 85% of non-accrual loans were impaired and carried at 68% of unpaid principal balance (“UPB”) Sales of OREO properties during the quarter totaled $16.7 million, 16 At and for the three months ended December 31, 2011 “Paying as agreed” includes loans < 30 days past due with payments occurring at least quarterly resulting in no material net gain/loss. OREO is carried at 54% of aggregate loan balances at time of foreclosure |
 4Q11 NPL Improvement 17 Dollars in millions As of 12/31/11 9/30/11 Change Non-accrual loans and leases $276.8 $314.5 ($37.7) Loans and leases 90+ days past due, still accruing 3.4 7.3 (3.9) Restructured loans and leases, still accruing 42.0 41.0 1.0 Total non-performing loans and leases $322.3 $362.8 ($40.5) Allowance for credit losses to net loans and leases 2.20% 2.21% Allowance for credit losses to non-performing loans and leases 60.55% 55.04% Non-performing loans and leases to net loans and leases 3.63% 4.01% |
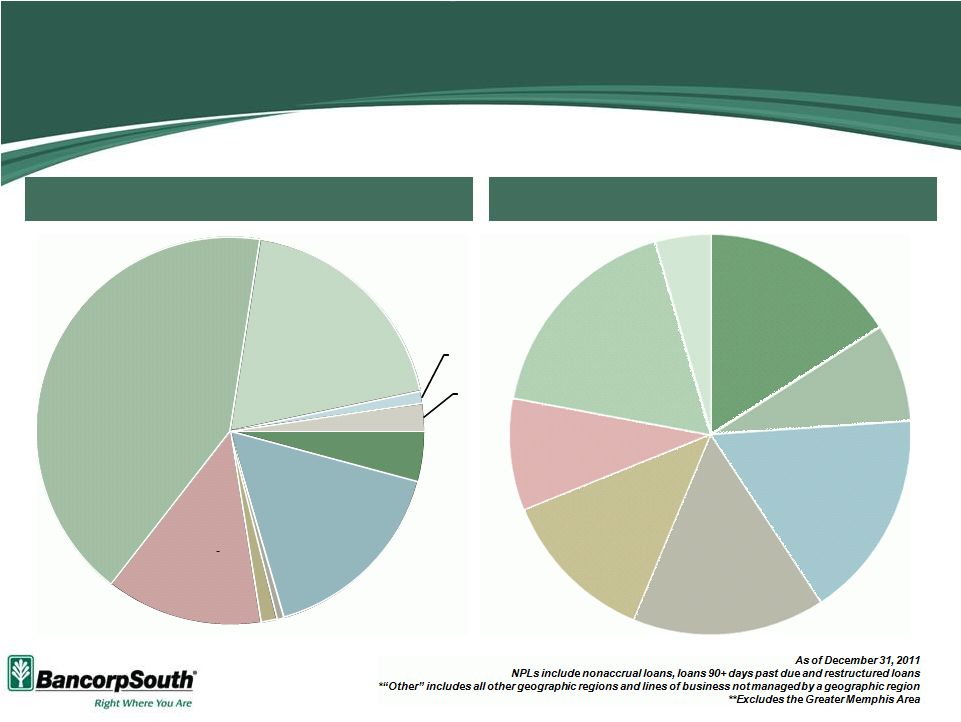 NPLs By Type & Location NPLs By Category NPLs By Geography 18 Commercial & Industrial 4% Consumer Mortgages 16% Home Equity 1% Agricultural 1% - C&I Owner Occupied 13% Construction, Acquisition & Development 42% Commercial Real Estate 19% Credit Cards 1% Other 2% AL & FL Panhandle 16% AR** 8% MS** 17% MO 15% Greater Memphis 13% TN** 9% TX & LA 18% Other* 4% |
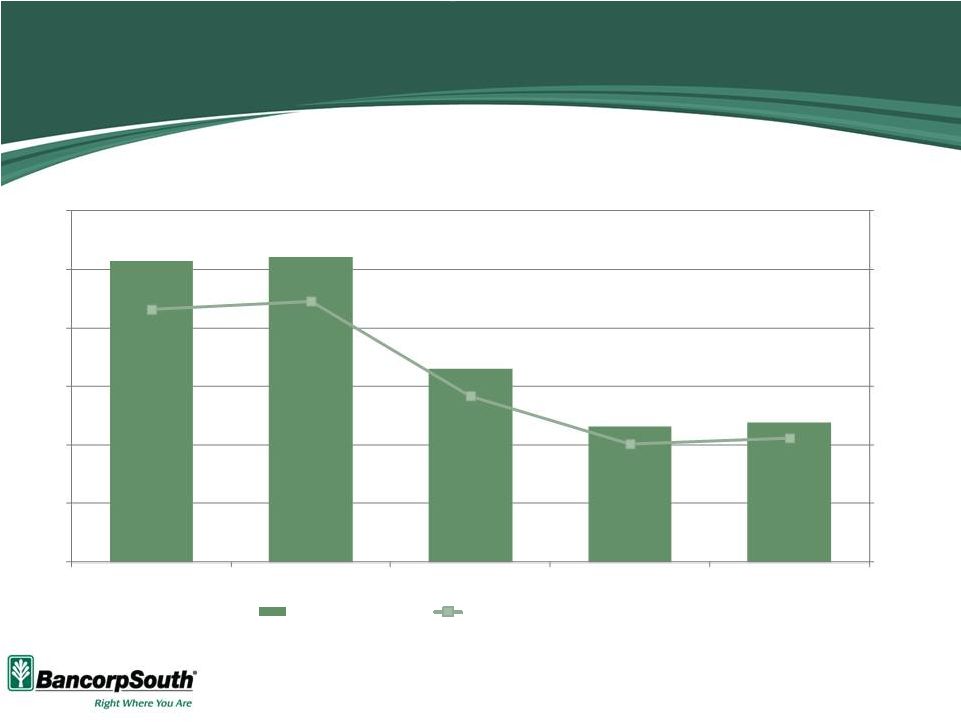
 19 Newly Identified Non-Accrual Loans $131M $111M $50M $61M $39M $60M $52M $48M $54M $38M $0 $20 $40 $60 $80 $100 $120 $140 12/31/10 3/31/11 6/30/11 9/30/11 12/31/11 Newly Identified Non-Accrual Loans Loans 30-89 Days Past Due, Still Accruing Dollars in millions Newly identified non-accrual loans for quarters ended as of dates shown |
 Non-Accrual Loans 20 51% of non-accrual loans were paying as agreed as of December 31, 2011 $0 $100 $200 $300 $400 12/31/10 3/31/11 6/30/11 9/30/11 12/31/11 Non-Accrual Lns Paying as Agreed All Other Non-Accrual Lns Dollars in millions “Paying as Agreed” includes loans < 30 days past due with payments occurring at least quarterly 36% 37% 47% 48% 51% |
 Net Charge-offs are Stabilizing 21 Net Charge-Offs Net Charge-offs / Average loans $51 $52 $33 $23 $24 0.0% 0.5% 1.0% 1.5% 2.0% 2.5% 3.0% $0 $10 $20 $30 $40 $50 $60 12/31/10 3/31/11 6/30/11 9/30/11 12/31/11 % Avg. Loans Data for quarters ended as of dates shown Dollars in millions |
 Strategic Focus Preserve strong capital and position the Company for economic recovery Focus on asset quality Pursue quality loan growth Take advantage of market disruption Grow core earnings through margin expansion and revenue growth Expense control and reduction 22 |
 Summary Leading Mid-South Regional Bank Serving Our Communities for Over 100 Years Stable net interest margin and historically over 35% of the revenue stream derived from noninterest sources High Quality Deposit Franchise with a Stable Core Deposit Base 87% core deposits* Cost of total deposits of 0.67% Positive Asset Quality Trends 11.2% decline in non-performing loans and 5.6% decline in non-performing assets from Q3‘11 to Q4’11 NPLs and NPAs have declined for three consecutive quarters 51% of nonaccrual loans paying as agreed Consistent Pre-tax, Pre-Provision Earnings 23 Proven and Experienced Management Team Diversified Revenue Stream At and for the three months ended December 31, 2011 *Includes all deposits except CDs>100K |
 Appendix |
 25 Non-GAAP Financial Reconciliation Pre-Tax, Pre-Provision Earnings Reconciliation Q4-11 Q3-11 Q2-11 Q1-11 Q4-10 Q3-10 Q2-10 Q1-10 (Dollars in Thousands) Net Interest Income Before Provision --> A $107,489 $108,075 $109,912 $109,437 $110,253 $109,678 $109,329 $111,882 Noninterest Income --> B 65,335 62,055 75,144 68,311 73,974 69,752 57,086 63,332 Noninterest Expense --> C 135,856 130,698 137,069 130,010 123,447 123,087 120,016 120,483 Pre-Tax Pre-Provision Earnings --> D=A+B-C 36,968 39,432 47,987 47,738 60,780 56,343 46,399 54,731 MSR Valuation Adjustment --> E (991) (11,676) (3,839) 2,540 8,895 (4,609) (8,323) 8 Pre-Tax Pre-Provision Earnings (Excluding MSR Adjustment) --> F=D-E 37,959 51,108 51,826 45,198 51,885 60,952 54,722 54,723 Tangible Common Equity / Tangible Assets (TCE/TA) and Tangible Book Per Share Pro Forma As of As of As of 12/31/2011* 12/31/2011 9/30/2011 12/31/2010 (In Thousands, Except Percentages and Per Share Amounts) Common Equity --> A $1,371,912 $1,262,912 $1,266,753 $1,222,244 Assets --> B 13,104,851 12,995,851 13,198,518 13,615,010 Intangibles --> C 287,910 287,910 288,723 289,720 Tangible Common Equity --> D=A-C 1,084,002 975,002 978,030 932,524 Tangible Assets --> E=B-C 12,816,941 12,707,941 12,909,795 13,325,290 Tangible Common Equity / Tangible Assets (%) -- > F=D/E 8.46% 7.67% 7.58% 7.00% Common Shares Outstanding -- > G 83,484 83,489 83,482 Tangible Book Value Per Share -- > D=D/G 11.68 11.71 11.17 *Assumes $109 million of net proceeds from common stock offering |