 BancorpSouth, Inc. Financial Information As of March 31, 2013 |
 Forward Looking Information 2 Certain statements contained in this presentation and the accompanying slides may not be based on historical facts and are “forward-looking statements” within the meaning of Section 27A of the Securities Act of 1933, as amended, and Section 21E of the Securities Exchange Act of 1934, as amended. These forward-looking statements may be identified by reference to a future period or by the use of forward-looking terminology, such as “anticipate,” “believe,” “estimate,” “expect,” “foresee,” “may,” “might,” “will,” “intend,” “could,” “would” or “plan,” or future or conditional verb tenses, and variations or negatives of such terms. These forward-looking statements include, without limitation, statements about long-term prospects for shareholder value, results of operations and financial condition. We caution you not to place undue reliance on the forward-looking statements contained in this presentation, in that actual results could differ materially from those indicated in such forward-looking statements as a result of a variety of factors. These factors may include, but are not limited to, conditions in the financial markets and economic conditions generally, the adequacy of the Company’s provision and allowance for credit losses to cover actual credit losses, the credit risk associated with real estate construction, acquisition and development loans, losses resulting from the significant amount of the Company’s other real estate owned, limitations on the Company’s ability to declare and pay dividends, the impact of legal or administrative proceedings, the availability of capital on favorable terms if and when needed, liquidity risk, governmental regulation, including the Dodd Frank Act, and supervision of the Company’s operations, the short-term and long-term impact of changes to banking capital standards on the Company’s regulatory capital and liquidity, the impact of regulations on service charges on the Company’s core deposit accounts, the susceptibility of the Company’s business to local economic or environmental conditions, the soundness of other financial institutions, changes in interest rates, the impact of monetary policies and economic factors on the Company’s ability to attract deposits or make loans, volatility in capital and credit markets, reputational risk, the impact of hurricanes or other adverse weather events, any requirement that the Company write down goodwill or other intangible assets, diversification in the types of financial services the Company offers, the Company’s ability to adapt its products and services to evolving industry standards and consumer preferences, competition with other financial services companies, risks in connection with completed or potential acquisitions, the Company’s growth strategy, interruptions or breaches in the Company’s information system security, the failure of certain third party vendors to perform, unfavorable ratings by rating agencies, dilution caused by the Company’s issuance of any additional shares of its common stock to raise capital or acquire other banks, bank holding companies, financial holding companies and insurance agencies, other factors generally understood to affect the financial results of financial services companies and other factors detailed from time to time in the Company’s press releases and filings with the Securities and Exchange Commission. Forward-looking statements speak only as of the date they were made, and, except as required by law, we do not undertake any obligation to update or revise forward-looking statements to reflect events or circumstances after the date of this presentation. Certain tabular presentations may not reconcile because of rounding. Unless otherwise noted, any quotes in this presentation can be attributed to company management. |
 Q1 Highlights At and for the three months ended March 31, 2013 Net income of $20.8 million, or $0.22 per diluted share Excluding a $6.8 million charge related to litigation, total noninterest expense declined $7.1 million, or 5.2%, on a comparable quarter basis and $14.6 million, or 10.2%, on a sequential quarter basis Both NPLs and NPAs reached levels that are approximately one half of the respective levels at which they peaked during the first quarter of 2011 Mortgage production of $425.9 million, which contributed to $12.3 million of mortgage lending revenue Insurance commission revenue increased $3.5 million, or 15.1%, on a comparable quarter basis 3 |
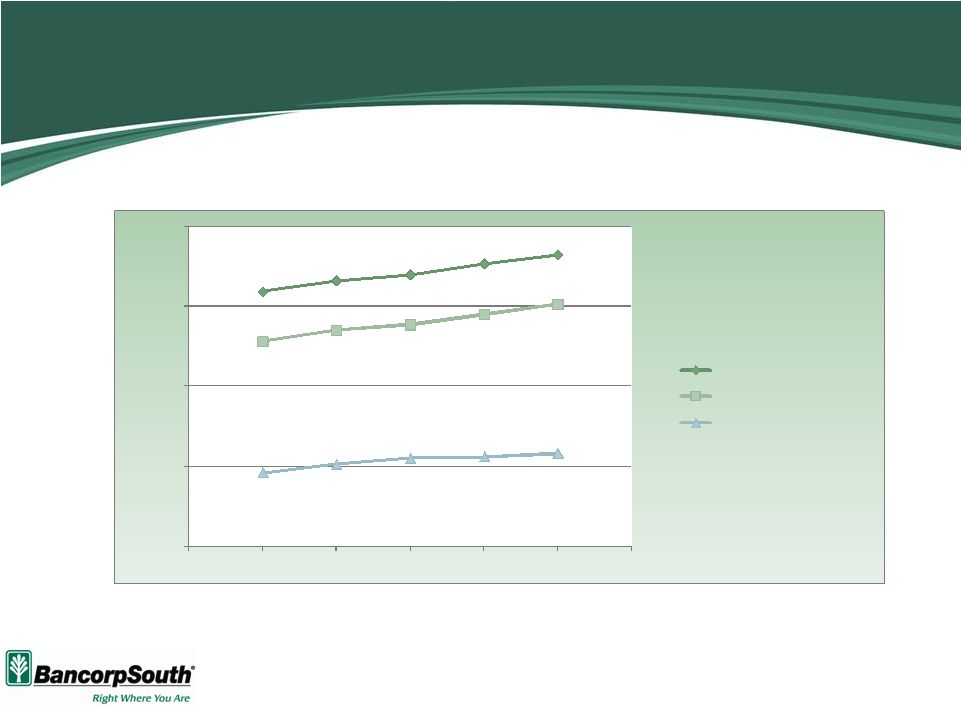 8.00% 10.00% 12.00% 14.00% 16.00% 3/31/12 6/30/12 9/30/12 12/31/12 3/31/13 Total capital Tier 1 capital Tier 1 leverage capital 4 Capital Highlights 15.31% 14.06% 10.33% 14.39% 13.13% 9.85% |
 Provision for credit losses of $4.0 million declined from $6.0 million for the fourth quarter of 2012 and $10.0 million for the first quarter of 2012 NPLs decreased $26.5 million, or 11.4%, and NPAs declined $33.5 million, or 9.9% OREO decreased $6.9 million, or 6.7% 56% of non-accrual loans were paying as agreed Near-term delinquencies declined $3.8 million, or 13.6% Substandard classified loans declined $30.9 million, or 6.4% Credit Quality Highlights 5 “Paying as Agreed” includes loans < 30 days past due with payments occurring at least quarterly At and for the three months ended March 31, 2013 |
 6 Recent Operating Results Dollars in millions, except per share data 3/31/13 12/31/12 3/31/12 vs 12/31/12 Net interest revenue 98.1 $ 100.9 $ 105.6 $ (2.8) % (7.1) % Provision for credit losses 4.0 6.0 10.0 (33.3) (60.0) Noninterest revenue 71.3 70.9 72.4 0.6 (1.4) Noninterest expense 135.4 143.2 135.7 (5.5) (0.2) Income before income taxes 30.0 22.5 32.3 33.2 (7.0) Income tax provision 9.2 5.6 9.4 65.7 (2.2) Net income 20.8 $ 17.0 $ 22.9 $ 22.5 % (9.0) % Net income per share: diluted 0.22 $ 0.18 $ 0.25 $ 22.2 % (12.0) % Three Months Ended % Change vs 3/31/12 |
 Noninterest Revenue Dollars in thousands NM – Not Meaningful 7 3/31/13 12/31/12 3/31/12 vs 12/31/12 Mortgage origination and servicing 11,309 $ 17,005 $ 11,445 $ (33.5) % (1.2) % MSR valuation adjustment 1,037 183 3,697 NM (72.0) Credit card, debit card and merchant fees 7,523 8,125 7,523 (7.4) - Service charges 12,832 13,875 15,116 (7.5) (15.1) Trust income 3,210 3,391 2,282 (5.3) 40.7 Security gains, net 19 152 74 NM NM Insurance commissions 26,641 20,502 23,153 29.9 15.1 Other 8,747 7,668 9,070 14.1 (3.6) Total noninterest revenue 71,318 $ 70,901 $ 72,360 $ 0.6 % (1.4) % Three Months Ended % Change vs 3/31/12 |
 Loan Portfolio Dollars in millions Net loans and leases 8 As of 3/31/13 12/31/12 3/31/12 Commercial and industrial 1,481 $ 1,477 $ 1,442 $ 0.3 % 2.7 % Real estate: Consumer mortgages 1,871 1,874 1,938 (0.1) (3.4) Home equity 482 486 501 (0.8) (3.8) Agricultural 249 256 257 (2.6) (2.8) Commercial and industrial-owner occupied 1,335 1,333 1,288 0.1 3.7 Construction, acquisition and development 728 736 858 (1.0) (15.2) Commercial 1,740 1,749 1,742 (0.5) (0.1) Credit Cards 99 105 101 (5.8) (1.7) Other 596 622 612 (4.1) (2.6) Total 8,582 $ 8,637 $ 8,738 $ (0.6) % (1.8) % vs 3/31/12 % Change vs 12/31/12 |
 Non-Performing Loans Dollars in millions Net loans and leases 9 As of 3/31/13 12/31/12 3/31/12 Commercial and industrial 7.4 $ 10.2 $ 12.5 $ (27.5) % (40.5) % Real estate: Consumer mortgages 41.3 40.7 52.2 1.6 (20.9) Home equity 4.3 3.5 2.7 22.2 59.0 Agricultural 7.1 8.0 4.3 (11.6) 67.1 Commercial and industrial-owner occupied 25.5 28.3 37.1 (9.6) (31.1) Construction, acquisition and development 58.9 72.0 121.4 (18.1) (51.4) Commercial 56.5 62.2 46.8 (9.1) 20.6 Credit Cards 2.5 2.5 3.1 0.8 (17.0) Other 3.3 6.1 5.2 (45.3) (36.3) Total 207.0 $ 233.6 $ 285.2 $ (11.4) % (27.4) % % Change vs 12/31/12 vs 3/31/12 |
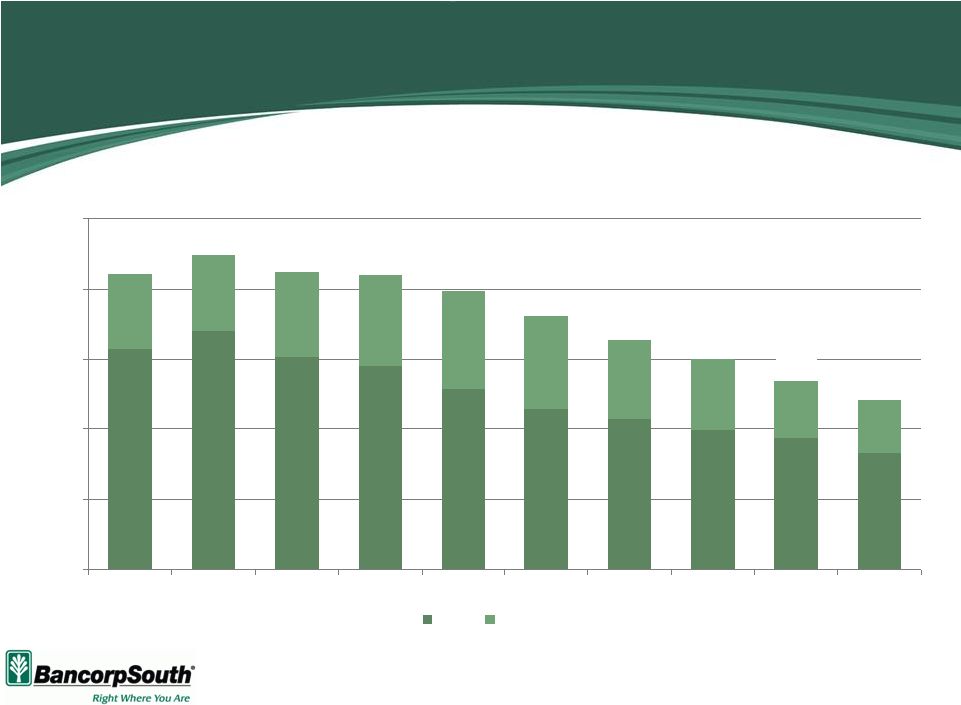 NPA Improvement 10 $394 $425 $380 $363 $322 $285 $267 $247 $234 $207 $133 $136 $151 $163 $174 $168 $144 $128 $103 $96 $528 $561 $531 $525 $496 $453 $411 $376 $337 $303 $0 $125 $250 $375 $500 $625 12/31/10 3/31/11 6/30/11 9/30/11 12/31/11 3/31/12 6/30/12 9/30/12 12/31/12 3/31/13 NPLs OREO Dollars in millions NPLs include nonaccrual loans, loans 90+ days past due and restructured loans NPAs include NPLs and other real estate owned |
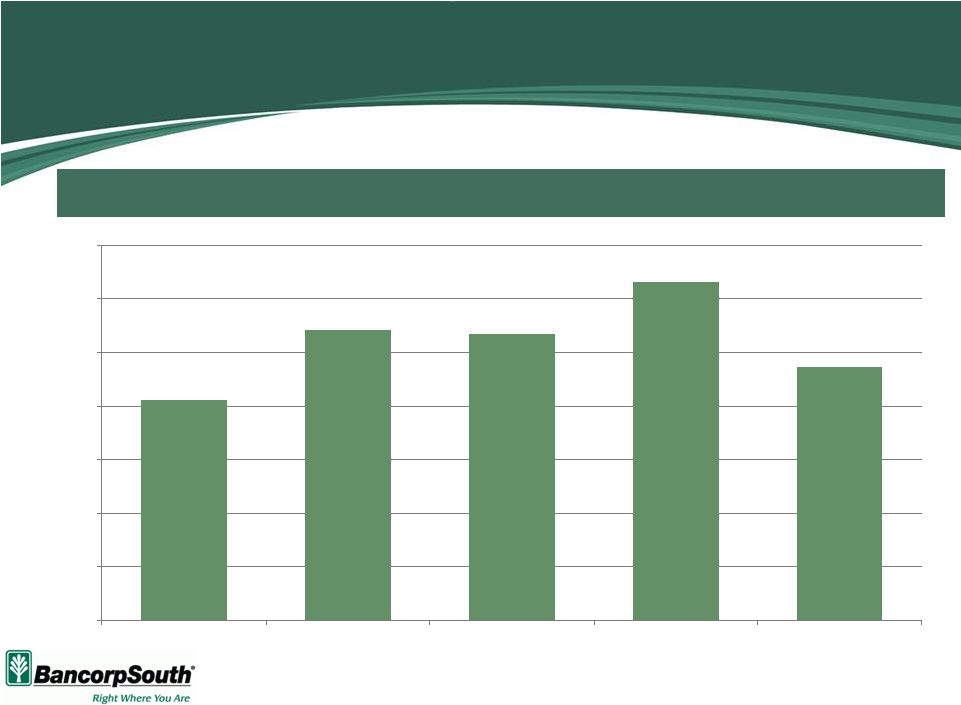 Dollars in millions Data for quarters ended as of dates shown Payments Received on Non-Accrual Loans 11 Payments of $109 million received on non-accrual loans over the past year $20.6 $27.1 $26.7 $31.6 $23.6 $0 $5 $10 $15 $20 $25 $30 $35 3/31/12 6/30/12 9/30/12 12/31/12 3/31/13 |
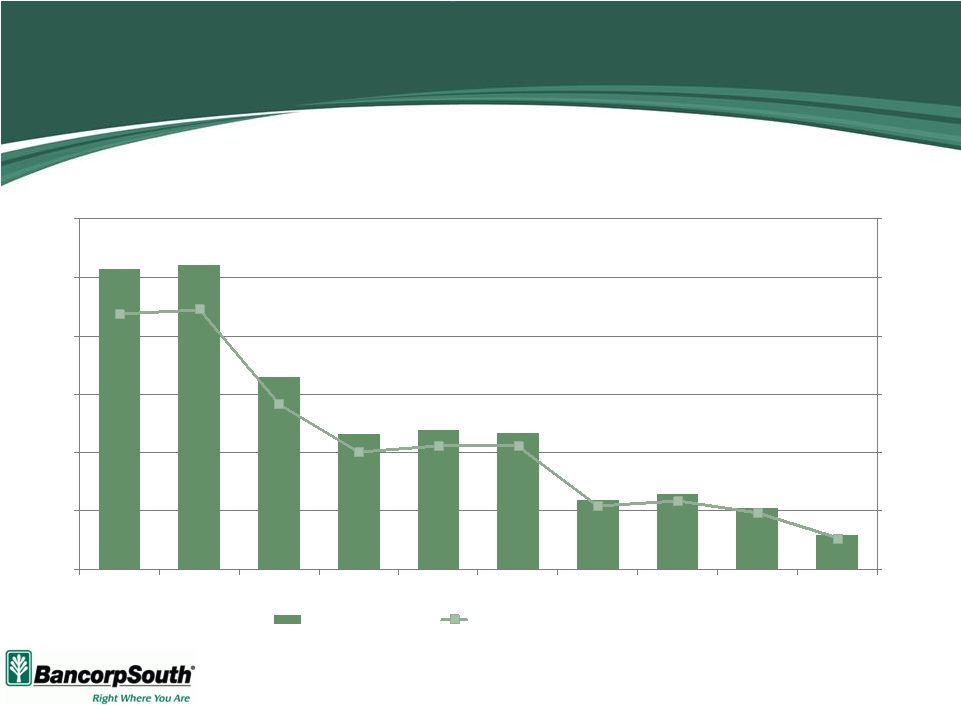 Dollars in millions Net charge-offs for the quarters ended as of the dates shown Net Charge-offs % Avg. Loans 12 $51 $52 $33 $23 $24 $23 $12 $13 $11 $6 0.0% 0.5% 1.0% 1.5% 2.0% 2.5% 3.0% $0 $10 $20 $30 $40 $50 $60 12/31/10 3/31/11 6/30/11 9/30/11 12/31/11 3/31/12 6/30/12 9/30/12 12/31/12 3/31/13 Net charge-offs Net charge-offs / average loans |