 BancorpSouth, Inc. Investor Presentation 2013 Gulf South Bank Conference Exhibit 99.1 |
 Forward Looking Information 2 Certain statements contained in this presentation and the accompanying slides may not be based on historical facts and are “forward-looking statements” within the meaning of Section 27A of the Securities Act of 1933, as amended, and Section 21E of the Securities Exchange Act of 1934, as amended. These forward-looking statements may be identified by reference to a future period or by the use of forward-looking terminology, such as “anticipate,” “believe,” “estimate,” “expect,” “foresee,” “may,” “might,” “will,” “intend,” “could,” “would” or “plan,” or future or conditional verb tenses, and variations or negatives of such terms. These forward-looking statements include, without limitation, statements about maturities of our CDs, the cost and expense savings of the voluntary early retirement program, acceleration of the non-cash charge related to distributions from our pension plan, long-term prospects for shareholder value, results of operations and financial condition. We caution you not to place undue reliance on the forward-looking statements contained in this presentation, in that actual results could differ materially from those indicated in such forward-looking statements as a result of a variety of factors. These factors may include, but are not limited to, conditions in the financial markets and economic conditions generally, the adequacy of the Company’s provision and allowance for credit losses to cover actual credit losses, the credit risk associated with real estate construction, acquisition and development loans, losses resulting from the significant amount of the Company’s other real estate owned, limitations on the Company’s ability to declare and pay dividends, the impact of legal or administrative proceedings, the availability of capital on favorable terms if and when needed, liquidity risk, governmental regulation, including the Dodd Frank Act, and supervision of the Company’s operations, the short-term and long-term impact of changes to banking capital standards on the Company’s regulatory capital and liquidity, the impact of regulations on service charges on the Company’s core deposit accounts, the susceptibility of the Company’s business to local economic or environmental conditions, the soundness of other financial institutions, changes in interest rates, the impact of monetary policies and economic factors on the Company’s ability to attract deposits or make loans, volatility in capital and credit markets, reputational risk, the impact of hurricanes or other adverse weather events, any requirement that the Company write down goodwill or other intangible assets, diversification in the types of financial services the Company offers, the Company’s ability to adapt its products and services to evolving industry standards and consumer preferences, competition with other financial services companies, risks in connection with completed or potential acquisitions, the Company’s growth strategy, interruptions or breaches in the Company’s information system security, the failure of certain third party vendors to perform, unfavorable ratings by rating agencies, dilution caused by the Company’s issuance of any additional shares of its common stock to raise capital or acquire other banks, bank holding companies, financial holding companies and insurance agencies, other factors generally understood to affect the financial results of financial services companies and other factors detailed from time to time in the Company’s press releases and filings with the Securities and Exchange Commission. Forward-looking statements speak only as of the date they were made, and, except as required by law, we do not undertake any obligation to update or revise forward-looking statements to reflect events or circumstances after the date of this presentation. Certain tabular presentations may not reconcile because of rounding. Unless otherwise noted, any quotes in this presentation can be attributed to company management. |
 About BancorpSouth, Inc. (NYSE:BXS) Total assets of $13.4 billion Headquartered in Tupelo, MS 256 full-service banking locations reaching throughout an 8-state footprint Customer-focused business model with comprehensive line of financial products and banking services for individuals and small to mid-size businesses Strong core capital base consisting of 100% common equity Market capitalization of $1.6 billion Data as of March 31, 2013 3 |
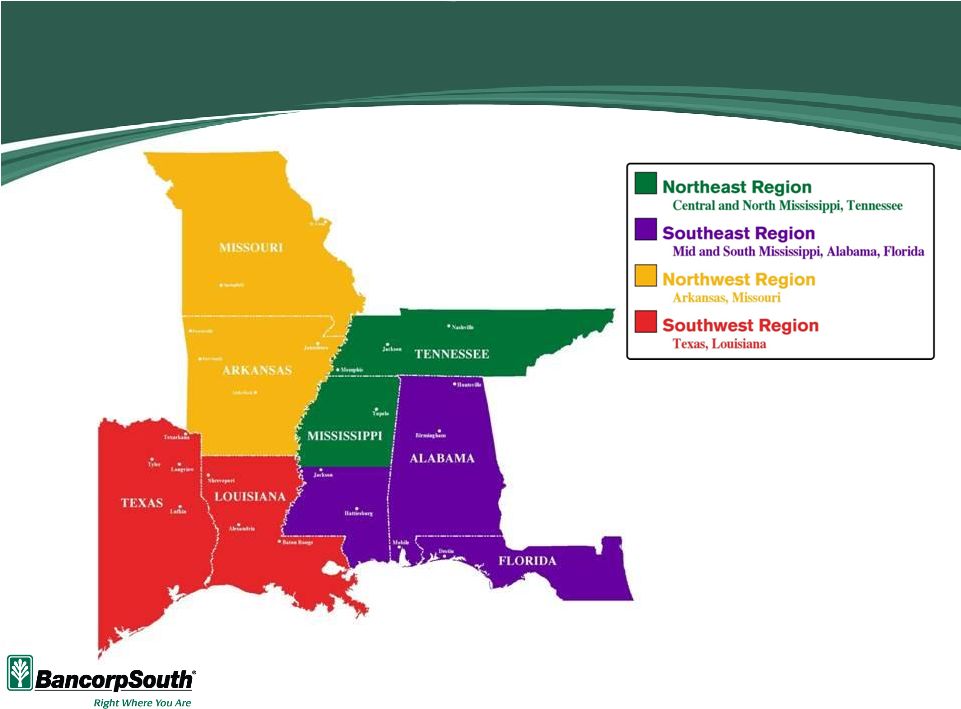 Community Bank Structure – 8 State Footprint 4 |
 COMMUNITY BANK Personal Banking Business Banking Deposit Offerings Business Loans Consumer Lending Full Range of Deposit Products Home Equity Lending Treasury Management Mobile/Internet Banking Merchant Services Prepaid Cards Payroll and HR Management Insurance 164 Licensed Producers in 29 Locations Commercial, P&C, and Life Insurance Trust and Wealth Management $7.1 Billion Total Assets Under Management Mortgage 109 Originators in 78 Locations $426 Million in Production in Q1 2013 ($2.0 Billion in 2012) 5 Equipment Finance and Leasing Territory Managers Covering 14 States Portfolio Balance of $500 Million Asset and portfolio balances as of March 31, 2013 Wide Range of Product Offerings |
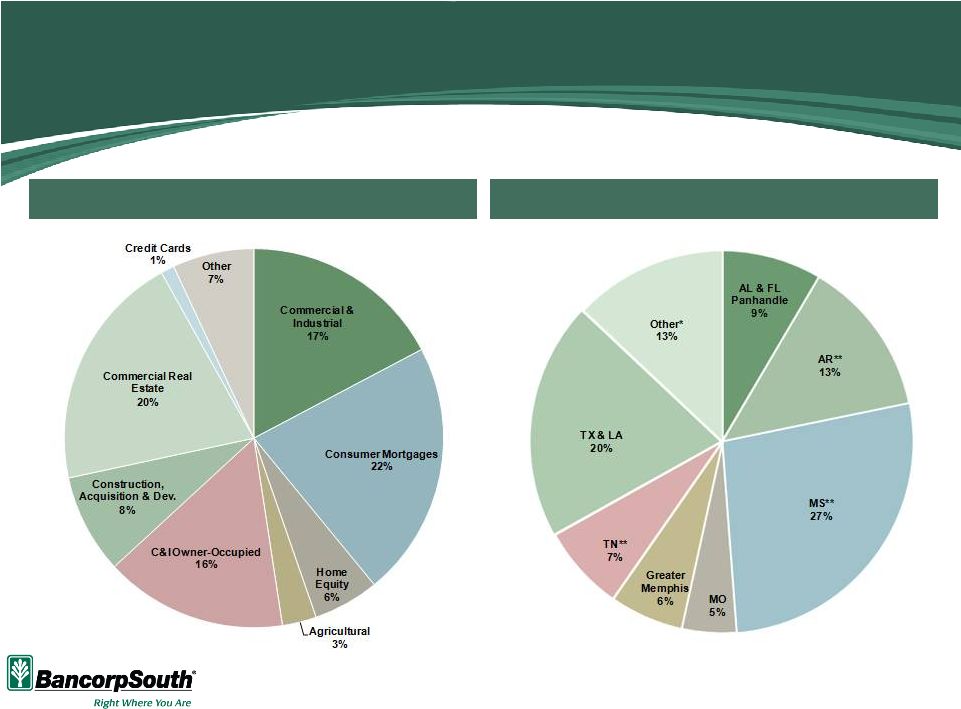 Diversified Loan Portfolio $8.6B Portfolio Loans By Category Loans By Geography 6 Net loans and leases as of March 31, 2013 *Other includes all geographic regions and lines of business not managed by a geographic region **Excludes Greater Memphis |
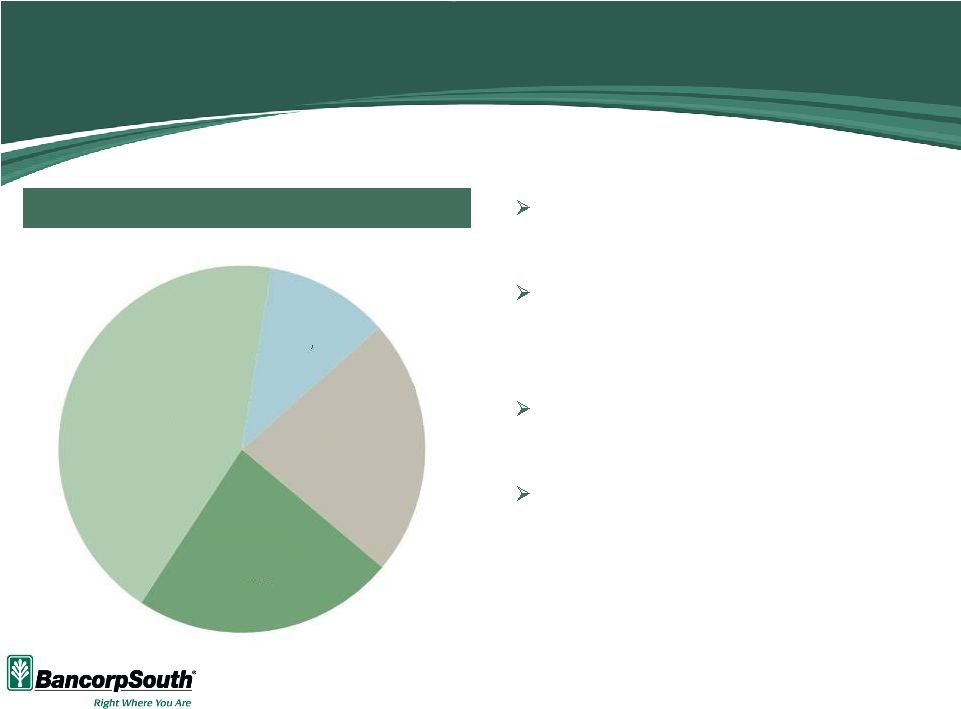 Core Deposit Franchise 100% core deposits – no reliance on brokered deposits Noninterest bearing deposits have grown approximately 14% since March 31, 2012 Cost of total deposits for the quarter ended March 31, 2013 was 0.43% Approximately $150 million of promotional CD’s at a weighted average rate of 3.97% mature between October 2013 and October 2014 $11.2B Total Deposit Composition 7 Non-Interest Bearing 23% Interest Bearing DDA 43% Time 11% Savings 23% As of and for the period ended March 31, 2013 (except where otherwise indicated) |
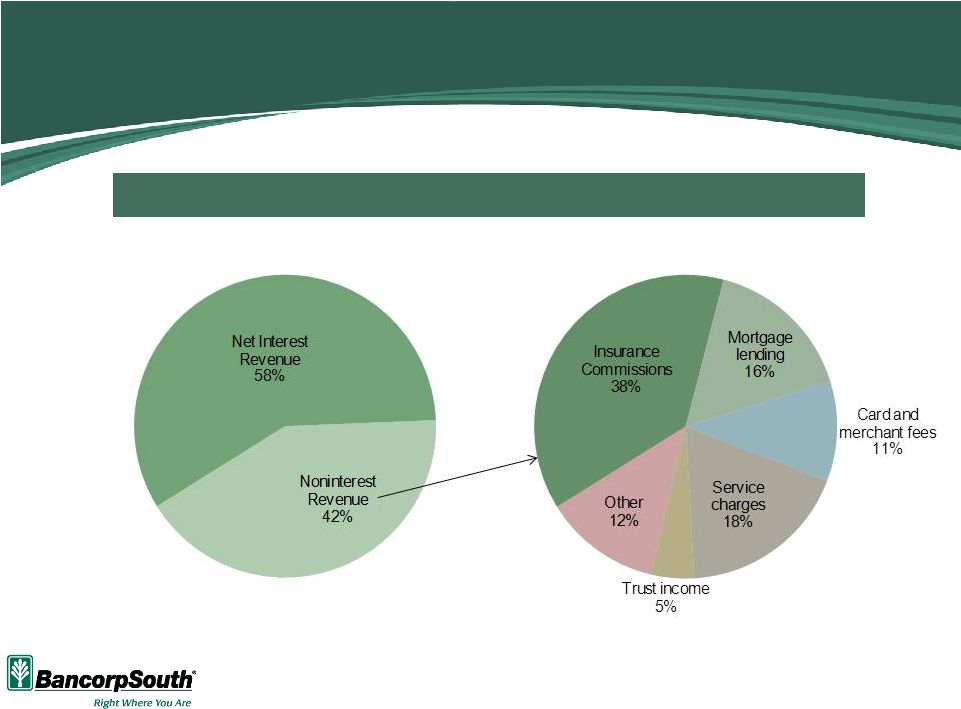 Diversified Revenue Stream Approximately 40% of Total Revenue is Derived from Noninterest Sources Total Noninterest Revenue of $70.3M* 8 Total Revenue of $168.3M* Percentages and amounts based on data for the three months ended March 31, 2013 *Excludes positive MSR valuation adjustment of $1.0 million |
 Current Strategic Focus Revenue Growth Opportunities Pursue quality loan growth Tweaks in organizational structure Shift focus from problem asset resolution to growth Continue to focus on fee revenue growth Expand mortgage originators geographically Continue to seek opportunities for expansion in insurance Efficiency Opportunities All areas of expense base under review – early results visible in first quarter advertising and public relations Voluntary Early Retirement Program 9 |
 Voluntary Early Retirement Program Offered enhanced pension plan benefits to 418 employees who were eligible based on job classification, age, and years-of-service criteria as of March 31 Responses received from 296 eligible employees, with 194 accepting the offer Results in a one-time pre-tax charge ranging from $8 million to $16 million, or $0.06 to $0.10 per share net of tax, which will be reflected in the Company’s second quarter 2013 earnings Pre-tax compensation and benefits savings are expected to range from $7 million to $12 million, $0.04 to $0.08 per share net of tax, on an annual basis when fully phased in Potential for additional non-cash charge between $8 and $13 million if certain lump sum thresholds are exceeded for the year, which would result in reduction in pension expense of $0.7 million to $1.2 million over the next 11 years 10 All information as of May 8, 2013 |
 11 Financial Highlights |
 First Quarter Financial Highlights 12 Net income of $20.8 million, or $0.22 per diluted share Excluding a $6.8 million charge to increase our litigation reserve, total noninterest expense declined $7.1 million, or 5.2%, on a comparable quarter basis and $14.6 million, or 10.2%, on a sequential quarter basis Both NPLs and NPAs reached levels that are approximately one half of the respective levels at which they peaked during the first quarter of 2011 Mortgage production of $425.9 million, which contributed to $12.3 million of mortgage lending revenue Insurance commission revenue increased $3.5 million, or 15.1%, on a comparable quarter basis At and for the three months ended March 31, 2013 |
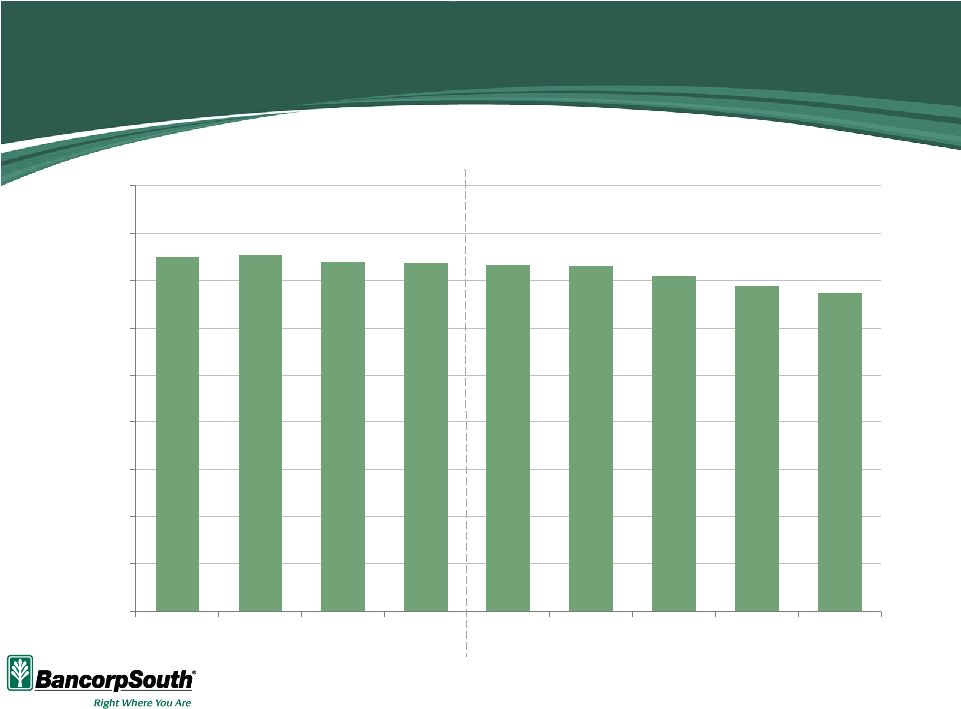 3.75% 3.77% 3.70% 3.69% 3.66% 3.65% 3.55% 3.44% 3.37% 0.00% 0.50% 1.00% 1.50% 2.00% 2.50% 3.00% 3.50% 4.00% 4.50% 2008 2009 2010 2011 3/31/12 6/30/12 9/30/12 12/31/12 3/31/13 Net Interest Margin Fiscal Year Quarter Ended Shown on a fully taxable equivalent basis 13 |
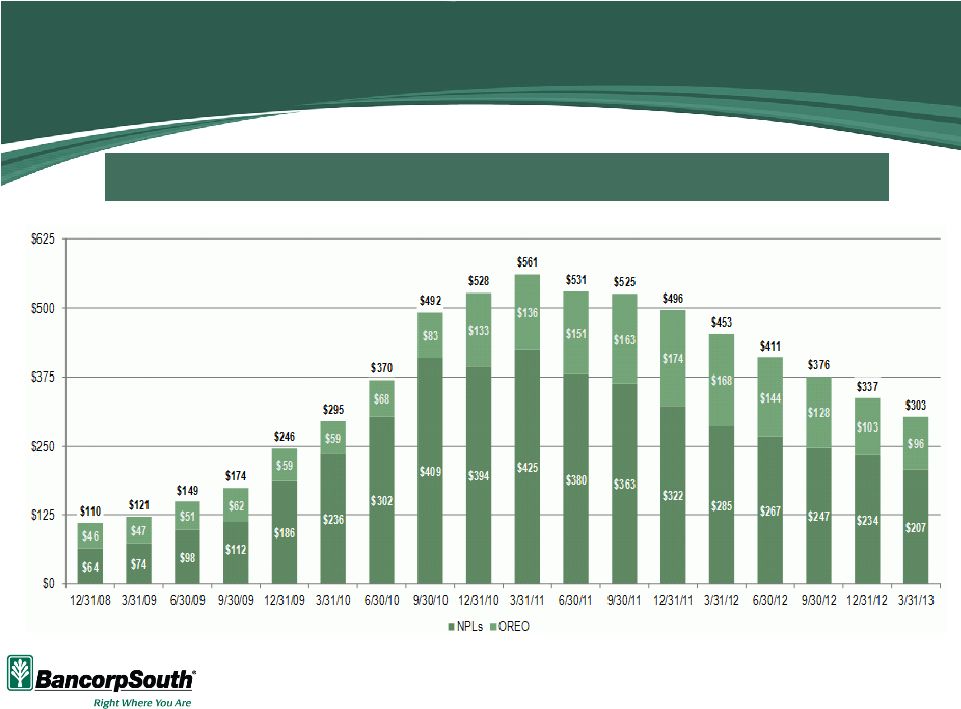 NPA Improvement Total NPAs Declined Approximately 46% Since Their Peak in Q1 2011 14 Dollars in millions NPLs include non-accrual loans, loans 90+ days past due and restructured loans NPAs include NPLs and other real estate owned |
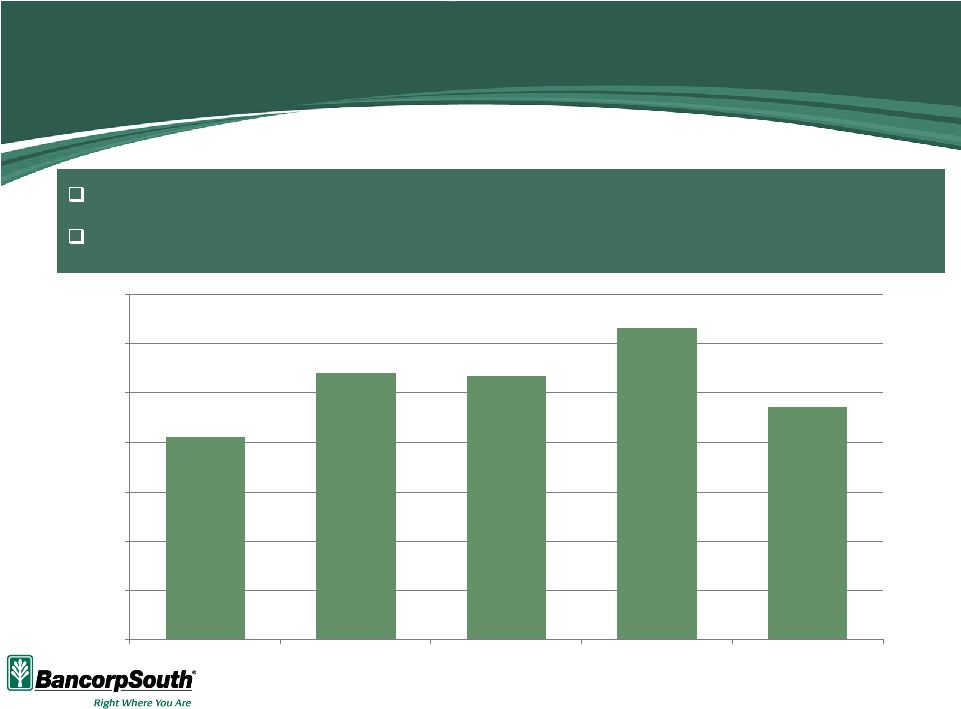 Dollars in millions Data for quarters ended as of dates shown Payments Received on Non-Accrual Loans 15 $20.6 $27.1 $26.7 $31.6 $23.6 $0 $5 $10 $15 $20 $25 $30 $35 3/31/12 6/30/12 9/30/12 12/31/12 3/31/13 Payments of $109 million received on non-accrual loans over the past year 56% of non-accrual loans were paying as agreed as of March 31, 2013 |
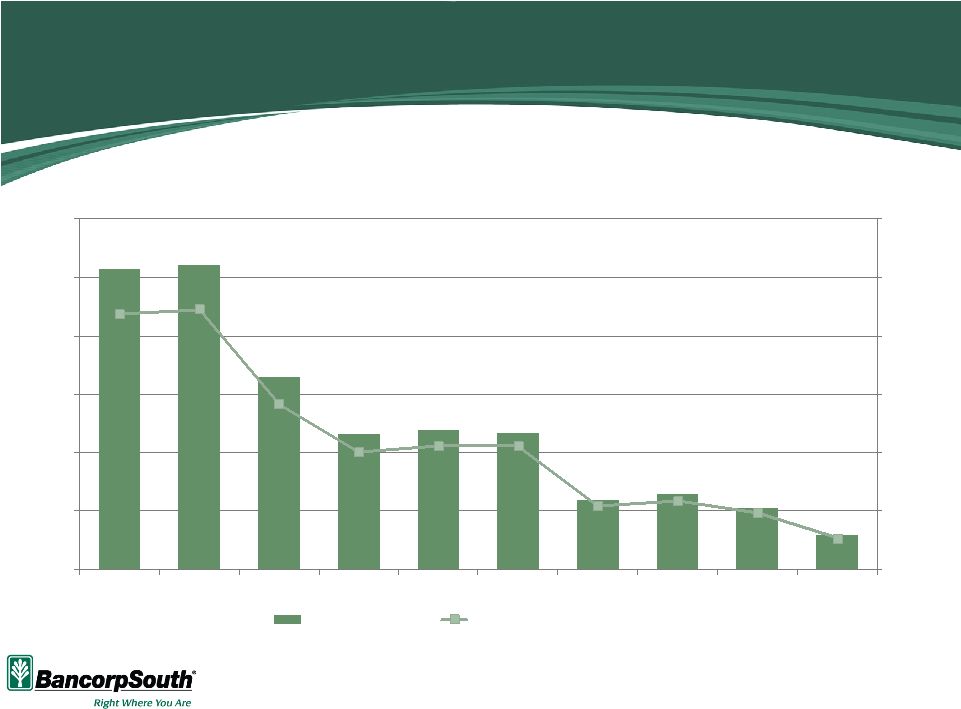 Dollars in millions Data for quarters ended as of dates shown Positive Trend in Net Charge-Offs % Avg. Loans 16 $51 $52 $33 $23 $24 $23 $12 $13 $11 $6 0.0% 0.5% 1.0% 1.5% 2.0% 2.5% 3.0% $0 $10 $20 $30 $40 $50 $60 12/31/10 3/31/11 6/30/11 9/30/11 12/31/11 3/31/12 6/30/12 9/30/12 12/31/12 3/31/13 Net charge-offs Net charge-offs / average loans |
 Summary Meaningful increases in profitability levels Consistent core earnings with approximately 40% of total revenue derived from noninterest sources Continued solid mortgage loan production Growth in certain noninterest revenue sources including insurance commissions Continued progress in improving asset quality 8 th consecutive quarter of improvement in total NPLs and NPAs Revenue growth opportunities Efficiency and expense control Data as of and for the quarter ended March 31, 2013 17 |