 BancorpSouth, Inc. Acquisition of Central Community Corporation First State Bank Central Texas January 22, 2014 Exhibit 99.1 |
 Forward Looking Information Certain statements contained in this presentation and the accompanying slides may not be based on historical facts and are “forward-looking statements” within the meaning of Section 27A of the Securities Act of 1933, as amended, and Section 21E of the Securities Exchange Act of 1934, as amended. These forward-looking statements may be identified by reference to a future period or by the use of forward-looking terminology, such as “anticipate,” “believe,” “estimate,” “expect,” “foresee,” “may,” “might,” “will,” “intend,” “could,” “would” or “plan,” or future or conditional verb tenses, and variations or negatives of such terms. These forward- looking statements include, without limitation, statements about the terms and closing of the proposed transaction with Central Community Corporation, acceptance by customers of Central Community Corporation of BancorpSouth’s products and services, the opportunities to enhance market share in certain markets and market acceptance of BancorpSouth generally in new markets. We caution you not to place undue reliance on the forward-looking statements contained in this news release, in that actual results could differ materially from those indicated in such forward-looking statements as a result of a variety of factors. These factors include, but are not limited to, the ability to obtain required shareholder and regulatory approvals for the merger, the ability of BancorpSouth and Central Community Corporation to close the merger, BancorpSouth’s ability to successfully integrate the operations of First State Bank Central Texas after the merger, the ability of BancorpSouth to provide competitive services and products in new markets and grow market share in existing markets, the ability of BancorpSouth to assimilate and retain key personnel after the merger, conditions in the financial markets and economic conditions generally, the adequacy of BancorpSouth’s provision and allowance for credit losses to cover actual credit losses, the credit risk associated with real estate construction, acquisition and development loans, losses resulting from the significant amount of BancorpSouth’s other real estate owned, limitations on BancorpSouth’s ability to declare and pay dividends, the impact of legal or administrative proceedings, the availability of capital on favorable terms if and when needed, liquidity risk, governmental regulation and supervision of BancorpSouth’s operations, the short-term and long-term impact of changes to banking capital standards on BancorpSouth’s regulatory capital and liquidity, the impact of regulations on service charges on BancorpSouth’s core deposit accounts, the susceptibility of BancorpSouth’s business to local economic or environmental conditions, the soundness of other financial institutions, changes in interest rates, the impact of monetary policies and economic factors on BancorpSouth’s ability to attract deposits or make loans, volatility in capital and credit markets, reputational risk, the impact of hurricanes or other adverse weather events, any requirement that BancorpSouth write down goodwill or other intangible assets, diversification in the types of financial services BancorpSouth offers, BancorpSouth’s ability to adapt its products and services to evolving industry standards and consumer preferences, competition with other financial services companies, BancorpSouth’s growth strategy, interruptions or breaches in BancorpSouth’s information system security, the failure of certain third party vendors to perform, unfavorable ratings by rating agencies, dilution caused by BancorpSouth’s issuance of additional shares of its common stock to raise capital or acquire other banks, bank holding companies, financial holding companies and insurance agencies,, other factors generally understood to affect the financial results of financial services companies and other factors detailed from time to time in the Company’s press releases and filings with the Securities and Exchange Commission. Forward-looking statements speak only as of the date they were made, and, except as required by law, we do not undertake any obligation to update or revise forward-looking statements to reflect events or circumstances after the date of this presentation. Certain tabular presentations may not reconcile because of rounding. Unless otherwise noted, any quotes in this presentation can be attributed to company management. Any pro forma information presented herein, while helpful in illustrating certain characteristics of the combined companies based on certain assumptions, does not reflect the impact of, for example, asset dispositions or runoff, that may result as a consequence of the business combination and, accordingly, does not attempt to predict or suggest future results. It also does not necessarily reflect what the historical loan composition of the combined operations would have been had the companies been combined as of the date indicated. If not otherwise attributed to a particular source, factual information was obtained or derived from third-party public sources believed by BancorpSouth management to be reliable, but BancorpSouth has not undertaken an independent review to verify the accuracy of this information as of the date of this presentation. To the extent that such information predicts future results, BancorpSouth can make no assurance that such results will occur. In connection with the proposed merger of Central Community Corporation with and into BancopSouth, BancorpSouth will file a registration statement on Form S-4 with the Securities and Exchange Commission. Shareholders of BancorpSouth and Central Community Corporation are encouraged to read the registration statement, including the proxy statement/prospectus that will be a part of the registration statement, because it will contain important information about the merger, BancorpSouth and Central Community Corporation After the registration statement is filed with the SEC, the proxy statement/prospectus and other relevant documents will be available for free on the SEC’s web site (www.sec.gov), and the proxy statement/prospectus will also be made available for free from the Corporate Secretary of each of BancorpSouth and Central Community Corporation In connection with the proposed merger of Ouachita Bancshares Corp. with and into BancorpSouth, BancorpSouth will file a registration statement on Form S-4 with the Securities and Exchange Commission. Shareholders of BancorpSouth and Ouachita Bancshares Corp. are encouraged to read the registration statement, including the proxy statement/prospectus that will be a part of the registration statement, because it will contain important information about the merger, BancorpSouth and Ouachita Bancshares Corp. After the registration statement is filed with the SEC, the proxy statement/prospectus and other relevant documents will be available for free on the SEC’s web site (www.sec.gov), and the proxy statement/prospectus will also be made available for free from the Corporate Secretary of each of BancorpSouth and Ouachita Bancshares Corp. |
 3 Strategic Rationale Largest independent bank headquartered in Austin, TX Expands the Company’s current east Texas footprint into the central Texas market Enhances the Company’s current Texas deposit market share from 65 th to 29 th Improves overall demographic profile of our Company Provides future consolidation and growth opportunities in Texas with over 600 banks currently in the state Similar cultures and operating styles Meaningful accretion to earnings per share |
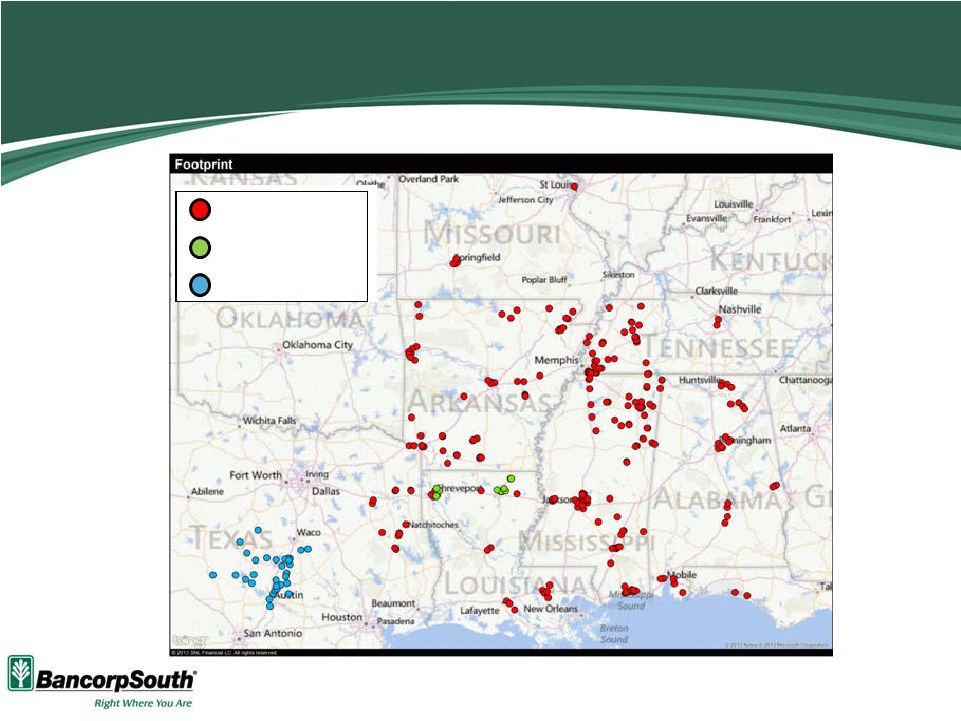 Footprint Expansion 4 BancorpSouth (256) Ouachita* (12) First State Bank (31) Source: SNL Financial *Merger of Ouachita Bancshares Corp. with and into BancorpSouth expected to close during the second quarter of 2014 |
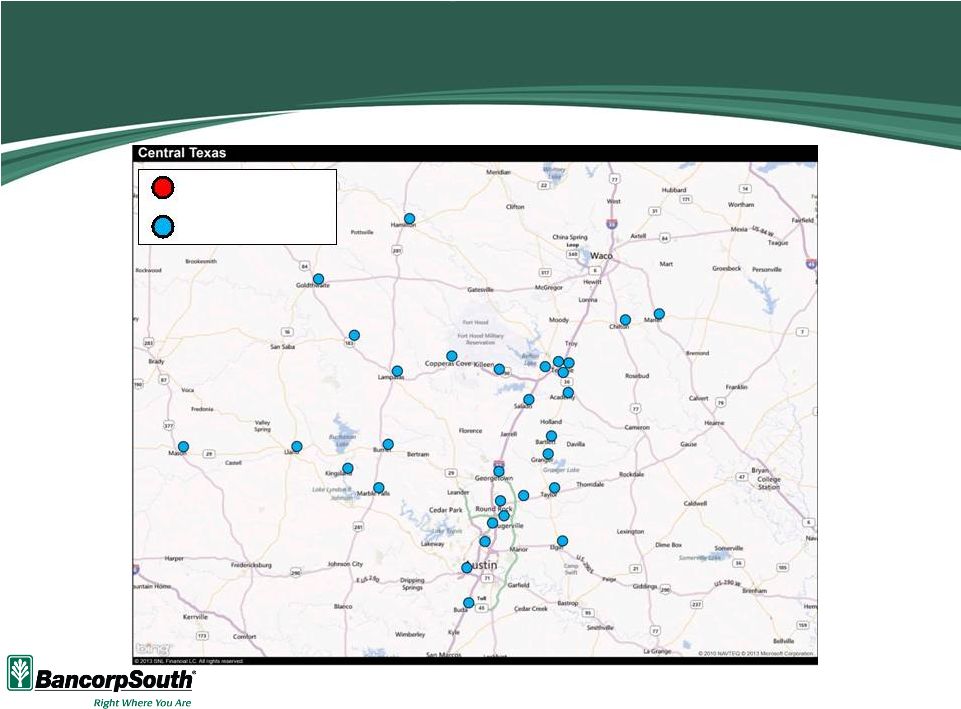 First State Bank - Footprint 5 Source: SNL Financial BancorpSouth (0) First State Bank (31) |
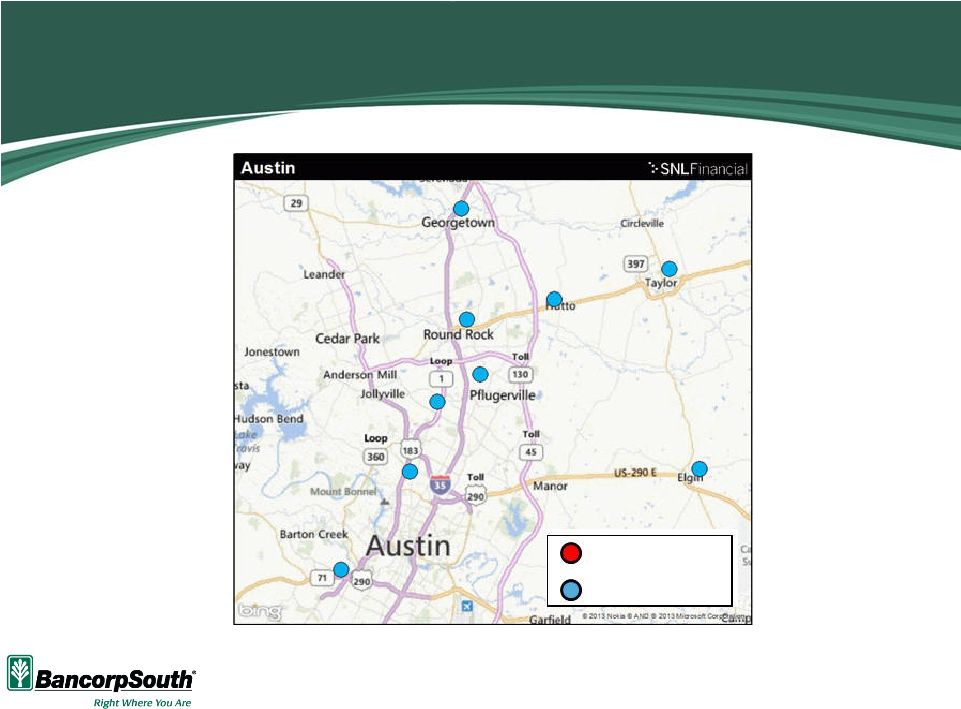 6 First State Bank - Austin Source: SNL Financial BancorpSouth (0) First State Bank (9) |
 7 Market Overview Texas Economy Contains four of the top ten fastest growing cities in the US Projected to have 40 million residents by 2030 In the past 10 years, Texas has added 732,000 jobs – No other state tops 100,000 A little less than half of the jobs created in the US since 2001 have been in Texas Home to more Fortune 1000 companies than any other state In 2012, Texas RGDP grew by 3.2% compared to 2.2% for the US Texas unemployment fell by more than 442,000 during the recession Sales tax collections have increased for 41 consecutive months Texas has the 11 th largest GDP in the world, if it were considered its own country Austin and Surrounding Area No. 1 economy in the U.S. based on the economic rankings of The Business Journals’ On Numbers report 14 th largest city in the US University of Texas – 24,000 faculty and staff; 52,000 students; annual budget of $2.2 billion Private-sector job base has grown by 11.2% since 2008, the highest five-year growth rate in the nation #8 on Bloomberg Business Week’s list of America’s 50 Best Cities #6 on Kiplinger’s list of Best Cities to Live, Work, and Play Five-year earnings growth of 17.8% One-year house appreciation of 7.7% Information obtained from third-party public sources |
 8 Deposit Market Share Market BXS Market Share Rank 6/30/13 Total BXS Deposits 6/30/13 Percentage of Total Company Deposits BXS Market Share 2013 (%) Ouachita Bancshares Corp. Deposits 6/30/13 Central Community Corp. Deposits 6/30/13 Pro Forma Deposits 6/30/13 Pro Forma Percentage of Total Company Deposits Pro Forma Market Share Rank 6/30/13 Pro Forma Market Share 2013 (%) Market YoY Deposit Growth 2013 (%) Mississippi 3 5,069,157 $ 46.4% 10.6% - $ - $ 5,069,157 $ 40.7% 3 10.6% 2.6% Texas 65 826,576 7.6% 0.1% - 977,625 1,804,201 14.5% 29 0.3% 8.9% Arkansas 7 1,733,083 15.9% 3.3% - - 1,733,083 13.9% 7 3.3% -0.5% Louisiana 11 955,359 8.7% 1.0% 533,685 - 1,489,044 12.0% 7 1.6% 5.3% Tennessee 15 1,184,566 10.8% 1.0% - - 1,184,566 9.5% 15 1.0% 0.1% Alabama 13 824,116 7.5% 1.0% - - 824,116 6.6% 13 1.0% 1.8% Missouri 66 317,286 2.9% 0.2% - - 317,286 2.6% 66 0.2% 6.2% Florida 246 19,351 0.2% 0.0% - - 19,351 0.2% 246 0.0% 4.1% Total 10,929,494 $ 100.0% 533,685 $ 977,625 $ 12,440,804 $ 100.0% 6/30/13 Deposit Market Share ($ in thousands) Source: SNL Financial Note: Deposit data as of 6/30/13 Merger of Ouachita Bancshares Corp. with and into BancorpSouth expected to close during the second quarter of 2014 |
   9 Branch Listing Branch Address City Total Deposits 23 101 E Polk St Burnet 28,550 $ 24 617 US Hwy 281 Marble Falls 39,077 67,627 $ 25 111 6th St Chilton 6,830 $ 26 1301 Fisher St Goldthwaite 26,238 27 200 S Bell St Hamilton 52,199 28 14550 W RR 1431 Kingsland 21,393 29 907 Ford St Llano 21,039 30 164 Live Oak St Marlin 48,689 31 215 Westmoreland St Mason 16,049 192,437 $ TOTAL DEPOSITS 977,625 $ MARBLE FALLS OTHER Source: SNL Financial Note: Deposit data as of 6/30/13 Branch Address City Total Deposits 2013 ($000) 1 6500 N MoPac Austin 64,441 $ 2 5501 W Hwy 290 Austin 43,901 3 3951 W Parmer Ln Austin 17,882 4 1115A Main St Buda 11,207 5 207 N Main St Elgin 13,013 6 711 San Gabriel Village Blvd Georgetown 51,322 7 201 E Davilla St Granger 15,107 8 120 Ed Schmidt Blvd Hutto 8,089 9 1620 Grand Avenue Pkwy Pflugerville 21,798 10 505 E Palm Valley Blvd Round Rock 14,881 11 813 N Main St Taylor 27,352 288,993 $ 12 206 S Dalton St Bartlett 24,052 $ 13 2855 N Main St Belton 21,152 14 181 W Hwy 190 Copperas Cove 2,565 15 661 W Central Texas Expy Harker Heights 62,484 16 206 S Key Ave Lampasas 52,314 17 450 N Hwy 95 Little River-Academy 13,410 18 101 N 4th St Lometa 22,671 19 50 S Main St Salado 66,586 20 5550 SW H K Dodgen Loop Temple 145,870 21 402 N Main St Temple 15,244 22 1150 Canyon Creek Dr Temple 2,220 428,568 $ AUSTIN-ROUND ROCK KILLEEN-TEMPLE-FORT HOOD |
 10 Central Community Corporation Deposit Market Share Source: SNL Financial Note: Deposit data as of 6/30/13 Total Deposit Rank 2013 Parent Company Name Parent City Parent State Total Active Branches 2013 Total Deposits 2013 ($000) Total Deposit Market Share 2013 (%) YoY Deposit Growth 2013 (%) 1 Wells Fargo & Co. San Francisco CA 72 6,658,833 $ 21.98 9.69 2 Bank of America Corp. Charlotte NC 40 5,092,558 16.81 16.51 3 JPMorgan Chase & Co. New York NY 67 4,766,530 15.73 7.31 4 Cullen/Frost Bankers Inc. San Antonio TX 15 2,109,788 6.96 10.70 5 Banco Bilbao Vizcaya Argentaria SA Bilbao - 31 1,993,821 6.58 18.67 17 Central Community Corp. Temple TX 11 288,993 0.95 12.01 1 Extraco Corp. Waco TX 10 686,240 $ 17.31 4.00 2 First Community Bancshares Inc. Killeen TX 25 641,847 16.19 9.40 3 Banco Bilbao Vizcaya Argentaria SA Bilbao - 5 476,650 12.02 15.56 4 National United Bancshares Inc. Gatesville TX 6 428,662 10.81 5.98 5 Central Community Corp. Temple TX 11 428,568 10.81 4.69 1 First State Bank of Burnet Burnet TX 2 163,986 $ 22.47 10.94 2 North American Bancshares Inc. Sherman TX 1 133,994 18.36 (0.82) 3 International Bancshares Corp. Laredo TX 1 69,033 9.46 (16.00) 4 Central Community Corp. Temple TX 2 67,627 9.26 29.77 5 Wells Fargo & Co. San Francisco CA 1 61,992 8.49 5.77 AUSTIN-ROUND ROCK KILLEEN-TEMPLE-FORT HOOD MARBLE FALLS 6/30/13 Deposit Market Share ($ in thousands) |
 Financial Highlights – Central Community Corporation 11 • Largest independent bank headquartered in Austin, TX • Operates 31 locations in the Central Texas market • Diverse and economically attractive markets Source: SNL Financial As of Dollars in thousands 12/31/10 12/31/11 12/31/12 9/30/13 Balance Sheet Total Assets 1,109,781 $ 1,151,910 $ 1,218,347 $ 1,310,971 $ Total Loans & Leases (Excl HFS) 600,356 568,738 559,877 544,200 Securities 358,298 452,190 519,782 605,204 Deposits 866,119 880,977 937,356 1,016,675 Total Equity 126,860 141,943 155,805 128,425 Tangible Equity 113,907 129,911 144,544 117,636 Balance Sheet Ratios Loans / Deposits (%) 69.32 64.56 59.73 53.53 Tangible Equity / Tangible Assets (%) 10.39 11.40 11.97 9.05 Leverage Ratio (%) 12.09 12.20 12.45 10.78 Tier 1 Capital Ratio (%) 16.82 18.95 20.03 17.29 Total Capital Ratio (%) 18.85 20.76 21.56 18.80 Income Statement Net Interest Income 37,275 $ 36,411 $ 36,119 $ 29,687 $ Provision Expense 5,515 3,320 225 - Noninterest Income 9,841 10,561 13,090 11,041 Securities Gains (Losses) 1,160 (2,983) (185) 44 Noninterest Expense 33,095 31,569 32,685 24,434 Net Income 7,147 7,250 11,654 11,605 Profitability Ratios Return on Average Assets (%) 0.68 0.65 0.99 1.24 Returne on Average Tangible Equity (%) 7.13 6.36 8.92 11.93 Net Interest Margin - FTE (%) 4.22 3.89 3.62 3.80 Efficiency Ratio (%) 65.27 62.56 61.89 56.70 Fee Income / Operating Revenue (%) 20.89 22.48 26.60 27.11 Year ended |
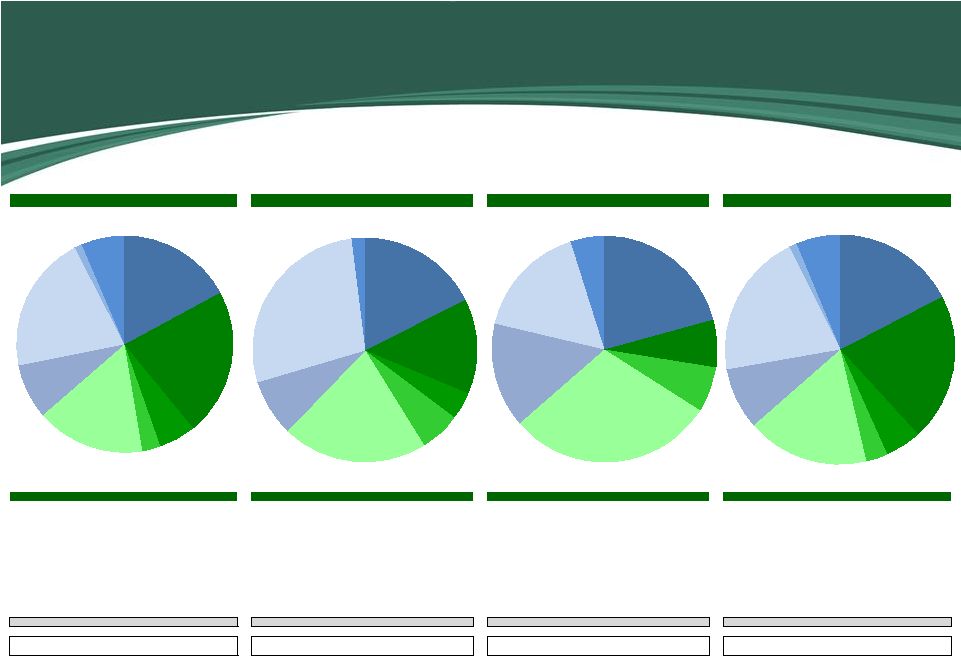 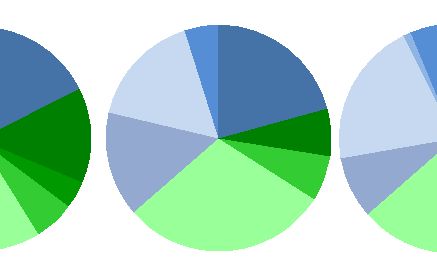 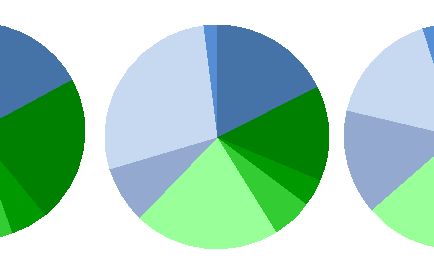 12 Pro Forma Loan Composition Loan Portfolio ($000) Amount % Loan Portfolio ($000) Amount % Loan Portfolio ($000) Amount % Loan Portfolio ($000) Amount % Commercial and industrial 1,503,809 $ 17.1% Commercial and industrial 81,395 $ 17.6% Commercial and industrial 112,802 $ 20.7% Commercial and industrial 1,698,006 $ 17.4% Real estate Real estate Real estate Real estate Consumer mortgages 1,931,171 22.0% Consumer mortgages 63,756 13.8% Consumer mortgages 37,131 6.8% Consumer mortgages 2,032,058 20.8% Home equity 490,361 5.6% Home equity 18,159 3.9% Home equity - 0.0% Home equity 508,520 5.2% Agricultural 234,547 2.7% Agricultural 27,381 5.9% Agricultural 35,253 6.5% Agricultural 297,181 3.0% Commercial and industrial-owner occupied 1,422,077 16.2% Commercial and industrial-owner occupied 96,740 20.9% Commercial and industrial-owner occupied 161,338 29.7% Commercial and industrial-owner occupied 1,680,155 17.2% Construction, acquisition and development 723,609 8.2% Construction, acquisition and development 37,903 8.2% Construction, acquisition and development 81,137 14.9% Construction, acquisition and development 842,649 8.6% Commercial real estate 1,795,352 20.5% Commercial real estate 127,863 27.7% Commercial real estate 90,235 16.6% Commercial real estate 2,013,450 20.6% Credit cards 105,112 1.2% Credit cards - 0.0% Credit cards - 0.0% Credit cards 105,112 1.1% All other 567,077 6.5% All other 9,129 2.0% All other 26,210 4.8% All other 602,416 6.2% Total loans 8,773,115 $ 100.0% Total loans 462,326 $ 100.0% Total loans 544,106 $ 100.0% Total loans 9,779,547 $ 100.0% Yield on Loans: 4.55% Yield on Loans: 5.37% Yield on Loans: 5.59% Yield on Loans: 4.65% BancorpSouth, Inc. Ouachita Bancshares Corp. Central Community Corp. Pro Forma Commercial and industrial 17.4% Consumer mortgages 20.8% Home equity 5.2% Agricultural 3.0% Commercial and industrial-owner occupied 17.2% Construction, acquisition and development 8.6% Commercial real estate 20.6% Credit cards 1.1% All other 6.2% Commercial and industrial 17.1% Consumer mortgages 22.0% Home equity 5.6% Agricultural 2.7% Commercial and industrial-owner occupied 16.2% Construction, acquisition and development 8.2% Commercial real estate 20.5% Credit cards 1.2% All other 6.5% Commercial and industrial 20.7% Consumer mortgages 6.8% Agricultural 6.5% Commercial and industrial-owner occupied 29.7% Construction, acquisition and development 14.9% Commercial real estate 16.6% All other 4.8% Commercial and industrial 17.6% Consumer mortgages 13.8% Home equity 3.9% Agricultural 5.9% Commercial and industrial-owner occupied 20.9% Construction, acquisition and development 8.2% Commercial real estate 27.7% All other 2.0% Pro forma information excludes purchase accounting adjustments but includes adjustments related to divestitures Loan yields represent weighted average yields for the quarter ended 9/30/13 Based on Call Reports filed by BancorpSouth, Ouachita Bancshares Corp., and Central Community Corporation as of 9/30/13 |
 13 Pro Forma Deposit Composition Central Community Corp. BancorpSouth, Inc. Ouachita Bancshares Corp. Pro Forma Deposit Portfolio ($000) Amount % Deposit Portfolio ($000) Amount % Deposit Portfolio ($000) Amount % Deposit Portfolio ($000) Amount % Non-Interest Bearing Demand 2,597,762 $ 24.2% Non-Interest Bearing Demand 159,207 $ 28.7% Non-Interest Bearing Demand 323,992 $ 31.8% Non-Interest Bearing Demand 3,080,961 25.1% Interest-Bearing Demand 4,493,359 41.9% Interest-Bearing Demand 182,975 33.0% Interest-Bearing Demand 307,707 30.2% Interest-Bearing Demand 4,984,041 40.5% Savings 1,220,227 11.4% Savings 93,020 16.8% Savings 45,193 4.4% Savings 1,358,440 11.1% Other Time 2,406,598 22.5% Other Time 119,938 21.6% Other Time 342,491 33.6% Other Time 2,869,027 23.3% Total deposits 10,717,946 $ 100.0% Total deposits 555,140 $ 100.0% Total deposits 1,019,383 $ 100.0% Total deposits 12,292,469 $ 100.0% Cost of Deposits: 0.29% Cost of Deposits: 0.36% Cost of Deposits: 0.54% Cost of Deposits: 0.36% Non-Interest Bearing Demand 28.7% Interest-Bearing Demand 33.0% Savings 16.8% Other Time 21.6% Non-Interest Bearing Demand 24.2% Interest-Bearing Demand 41.9% Savings 11.4% Other Time 22.5% Non-Interest Bearing Demand 31.8% Interest-Bearing Demand 30.2% Savings 4.4% Other Time 33.6% Non-Interest Bearing Demand 25.1% Interest-Bearing Demand 40.5% Savings 11.1% Other Time 23.3% $ Pro forma information excludes purchase accounting adjustments but includes adjustments related to divestitures Deposit costs represent weighted average costs for the quarter ended 9/30/13 |
 14 Credit Quality Loan portfolio summary Granular loan portfolio • Over 4,500 individual loans • Average loan size approximately $115,000 Asset quality metrics (as of 9/30/13)* • NPLs/loans – 2.63% • NPAs/total assets – 3.42% Allowance for loan losses – $14.5 million Scope of diligence work Performed on-site by internal diligence team Performed detailed loan file reviews on approximately 80% of outstanding loan balances and commitments Reviewed substantially all NPLs and NPAs Performed diligence on largest borrowers, troubled debt restructurings, participations bought and sold, etc. Results of diligence work *Source: SNL Financial Preliminary total credit mark estimated at $32 million ($17.5 million net of ALLL) Other real estate mark estimated at $3.5 million |
 15 Transaction Terms Merger Partner: Central Community Corporation Aggregate Deal Value: $209.5 million Consideration Structure: 7,250,000 shares of BancorpSouth, Inc. and $28.5 million of cash Consideration Mix: 87% stock / 13% cash Required Approvals: Customary regulatory approval; Central Community Corporation shareholder approval Due Diligence: Complete Anticipated Closing: Second quarter of 2014 Retained Subsidiaries*: First State Bank Central Texas Central Community Capital Trust 1 ($15 million trust preferred securities) First Central Union Capital Trust 1 ($2 million trust preferred securities) Based on a per share price of BancorpSouth, Inc. common stock of $24.97, which represents the closing price as of 1/21/14 *Subsidiaries and assets with book values totaling approximately $27 million will be divested prior to closing |
 16 Transaction Summary $209.5 Transaction Multiples Last Twelve Months Earnings ($14.3mm) 14.7x 2013 Annualized Earnings ($15.5mm) 13.5x Book Value ($128.4mm) 1.63x Adjusted Book Value ($109.5mm)* 1.91x Tangible Book Value ($117.6mm) 1.78x Adjusted Tangible Book Value ($98.7mm)* 2.12x Deposit Premium ($1,016.7mm) 9.0% Aggregate Deal Value ($mm) Source: SNL Financial Based on a per share price of BancorpSouth, Inc. common stock of $24.97, which represents the closing price as of 1/21/14 *Adjusted to reflect estimated impact of divestitures of assets with book values totaling approximately $27 million to be made prior to closing |
 17 Financial Impact BancorpSouth, Inc. Ouachita Bancshares Corp. Central Community Corp. Pro Forma (1) Financial Impact 9/30/13 9/30/13 9/30/13 9/30/13 Balance Sheet Total Assets 12,916,153 $ 664,161 $ 1,310,971 $ 14,965,722 $ Total Loans & Leases (Excl HFS) 8,773,115 462,326 544,200 9,739,041 Deposits 10,717,946 555,140 1,016,675 12,289,761 Total Equity 1,480,611 50,975 128,425 1,747,998 Tangible Equity 1,190,259 50,975 117,636 1,252,171 Regulatory Capital (%) Tangible Equity / Tangible Assets (%) 9.43 7.68 9.05 8.65 Leverage Ratio (%) 9.93 7.64 10.78 9.18 Tier 1 Capital Ratio (%) 13.25 9.95 17.29 12.39 Total Capital Ratio (%) 14.50 14.64 18.80 13.70 Source: SNL Financial and company internal documents Includes estimated purchase accounting adjustments *Merger of Ouachita Bancshares Corp. with and into BancorpSouth expected to close during the second quarter of 2014 (1) |
 18 Summary Footprint expansion Attractive, high-growth markets Significantly increase Texas deposit market share Foundation for future growth Prospects for organic growth Future consolidation opportunities in Texas Opportunity to further leverage current operating platform and back office support Retention of experienced local management team Addition of Donald Grobowsky to Boards of Directors of BancorpSouth, Inc. and BancorpSouth Bank Accretive to earnings per share while retaining strong capital position |