 BancorpSouth, Inc. Financial Information As of December 31, 2013 Exhibit 99.2 |
 Forward Looking Information 2 Certain statements contained in this presentation and the accompanying slides may not be based on historical facts and are “forward-looking statements” within the meaning of Section 27A of the Securities Act of 1933, as amended, and Section 21E of the Securities Exchange Act of 1934, as amended. These forward-looking statements may be identified by reference to a future period or by the use of forward-looking terminology, such as “anticipate,” “believe,” “estimate,” “expect,” “foresee,” “may,” “might,” “will,” “intend,” “could,” “would” or “plan,” or future or conditional verb tenses, and variations or negatives of such terms. These forward- looking statements include, without limitation,, statements relating to revenue estimates for the Company’s operations in Houston, Texas following the closing of the transaction with GEM Insurance Agencies, LP and the potential for expansion of the Company’s business in Houston, the terms and closing of the proposed transactions with Ouachita Bancshares Corp. and Central Community Corp., acceptance by customers of Ouachita Bancshares Corp. and Central Community Corp. of the Company’s products and services, the opportunities to enhance market share in certain markets and market acceptance of the Company generally in new markets, the impact of cost-saving initiatives, our ability to improve efficiency, and our use of non-GAAP financial measures. We caution you not to place undue reliance on the forward-looking statements contained in this news release in that actual results could differ materially from those indicated in such forward-looking statements because of a variety of factors. These factors may include, but are not limited to, the ability to obtain required shareholder and regulatory approvals of the mergers, the ability of the Company, Ouachita Bancshares Corp. and Central Community Corp. to close the mergers, the ability of the Company to expand its insurance operations in Houston, conditions in the financial markets and economic conditions generally, the adequacy of the Company’s provision and allowance for credit losses to cover actual credit losses, the credit risk associated with real estate construction, acquisition and development loans, losses resulting from the significant amount of the Company’s other real estate owned, limitations on the Company’s ability to declare and pay dividends, the impact of legal or administrative proceedings, the availability of capital on favorable terms if and when needed, liquidity risk, governmental regulation, including the Dodd Frank Act, and supervision of the Company’s operations, the short-term and long-term impact of changes to banking capital standards on the Company’s regulatory capital and liquidity, the impact of regulations on service charges on the Company’s core deposit accounts, the susceptibility of the Company’s business to local economic or environmental conditions, the soundness of other financial institutions, changes in interest rates, the impact of monetary policies and economic factors on the Company’s ability to attract deposits or make loans, volatility in capital and credit markets, reputational risk, the impact of hurricanes or other adverse weather events, any requirement that the Company write down goodwill or other intangible assets, diversification in the types of financial services the Company offers, the Company’s ability to adapt its products and services to evolving industry standards and consumer preferences, competition with other financial services companies, risks in connection with completed or potential acquisitions, the Company’s growth strategy, interruptions or breaches in the Company’s information system security, the failure of certain third party vendors to perform, unfavorable ratings by rating agencies, dilution caused by the Company’s issuance of any additional shares of its common stock to raise capital or acquire other banks, bank holding companies, financial holding companies and insurance agencies, other factors generally understood to affect the financial results of financial services companies and other factors detailed from time to time in the Company’s press releases and filings with the Securities and Exchange Commission. Forward-looking statements speak only as of the date they were made, and, except as required by law, we do not undertake any obligation to update or revise forward-looking statements to reflect events or circumstances after the date of this presentation. Certain tabular presentations may not reconcile because of rounding. Unless otherwise noted, any quotes in this presentation can be attributed to company management. In connection with the proposed merger of Central Community Corporation with and into BancopSouth, BancorpSouth will file a registration statement on Form S-4 with the Securities and Exchange Commission. Shareholders of BancorpSouth and Central Community Corporation are encouraged to read the registration statement, including the proxy statement/prospectus that will be a part of the registration statement, because it will contain important information about the merger, BancorpSouth and Central Community Corporation After the registration statement is filed with the SEC, the proxy statement/prospectus and other relevant documents will be available for free on the SEC’s web site (www.sec.gov), and the proxy statement/prospectus will also be made available for free from the Corporate Secretary of each of BancorpSouth and Central Community Corporation In connection with the proposed merger of Ouachita Bancshares Corp. with and into BancorpSouth, BancorpSouth will file a registration statement on Form S-4 with the Securities and Exchange Commission. Shareholders of BancorpSouth and Ouachita Bancshares Corp. are encouraged to read the registration statement, including the proxy statement/prospectus that will be a part of the registration statement, because it will contain important information about the merger, BancorpSouth and Ouachita Bancshares Corp. After the registration statement is filed with the SEC, the proxy statement/prospectus and other relevant documents will be available for free on the SEC’s web site (www.sec.gov), and the proxy statement/prospectus will also be made available for free from the Corporate Secretary of each of BancorpSouth and Ouachita Bancshares Corp. |
 Q4 Highlights At and for the three months ended December 31, 2013 *Expected to close during the second quarter of 2014. Net income of $27.7 million, or $0.29 per diluted share Acquisition of Gem Insurance Agencies, LP (“GEM”) Expected to produce annual insurance commission revenues of approximately $9 million Generated net loan growth of $184.9 million, or 8.4% annualized Net interest margin increased to 3.52% from 3.45% for the third quarter Expense control focus and efficiency initiatives continue to improve performance Continued improving credit quality Subsequent announcements* Acquisition of Ouachita Bancshares Corp. (Ouachita Independent Bank) Acquisition of Central Community Corporation (First State Bank Central Texas) 3 |
 Recent Quarterly Results Dollars in millions, except per share data 4 12/31/13 9/30/13 12/31/12 vs 9/30/13 Net interest revenue 102.4 $ 100.2 $ 100.9 $ 2.2 % 1.5 % Provision for credit losses 0.0 0.5 6.0 (100.0) (100.0) Noninterest revenue 65.1 62.5 70.9 4.2 (8.1) Noninterest expense 127.8 129.4 143.2 (1.2) (10.7) Income before income taxes 39.7 32.9 22.5 20.9 76.2 Income tax provision 12.0 8.0 5.6 50.2 116.0 Net income 27.7 $ 24.9 $ 17.0 $ 11.4 % 63.1 % Net income per share: diluted 0.29 $ 0.26 $ 0.18 $ 11.5 % 61.1 % Three Months Ended % Change vs 12/31/12 |
 Noninterest Revenue Dollars in thousands NM – Not Meaningful 5 12/31/13 9/30/13 12/31/12 vs 9/30/13 Mortgage lending revenue 9,605 5,134 17,188 87.1 (44.1) Credit card, debit card and merchant fees 8,324 8,834 8,125 (5.8) 2.4 Deposit service charges 13,570 13,679 13,875 (0.8) (2.2) Trust income 3,717 3,332 3,391 11.6 9.6 Security gains, net 29 (5) 152 NM NM Insurance commissions 21,397 23,800 20,502 (10.1) 4.4 Other 8,483 7,740 7,668 9.6 10.6 Total noninterest revenue 65,125 $ 62,514 $ 70,901 $ 4.2 % (8.1) % % of total revenue 38.9% 38.4% 41.3% Three Months Ended % Change vs 12/31/12 |
 Mortgage and Insurance Revenue Dollars in thousands 6 Mortgage Lending Revenue 12/31/13 9/30/13 6/30/13 3/31/13 12/31/12 Origination revenue 3,590 $ 2,862 $ 10,471 $ 9,187 $ 15,131 $ Servicing revenue 4,361 4,072 3,908 3,827 3,879 MSR payoffs/paydowns (1,240) (1,560) (1,739) (1,705) (2,005) MSR valuation adjustment 2,894 (240) 5,252 1,037 183 Total mortgage lending revenue 9,605 $ 5,134 $ 17,892 $ 12,346 $ 17,188 $ Production volume 222,282 $ 341,854 $ 434,966 $ 425,882 $ 549,392 $ Purchase money production 160,043 $ 229,042 $ 226,182 $ 161,835 $ 175,805 $ Margin on total production 1.62% 0.84% 2.41% 2.16% 2.75% Insurance Commission Revenue Property and casualty commissions 15,588 $ 18,372 $ 18,762 $ 16,878 $ 14,968 $ Life and health commissions 4,525 4,061 5,093 4,688 4,376 Risk management income 648 628 573 650 581 Other 636 739 1,434 4,425 577 Total insurance commissions 21,397 $ 23,800 $ 25,862 $ 26,641 $ 20,502 $ Three Months Ended |
 Loan Portfolio Dollars in millions Net loans and leases 7 As of 12/31/13 9/30/13 12/31/12 Commercial and industrial 1,529 $ 1,504 $ 1,477 $ 6.7 % 3.6 % Real estate: Consumer mortgages 1,976 1,931 1,874 9.2 5.5 Home equity 494 486 3.2 1.7 Agricultural 235 235 256 0.0 (8.4) Commercial and industrial-owner occupied 1,473 1,422 1,333 14.3 10.5 Construction, acquisition and development 741 724 736 9.8 0.8 Commercial 1,846 1,795 1,749 11.2 5.6 Credit Cards 111 105 105 23.5 6.1 Other 552 567 622 (10.8) (11.2) Total 8,958 $ 8,773 $ 8,637 $ 8.4 % 3.7 % vs 12/31/12 % Change vs 9/30/13 Annualized |
 No provision for credit losses recorded, which represents a decline from $0.5 million for the third quarter of 2013 and $6.0 million for the fourth quarter of 2012 NPLs decreased $23.9 million, or 16.6%, and NPAs declined $31.4 million, or 14.2% OREO decreased $7.5 million, or 9.8% 52% of non-accrual loans were paying as agreed Near-term delinquencies modestly increased to $33.8 million Net charge-offs declined to $0.7 million from $7.6 million for the third quarter Credit Quality Highlights 8 At and for the three months ended December 31, 2013 “Paying as agreed” includes loans < 30 days past due with payments occurring at least quarterly |
 Non-Performing Loans Dollars in millions Net loans and leases 9 As of 12/31/13 9/30/13 12/31/12 Commercial and industrial 4.2 $ 6.6 $ 10.2 $ (37.0) % (59.2) % Real estate: Consumer mortgages 29.1 34.2 40.7 (14.8) (28.5) Home equity 3.7 3.3 3.5 12.4 5.7 Agricultural 1.9 4.5 8.0 (58.3) (76.6) Commercial and industrial-owner occupied 23.6 23.1 28.3 2.1 (16.7) Construction, acquisition and development 24.3 32.7 72.0 (25.7) (66.2) Commercial 29.4 34.8 62.2 (15.6) (52.8) Credit Cards 1.8 2.0 2.5 (13.2) (30.0) Other 2.6 3.1 6.1 (18.4) (58.1) Total 120.4 $ 144.3 $ 233.6 $ (16.6) % (48.4) % NPL's to net loans and leases 1.34% 1.65% 2.70% % Change vs 9/30/13 vs 12/31/12 |
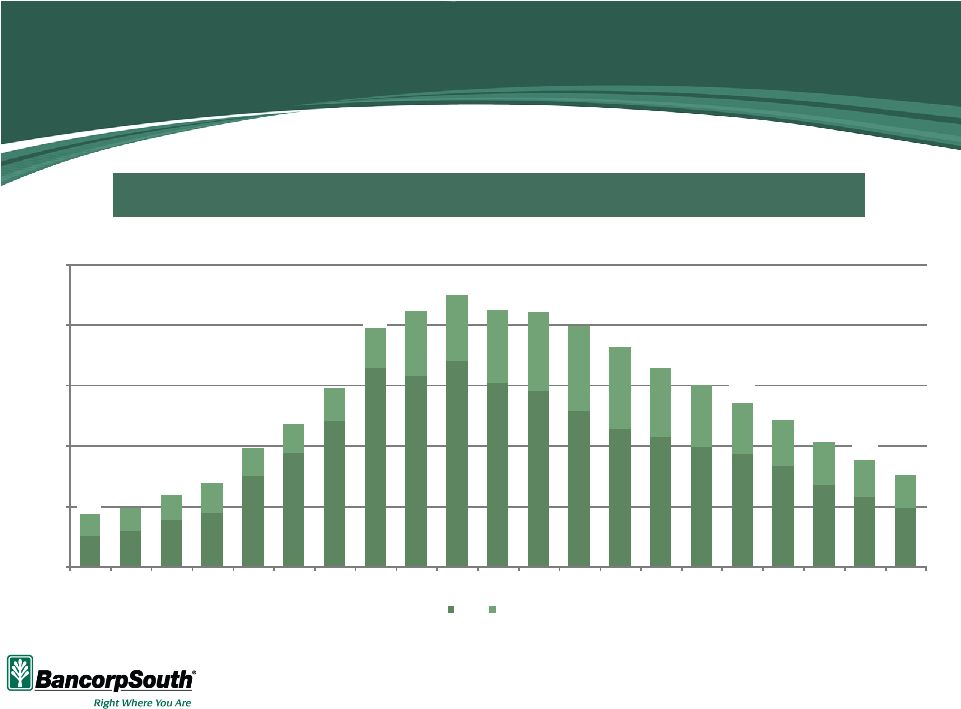 NPA Improvement 10 Total NPAs Have Declined Over 40% in the Last 12 Months $64 $74 $98 $112 $186 $236 $302 $409 $394 $425 $380 $363 $322 $285 $267 $247 $234 $207 $168 $144 $120 $46 $47 $51 $62 $59 $59 $68 $83 $133 $136 $151 $163 $174 $168 $144 $128 $103 $96 $88 $77 $69 $110 $121 $149 $174 $246 $295 $370 $528 $561 $531 $525 $496 $453 $411 $376 $337 $303 $256 $221 $190 $0 $125 $250 $375 $500 $625 4Q 08 1Q 09 2Q 09 3Q 09 4Q 09 1Q 10 2Q 10 3Q 10 4Q 10 1Q 11 2Q 11 3Q 11 4Q 11 1Q 12 2Q 12 3Q 12 4Q 12 1Q 13 2Q 13 3Q 13 4Q 13 NPLs OREO Dollars in millions NPLs consist of nonaccrual loans, loans 90+ days past due and restructured loans NPAs consist of NPLs and other real estate owned $492 |
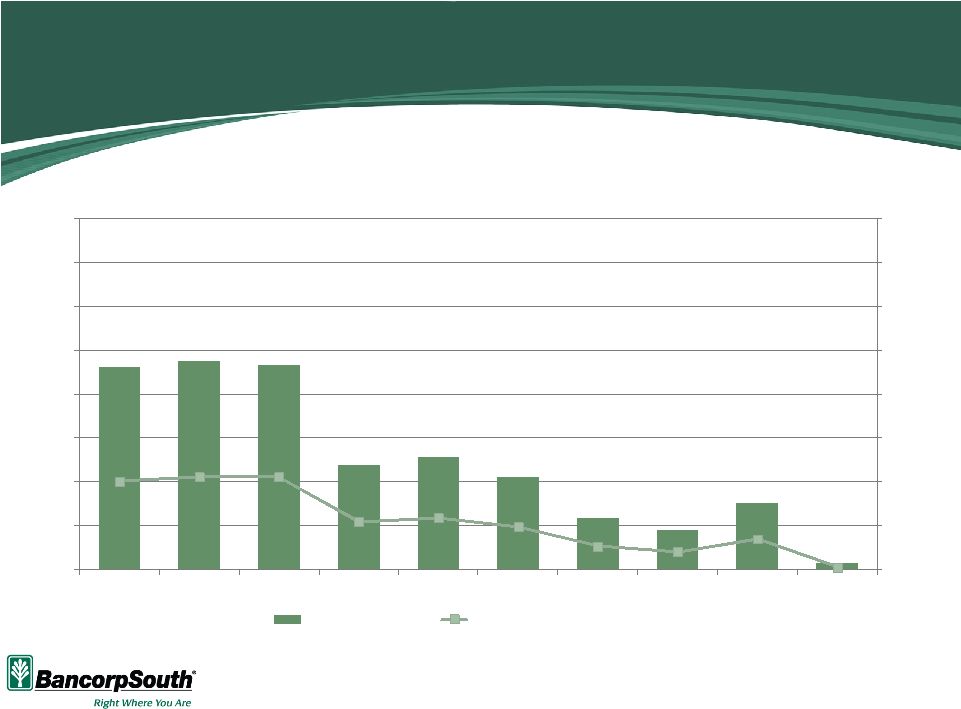 Net Charge-offs % Avg. Loans 11 $23 $24 $23 $12 $13 $11 $6 $5 $8 $1 0.0% 0.5% 1.0% 1.5% 2.0% 2.5% 3.0% 3.5% 4.0% $0 $5 $10 $15 $20 $25 $30 $35 $40 9/30/11 12/31/11 3/31/12 6/30/12 9/30/12 12/31/12 3/31/13 6/30/13 9/30/13 12/31/13 Net charge-offs Net charge-offs / average loans Dollars in millions Net charge-offs for the quarters ended as of the dates shown |
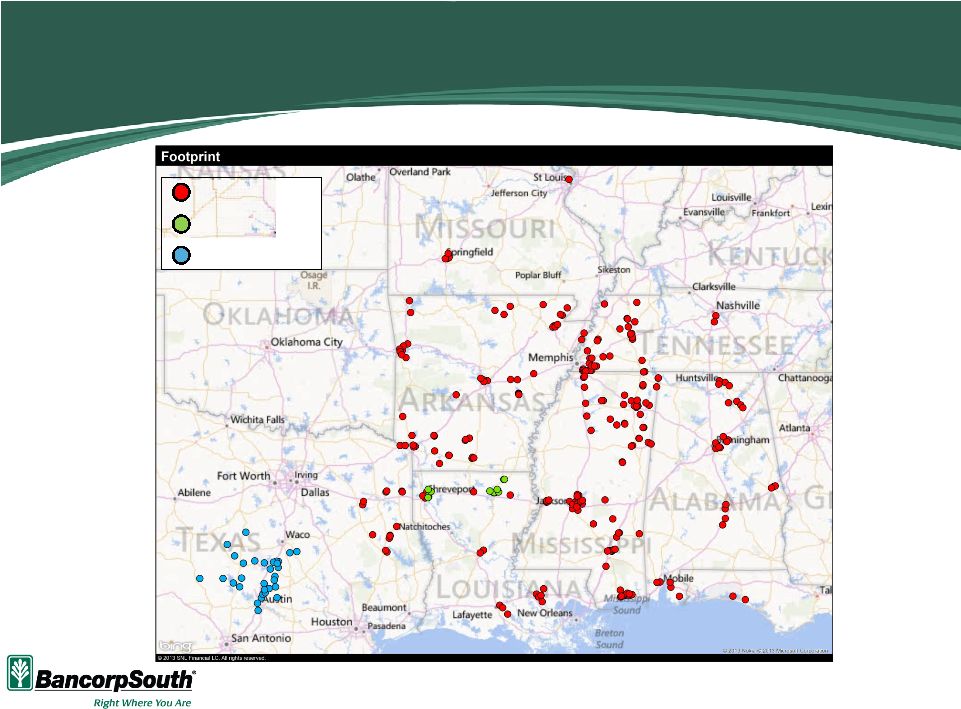  Footprint Expansion 12 Source: SNL Financial BancorpSouth (256) Ouachita* (12) First State Bank* (31) *Transactions expected to close during the second quarter of 2014 |
 Recent Transaction Announcements Ouachita Bancshares Corp. (Ouachita Independent Bank) Assets - $650 million; Loans - $475 million; Deposits - $550 million In-market expansion – enhance presence along I-20 corridor • Footprint overlap in Shreveport and Monroe • Meaningful cost save opportunities Low-risk opportunity • Similar cultures and operating styles • Clean credit quality Accretive to earnings per share Central Community Corporation (First State Bank Central Texas) Assets - $1.3 billion; Loans - $550 million; Deposits - $1.1 billion Footprint expansion – high growth Austin, TX market and other markets along I-35 corridor • Austin, TX ranked No. 1 economy in the U.S. based on the economic rankings of The Business Journals’ On Numbers report • Foundation for growth in Texas, both organically and future consolidation opportunities Similar business models with community and customer focus Accretive to earnings per share 13 Financial data as of 12/31/13 Ouachita Bancshares Corp. and Central Community Corporation transactions expected to close during the second quarter of 2014 |
 14 Deposit Market Share Source: SNL Financial Market BXS Market Share Rank 6/30/13 Total BXS Deposits 6/30/13 Percentage of Total Company Deposits BXS Market Share 2013 (%) Ouachita Bancshares Corp. Deposits 6/30/13 Central Community Corp. Deposits 6/30/13 Pro Forma Deposits 6/30/13 Pro Forma Percentage of Total Company Deposits Pro Forma Market Share Rank 6/30/13 Pro Forma Market Share 2013 (%) Market YoY Deposit Growth 2013 (%) Mississippi 3 5,069,157 $ 46.4% 10.6% - $ - $ 5,069,157 $ 40.7% 3 10.6% 2.6% Texas 65 826,576 7.6% 0.1% - 977,625 1,804,201 14.5% 29 0.3% 8.9% Arkansas 7 1,733,083 15.9% 3.3% - - 1,733,083 13.9% 7 3.3% -0.5% Louisiana 11 955,359 8.7% 1.0% 533,685 - 1,489,044 12.0% 7 1.6% 5.3% Tennessee 15 1,184,566 10.8% 1.0% - - 1,184,566 9.5% 15 1.0% 0.1% Alabama 13 824,116 7.5% 1.0% - - 824,116 6.6% 13 1.0% 1.8% Missouri 66 317,286 2.9% 0.2% - - 317,286 2.6% 66 0.2% 6.2% Florida 246 19,351 0.2% 0.0% - - 19,351 0.2% 246 0.0% 4.1% Total 10,929,494 $ 100.0% 533,685 $ 977,625 $ 12,440,804 $ 100.0% 6/30/13 Deposit Market Share ($ in thousands) Note: Deposit data as of 6/30/13 Ouachita Bancshares Corp. and Central Community Corporation transactions expected to close during the second quarter of 2014 |
 Summary Meaningful progress during 2013 Profitability improvement Loan growth following three years of contraction Progress towards improving efficiency Credit quality continues to improve Current team focus Lenders continue to bring quality deals into the loan pipeline Insurance is growing, both through winning new business and the GEM acquisition Mortgage group attracting and retaining key producers Other lines of business continue to grow and improve performance Operations and support areas preparing for integration of recent bank deals Goals for 2014 More of the same – growth and efficiency Q&A 15 |