 BancorpSouth, Inc. Financial Information As of and for the three months ended June 30, 2014 Exhibit 99.2 |
 Forward Looking Information 2 Certain statements contained in this presentation and the accompanying slides may not be based upon historical facts and are “forward-looking statements” within the meaning of Section 27A of the Securities Act of 1933, as amended, and Section 21E of the Securities Exchange Act of 1934, as amended. These forward-looking statements may be identified by their reference to a future period or periods or by the use of forward-looking terminology such as “anticipate,” “believe,” “could,” “estimate,” “expect,” “foresee,” “intend,” “may,” “might,” “plan,” “will,” or “would” or future or conditional verb tenses and variations or negatives of such terms. These forward-looking statements include, without limitation, statements relating to the terms, timing and closings of the proposed mergers with Ouachita Bancshares Corp. and Central Community Corporation, the Company’s undertaking and performance of the necessary actions to remediate and fully resolve those concerns regarding the Company’s procedures, systems and processes related to certain of its compliance programs, including its Bank Secrecy Act and anti-money-laundering programs, that have been identified by its federal bank regulators, the acceptance by customers of Ouachita Bancshares Corp. and Central Community Corporation of the Company’s products and services if the proposed mergers close, non-accrual loans and any uncertainty regarding repayment, or determinations of impairment, of such non-accrual loans, revenue estimates for the Company’s operations in Houston, Texas following the closing of the transaction with GEM, the retention of key personnel, Knox’s continued operations and generation of revenues, the Company’s opportunities to grow organically and through acquisitions, the Company’s ability to enhance market share in existing markets and to gain acceptance of the Company generally in new markets, the Company’s focus on and impact of cost-saving initiatives, the Company’s ability to improve efficiency, trends in the Company’s operating expenses, and the Company’s use of non-GAAP financial measures. The Company cautions you not to place undue reliance on the forward-looking statements contained in this this presentation and the accompanying slides in that actual results could differ materially from those indicated in such forward-looking statements because of a variety of factors. These factors may include, but are not limited to, the ability of the Company to resolve to the satisfaction of its federal bank regulators those identified concerns regarding the Company’s procedures, systems and processes related to certain of its compliance programs, including its Bank Secrecy Act and anti-money-laundering programs, the findings and results of the Consumer Financial Protection Bureau in its review of the Company’s fair lending practices, the ability of the Company, Ouachita Bancshares Corp. and Central Community Corporation to obtain regulatory approval of and close the proposed mergers, the potential impact upon the Company of the delay in the closings, if any, of these proposed mergers, the ability of the Company to retain key personnel after the closings, if any, of these proposed mergers and the Knox acquisition, the impact of the Company’s restructuring of its management, the conditions in the financial markets and economic conditions generally, the adequacy of the Company’s provision and allowance for credit losses to cover actual credit losses, the credit risk associated with real estate construction, acquisition and development loans, losses resulting from the significant amount of the Company’s other real estate owned, limitations on the Company’s ability to declare and pay dividends, the impact of legal or administrative proceedings, the availability of capital on favorable terms if and when needed, liquidity risk, governmental regulation, including the Dodd Frank Act, and supervision of the Company’s operations, the short-term and long-term impact of changes to banking capital standards on the Company’s regulatory capital and liquidity, the impact of regulations on service charges on the Company’s core deposit accounts, the susceptibility of the Company’s business to local economic or environmental conditions, the soundness of other financial institutions, changes in interest rates, the impact of monetary policies and economic factors on the Company’s ability to attract deposits or make loans, volatility in capital and credit markets, reputational risk, the impact of hurricanes or other adverse weather events, any requirement that the Company write down goodwill or other intangible assets, diversification in the types of financial services the Company offers, the Company’s ability to adapt its products and services to evolving industry standards and consumer preferences, competition with other financial services companies, risks in connection with completed or potential acquisitions, the Company’s growth strategy, interruptions or breaches in the Company’s information system security, the failure of certain third party vendors to perform, unfavorable ratings by rating agencies, dilution caused by the Company’s issuance of any additional shares of its common stock to raise capital or acquire other banks, bank holding companies, financial holding companies and insurance agencies, other factors generally understood to affect the assets, business, cash flows, financial condition, liquidity, prospects and/or results of operations of financial services companies and other factors detailed from time to time in the Company’s press releases and filings with the Securities and Exchange Commission. Forward-looking statements speak only as of the date that they were made, and, except as required by law, the Company does not undertake any obligation to update or revise forward-looking statements to reflect events or circumstances after the date of this this presentation and the accompanying slides. Unless otherwise noted, any quotes in this this presentation and the accompanying slides can be attributed to company management. |
 Q2 Highlights As of and for the three months ended June 30, 2014 3 Net income of $30.9 million, or $0.32 per diluted share Net operating income of $31.5 million, or $0.33 per diluted share Acquisition of Knox Insurance Group, LLC Generated net loan growth of $243.3 million, or 10.8% annualized Net interest margin increased to 3.59% Continued progress toward reducing core operating expenses Continued credit quality improvement Announced succession for President and Chief Operating Officer as well as redesign of management structure |
 Recent Quarterly Results Dollars in millions, except per share data NM – Not Meaningful 6/30/14 3/31/14 6/30/13 vs 3/31/14 Net interest revenue 103.1 $ 101.5 $ 98.2 $ 1.5 % 5.0 % Provision for credit losses 0.0 0.0 3.0 NM (100.0) Noninterest revenue 69.8 66.5 76.1 5.0 (8.2) Noninterest expense 128.0 126.7 142.3 1.0 (10.1) Income before income taxes 45.0 41.3 29.1 8.8 54.7 Income tax provision 14.1 12.9 8.3 9.4 69.5 Net income 30.9 $ 28.4 $ 20.8 $ 8.5 % 48.7 % Net income per share: diluted 0.32 $ 0.30 $ 0.22 $ 6.7 % 45.5 % Three Months Ended % Change vs 6/30/13 4 |
 Noninterest Revenue Dollars in thousands 5 6/30/14 3/31/14 6/30/13 vs 3/31/14 Mortgage lending revenue 9,089 3,394 17,892 167.8 (49.2) Credit card, debit card and merchant fees 8,567 7,843 8,324 9.2 2.9 Deposit service charges 12,437 12,536 12,824 (0.8) (3.0) Insurance commissions 28,621 31,599 25,862 (9.4) 10.7 Wealth management 5,828 5,916 5,802 (1.5) 0.4 Other 5,296 5,229 5,405 1.3 (2.0) Total noninterest revenue 69,838 $ 66,517 $ 76,109 $ 5.0 % (8.2) % % of total revenue 40.4% 39.6% 43.7% Three Months Ended % Change vs 6/30/13 |
 Mortgage and Insurance Revenue Dollars in thousands Mortgage Lending Revenue 6/30/14 3/31/14 12/31/13 9/30/13 6/30/13 Origination revenue 8,758 $ 1,964 $ 3,590 $ 2,862 $ 10,471 $ Servicing revenue 4,058 4,115 4,361 4,072 3,908 MSR payoffs/paydowns (1,616) (1,138) (1,240) (1,560) (1,739) MSR valuation adjustment (2,111) (1,547) 2,894 (240) 5,252 Total mortgage lending revenue 9,089 $ 3,394 $ 9,605 $ 5,134 $ 17,892 $ Production volume 291,010 $ 197,110 $ 222,282 $ 341,854 $ 434,966 $ Purchase money production 241,538 $ 143,890 $ 160,043 $ 229,042 $ 226,182 $ Mortgage loans sold 264,478 $ 143,213 $ 200,665 $ 371,271 $ 424,355 $ Margin on loans sold 3.31% 1.37% 1.79% 0.77% 2.47% Insurance Commission Revenue Property and casualty commissions 21,576 $ 19,987 $ 15,588 $ 18,372 $ 18,762 $ Life and health commissions 5,549 5,010 4,525 4,061 5,093 Risk management income 617 705 648 628 573 Other 879 5,897 636 739 1,434 Total insurance commissions 28,621 $ 31,599 $ 21,397 $ 23,800 $ 25,862 $ Three Months Ended 6 |
 Loan Portfolio Dollars in millions Net loans and leases As of 6/30/14 3/31/14 6/30/13 Commercial and industrial 1,700 $ 1,581 $ 1,553 $ 30.1 % 9.5 % Real estate: Consumer mortgages 2,072 2,047 1,880 4.8 10.2 Home equity 507 498 482 7.0 5.2 Agricultural 238 230 238 14.7 0.0 Commercial and industrial-owner occupied 1,506 1,488 1,376 4.7 9.4 Construction, acquisition and development 772 748 709 12.9 8.8 Commercial 1,902 1,848 1,755 11.7 8.4 Credit Cards 109 106 103 12.1 5.7 Other 507 522 582 (11.7) (13.0) Total 9,312 $ 9,068 $ 8,679 $ 10.8 % 7.3 % vs 6/30/13 % Change vs 3/31/14 Annualized 7 |
 NPLs decreased $19.6 million, or 21.0%, and NPAs declined $27.9 million, or 17.8%, quarter over quarter OREO decreased $8.3 million, or 13.1%, quarter over quarter Near-term delinquencies remained stable at $28.8 million No provision for credit losses recorded, which is consistent with no recorded provision for the first quarter of 2014 and a decline from $3.0 million for the second quarter of 2013 Net charge-offs were $2.6 million for the second quarter compared with $3.5 million for the first quarter of 2014 and $4.6 million for the second quarter of 2013 57% of non-accrual loans were paying as agreed Credit Quality Highlights As of and for the three months ended June 30, 2014 “Paying as agreed” includes loans < 30 days past due with payments occurring at least quarterly 8 |
 Non-Performing Loans Dollars in millions Net loans and leases As of 6/30/14 3/31/14 6/30/13 Commercial and industrial 3.8 $ 4.9 $ 6.5 $ (23.2) % (41.8) % Real estate: Consumer mortgages 26.7 27.8 37.6 (3.9) (29.0) Home equity 2.2 2.8 3.9 (19.4) (42.2) Agricultural 0.7 1.3 5.4 (45.5) (87.2) Commercial and industrial-owner occupied 12.8 18.7 21.1 (31.6) (39.4) Construction, acquisition and development 10.3 11.6 46.0 (10.9) (77.6) Commercial 14.9 23.5 42.6 (36.5) (65.0) Credit Cards 1.5 1.7 2.3 (12.4) (37.2) Other 0.8 1.1 2.5 (27.0) (67.5) Total 73.7 $ 93.3 $ 167.9 $ (21.0) % (56.1) % NPL's to net loans and leases 0.79% 1.03% 1.94% % Change vs 3/31/14 vs 6/30/13 9 |
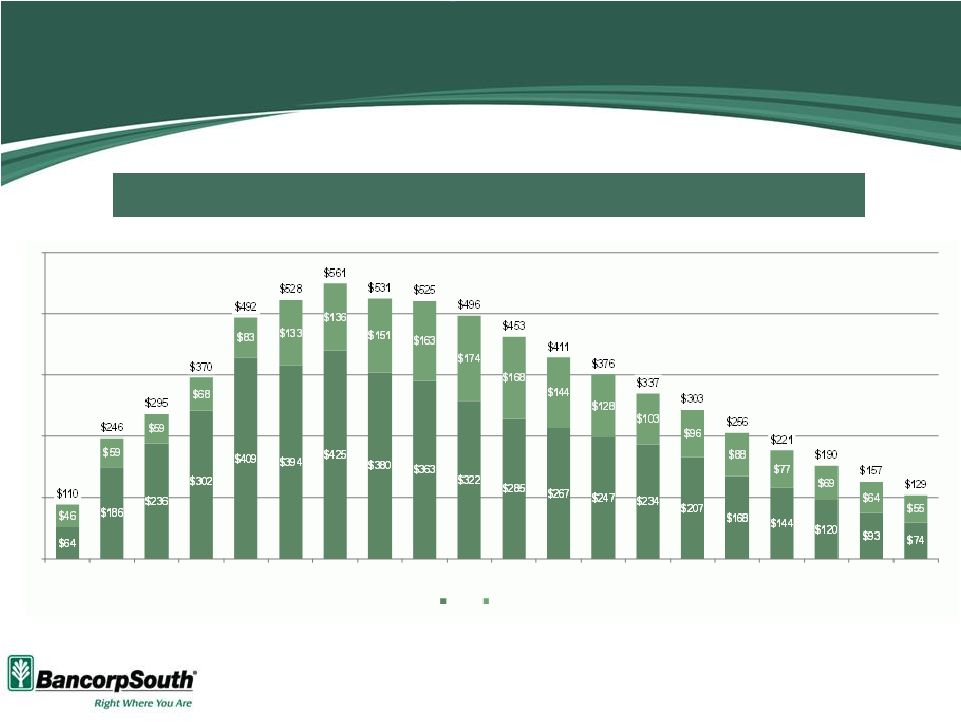 NPA Improvement Total NPAs Have Declined 50% in the Last 12 Months NPAs consist of NPLs and other real estate owned NPLs consist of nonaccrual loans, loans 90+ days past due and restructured loans 10 Dollars in millions $0 $125 $250 $375 $500 $625 4Q 08 4Q 09 1Q 10 2Q 10 3Q 10 4Q 10 1Q 11 2Q 11 3Q 11 4Q 11 1Q 12 2Q 12 3Q 12 4Q 12 1Q 13 2Q 13 3Q 13 4Q 13 1Q 14 2Q 14 NPLs OREO |
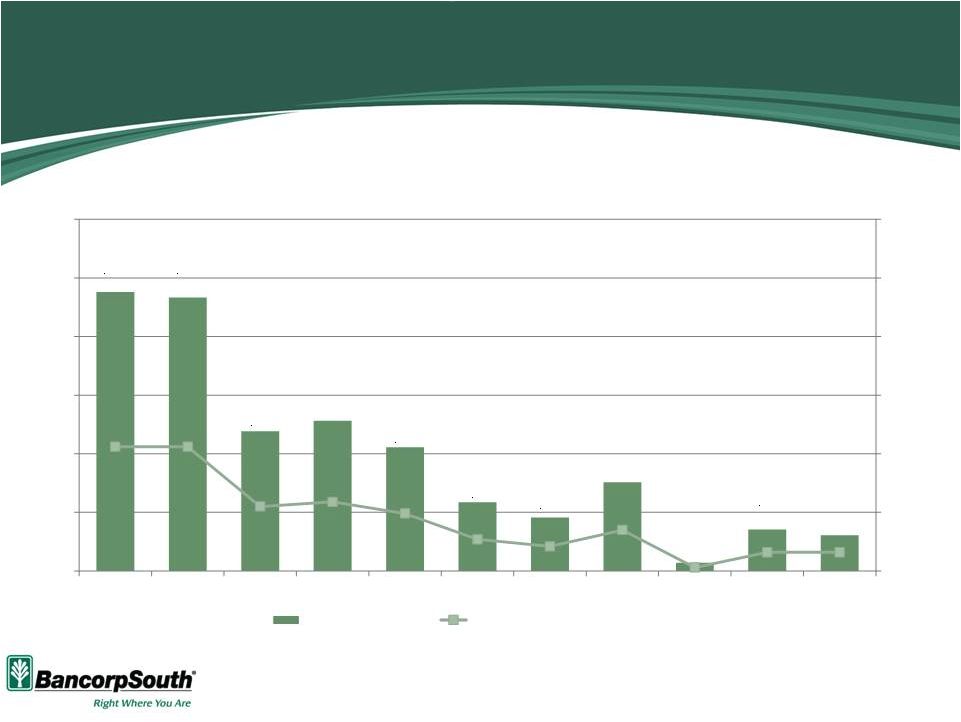 Dollars in millions Net Charge-offs % Avg. Loans 11 $24 $23 $12 $13 $11 $6 $5 $8 $1 $4 $3 0.0% 0.5% 1.0% 1.5% 2.0% 2.5% 3.0% $0 $5 $10 $15 $20 $25 $30 12/31/11 3/31/12 6/30/12 9/30/12 12/31/12 3/31/13 6/30/13 9/30/13 12/31/13 3/31/14 6/30/14 Net charge-offs Net charge-offs / average loans Net charge-offs for the quarters ended as of the dates shown |
 Summary Non-Financial Highlights Extension of merger agreements President and COO succession Management restructure Acquisition of Knox Insurance Group, LLC Financial Highlights Improvement in GAAP and operating earnings Meaningful loan growth Steady net interest margin Progress toward reducing expenses Continued credit quality improvement Q&A 12 |