
Term Portfolio
Government Portfolio
Semi-Annual Report
December 31, 2018
Contents
To view a fund's proxy voting guidelines and proxy voting record for the 12-month period ended June 30, visit http://www.fidelity.com/proxyvotingresults or visit the Securities and Exchange Commission's (SEC) web site at http://www.sec.gov.
You may also call 1-800-222-3232 to request a free copy of the proxy voting guidelines.
Standard & Poor's, S&P and S&P 500 are registered service marks of The McGraw-Hill Companies, Inc. and have been licensed for use by Fidelity Distributors Corporation.
Other third-party marks appearing herein are the property of their respective owners.
All other marks appearing herein are registered or unregistered trademarks or service marks of FMR LLC or an affiliated company. © 2019 FMR LLC. All rights reserved.
This report and the financial statements contained herein are submitted for the general information of the shareholders of the Fund. This report is not authorized for distribution to prospective investors in the Fund unless preceded or accompanied by an effective prospectus.
A fund files its complete schedule of portfolio holdings with the SEC for the first and third quarters of each fiscal year on Form N-Q. Forms N-Q are available on the SEC’s web site at http://www.sec.gov. A fund's Forms N-Q may be reviewed and copied at the SEC’s Public Reference Room in Washington, DC. Information regarding the operation of the SEC's Public Reference Room may be obtained by calling 1-800-SEC-0330.
NOT FDIC INSURED •MAY LOSE VALUE •NO BANK GUARANTEE
Neither the Fund nor Fidelity Distributors Corporation is a bank.
The North Carolina Capital Management Trust: Term Portfolio
Investment Summary (Unaudited)
Asset Allocation (% of fund's net assets)
| As of December 31, 2018 |
| | Commercial Paper | 100.4% |
| | Other Short-Term Investments and Net Other Assets (Liabilities)* | (0.4)% |

* Short-Term Investments and Net Other Assets (Liabilities) are not included in the pie chart
The North Carolina Capital Management Trust: Term Portfolio
Schedule of Investments December 31, 2018 (Unaudited)
Showing Percentage of Net Assets
| Commercial Paper - 100.4% | | | |
| | | Principal Amount | Value |
| ASB Finance Ltd. (London) 1 month U.S. LIBOR + 0.180% 2.5293% 2/1/19 (a)(b) | | 35,000,000 | 35,006,125 |
| Atlantic Asset Securitization Corp.: | | | |
| 1 month U.S. LIBOR + 0.170% 2.6494% 2/21/19 (a)(b) | | $20,000,000 | $19,999,712 |
| 2.45% 1/23/19 (Liquidity Facility Credit Agricole CIB) | | 25,000,000 | 24,958,855 |
| 2.64% 2/19/19 (Liquidity Facility Credit Agricole CIB) | | 40,000,000 | 39,850,724 |
| 2.72% 2/19/19 (Liquidity Facility Credit Agricole CIB) | | 18,000,000 | 17,932,826 |
| 2.75% 3/4/19 (Liquidity Facility Credit Agricole CIB) | | 40,000,000 | 39,808,832 |
| 2.83% 3/12/19 (Liquidity Facility Credit Agricole CIB) | | 4,000,000 | 3,978,014 |
| 2.83% 3/12/19 (Liquidity Facility Credit Agricole CIB) | | 4,000,000 | 3,978,014 |
| 2.85% 3/26/19 (Liquidity Facility Credit Agricole CIB) | | 22,000,000 | 21,850,140 |
| Australia & New Zealand Banking Group Ltd.: | | | |
| 1 month U.S. LIBOR + 0.110% 2.565% 3/18/19 (a)(b) | | 40,000,000 | 39,998,280 |
| yankee 2.58% 2/7/19 | | 40,000,000 | 39,892,248 |
| Bank of Montreal yankee: | | | |
| 2.36% 1/18/19 | | 40,000,000 | 39,950,160 |
| 2.42% 1/25/19 | | 35,000,000 | 34,938,603 |
| 2.656% 3/6/19 | | 30,000,000 | 29,856,459 |
| 2.83% 3/25/19 | | 40,000,000 | 39,742,028 |
| Bank of Nova Scotia: | | | |
| 1 month U.S. LIBOR + 0.150% 2.6563% 3/25/19 (a)(b) | | 15,000,000 | 15,000,435 |
| 1 month U.S. LIBOR + 0.160% 2.615% 4/18/19 (a)(b) | | 40,000,000 | 39,993,800 |
| 1 month U.S. LIBOR + 0.250% 2.6901% 1/14/19 (a)(b) | | 30,000,000 | 30,002,940 |
| 1 month U.S. LIBOR + 0.250% 2.7538% 5/22/19 (a)(b) | | 12,000,000 | 11,999,364 |
| 2.5193% 5/2/19 (a)(b) | | 19,000,000 | 18,995,402 |
| Barclays Bank PLC/Barclays U.S. CCP Funding LLC yankee: | | | |
| 2.45% 1/4/19 (c) | | 20,000,000 | 19,994,740 |
| 2.5% 1/9/19 (c) | | 6,000,000 | 5,996,393 |
| 2.5% 1/10/19 (c) | | 5,000,000 | 4,996,650 |
| 2.73% 2/19/19 (c) | | 4,000,000 | 3,984,628 |
| 2.78% 2/26/19 (c) | | 4,000,000 | 3,982,330 |
| BPCE SA yankee 2.64% 2/1/19 | | 40,000,000 | 39,911,076 |
| Canadian Imperial Bank of Commerce: | | | |
| 1 month U.S. LIBOR + 0.150% 2.605% 3/18/19 (a)(b) | | 15,000,000 | 15,000,630 |
| 1 month U.S. LIBOR + 0.240% 2.695% 5/20/19 (a)(b) | | 40,000,000 | 39,995,840 |
| 1 month U.S. LIBOR + 0.240% 2.7096% 2/19/19 (a)(b) | | 25,000,000 | 25,006,275 |
| 1 month U.S. LIBOR + 0.330% 2.7089% 8/5/19 (a)(b) | | 25,000,000 | 25,001,150 |
| 3 month U.S. LIBOR + 0.090% 2.5672% 1/23/19 (a)(b) | | 20,000,000 | 20,000,260 |
| 3 month U.S. LIBOR + 0.120% 2.5563% 1/14/19 (a)(b) | | 35,000,000 | 35,000,763 |
| Commonwealth Bank of Australia: | | | |
| 1 month U.S. LIBOR + 0.290% 2.6695% 6/6/19 (a)(b) | | 12,000,000 | 12,000,252 |
| 1 month U.S. LIBOR + 0.290% 2.6695% 6/7/19 (a)(b) | | 12,000,000 | 12,000,156 |
| yankee: | | | |
| 2.59% 2/11/19 | | 40,000,000 | 39,879,692 |
| 2.62% 2/19/19 | | 40,000,000 | 39,854,276 |
| Credit Agricole CIB yankee: | | | |
| 2.39% 1/2/19 | | 33,169,000 | 33,164,625 |
| 2.55% 2/1/19 | | 20,000,000 | 19,955,112 |
| Credit Suisse AG yankee: | | | |
| 2.67% 2/8/19 | | 20,000,000 | 19,944,404 |
| 2.84% 3/22/19 | | 40,000,000 | 39,749,532 |
| 2.87% 3/26/19 | | 30,000,000 | 29,801,100 |
| DNB Bank ASA: | | | |
| 1 month U.S. LIBOR + 0.130% 2.5701% 3/14/19 (a)(b) | | 70,000,000 | 70,001,257 |
| 1 month U.S. LIBOR + 0.180% 2.6351% 1/16/19 (a)(b) | | 20,000,000 | 20,001,580 |
| yankee: | | | |
| 2.39% 1/18/19 | | 25,000,000 | 24,969,988 |
| 2.67% 2/27/19 | | 40,000,000 | 39,832,960 |
| Federation des caisses Desjardin yankee: | | | |
| 2.41% 1/9/19 | | 40,000,000 | 39,975,572 |
| 2.5% 2/12/19 | | 40,000,000 | 39,876,112 |
| 2.56% 2/4/19 | | 30,000,000 | 29,925,129 |
| 2.65% 2/4/19 | | 6,400,000 | 6,384,028 |
| 2.76% 3/18/19 | | 35,000,000 | 34,796,528 |
| 2.84% 3/18/19 | | 12,000,000 | 11,930,238 |
| Gotham Funding Corp. yankee: | | | |
| 2.6% 1/28/19 (Liquidity Facility Bank of Tokyo-Mitsubishi UFJ Ltd.) | | 30,000,000 | 29,940,429 |
| 2.73% 2/19/19 (Liquidity Facility Bank of Tokyo-Mitsubishi UFJ Ltd.) | | 3,000,000 | 2,989,054 |
| 2.73% 2/21/19 (Liquidity Facility Bank of Tokyo-Mitsubishi UFJ Ltd.) | | 5,000,000 | 4,980,999 |
| 2.79% 3/4/19 (Liquidity Facility Bank of Tokyo-Mitsubishi UFJ Ltd.) | | 30,000,000 | 29,859,405 |
| 2.81% 3/1/19 (Liquidity Facility Bank of Tokyo-Mitsubishi UFJ Ltd.) | | 11,000,000 | 10,951,416 |
| 2.81% 3/4/19 (Liquidity Facility Bank of Tokyo-Mitsubishi UFJ Ltd.) | | 11,000,000 | 10,948,449 |
| 2.81% 3/6/19 (Liquidity Facility Bank of Tokyo-Mitsubishi UFJ Ltd.) | | 15,000,000 | 14,926,956 |
| HSBC Bank PLC 1 month U.S. LIBOR + 0.270% 2.7738% 5/22/19 (a)(b) | | 40,000,000 | 40,001,040 |
| J.P. Morgan Securities, LLC: | | | |
| 1 month U.S. LIBOR + 0.150% 2.5369% 2/8/19 (a)(b) | | 25,000,000 | 25,002,975 |
| 1 month U.S. LIBOR + 0.170% 2.5193% 4/3/19 (a)(b) | | 14,000,000 | 14,000,098 |
| 1 month U.S. LIBOR + 0.170% 2.5702% 3/11/19 (a)(b) | | 10,000,000 | 10,001,050 |
| 1 month U.S. LIBOR + 0.170% 2.6763% 3/25/19 (a)(b) | | 12,000,000 | 12,000,900 |
| 1 month U.S. LIBOR + 0.170% 2.6763% 3/25/19 (a)(b) | | 17,000,000 | 17,001,275 |
| 1 month U.S. LIBOR + 0.200% 2.5869% 4/9/19 (a)(b) | | 15,000,000 | 15,000,405 |
| 1 month U.S. LIBOR + 0.200% 2.6551% 4/16/19 (a)(b) | | 25,000,000 | 24,999,575 |
| 1 month U.S. LIBOR + 0.270% 2.6169% 1/4/19 (a)(b) | | 35,000,000 | 35,000,875 |
| 1 month U.S. LIBOR + 0.350% 2.7502% 6/11/19 (a)(b) | | 35,000,000 | 35,004,445 |
| Liberty Street Funding LLC: | | | |
| 2.4% 1/18/19 (Liquidity Facility Bank of Nova Scotia) | | 40,000,000 | 39,949,600 |
| 2.81% 3/11/19 (Liquidity Facility Bank of Nova Scotia) | | 40,000,000 | 39,787,432 |
| Manhattan Asset Funding Co. LLC: | | | |
| 2.37% 1/2/19 (Liquidity Facility Sumitomo Mitsui Banking Corp.) | | 40,000,000 | 39,994,532 |
| 2.41% 1/7/19 (Liquidity Facility Sumitomo Mitsui Banking Corp.) | | 24,000,000 | 23,988,427 |
| 2.51% 1/16/19 (Liquidity Facility Sumitomo Mitsui Banking Corp.) | | 15,000,000 | 14,983,247 |
| Mitsubishi UFJ Trust & Banking Corp. yankee: | | | |
| 2.64% 2/13/19 | | 35,000,000 | 34,887,965 |
| 2.66% 2/4/19 | | 8,000,000 | 7,980,026 |
| 2.66% 2/7/19 | | 8,000,000 | 7,978,171 |
| 2.86% 3/20/19 | | 40,000,000 | 39,753,784 |
| Mizuho Corporate Bank Ltd.: | | | |
| 2.47% 1/15/19 | | 40,000,000 | 39,959,000 |
| 2.7% 2/26/19 | | 40,000,000 | 39,833,560 |
| 2.73% 2/28/19 | | 25,000,000 | 24,891,998 |
| Natexis Banques Populaires New York Branch yankee 2.51% 1/31/19 | | 40,000,000 | 39,913,684 |
| National Australia Bank Ltd.: | | | |
| 1 month U.S. LIBOR + 0.120% 2.5751% 4/16/19 (a)(b) | | 40,000,000 | 39,989,920 |
| 1 month U.S. LIBOR + 0.150% 2.5369% 5/9/19 (a)(b) | | 40,000,000 | 39,984,920 |
| 1 month U.S. LIBOR + 0.170% 2.6024% 6/13/19 (a)(b) | | 40,000,000 | 39,977,520 |
| 1 month U.S. LIBOR + 0.270% 2.7494% 5/21/19 (a)(b) | | 40,000,000 | 40,000,600 |
| National Bank of Canada: | | | |
| 1 month U.S. LIBOR + 0.150% 2.4969% 4/4/19 (a)(b) | | 40,000,000 | 39,997,680 |
| 1 month U.S. LIBOR + 0.150% 2.5824% 3/13/19 (a)(b) | | 25,000,000 | 25,001,700 |
| 1 month U.S. LIBOR + 0.150% 2.6563% 3/27/19 (a)(b) | | 35,000,000 | 35,000,630 |
| 1 month U.S. LIBOR + 0.200% 2.5869% 5/9/19 (a)(b) | | 35,000,000 | 34,993,035 |
| 1 month U.S. LIBOR + 0.250% 2.705% 1/18/19 (a)(b) | | 35,000,000 | 35,004,235 |
| Nationwide Building Society yankee: | | | |
| 2.66% 2/7/19 | | 13,000,000 | 12,964,363 |
| 2.66% 2/12/19 | | 17,000,000 | 16,946,941 |
| Omers Finance Trust 2.78% 3/11/19 (c) | | 40,000,000 | 39,787,432 |
| Ontario Teachers' Finance Trust yankee: | | | |
| 2.42% 1/14/19 (c) | | 6,000,000 | 5,994,230 |
| 2.5% 1/18/19 (c) | | 10,000,000 | 9,987,500 |
| 2.72% 3/18/19 (c) | | 25,000,000 | 24,853,058 |
| PSP Capital, Inc. yankee: | | | |
| 2.35% 1/18/19 (c) | | 40,000,000 | 39,951,000 |
| 2.39% 1/23/19 (c) | | 40,000,000 | 39,936,596 |
| 2.4% 1/28/19 (c) | | 40,000,000 | 39,921,944 |
| 2.48% 1/11/19 (c) | | 40,000,000 | 39,970,668 |
| Royal Bank of Canada: | | | |
| 1 month U.S. LIBOR + 0.160% 2.5395% 5/6/19 (a)(b) | | 40,000,000 | 39,987,400 |
| 1 month U.S. LIBOR + 0.170% 2.5169% 6/4/19 (a)(b) | | 40,000,000 | 39,979,720 |
| 1 month U.S. LIBOR + 0.180% 2.5293% 7/1/19 (a)(b) | | 40,000,000 | 39,967,280 |
| 1 month U.S. LIBOR + 0.210% 2.665% 4/18/19 (a)(b) | | 30,000,000 | 29,999,760 |
| yankee 2.39% 1/18/19 | | 40,000,000 | 39,950,000 |
| Skandinaviska Enskilda Banken AB yankee: | | | |
| 2.65% 2/26/19 | | 40,000,000 | 39,834,192 |
| 2.705% 3/11/19 | | 40,000,000 | 39,792,100 |
| Sumitomo Mitsui Banking Corp. yankee: | | | |
| 2.43% 1/25/19 | | 30,000,000 | 29,948,499 |
| 2.7% 2/25/19 | | 30,000,000 | 29,879,367 |
| 2.74% 3/15/19 | | 40,000,000 | 39,782,028 |
| Sumitomo Mitsui Trust Bank Ltd. yankee: | | | |
| 2.51% 1/15/19 | | 20,000,000 | 19,979,250 |
| 2.555% 1/17/19 | | 12,000,000 | 11,985,851 |
| 2.56% 1/22/19 | | 4,000,000 | 3,993,857 |
| 2.7% 2/20/19 | | 30,000,000 | 29,889,075 |
| 2.75% 2/25/19 | | 30,000,000 | 29,877,408 |
| 2.83% 3/15/19 | | 25,000,000 | 24,859,040 |
| 2.85% 3/18/19 | | 39,000,000 | 38,769,354 |
| Sumitomo Trust & Banking Co. Ltd. yankee 2.55% 1/17/19 | | 29,000,000 | 28,965,806 |
| Swedbank AB yankee 2.56% 2/5/19 | | 40,000,000 | 39,900,560 |
| The Toronto-Dominion Bank: | | | |
| 1 month U.S. LIBOR + 0.150% 2.6294% 3/21/19 (a)(b) | | 20,000,000 | 20,000,000 |
| 1 month U.S. LIBOR + 0.180% 2.5802% 5/13/19 (a)(b) | | 25,000,000 | 24,992,550 |
| 1 month U.S. LIBOR + 0.250% 2.6502% 1/11/19 (a)(b) | | 30,000,000 | 30,001,890 |
| 1 month U.S. LIBOR + 0.250% 2.7563% 1/25/19 (a)(b) | | 25,000,000 | 25,004,725 |
| 1 month U.S. LIBOR + 0.300% 2.7696% 6/19/19 (a)(b) | | 30,000,000 | 30,000,090 |
| 3 month U.S. LIBOR + 0.150% 2.7511% 5/9/19 (a)(b) | | 30,000,000 | 29,999,793 |
| yankee 2.5% 1/2/19 | | 34,000,000 | 33,995,607 |
| Total Capital Canada Ltd. yankee 2.5% 1/4/19 | | 35,000,000 | 34,990,501 |
| Toyota Credit Canada, Inc. yankee 2.65% 3/11/19 | | 30,000,000 | 29,845,416 |
| Toyota Motor Credit Corp.: | | | |
| 1 month U.S. LIBOR + 0.210% 2.5969% 1/7/19 (a)(b) | | 13,000,000 | 13,000,416 |
| 1 month U.S. LIBOR + 0.210% 2.6102% 1/8/19 (a)(b) | | 9,000,000 | 9,000,414 |
| 1 month U.S. LIBOR + 0.250% 2.7538% 4/23/19 (a)(b) | | 10,000,000 | 10,001,010 |
| 1 month U.S. LIBOR + 0.250% 2.7538% 4/24/19 (a)(b) | | 10,000,000 | 10,000,930 |
| 1 month U.S. LIBOR + 0.280% 2.7005% 6/10/19 (a)(b) | | 40,000,000 | 39,997,720 |
| U.S. SOFR SEC OVRN FIN RATE INDX + 0.250% 2.71% 1/17/19 (a)(b) | | 40,000,000 | 39,999,792 |
| UBS AG London Branch: | | | |
| 1 month U.S. LIBOR + 0.180% 2.5293% 4/3/19 (a)(b) | | 20,000,000 | 20,000,640 |
| 1 month U.S. LIBOR + 0.180% 2.5669% 4/9/19 (a)(b) | | 20,000,000 | 19,999,440 |
| 1 month U.S. LIBOR + 0.180% 2.635% 3/18/19 (a)(b) | | 26,000,000 | 26,002,756 |
| 1 month U.S. LIBOR + 0.180% 2.6838% 3/25/19 (a)(b) | | 33,000,000 | 32,999,307 |
| 1 month U.S. LIBOR + 0.220% 2.7263% 2/25/19 (a)(b) | | 35,000,000 | 35,008,680 |
| 3 month U.S. LIBOR + 0.140% 2.7215% 5/7/19 (a)(b) | | 19,000,000 | 18,999,884 |
| Westpac Banking Corp.: | | | |
| 1 month U.S. LIBOR + 0.270% 2.7401% 5/20/19 (a)(b) | | 40,000,000 | 40,000,720 |
| 1 month U.S. LIBOR + 0.280% 2.6595% 6/6/19 (a)(b) | | 40,000,000 | 39,998,560 |
| yankee 2.7% 3/5/19 | | 40,000,000 | 39,811,768 |
| TOTAL COMMERCIAL PAPER | | | |
| (Cost $3,928,564,885) | | | 3,928,414,137 |
| TOTAL INVESTMENT IN SECURITIES - 100.4% | | | |
| (Cost $3,928,564,885) | | | 3,928,414,137 |
| NET OTHER ASSETS (LIABILITIES) - (0.4)% | | | (14,648,047) |
| NET ASSETS - 100% | | | $3,913,766,090 |
Legend
(a) Coupon rates for floating and adjustable rate securities reflect the rates in effect at period end.
(b) Coupon is indexed to a floating interest rate which may be multiplied by a specified factor and/or subject to caps or floors.
(c) Security exempt from registration under Rule 144A of the Securities Act of 1933. These securities may be resold in transactions exempt from registration, normally to qualified institutional buyers. At the end of the period, the value of these securities amounted to $279,357,169 or 7.1% of net assets.
Investment Valuation
All investments are categorized as Level 2 under the Fair Value Hierarchy. The inputs or methodology used for valuing securities may not be an indication of the risk associated with investing in those securities. For more information on valuation inputs please refer to the Investment Valuation section in the accompanying Notes to Financial Statements.
Other Information
Distribution of investments by country or territory of incorporation, as a percentage of Total Net Assets, is as follows (Unaudited):
| Canada | 33.3% |
| United States of America | 32.6% |
| Australia | 11.6% |
| United Kingdom | 6.6% |
| Singapore | 5.4% |
| Norway | 3.9% |
| Sweden | 3.0% |
| Japan | 2.6% |
| France | 1.0% |
| | 100.0% |
See accompanying notes which are an integral part of the financial statements.
The North Carolina Capital Management Trust: Term Portfolio
Financial Statements
Statement of Assets and Liabilities
| | | December 31, 2018 (Unaudited) |
| Assets | | |
Investment in securities, at value — See accompanying schedule:
Unaffiliated issuers (cost $3,928,564,885) | | $3,928,414,137 |
| Receivable for fund shares sold | | 55,908,818 |
| Interest receivable | | 2,719,012 |
| Receivable from investment adviser for expense reductions | | 23,860 |
| Total assets | | 3,987,065,827 |
| Liabilities | | |
| Payable to custodian bank | $301 | |
| Payable for fund shares redeemed | 72,479,899 | |
| Distributions payable | 96,153 | |
| Accrued management fee | 723,384 | |
| Total liabilities | | 73,299,737 |
| Net Assets | | $3,913,766,090 |
| Net Assets consist of: | | |
| Paid in capital | | $3,914,426,249 |
| Total distributable earnings (loss) | | (660,159) |
| Net Assets, for 404,384,555 shares outstanding | | $3,913,766,090 |
| Net Asset Value, offering price and redemption price per share ($3,913,766,090 ÷ 404,384,555 shares) | | $9.68 |
See accompanying notes which are an integral part of the financial statements.
Statement of Operations
| | | Six months ended December 31, 2018 (Unaudited) |
| Investment Income | | |
| Interest | | $45,789,215 |
| Expenses | | |
| Management fee | $4,451,949 | |
| Independent trustees' fees and expenses | 41,910 | |
| Total expenses before reductions | 4,493,859 | |
| Expense reductions | (353,526) | |
| Total expenses after reductions | | 4,140,333 |
| Net investment income (loss) | | 41,648,882 |
| Realized and Unrealized Gain (Loss) | | |
| Net realized gain (loss) on: | | |
| Investment securities: | | |
| Unaffiliated issuers | | 10,334 |
| Total net realized gain (loss) | | 10,334 |
| Change in net unrealized appreciation (depreciation) on investment securities | | (624,161) |
| Net gain (loss) | | (613,827) |
| Net increase (decrease) in net assets resulting from operations | | $41,035,055 |
See accompanying notes which are an integral part of the financial statements.
Statement of Changes in Net Assets
| | Six months ended December 31, 2018 (Unaudited) | Year ended June 30, 2018 |
| Increase (Decrease) in Net Assets | | |
| Operations | | |
| Net investment income (loss) | $41,648,882 | $48,651,081 |
| Net realized gain (loss) | 10,334 | 64,472 |
| Change in net unrealized appreciation (depreciation) | (624,161) | 277,301 |
| Net increase (decrease) in net assets resulting from operations | 41,035,055 | 48,992,854 |
| Distributions to shareholders | (42,053,002) | – |
| Distributions to shareholders from net investment income | – | (48,652,096) |
| Total distributions | (42,053,002) | (48,652,096) |
| Share transactions | | |
| Proceeds from sales of shares | 1,918,826,150 | 2,683,314,932 |
| Reinvestment of distributions | 41,524,693 | 47,735,695 |
| Cost of shares redeemed | (1,569,005,186) | (1,953,497,938) |
| Net increase (decrease) in net assets resulting from share transactions | 391,345,657 | 777,552,689 |
| Total increase (decrease) in net assets | 390,327,710 | 777,893,447 |
| Net Assets | | |
| Beginning of period | 3,523,438,380 | 2,745,544,933 |
| End of period | $3,913,766,090 | $3,523,438,380 |
| Other Information | | |
| Distributions in excess of net investment income end of period | | $(115,625) |
| Shares | | |
| Sold | 198,225,842 | 277,201,956 |
| Issued in reinvestment of distributions | 4,289,741 | 4,931,373 |
| Redeemed | (162,087,313) | (201,807,719) |
| Net increase (decrease) | 40,428,270 | 80,325,610 |
See accompanying notes which are an integral part of the financial statements.
Financial Highlights
Term Portfolio
| | Six months ended (Unaudited) December 31, | Years endedJune 30, | | | | |
| | 2018 | 2018 | 2017 | 2016 | 2015 | 2014 |
| Selected Per–Share Data | | | | | | |
| Net asset value, beginning of period | $9.68 | $9.68 | $9.68 | $9.68 | $9.68 | $9.68 |
| Income from Investment Operations | | | | | | |
| Net investment income (loss)A | .107 | .144 | .078 | .030 | .008 | .010 |
| Net realized and unrealized gain (loss) | .001B | (.002)B | (.002) | –C | .001 | –C |
| Total from investment operations | .108 | .142 | .076 | .030 | .009 | .010 |
| Distributions from net investment income | (.108) | (.142) | (.075) | (.030) | (.008) | (.010) |
| Distributions from net realized gain | – | – | (.001) | – | (.001) | – |
| Total distributions | (.108) | (.142) | (.076) | (.030) | (.009) | (.010) |
| Net asset value, end of period | $9.68 | $9.68 | $9.68 | $9.68 | $9.68 | $9.68 |
| Total ReturnD,E | 1.12% | 1.48% | .78% | .31% | .09% | .10% |
| Ratios to Average Net AssetsF | | | | | | |
| Expenses before reductions | .24%G | .24% | .26% | .26% | .26% | .27% |
| Expenses net of fee waivers, if any | .22%G | .21% | .22% | .22% | .21% | .21% |
| Expenses net of all reductions | .22%G | .21% | .22% | .22% | .21% | .21% |
| Net investment income (loss) | 2.20%G | 1.49% | .81% | .31% | .08% | .10% |
| Supplemental Data | | | | | | |
| Net assets, end of period (000 omitted) | $3,913,766 | $3,523,438 | $2,745,545 | $1,430,057 | $1,683,467 | $1,415,470 |
| Portfolio turnover rate | - %G | -% | -% | -% | 902% | -% |
A Calculated based on average shares outstanding during the period.
B The amount shown for a share outstanding does not correspond with the aggregate net gain (loss) on investments for the period due to the timing of sales and repurchases of shares in relation to fluctuating market values of the investments of the Fund.
C Amount represents less than $.0005 per share.
D Total returns for periods of less than one year are not annualized.
E Total returns would have been lower if certain expenses had not been reduced during the applicable periods shown.
F Expense ratios reflect operating expenses of the Fund. Expenses before reductions do not reflect amounts reimbursed by the investment adviser or reductions from expense offset arrangements and do not represent the amount paid by the Fund during periods when reimbursements or reductions occur. Expenses net of fee waivers reflect expenses after reimbursement by the investment adviser but prior to reductions from expense offset arrangements. Expenses net of all reductions represent the net expenses paid by the Fund.
G Annualized
See accompanying notes which are an integral part of the financial statements.
The North Carolina Capital Management Trust: Government Portfolio
Investment Summary/Performance (Unaudited)
Effective Maturity Diversification as of December 31, 2018
| Days | % of fund's investments 12/31/18 |
| 1 - 7 | 25.8 |
| 8 - 30 | 42.1 |
| 31 - 60 | 13.6 |
| 61 - 90 | 12.5 |
| 91 - 180 | 5.3 |
| > 180 | 0.7 |
Effective maturity is determined in accordance with the requirements of Rule 2a-7 under the Investment Company Act of 1940.
Asset Allocation (% of fund's net assets)
| As of December 31, 2018 |
| | U.S. Treasury Debt | 26.9% |
| | U.S. Government Agency Debt | 72.3% |
| | Repurchase Agreements | 3.6% |
| | Net Other Assets (Liabilities)* | (2.8)% |

* Short-Term Investments and Net Other Assets (Liabilities) are not included in the pie chart
Current 7-Day Yields
| | 12/31/18 |
| Government Portfolio | 2.22% |
Yield refers to the income paid by the Fund over a given period. Yield for money market funds is usually for seven-day periods, as it is here, though it is expressed as an annual percentage rate. Past performance is no guarantee of future results. Yield will vary and it's possible to lose money investing in the Fund. A portion of the Fund's expenses was reimbursed and/or waived. Absent such reimbursements and/or waivers the yield for the period ending December 31, 2018, would have been 2.17%.
The North Carolina Capital Management Trust: Government Portfolio
Schedule of Investments December 31, 2018 (Unaudited)
Showing Percentage of Net Assets
| U.S. Treasury Debt - 26.9% | | | | |
| | | Yield(a) | Principal Amount | Value |
| U.S. Treasury Inflation Protected Obligations - 2.3% | | | | |
| U.S. Treasury Notes | | | | |
| 1/15/19 | | 2.39 to 2.40% | $142,519,850 | $142,452,558 |
| U.S. Treasury Obligations - 24.6% | | | | |
| U.S. Treasury Bills | | | | |
| 1/2/19 to 4/11/19 | | 2.16 to 2.48 | 1,032,200,000 | 1,029,495,100 |
| U.S. Treasury Notes | | | | |
| 1/31/19 to 4/30/20 | | 2.24 to 2.57 (b) | 479,600,000 | 479,509,048 |
| | | | | 1,509,004,148 |
| TOTAL U.S. TREASURY DEBT | | | | |
| (Cost $1,651,456,706) | | | | 1,651,456,706 |
|
| U.S. Government Agency Debt - 72.3% | | | | |
| Federal Agencies - 72.3% | | | | |
| Fannie Mae | | | | |
| 1/2/19 to 4/30/20 | | 2.19 to 2.57 (b) | 293,997,000 | 293,750,368 |
| Federal Farm Credit Bank | | | | |
| 1/23/19 to 12/23/19 | | 2.22 to 2.70 (b) | 534,800,000 | 533,376,318 |
| Federal Home Loan Bank | | | | |
| 1/2/19 to 6/10/20 | | 2.07 to 2.57 (b) | 3,282,040,000 | 3,278,138,454 |
| Federal Home Loan Bank | | | | |
| 9/20/19 to 10/15/19 | | 2.40 to 2.53 (c) | 31,000,000 | 30,999,589 |
| Freddie Mac | | | | |
| 1/3/19 to 8/8/19 | | 2.24 to 2.49 (b) | 285,999,000 | 285,639,121 |
| 9/20/19 | | 2.53 (c) | 14,000,000 | 14,000,000 |
| TOTAL U.S. GOVERNMENT AGENCY DEBT | | | | |
| (Cost $4,435,903,850) | | | | 4,435,903,850 |
| U.S. Treasury Repurchase Agreement - 3.6% | | | |
| | | Maturity Amount | Value |
| In a joint trading account at 2.93% dated 12/31/18 due 1/2/19 (Collateralized by U.S. Treasury Obligations) # | | $26,971,384 | $26,967,000 |
| With: | | | |
| Deutsche Bank Securities, Inc. at: | | | |
| 2.9%, dated 12/31/18 due 1/2/19 (Collateralized by U.S. Treasury Obligations valued at $1,020,241, 2.88%, 11/30/23) | | 1,000,161 | 1,000,000 |
| 3%, dated 12/31/18 due 1/2/19 | | | |
| (Collateralized by U.S. Treasury Obligations valued at $6,121,106, 0.00%, 1/8/19) | | 6,001,000 | 6,000,000 |
| (Collateralized by U.S. Treasury Obligations valued at $11,331,900, 2.75%, 11/15/47) | | 11,001,833 | 11,000,000 |
| HSBC Securities, Inc. at: | | | |
| 2.52%, dated 12/27/18 due 1/3/19 | | | |
| (Collateralized by U.S. Treasury Obligations valued at $17,347,356, 0.00% - 4.38%, 4/25/19 - 11/15/45) | | 17,008,330 | 17,000,000 |
| (Collateralized by U.S. Treasury Obligations valued at $8,163,431, 0.00% - 3.50%, 1/3/19 - 5/15/44) | | 8,003,920 | 8,000,000 |
| 2.95%, dated 12/31/18 due 1/2/19 (Collateralized by U.S. Treasury Obligations valued at $6,147,748, 1.25%, 3/31/21) | | 6,000,983 | 6,000,000 |
| Morgan Stanley & Co., LLC at: | | | |
| 2.5%, dated 12/31/18 due 1/2/19 (Collateralized by U.S. Treasury Obligations valued at $8,161,180, 0.00% - 6.13%, 6/20/19 - 5/15/46) | | 8,001,111 | 8,000,000 |
| 2.95%, dated 12/31/18 due 1/2/19 (Collateralized by U.S. Treasury Obligations valued at $17,342,897, 0.00% - 3.13%, 1/17/19 - 2/15/43) | | 17,002,786 | 17,000,000 |
| Nomura Securities International, Inc. at 2.95%, dated 12/31/18 due 1/2/19 (Collateralized by U.S. Treasury Obligations valued at $61,693,190, 2.25% - 2.75%, 7/31/21 - 8/15/47) | | 60,009,833 | 60,000,000 |
| Societe Generale at: | | | |
| 2.33%, dated 11/2/18 due 1/10/19 (Collateralized by U.S. Treasury Obligations valued at $7,175,490, 0.00% - 6.88%, 2/7/19 - 5/15/47) | | 7,031,261 | 7,000,000 |
| 2.4%, dated 12/3/18 due 1/11/19 (Collateralized by U.S. Treasury Obligations valued at $21,517,781, 2.25% - 8.13%, 7/31/20 - 8/15/46) | | 21,054,600 | 21,000,000 |
| 2.41%, dated 12/4/18 due 1/14/19 (Collateralized by U.S. Treasury Obligations valued at $10,309,948, 0.00% - 3.75%, 1/3/19 - 8/15/47) | | 10,027,447 | 10,000,000 |
| TD Securities (U.S.A.) at 2.95%, dated 12/31/18 due 1/2/19 (Collateralized by U.S. Treasury Obligations valued at $20,403,380, 1.63% - 2.25%, 7/31/20 - 12/31/24) | | 20,003,278 | 20,000,000 |
| TOTAL U.S. TREASURY REPURCHASE AGREEMENT | | | |
| (Cost $218,967,000) | | | 218,967,000 |
| TOTAL INVESTMENT IN SECURITIES - 102.8% | | | |
| (Cost $6,306,327,556) | | | 6,306,327,556 |
| NET OTHER ASSETS (LIABILITIES) - (2.8)% | | | (170,131,030) |
| NET ASSETS - 100% | | | $6,136,196,526 |
The date shown for securities represents the date when principal payments must be paid, taking into account any call options exercised by the issuer and any permissible maturity shortening features other than interest rate resets.
Legend
(a) Yield represents either the annualized yield at the date of purchase, or the stated coupon rate, or, for floating and adjustable rate securities, the rate at period end.
(b) Coupon rates for floating and adjustable rate securities reflect the rates in effect at period end.
(c) Security initially issued at one coupon which converts to a higher coupon at a specified date. The rate shown is the rate at period end.
Investment Valuation
All investments are categorized as Level 2 under the Fair Value Hierarchy. The inputs or methodology used for valuing securities may not be an indication of the risk associated with investing in those securities. For more information on valuation inputs please refer to the Investment Valuation section in the accompanying Notes to Financial Statements.
Other Information
# Additional information on each counterparty to the repurchase agreement is as follows:
| Repurchase Agreement / Counterparty | Value |
| $26,967,000 due 1/02/19 at 2.93% | |
| Bank of Nova Scotia | $14,967,000 |
| J.P. Morgan Securities, Inc. | 10,000,000 |
| Merrill Lynch, Pierce, Fenner & Smith, Inc. | 2,000,000 |
| | $26,967,000 |
See accompanying notes which are an integral part of the financial statements.
The North Carolina Capital Management Trust: Government Portfolio
Financial Statements
Statement of Assets and Liabilities
| | | December 31, 2018 (Unaudited) |
| Assets | | |
Investment in securities, at value (including repurchase agreements of $218,967,000) — See accompanying schedule:
Unaffiliated issuers (cost $6,306,327,556) | | $6,306,327,556 |
| Cash | | 175,926 |
| Receivable for investments sold | | 1,996,480 |
| Receivable for fund shares sold | | 900,000 |
| Interest receivable | | 7,831,018 |
| Receivable from investment adviser for expense reductions | | 37,985 |
| Total assets | | 6,317,268,965 |
| Liabilities | | |
| Payable for investments purchased | $160,343,685 | |
| Payable for fund shares redeemed | 19,019,508 | |
| Distributions payable | 822,124 | |
| Accrued management fee | 887,122 | |
| Total liabilities | | 181,072,439 |
| Net Assets | | $6,136,196,526 |
| Net Assets consist of: | | |
| Paid in capital | | $6,135,993,470 |
| Total distributable earnings (loss) | | 203,056 |
| Net Assets, for 6,133,421,045 shares outstanding | | $6,136,196,526 |
| Net Asset Value, offering price and redemption price per share ($6,136,196,526 ÷ 6,133,421,045 shares) | | $1.00 |
See accompanying notes which are an integral part of the financial statements.
Statement of Operations
| | | Six months ended December 31, 2018 (Unaudited) |
| Investment Income | | |
| Interest | | $55,257,273 |
| Expenses | | |
| Management fee | $5,877,634 | |
| Independent trustees' fees and expenses | 54,563 | |
| Total expenses before reductions | 5,932,197 | |
| Expense reductions | (1,386,862) | |
| Total expenses after reductions | | 4,545,335 |
| Net investment income (loss) | | 50,711,938 |
| Realized and Unrealized Gain (Loss) | | |
| Net realized gain (loss) on: | | |
| Investment securities: | | |
| Unaffiliated issuers | | 21,059 |
| Total net realized gain (loss) | | 21,059 |
| Net increase in net assets resulting from operations | | $50,732,997 |
See accompanying notes which are an integral part of the financial statements.
Statement of Changes in Net Assets
| | Six months ended December 31, 2018 (Unaudited) | Year ended June 30, 2018 |
| Increase (Decrease) in Net Assets | | |
| Operations | | |
| Net investment income (loss) | $50,711,938 | $61,155,425 |
| Net realized gain (loss) | 21,059 | 22,848 |
| Net increase in net assets resulting from operations | 50,732,997 | 61,178,273 |
| Distributions to shareholders | (50,558,626) | – |
| Distributions to shareholders from net investment income | – | (61,140,590) |
| Total distributions | (50,558,626) | (61,140,590) |
| Share transactions at net asset value of $1.00 per share | | |
| Proceeds from sales of shares | 8,358,146,970 | 13,668,680,055 |
| Reinvestment of distributions | 46,834,564 | 57,006,286 |
| Cost of shares redeemed | (7,187,860,275) | (13,497,328,694) |
| Net increase (decrease) in net assets and shares resulting from share transactions | 1,217,121,259 | 228,357,647 |
| Total increase (decrease) in net assets | 1,217,295,630 | 228,395,330 |
| Net Assets | | |
| Beginning of period | 4,918,900,896 | 4,690,505,566 |
| End of period | $6,136,196,526 | $4,918,900,896 |
See accompanying notes which are an integral part of the financial statements.
Financial Highlights
Government Portfolio
| | Six months ended (Unaudited) December 31, | Years endedJune 30, | | | | |
| | 2018 | 2018 | 2017 | 2016 | 2015 | 2014 |
| Selected Per–Share Data | | | | | | |
| Net asset value, beginning of period | $1.00 | $1.00 | $1.00 | $1.00 | $1.00 | $1.00 |
| Income from Investment Operations | | | | | | |
| Net investment income (loss) | .010 | .012 | .004 | .002 | –A | –A |
| Distributions from net investment income | (.010) | (.012) | (.004) | (.002) | –A | –A |
| Net asset value, end of period | $1.00 | $1.00 | $1.00 | $1.00 | $1.00 | $1.00 |
| Total ReturnB,C | .99% | 1.19% | .42% | .22% | .02% | .01% |
| Ratios to Average Net AssetsD | | | | | | |
| Expenses before reductions | .23%E | .23% | .23% | .24% | .24% | .24% |
| Expenses net of fee waivers, if any | .18%E | .18% | .18% | .18% | .17% | .17% |
| Expenses net of all reductions | .18%E | .18% | .18% | .18% | .17% | .17% |
| Net investment income (loss) | 1.97%E | 1.19% | .42% | .24% | .02% | .01% |
| Supplemental Data | | | | | | |
| Net assets, end of period (000 omitted) | $6,136,197 | $4,918,901 | $4,690,506 | $4,866,955 | $3,643,774 | $3,232,290 |
A Amount represents less than $.0005 per share.
B Total returns for periods of less than one year are not annualized.
C Total returns would have been lower if certain expenses had not been reduced during the applicable periods shown.
D Expense ratios reflect operating expenses of the Fund. Expenses before reductions do not reflect amounts reimbursed or waived or reductions from expense offset arrangements and do not represent the amount paid by the Fund during periods when reimbursements, waivers or reductions occur. Expenses net of fee waivers reflect expenses after reimbursement and waivers but prior to reductions from expense offset arrangements. Expenses net of all reductions represent the net expenses paid by the Fund.
E Annualized
See accompanying notes which are an integral part of the financial statements.
Notes to Financial Statements (Unaudited)
For the period ended December 31, 2018
1. Organization.
Government Portfolio and Term Portfolio (the Funds) are funds of The North Carolina Capital Management Trust (the Trust). The Trust is registered under the Investment Company Act of 1940, as amended (the 1940 Act), as an open-end management investment company organized as a Massachusetts business trust. Shares of the Trust are offered exclusively to local government and public authorities of the state of North Carolina. Each Fund is authorized to issue an unlimited number of shares. Share transactions on the Statement of Changes in Net Assets may contain exchanges between affiliated funds.
2. Significant Accounting Policies.
Each Fund is an investment company and applies the accounting and reporting guidance of the Financial Accounting Standards Board (FASB) Accounting Standards Codification Topic 946 Financial Services – Investments Companies. The financial statements have been prepared in conformity with accounting principles generally accepted in the United States of America (GAAP), which require management to make certain estimates and assumptions at the date of the financial statements. Actual results could differ from those estimates. Subsequent events, if any, through the date that the financial statements were issued have been evaluated in the preparation of the financial statements. The following summarizes the significant accounting policies of the Funds:
Investment Valuation. Investments are valued as of 4:00 p.m. Eastern time on the last calendar day of the period. The Board of Trustees (the Board) has delegated the day to day responsibility for the valuation of the Term Portfolio's investments to the Fair Value Committee (the Committee) established by the Term Portfolio's investment adviser. In accordance with valuation policies and procedures approved by the Board, the Term Portfolio attempts to obtain prices from one or more third party pricing vendors or brokers to value its investments. When current market prices, quotations or currency exchange rates are not readily available or reliable, investments will be fair valued in good faith by the Committee, in accordance with procedures adopted by the Board. Factors used in determining fair value vary by investment type and may include market or investment specific events, changes in interest rates and credit quality. The frequency with which these procedures are used cannot be predicted and they may be utilized to a significant extent. The Committee oversees the Term Portfolio's valuation policies and procedures and reports to the Board on the Committee's activities and fair value determinations. The Board monitors the appropriateness of the procedures used in valuing the Term Portfolio's investments and ratifies the fair value determinations of the Committee.
Each Fund categorizes the inputs to valuation techniques used to value its investments into a disclosure hierarchy consisting of three levels as shown below:
- Level 1 – quoted prices in active markets for identical investments
- Level 2 – other significant observable inputs (including quoted prices for similar investments, interest rates, prepayment speeds, etc.)
- Level 3 – unobservable inputs (including the Fund's own assumptions based on the best information available)
Valuation techniques used to value each Fund's investments by major category are as follows:
For the Term Portfolio, debt securities, including restricted securities, are valued based on evaluated prices received from third party pricing vendors or from brokers who make markets in such securities. Commercial paper are valued by pricing vendors who utilize matrix pricing which considers yield or price of bonds of comparable quality, coupon, maturity and type or by broker-supplied prices. When independent prices are unavailable or unreliable, debt securities may be valued utilizing pricing methodologies which consider similar factors that would be used by third party pricing vendors. Debt securities are generally categorized as Level 2 in the hierarchy but may be Level 3 depending on the circumstances.
For the Government Portfolio, as permitted by compliance with certain conditions under Rule 2a-7 of the 1940 Act, securities are valued at amortized cost, which approximates fair value. The amortized cost of an instrument is determined by valuing it at its original cost and thereafter amortizing any discount or premium from its face value at a constant rate until maturity. Securities held by a money market fund are generally high quality and liquid; however, they are reflected as Level 2 because the inputs used to determine fair value are not quoted prices in an active market.
For the Term Portfolio, changes in valuation techniques may result in transfers in or out of an assigned level within the disclosure hierarchy.
Investment Transactions and Income. For financial reporting purposes, the Funds' investment holdings and NAV include trades executed through the end of the last business day of the period. The NAV per share for processing shareholder transactions is calculated as of the close of business of the New York Stock Exchange (NYSE), normally 4:00 p.m. Eastern time and includes trades executed through the end of the prior business day for the Term Portfolio and trades executed through the end of the current business day for the Government Portfolio. Gains and losses on securities sold are determined on the basis of identified cost. Interest income is accrued as earned and includes coupon interest and amortization of premium and accretion of discount on debt securities as applicable. The principal amount on inflation-indexed securities is periodically adjusted to the rate of inflation and interest is accrued based on the principal amount. The adjustments to principal due to inflation are reflected as increases or decreases to Interest in the accompanying Statement of Operations.
Expenses. Expenses directly attributable to a fund are charged to that fund. Expenses attributable to more than one fund are allocated among the respective funds on the basis of relative net assets or other appropriate methods. Expense estimates are accrued in the period to which they relate and adjustments are made when actual amounts are known.
Deferred Trustee Compensation. Certain independent Trustees have elected to defer receipt of all or a portion of their annual fees under the Trustees' Deferred Compensation Plan ("the Plan"). Interest is accrued on amounts deferred under the Plan based on the prevailing 90 day Treasury Bill rate.
Income Tax Information and Distributions to Shareholders. Each year, each Fund intends to qualify as a regulated investment company under Subchapter M of the Internal Revenue Code, including distributing substantially all of its taxable income and realized gains. As a result, no provision for U.S. Federal income taxes is required. The Term Portfolio files a U.S. federal tax return, in addition to state and local tax returns as required. The Term Portfolio's federal income tax returns are subject to examination by the Internal Revenue Service (IRS) for a period of three fiscal years after they are filed. State and local tax returns may be subject to examination for an additional fiscal year depending on the jurisdiction.
Distributions are declared and recorded daily and paid monthly from net investment income. Distributions from realized gains, if any, are declared and recorded on the ex-dividend date. Income and capital gain distributions are determined in accordance with income tax regulations, which may differ from GAAP.
Capital accounts within the financial statements are adjusted for permanent book-tax differences. These adjustments have no impact on net assets or the results of operations. Capital accounts are not adjusted for temporary book-tax differences which will reverse in a subsequent period.
Book-tax differences are primarily due to losses deferred due to wash sales.
As of period end, the cost and unrealized appreciation (depreciation) in securities, and derivatives if applicable, for federal income tax purposes were as follows for each Fund:
| | Tax cost | Gross unrealized appreciation | Gross unrealized depreciation | Net unrealized appreciation (depreciation) |
| Government Portfolio | $6,306,327,556 | $– | $– | $– |
| Term Portfolio | 3,928,564,884 | 117,534 | (268,281) | (150,747) |
Repurchase Agreements. Pursuant to an Exemptive Order issued by the Securities and Exchange Commission (the SEC), the Funds along with other registered investment companies having management contracts with Fidelity Management & Research Company (FMR), or other affiliated entities of FMR, are permitted to transfer uninvested cash balances into joint trading accounts which are then invested in repurchase agreements. The Funds may also invest directly with institutions in repurchase agreements. Repurchase agreements may be collateralized by government or non-government securities. Upon settlement date, collateral is held in segregated accounts with custodian banks and may be obtained in the event of a default of the counterparty. Each applicable Fund monitors, on a daily basis, the value of the collateral to ensure it is at least equal to the principal amount of the repurchase agreement (including accrued interest). In the event of a default by the counterparty, realization of the collateral proceeds could be delayed, during which time the value of the collateral may decline.
Restricted Securities. The Funds may invest in securities that are subject to legal or contractual restrictions on resale. These securities generally may be resold in transactions exempt from registration or to the public if the securities are registered. Disposal of these securities may involve time-consuming negotiations and expense, and prompt sale at an acceptable price may be difficult. Information regarding restricted securities is included at the end of each applicable Fund's Schedule of Investments.
New Rule Issuance. During August 2018, the U.S. Securities and Exchange Commission issued Final Rule Release No. 33-10532, Disclosure Update and Simplification. This Final Rule includes amendments specific to registered investment companies that are intended to eliminate overlap in disclosure requirements between Regulation S-X and GAAP. In accordance with these amendments, certain line-items in the Funds' financial statements have been combined or removed for the current period as outlined in the table below.
| Financial Statement | Current Line-Item Presentation | Prior Line-Item Presentation |
| Statement of Assets and Liabilities | Total distributable earnings (loss) | Undistributed/Distributions in excess of/Accumulated net investment income (loss)
Accumulated/Undistributed net realized gain (loss)
Net unrealized appreciation (depreciation) |
| Statement of Changes in Net Assets | N/A - removed | Undistributed/Distributions in excess of/Accumulated net investment income (loss) end of period |
| Statement of Changes in Net Assets | Distributions to shareholders | Distributions to shareholders from net investment income
Distributions to shareholders from net realized gain |
3. Purchases and Sales of Investments.
Purchases and sales of securities, other than short-term securities, are noted in the table below.
| | Purchases ($) | Sales ($) |
| Term Portfolio | – | 30,000,000 |
4. Fees and Other Transactions with Affiliates.
Management Fee. Fidelity Management & Research Company (the investment adviser) and its affiliates provides the Funds with investment management related services for which the Funds pay a monthly management fee based upon a graduated series of annual rates ranging between .195% and .275% of each Fund's average net assets. The investment adviser pays all other expenses, except the compensation of the independent Trustees and certain exceptions such as interest expense. The management fee is reduced by an amount equal to the fees and expenses paid by the Funds to the independent Trustees. For the reporting period each Fund's annualized management fee rate, expressed as a percentage of each Fund's average net assets, was as follows:
| Government Portfolio | .23% |
| Term Portfolio | .24% |
Distribution and Service Plan Fees. In accordance with Rule 12b-1 of the 1940 Act, each Fund has adopted a separate Distribution and Service plan. The Funds do not pay any fees for these services. The investment adviser pays Fidelity Distributors Corporation (FDC), an affiliate of the investment adviser, a Distribution and Service fee from the management fee paid by each fund based on a graduated series of rates ranging from .06% to .08% of each Fund's average net assets. For the period, the investment adviser paid FDC $1,247,408 and $1,010,409 on behalf of Government and Term Portfolios, respectively, all of which was paid to the Capital Management of the Carolinas LLC.
Interfund Trades. The Funds may purchase from or sell securities to other Fidelity Funds under procedures adopted by the Board. The procedures have been designed to ensure these interfund trades are executed in accordance with Rule 17a-7 of the 1940 Act. For the Term Portfolio, interfund trades are included within the respective purchases and sales amounts shown in the Purchases and Sales of Investments note.
5. Expense Reductions.
The investment adviser or its affiliates voluntarily agreed to waive a portion of each Fund's management fee during the period. The amount of the waiver for each Fund was as follows:
| Government Portfolio | $1,386,862 |
| Term Portfolio | 353,526 |
6. Other.
The Funds' organizational documents provide former and current trustees and officers with a limited indemnification against liabilities arising in connection with the performance of their duties to the Funds. In the normal course of business, the Funds may also enter into contracts that provide general indemnifications. The Funds' maximum exposure under these arrangements is unknown as this would be dependent on future claims that may be made against the Funds. The risk of material loss from such claims is considered remote.
Shareholder Expense Example
As a shareholder of a Fund, you incur two types of costs: (1) transaction costs and (2) ongoing costs, including management fees and other Fund expenses. This Example is intended to help you understand your ongoing costs (in dollars) of investing in the Funds and to compare these costs with the ongoing costs of investing in other mutual funds.
The Example is based on an investment of $1,000 invested at the beginning of the period and held for the entire period (July 1, 2018 to December 31, 2018).
Actual Expenses
The first line of the accompanying table for each fund provides information about actual account values and actual expenses. You may use the information in this line, together with the amount you invested, to estimate the expenses that you paid over the period. Simply divide your account value by $1,000.00 (for example, an $8,600 account value divided by $1,000.00 = 8.6), then multiply the result by the number in the first line for a fund under the heading entitled "Expenses Paid During Period" to estimate the expenses you paid on your account during this period.
Hypothetical Example for Comparison Purposes
The second line of the accompanying table for each fund provides information about hypothetical account values and hypothetical expenses based on a fund's actual expense ratio and an assumed rate of return of 5% per year before expenses, which is not the Fund's actual return. The hypothetical account values and expenses may not be used to estimate the actual ending account balance or expenses you paid for the period. You may use this information to compare the ongoing costs of investing in the Fund and other funds. To do so, compare this 5% hypothetical example with the 5% hypothetical examples that appear in the shareholder reports of the other funds.
Please note that the expenses shown in the table are meant to highlight your ongoing costs only and do not reflect any transaction costs. Therefore, the second line of the table is useful in comparing ongoing costs only, and will not help you determine the relative total costs of owning different funds.
| | Annualized Expense RatioA | Beginning
Account Value
July 1, 2018 | Ending
Account Value
December 31, 2018 | Expenses Paid
During Period-B
July 1, 2018
to December 31, 2018 |
| Government Portfolio | .18% | | | |
| Actual | | $1,000.00 | $1,009.90 | $.91 |
| Hypothetical-C | | $1,000.00 | $1,024.30 | $.92 |
| Term Portfolio | .22% | | | |
| Actual | | $1,000.00 | $1,011.20 | $1.12 |
| Hypothetical-C | | $1,000.00 | $1,024.10 | $1.12 |
A Annualized expense ratio reflects expenses net of applicable fee waivers.
B Expenses are equal to each Fund's annualized expense ratio, multiplied by the average account value over the period, multiplied by 184/ 365 (to reflect the one-half year period).
C 5% return per year before expenses
Board Approval of Investment Advisory Contracts and Management Fees
Government Portfolio
Term Portfolio
Each year, the Board of Trustees, including the Independent Trustees (together, the Board), votes on the renewal of the management contract with Fidelity Management & Research Company (FMR) and sub-advisory agreements (together, the Advisory Contracts) for each fund. The Board, assisted by the advice of fund counsel and Independent Trustees' counsel, requests and considers a broad range of information relevant to the renewal of the Advisory Contracts throughout the year.
The Board meets regularly each quarter and, at each of its meetings, covers an extensive agenda of topics and materials and considers factors that are relevant to its annual consideration of the renewal of each fund's Advisory Contracts, including the services and support provided to each fund and its shareholders. While the full Board or the Independent Trustees, as appropriate, act on all major matters, a portion of the activities of the Board (including certain of those described herein) may be conducted through the Board's Audit Committee. All of the Independent Trustees are members of the Audit Committee.
At its October 2018 meeting, the Board unanimously determined to renew each fund's Advisory Contracts. In reaching its determination, the Board considered all factors it believed relevant, including (i) the nature, extent, and quality of the services provided to each fund and its shareholders (including the investment performance of each fund); (ii) the competitiveness of each fund's management fee and total expense ratio relative to peer funds; (iii) the total costs of the services to be provided by and the profits to be realized by Fidelity from its relationships with each fund; (iv) the extent to which economies of scale, if any, exist and would be realized as each fund grows; and (v) whether any economies of scale are appropriately shared with fund shareholders.
In considering whether to renew the Advisory Contracts for each fund, the Board reached a determination, with the assistance of fund counsel and Independent Trustees' counsel and through the exercise of its business judgment, that the renewal of the Advisory Contracts was in the best interests of each fund and its shareholders and that the compensation payable under the Advisory Contracts was fair and reasonable. The Board's decision to renew the Advisory Contracts was not based on any single factor, but rather was based on a comprehensive consideration of all the information provided to the Board at its meetings throughout the year. The Board, in reaching its determination to renew the Advisory Contracts, was aware that shareholders in each fund have other investment choices available to them, and that each fund's shareholders, who have the opportunity to review and weigh the disclosure provided by the fund in its prospectus and other public disclosures, have chosen to invest in that fund, managed by Fidelity.
Nature, Extent, and Quality of Services Provided. The Board considered Fidelity's staffing as it relates to the funds, including the backgrounds of the investment personnel of Fidelity, and also considered the funds' investment objectives, strategies, and related investment philosophies. The Independent Trustees also had discussions with senior management of Fidelity's investment operations and investment groups. The Board considered the structure of the investment personnel compensation program and whether this structure provides appropriate incentives to act in the best interests of each fund.
Resources Dedicated to Investment Management and Support Services. The Board reviewed the general qualifications and capabilities of Fidelity's investment staff, including its size, education, experience, and resources, as well as Fidelity's approach to recruiting, managing, and compensating investment personnel. The Board noted that Fidelity's analysts have extensive resources, tools and capabilities that allow them to conduct sophisticated quantitative and fundamental analysis, as well as credit analysis of issuers, counterparties and guarantors. The Board also considered that Fidelity's investment professionals have sufficient access to global information and data so as to provide competitive investment results over time, and that those professionals also have access to sophisticated tools that permit them to assess portfolio construction and risk and performance attribution characteristics continuously, as well as to transmit new information and research conclusions rapidly around the world. Additionally, in its deliberations, the Board considered Fidelity's trading, risk management and compliance capabilities and resources, which are integral parts of the investment management process.
Shareholder and Administrative Services. The Board considered (i) the nature, extent, quality, and cost of advisory, administrative, and shareholder services performed by FMR, the sub-advisers (together with FMR, the Investment Advisers) and their affiliates under the Advisory Contracts and under separate agreements covering transfer agency and pricing and bookkeeping services for each fund; (ii) the nature and extent of the Investment Advisers' supervision of, and coordination with, third party service providers, principally Capital Management of the Carolinas (CMC), the funds' regional distributor, as well as the third parties acting as the funds' custodian and subcustodians; and (iii) the resources devoted to, and the record of compliance with, each fund's compliance policies and procedures.
Investment Performance. The Board considered whether each fund has operated in accordance with its investment objective, as well as its record of compliance with its investment restrictions.
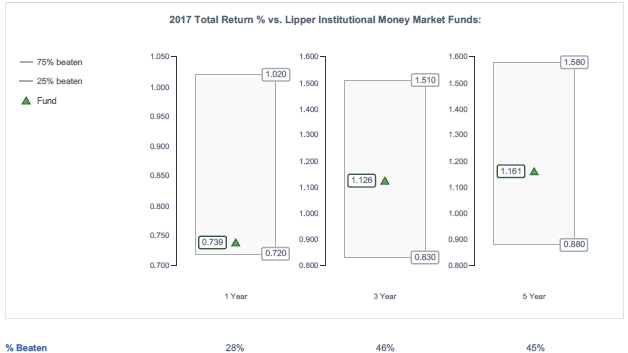
The Board took into account discussions that occur at Board meetings throughout the year with representatives of the Investment Advisers about fund investment performance. The Board reviewed each fund's absolute investment performance, as well as each fund's relative investment performance measured over multiple periods against (i) a broad-based securities market index or other index, and (ii) a peer group of mutual funds deemed appropriate by Fidelity and reviewed by the Board. For each fund, the following charts considered by the Board show, over the one-, three-, and five-year periods ended December 31, 2017, the fund's cumulative total returns, the cumulative total returns of a broad-based securities market index or other index ("benchmark"), and/or a range of cumulative total returns of a peer group of mutual funds identified by Lipper Inc. as having an investment objective similar to that of the fund.
The box within each chart shows the 25th percentile return (top of box, 75% beaten) and the 75th percentile return (bottom of box, 25% beaten) of the peer group. Returns shown above the box are in the first quartile and returns shown below the box are in the fourth quartile. The percentage beaten number noted below each chart corresponds to the percentile box and represents the percentage of funds in the peer group whose performance was equal to or lower than that of the fund.
Government Portfolio
The Board reviewed Government Portfolio's relative investment performance against its peer group and noted that the performance of the fund was in the third quartile for the one-, three- and five-year periods.
Term Portfolio

The Board reviewed Term Portfolio's relative investment performance against its peer group and noted that the performance of the fund was in the first quartile for the one-year period and in the second quartile for the three- and five-year periods shown. The Board also noted that the fund outperformed its benchmark for the one- three- and five-year periods.
The Board noted that each fund's performance is also influenced by the investment parameters imposed by the laws of North Carolina, which restrict the flexibility of the funds when compared to other funds in their respective Lipper universes. For example, unlike other institutional money market funds, Government Portfolio may not engage in reverse repurchase agreements or invest in certain certificates of deposit and repurchase agreements that are backed by collateral other than U.S. government securities, the use of which might increase yield.
Based on its review, the Board concluded that the nature, extent, and quality of services provided to each fund under the Advisory Contracts should continue to benefit shareholders of each fund.
Competitiveness of Management Fee and Total Expense Ratio. The Board considered each fund's management fee and total expense ratio compared to "mapped groups" of competitive funds and classes created for the purpose of facilitating the Trustees' competitive analysis of management fees and total expenses. Fidelity creates "mapped groups" by combining similar Lipper investment objective categories that have comparable investment mandates. Combining Lipper investment objective categories aids the Board's management fee and total expense ratio comparisons by broadening the competitive group used for comparison.
Management Fee. The Board considered two proprietary management fee comparisons for the 12-month periods shown in basis points (BP) in the charts below. The group of Lipper funds used by the Board for management fee comparisons is referred to below as the "Total Mapped Group." The Total Mapped Group is broader than the Lipper peer group used by the Board for performance comparisons because the Total Mapped Group combines several Lipper investment objective categories while the Lipper peer group does not. The Total Mapped Group comparison focuses on a fund's standing in terms of gross management fees before expense reimbursements or caps relative to the total universe of funds with comparable investment mandates, regardless of whether their management fee structures are also comparable. Funds with comparable investment mandates offer exposure to similar types of securities. Funds with comparable management fee structures have similar management fee contractual arrangements (
e.g., flat rate charged for advisory services, all-inclusive fee rate,
etc.). "TMG %" represents the percentage of funds in the Total Mapped Group that had management fees that were lower than a fund's. For example, a hypothetical TMG % of 20% would mean that 80% of the funds in the Total Mapped Group had higher, and 20% had lower, management fees than a fund. The funds' actual TMG %s and the number of funds in the Total Mapped Group are in the charts below. The "Asset-Size Peer Group" (ASPG) comparison focuses on a fund's standing relative to a subset of non-Fidelity funds within the Total Mapped Group that are similar in size and management fee structure. For example, if a fund is in the first quartile of the ASPG, the fund's management fee ranks in the least expensive or lowest 25% of funds in the ASPG. The ASPG represents at least 15% of the funds in the Total Mapped Group with comparable asset size and management fee structures, subject to a minimum of 50 funds (or all funds in the Total Mapped Group if fewer than 50). Additional information, such as the ASPG quartile in which a fund's management fee rate ranked, is also included in the charts and considered by the Board. Because the vast majority of competitor funds' management fees do not cover non-management expenses, for periods prior to 2017, each fund was compared on the basis of a hypothetical "net management fee," which was derived by subtracting payments made by FMR for non-advisory expenses, such as transfer agent, pricing and bookkeeping, audit and custody fees, from the fund's all-inclusive fee. In this regard, the Board noted that net management fees could vary from year to year because of differences in non-management expenses. Fidelity no longer considers the hypothetical net management fee to be a meaningful comparison for the funds. As a result, the charts below do not include a hypothetical net management fee for 2017.
Government Portfolio

* All-inclusive fee structure; due to a methodology change Fidelity is no longer using hypothetical net management fees for primary comparisons.
* All-inclusive fee structure; due to a methodology change Fidelity is no longer using hypothetical net management fees for primary comparisons.
Term Portfolio
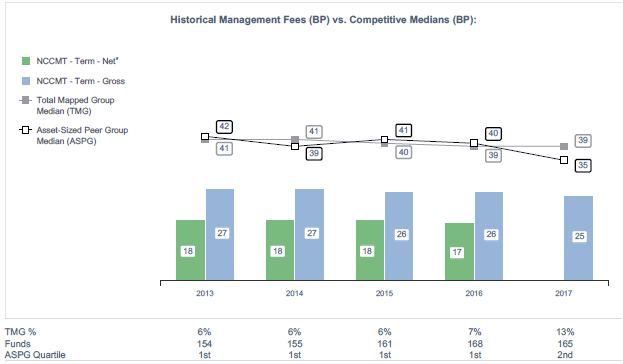
The Board noted that the management fee rate for Term Portfolio ranked below the median of its Total Mapped Group and below the median of its ASPG for 2017. Government Portfolio's management fee rate ranked above both its Total Mapped Group and ASPG medians for 2017.
Based on its review, the Board concluded that each fund's management fee is fair and reasonable in light of the services that the fund receives and the other factors considered.
Total Expense Ratio. In its review of each fund's total expense ratio, the Board considered the fund's all-inclusive management fee as well as other expenses, such as transfer agent fees, pricing and bookkeeping fees, and custodial, legal, and audit fees, paid by FMR under the all-inclusive arrangement. The Board also noted that Fidelity may agree to waive fees and expenses from time to time, and the extent to which, if any, it has done so for each fund. As part of its review, the Board also considered the current and historical total expense ratios of each fund compared to competitive fund median expenses. Each fund is compared to those funds and classes in the Total Mapped Group (used by the Board for management fee comparisons) that have a similar sales load structure. The Board also considered information concerning the total expense ratios of the ASPG.
The Board noted that each fund's total expense ratio ranked at or below its respective competitive median for 2017.
Fees Charged to Other Fidelity Clients. The Board also considered Fidelity fee structures and other information with respect to clients of Fidelity, such as other mutual funds advised or subadvised by Fidelity, pension plan clients, and other institutional clients. The Board noted that the management fees charged by Fidelity to the funds are among the lowest in the Fidelity complex for each of their respective disciplines.
Based on its review of total expense ratios and fees charged to other Fidelity clients, the Board concluded that each fund's total expense ratio was reasonable in light of the services that the fund and its shareholders receive and the other factors considered.
Costs of the Services and Profitability. The Board considered the revenues earned and the expenses incurred by Fidelity in conducting the business of developing, marketing, distributing, managing, administering and servicing each fund and servicing each fund's shareholders. The Board also considered the level of Fidelity's profits in respect of the funds.
On an annual basis, Fidelity presents to the Board information about the profitability of its relationships with each fund. Fidelity calculates profitability information for each fund using a series of detailed revenue and cost allocation methodologies which originate with the books and records of Fidelity on which Fidelity's audited financial statements are based. The Board reviews any significant changes from the prior year's methodologies.
PricewaterhouseCoopers LLP (PwC), auditor to Fidelity and certain Fidelity funds, has been engaged annually by the Board as part of the Board's assessment of Fidelity's profitability analysis. PwC's engagement includes the review and assessment of the methodologies used by Fidelity in determining the revenues and expenses attributable to Fidelity's mutual fund business, and completion of agreed-upon procedures in respect of the mathematical accuracy of the fund profitability information and its conformity to established allocation methodologies. After considering PwC's reports issued under the engagement and information provided by Fidelity, the Board concluded that while other allocation methods may also be reasonable, Fidelity's profitability methodologies are reasonable in all material respects.
The Board considered whether there were any fall-out benefits that FMR derives from its relationship with the Trust. The Board concluded that FMR did not derive any fall-out benefits and that any potential fall-out benefits would be de minimis.
The Board considered the costs of the services provided by and the profits realized by Fidelity in connection with the operation of each fund and was satisfied that the profitability was not excessive.
Economies of Scale. The Board considered whether there have been economies of scale in respect of the management of the funds, whether the funds have appropriately benefited from any such economies of scale, and whether there is potential for realization of any further economies of scale. The Board considered the extent to which each fund will benefit from economies of scale as assets grow through increased services to the fund, through waivers or reimbursements, or through fee or expense reductions.
The Board concluded that economies of scale, if any, are being appropriately shared between fund shareholders and Fidelity.
Additional Information Requested by the Board. In order to develop fully the factual basis for consideration of the Advisory Contracts, the Board requested and received additional information on certain topics, including (i) fund profitability and the impact of certain factors on fund profitability results and services provided to the funds; (ii) the fees paid by other comparable money market funds and fixed income funds advised by FMR and institutional accounts for which FMR or one or more of its affiliates provides investment advisory services; (iii) the management fees paid by other mutual funds that have investment objectives similar to Government Portfolio or Term Portfolio; (iv) Fidelity's and CMC's voluntary waiver of fees for each portfolio and trends concerning fee waivers among sponsors of U.S. Government money market funds; and (v) portfolio manager compensation.
Based on its evaluation of all of the conclusions noted above, and after considering all factors it believed relevant, the Board ultimately concluded that the advisory fee arrangements are fair and reasonable, and that each fund's Advisory Contracts should be renewed.
Investment Adviser
Fidelity Management & Research Company
Boston, MA
Sub-Advisers
Fidelity Investments Money Management, Inc.
FMR Investment Management (U.K.) Limited
Fidelity Management & Research (Hong Kong) Limited
Fidelity Management & Research (Japan) Limited
Custodian
Wells Fargo Bank
San Francisco, CA
Transfer and Service Agents
Fidelity Investments Institutional Operations Company, Inc.
Boston, MA
Fidelity Service Company, Inc.
Boston, MA
Distribution Agent
Capital Management of the Carolinas, L.L.C.
Charlotte, NC
NC-SANN-0219
1.540079.121