Free signup for more
- Track your favorite companies
- Receive email alerts for new filings
- Personalized dashboard of news and more
- Access all data and search results
Filing tables
Filing exhibits
ONBPP similar filings
- 6 Jan 11 Departure of Directors or Certain Officers
- 23 Dec 10 Departure of Directors or Certain Officers
- 22 Nov 10 Departure of Directors or Certain Officers
- 12 Nov 10 Regulation FD Disclosure
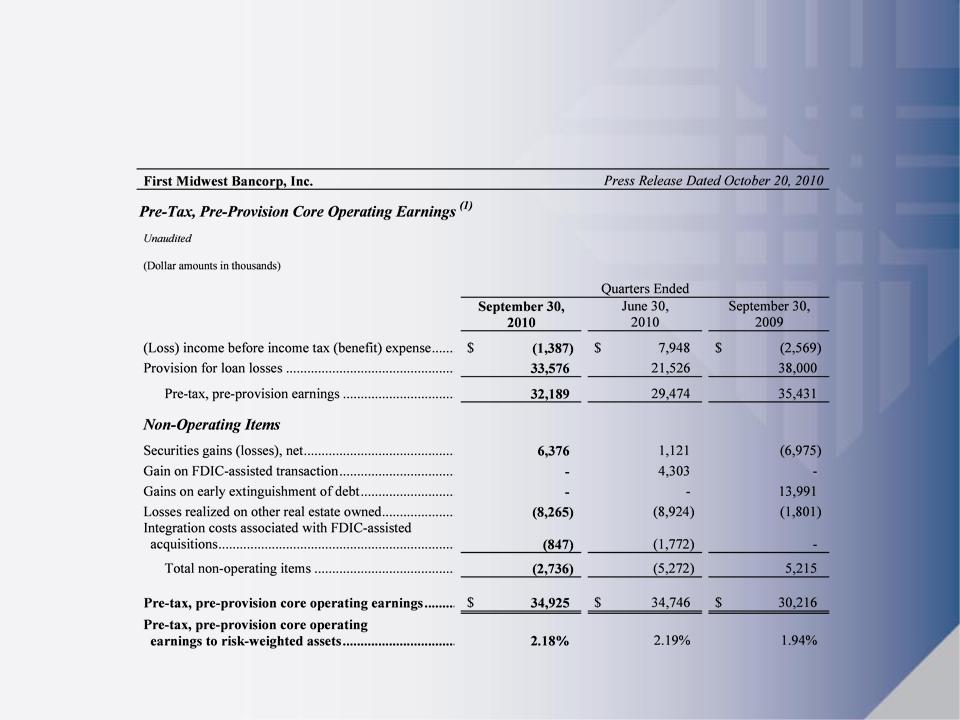
- 20 Oct 10 Results of Operations and Financial Condition
- 4 Oct 10 Departure of Directors or Certain Officers
- 24 Aug 10 Departure of Directors or Certain Officers
Filing view
External links