
* Title date Sandler O’Neill + Partners California Marketing Meetings August 2012
* Agenda First Midwest Overview Operating Performance Loan Portfolio and Credit Quality Strategy Execution and Priorities Why Invest in FMBI?
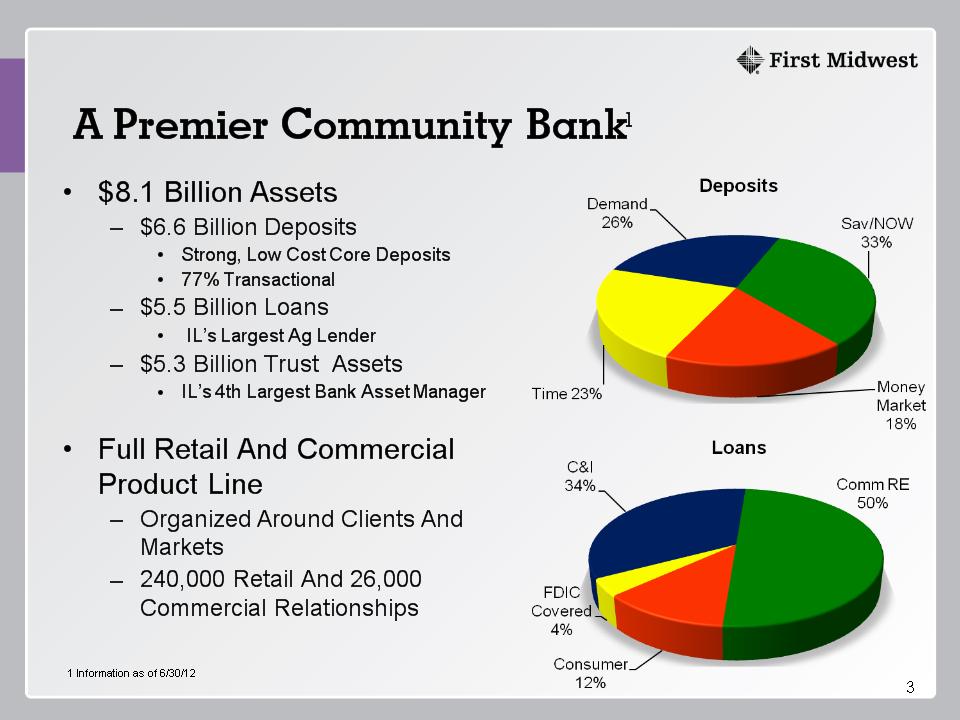
* $8.1 Billion Assets $6.6 Billion Deposits Strong, Low Cost Core Deposits 77% Transactional $5.5 Billion Loans IL’s Largest Ag Lender $5.3 Billion Trust Assets IL’s 4th Largest Bank Asset Manager Full Retail And Commercial Product Line Organized Around Clients And Markets 240,000 Retail And 26,000 Commercial Relationships 1 Information as of 6/30/12 A Premier Community Bank1
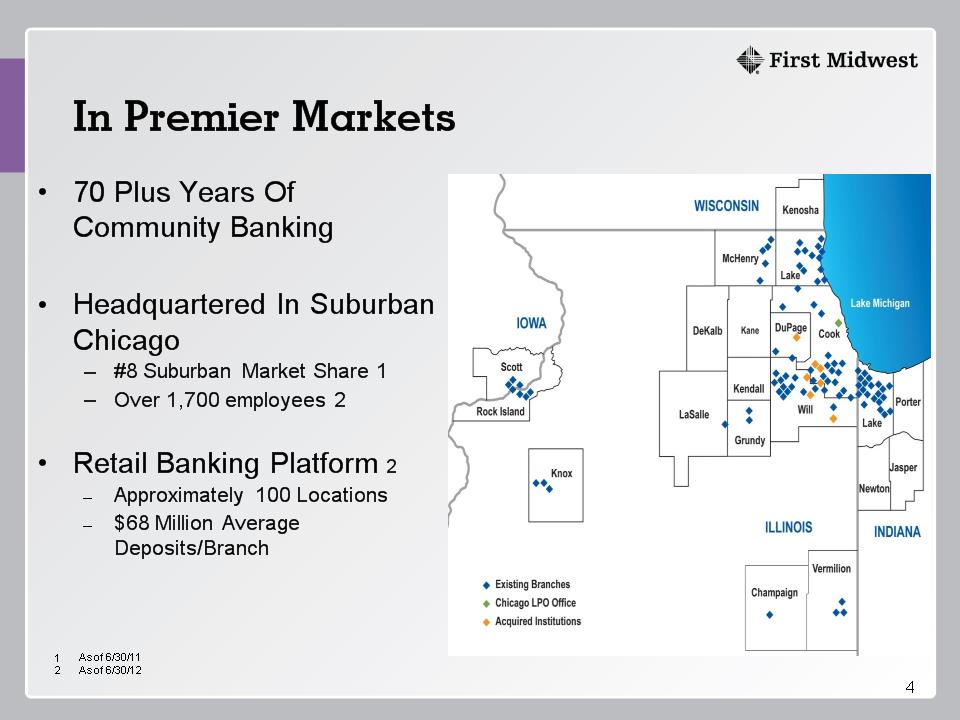
* In Premier Markets 70 Plus Years Of Community Banking Headquartered In Suburban Chicago #8 Suburban Market Share 1 Over 1,700 employees 2 Retail Banking Platform 2 Approximately 100 Locations $68 Million Average Deposits/Branch As of 6/30/11 As of 6/30/12
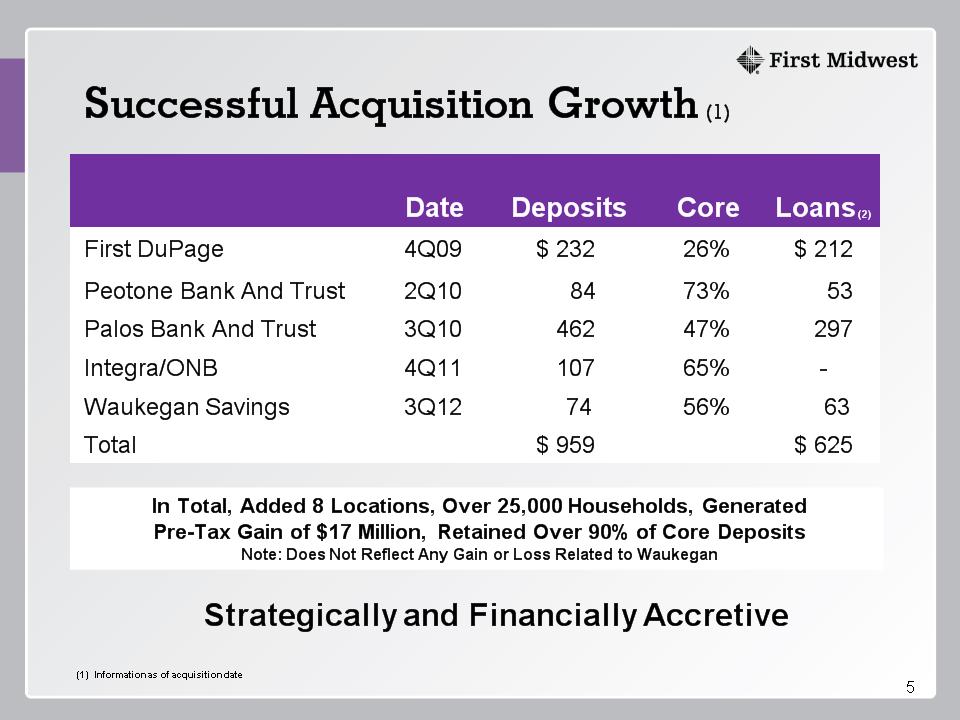
* Date Deposits Core Loans (2) First DuPage 4Q09 $ 232 26% $ 212 Peotone Bank And Trust 2Q10 84 73% 53 Palos Bank And Trust 3Q10 462 47% 297 Integra/ONB 4Q11 107 65% - Waukegan Savings 3Q12 74 56% 63 Total $ 959 $ 625 Successful Acquisition Growth (1) Strategically and Financially Accretive (1) Information as of acquisition date In Total, Added 8 Locations, Over 25,000 Households, Generated Pre-Tax Gain of $17 Million, Retained Over 90% of Core Deposits Note: Does Not Reflect Any Gain or Loss Related to Waukegan

*
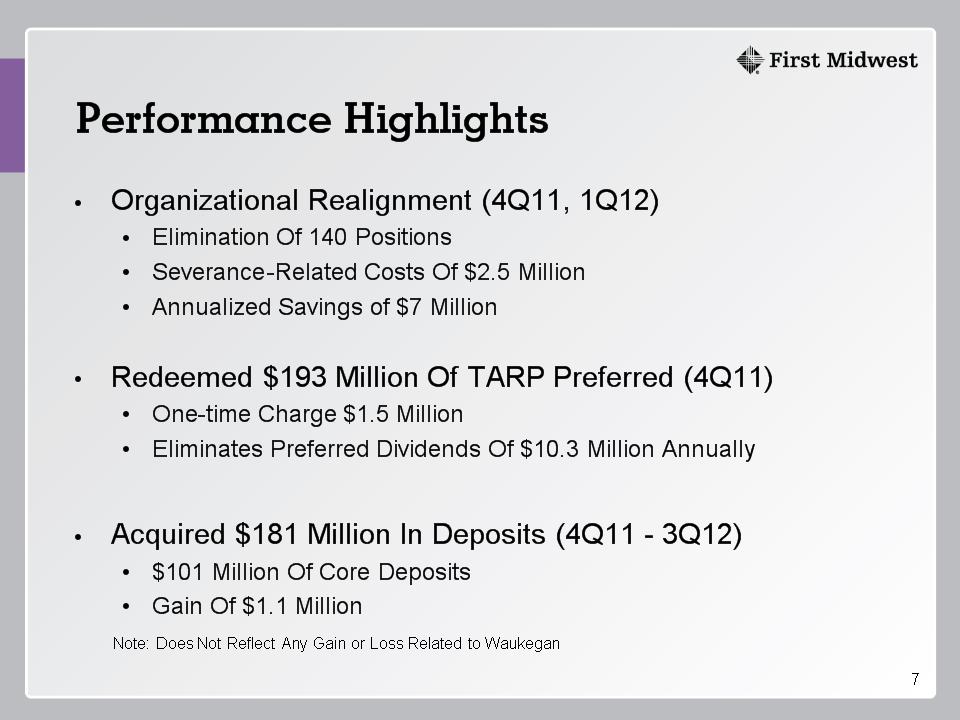
* Organizational Realignment (4Q11, 1Q12) Elimination Of 140 Positions Severance-Related Costs Of $2.5 Million Annualized Savings of $7 Million Redeemed $193 Million Of TARP Preferred (4Q11) One-time Charge $1.5 Million Eliminates Preferred Dividends Of $10.3 Million Annually Acquired $181 Million In Deposits (4Q11 – 3Q12) $101 Million Of Core Deposits Gain Of $1.1 Million Note: Does Not Reflect Any Gain or Loss Related to Waukegan Performance Highlights
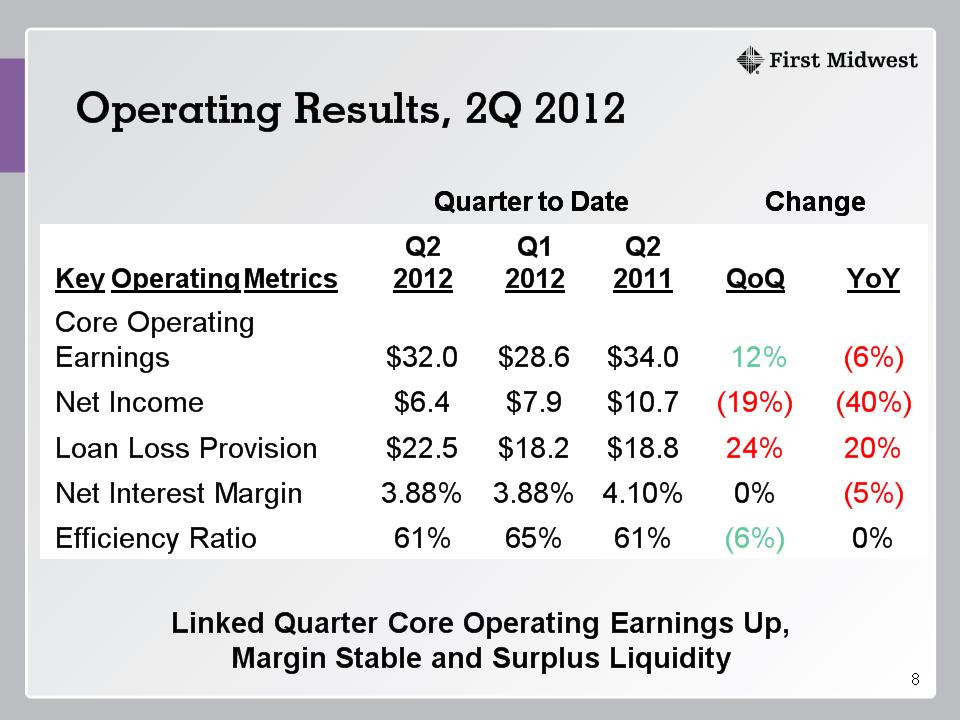
* Operating Results, 2Q 2012 Linked Quarter Core Operating Earnings Up, Margin Stable and Surplus Liquidity Quarter to Date Quarter to Date Quarter to Date Change Change Key Operating Metrics Q2 2012 Q1 2012 Q2 2011 QoQ YoY Core Operating Earnings $32.0 $28.6 $34.0 12% (6%) Net Income $6.4 $7.9 $10.7 (19%) (40%) Loan Loss Provision $22.5 $18.2 $18.8 24% 20% Net Interest Margin 3.88% 3.88% 4.10% 0% (5%) Efficiency Ratio 61% 65% 61% (6%) 0%
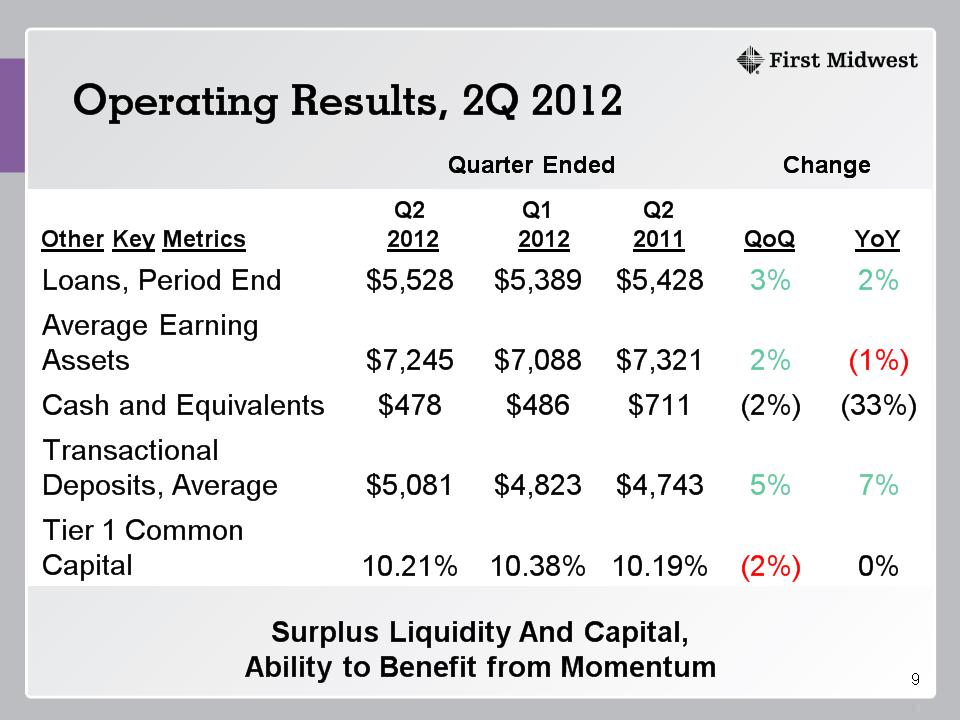
* Operating Results, 2Q 2012 Quarter Ended Quarter Ended Quarter Ended Change Change Other Key Metrics Q2 2012 Q1 2012 Q2 2011 QoQ YoY Loans, Period End $5,528 $5,389 $5,428 3% 2% Average Earning Assets $7,245 $7,088 $7,321 2% (1%) Cash and Equivalents $478 $486 $711 (2%) (33%) Transactional Deposits, Average $5,081 $4,823 $4,743 5% 7% Tier 1 Common Capital 10.21% 10.38% 10.19% (2%) 0% Surplus Liquidity And Capital, Ability to Benefit from Momentum
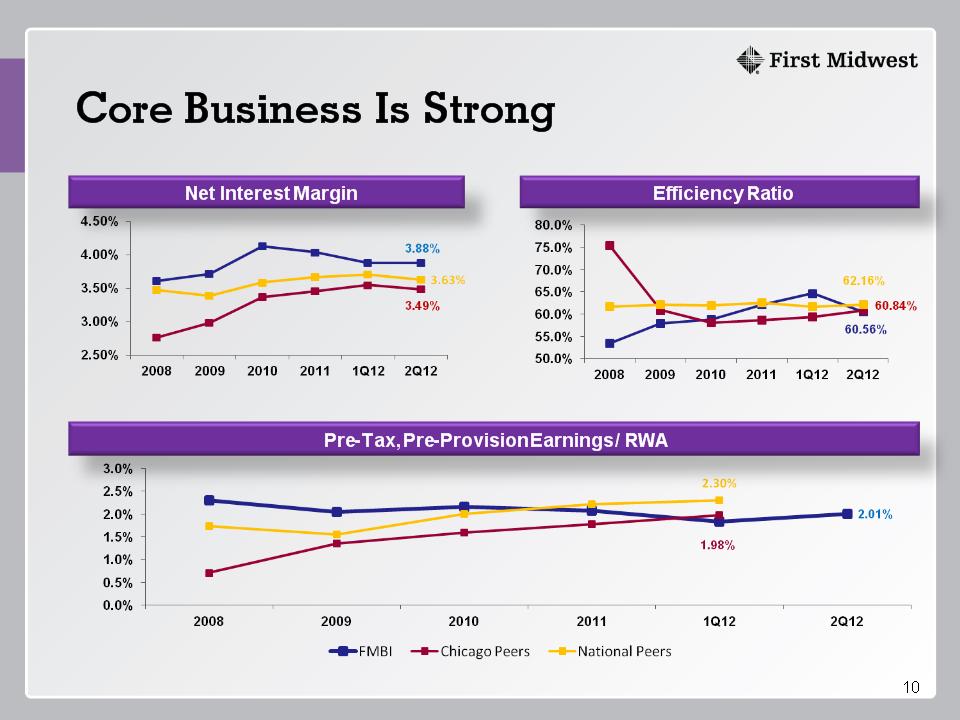
* Core Business Is Strong Pre-Tax, Pre-Provision Earnings / RWA Efficiency Ratio Net Interest Margin

* Changing Loan Trajectory Expanding Our Sales and Footprint: Enhancing Existing Teams Mortgage Platform Chicago Loop, Du Page Markets Asset Based and Other Niches
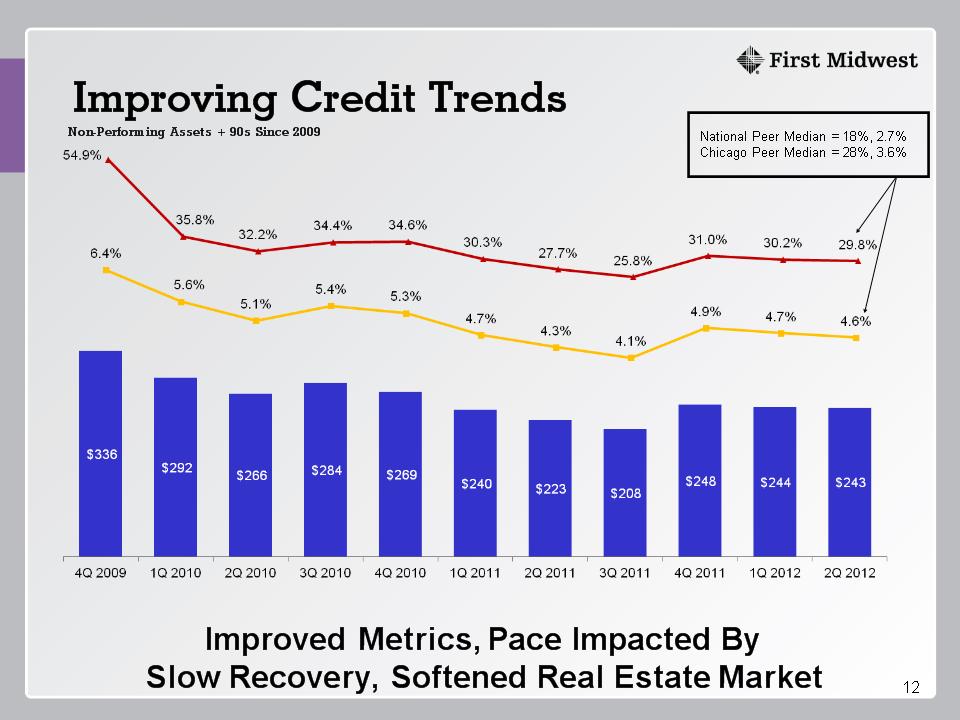
* Improving Credit Trends Non-Performing Assets + 90s Since 2009 National Peer Median = 18%, 2.7% Chicago Peer Median = 28%, 3.6% Improved Metrics, Pace Impacted By Slow Recovery, Softened Real Estate Market
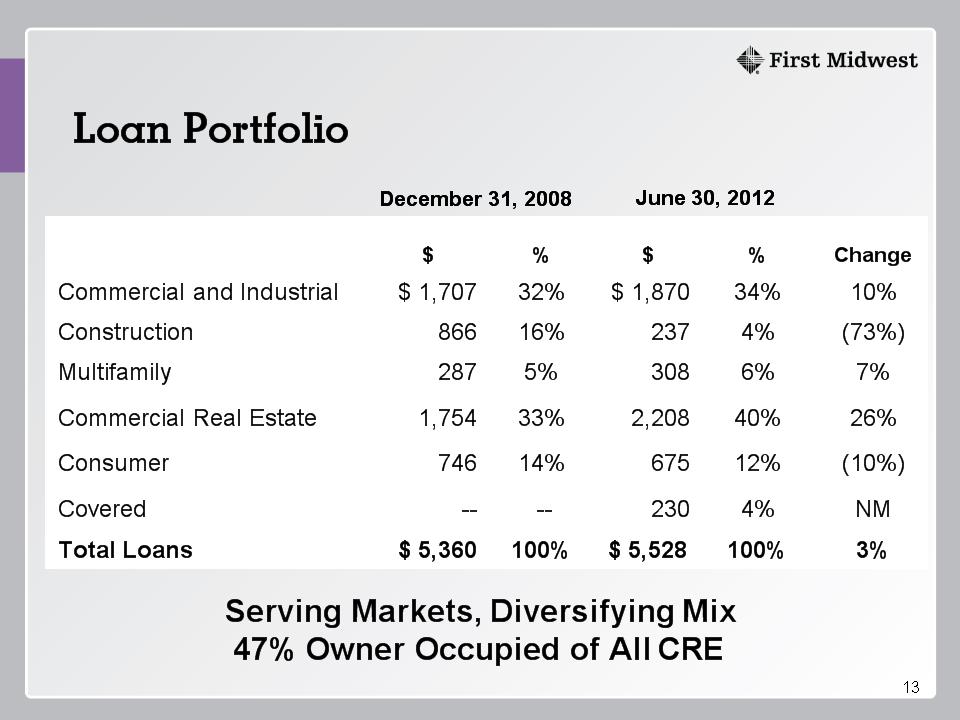
* Loan Portfolio EXCEL SOURCE range $C$4:$F$12 copied at 01-Sep-10 09:29:47: FMBICS\2010 Presentations\September - Regulators\Excel\Credit Data.xls (YoY Change) EXCEL SOURCE range $C$4:$F$12 copied at 01-Sep-10 09:31:19: FMBICS\2010 Presentations\September - Regulators\Excel\Credit Data.xls (YoY Change) EXCEL SOURCE range $C$4:$F$12 copied at 13-Jan-11 05:12:53: FMBICS\2011 Presentations\January - Earnings Presentation\Excel\Credit Data.xlsx (YoY Change) December 31, 2008 December 31, 2008 June 30, 2012 June 30, 2012 $ % $ % Change Commercial and Industrial $ 1,707 32% $ 1,870 34% 10% Construction 866 16% 237 4% (73%) Multifamily 287 5% 308 6% 7% Commercial Real Estate 1,754 33% 2,208 40% 26% Consumer 746 14% 675 12% (10%) Covered -- -- 230 4% NM Total Loans $ 5,360 100% $ 5,528 100% 3% Serving Markets, Diversifying Mix 47% Owner Occupied of All CRE
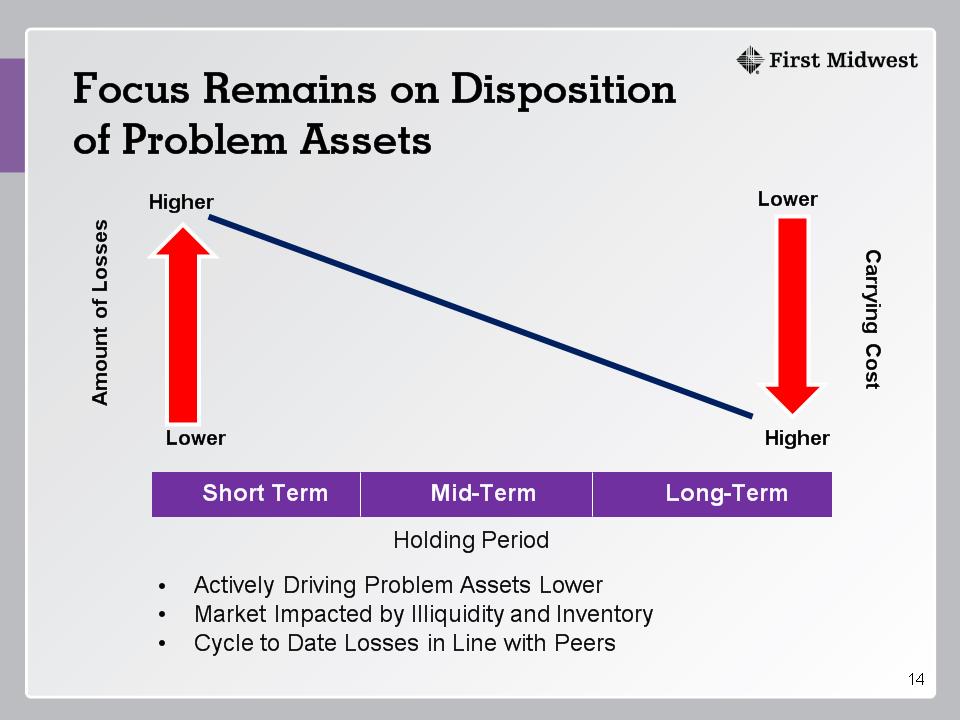
* Focus Remains on Disposition of Problem Assets Amount of Losses Short Term Mid-Term Long-Term Holding Period Actively Driving Problem Assets Lower Market Impacted by Illiquidity and Inventory Cycle to Date Losses in Line with Peers Carrying Cost Higher Higher Lower Lower
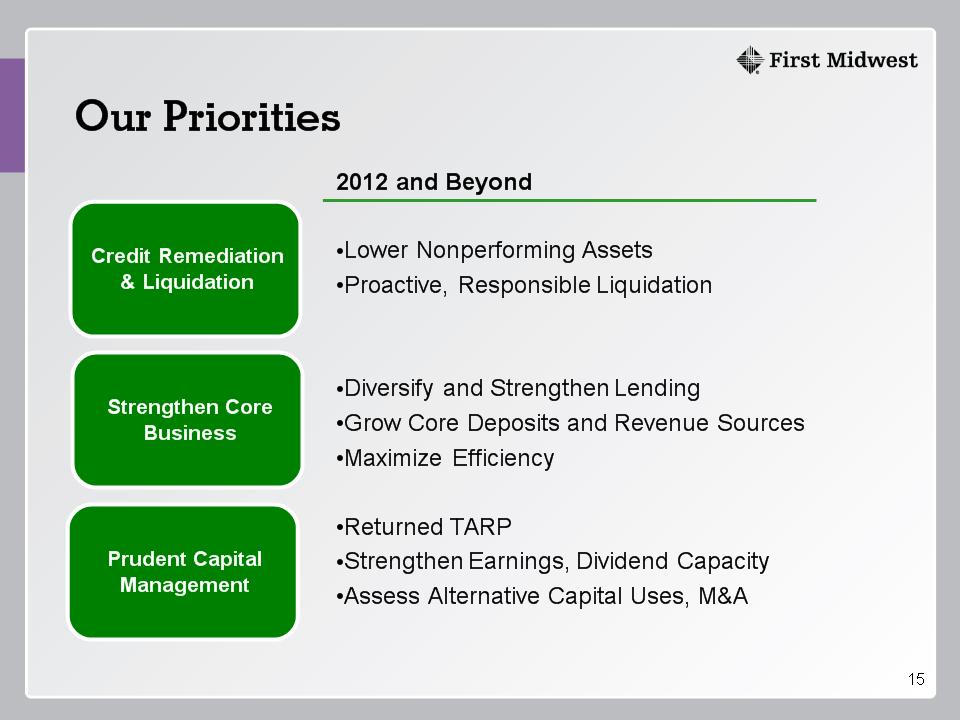
* Our Priorities 2012 and Beyond Lower Nonperforming Assets Proactive, Responsible Liquidation Diversify and Strengthen Lending Grow Core Deposits and Revenue Sources Maximize Efficiency Returned TARP Strengthen Earnings, Dividend Capacity Assess Alternative Capital Uses, M&A Credit Remediation & Liquidation Strengthen Core Business Prudent Capital Management
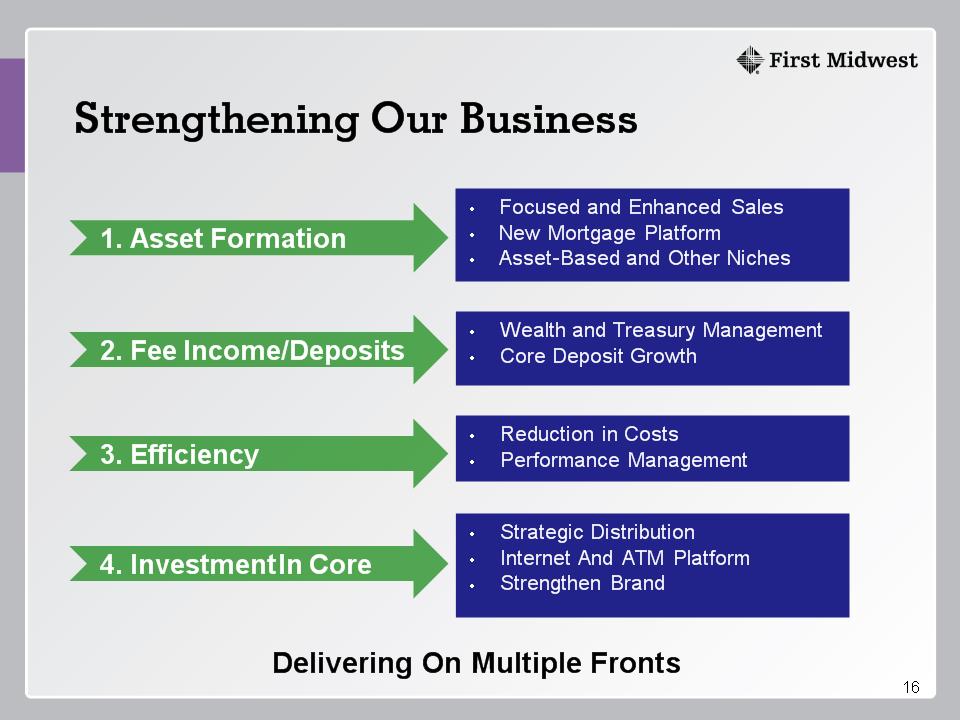
* Strengthening Our Business Delivering On Multiple Fronts 1. Asset Formation 3. Efficiency 2. Fee Income/Deposits 4. Investment In Core Focused and Enhanced Sales New Mortgage Platform Asset-Based and Other Niches Wealth and Treasury Management Core Deposit Growth Reduction in Costs Performance Management Strategic Distribution Internet And ATM Platform Strengthen Brand
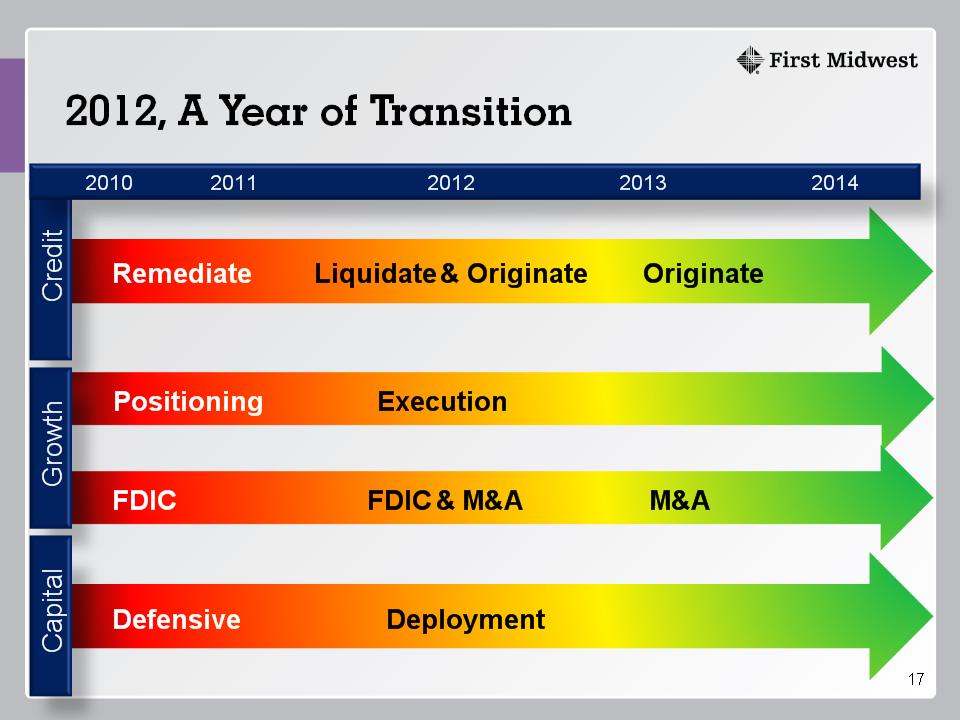
* Remediate Liquidate & Originate Originate Positioning Execution FDIC FDIC & M&A M&A Defensive Deployment Credit Growth Capital 2010 2011 2012 2013 2014
* 2012 Is A Year Of Transition Economic Conditions Improving, but Fragile Regulatory and Capital Requirements Evolving Credit Improving, Remediation Uneven Aligning Resources With Growth and Opportunity Positioning For Long Term Success
* Market Opportunities Environment Creates Opportunities Expansion Efficiency Within Chicago Market 40 Failures Since Start Of 2009 39 Institutions ($12 Billion) With Texas Ratio > 100% Consolidation Expected Well Positioned To Benefit Strong Capital, Solid Reputation Experienced Team 5 Transactions, Approx $1 Billion in Deposits Since 2008
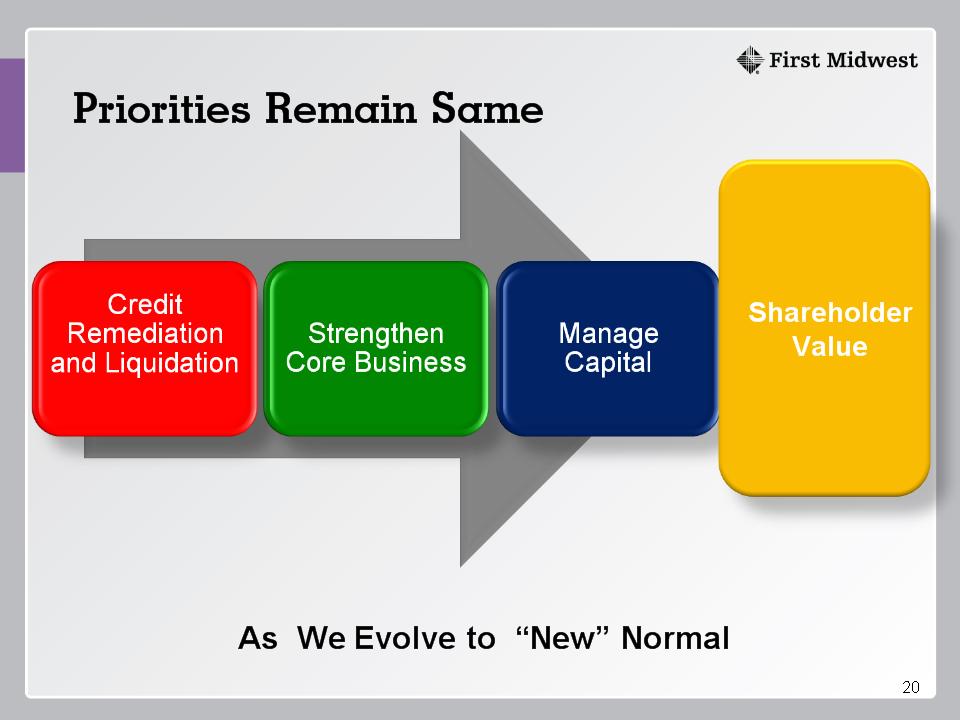
* As We Evolve to “New” Normal Shareholder Value Priorities Remain Same
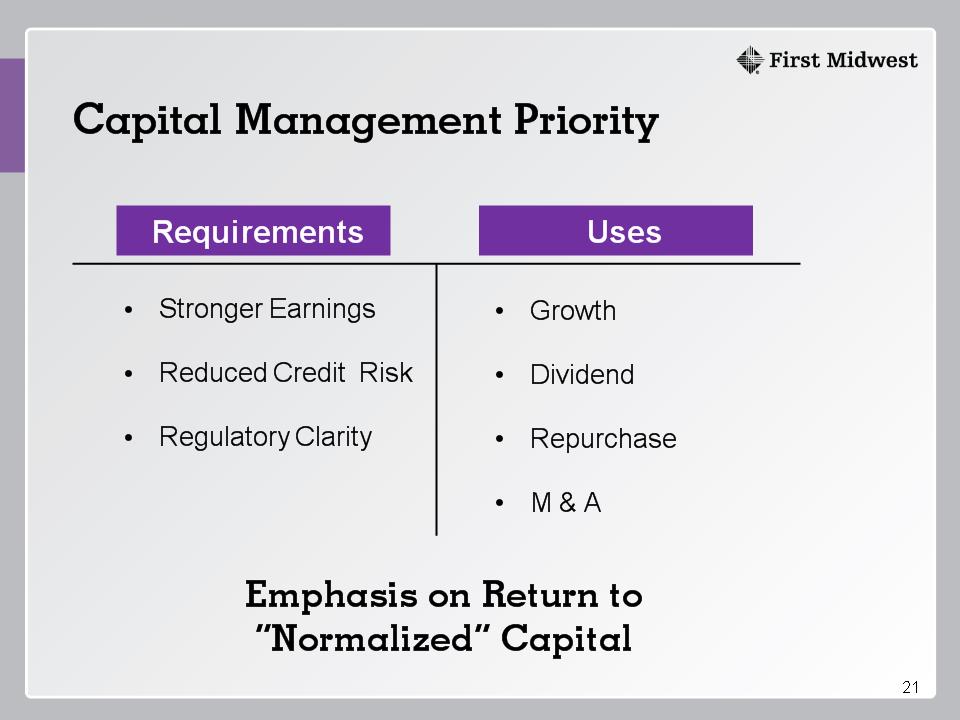
* Capital Management Priority Emphasis on Return to “Normalized” Capital Requirements Uses Stronger Earnings Reduced Credit Risk Regulatory Clarity Growth Dividend Repurchase M & A
* Why Invest in FMBI? Premier Metro Chicago Banking Franchise We Have Advantages That Create Opportunities Strong Core Deposit Engaged and Enhanced Workforce Good Markets, Growing Opportunities Significant Capital and Liquidity Execution on Our Priorities Enhances Value Aligned with Shareholder Interest
* Appendix
* Forward Looking Statement This presentation may contain, and during this presentation our management may make statements that may constitute “forward-looking statements” within the meaning of the safe harbor provisions of the Private Securities Litigation Reform Act of 1995. Forward-looking statements are not historical facts but instead represent only our beliefs regarding future events, many of which, by their nature, are inherently uncertain and outside our control. Forward-looking statements include, among other things, statements regarding our financial performance, business prospects, future growth and operating strategies, objectives and results. Actual results, performance or developments could differ materially from those expressed or implied by these forward-looking statements. Important factors that could cause actual results to differ from those in the forward-looking statements include, among others, those discussed in our Annual Report on Form 10-K and other reports filed with the Securities and Exchange Commission, copies of which will be made available upon request. With the exception of fiscal year end information previously included in our Annual Report on Form 10-K, the information contained herein is unaudited. Except as required by law, we undertake no duty to update the contents of this presentation after the date of this presentation. Non-GAAP Disclaimer This presentation contains GAAP financial measures and, where management believes it to be helpful in understanding the Company’s results of operations or financial position, non-GAAP financial measures. Where non-GAAP financial measures are used, the most directly comparable GAAP financial measure, as well as the reconciliation to the most directly comparable GAAP financial measure can be found in the Company’s current quarter earnings release or Quarterly Report on Form 10-Q which can be found on the Company’s website at www.firstmidwest.com/secfilings. Non-GAAP financial measures in this presentation include core operating earnings and pre-tax, pre-provision return on risk weighted average assets. Both of these measures are useful in understanding the performance and trends of the Company’s core franchise over time without respect to investment securities gains/losses, taxes, provisions expense and OREO losses, each of which can significantly vary from quarter to quarter, and therefore may distort the Company’s underlying performance.
* Certain Terms Used in this Presentation Chicago Peers – Means collectively the companies with the ticker symbol MBFI, WTFC, PVTB, and TAYC. Core Deposit – Includes demand, savings and NOW accounts. Core Operating Earnings – Means the Company’s pre-tax pre-provision operating earnings for the stated period, which reflect the Company’s operating performance before the effects of credit-related charges and other unusual, infrequent, or non-recurring revenues and expenses. This is a non-GAAP financial measure. Covered Loans or Assets – Means loans or assets which the Company acquired via an FDIC-assisted transaction. National Peers – Means collectively the companies with the ticker symbol SRCE, CHFC, CRBC, FCF, FMER, MBFI, ONB, PNFP, PVTB, PFS, STSA, SUSQ, UMBF, UMPQ, VLY, TAYC, TCBI, TRMK, WSBC, WTFC. Net Interest Income – Means the difference between interest income and fees earned on interest-earning assets and interest expense incurred on interest-bearing liabilities, presented on a tax-equivalent basis, assuming a federal income tax rate of 35%. Non-Performing Assets – Means non-accrual loans (the majority of which are past due), loans 90 days or more past due and still accruing interest and OREO. SNL Midwestern Banks – Means 74 Midwest based banks Tier 1 Common Capital – Means tier 1 capital, less trust preferred securities, divided by risk based assets. Note: Unless otherwise indicated, all dollar amounts used in this presentation are in millions except per share information. Unless otherwise indicated, all loan information includes Covered Loans. Peer information source for this presentation from SNL.