® Presentation Materials February 12, 2014
Agenda Overview of First Midwest Strategic Priorities Performance Highlights Why Invest in FMBI?
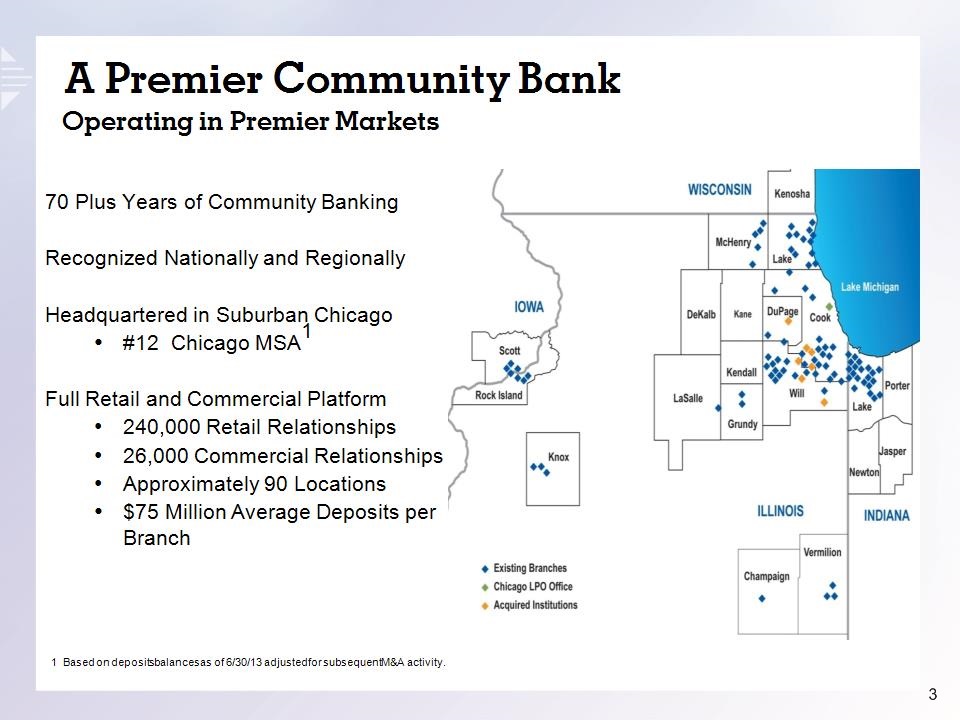
A Premier Community Bank Operating in Premier Markets 70 Plus Years of Community Banking Recognized Nationally and Regionally Headquartered in Suburban Chicago #12 Chicago MSA1 Full Retail and Commercial Platform 240,000 Retail Relationships 26,000 Commercial Relationships Approximately 90 Locations $75 Million Average Deposits per Branch 1 Based on deposits balances as of 6/30/13 adjusted for subsequent M&A activity.
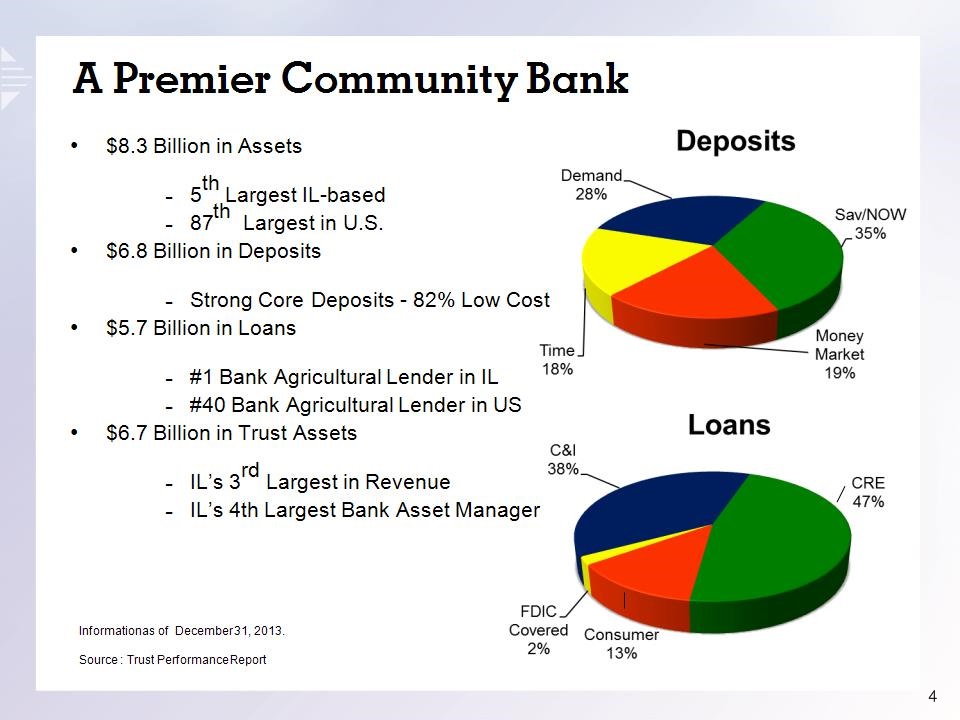
$8.3 Billion in Assets 5th Largest IL-based 87th Largest in U.S. $6.8 Billion in Deposits Strong Core Deposits - 82% Low Cost $5.7 Billion in Loans #1 Bank Agricultural Lender in IL #40 Bank Agricultural Lender in US $6.7 Billion in Trust Assets IL’s 3rd Largest in Revenue IL’s 4th Largest Bank Asset Manager Information as of December 31, 2013. Source : Trust Performance Report A Premier Community Bank
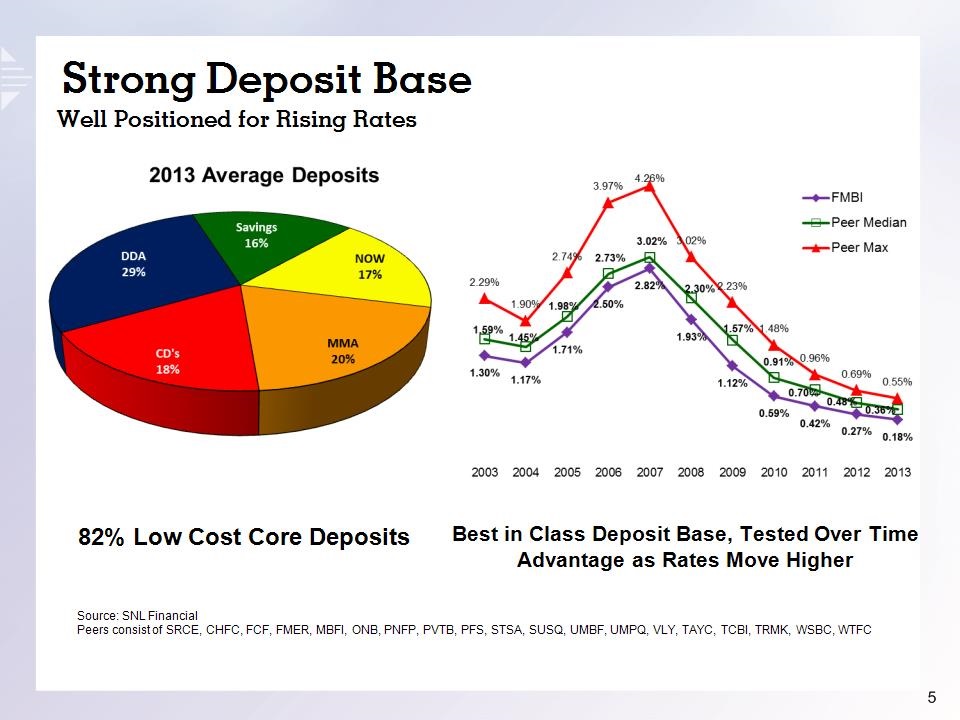
Strong Deposit Base Well Positioned for Rising Rates Best in Class Deposit Base, Tested Over Time Advantage as Rates Move Higher Source: SNL Financial Peers consist of SRCE, CHFC, FCF, FMER, MBFI, ONB, PNFP, PVTB, PFS, STSA, SUSQ, UMBF, UMPQ, VLY, TAYC, TCBI, TRMK, WSBC, WTFC 82% Low Cost Core Deposits
2013 Priorities and Results We Did What We Said We Would Do Strengthened Our Core Business Significantly Improved Earnings Robust Loan Growth Fee Based Revenues Growth Tight Expense Control – Lowered Credit Costs Managed Our Capital Returned Capital to Pre-Bulk Sale Levels Increased the Dividend Twice During 2013 Strong Foundation for Growth, Grew Tier 1 Common Capital by 104 bps to 10.37% Improved Our Credit Risk Profile Net Charge-offs Levels Lowest in 5 Years Decreased Non-performing Loans by $30 million or 32%* Reduced Performing Potential Problem Loans by $63 million or 29%* * Compared to 12/31/12
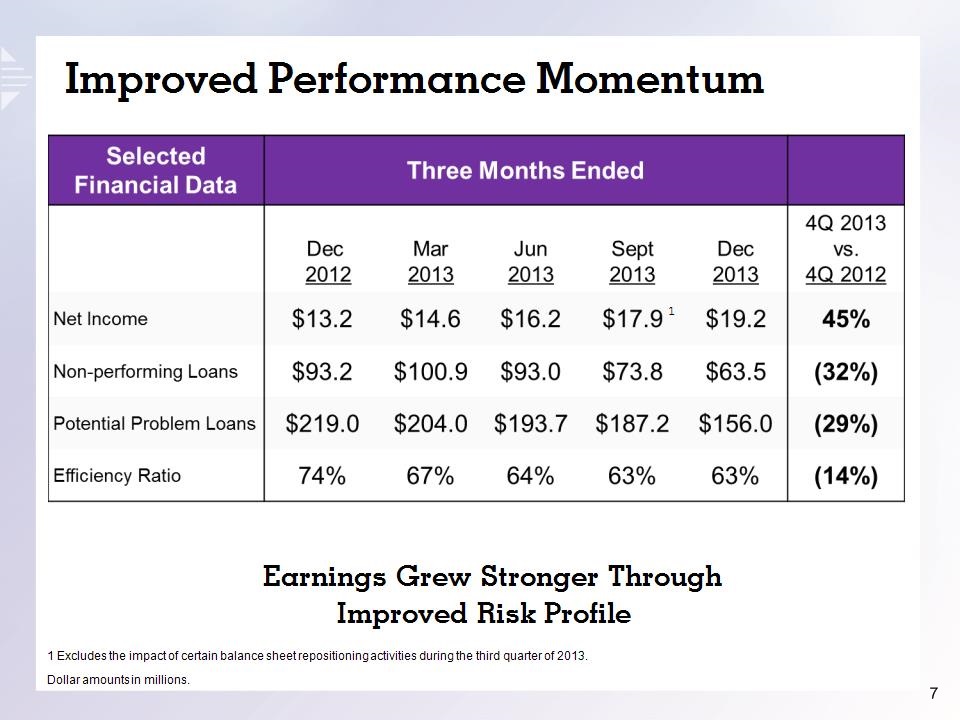
Improved Performance Momentum Earnings Grew Stronger Through Improved Risk Profile Dollar amounts in millions. 1 1 Excludes the impact of certain balance sheet repositioning activities during the third quarter of 2013.
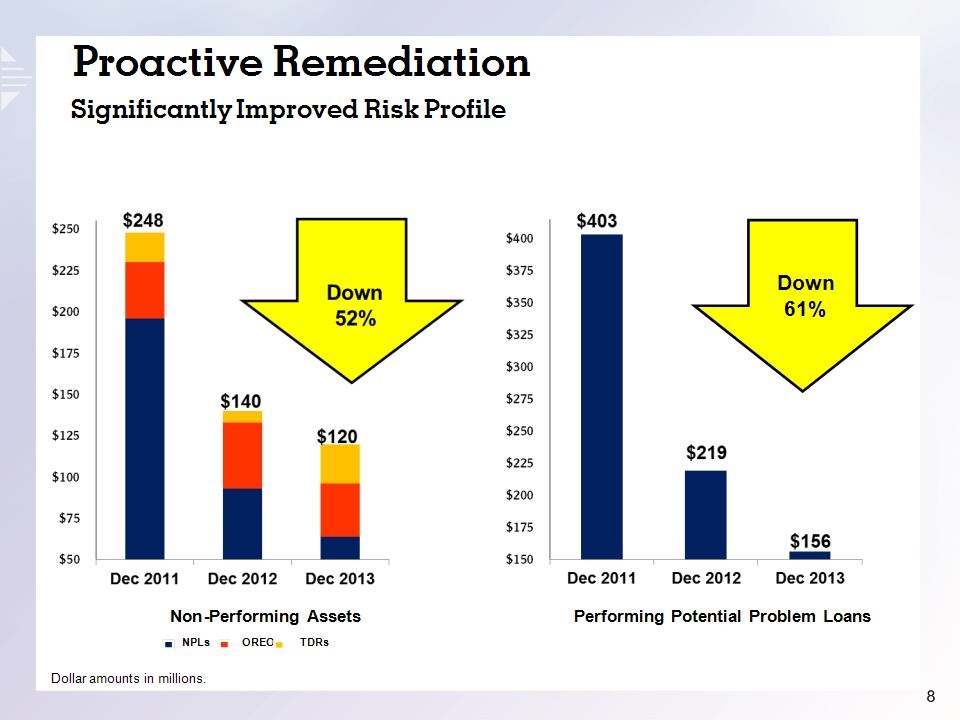
NPLs OREO TDRs Proactive Remediation Significantly Improved Risk Profile Down 61% Dollar amounts in millions. Non-Performing Assets Performing Potential Problem Loans
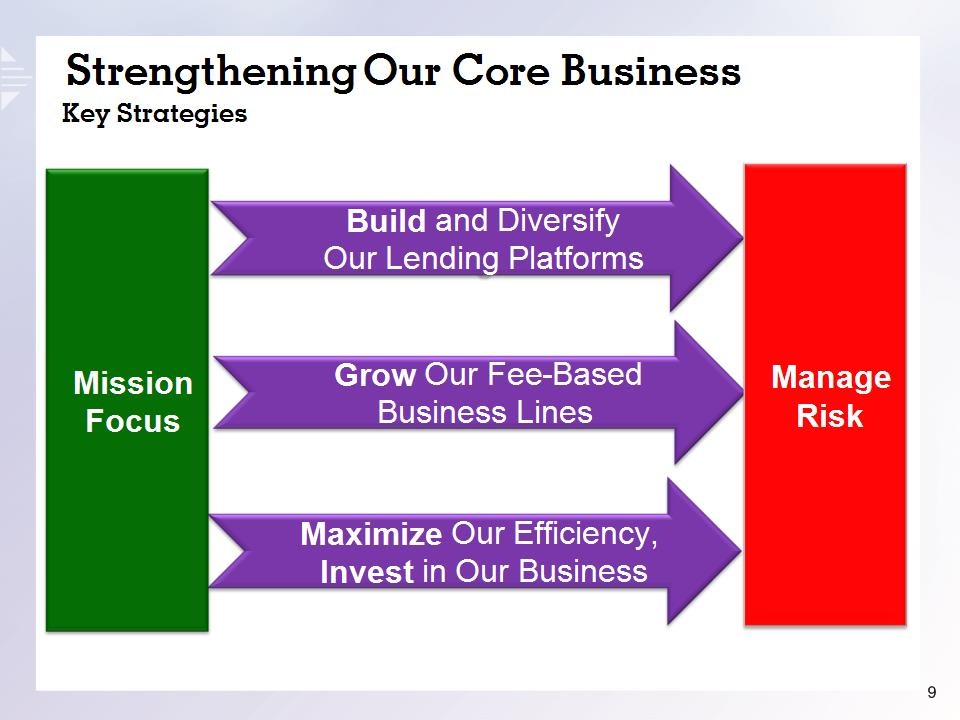
Build and Diversify Our Lending Platforms Maximize Our Efficiency, Invest in Our Business Grow Our Fee-Based Business Lines Mission Focus Manage Risk Strengthening Our Core Business Key Strategies
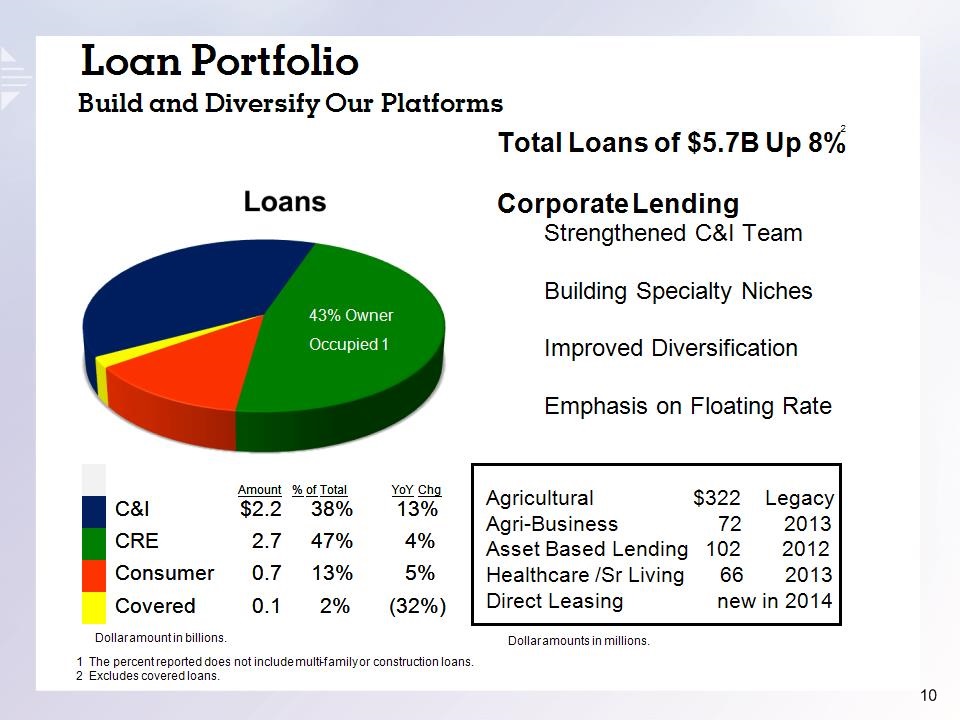
Loan Portfolio Build and Diversify Our Platforms Dollar amount in billions. Amount % of Total YoY Chg C&I $2.2 38% 13% CRE 2.7 47% 4% Consumer 0.7 13% 5% Covered 0.1 2% (32%) Agricultural $322 Legacy Agri-Business 72 2013 Asset Based Lending 102 2012 Healthcare /Sr Living 66 2013 Direct Leasing new in 2014 43% Owner Occupied 1 Dollar amounts in millions. 1 The percent reported does not include multi-family or construction loans. 2 Excludes covered loans. Total Loans of $5.7B Up 8% Corporate Lending Strengthened C&I Team Building Specialty Niches Improved Diversification Emphasis on Floating Rate 2
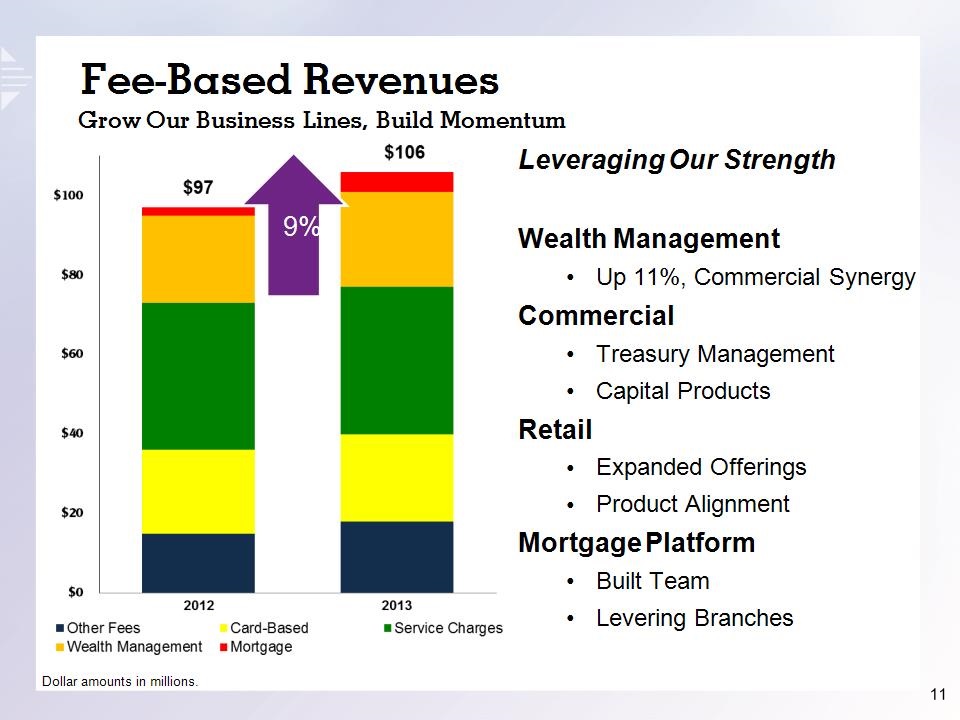
Leveraging Our Strength Wealth Management Up 11%, Commercial Synergy Commercial Treasury Management Capital Products Retail Expanded Offerings Product Alignment Mortgage Platform Built Team Levering Branches Fee-Based Revenues Grow Our Business Lines, Build Momentum Dollar amounts in millions. 9%
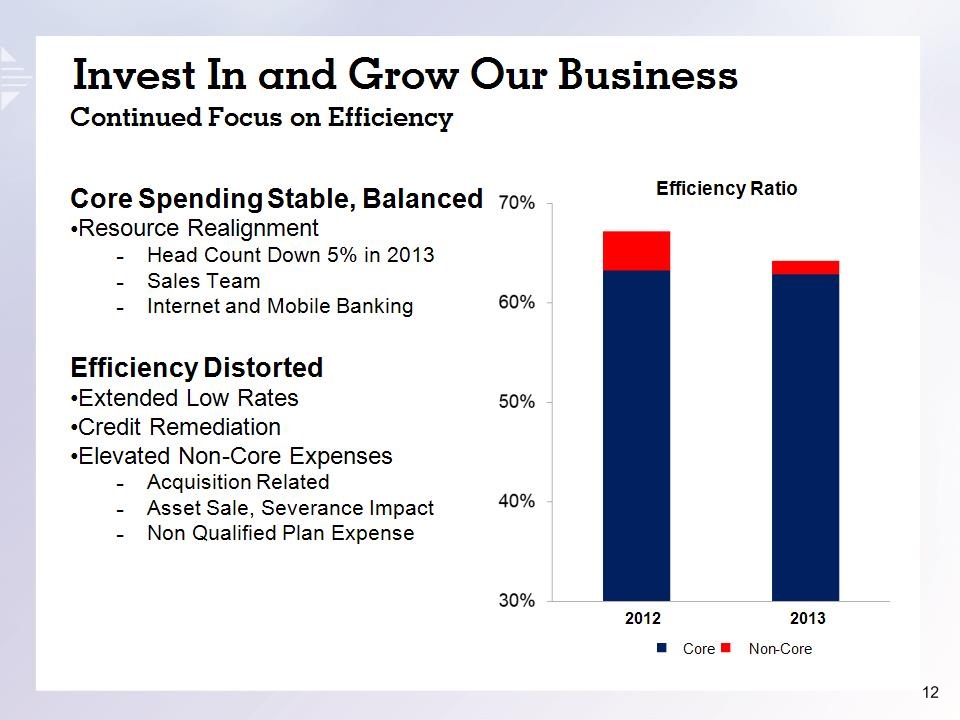
Core Invest In and Grow Our Business Continued Focus on Efficiency Efficiency Ratio Non-Core Core Spending Stable, Balanced Resource Realignment Head Count Down 5% in 2013 Sales Team Internet and Mobile Banking Efficiency Distorted Extended Low Rates Credit Remediation Elevated Non-Core Expenses Acquisition Related Asset Sale, Severance Impact Non Qualified Plan Expense 2012 2013
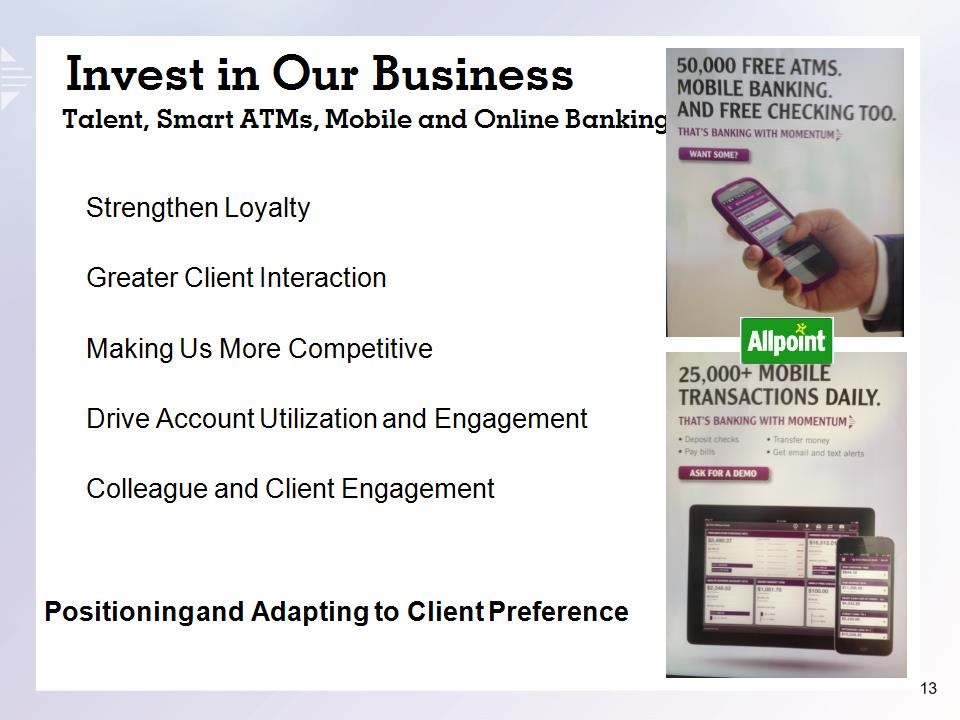
Invest in Our Business Talent, Smart ATMs, Mobile and Online Banking Strengthen Loyalty Greater Client Interaction Making Us More Competitive Drive Account Utilization and Engagement Colleague and Client Engagement Positioning and Adapting to Client Preference
2014 Outlook Near-Term Operating Environment Remains Difficult Low Interest Rates, Highly Competitive Growing Regulatory Compliance Evolving Fiscal and Regulatory Landscape Changing Consumer Preferences, Technology Adding Strategic Complexity Evolving Product and Distribution Usage Protect the Client Credit/Debit Card Data Breach – Requires Fraud Resources Dynamics Will Likely Drive Further Consolidation
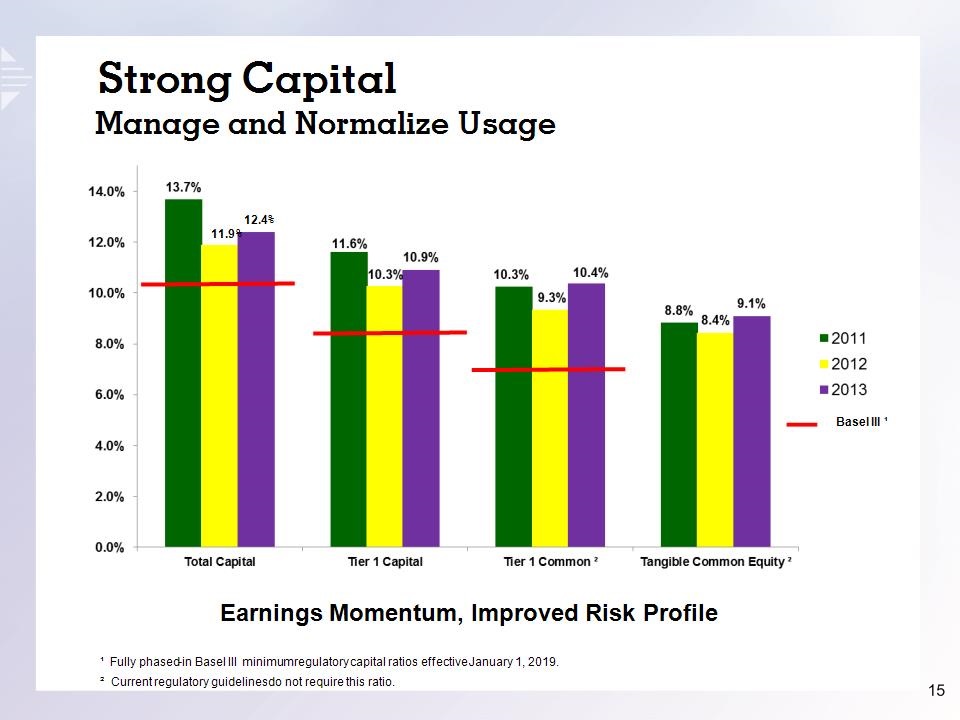
Strong Capital Manage and Normalize Usage Earnings Momentum, Improved Risk Profile ¹ Fully phased-in Basel III minimum regulatory capital ratios effective January 1, 2019. ² Current regulatory guidelines do not require this ratio. 12.4% 11.9% Basel III ¹
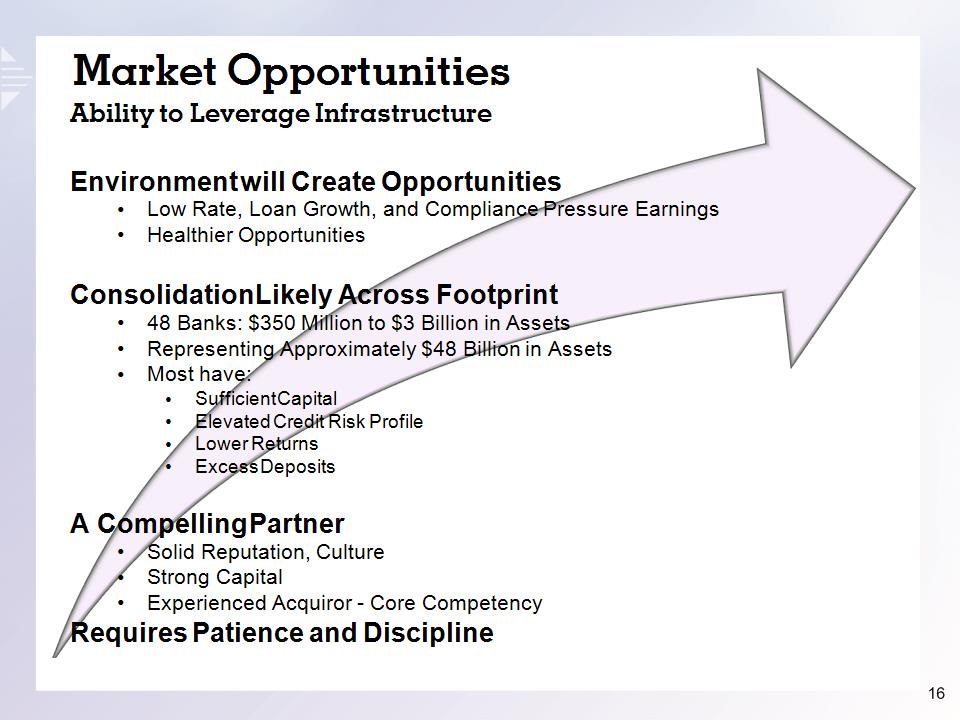
Market Opportunities Ability to Leverage Infrastructure Environment will Create Opportunities Low Rate, Loan Growth, and Compliance Pressure Earnings Healthier Opportunities Consolidation Likely Across Footprint 48 Banks: $350 Million to $3 Billion in Assets Representing Approximately $48 Billion in Assets Most have: Sufficient Capital Elevated Credit Risk Profile Lower Returns Excess Deposits A Compelling Partner Solid Reputation, Culture Strong Capital Experienced Acquiror - Core Competency Requires Patience and Discipline
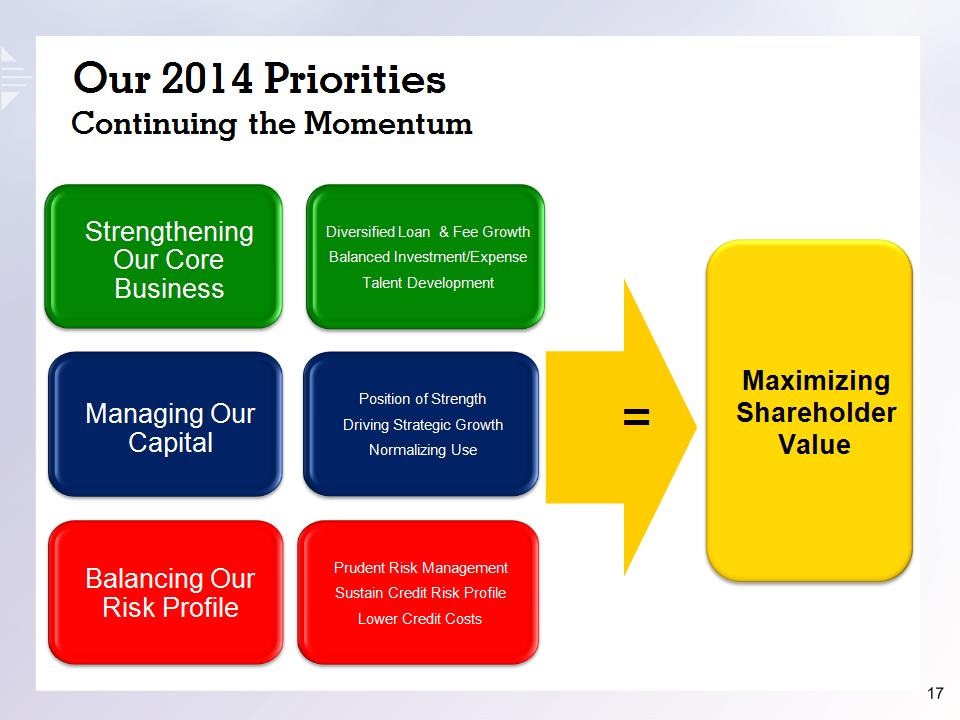
Balancing Our Risk Profile Strengthening Our Core Business Managing Our Capital Maximizing Shareholder Value Our 2014 Priorities Continuing the Momentum = Diversified Loan & Fee Growth Balanced Investment/Expense Talent Development Prudent Risk Management Sustain Credit Risk Profile Lower Credit Costs Position of Strength Driving Strategic Growth Normalizing Use
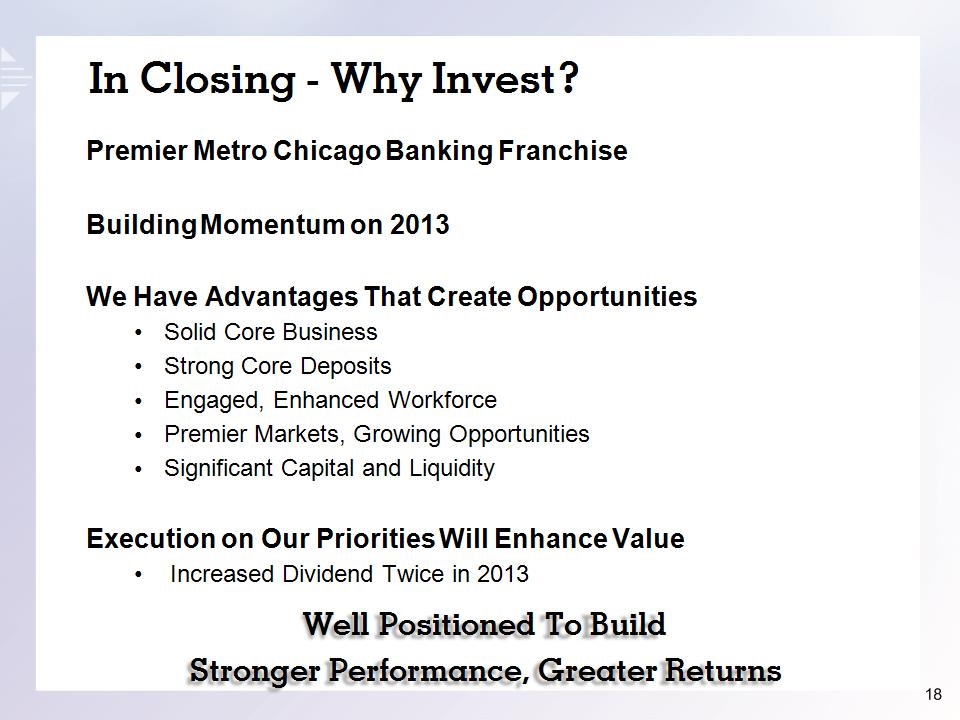
In Closing – Why Invest? Well Positioned To Build Stronger Performance, Greater Returns Premier Metro Chicago Banking Franchise Building Momentum on 2013 We Have Advantages That Create Opportunities Solid Core Business Strong Core Deposits Engaged, Enhanced Workforce Premier Markets, Growing Opportunities Significant Capital and Liquidity Execution on Our Priorities Will Enhance Value Increased Dividend Twice in 2013


Appendix
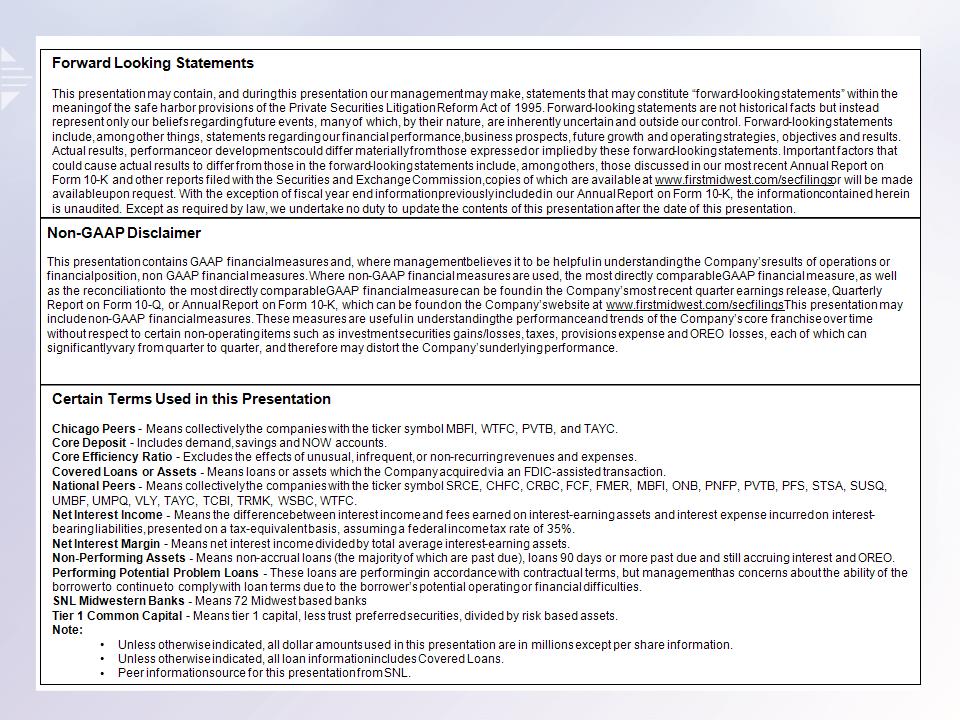
Certain Terms Used in this Presentation Chicago Peers – Means collectively the companies with the ticker symbol MBFI, WTFC, PVTB, and TAYC. Core Deposit – Includes demand, savings and NOW accounts. Core Efficiency Ratio – Excludes the effects of unusual, infrequent, or non-recurring revenues and expenses. Covered Loans or Assets – Means loans or assets which the Company acquired via an FDIC-assisted transaction. National Peers – Means collectively the companies with the ticker symbol SRCE, CHFC, CRBC, FCF, FMER, MBFI, ONB, PNFP, PVTB, PFS, STSA, SUSQ, UMBF, UMPQ, VLY, TAYC, TCBI, TRMK, WSBC, WTFC. Net Interest Income – Means the difference between interest income and fees earned on interest-earning assets and interest expense incurred on interest-bearing liabilities, presented on a tax-equivalent basis, assuming a federal income tax rate of 35%. Net Interest Margin – Means net interest income divided by total average interest-earning assets. Non-Performing Assets – Means non-accrual loans (the majority of which are past due), loans 90 days or more past due and still accruing interest and OREO. Performing Potential Problem Loans – These loans are performing in accordance with contractual terms, but management has concerns about the ability of the borrower to continue to comply with loan terms due to the borrower’s potential operating or financial difficulties. SNL Midwestern Banks – Means 72 Midwest based banks Tier 1 Common Capital – Means tier 1 capital, less trust preferred securities, divided by risk based assets. Note: Unless otherwise indicated, all dollar amounts used in this presentation are in millions except per share information. Unless otherwise indicated, all loan information includes Covered Loans. Peer information source for this presentation from SNL. Forward Looking Statements This presentation may contain, and during this presentation our management may make, statements that may constitute “forward-looking statements” within the meaning of the safe harbor provisions of the Private Securities Litigation Reform Act of 1995. Forward-looking statements are not historical facts but instead represent only our beliefs regarding future events, many of which, by their nature, are inherently uncertain and outside our control. Forward-looking statements include, among other things, statements regarding our financial performance, business prospects, future growth and operating strategies, objectives and results. Actual results, performance or developments could differ materially from those expressed or implied by these forward-looking statements. Important factors that could cause actual results to differ from those in the forward-looking statements include, among others, those discussed in our most recent Annual Report on Form 10-K and other reports filed with the Securities and Exchange Commission, copies of which are available at www.firstmidwest.com/secfilings or will be made available upon request. With the exception of fiscal year end information previously included in our Annual Report on Form 10-K, the information contained herein is unaudited. Except as required by law, we undertake no duty to update the contents of this presentation after the date of this presentation. Non-GAAP Disclaimer This presentation contains GAAP financial measures and, where management believes it to be helpful in understanding the Company’s results of operations or financial position, non GAAP financial measures. Where non-GAAP financial measures are used, the most directly comparable GAAP financial measure, as well as the reconciliation to the most directly comparable GAAP financial measure can be found in the Company’s most recent quarter earnings release, Quarterly Report on Form 10-Q, or Annual Report on Form 10-K, which can be found on the Company’s website at www.firstmidwest.com/secfilings. This presentation may include non-GAAP financial measures. These measures are useful in understanding the performance and trends of the Company’s core franchise over time without respect to certain non-operating items such as investment securities gains/losses, taxes, provisions expense and OREO losses, each of which can significantly vary from quarter to quarter, and therefore may distort the Company’s underlying performance.
First Midwest Bancorp, Inc. Contact Information Paul F. Clemens Executive Vice President & Chief Financial Officer Paul.clemens@firstmidwest.com 630-875-7347 James M. Roolf Senior Vice President & Corporate Relations Officer Jim.roolf@firstmidwest.com 630-875-7533