UNITED STATES
SECURITIES AND EXCHANGE COMMISSION
Washington, D.C. 20549
FORM N-CSR
CERTIFIED SHAREHOLDER REPORT OF REGISTERED
MANAGEMENT INVESTMENT COMPANIES
Investment Company Act file number 811-03466
Fidelity Hanover Street Trust
(Exact name of registrant as specified in charter)
245 Summer St., Boston, MA 02210
(Address of principal executive offices) (Zip code)
Margaret Carey, Secretary
245 Summer St.
Boston, Massachusetts 02210
(Name and address of agent for service)
Registrant's telephone number, including area code:
617-563-7000
| |
Date of fiscal year end: | December 31 |
|
|
Date of reporting period: | June 30, 2024 |
Item 1.
Reports to Stockholders
| |
| | SEMI-ANNUAL SHAREHOLDER REPORT | AS OF JUNE 30, 2024 | |
| | Fidelity® Emerging Markets Debt Central Fund Fidelity® Emerging Markets Debt Central Fund true |
| | | |
This semi-annual shareholder report contains information about Fidelity® Emerging Markets Debt Central Fund for the period January 1, 2024 to June 30, 2024. You can find additional information about the Fund at fundresearch.fidelity.com/prospectus/sec. You can also request this information by contacting us at 1-800-544-8544.
What were your Fund costs for the last six months?(based on hypothetical $10,000 investment)
| | Costs of a $10,000 investment | Costs paid as a percentage of a $10,000 investment | |
| Fidelity® Emerging Markets Debt Central Fund | $ 1 | 0.02% | |
Key Fund Statistics (as of June 30, 2024)
KEY FACTS | | |
| Fund Size | $2,114,976,064 | |
| Number of Holdings | 508 | |
| Portfolio Turnover | 15% | |
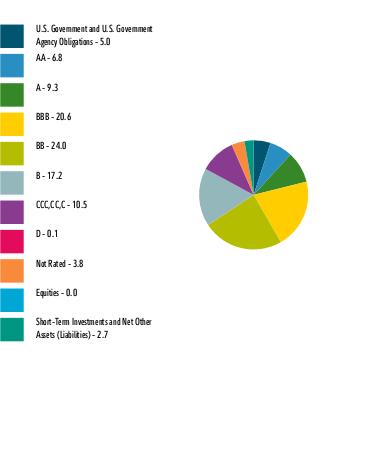
What did the Fund invest in?
(as of June 30, 2024)
| U.S. Government and U.S. Government Agency Obligations | 5.0 |
| AA | 6.8 |
| A | 9.3 |
| BBB | 20.6 |
| BB | 24.0 |
| B | 17.2 |
| CCC,CC,C | 10.5 |
| D | 0.1 |
| Not Rated | 3.8 |
| Equities | 0.0 |
| Short-Term Investments and Net Other Assets (Liabilities) | 2.7 |
QUALITY DIVERSIFICATION (% of Fund's net assets) |
|
| |
| We have used ratings from Moody's Investors Service, Inc. Where Moody's® ratings are not available, we have used S&P® ratings. All ratings are as of the date indicated and do not reflect subsequent changes. |
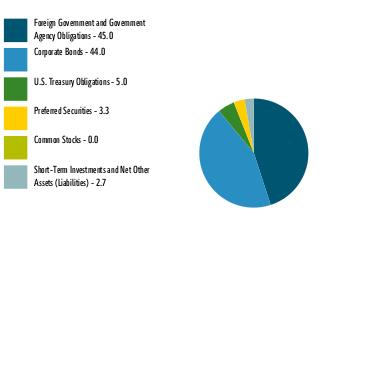
| Foreign Government and Government Agency Obligations | 45.0 |
| Corporate Bonds | 44.0 |
| U.S. Treasury Obligations | 5.0 |
| Preferred Securities | 3.3 |
| Common Stocks | 0.0 |
| Short-Term Investments and Net Other Assets (Liabilities) | 2.7 |
ASSET ALLOCATION (% of Fund's net assets) |
|
|
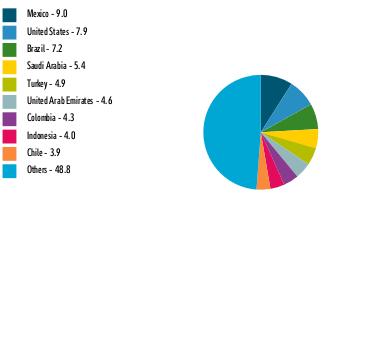
| Mexico | 9.0 |
| United States | 7.9 |
| Brazil | 7.2 |
| Saudi Arabia | 5.4 |
| Turkey | 4.9 |
| United Arab Emirates | 4.6 |
| Colombia | 4.3 |
| Indonesia | 4.0 |
| Chile | 3.9 |
| Others | 48.8 |
GEOGRAPHIC DIVERSIFICATION (% of Fund's net assets) |
|
| |
|
TOP HOLDINGS (% of Fund's net assets) | | |
| Republic of Turkiye/The | 4.2 | |
| Petroleos Mexicanos | 3.4 | |
| US Treasury Bonds | 3.3 | |
| Argentine Republic | 2.9 | |
| Indonesia Government | 2.3 | |
| Dominican Republic | 2.3 | |
| Saudi Arabian Oil Co | 2.0 | |
| United Mexican States | 1.9 | |
| State of Qatar | 1.8 | |
| Colombian Republic | 1.8 | |
| | 25.9 | |
| |
| Fidelity, the Fidelity Investments Logo and all other Fidelity trademarks or service marks used herein are trademarks or service marks of FMR LLC. Any third-party marks that are used herein are trademarks or service marks of their respective owners. © 2024 FMR LLC. All rights reserved. |
| | For additional information about the Fund; including its prospectus, financial information, holdings and proxy information, scan the QR code or visit fundresearch.fidelity.com/prospectus/sec 1.9916143.100 2276-TSRS-0824 |
| |
| | SEMI-ANNUAL SHAREHOLDER REPORT | AS OF JUNE 30, 2024 | |
| | Fidelity® Emerging Markets Debt Local Currency Central Fund Fidelity® Emerging Markets Debt Local Currency Central Fund true |
| | | |
This semi-annual shareholder report contains information about Fidelity® Emerging Markets Debt Local Currency Central Fund for the period January 1, 2024 to June 30, 2024. You can find additional information about the Fund at fundresearch.fidelity.com/prospectus/sec. You can also request this information by contacting us at 1-800-544-8544.
What were your Fund costs for the last six months?(based on hypothetical $10,000 investment)
| | Costs of a $10,000 investment | Costs paid as a percentage of a $10,000 investment | |
| Fidelity® Emerging Markets Debt Local Currency Central Fund | $ 1 | 0.02% | |
Key Fund Statistics (as of June 30, 2024)
KEY FACTS | | |
| Fund Size | $259,672,836 | |
| Number of Holdings | 235 | |
| Portfolio Turnover | 50% | |
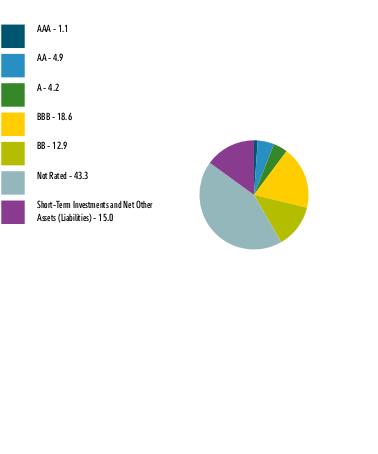
What did the Fund invest in?
(as of June 30, 2024)
| AAA | 1.1 |
| AA | 4.9 |
| A | 4.2 |
| BBB | 18.6 |
| BB | 12.9 |
| Not Rated | 43.3 |
| Short-Term Investments and Net Other Assets (Liabilities) | 15.0 |
QUALITY DIVERSIFICATION (% of Fund's net assets) |
|
| |
| We have used ratings from Moody's Investors Service, Inc. Where Moody's® ratings are not available, we have used S&P® ratings. All ratings are as of the date indicated and do not reflect subsequent changes. |
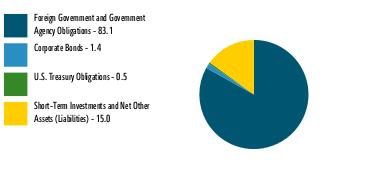
| Foreign Government and Government Agency Obligations | 83.1 |
| Corporate Bonds | 1.4 |
| U.S. Treasury Obligations | 0.5 |
| Short-Term Investments and Net Other Assets (Liabilities) | 15.0 |
ASSET ALLOCATION (% of Fund's net assets) |
|
|
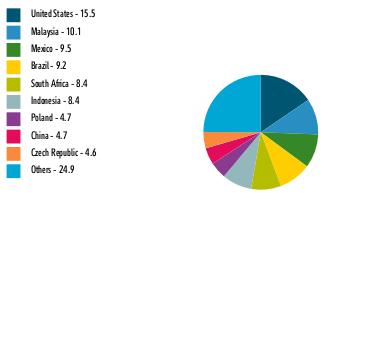
| United States | 15.5 |
| Malaysia | 10.1 |
| Mexico | 9.5 |
| Brazil | 9.2 |
| South Africa | 8.4 |
| Indonesia | 8.4 |
| Poland | 4.7 |
| China | 4.7 |
| Czech Republic | 4.6 |
| Others | 24.9 |
GEOGRAPHIC DIVERSIFICATION (% of Fund's net assets) |
|
| |
|
TOP HOLDINGS (% of Fund's net assets) | | |
| Malaysia Government | 10.1 | |
| United Mexican States | 9.5 | |
| South African Republic | 8.4 | |
| Indonesia Government | 8.4 | |
| Republic of Poland | 4.7 | |
| Peoples Republic of China | 4.7 | |
| Czech Republic | 4.6 | |
| Romanian Republic | 4.6 | |
| Brazil Notas do Tesouro Nacional Serie F | 4.4 | |
| Colombian Republic | 4.4 | |
| | 63.8 | |
| |
| Fidelity, the Fidelity Investments Logo and all other Fidelity trademarks or service marks used herein are trademarks or service marks of FMR LLC. Any third-party marks that are used herein are trademarks or service marks of their respective owners. © 2024 FMR LLC. All rights reserved. |
| | For additional information about the Fund; including its prospectus, financial information, holdings and proxy information, scan the QR code or visit fundresearch.fidelity.com/prospectus/sec 1.9916195.100 6286-TSRS-0824 |
Item 2.
Code of Ethics
Not applicable.
Item 3.
Audit Committee Financial Expert
Not applicable.
Item 4.
Principal Accountant Fees and Services
Not applicable.
Item 5.
Audit Committee of Listed Registrants
Not applicable.
Item 6.
Investments
(a)
Not applicable.
(b)
Not applicable
Item 7.
Financial Statements and Financial Highlights for Open-End Management Investment Companies
Fidelity® Emerging Markets Debt Central Fund
Fidelity® Emerging Markets Debt Local Currency Central Fund
Semi-Annual Report
June 30, 2024
Contents
To view a fund's proxy voting guidelines and proxy voting record for the 12-month period ended June 30, visit http://www.fidelity.com/proxyvotingresults or visit the Securities and Exchange Commission's (SEC) web site at http://www.sec.gov.
You may also call 1-800-544-8544 to request a free copy of the proxy voting guidelines.
Standard & Poor's, S&P and S&P 500 are registered service marks of The McGraw-Hill Companies, Inc. and have been licensed for use by Fidelity Distributors Corporation.
Other third-party marks appearing herein are the property of their respective owners.
All other marks appearing herein are registered or unregistered trademarks or service marks of FMR LLC or an affiliated company. © 2024 FMR LLC. All rights reserved.
A fund files its complete schedule of portfolio holdings with the SEC for the first and third quarters of each fiscal year on Form N-PORT. Forms N-PORT are available on the SEC's web site at http://www.sec.gov. A fund's Forms N-PORT may be reviewed and copied at the SEC's Public Reference Room in Washington, DC. Information regarding the operation of the SEC's Public Reference Room may be obtained by calling 1-800-SEC-0330.
Item 7: Financial Statements and Financial Highlights for Open-End Management Investment Companies (Semi-Annual Report)
Fidelity® Emerging Markets Debt Central Fund
Schedule of Investments June 30, 2024 (Unaudited)
Showing Percentage of Net Assets
| Nonconvertible Bonds - 43.4% |
| | | Principal Amount (a) | Value ($) |
| Azerbaijan - 0.6% | | | |
| Southern Gas Corridor CJSC 6.875% 3/24/26 (b) | | 9,935,000 | 10,003,303 |
| State Oil Co. of Azerbaijan Republic 6.95% 3/18/30 (Reg. S) | | 2,515,000 | 2,571,588 |
TOTAL AZERBAIJAN | | | 12,574,891 |
| Bahrain - 0.4% | | | |
| The Oil and Gas Holding Co.: | | | |
| 7.5% 10/25/27 (b) | | 5,740,000 | 5,849,419 |
| 8.375% 11/7/28 (b) | | 1,985,000 | 2,110,055 |
TOTAL BAHRAIN | | | 7,959,474 |
| Brazil - 5.3% | | | |
| Adecoagro SA 6% 9/21/27 (b) | | 5,465,000 | 5,280,556 |
| Aegea Finance SARL 9% 1/20/31 (b) | | 1,740,000 | 1,800,900 |
| Azul Secured Finance LLP: | | | |
| 11.5% 5/28/29 (b) | | 6,902,629 | 5,694,669 |
| 11.93% 8/28/28 (b) | | 2,850,000 | 2,765,391 |
| Banco Do Brasil SA 6% 3/18/31 (b) | | 4,020,000 | 3,950,906 |
| Braskem Netherlands BV: | | | |
| 5.875% 1/31/50 (b) | | 2,860,000 | 2,108,392 |
| 7.25% 2/13/33 (b) | | 3,610,000 | 3,402,425 |
| 8.5% 1/12/31 (b) | | 5,705,000 | 5,822,666 |
| Cosan Luxembourg SA 7.25% 6/27/31 (b) | | 2,870,000 | 2,895,830 |
| CSN Inova Ventures 6.75% 1/28/28 (b) | | 4,745,000 | 4,507,750 |
| CSN Resources SA: | | | |
| 5.875% 4/8/32 (b) | | 3,790,000 | 3,162,281 |
| 8.875% 12/5/30 (b) | | 1,575,000 | 1,565,156 |
| Embraer Netherlands Finance BV: | | | |
| 5.4% 2/1/27 | | 1,875,000 | 1,857,422 |
| 6.95% 1/17/28 (b) | | 2,725,000 | 2,800,789 |
| 7% 7/28/30 (b) | | 4,705,000 | 4,909,373 |
| Guara Norte SARL 5.198% 6/15/34 (b) | | 4,476,151 | 4,124,773 |
| MARB BondCo PLC 3.95% 1/29/31 (b) | | 3,925,000 | 3,252,844 |
| MC Brazil Downstream Trading SARL 7.25% 6/30/31 (b) | | 9,334,561 | 8,263,420 |
| Minerva Luxembourg SA 8.875% 9/13/33 (b) | | 3,080,000 | 3,180,892 |
| NBM U.S. Holdings, Inc. 6.625% 8/6/29 (b) | | 6,505,000 | 6,423,688 |
| Nexa Resources SA: | | | |
| 6.5% 1/18/28 (b) | | 3,875,000 | 3,901,641 |
| 6.75% 4/9/34 (b) | | 1,420,000 | 1,433,632 |
| Petrorio Luxembourg Holding SA 6.125% 6/9/26 (b) | | 2,225,000 | 2,176,328 |
| Raizen Fuels Finance SA 6.95% 3/5/54 (b) | | 3,465,000 | 3,516,975 |
| Samarco Mineracao SA 9% 6/30/31 pay-in-kind (b)(c) | | 9,960,274 | 9,246,869 |
| Sitios Latinoamerica S.A.B. de CV 5.375% 4/4/32 (b) | | 3,575,000 | 3,314,695 |
| Suzano Austria GmbH 3.75% 1/15/31 | | 2,340,000 | 2,038,140 |
| Vale Overseas Ltd. 6.4% 6/28/54 | | 4,850,000 | 4,800,045 |
| Yinson Boronia Production BV 8.947% 7/31/42 (b) | | 4,505,000 | 4,536,535 |
TOTAL BRAZIL | | | 112,734,983 |
| Burkina Faso - 0.2% | | | |
| Endeavour Mining PLC 5% 10/14/26 (b) | | 5,220,000 | 4,949,213 |
| Cambodia - 0.2% | | | |
| NagaCorp Ltd. 7.95% 7/6/24 (Reg. S) | | 4,110,000 | 4,082,463 |
| Chile - 2.3% | | | |
| Antofagasta PLC: | | | |
| 2.375% 10/14/30 (b) | | 7,745,000 | 6,440,452 |
| 5.625% 5/13/32 (b) | | 2,640,000 | 2,632,575 |
| Chile Electricity LUX MPC SARL 6.01% 1/20/33 (b) | | 1,750,000 | 1,770,685 |
| Corporacion Nacional del Cobre de Chile (Codelco): | | | |
| 3% 9/30/29 (b) | | 1,175,000 | 1,036,938 |
| 3.15% 1/14/30 (b) | | 3,075,000 | 2,718,492 |
| 3.7% 1/30/50 (b) | | 7,190,000 | 4,902,681 |
| 5.125% 2/2/33 (b) | | 2,775,000 | 2,631,047 |
| 5.95% 1/8/34 (b) | | 2,985,000 | 2,971,568 |
| 6.3% 9/8/53 (b) | | 2,750,000 | 2,711,328 |
| 6.44% 1/26/36 (b) | | 1,925,000 | 1,979,141 |
| Empresa Nacional de Petroleo 6.15% 5/10/33 (b) | | 1,195,000 | 1,192,610 |
| Inversiones CMPC SA 3% 4/6/31 (b) | | 2,340,000 | 1,985,344 |
| Sable International Finance Ltd. 5.75% 9/7/27 (b) | | 5,292,000 | 5,098,511 |
| VTR Comunicaciones SpA: | | | |
| 4.375% 4/15/29 (b) | | 1,645,000 | 1,423,180 |
| 5.125% 1/15/28 (b) | | 7,560,000 | 6,858,338 |
| VTR Finance BV 6.375% 7/15/28 (b) | | 3,510,000 | 3,055,894 |
TOTAL CHILE | | | 49,408,784 |
| China - 2.6% | | | |
| Alibaba Group Holding Ltd. 2.125% 2/9/31 | | 3,260,000 | 2,691,228 |
| ENN Clean Energy International Investment Ltd. 3.375% 5/12/26 (b) | | 4,855,000 | 4,628,939 |
| ENN Energy Holdings Ltd. 4.625% 5/17/27 (b) | | 5,425,000 | 5,311,414 |
| JD.com, Inc. 3.375% 1/14/30 | | 7,905,000 | 7,201,929 |
| Lenovo Group Ltd.: | | | |
| 3.421% 11/2/30 (b) | | 5,335,000 | 4,709,805 |
| 5.875% 4/24/25 (Reg. S) | | 1,295,000 | 1,292,915 |
| Meituan: | | | |
| 2.125% 10/28/25 (b) | | 3,045,000 | 2,907,792 |
| 3.05% 10/28/30 (b) | | 3,705,000 | 3,187,458 |
| Prosus NV: | | | |
| 2.031% 8/3/32 (Reg. S) | EUR | 2,295,000 | 1,993,743 |
| 3.061% 7/13/31 (b) | | 1,850,000 | 1,533,188 |
| 3.68% 1/21/30 (b) | | 4,055,000 | 3,597,545 |
| 4.027% 8/3/50 (b) | | 6,570,000 | 4,488,131 |
| 4.193% 1/19/32 (b) | | 2,005,000 | 1,772,545 |
| Tencent Holdings Ltd.: | | | |
| 1.81% 1/26/26 (b) | | 2,605,000 | 2,469,866 |
| 2.39% 6/3/30 (b) | | 5,400,000 | 4,638,222 |
| 3.975% 4/11/29 (b) | | 1,960,000 | 1,860,163 |
TOTAL CHINA | | | 54,284,883 |
| Colombia - 2.4% | | | |
| Aris Mining Corp. 6.875% 8/9/26 (b) | | 6,700,000 | 6,310,563 |
| Bancolombia SA 8.625% 12/24/34 (c) | | 2,800,000 | 2,853,200 |
| Canacol Energy Ltd. 5.75% 11/24/28 (b) | | 2,525,000 | 1,342,195 |
| Colombia Telecomunicaciones SA 4.95% 7/17/30 (b) | | 2,325,000 | 1,816,406 |
| Ecopetrol SA: | | | |
| 4.625% 11/2/31 | | 3,870,000 | 3,172,239 |
| 8.875% 1/13/33 | | 9,290,000 | 9,591,925 |
| EnfraGen Energia Sur SA 5.375% 12/30/30 (b) | | 10,370,000 | 8,675,153 |
| GeoPark Ltd. 5.5% 1/17/27 (b) | | 4,900,000 | 4,445,219 |
| Gran Tierra Energy, Inc. 9.5% 10/15/29 (b) | | 2,645,000 | 2,524,653 |
| Oleoducto Central SA 4% 7/14/27 (b) | | 4,675,000 | 4,333,725 |
| Termocandelaria Power Ltd. 7.875% 1/30/29 (b) | | 4,417,000 | 4,429,423 |
TOTAL COLOMBIA | | | 49,494,701 |
| Costa Rica - 0.2% | | | |
| Liberty Costa Rica SR SF 10.875% 1/15/31 (b) | | 4,075,000 | 4,322,047 |
| Czech Republic - 0.2% | | | |
| Energo-Pro A/S 8.5% 2/4/27 (b) | | 4,600,000 | 4,598,563 |
| Dominican Republic - 0.1% | | | |
| Aeropuertos Dominicanos Siglo XXI SA 7% 6/30/34 (b)(d) | | 2,840,000 | 2,861,584 |
| Ghana - 1.2% | | | |
| Kosmos Energy Ltd.: | | | |
| 7.125% 4/4/26 (b) | | 14,130,000 | 13,926,881 |
| 7.5% 3/1/28 (b) | | 945,000 | 901,589 |
| Tullow Oil PLC: | | | |
| 7% 3/1/25 (b) | | 1,285,000 | 1,231,592 |
| 10.25% 5/15/26 (b) | | 8,544,375 | 8,098,465 |
TOTAL GHANA | | | 24,158,527 |
| Guatemala - 1.1% | | | |
| Central American Bottling Corp. 5.25% 4/27/29 (b) | | 5,695,000 | 5,296,350 |
| CT Trust 5.125% 2/3/32 (b) | | 7,360,000 | 6,502,560 |
| Investment Energy Resources Ltd. 6.25% 4/26/29 (b) | | 5,270,000 | 4,962,034 |
| Millicom International Cellular SA: | | | |
| 4.5% 4/27/31 (b) | | 3,345,000 | 2,872,519 |
| 7.375% 4/2/32 (b) | | 2,545,000 | 2,537,365 |
TOTAL GUATEMALA | | | 22,170,828 |
| Hungary - 0.2% | | | |
| Magyar Export-Import Bank 6.125% 12/4/27 (b) | | 1,825,000 | 1,831,273 |
| OTP Bank PLC 8.75% 5/15/33 (Reg. S) (c) | | 2,150,000 | 2,250,109 |
TOTAL HUNGARY | | | 4,081,382 |
| India - 0.6% | | | |
| CA Magnum Holdings 5.375% 10/31/26 (b) | | 6,365,000 | 6,088,520 |
| Shriram Finance Ltd.: | | | |
| 4.15% 7/18/25 (b) | | 5,205,000 | 5,078,141 |
| 6.625% 4/22/27 (b) | | 2,175,000 | 2,173,641 |
TOTAL INDIA | | | 13,340,302 |
| Indonesia - 1.7% | | | |
| Medco Laurel Tree PTE Ltd. 6.95% 11/12/28 (b) | | 6,620,000 | 6,466,813 |
| Medco Maple Tree Pte. Ltd. 8.96% 4/27/29 (b) | | 5,210,000 | 5,450,963 |
| Medco Oak Tree Pte Ltd. 7.375% 5/14/26 (b) | | 597,000 | 600,731 |
| PT Adaro Indonesia 4.25% 10/31/24 (b) | | 5,325,000 | 5,272,123 |
| PT Freeport Indonesia: | | | |
| 4.763% 4/14/27 (b) | | 2,350,000 | 2,300,321 |
| 5.315% 4/14/32 (b) | | 3,980,000 | 3,851,645 |
| 6.2% 4/14/52 (b) | | 2,720,000 | 2,664,750 |
| PT Indonesia Asahan Aluminium 5.45% 5/15/30 (b) | | 6,445,000 | 6,316,100 |
| PT Pertamina Geothermal Energy 5.15% 4/27/28 (b) | | 1,940,000 | 1,921,813 |
| PT Pertamina Persero 4.175% 1/21/50 (b) | | 2,365,000 | 1,824,006 |
TOTAL INDONESIA | | | 36,669,265 |
| Israel - 1.5% | | | |
| Energean Israel Finance Ltd. 4.875% 3/30/26 (Reg. S) (b) | | 7,160,000 | 6,748,300 |
| Energean PLC 6.5% 4/30/27 (b) | | 5,725,000 | 5,636,978 |
| Israel Electric Corp. Ltd. 3.75% 2/22/32 (Reg. S) (b) | | 6,285,000 | 5,163,913 |
| Leviathan Bond Ltd. 6.125% 6/30/25 (Reg. S) (b) | | 5,160,000 | 4,994,777 |
| Teva Pharmaceutical Finance Netherlands III BV: | | | |
| 4.75% 5/9/27 | | 2,895,000 | 2,789,806 |
| 7.875% 9/15/29 | | 5,240,000 | 5,629,563 |
TOTAL ISRAEL | | | 30,963,337 |
| Kazakhstan - 0.5% | | | |
| KazMunaiGaz National Co.: | | | |
| 3.5% 4/14/33 (b) | | 3,745,000 | 3,067,389 |
| 5.375% 4/24/30 (b) | | 685,000 | 668,303 |
| 5.75% 4/19/47 (b) | | 1,885,000 | 1,644,663 |
| Tengizchevroil Finance Co. International Ltd. 3.25% 8/15/30 (b) | | 6,950,000 | 5,738,094 |
TOTAL KAZAKHSTAN | | | 11,118,449 |
| Korea (South) - 0.2% | | | |
| POSCO: | | | |
| 5.75% 1/17/28 (b) | | 2,950,000 | 2,988,989 |
| 5.875% 1/17/33 (b) | | 1,750,000 | 1,800,236 |
TOTAL KOREA (SOUTH) | | | 4,789,225 |
| Kuwait - 0.4% | | | |
| MEGlobal BV: | | | |
| 2.625% 4/28/28 (b) | | 2,960,000 | 2,656,230 |
| 4.25% 11/3/26 (b) | | 2,425,000 | 2,346,491 |
| MEGlobal Canada, Inc. 5% 5/18/25 (b) | | 3,750,000 | 3,712,500 |
TOTAL KUWAIT | | | 8,715,221 |
| Malaysia - 0.9% | | | |
| GENM Capital Labuan Ltd. 3.882% 4/19/31 (b) | | 5,185,000 | 4,536,875 |
| MISC Capital Two (Labuan) Ltd.: | | | |
| 3.625% 4/6/25 (b) | | 3,690,000 | 3,633,857 |
| 3.75% 4/6/27 (b) | | 5,890,000 | 5,635,493 |
| Petronas Capital Ltd.: | | | |
| 3.404% 4/28/61 (b) | | 4,990,000 | 3,291,703 |
| 3.5% 4/21/30 (b) | | 2,515,000 | 2,305,727 |
TOTAL MALAYSIA | | | 19,403,655 |
| Mauritius - 0.3% | | | |
| AXIAN Telecom 7.375% 2/16/27 (b) | | 5,485,000 | 5,344,803 |
| Mexico - 5.6% | | | |
| Bimbo Bakeries U.S.A., Inc.: | | | |
| 5.375% 1/9/36 (b) | | 1,845,000 | 1,796,569 |
| 6.4% 1/15/34 (b) | | 3,780,000 | 3,991,444 |
| Braskem Idesa SAPI: | | | |
| 6.99% 2/20/32 (b) | | 1,965,000 | 1,495,365 |
| 7.45% 11/15/29 (b) | | 6,340,000 | 5,135,400 |
| Buffalo Energy Mexico Holdings 7.875% 2/15/39 (b) | | 3,075,000 | 3,189,352 |
| FEL Energy VI SARL 5.75% 12/1/40 (b) | | 2,770,304 | 2,494,139 |
| Fresnillo PLC 4.25% 10/2/50 (b) | | 3,785,000 | 2,786,706 |
| GRUP KUO, S.A.B. de CV 5.75% 7/7/27 (b) | | 3,380,000 | 3,263,525 |
| Grupo Axo SAPI de CV 5.75% 6/8/26 (b) | | 3,380,000 | 3,407,885 |
| Metalsa SA de CV 3.75% 5/4/31 (b) | | 4,945,000 | 3,948,583 |
| Orbia Advance Corp. S.A.B. de CV: | | | |
| 1.875% 5/11/26 (b) | | 6,640,000 | 6,186,488 |
| 2.875% 5/11/31 (b) | | 3,435,000 | 2,839,242 |
| Petroleos Mexicanos: | | | |
| 6.5% 6/2/41 | | 2,000,000 | 1,360,000 |
| 6.625% 6/15/35 | | 21,045,000 | 15,967,894 |
| 6.7% 2/16/32 | | 11,627,000 | 9,727,962 |
| 6.75% 9/21/47 | | 8,402,000 | 5,535,826 |
| 6.875% 8/4/26 | | 4,835,000 | 4,726,213 |
| 6.95% 1/28/60 | | 5,655,000 | 3,713,921 |
| 7.69% 1/23/50 | | 39,799,000 | 28,686,323 |
| TV Azteca SA de CV 8.25% (Reg. S) (e) | | 19,500,000 | 7,579,845 |
TOTAL MEXICO | | | 117,832,682 |
| Morocco - 0.6% | | | |
| OCP SA: | | | |
| 3.75% 6/23/31 (b) | | 3,820,000 | 3,301,913 |
| 5.125% 6/23/51 (b) | | 2,190,000 | 1,648,659 |
| 6.75% 5/2/34 (b) | | 2,485,000 | 2,550,231 |
| 6.875% 4/25/44 (b) | | 3,920,000 | 3,753,400 |
| 7.5% 5/2/54 (b) | | 1,890,000 | 1,925,759 |
TOTAL MOROCCO | | | 13,179,962 |
| Nigeria - 0.6% | | | |
| Access Bank PLC 6.125% 9/21/26 (b) | | 4,447,000 | 4,231,598 |
| IHS Holding Ltd. 5.625% 11/29/26 (b) | | 4,305,000 | 4,085,714 |
| IHS Netherlands Holdco BV 8% 9/18/27 (b) | | 3,265,000 | 3,170,111 |
TOTAL NIGERIA | | | 11,487,423 |
| Oman - 0.2% | | | |
| Lamar Funding Ltd. 3.958% 5/7/25 (b) | | 4,980,000 | 4,855,500 |
| Panama - 0.8% | | | |
| Aeropuerto Internacional de Tocumen SA 5.125% 8/11/61 (b) | | 2,115,000 | 1,559,813 |
| C&W Senior Finance Ltd. 6.875% 9/15/27 (b) | | 5,915,000 | 5,675,257 |
| Telecomunicaciones Digitales SA 4.5% 1/30/30 (b) | | 9,720,000 | 8,663,436 |
TOTAL PANAMA | | | 15,898,506 |
| Paraguay - 0.3% | | | |
| Telefonica Celular del Paraguay SA 5.875% 4/15/27 (b) | | 6,185,000 | 6,051,636 |
| Peru - 0.6% | | | |
| Auna SA 10% 12/15/29 (b) | | 2,724,200 | 2,783,397 |
| Camposol SA 6% 2/3/27 (b) | | 3,128,000 | 2,643,160 |
| Compania de Minas Buenaventura SAA 5.5% 7/23/26 (b) | | 3,690,000 | 3,564,309 |
| Volcan Compania Minera SAA 4.375% 2/11/26 (b) | | 4,550,000 | 3,527,672 |
TOTAL PERU | | | 12,518,538 |
| Puerto Rico - 0.3% | | | |
| LCPR Senior Secured Financing DAC 5.125% 7/15/29 (b) | | 6,800,000 | 5,638,736 |
| Qatar - 1.8% | | | |
| QatarEnergy: | | | |
| 1.375% 9/12/26 (b) | | 8,475,000 | 7,797,000 |
| 2.25% 7/12/31 (b) | | 13,045,000 | 10,892,575 |
| 3.125% 7/12/41 (b) | | 12,920,000 | 9,593,100 |
| 3.3% 7/12/51 (b) | | 9,635,000 | 6,732,456 |
| Qtel International Finance Ltd. 2.625% 4/8/31 (b) | | 4,095,000 | 3,528,098 |
TOTAL QATAR | | | 38,543,229 |
| Russia - 0.0% | | | |
| TMK Capital SA 4.3% (Reg. S) (e)(f) | | 4,020,000 | 603,000 |
| Saudi Arabia - 3.7% | | | |
| EIG Pearl Holdings SARL 3.545% 8/31/36 (b) | | 13,705,000 | 11,777,734 |
| GACI First Investment 5.25% 10/13/32 (Reg. S) | | 2,155,000 | 2,143,552 |
| Greensaif Pipelines Bidco SARL: | | | |
| 6.129% 2/23/38 (b) | | 9,650,000 | 9,864,109 |
| 6.51% 2/23/42 (b) | | 2,955,000 | 3,095,363 |
| SA Global Sukuk Ltd. 1.602% 6/17/26 (b) | | 8,175,000 | 7,628,297 |
| Saudi Arabian Oil Co.: | | | |
| 2.25% 11/24/30 (b) | | 10,775,000 | 9,084,672 |
| 3.25% 11/24/50 (b) | | 8,390,000 | 5,642,275 |
| 3.5% 4/16/29 (b) | | 13,480,000 | 12,536,400 |
| 3.5% 11/24/70 (b) | | 3,270,000 | 2,109,150 |
| 4.25% 4/16/39 (b) | | 14,945,000 | 12,983,469 |
| 4.375% 4/16/49 (b) | | 2,280,000 | 1,874,588 |
TOTAL SAUDI ARABIA | | | 78,739,609 |
| South Africa - 1.8% | | | |
| Eskom Holdings SOC Ltd.: | | | |
| 6.35% 8/10/28 (b) | | 5,840,000 | 5,656,274 |
| 7.125% 2/11/25 (b) | | 7,180,000 | 7,153,075 |
| 8.45% 8/10/28 (b) | | 2,350,000 | 2,362,484 |
| Liquid Telecommunications Financing PLC 5.5% 9/4/26 (b) | | 8,595,000 | 5,447,081 |
| MTN (Mauritius) Investments Ltd. 6.5% 10/13/26 (b) | | 3,485,000 | 3,467,575 |
| Sasol Financing U.S.A. LLC: | | | |
| 4.375% 9/18/26 | | 8,935,000 | 8,412,861 |
| 5.5% 3/18/31 | | 2,355,000 | 1,985,458 |
| Stillwater Mining Co. 4% 11/16/26 (b) | | 4,255,000 | 3,888,006 |
TOTAL SOUTH AFRICA | | | 38,372,814 |
| Thailand - 0.1% | | | |
| PTT Treasury Center Co. Ltd. 3.7% 7/16/70 (b) | | 2,530,000 | 1,722,095 |
| Turkey - 0.5% | | | |
| Aydem Yenilenebilir Enerji A/S 7.75% 2/2/27 (b) | | 2,520,000 | 2,447,550 |
| Sisecam UK PLC 8.625% 5/2/32 (b) | | 5,680,000 | 5,777,625 |
| Vestel Elektonik Sanayi ve Ticaret A/S 9.75% 5/15/29 (b) | | 3,045,000 | 3,040,242 |
TOTAL TURKEY | | | 11,265,417 |
| Ukraine - 0.4% | | | |
| Metinvest BV 8.5% 4/23/26 (Reg. S) | | 1,825,000 | 1,460,000 |
| NAK Naftogaz Ukraine: | | | |
| 7.625% 11/8/28 (b) | | 2,355,000 | 1,766,250 |
| 7.65% (Reg. S) (e) | | 6,189,250 | 5,694,110 |
TOTAL UKRAINE | | | 8,920,360 |
| United Arab Emirates - 2.4% | | | |
| Abu Dhabi Developmental Holding Co. PJSC 5.5% 5/8/34 (b) | | 2,220,000 | 2,279,940 |
| Abu Dhabi National Energy Co. PJSC: | | | |
| 4% 10/3/49 (b) | | 4,655,000 | 3,763,277 |
| 4.696% 4/24/33 (b) | | 3,320,000 | 3,237,000 |
| 4.875% 4/23/30 (b) | | 2,020,000 | 2,016,844 |
| DP World Crescent Ltd. 3.7495% 1/30/30 (b) | | 4,165,000 | 3,847,419 |
| DP World Ltd. 5.625% 9/25/48 (b) | | 4,230,000 | 4,023,788 |
| Galaxy Pipeline Assets BidCo Ltd.: | | | |
| 2.16% 3/31/34 (b) | | 3,286,172 | 2,818,919 |
| 2.625% 3/31/36 (b) | | 10,925,000 | 8,900,461 |
| GEMS MENASA Cayman Ltd./GEMS Education Delaware LLC 7.125% 7/31/26 (b) | | 6,160,000 | 6,121,500 |
| MDGH GMTN RSC Ltd.: | | | |
| 2.875% 11/7/29 (b) | | 5,770,000 | 5,193,000 |
| 4.375% 11/22/33 (b) | | 2,925,000 | 2,756,813 |
| 5.084% 5/22/53 (b) | | 3,770,000 | 3,566,184 |
| 5.5% 4/28/33 (b) | | 2,985,000 | 3,064,289 |
TOTAL UNITED ARAB EMIRATES | | | 51,589,434 |
| United Kingdom - 0.0% | | | |
| Celtic Resources Holdings DAC 4.125% (b)(e)(f) | | 5,060,000 | 725,402 |
| United States of America - 0.2% | | | |
| Sagicor Financial Co. Ltd. 5.3% 5/13/28 (b) | | 3,595,000 | 3,419,492 |
| Venezuela - 0.2% | | | |
| Petroleos de Venezuela SA: | | | |
| 5.375% (e) | | 4,800,000 | 561,264 |
| 5.5% (e) | | 315,000 | 36,698 |
| 6% (b)(e) | | 11,650,000 | 1,380,525 |
| 6% (b)(e) | | 9,300,000 | 1,102,050 |
| 9.75% (b)(e) | | 1,265,000 | 172,673 |
| 12.75% (b)(e) | | 1,258,333 | 179,942 |
TOTAL VENEZUELA | | | 3,433,152 |
| Vietnam - 0.2% | | | |
| Mong Duong Finance Holdings BV 5.125% 5/7/29 (b) | | 4,258,568 | 4,054,955 |
| TOTAL NONCONVERTIBLE BONDS (Cost $1,015,691,352) | | | 916,878,522 |
| | | | |
| Government Obligations - 50.6% |
| | | Principal Amount (a) | Value ($) |
| Angola - 0.8% | | | |
| Angola Republic: | | | |
| 8.25% 5/9/28 (b) | | 5,980,000 | 5,613,725 |
| 8.75% 4/14/32 (b) | | 2,570,000 | 2,275,253 |
| 9.375% 5/8/48 (b) | | 2,395,000 | 2,003,567 |
| 9.5% 11/12/25 (b) | | 7,565,000 | 7,671,383 |
TOTAL ANGOLA | | | 17,563,928 |
| Argentina - 3.4% | | | |
| Argentine Republic: | | | |
| 0.75% 7/9/30 (g) | | 54,812,307 | 30,749,704 |
| 1% 7/9/29 | | 8,025,564 | 4,587,111 |
| 3.5% 7/9/41 (g) | | 11,065,000 | 4,337,480 |
| 3.625% 7/9/35 (g) | | 34,047,842 | 14,300,094 |
| 4.25% 1/9/38 (g) | | 16,906,530 | 7,760,097 |
| Bonos para la Reconstruccion de una Argentina Libre 0% 6/30/25 | | 5,120,000 | 4,816,230 |
| Provincia de Cordoba: | | | |
| 6.875% 12/10/25 (b) | | 1,237,382 | 1,146,224 |
| 6.99% 6/1/27 (b) | | 5,456,546 | 4,508,198 |
TOTAL ARGENTINA | | | 72,205,138 |
| Armenia - 0.1% | | | |
| Republic of Armenia 3.6% 2/2/31 (b) | | 2,505,000 | 2,040,792 |
| Bahamas (Nassau) - 0.1% | | | |
| Bahamian Republic 6% 11/21/28 (b) | | 2,980,000 | 2,605,638 |
| Bahrain - 0.1% | | | |
| Bahrain Kingdom: | | | |
| 5.625% 5/18/34 (b) | | 1,330,000 | 1,192,013 |
| 7.5% 2/12/36 (b) | | 1,925,000 | 1,965,305 |
TOTAL BAHRAIN | | | 3,157,318 |
| Barbados - 0.2% | | | |
| Barbados Government 6.5% 10/1/29 (b) | | 3,535,000 | 3,346,098 |
| Benin - 0.3% | | | |
| Republic of Benin: | | | |
| 4.875% 1/19/32 (b) | EUR | 3,510,000 | 3,145,842 |
| 7.96% 2/13/38 (b) | | 2,710,000 | 2,515,219 |
TOTAL BENIN | | | 5,661,061 |
| Bermuda - 0.7% | | | |
| Bermuda Government: | | | |
| 2.375% 8/20/30 (b) | | 520,000 | 437,288 |
| 3.375% 8/20/50 (b) | | 1,825,000 | 1,242,711 |
| 3.717% 1/25/27 (b) | | 7,240,000 | 6,909,675 |
| 4.75% 2/15/29 (b) | | 3,960,000 | 3,834,626 |
| 5% 7/15/32 (b) | | 1,590,000 | 1,535,344 |
TOTAL BERMUDA | | | 13,959,644 |
| Brazil - 1.4% | | | |
| Brazilian Federative Republic: | | | |
| 3.875% 6/12/30 | | 6,525,000 | 5,758,313 |
| 6% 10/20/33 | | 3,180,000 | 3,055,980 |
| 7.125% 1/20/37 | | 6,165,000 | 6,442,425 |
| 7.125% 5/13/54 | | 835,000 | 806,193 |
| 8.25% 1/20/34 | | 11,540,000 | 13,109,440 |
TOTAL BRAZIL | | | 29,172,351 |
| Chile - 1.3% | | | |
| Chilean Republic: | | | |
| 2.45% 1/31/31 | | 12,490,000 | 10,653,970 |
| 2.75% 1/31/27 | | 2,635,000 | 2,477,723 |
| 3.1% 1/22/61 | | 6,730,000 | 4,166,291 |
| 3.5% 1/31/34 | | 2,180,000 | 1,892,240 |
| 4% 1/31/52 | | 1,910,000 | 1,476,669 |
| 4.34% 3/7/42 | | 2,615,000 | 2,257,346 |
| 5.33% 1/5/54 | | 4,770,000 | 4,507,650 |
TOTAL CHILE | | | 27,431,889 |
| Colombia - 1.9% | | | |
| Colombian Republic: | | | |
| 3% 1/30/30 | | 8,400,000 | 6,867,000 |
| 3.125% 4/15/31 | | 5,855,000 | 4,613,740 |
| 3.25% 4/22/32 | | 2,805,000 | 2,151,435 |
| 4.125% 5/15/51 | | 2,355,000 | 1,414,178 |
| 5% 6/15/45 | | 9,490,000 | 6,666,725 |
| 5.2% 5/15/49 | | 6,915,000 | 4,875,075 |
| 6.125% 1/18/41 | | 440,000 | 369,820 |
| 7.375% 9/18/37 | | 1,475,000 | 1,431,488 |
| 7.5% 2/2/34 | | 2,055,000 | 2,056,028 |
| 8% 4/20/33 | | 1,530,000 | 1,585,845 |
| 8% 11/14/35 | | 2,860,000 | 2,937,220 |
| 8.75% 11/14/53 | | 2,695,000 | 2,837,835 |
| Ecopetrol SA 8.375% 1/19/36 | | 2,790,000 | 2,738,385 |
TOTAL COLOMBIA | | | 40,544,774 |
| Costa Rica - 0.3% | | | |
| Costa Rican Republic: | | | |
| 5.625% 4/30/43 (b) | | 2,610,000 | 2,326,978 |
| 6.125% 2/19/31 (b) | | 1,370,000 | 1,374,709 |
| 7.3% 11/13/54 (b) | | 3,030,000 | 3,156,881 |
TOTAL COSTA RICA | | | 6,858,568 |
| Dominican Republic - 2.3% | | | |
| Dominican Republic: | | | |
| 4.5% 1/30/30 (b) | | 2,550,000 | 2,323,688 |
| 4.875% 9/23/32 (b) | | 12,965,000 | 11,627,984 |
| 5.875% 1/30/60 (b) | | 2,970,000 | 2,526,356 |
| 5.95% 1/25/27 (b) | | 6,155,000 | 6,118,070 |
| 6% 7/19/28 (b) | | 3,955,000 | 3,919,405 |
| 6.5% 2/15/48 (b) | | 2,135,000 | 2,025,581 |
| 6.6% 6/1/36 (b) | | 2,112,000 | 2,104,608 |
| 6.85% 1/27/45 (b) | | 3,300,000 | 3,238,950 |
| 6.875% 1/29/26 (b) | | 7,160,000 | 7,240,550 |
| 7.05% 2/3/31 (b) | | 2,795,000 | 2,877,103 |
| 7.45% 4/30/44 (b) | | 3,510,000 | 3,685,500 |
TOTAL DOMINICAN REPUBLIC | | | 47,687,795 |
| Ecuador - 0.5% | | | |
| Ecuador Republic: | | | |
| 3.5% 7/31/35 (b)(g) | | 7,555,000 | 3,765,695 |
| 6% 7/31/30 (b)(g) | | 10,005,000 | 6,331,289 |
TOTAL ECUADOR | | | 10,096,984 |
| Egypt - 1.4% | | | |
| Arab Republic of Egypt: | | | |
| , yield at date of purchase 25.8506% to 31.6253% 12/10/24 to 3/18/25 | EGP | 308,800,000 | 5,557,708 |
| 7.5% 1/31/27 (b) | | 7,330,000 | 7,039,091 |
| 7.5% 2/16/61 (b) | | 5,040,000 | 3,368,925 |
| 7.6003% 3/1/29 (b) | | 2,520,000 | 2,286,113 |
| 7.903% 2/21/48 (b) | | 4,675,000 | 3,281,266 |
| 8.5% 1/31/47 (b) | | 7,100,000 | 5,254,000 |
| 8.7002% 3/1/49 (b) | | 4,745,000 | 3,535,025 |
TOTAL EGYPT | | | 30,322,128 |
| El Salvador - 0.3% | | | |
| El Salvador Republic: | | | |
| 0.25% 4/17/30 (b) | | 2,770,000 | 80,330 |
| 6.375% 1/18/27 (b) | | 780,000 | 691,860 |
| 7.1246% 1/20/50 (b) | | 3,170,000 | 2,007,997 |
| 7.625% 2/1/41 (b) | | 935,000 | 629,255 |
| 7.65% 6/15/35 (b) | | 1,490,000 | 1,072,334 |
| 9.25% 4/17/30 (b) | | 2,770,000 | 2,460,364 |
TOTAL EL SALVADOR | | | 6,942,140 |
| Gabon - 0.3% | | | |
| Gabonese Republic: | | | |
| 6.625% 2/6/31 (b) | | 4,070,000 | 3,072,850 |
| 7% 11/24/31 (b) | | 3,880,000 | 2,929,400 |
TOTAL GABON | | | 6,002,250 |
| Georgia - 0.2% | | | |
| Georgia Republic 2.75% 4/22/26 (b) | | 3,890,000 | 3,553,272 |
| Ghana - 0.3% | | | |
| Ghana Republic: | | | |
| 7.75% (b)(e) | | 3,290,000 | 1,667,619 |
| 8.627% (b)(e) | | 2,150,000 | 1,075,000 |
| 10.75% 10/14/30 (b) | | 4,545,000 | 3,065,034 |
TOTAL GHANA | | | 5,807,653 |
| Guatemala - 0.3% | | | |
| Guatemalan Republic: | | | |
| 4.9% 6/1/30 (b) | | 2,510,000 | 2,375,872 |
| 5.375% 4/24/32 (b) | | 1,340,000 | 1,270,906 |
| 6.125% 6/1/50 (b) | | 2,420,000 | 2,184,806 |
| 6.6% 6/13/36 (b) | | 1,465,000 | 1,467,747 |
TOTAL GUATEMALA | | | 7,299,331 |
| Hungary - 0.8% | | | |
| Hungarian Republic: | | | |
| 2.125% 9/22/31 (b) | | 2,190,000 | 1,732,290 |
| 3.125% 9/21/51 (b) | | 3,170,000 | 2,012,950 |
| 5.25% 6/16/29 (b) | | 2,880,000 | 2,826,000 |
| 5.5% 6/16/34 (b) | | 6,825,000 | 6,626,648 |
| 6.125% 5/22/28 (b) | | 2,280,000 | 2,322,750 |
| 6.75% 9/25/52 (b) | | 1,450,000 | 1,554,944 |
TOTAL HUNGARY | | | 17,075,582 |
| Indonesia - 2.3% | | | |
| Indonesian Republic: | | | |
| 3.2% 9/23/61 | | 3,110,000 | 1,999,147 |
| 4.35% 1/11/48 | | 3,895,000 | 3,329,018 |
| 5.125% 1/15/45 (b) | | 9,205,000 | 8,931,727 |
| 5.25% 1/17/42 (b) | | 3,765,000 | 3,690,114 |
| 5.95% 1/8/46 (b) | | 4,305,000 | 4,552,538 |
| 6.625% 2/17/37 (b) | | 821,000 | 916,185 |
| 6.75% 1/15/44 (b) | | 3,510,000 | 4,057,341 |
| 7.75% 1/17/38 (b) | | 8,515,000 | 10,470,789 |
| 8.5% 10/12/35 (b) | | 8,850,000 | 11,174,099 |
TOTAL INDONESIA | | | 49,120,958 |
| Israel - 0.3% | | | |
| Israeli State: | | | |
| 3.375% 1/15/50 | | 6,505,000 | 4,149,461 |
| 5.75% 3/12/54 | | 2,975,000 | 2,673,781 |
TOTAL ISRAEL | | | 6,823,242 |
| Ivory Coast - 0.8% | | | |
| Ivory Coast: | | | |
| 5.875% 10/17/31 (b) | EUR | 8,785,000 | 8,476,286 |
| 6.375% 3/3/28 (b) | | 5,285,000 | 5,106,631 |
| 8.25% 1/30/37 (b) | | 2,790,000 | 2,692,350 |
TOTAL IVORY COAST | | | 16,275,267 |
| Jamaica - 0.1% | | | |
| Jamaican Government 7.875% 7/28/45 | | 1,995,000 | 2,318,564 |
| Jordan - 0.5% | | | |
| Jordanian Kingdom: | | | |
| 4.95% 7/7/25 (b) | | 6,345,000 | 6,176,461 |
| 7.375% 10/10/47 (b) | | 1,240,000 | 1,056,325 |
| 7.5% 1/13/29 (b) | | 1,060,000 | 1,033,500 |
| 7.75% 1/15/28 (b) | | 3,150,000 | 3,117,516 |
TOTAL JORDAN | | | 11,383,802 |
| Kenya - 0.3% | | | |
| Republic of Kenya: | | | |
| 6.3% 1/23/34 (b) | | 1,785,000 | 1,332,614 |
| 7.25% 2/28/28 (b) | | 1,010,000 | 916,891 |
| 9.75% 2/16/31 (b) | | 3,280,000 | 3,124,200 |
TOTAL KENYA | | | 5,373,705 |
| Lebanon - 0.1% | | | |
| Lebanese Republic: | | | |
| 5.8% (e) | | 7,047,000 | 484,481 |
| 6.375% (e) | | 8,768,000 | 602,800 |
TOTAL LEBANON | | | 1,087,281 |
| Mexico - 1.9% | | | |
| United Mexican States: | | | |
| 3.5% 2/12/34 | | 6,340,000 | 5,157,590 |
| 3.75% 4/19/71 | | 8,735,000 | 5,245,368 |
| 4.875% 5/19/33 | | 3,425,000 | 3,157,850 |
| 5.75% 10/12/2110 | | 9,315,000 | 7,705,252 |
| 6% 5/7/36 | | 5,760,000 | 5,610,240 |
| 6.05% 1/11/40 | | 7,390,000 | 7,159,063 |
| 6.338% 5/4/53 | | 2,810,000 | 2,644,210 |
| 6.35% 2/9/35 | | 4,445,000 | 4,469,448 |
TOTAL MEXICO | | | 41,149,021 |
| Mongolia - 0.0% | | | |
| Mongolia Government 7.875% 6/5/29 (b) | | 840,000 | 856,892 |
| Montenegro - 0.2% | | | |
| Republic of Montenegro 7.25% 3/12/31 (b) | | 3,630,000 | 3,643,613 |
| Morocco - 0.2% | | | |
| Moroccan Kingdom 6.5% 9/8/33 (b) | | 4,725,000 | 4,871,180 |
| Nigeria - 1.3% | | | |
| Republic of Nigeria: | | | |
| , yield at date of purchase 25.6137% to 28.7481% 3/6/25 to 5/20/25 | NGN | 9,136,190,000 | 5,095,103 |
| 6.125% 9/28/28 (b) | | 8,805,000 | 7,720,884 |
| 6.5% 11/28/27 (b) | | 2,250,000 | 2,081,953 |
| 7.143% 2/23/30 (b) | | 3,580,000 | 3,104,531 |
| 7.625% 11/21/25 (b) | | 4,945,000 | 4,951,181 |
| 7.696% 2/23/38 (b) | | 2,730,000 | 2,113,191 |
| 7.875% 2/16/32 (b) | | 1,590,000 | 1,375,350 |
TOTAL NIGERIA | | | 26,442,193 |
| Oman - 1.5% | | | |
| Sultanate of Oman: | | | |
| 5.375% 3/8/27 (b) | | 1,305,000 | 1,293,989 |
| 5.625% 1/17/28 (b) | | 9,545,000 | 9,533,069 |
| 6% 8/1/29 (b) | | 5,535,000 | 5,618,025 |
| 6.25% 1/25/31 (b) | | 3,525,000 | 3,628,547 |
| 6.5% 3/8/47 (b) | | 1,235,000 | 1,231,913 |
| 6.75% 1/17/48 (b) | | 9,450,000 | 9,624,234 |
| 7% 1/25/51 (b) | | 1,060,000 | 1,115,650 |
TOTAL OMAN | | | 32,045,427 |
| Pakistan - 0.6% | | | |
| Islamic Republic of Pakistan: | | | |
| 6% 4/8/26 (b) | | 7,395,000 | 6,648,567 |
| 6.875% 12/5/27 (b) | | 1,375,000 | 1,186,367 |
| 7.375% 4/8/31 (b) | | 4,895,000 | 3,850,223 |
TOTAL PAKISTAN | | | 11,685,157 |
| Panama - 1.2% | | | |
| Panamanian Republic: | | | |
| 2.252% 9/29/32 | | 4,345,000 | 3,126,228 |
| 3.298% 1/19/33 | | 4,585,000 | 3,567,130 |
| 3.87% 7/23/60 | | 6,150,000 | 3,503,578 |
| 4.5% 5/15/47 | | 2,510,000 | 1,736,606 |
| 4.5% 4/16/50 | | 8,075,000 | 5,440,531 |
| 6.853% 3/28/54 | | 1,865,000 | 1,712,070 |
| 7.875% 3/1/57 | | 2,695,000 | 2,801,116 |
| 8% 3/1/38 | | 2,860,000 | 3,014,440 |
TOTAL PANAMA | | | 24,901,699 |
| Paraguay - 0.5% | | | |
| Republic of Paraguay: | | | |
| 2.739% 1/29/33 (b) | | 2,485,000 | 1,998,872 |
| 4.95% 4/28/31 (b) | | 5,285,000 | 5,042,220 |
| 5.4% 3/30/50 (b) | | 2,220,000 | 1,918,913 |
| 6% 2/9/36 (b) | | 1,860,000 | 1,858,838 |
TOTAL PARAGUAY | | | 10,818,843 |
| Peru - 0.6% | | | |
| Peruvian Republic: | | | |
| 2.783% 1/23/31 | | 6,570,000 | 5,627,205 |
| 3% 1/15/34 | | 4,535,000 | 3,691,773 |
| 3.3% 3/11/41 | | 4,050,000 | 3,005,859 |
TOTAL PERU | | | 12,324,837 |
| Philippines - 0.8% | | | |
| Philippine Republic: | | | |
| 2.65% 12/10/45 | | 3,325,000 | 2,178,914 |
| 2.95% 5/5/45 | | 1,655,000 | 1,145,570 |
| 5.5% 1/17/48 | | 1,885,000 | 1,906,795 |
| 5.6% 5/14/49 | | 2,820,000 | 2,852,035 |
| 5.609% 4/13/33 | | 3,005,000 | 3,089,516 |
| 5.95% 10/13/47 | | 4,915,000 | 5,228,331 |
TOTAL PHILIPPINES | | | 16,401,161 |
| Poland - 0.6% | | | |
| Bank Gospodarstwa Krajowego: | | | |
| 5.375% 5/22/33 (b) | | 1,780,000 | 1,762,912 |
| 6.25% 10/31/28 (b) | | 1,630,000 | 1,685,599 |
| Polish Government: | | | |
| 5.5% 4/4/53 | | 2,005,000 | 1,962,454 |
| 5.5% 3/18/54 | | 2,745,000 | 2,662,870 |
| 5.75% 11/16/32 | | 4,200,000 | 4,350,654 |
TOTAL POLAND | | | 12,424,489 |
| Qatar - 1.8% | | | |
| State of Qatar: | | | |
| 4.4% 4/16/50 (b) | | 12,865,000 | 11,280,997 |
| 4.625% 6/2/46 (b) | | 5,790,000 | 5,305,088 |
| 4.817% 3/14/49 (b) | | 8,905,000 | 8,328,958 |
| 5.103% 4/23/48 (b) | | 9,945,000 | 9,683,944 |
| 9.75% 6/15/30 (b) | | 3,280,000 | 4,135,875 |
TOTAL QATAR | | | 38,734,862 |
| Romania - 0.7% | | | |
| Romanian Republic: | | | |
| 2% 4/14/33 (Reg. S) | EUR | 1,290,000 | 1,036,576 |
| 3% 2/27/27 (b) | | 2,536,000 | 2,358,480 |
| 3.375% 1/28/50 (Reg. S) | EUR | 1,755,000 | 1,248,117 |
| 3.625% 3/27/32 (b) | | 4,866,000 | 4,116,332 |
| 4% 2/14/51 (b) | | 1,450,000 | 1,001,406 |
| 6.625% 2/17/28 (b) | | 2,190,000 | 2,235,202 |
| 7.125% 1/17/33 (b) | | 775,000 | 816,656 |
| 8% 4/29/30 | RON | 10,700,000 | 2,432,616 |
TOTAL ROMANIA | | | 15,245,385 |
| Rwanda - 0.2% | | | |
| Rwanda Republic 5.5% 8/9/31 (b) | | 5,740,000 | 4,600,969 |
| Saudi Arabia - 1.7% | | | |
| Kingdom of Saudi Arabia: | | | |
| 2.25% 2/2/33 (b) | | 7,350,000 | 5,875,406 |
| 3.45% 2/2/61 (b) | | 10,930,000 | 7,131,825 |
| 3.625% 3/4/28 (b) | | 3,315,000 | 3,157,538 |
| 3.75% 1/21/55 (b) | | 5,025,000 | 3,548,906 |
| 4.5% 10/26/46 (b) | | 6,645,000 | 5,633,714 |
| 4.5% 4/22/60 (b) | | 2,345,000 | 1,900,916 |
| 4.625% 10/4/47 (b) | | 3,095,000 | 2,642,356 |
| 5% 1/18/53 (b) | | 3,580,000 | 3,150,400 |
| 5.75% 1/16/54 (b) | | 2,960,000 | 2,883,040 |
TOTAL SAUDI ARABIA | | | 35,924,101 |
| Senegal - 0.1% | | | |
| Republic of Senegal 6.25% 5/23/33 (b) | | 3,030,000 | 2,533,838 |
| Serbia - 0.6% | | | |
| Republic of Serbia: | | | |
| 2.125% 12/1/30 (b) | | 7,890,000 | 6,287,344 |
| 6% 6/12/34 (b) | | 3,250,000 | 3,197,188 |
| 6.5% 9/26/33 (b) | | 4,090,000 | 4,147,516 |
TOTAL SERBIA | | | 13,632,048 |
| South Africa - 0.7% | | | |
| South African Republic: | | | |
| 4.85% 9/27/27 | | 2,690,000 | 2,575,675 |
| 4.85% 9/30/29 | | 2,510,000 | 2,293,513 |
| 5% 10/12/46 | | 3,845,000 | 2,696,306 |
| 5.65% 9/27/47 | | 1,905,000 | 1,435,894 |
| 5.75% 9/30/49 | | 5,505,000 | 4,142,513 |
| 5.875% 4/20/32 | | 2,695,000 | 2,496,244 |
TOTAL SOUTH AFRICA | | | 15,640,145 |
| Sri Lanka - 0.4% | | | |
| Democratic Socialist Republic of Sri Lanka: | | | |
| 6.2% (b)(e) | | 2,485,000 | 1,456,055 |
| 6.825% (b)(e) | | 2,785,000 | 1,633,577 |
| 7.55% (b)(e) | | 2,430,000 | 1,388,745 |
| 7.85% (b)(e) | | 5,440,000 | 3,194,300 |
TOTAL SRI LANKA | | | 7,672,677 |
| Turkey - 4.3% | | | |
| Export Credit Bank of Turkey 9% 1/28/27 (b) | | 2,875,000 | 2,987,305 |
| Turkish Republic: | | | |
| 4.25% 4/14/26 | | 8,290,000 | 7,981,716 |
| 4.75% 1/26/26 | | 10,535,000 | 10,258,456 |
| 4.875% 10/9/26 | | 4,395,000 | 4,241,175 |
| 4.875% 4/16/43 | | 8,580,000 | 6,073,031 |
| 5.125% 2/17/28 | | 5,725,000 | 5,440,539 |
| 5.25% 3/13/30 | | 2,085,000 | 1,907,123 |
| 5.75% 5/11/47 | | 4,290,000 | 3,296,597 |
| 6% 3/25/27 | | 1,900,000 | 1,872,094 |
| 6% 1/14/41 | | 8,310,000 | 6,897,300 |
| 6.625% 2/17/45 | | 3,000,000 | 2,588,438 |
| 7.625% 5/15/34 | | 3,075,000 | 3,097,102 |
| 9.125% 7/13/30 | | 2,030,000 | 2,212,700 |
| 9.375% 3/14/29 | | 4,750,000 | 5,165,625 |
| 9.375% 1/19/33 | | 8,105,000 | 9,059,870 |
| 9.875% 1/15/28 | | 9,925,000 | 10,895,789 |
| 26.2% 10/5/33 | TRY | 82,770,000 | 2,499,690 |
| 31.08% 11/8/28 | TRY | 72,855,000 | 2,306,925 |
| 37% 2/18/26 | TRY | 38,515,000 | 1,161,179 |
TOTAL TURKEY | | | 89,942,654 |
| Ukraine - 0.7% | | | |
| Ukraine Government: | | | |
| 6.876% 5/21/31 (b) | | 1,910,000 | 544,350 |
| 7.253% 3/15/35 (b) | | 6,430,000 | 1,829,335 |
| 7.375% 9/25/34 (b) | | 3,110,000 | 886,350 |
| 7.75% 9/1/24 (b) | | 5,642,000 | 1,785,693 |
| 7.75% 9/1/25 (b) | | 8,945,000 | 2,822,148 |
| 7.75% 9/1/26 (b) | | 12,100,000 | 3,726,800 |
| 7.75% 9/1/28 (b) | | 2,095,000 | 634,785 |
| 7.75% 9/1/29 (b) | | 1,260,000 | 381,150 |
| 7.75% 8/1/41 (b)(c) | | 3,920,000 | 1,912,960 |
TOTAL UKRAINE | | | 14,523,571 |
| United Arab Emirates - 1.8% | | | |
| Abu Dhabi National Energy Co. PJSC 4.375% 1/24/29 (b) | | 2,970,000 | 2,896,678 |
| Emirate of Abu Dhabi: | | | |
| 3% 9/15/51 (b) | | 4,675,000 | 3,138,094 |
| 3.125% 9/30/49 (b) | | 21,570,000 | 15,051,816 |
| 3.875% 4/16/50 (b) | | 6,905,000 | 5,506,738 |
| 5.5% 4/30/54 (b) | | 3,745,000 | 3,805,856 |
| Emirate of Dubai: | | | |
| 3.9% 9/9/50 (Reg. S) | | 7,425,000 | 5,452,734 |
| 5.25% 1/30/43 (Reg. S) | | 3,180,000 | 2,998,144 |
TOTAL UNITED ARAB EMIRATES | | | 38,850,060 |
| United States of America - 5.0% | | | |
| U.S. Treasury Bonds: | | | |
| 2.875% 5/15/52 | | 43,234,000 | 31,687,462 |
| 3.25% 5/15/42 | | 14,357,000 | 11,938,743 |
| 3.625% 2/15/53 | | 29,500,000 | 25,095,742 |
| U.S. Treasury Notes: | | | |
| 2.875% 5/15/32 (h) | | 10,848,000 | 9,773,794 |
| 3.625% 3/31/30 | | 9,396,000 | 9,046,586 |
| 3.75% 5/31/30 | | 1,994,000 | 1,930,986 |
| 4% 2/28/30 | | 4,819,000 | 4,731,844 |
| 4.125% 3/31/31 | | 7,644,000 | 7,543,374 |
| 4.625% 9/30/30 | | 3,851,000 | 3,905,155 |
TOTAL UNITED STATES OF AMERICA | | | 105,653,686 |
| Uruguay - 0.6% | | | |
| Uruguay Republic: | | | |
| 5.1% 6/18/50 | | 7,425,000 | 7,007,344 |
| 5.75% 10/28/34 | | 2,875,000 | 2,995,750 |
| 9.75% 7/20/33 | UYU | 110,760,000 | 2,802,415 |
TOTAL URUGUAY | | | 12,805,509 |
| Uzbekistan - 0.1% | | | |
| Republic of Uzbekistan: | | | |
| 3.7% 11/25/30 (b) | | 1,300,000 | 1,069,250 |
| 3.9% 10/19/31 (b) | | 1,855,000 | 1,509,506 |
TOTAL UZBEKISTAN | | | 2,578,756 |
| Venezuela - 0.4% | | | |
| Venezuelan Republic: | | | |
| 9.25% (e) | | 31,105,000 | 5,738,873 |
| 11.95% (Reg. S) (e) | | 13,520,000 | 2,460,640 |
| 12.75% (e) | | 2,600,000 | 473,200 |
TOTAL VENEZUELA | | | 8,672,713 |
| Vietnam - 0.6% | | | |
| Vietnamese Socialist Republic 5.5% 3/12/28 | | 14,151,883 | 13,407,070 |
| Zambia - 0.1% | | | |
| Republic of Zambia: | | | |
| 0.5% 12/31/53 (b) | | 714,768 | 349,343 |
| 5.75% 6/30/33 (b) | | 860,368 | 756,855 |
TOTAL ZAMBIA | | | 1,106,198 |
| TOTAL GOVERNMENT OBLIGATIONS (Cost $1,203,896,061) | | | 1,070,805,907 |
| | | | |
| Common Stocks - 0.0% |
| | | Shares | Value ($) |
| Jamaica - 0.0% | | | |
Digicel Group Ltd. (f) (Cost $62,402) | | 69,594 | 167,722 |
| | | | |
| Preferred Securities - 3.3% |
| | | Principal Amount (a) | Value ($) |
| Brazil - 0.5% | | | |
| Banco Do Brasil SA 10-Year Treasury Constant Maturity Rate + 4.390% 8.748% (b)(c)(i)(j) | | 6,055,000 | 6,278,077 |
| Cosan Overseas Ltd. 8.25% (i) | | 4,346,000 | 4,457,219 |
TOTAL BRAZIL | | | 10,735,296 |
| Chile - 0.3% | | | |
| Banco de Credito e Inversiones 8.75% (b)(c)(i) | | 2,785,000 | 3,024,776 |
| Banco del Estado de Chile 7.95% (b)(c)(i) | | 2,485,000 | 2,596,730 |
TOTAL CHILE | | | 5,621,506 |
| Hong Kong - 0.3% | | | |
| CAS Capital No 1 Ltd. 4% (Reg. S) (c)(i) | | 6,695,000 | 6,378,937 |
| India - 0.4% | | | |
| Network i2i Ltd.: | | | |
| 3.975% (b)(c)(i) | | 2,535,000 | 2,418,494 |
| 5.65% (b)(c)(i) | | 6,088,000 | 6,096,442 |
TOTAL INDIA | | | 8,514,936 |
| Kuwait - 0.1% | | | |
| NBK Tier 1 Ltd. 3.625% (b)(c)(i) | | 2,490,000 | 2,333,717 |
| Mexico - 1.4% | | | |
| Banco Mercantil del Norte SA: | | | |
| 6.75% (b)(c)(i) | | 3,500,000 | 3,475,224 |
| 7.625% (b)(c)(i) | | 7,260,000 | 7,223,672 |
| BBVA Bancomer SA Texas Branch: | | | |
| 5.125% 1/18/33 (b)(c) | | 2,615,000 | 2,446,121 |
| 5.35% 11/12/29 (b)(c) | | 1,950,000 | 1,934,717 |
| 8.45% 6/29/38 (b)(c) | | 2,930,000 | 3,021,225 |
| CEMEX S.A.B. de CV: | | | |
| 5.125% (b)(c)(i) | | 8,855,000 | 8,652,332 |
| 9.125% (b)(c)(i) | | 3,615,000 | 3,873,205 |
TOTAL MEXICO | | | 30,626,496 |
| Russia - 0.0% | | | |
| Alfa Bond Issuance PLC 6.95% (Reg. S) (c)(e)(f)(i) | | 982,000 | 49,100 |
| Tinkoff Bank JSC 6% (b)(c)(e)(f)(i) | | 2,960,000 | 148,000 |
TOTAL RUSSIA | | | 197,100 |
| United Arab Emirates - 0.3% | | | |
| DP World Salaam 6% (Reg. S) (c)(i) | | 6,000,000 | 6,139,625 |
| TOTAL PREFERRED SECURITIES (Cost $74,239,954) | | | 70,547,613 |
| | | | |
| Money Market Funds - 0.8% |
| | | Shares | Value ($) |
Fidelity Cash Central Fund 5.38% (k) (Cost $16,813,734) | | 16,810,864 | 16,814,226 |
| | | | |
| TOTAL INVESTMENT IN SECURITIES - 98.1% (Cost $2,310,703,503) | 2,075,213,990 |
NET OTHER ASSETS (LIABILITIES) - 1.9% | 39,762,074 |
| NET ASSETS - 100.0% | 2,114,976,064 |
| | |
| Futures Contracts |
| | Number of contracts | Expiration Date | Notional Amount ($) | Value ($) | Unrealized Appreciation/ (Depreciation) ($) |
| Purchased | | | | | |
| | | | | | |
| Treasury Contracts | | | | | |
| CBOT 10-Year U.S. Treasury Note Contracts (United States) | 365 | Sep 2024 | 40,144,297 | 235,215 | 235,215 |
| | | | | | |
| The notional amount of futures purchased as a percentage of Net Assets is 1.9% |
Currency Abbreviations
| EGP | - | Egyptian pound |
| EUR | - | European Monetary Unit |
| NGN | - | Nigerian naira |
| RON | - | Romanian leu |
| TRY | - | Turkish Lira |
| UYU | - | Uruguay peso |
Legend
| (a) | Amount is stated in United States dollars unless otherwise noted. |
| (b) | Security exempt from registration under Rule 144A of the Securities Act of 1933. These securities may be resold in transactions exempt from registration, normally to qualified institutional buyers. At the end of the period, the value of these securities amounted to $1,338,230,771 or 63.3% of net assets. |
| (c) | Coupon rates for floating and adjustable rate securities reflect the rates in effect at period end. |
| (d) | Security or a portion of the security purchased on a delayed delivery or when-issued basis. |
| (e) | Non-income producing - Security is in default. |
| (g) | Security initially issued at one coupon which converts to a higher coupon at a specified date. The rate shown is the rate at period end. |
| (h) | Security or a portion of the security was pledged to cover margin requirements for futures contracts. At period end, the value of securities pledged amounted to $773,274. |
| (i) | Security is perpetual in nature with no stated maturity date. |
| (j) | Coupon is indexed to a floating interest rate which may be multiplied by a specified factor and/or subject to caps or floors. |
| (k) | Affiliated fund that is generally available only to investment companies and other accounts managed by Fidelity Investments. The rate quoted is the annualized seven-day yield of the fund at period end. A complete unaudited listing of the fund's holdings as of its most recent quarter end is available upon request. In addition, each Fidelity Central Fund's financial statements are available on the SEC's website or upon request. |
Affiliated Central Funds
Fiscal year to date information regarding the Fund's investments in Fidelity Central Funds, including the ownership percentage, is presented below.
| Affiliate | Value, beginning of period ($) | Purchases ($) | Sales Proceeds ($) | Dividend Income ($) | Realized Gain (loss) ($) | Change in Unrealized appreciation (depreciation) ($) | Value, end of period ($) | % ownership, end of period |
| Fidelity Cash Central Fund 5.38% | 36,533,365 | 284,457,896 | 304,178,019 | 940,329 | 984 | - | 16,814,226 | 0.0% |
| Total | 36,533,365 | 284,457,896 | 304,178,019 | 940,329 | 984 | - | 16,814,226 | |
| | | | | | | | | |
Amounts in the dividend income column in the above table include any capital gain distributions from underlying funds, which are presented in the corresponding line item in the Statement of Operations, if applicable.
Amounts included in the purchases and sales proceeds columns may include in-kind transactions, if applicable.
Investment Valuation
The following is a summary of the inputs used, as of June 30, 2024, involving the Fund's assets and liabilities carried at fair value. The inputs or methodology used for valuing securities may not be an indication of the risk associated with investing in those securities. For more information on valuation inputs, and their aggregation into the levels used below, please refer to the Investment Valuation section in the accompanying Notes to Financial Statements.
| Valuation Inputs at Reporting Date: |
| Description | Total ($) | Level 1 ($) | Level 2 ($) | Level 3 ($) |
Investments in Securities: | | | | |
|
| Equities: | | | | |
Communication Services | 167,722 | - | - | 167,722 |
|
| Corporate Bonds | 916,878,522 | - | 915,550,120 | 1,328,402 |
|
| Government Obligations | 1,070,805,907 | - | 1,070,805,907 | - |
|
| Preferred Securities | 70,547,613 | - | 70,350,513 | 197,100 |
|
| Money Market Funds | 16,814,226 | 16,814,226 | - | - |
| Total Investments in Securities: | 2,075,213,990 | 16,814,226 | 2,056,706,540 | 1,693,224 |
Derivative Instruments: Assets | | | | |
Futures Contracts | 235,215 | 235,215 | - | - |
| Total Assets | 235,215 | 235,215 | - | - |
| Total Derivative Instruments: | 235,215 | 235,215 | - | - |
Value of Derivative Instruments
The following table is a summary of the Fund's value of derivative instruments by primary risk exposure as of June 30, 2024. For additional information on derivative instruments, please refer to the Derivative Instruments section in the accompanying Notes to Financial Statements.
Primary Risk Exposure / Derivative Type | Value |
| Asset ($) | Liability ($) |
| Interest Rate Risk | | |
Futures Contracts (a) | 235,215 | 0 |
| Total Interest Rate Risk | 235,215 | 0 |
| Total Value of Derivatives | 235,215 | 0 |
(a)Reflects gross cumulative appreciation (depreciation) on futures contracts as presented in the Schedule of Investments. In the Statement of Assets and Liabilities, the period end daily variation margin is included in receivable or payable for daily variation margin on futures contracts, and the net cumulative appreciation (depreciation) is included in Total accumulated earnings (loss).
Fidelity® Emerging Markets Debt Central Fund
Financial Statements (Unaudited)
| Statement of Assets and Liabilities |
| | | | June 30, 2024 (Unaudited) |
| | | | | |
| Assets | | | | |
| Investment in securities, at value - See accompanying schedule: | | | | |
Unaffiliated issuers (cost $2,293,889,769) | $ | 2,058,399,764 | | |
Fidelity Central Funds (cost $16,813,734) | | 16,814,226 | | |
| | | | | |
| | | | | |
| Total Investment in Securities (cost $2,310,703,503) | | | $ | 2,075,213,990 |
| Cash | | | | 72,312 |
| Foreign currency held at value (cost $156) | | | | 154 |
| Receivable for investments sold | | | | 149,184 |
| Receivable for fund shares sold | | | | 1,590 |
| Dividends receivable | | | | 23,250 |
| Interest receivable | | | | 45,371,546 |
| Distributions receivable from Fidelity Central Funds | | | | 98,685 |
Total assets | | | | 2,120,930,711 |
| Liabilities | | | | |
| Payable for investments purchased | | | | |
Regular delivery | $ | 3,013,780 | | |
Delayed delivery | | 2,840,000 | | |
| Payable for daily variation margin on futures contracts | | 96,953 | | |
| Other payables and accrued expenses | | 3,914 | | |
| Total liabilities | | | | 5,954,647 |
| Net Assets | | | $ | 2,114,976,064 |
| Net Assets consist of: | | | | |
| Paid in capital | | | $ | 2,620,428,361 |
| Total accumulated earnings (loss) | | | | (505,452,297) |
| Net Assets | | | $ | 2,114,976,064 |
Net Asset Value, offering price and redemption price per share ($2,114,976,064 ÷ 266,462,627 shares) | | | $ | 7.94 |
| Statement of Operations |
| | | | Six months ended June 30, 2024 (Unaudited) |
| Investment Income | | | | |
| Dividends | | | $ | 2,111,472 |
| Interest | | | | 68,986,112 |
| Income from Fidelity Central Funds | | | | 940,329 |
| Income before foreign taxes withheld | | | $ | 72,037,913 |
| Less foreign taxes withheld | | | | (149,370) |
| Total income | | | | 71,888,543 |
| Expenses | | | | |
| Custodian fees and expenses | $ | 4,689 | | |
| Independent trustees' fees and expenses | | 4,606 | | |
| Legal | | 213,789 | | |
| Miscellaneous | | 4 | | |
| Total expenses before reductions | | 223,088 | | |
| Expense reductions | | (3,667) | | |
| Total expenses after reductions | | | | 219,421 |
| Net Investment income (loss) | | | | 71,669,122 |
| Realized and Unrealized Gain (Loss) | | | | |
| Net realized gain (loss) on: | | | | |
| Investment Securities: | | | | |
| Unaffiliated issuers | | (18,250,502) | | |
| Redemptions in-kind | | (4,462,593) | | |
| Fidelity Central Funds | | 984 | | |
| Foreign currency transactions | | (57,722) | | |
| Futures contracts | | 299,385 | | |
| Total net realized gain (loss) | | | | (22,470,448) |
| Change in net unrealized appreciation (depreciation) on: | | | | |
| Investment Securities: | | | | |
| Unaffiliated issuers | | 27,576,137 | | |
| Assets and liabilities in foreign currencies | | (19,275) | | |
| Futures contracts | | 115,595 | | |
| Total change in net unrealized appreciation (depreciation) | | | | 27,672,457 |
| Net gain (loss) | | | | 5,202,009 |
| Net increase (decrease) in net assets resulting from operations | | | $ | 76,871,131 |
| Statement of Changes in Net Assets |
| |
| | Six months ended June 30, 2024 (Unaudited) | | Year ended December 31, 2023 |
| Increase (Decrease) in Net Assets | | | | |
| Operations | | | | |
| Net investment income (loss) | $ | 71,669,122 | $ | 139,682,661 |
| Net realized gain (loss) | | (22,470,448) | | (89,600,719) |
| Change in net unrealized appreciation (depreciation) | | 27,672,457 | | 170,105,814 |
| Net increase (decrease) in net assets resulting from operations | | 76,871,131 | | 220,187,756 |
| Distributions to shareholders | | (61,251,033) | | (126,070,231) |
| | | | | |
| Affiliated share transactions | | | | |
| Proceeds from sales of shares | | 71,205,836 | | 38,287,797 |
| Reinvestment of distributions | | 60,831,100 | | 126,064,824 |
| Cost of shares redeemed | | (172,132,478) | | (291,269,824) |
| | | | | |
Net increase (decrease) in net assets resulting from share transactions | | (40,095,542) | | (126,917,203) |
| Total increase (decrease) in net assets | | (24,475,444) | | (32,799,678) |
| | | | | |
| Net Assets | | | | |
| Beginning of period | | 2,139,451,508 | | 2,172,251,186 |
| End of period | $ | 2,114,976,064 | $ | 2,139,451,508 |
| | | | | |
| Other Information | | | | |
| Shares | | | | |
| Sold | | 9,039,536 | | 5,115,802 |
| Issued in reinvestment of distributions | | 7,732,639 | | 16,684,465 |
| Redeemed | | (21,997,919) | | (38,214,712) |
| Net increase (decrease) | | (5,225,744) | | (16,414,445) |
| | | | | |
Financial Highlights
Fidelity® Emerging Markets Debt Central Fund |
| |
| | Six months ended (Unaudited) June 30, 2024 | | Years ended December 31, 2023 | | 2022 | | 2021 | | 2020 | | 2019 |
Selected Per-Share Data | | | | | | | | | | | | |
| Net asset value, beginning of period | $ | 7.87 | $ | 7.54 | $ | 8.98 | $ | 9.37 | $ | 9.44 | $ | 9.11 |
| Income from Investment Operations | | | | | | | | | | | | |
Net investment income (loss) A,B | | .264 | | .507 | | .438 | | .437 | | .501 | | .582 |
| Net realized and unrealized gain (loss) | | .032 | | .283 | | (1.468) | | (.428) | | (.119) | | .353 |
| Total from investment operations | | .296 | | .790 | | (1.030) | | .009 | | .382 | | .935 |
| Distributions from net investment income | | (.226) | | (.460) | | (.410) | | (.399) | | (.452) | | (.548) |
| Distributions from net realized gain | | - | | - | | - | | - | | - | | (.057) |
| Total distributions | | (.226) | | (.460) | | (.410) | | (.399) | | (.452) | | (.605) |
| Net asset value, end of period | $ | 7.94 | $ | 7.87 | $ | 7.54 | $ | 8.98 | $ | 9.37 | $ | 9.44 |
Total Return C,D | | | | 10.91% | | (11.47)% | | .11% | | 4.42% | | 10.48% |
Ratios to Average Net Assets B,E,F | | | | | | | | | | | | |
| Expenses before reductions | | .02% G,H | | .02% | | -% I | | -% I | | -% I | | -% I |
| Expenses net of fee waivers, if any | | | | .02% | | -% I | | -% I | | -% I | | -% I |
| Expenses net of all reductions | | .02% G,H | | .02% | | -% I | | -% I | | -% I | | -% I |
| Net investment income (loss) | | 6.75% G,H | | 6.72% | | 5.58% | | 4.77% | | 5.59% | | 6.23% |
| Supplemental Data | | | | | | | | | | | | |
| Net assets, end of period (000 omitted) | $ | 2,114,976 | $ | 2,139,452 | $ | 2,172,251 | $ | 2,751,450 | $ | 2,751,759 | $ | 2,936,254 |
Portfolio turnover rate J | | | | 21% | | 22% | | 32% | | 89% | | 72% K |
ACalculated based on average shares outstanding during the period.
BNet investment income (loss) is affected by the timing of the declaration of dividends by any underlying mutual funds or exchange-traded funds (ETFs). Net investment income (loss) of any mutual funds or ETFs is not included in the Fund's net investment income (loss) ratio.
CTotal returns for periods of less than one year are not annualized.
DTotal returns would have been lower if certain expenses had not been reduced during the applicable periods shown.
EFees and expenses of any underlying mutual funds or exchange-traded funds (ETFs) are not included in the Fund's expense ratio. The Fund indirectly bears its proportionate share of these expenses. For additional expense information related to investments in Fidelity Central Funds, please refer to the "Investments in Fidelity Central Funds" note found in the Notes to Financial Statements section of the most recent Annual or Semi-Annual report.
FExpense ratios reflect operating expenses of the class. Expenses before reductions do not reflect amounts reimbursed, waived, or reduced through arrangements with the investment adviser, brokerage services, or other offset arrangements, if applicable, and do not represent the amount paid by the class during periods when reimbursements, waivers or reductions occur.
GAnnualized.
HProxy expenses are not annualized.
IAmount represents less than .005%.
JAmount does not include the portfolio activity of any underlying mutual funds or exchange-traded funds (ETFs).
KPortfolio turnover rate excludes securities received or delivered in-kind.
Fidelity® Emerging Markets Debt Local Currency Central Fund
Schedule of Investments June 30, 2024 (Unaudited)
Showing Percentage of Net Assets
| U.S. Government and Government Agency Obligations - 0.5% |
| | | Principal Amount (a) | Value ($) |
| U.S. Treasury Obligations - 0.5% | | | |
U.S. Treasury Bills, yield at date of purchase 5.3% 11/14/24 (b) (Cost $1,333,502) | | 1,360,000 | 1,333,498 |
| | | | |
| Foreign Government and Government Agency Obligations - 83.1% |
| | | Principal Amount (a) | Value ($) |
| Brazil - 9.2% | | | |
| Brazil Letras Do Tesouro Nacio, yield at date of purchase 9.892% to 13.1648% 1/1/26 to 7/1/27 | BRL | 68,075,000 | 9,952,510 |
| Brazilian Federative Republic: | | | |
| 10% 1/1/25 | BRL | 13,250,000 | 2,358,855 |
| 10% 1/1/27 | BRL | 30,750,000 | 5,280,936 |
| 10% 1/1/29 | BRL | 18,500,000 | 3,069,903 |
| 10% 1/1/31 | BRL | 14,500,000 | 2,333,025 |
| 10% 1/1/33 | BRL | 1,900,000 | 300,290 |
| 10% 1/1/35 | BRL | 3,750,000 | 585,675 |
TOTAL BRAZIL | | | 23,881,194 |
| Chile - 1.2% | | | |
| Chilean Republic: | | | |
| 4.5% 3/1/26 | CLP | 220,000,000 | 233,052 |
| 4.7% 9/1/30 (Reg. S) (c) | CLP | 1,050,000,000 | 1,040,781 |
| 5% 3/1/35 | CLP | 580,000,000 | 561,247 |
| 6% 4/1/33 (Reg. S) (c) | CLP | 1,050,000,000 | 1,105,142 |
| 6% 1/1/43 | CLP | 225,000,000 | 236,628 |
TOTAL CHILE | | | 3,176,850 |
| China - 4.7% | | | |
| Peoples Republic of China: | | | |
| 2.68% 5/21/30 | CNY | 28,500,000 | 4,043,716 |
| 2.88% 2/25/33 | CNY | 19,750,000 | 2,856,942 |
| 2.91% 10/14/28 | CNY | 9,000,000 | 1,285,757 |
| 3.12% 10/25/52 | CNY | 7,500,000 | 1,164,301 |
| 3.81% 9/14/50 | CNY | 16,550,000 | 2,856,830 |
TOTAL CHINA | | | 12,207,546 |
| Colombia - 4.4% | | | |
| Colombian Republic: | | | |
| 5.75% 11/3/27 | COP | 3,350,000,000 | 714,147 |
| 6% 4/28/28 | COP | 1,000,000,000 | 210,626 |
| 7% 6/30/32 | COP | 18,800,000,000 | 3,666,289 |
| 7.25% 10/18/34 | COP | 8,000,000,000 | 1,506,543 |
| 7.25% 10/26/50 | COP | 1,650,000,000 | 256,823 |
| 7.5% 8/26/26 | COP | 12,750,000,000 | 2,954,952 |
| 9.25% 5/28/42 | COP | 10,375,000,000 | 2,067,939 |
TOTAL COLOMBIA | | | 11,377,319 |
| Czech Republic - 4.6% | | | |
| Czech Republic: | | | |
| 0.95% 5/15/30 (Reg. S) | CZK | 64,250,000 | 2,304,463 |
| 1.2% 3/13/31 | CZK | 108,630,000 | 3,868,673 |
| 1.5% 4/24/40 | CZK | 12,000,000 | 350,257 |
| 1.95% 7/30/37 | CZK | 28,000,000 | 921,661 |
| 2% 10/13/33 | CZK | 75,000,000 | 2,668,433 |
| 2.4% 9/17/25 | CZK | 29,250,000 | 1,222,415 |
| 2.75% 7/23/29 | CZK | 17,500,000 | 702,526 |
TOTAL CZECH REPUBLIC | | | 12,038,428 |
| Dominican Republic - 0.1% | | | |
| Dominican Republic 13.625% 2/3/33 (c) | DOP | 17,000,000 | 340,054 |
| Egypt - 0.5% | | | |
| Arab Republic of Egypt: | | | |
| , yield at date of purchase 25.8989% to 25.8999% 11/12/24 to 4/29/25 | EGP | 67,650,000 | 1,212,832 |
| 14.556% 10/13/27 | EGP | 7,000,000 | 111,550 |
| 16.1% 5/7/29 | EGP | 2,500,000 | 38,322 |
TOTAL EGYPT | | | 1,362,704 |
| Hungary - 3.5% | | | |
| Hungarian Republic: | | | |
| 1% 11/26/25 | HUF | 525,000,000 | 1,320,243 |
| 2.25% 4/20/33 | HUF | 350,000,000 | 669,066 |
| 2.25% 6/22/34 | HUF | 125,000,000 | 229,202 |
| 2.75% 12/22/26 | HUF | 1,567,000,000 | 3,882,063 |
| 3% 10/27/38 | HUF | 310,000,000 | 550,885 |
| 3.25% 10/22/31 | HUF | 347,500,000 | 755,466 |
| 6.75% 10/22/28 | HUF | 583,000,000 | 1,584,340 |
TOTAL HUNGARY | | | 8,991,265 |
| Indonesia - 8.4% | | | |
| Indonesian Republic: | | | |
| 5.125% 4/15/27 | IDR | 11,000,000,000 | 645,557 |
| 6.375% 4/15/32 | IDR | 70,000,000,000 | 4,108,092 |
| 6.5% 6/15/25 | IDR | 15,750,000,000 | 959,427 |
| 6.5% 2/15/31 | IDR | 49,500,000,000 | 2,924,609 |
| 6.625% 2/15/34 | IDR | 12,750,000,000 | 754,271 |
| 7.125% 6/15/38 | IDR | 24,000,000,000 | 1,472,277 |
| 7.125% 6/15/42 | IDR | 7,500,000,000 | 458,144 |
| 7.125% 6/15/43 | IDR | 14,100,000,000 | 861,849 |
| 7.5% 8/15/32 | IDR | 8,000,000,000 | 499,840 |
| 7.5% 4/15/40 | IDR | 32,700,000,000 | 2,063,135 |
| 8.25% 5/15/29 | IDR | 35,500,000,000 | 2,280,672 |
| 8.25% 5/15/36 | IDR | 250,000,000 | 16,641 |
| 8.375% 9/15/26 | IDR | 18,400,000,000 | 1,164,062 |
| 8.375% 3/15/34 | IDR | 33,300,000,000 | 2,219,661 |
| 8.375% 4/15/39 | IDR | 19,750,000,000 | 1,344,809 |
TOTAL INDONESIA | | | 21,773,046 |
| Malaysia - 10.0% | | | |
| Malaysian Government: | | | |
| 3.519% 4/20/28 | MYR | 28,000,000 | 5,911,902 |
| 3.582% 7/15/32 | MYR | 13,500,000 | 2,806,369 |
| 3.757% 5/22/40 | MYR | 5,500,000 | 1,121,918 |
| 3.828% 7/5/34 | MYR | 3,650,000 | 769,521 |
| 3.885% 8/15/29 | MYR | 11,175,000 | 2,392,788 |
| 3.906% 7/15/26 | MYR | 16,500,000 | 3,527,520 |
| 4.065% 6/15/50 | MYR | 7,250,000 | 1,496,720 |
| 4.457% 3/31/53 | MYR | 3,250,000 | 715,103 |
| 4.504% 4/30/29 | MYR | 6,500,000 | 1,429,793 |
| 4.642% 11/7/33 | MYR | 3,000,000 | 674,245 |
| 4.696% 10/15/42 | MYR | 1,550,000 | 352,746 |
| 4.736% 3/15/46 | MYR | 3,250,000 | 738,561 |
| 4.762% 4/7/37 | MYR | 11,000,000 | 2,504,293 |
| 4.893% 6/8/38 | MYR | 6,750,000 | 1,561,707 |
TOTAL MALAYSIA | | | 26,003,186 |
| Mexico - 9.4% | | | |
| United Mexican States: | | | |
| 5.75% 3/5/26 | MXN | 82,750,000 | 4,184,947 |
| 7.5% 6/3/27 | MXN | 51,250,000 | 2,608,456 |
| 7.5% 5/26/33 | MXN | 30,000,000 | 1,409,115 |
| 7.75% 11/23/34 | MXN | 66,250,000 | 3,115,506 |
| 7.75% 11/13/42 | MXN | 83,500,000 | 3,685,273 |
| 8% 9/5/24 | MXN | 16,250,000 | 882,672 |
| 8% 7/31/53 | MXN | 36,500,000 | 1,616,709 |
| 8.5% 5/31/29 | MXN | 130,500,000 | 6,722,661 |
| 10% 11/20/36 | MXN | 5,000,000 | 275,326 |
TOTAL MEXICO | | | 24,500,665 |
| Paraguay - 0.3% | | | |
| Republic of Paraguay 7.9% 2/9/31 (c) | PYG | 5,000,000,000 | 685,853 |
| Peru - 2.2% | | | |
| Peruvian Republic: | | | |
| 5.35% 8/12/40 | PEN | 1,850,000 | 389,067 |
| 5.4% 8/12/34(Reg. S) | PEN | 4,100,000 | 938,636 |
| 5.94% 2/12/29 | PEN | 3,750,000 | 978,383 |
| 6.15% 8/12/32 | PEN | 2,500,000 | 626,140 |
| 6.35% 8/12/28 | PEN | 2,575,000 | 686,984 |
| 6.9% 8/12/37 | PEN | 3,750,000 | 935,012 |
| 6.95% 8/12/31 | PEN | 1,750,000 | 466,809 |
| 7.3% 8/12/33(Reg. S) (c) | PEN | 2,750,000 | 733,484 |
TOTAL PERU | | | 5,754,515 |
| Poland - 4.8% | | | |
| Polish Government: | | | |
| 1.25% 10/25/30 | PLN | 11,050,000 | 2,131,983 |
| 1.75% 4/25/32 | PLN | 15,750,000 | 2,977,159 |
| 2.75% 4/25/28 | PLN | 11,750,000 | 2,662,222 |
| 2.75% 10/25/29 | PLN | 10,950,000 | 2,384,804 |
| 5% 10/25/34 | PLN | 1,000,000 | 234,516 |
| 6% 10/25/33 | PLN | 7,500,000 | 1,908,493 |
TOTAL POLAND | | | 12,299,177 |
| Romania - 4.6% | | | |
| Romanian Republic: | | | |
| 3.25% 6/24/26 | RON | 14,750,000 | 3,011,684 |
| 3.65% 9/24/31 | RON | 13,750,000 | 2,431,602 |
| 4.25% 4/28/36 | RON | 2,000,000 | 339,379 |
| 4.75% 10/11/34 | RON | 2,000,000 | 363,886 |
| 5% 2/12/29 | RON | 24,150,000 | 4,876,457 |
| 5.8% 7/26/27 | RON | 3,250,000 | 690,744 |
| 6.7% 2/25/32 | RON | 1,250,000 | 266,725 |
TOTAL ROMANIA | | | 11,980,477 |
| South Africa - 8.4% | | | |
| South African Republic: | | | |
| 6.25% 3/31/36 | ZAR | 45,500,000 | 1,665,416 |
| 6.5% 2/28/41 | ZAR | 30,750,000 | 1,032,537 |
| 7% 2/28/31 | ZAR | 101,250,000 | 4,664,554 |
| 8% 1/31/30 | ZAR | 118,000,000 | 5,945,108 |
| 8.5% 1/31/37 | ZAR | 55,000,000 | 2,378,479 |
| 8.75% 2/28/48 | ZAR | 70,250,000 | 2,874,839 |
| 8.875% 2/28/35 | ZAR | 71,000,000 | 3,298,449 |
TOTAL SOUTH AFRICA | | | 21,859,382 |
| Thailand - 4.1% | | | |
| Kingdom of Thailand: | | | |
| 1.585% 12/17/35 | THB | 58,000,000 | 1,391,811 |
| 1.6% 6/17/35 | THB | 87,000,000 | 2,109,981 |
| 2% 6/17/42 | THB | 42,500,000 | 975,683 |
| 2.875% 6/17/46 | THB | 9,200,000 | 230,413 |
| 3.3% 6/17/38 | THB | 94,000,000 | 2,668,494 |
| 3.39% 6/17/37 | THB | 45,000,000 | 1,288,497 |
| 3.45% 6/17/43 | THB | 65,000,000 | 1,822,584 |
TOTAL THAILAND | | | 10,487,463 |
| Turkey - 1.9% | | | |
| Turkish Republic: | | | |
| 9.3% 12/4/24 | TRY | 25,000,000 | 678,998 |
| 10.5% 8/11/27 | TRY | 35,250,000 | 692,483 |
| 12.6% 10/1/25 | TRY | 78,000,000 | 1,802,517 |
| 17.3% 7/19/28 | TRY | 25,000,000 | 575,337 |
| 17.8% 7/13/33 | TRY | 18,000,000 | 400,807 |
| 26.2% 10/5/33 | TRY | 25,500,000 | 770,111 |
TOTAL TURKEY | | | 4,920,253 |
| Uruguay - 0.8% | | | |
| Uruguay Republic: | | | |
| 8.25% 5/21/31 | UYU | 6,500,000 | 152,460 |
| 8.5% 3/15/28 (Reg. S) | UYU | 74,825,000 | 1,841,208 |
| 9.75% 7/20/33 | UYU | 3,680,820 | 93,131 |
TOTAL URUGUAY | | | 2,086,799 |
| TOTAL FOREIGN GOVERNMENT AND GOVERNMENT AGENCY OBLIGATIONS (Cost $221,925,100) | | | 215,726,176 |
| | | | |
| Supranational Obligations - 1.4% |
| | | Principal Amount (a) | Value ($) |
| Asian Infrastructure Investment Bank 6.65% 6/30/33 (Reg. S) | INR | 45,000,000 | 516,180 |
| Corporacion Andina de Fomento 7.65% 3/5/31 (Reg. S) | INR | 62,000,000 | 729,715 |
| European Bank for Reconstruction & Development 6.25% 4/11/28 | INR | 107,000,000 | 1,250,240 |
| Inter-American Development Bank: | | | |
| 5.1% 11/17/26 | IDR | 5,000,000,000 | 295,817 |
| 5.7% 11/12/24 | INR | 20,000,000 | 238,144 |
| International Bank for Reconstruction & Development 7.05% 7/22/29 | INR | 60,000,000 | 727,233 |
| TOTAL SUPRANATIONAL OBLIGATIONS (Cost $3,856,512) | | | 3,757,329 |
| | | | |
| Money Market Funds - 13.0% |
| | | Shares | Value ($) |
Fidelity Cash Central Fund 5.38% (d) (Cost $33,771,765) | | 33,765,012 | 33,771,765 |
| | | | |
| TOTAL INVESTMENT IN SECURITIES - 98.0% (Cost $260,886,879) | 254,588,768 |
NET OTHER ASSETS (LIABILITIES) - 2.0% | 5,084,068 |
| NET ASSETS - 100.0% | 259,672,836 |
| | |
| Forward Foreign Currency Contracts |
Currency Purchased
| Currency Sold | Counterparty | Settlement Date | Unrealized Appreciation/ (Depreciation) ($) |
| | | | | | | |
| USD | 342,423 | PLN | 1,375,740 | JPMorgan Chase Bank, N.A. | 7/02/24 | 680 |
| USD | 103,236 | RON | 479,375 | JPMorgan Chase Bank, N.A. | 7/02/24 | 86 |
| BRL | 9,985,000 | USD | 1,917,372 | BNP Paribas S.A. | 8/29/24 | (143,075) |
| BRL | 2,707,000 | USD | 512,466 | State Street Bank and Trust Co | 8/29/24 | (31,443) |
| BRL | 3,981,000 | USD | 751,345 | State Street Bank and Trust Co | 8/29/24 | (43,936) |
| CLP | 975,397,000 | USD | 1,059,581 | BNP Paribas S.A. | 8/29/24 | (23,518) |
| CLP | 536,697,000 | USD | 593,035 | State Street Bank and Trust Co | 8/29/24 | (22,958) |
| CLP | 920,542,000 | USD | 980,761 | State Street Bank and Trust Co | 8/29/24 | (2,965) |
| CNY | 4,664,000 | USD | 655,378 | BNP Paribas S.A. | 8/29/24 | (9,406) |
| CNY | 62,236,000 | USD | 8,760,082 | Goldman Sachs Bank USA | 8/29/24 | (140,283) |
| CNY | 2,952,000 | USD | 415,307 | Goldman Sachs Bank USA | 8/29/24 | (6,449) |
| COP | 2,728,200,000 | USD | 694,163 | BNP Paribas S.A. | 8/29/24 | (42,966) |
| COP | 3,003,500,000 | USD | 726,536 | HSBC Bank | 8/29/24 | (9,628) |
| COP | 2,772,200,000 | USD | 708,278 | State Street Bank and Trust Co | 8/29/24 | (46,579) |
| CZK | 5,984,000 | USD | 261,266 | Bank of America, N.A. | 8/29/24 | (5,119) |
| CZK | 16,549,000 | USD | 733,407 | Bank of America, N.A. | 8/29/24 | (25,022) |
| CZK | 30,780,000 | USD | 1,356,724 | Goldman Sachs Bank USA | 8/29/24 | (39,177) |
| CZK | 24,426,000 | USD | 1,070,258 | Goldman Sachs Bank USA | 8/29/24 | (24,695) |
| CZK | 15,546,000 | USD | 684,960 | Goldman Sachs Bank USA | 8/29/24 | (19,509) |
| CZK | 31,683,000 | USD | 1,393,885 | HSBC Bank | 8/29/24 | (37,684) |
| EUR | 604,000 | USD | 649,847 | BNP Paribas S.A. | 8/29/24 | (1,121) |
| EUR | 1,249,000 | USD | 1,361,055 | JPMorgan Chase Bank, N.A. | 8/29/24 | (19,565) |
| HUF | 353,000,000 | USD | 981,626 | Bank of America, N.A. | 8/29/24 | (26,593) |
| HUF | 236,119,000 | USD | 662,893 | Citibank, N. A. | 8/29/24 | (24,078) |
| HUF | 277,200,000 | USD | 772,969 | Goldman Sachs Bank USA | 8/29/24 | (23,011) |
| HUF | 216,861,000 | USD | 601,882 | State Street Bank and Trust Co | 8/29/24 | (15,170) |
| IDR | 26,018,400,000 | USD | 1,608,457 | Goldman Sachs Bank USA | 8/29/24 | (21,048) |
| IDR | 20,605,200,000 | USD | 1,286,779 | Royal Bank of Canada | 8/29/24 | (29,636) |
| IDR | 13,449,300,000 | USD | 829,487 | State Street Bank and Trust Co | 8/29/24 | (8,932) |
| INR | 257,201,000 | USD | 3,068,126 | Bank of America, N.A. | 8/29/24 | 11,578 |
| INR | 218,677,000 | USD | 2,619,671 | State Street Bank and Trust Co | 8/29/24 | (1,249) |
| KRW | 903,100,000 | USD | 657,709 | State Street Bank and Trust Co | 8/29/24 | (1,099) |
| KZT | 509,699,000 | USD | 1,128,901 | Goldman Sachs Bank USA | 8/29/24 | (66,543) |
| MXN | 38,488,000 | USD | 2,089,164 | BNP Paribas S.A. | 8/29/24 | (4,987) |
| MXN | 27,526,000 | USD | 1,611,307 | JPMorgan Chase Bank, N.A. | 8/29/24 | (120,737) |
| MXN | 11,899,000 | USD | 702,061 | JPMorgan Chase Bank, N.A. | 8/29/24 | (57,714) |
| MYR | 2,730,000 | USD | 584,207 | Goldman Sachs Bank USA | 8/29/24 | (3,189) |
| MYR | 5,084,000 | USD | 1,080,093 | State Street Bank and Trust Co | 8/29/24 | 1,920 |
| PEN | 3,825,000 | USD | 1,007,507 | Bank of America, N.A. | 8/29/24 | (13,646) |
| PEN | 1,094,000 | USD | 288,479 | JPMorgan Chase Bank, N.A. | 8/29/24 | (4,222) |
| PHP | 38,721,000 | USD | 662,520 | State Street Bank and Trust Co | 8/29/24 | (721) |
| PLN | 9,338,000 | USD | 2,298,142 | BNP Paribas S.A. | 8/29/24 | 19,929 |
| PLN | 9,525,000 | USD | 2,355,059 | Canadian Imperial Bk. of Comm. | 8/29/24 | 9,432 |
| PLN | 2,646,000 | USD | 660,405 | Goldman Sachs Bank USA | 8/29/24 | (3,561) |
| PLN | 11,768,000 | USD | 2,905,470 | JPMorgan Chase Bank, N.A. | 8/29/24 | 15,826 |
| PLN | 11,924,000 | USD | 2,999,785 | State Street Bank and Trust Co | 8/29/24 | (39,764) |
| RON | 3,394,000 | USD | 732,201 | BNP Paribas S.A. | 8/29/24 | (2,390) |
| RON | 13,411,000 | USD | 2,905,361 | Citibank, N. A. | 8/29/24 | (21,596) |
| THB | 560,742,000 | USD | 15,345,746 | JPMorgan Chase Bank, N.A. | 8/29/24 | (4,969) |
| THB | 28,355,000 | USD | 779,301 | JPMorgan Chase Bank, N.A. | 8/29/24 | (3,565) |
| TRY | 20,833,000 | USD | 594,953 | Bank of America, N.A. | 8/29/24 | 2,141 |
| TRY | 20,729,000 | USD | 594,609 | Bank of America, N.A. | 8/29/24 | (496) |
| TRY | 103,436,000 | USD | 2,904,623 | Citibank, N. A. | 8/29/24 | 59,953 |
| TRY | 26,494,000 | USD | 758,631 | JPMorgan Chase Bank, N.A. | 8/29/24 | 713 |
| TWD | 43,132,000 | USD | 1,337,426 | Royal Bank of Canada | 8/29/24 | (2,003) |
| USD | 1,358,363 | BRL | 7,048,000 | BNP Paribas S.A. | 8/29/24 | 105,960 |
| USD | 1,905,588 | BRL | 10,657,000 | Bank of America, N.A. | 8/29/24 | 11,880 |
| USD | 1,222,823 | BRL | 6,688,000 | Citibank, N. A. | 8/29/24 | 34,391 |
| USD | 566,343 | BRL | 2,937,000 | State Street Bank and Trust Co | 8/29/24 | 44,450 |
| USD | 691,241 | CLP | 617,299,000 | BNP Paribas S.A. | 8/29/24 | 35,549 |
| USD | 1,297,782 | CLP | 1,217,968,000 | Goldman Sachs Bank USA | 8/29/24 | 4,061 |
| USD | 645,455 | CLP | 597,369,000 | Royal Bank of Canada | 8/29/24 | 10,932 |
| USD | 1,371,229 | CNY | 9,753,000 | State Street Bank and Trust Co | 8/29/24 | 20,420 |
| USD | 606,143 | COP | 2,346,400,000 | BNP Paribas S.A. | 8/29/24 | 46,078 |
| USD | 664,926 | COP | 2,635,100,000 | Bank of America, N.A. | 8/29/24 | 35,951 |
| USD | 692,437 | COP | 2,728,200,000 | Citibank, N. A. | 8/29/24 | 41,240 |
| USD | 1,079,899 | CZK | 24,439,000 | Bank of America, N.A. | 8/29/24 | 33,780 |
| USD | 643,887 | CZK | 14,962,000 | Goldman Sachs Bank USA | 8/29/24 | 3,434 |
| USD | 624,023 | CZK | 14,533,000 | Goldman Sachs Bank USA | 8/29/24 | 1,933 |
| USD | 705,839 | CZK | 16,352,000 | JPMorgan Chase Bank, N.A. | 8/29/24 | 5,887 |
| USD | 1,346,469 | EUR | 1,234,000 | Brown Brothers Harriman & Co | 8/29/24 | 21,091 |
| USD | 2,010,020 | EUR | 1,854,000 | Royal Bank of Canada | 8/29/24 | 18,730 |
| USD | 1,294,519 | EUR | 1,201,000 | Royal Bank of Canada | 8/29/24 | 4,585 |
| USD | 578,523 | HUF | 214,301,000 | BNP Paribas S.A. | 8/29/24 | (1,263) |
| USD | 678,529 | HUF | 245,547,000 | Canadian Imperial Bk. of Comm. | 8/29/24 | 14,208 |
| USD | 378,000 | HUF | 139,297,000 | Canadian Imperial Bk. of Comm. | 8/29/24 | 1,135 |
| USD | 1,355,973 | HUF | 484,035,000 | Goldman Sachs Bank USA | 8/29/24 | 46,429 |
| USD | 1,384,918 | IDR | 22,239,800,000 | BNP Paribas S.A. | 8/29/24 | 28,045 |
| USD | 1,395,465 | INR | 116,693,000 | Goldman Sachs Bank USA | 8/29/24 | (1,807) |
| USD | 1,355,920 | INR | 113,321,000 | Goldman Sachs Bank USA | 8/29/24 | (977) |
| USD | 457,778 | KZT | 209,891,000 | Goldman Sachs Bank USA | 8/29/24 | 20,305 |
| USD | 264,448 | MXN | 4,960,000 | BNP Paribas S.A. | 8/29/24 | (4,142) |
| USD | 167,913 | MXN | 3,092,000 | Canadian Imperial Bk. of Comm. | 8/29/24 | 477 |
| USD | 801,678 | MXN | 13,538,000 | Citibank, N. A. | 8/29/24 | 68,577 |
| USD | 679,318 | MXN | 12,224,000 | Goldman Sachs Bank USA | 8/29/24 | 17,372 |
| USD | 625,226 | MYR | 2,937,000 | Goldman Sachs Bank USA | 8/29/24 | 153 |
| USD | 1,038,986 | MYR | 4,877,000 | Goldman Sachs Bank USA | 8/29/24 | 1,028 |
| USD | 1,318,944 | PEN | 4,919,000 | State Street Bank and Trust Co | 8/29/24 | 40,825 |
| USD | 656,288 | PHP | 38,721,000 | Bank of America, N.A. | 8/29/24 | (5,512) |
| USD | 647,157 | PLN | 2,562,000 | Bank of America, N.A. | 8/29/24 | 11,164 |
| USD | 1,699,292 | PLN | 6,667,000 | Canadian Imperial Bk. of Comm. | 8/29/24 | 44,272 |
| USD | 651,552 | PLN | 2,556,000 | JPMorgan Chase Bank, N.A. | 8/29/24 | 17,049 |
| USD | 688,606 | PLN | 2,701,000 | JPMorgan Chase Bank, N.A. | 8/29/24 | 18,108 |
| USD | 539,520 | RON | 2,507,000 | JPMorgan Chase Bank, N.A. | 8/29/24 | 440 |
| USD | 907,652 | THB | 33,251,000 | JPMorgan Chase Bank, N.A. | 8/29/24 | (2,029) |
| USD | 1,329,300 | THB | 48,508,000 | JPMorgan Chase Bank, N.A. | 8/29/24 | 2,219 |
| USD | 706,546 | TRY | 24,995,000 | BNP Paribas S.A. | 8/29/24 | (9,835) |
| USD | 1,360,543 | TRY | 48,854,000 | Bank of America, N.A. | 8/29/24 | (39,661) |
| USD | 2,649,234 | TRY | 94,057,000 | Bank of America, N.A. | 8/29/24 | (46,531) |
| USD | 675,404 | TWD | 21,619,000 | BNP Paribas S.A. | 8/29/24 | 6,051 |
| USD | 666,450 | TWD | 21,513,000 | BNP Paribas S.A. | 8/29/24 | 379 |
| USD | 864,799 | ZAR | 16,305,000 | Canadian Imperial Bk. of Comm. | 8/29/24 | (27,307) |
| USD | 639,010 | ZAR | 11,655,000 | Goldman Sachs Bank USA | 8/29/24 | 1,322 |
| ZAR | 22,338,000 | USD | 1,209,277 | State Street Bank and Trust Co | 8/29/24 | 12,916 |
| ZAR | 12,413,000 | USD | 675,879 | State Street Bank and Trust Co | 8/29/24 | 3,282 |
| EGP | 35,580,000 | USD | 638,206 | Goldman Sachs Bank USA | 3/13/25 | 46,213 |
| USD | 671,955 | EGP | 35,580,000 | Goldman Sachs Bank USA | 3/13/25 | (12,464) |
| | | | | | | |
| TOTAL FORWARD FOREIGN CURRENCY CONTRACTS | | (342,966) |
| Unrealized Appreciation | | | 1,004,579 |
| Unrealized Depreciation | | | (1,347,545) |
For the period, the average contract value for forward foreign currency contracts was $110,214,451. Contract value represents contract amount in United States dollars plus or minus unrealized appreciation or depreciation, respectively.
Currency Abbreviations
| BRL | - | Brazilian real |
| CLP | - | Chilean peso |
| CNY | - | Chinese yuan |
| COP | - | Colombian peso |
| CZK | - | Czech koruna |
| DOP | - | Dominican Republic peso |
| EGP | - | Egyptian pound |
| EUR | - | European Monetary Unit |
| HUF | - | Hungarian forint |
| IDR | - | Indonesian rupiah |
| INR | - | Indian rupee |
| KRW | - | Korean won |
| KZT | - | Kazakhstan tenge |
| MXN | - | Mexican peso |
| MYR | - | Malaysian ringgit |
| PEN | - | Peruvian new sol |
| PHP | - | Philippine peso |
| PLN | - | Polish zloty |
| PYG | - | Paraguay Guarani |
| RON | - | Romanian leu |
| THB | - | Thai baht |
| TRY | - | Turkish Lira |
| TWD | - | Taiwanese dollar |
| USD | - | U.S. dollar |
| UYU | - | Uruguay peso |
| ZAR | - | South African rand |
Legend
| (a) | Amount is stated in United States dollars unless otherwise noted. |
| (b) | Security or a portion of the security has been segregated as collateral for open forward foreign currency contracts. At period end, the value of securities pledged amounted to $251,404. |
| (c) | Security exempt from registration under Rule 144A of the Securities Act of 1933. These securities may be resold in transactions exempt from registration, normally to qualified institutional buyers. At the end of the period, the value of these securities amounted to $3,905,314 or 1.5% of net assets. |
| (d) | Affiliated fund that is generally available only to investment companies and other accounts managed by Fidelity Investments. The rate quoted is the annualized seven-day yield of the fund at period end. A complete unaudited listing of the fund's holdings as of its most recent quarter end is available upon request. In addition, each Fidelity Central Fund's financial statements are available on the SEC's website or upon request. |
Affiliated Central Funds
Fiscal year to date information regarding the Fund's investments in Fidelity Central Funds, including the ownership percentage, is presented below.
| Affiliate | Value, beginning of period ($) | Purchases ($) | Sales Proceeds ($) | Dividend Income ($) | Realized Gain (loss) ($) | Change in Unrealized appreciation (depreciation) ($) | Value, end of period ($) | % ownership, end of period |
| Fidelity Cash Central Fund 5.38% | 40,241,620 | 70,779,140 | 77,248,995 | 965,815 | - | - | 33,771,765 | 0.1% |
| Total | 40,241,620 | 70,779,140 | 77,248,995 | 965,815 | - | - | 33,771,765 | |
| | | | | | | | | |
Amounts in the dividend income column in the above table include any capital gain distributions from underlying funds, which are presented in the corresponding line item in the Statement of Operations, if applicable.
Amounts included in the purchases and sales proceeds columns may include in-kind transactions, if applicable.
Investment Valuation
The following is a summary of the inputs used, as of June 30, 2024, involving the Fund's assets and liabilities carried at fair value. The inputs or methodology used for valuing securities may not be an indication of the risk associated with investing in those securities. For more information on valuation inputs, and their aggregation into the levels used below, please refer to the Investment Valuation section in the accompanying Notes to Financial Statements.
| Valuation Inputs at Reporting Date: |
| Description | Total ($) | Level 1 ($) | Level 2 ($) | Level 3 ($) |
Investments in Securities: | | | | |
|
| U.S. Government and Government Agency Obligations | 1,333,498 | - | 1,333,498 | - |
|
| Foreign Government and Government Agency Obligations | 215,726,176 | - | 215,726,176 | - |
|
| Supranational Obligations | 3,757,329 | - | 3,757,329 | - |
|
| Money Market Funds | 33,771,765 | 33,771,765 | - | - |
| Total Investments in Securities: | 254,588,768 | 33,771,765 | 220,817,003 | - |
Derivative Instruments: Assets | | | | |
Forward Foreign Currency Contracts | 1,004,579 | - | 1,004,579 | - |
| Total Assets | 1,004,579 | - | 1,004,579 | - |
| Liabilities | | | | |
Forward Foreign Currency Contracts | (1,347,545) | - | (1,347,545) | - |
| Total Liabilities | (1,347,545) | - | (1,347,545) | - |
| Total Derivative Instruments: | (342,966) | - | (342,966) | - |
Value of Derivative Instruments
The following table is a summary of the Fund's value of derivative instruments by primary risk exposure as of June 30, 2024. For additional information on derivative instruments, please refer to the Derivative Instruments section in the accompanying Notes to Financial Statements.
Primary Risk Exposure / Derivative Type | Value |
| Asset ($) | Liability ($) |
| Foreign Exchange Risk | | |
Forward Foreign Currency Contracts (a) | 1,004,579 | (1,347,545) |
| Total Foreign Exchange Risk | 1,004,579 | (1,347,545) |
| Total Value of Derivatives | 1,004,579 | (1,347,545) |
(a)Gross value is presented in the Statement of Assets and Liabilities in the unrealized appreciation/depreciation on forward foreign currency contracts line-items.
Fidelity® Emerging Markets Debt Local Currency Central Fund
Financial Statements (Unaudited)
| Statement of Assets and Liabilities |
| | | | June 30, 2024 (Unaudited) |
| | | | | |
| Assets | | | | |
| Investment in securities, at value - See accompanying schedule: | | | | |
Unaffiliated issuers (cost $227,115,114) | $ | 220,817,003 | | |
Fidelity Central Funds (cost $33,771,765) | | 33,771,765 | | |
| | | | | |
| | | | | |
| Total Investment in Securities (cost $260,886,879) | | | $ | 254,588,768 |
| Cash | | | | 9,564 |
| Foreign currency held at value (cost $718,884) | | | | 691,714 |
| Unrealized appreciation on forward foreign currency contracts | | | | 1,004,579 |
| Dividends receivable | | | | 102,690 |
| Interest receivable | | | | 4,554,113 |
| Distributions receivable from Fidelity Central Funds | | | | 130,198 |
| Other receivables | | | | 65 |
Total assets | | | | 261,081,691 |
| Liabilities | | | | |
| Unrealized depreciation on forward foreign currency contracts | $ | 1,347,545 | | |
| Other payables and accrued expenses | | 61,310 | | |
| Total liabilities | | | | 1,408,855 |
| Net Assets | | | $ | 259,672,836 |
| Net Assets consist of: | | | | |
| Paid in capital | | | $ | 274,936,254 |
| Total accumulated earnings (loss) | | | | (15,263,418) |
| Net Assets | | | $ | 259,672,836 |
Net Asset Value, offering price and redemption price per share ($259,672,836 ÷ 3,014,291 shares) | | | $ | 86.15 |
| Statement of Operations |
| | | | Six months ended June 30, 2024 (Unaudited) |
| Investment Income | | | | |
| Interest | | | $ | 8,948,421 |
| Income from Fidelity Central Funds | | | | 965,815 |
| Income before foreign taxes withheld | | | $ | 9,914,236 |
| Less foreign taxes withheld | | | | (101,245) |
| Total income | | | | 9,812,991 |
| Expenses | | | | |
| Custodian fees and expenses | $ | 24,357 | | |
| Independent trustees' fees and expenses | | 626 | | |
| Miscellaneous | | 4 | | |
| Total expenses before reductions | | 24,987 | | |
| Expense reductions | | (1,412) | | |
| Total expenses after reductions | | | | 23,575 |
| Net Investment income (loss) | | | | 9,789,416 |
| Realized and Unrealized Gain (Loss) | | | | |
| Net realized gain (loss) on: | | | | |
| Investment Securities: | | | | |
| Unaffiliated issuers (net of foreign taxes of $19,083) | | (2,000,232) | | |
| Forward foreign currency contracts | | (1,222,819) | | |
| Foreign currency transactions | | (90,678) | | |
| Total net realized gain (loss) | | | | (3,313,729) |
| Change in net unrealized appreciation (depreciation) on: | | | | |
| Investment Securities: | | | | |
| Unaffiliated issuers (net of decrease in deferred foreign taxes of $23,904) | | (15,681,173) | | |
| Forward foreign currency contracts | | (804,745) | | |
| Assets and liabilities in foreign currencies | | (211,984) | | |
| Total change in net unrealized appreciation (depreciation) | | | | (16,697,902) |
| Net gain (loss) | | | | (20,011,631) |
| Net increase (decrease) in net assets resulting from operations | | | $ | (10,222,215) |
| Statement of Changes in Net Assets |
| |
| | Six months ended June 30, 2024 (Unaudited) | | Year ended December 31, 2023 |
| Increase (Decrease) in Net Assets | | | | |
| Operations | | | | |
| Net investment income (loss) | $ | 9,789,416 | $ | 17,805,607 |
| Net realized gain (loss) | | (3,313,729) | | (3,398,908) |
| Change in net unrealized appreciation (depreciation) | | (16,697,902) | | 15,584,531 |
| Net increase (decrease) in net assets resulting from operations | | (10,222,215) | | 29,991,230 |
| Distributions to shareholders | | (4,083,522) | | (17,272,974) |
| | | | | |
| Affiliated share transactions | | | | |
| Proceeds from sales of shares | | 53,164 | | 182,001,326 |
| Reinvestment of distributions | | 4,083,522 | | 17,272,974 |
| Cost of shares redeemed | | (28,170,821) | | (788,275) |
| | | | | |
Net increase (decrease) in net assets resulting from share transactions | | (24,034,135) | | 198,486,025 |
| Total increase (decrease) in net assets | | (38,339,872) | | 211,204,281 |
| | | | | |
| Net Assets | | | | |
| Beginning of period | | 298,012,708 | | 86,808,427 |
| End of period | $ | 259,672,836 | $ | 298,012,708 |
| | | | | |
| Other Information | | | | |
| Shares | | | | |
| Sold | | 611 | | 2,082,339 |
| Issued in reinvestment of distributions | | 46,712 | | 197,058 |
| Redeemed | | (323,542) | | (8,779) |
| Net increase (decrease) | | (276,219) | | 2,270,618 |
| | | | | |
Financial Highlights
Fidelity® Emerging Markets Debt Local Currency Central Fund |
| |
| | Six months ended (Unaudited) June 30, 2024 | | Years ended December 31, 2023 | | 2022 | | 2021 | | 2020 A |
Selected Per-Share Data | | | | | | | | | | |
| Net asset value, beginning of period | $ | 90.57 | $ | 85.12 | $ | 93.30 | $ | 108.21 | $ | 100.00 |
| Income from Investment Operations | | | | | | | | | | |
Net investment income (loss) B,C | | 3.037 | | 6.097 | | 4.389 | | 4.478 | | 1.042 |
| Net realized and unrealized gain (loss) | | (6.216) | | 4.973 | | (11.606) | | (13.557) | | 8.599 |
| Total from investment operations | | (3.179) | | 11.070 | | (7.217) | | (9.079) | | 9.641 |
| Distributions from net investment income | | (1.241) | | (5.620) | | (.963) | | (5.726) | | (1.431) |
| Distributions from net realized gain | | - | | - | | - | | (.105) | | - |
| Total distributions | | (1.241) | | (5.620) | | (.963) | | (5.831) | | (1.431) |
| Net asset value, end of period | $ | 86.15 | $ | 90.57 | $ | 85.12 | $ | 93.30 | $ | 108.21 |
Total Return D,E | | | | 13.23% | | (7.82)% | | (8.48)% | | 9.65% |
Ratios to Average Net Assets C,F,G | | | | | | | | | | |
| Expenses before reductions | | .02% H,I | | .02% | | .02% | | .03% | | .04% I |
| Expenses net of fee waivers, if any | | | | .02% | | .02% | | .03% | | .04% I |
| Expenses net of all reductions | | .02% H,I | | .02% | | .02% | | .03% | | .04% I |
| Net investment income (loss) | | 6.96% H,I | | 6.80% | | 5.21% | | 4.37% | | 3.66% I |
| Supplemental Data | | | | | | | | | | |
| Net assets, end of period (000 omitted) | $ | 259,673 | $ | 298,013 | $ | 86,808 | $ | 94,140 | $ | 164,503 |
Portfolio turnover rate J | | | | 63% | | 60% | | 81% | | 30% I |
AFor the period September 23, 2020 (commencement of operations) through December 31, 2020.
BCalculated based on average shares outstanding during the period.
CNet investment income (loss) is affected by the timing of the declaration of dividends by any underlying mutual funds or exchange-traded funds (ETFs). Net investment income (loss) of any mutual funds or ETFs is not included in the Fund's net investment income (loss) ratio.
DTotal returns for periods of less than one year are not annualized.
ETotal returns would have been lower if certain expenses had not been reduced during the applicable periods shown.
FFees and expenses of any underlying mutual funds or exchange-traded funds (ETFs) are not included in the Fund's expense ratio. The Fund indirectly bears its proportionate share of these expenses. For additional expense information related to investments in Fidelity Central Funds, please refer to the "Investments in Fidelity Central Funds" note found in the Notes to Financial Statements section of the most recent Annual or Semi-Annual report.
GExpense ratios reflect operating expenses of the class. Expenses before reductions do not reflect amounts reimbursed, waived, or reduced through arrangements with the investment adviser, brokerage services, or other offset arrangements, if applicable, and do not represent the amount paid by the class during periods when reimbursements, waivers or reductions occur.
HProxy expenses are not annualized.
IAnnualized.
JAmount does not include the portfolio activity of any underlying mutual funds or exchange-traded funds (ETFs).
Notes to Financial Statements
(Unaudited)For the period ended June 30, 2024
1.Organization.
Fidelity Emerging Markets Debt Central Fund and Fidelity Emerging Markets Debt Local Currency Central Fund (the Funds) are funds of Fidelity Hanover Street Trust (the Trust). Each Fund is authorized to issue an unlimited number of shares. The Trust is registered under the Investment Company Act of 1940, as amended (the 1940 Act), as an open-end management investment company organized as a Massachusetts business trust. Fidelity Emerging Markets Debt Local Currency Central Fund is a non-diversified fund. Investments in emerging markets, if applicable, can be subject to social, economic, regulatory, and political uncertainties and can be extremely volatile.
2.Investments in Fidelity Central Funds.
Funds may invest in Fidelity Central Funds, which are open-end investment companies generally available only to other investment companies and accounts managed by the investment adviser and its affiliates. The Schedule of Investments lists any Fidelity Central Funds held as an investment as of period end, but does not include the underlying holdings of each Fidelity Central Fund. An investing fund indirectly bears its proportionate share of the expenses of the underlying Fidelity Central Funds.
Based on its investment objective, each Fidelity Central Fund may invest or participate in various investment vehicles or strategies that are similar to those of the investing fund. These strategies are consistent with the investment objectives of the investing fund and may involve certain economic risks which may cause a decline in value of each of the Fidelity Central Funds and thus a decline in the value of the investing fund.
| Fidelity Central Fund | Investment Manager | Investment Objective | Investment Practices | Expense RatioA |
| Fidelity Money Market Central Funds | Fidelity Management & Research Company LLC (FMR) | Each fund seeks to obtain a high level of current income consistent with the preservation of capital and liquidity. | Short-term Investments | Less than .005% |
A Expenses expressed as a percentage of average net assets and are as of each underlying Central Fund's most recent annual or semi-annual shareholder report.
A complete unaudited list of holdings for each Fidelity Central Fund is available upon request or at the Securities and Exchange Commission website at www.sec.gov. In addition, the financial statements of the Fidelity Central Funds which contain the significant accounting policies (including investment valuation policies) of those funds, and are not covered by the Report of Independent Registered Public Accounting Firm, are available on the Securities and Exchange Commission website or upon request.
3.Significant Accounting Policies.
Each Fund is an investment company and applies the accounting and reporting guidance of the Financial Accounting Standards Board (FASB) Accounting Standards Codification Topic 946 Financial Services - Investment Companies. The financial statements have been prepared in conformity with accounting principles generally accepted in the United States of America (GAAP), which require management to make certain estimates and assumptions at the date of the financial statements. Actual results could differ from those estimates. Subsequent events, if any, through the date that the financial statements were issued have been evaluated in the preparation of the financial statements. Each Fund's Schedule of Investments lists any underlying mutual funds or exchange-traded funds (ETFs) but does not include the underlying holdings of these funds. The following summarizes the significant accounting policies of each Fund:
Investment Valuation. Investments are valued as of 4:00 p.m. Eastern time on the last calendar day of the period. The Board of Trustees (the Board) has designated each Fund's investment adviser as the valuation designee responsible for the fair valuation function and performing fair value determinations as needed. The investment adviser has established a Fair Value Committee (the Committee) to carry out the day-to-day fair valuation responsibilities and has adopted policies and procedures to govern the fair valuation process and the activities of the Committee. In accordance with these fair valuation policies and procedures, which have been approved by the Board, each Fund attempts to obtain prices from one or more third party pricing services or brokers to value its investments. When current market prices, quotations or currency exchange rates are not readily available or reliable, investments will be fair valued in good faith by the Committee, in accordance with the policies and procedures. Factors used in determining fair value vary by investment type and may include market or investment specific events, transaction data, estimated cash flows, and market observations of comparable investments. The frequency that the fair valuation procedures are used cannot be predicted and they may be utilized to a significant extent. The Committee manages each Fund's fair valuation practices and maintains the fair valuation policies and procedures. Each Fund's investment adviser reports to the Board information regarding the fair valuation process and related material matters.
Each Fund categorizes the inputs to valuation techniques used to value its investments into a disclosure hierarchy consisting of three levels as shown below:
Level 1 - unadjusted quoted prices in active markets for identical investments
Level 2 - other significant observable inputs (including quoted prices for similar investments, interest rates, prepayment speeds, etc.)
Level 3 - unobservable inputs (including the Fund's own assumptions based on the best information available)
Valuation techniques used to value each Fund's investments by major category are as follows:
Debt securities, including restricted securities, are valued based on evaluated prices received from third party pricing services or from brokers who make markets in such securities. Corporate bonds, foreign government and government agency obligations, preferred securities, supranational obligations and U.S. government and government agency obligations are valued by pricing services who utilize matrix pricing which considers yield or price of bonds of comparable quality, coupon, maturity and type or by broker-supplied prices. When independent prices are unavailable or unreliable, debt securities may be valued utilizing pricing methodologies which consider similar factors that would be used by third party pricing services. For foreign debt securities, when significant market or security specific events arise, valuations may be determined in good faith in accordance with procedures adopted by the Board. Debt securities are generally categorized as Level 2 in the hierarchy but may be Level 3 depending on the circumstances. The Fund invests a significant portion of its assets in below investment grade securities. The value of these securities can be more volatile due to changes in the credit quality of the issuer and is sensitive to changes in economic, market and regulatory conditions.
Equity securities, including restricted securities, for which market quotations are readily available, are valued at the last reported sale price or official closing price as reported by a third party pricing service on the primary market or exchange on which they are traded and are categorized as Level 1 in the hierarchy. In the event there were no sales during the day or closing prices are not available, securities are valued at the last quoted bid price or may be valued using the last available price and are generally categorized as Level 2 in the hierarchy. For equity securities, including restricted securities, where observable inputs are limited, assumptions about market activity and risk are used and these securities may be categorized as Level 3 in the hierarchy.
The U.S. dollar value of forward foreign currency contracts is determined using currency exchange rates supplied by a pricing service and are categorized as Level 2 in the hierarchy. Futures contracts are valued at the settlement price established each day by the board of trade or exchange on which they are traded and are categorized as Level 1 in the hierarchy. Investments in open-end mutual funds including the Fidelity Central Funds, are valued at their closing net asset value (NAV) each business day and are categorized as Level 1 in the hierarchy.
Changes in valuation techniques may result in transfers in or out of an assigned level within the disclosure hierarchy. The aggregate value of investments by input level as of June 30, 2024 is included at the end of each Fund's Schedule of Investments.
Foreign Currency. Foreign-denominated assets, including investment securities, and liabilities are translated into U.S. dollars at the exchange rates at period end. Purchases and sales of investment securities, income and dividends received, and expenses denominated in foreign currencies are translated into U.S. dollars at the exchange rate in effect on the transaction date.
The effects of exchange rate fluctuations on investments are included with the net realized and unrealized gain (loss) on investment securities. Other foreign currency transactions resulting in realized and unrealized gain (loss) are disclosed separately.
Realized gains and losses on foreign currency transactions arise from the disposition of foreign currency, realized changes in the value of foreign currency between the trade and settlement dates on security transactions, and the difference between the amounts of dividends, interest and foreign withholding taxes recorded on transaction date and the U.S. dollar equivalent of the amounts actually received or paid. Unrealized gains and losses on assets and liabilities in foreign currencies arise from changes in the value of foreign currency, and from assets and liabilities denominated in foreign currencies, other than investments, which are held at period end.
Investment Transactions and Income. For financial reporting purposes, the Funds' investment holdings and NAV include trades executed through the end of the last business day of the period. The NAV per share for processing shareholder transactions is calculated as of the close of business of the New York Stock Exchange (NYSE), normally 4:00 p.m. Eastern time and includes trades executed through the end of the prior business day. Gains and losses on securities sold are determined on the basis of identified cost. Commissions paid to certain brokers with whom the investment adviser, or its affiliates, places trades on behalf of a fund include an amount in addition to trade execution, which may be rebated back to a fund. Any such rebates are included in net realized gain (loss) on investments in the Statement of Operations. Dividend income is recorded on the ex-dividend date. Income and capital gain distributions from Fidelity Central Funds, if any, are recorded on the ex-dividend date. Interest income is accrued as earned and includes coupon interest and amortization of premium and accretion of discount on debt securities as applicable. Paid in Kind (PIK) income is recorded at the fair market value of the securities received. Investment income is recorded net of foreign taxes withheld where recovery of such taxes is uncertain. Debt obligations may be placed on non-accrual status and related interest income may be reduced by ceasing current accruals and writing off interest receivables when the collection of all or a portion of interest has become doubtful based on consistently applied procedures. A debt obligation is removed from non-accrual status when the issuer resumes interest payments or when collectability of interest is reasonably assured. Funds may file withholding tax reclaims in certain jurisdictions to recover a portion of amounts previously withheld. Any withholding tax reclaims income is included in the Statement of Operations in foreign taxes withheld. Any receivables for withholding tax reclaims are included in the Statement of Assets and Liabilities in dividends receivable.
Expenses. Expenses directly attributable to a fund are charged to that fund. Expenses attributable to more than one fund are allocated among the respective funds on the basis of relative net assets or other appropriate methods. Expenses included in the accompanying financial statements reflect the expenses of that fund and do not include any expenses associated with any underlying mutual funds or exchange-traded funds. Although not included in a fund's expenses, a fund indirectly bears its proportionate share of these expenses through the net asset value of each underlying mutual fund or exchange-traded fund. Expense estimates are accrued in the period to which they relate and adjustments are made when actual amounts are known.
Income Tax Information and Distributions to Shareholders. Each year, each Fund intends to qualify as a regulated investment company under Subchapter M of the Internal Revenue Code, including distributing substantially all of its taxable income and realized gains. As a result, no provision for U.S. Federal income taxes is required. Each Fund files a U.S. federal tax return, in addition to state and local tax returns as required. Each Fund's federal income tax returns are subject to examination by the Internal Revenue Service (IRS) for a period of three fiscal years after they are filed. State and local tax returns may be subject to examination for an additional fiscal year depending on the jurisdiction. Foreign taxes are provided for based on each Fund's understanding of the tax rules and rates that exist in the foreign markets in which it invests. The Fidelity Emerging Markets Debt Local Currency Central Fund is subject to a tax imposed on capital gains by certain countries in which it invests. An estimated deferred tax liability for net unrealized appreciation on the applicable securities is included in Other payables and accrued expenses on each applicable Fund's Statement of Assets & Liabilities.
Distributions are declared and recorded daily and paid monthly from net investment income. Distributions from realized gains, if any, are declared and recorded on the ex-dividend date. Income and capital gain distributions are determined in accordance with income tax regulations, which may differ from GAAP.
Capital accounts within the financial statements are adjusted for permanent book-tax differences. These adjustments have no impact on net assets or the results of operations. Capital accounts are not adjusted for temporary book-tax differences which will reverse in a subsequent period.
Book-tax differences are primarily due to futures contracts, foreign currency transactions, certain foreign taxes, market discount, contingent interest and capital loss carryforwards and losses deferred due to wash sales and futures contracts.
As of period end, the cost and unrealized appreciation (depreciation) in securities, and derivatives if applicable, for federal income tax purposes were as follows for each Fund:
| | Tax cost ($) | Gross unrealized appreciation ($) | Gross unrealized depreciation ($) | Net unrealized appreciation (depreciation)($) |
Fidelity Emerging Markets Debt Central Fund | 2,272,560,458 | 56,475,083 | (253,586,336) | (197,111,253) |
Fidelity Emerging Markets Debt Local Currency Central Fund | 261,766,766 | 5,052,857 | (12,573,821) | (7,520,964) |
Capital loss carryforwards are only available to offset future capital gains of the Funds to the extent provided by regulations and may be limited. The capital loss carryforward information presented below, including any applicable limitation, is estimated as of prior fiscal period end and is subject to adjustment.
| | Short-term ($) | Long-term ($) | Total capital loss carryforward ($) |
Fidelity Emerging Markets Debt Central Fund | (54,942,364) | (237,464,275) | (292,406,639) |
Fidelity Emerging Markets Debt Local Currency Central Fund | (3,210,532) | (4,419,719) | (7,630,251) |
Delayed Delivery Transactions and When-Issued Securities. During the period, certain Funds transacted in securities on a delayed delivery or when-issued basis. Payment and delivery may take place after the customary settlement period for that security. The price of the underlying securities and the date when the securities will be delivered and paid for are fixed at the time the transaction is negotiated. Securities purchased on a delayed delivery or when-issued basis are identified as such in the Schedule of Investments. Compensation for interest forgone in the purchase of a delayed delivery or when-issued debt security may be received. With respect to purchase commitments, each applicable Fund identifies securities as segregated in its records with a value at least equal to the amount of the commitment. Payables and receivables associated with the purchases and sales of delayed delivery securities having the same coupon, settlement date and broker are offset. Delayed delivery or when-issued securities that have been purchased from and sold to different brokers are reflected as both payables and receivables in the Statement of Assets and Liabilities under the caption "Delayed delivery", as applicable. Losses may arise due to changes in the value of the underlying securities or if the counterparty does not perform under the contract's terms, or if the issuer does not issue the securities due to political, economic, or other factors.
Restricted Securities (including Private Placements). Funds may invest in securities that are subject to legal or contractual restrictions on resale. These securities generally may be resold in transactions exempt from registration or to the public if the securities are registered. Disposal of these securities may involve time-consuming negotiations and expense, and prompt sale at an acceptable price may be difficult. Information regarding restricted securities held at period end is included at the end of the Schedule of Investments, if applicable.
4.Derivative Instruments.
Risk Exposures and the Use of Derivative Instruments. Each Fund's investment objectives allow for various types of derivative instruments, including futures contracts and forward foreign currency contracts. Derivatives are investments whose value is primarily derived from underlying assets, indices or reference rates and may be transacted on an exchange or over-the-counter (OTC). Derivatives may involve a future commitment to buy or sell a specified asset based on specified terms, to exchange future cash flows at periodic intervals based on a notional principal amount, or for one party to make one or more payments upon the occurrence of specified events in exchange for periodic payments from the other party.
Derivatives were used to increase returns, to facilitate transactions in foreign-denominated securities and to manage exposure to certain risks as defined below. The success of any strategy involving derivatives depends on analysis of numerous economic factors, and if the strategies for investment do not work as intended, the objectives may not be achieved.
Derivatives were used to increase or decrease exposure to the following risk(s):
| | |
| Foreign Exchange Risk | Foreign exchange rate risk relates to fluctuations in the value of an asset or liability due to changes in currency exchange rates. |
| Interest Rate Risk | Interest rate risk relates to the fluctuations in the value of interest-bearing securities due to changes in the prevailing levels of market interest rates. |
Funds are also exposed to additional risks from investing in derivatives, such as liquidity risk and counterparty credit risk. Liquidity risk is the risk that a fund will be unable to close out the derivative in the open market in a timely manner. Counterparty credit risk is the risk that the counterparty will not be able to fulfill its obligation to a fund. Derivative counterparty credit risk is managed through formal evaluation of the creditworthiness of all potential counterparties. On certain OTC derivatives such as forward foreign currency contracts, a fund attempts to reduce its exposure to counterparty credit risk by entering into an International Swaps and Derivatives Association, Inc. (ISDA) Master Agreement with each of its counterparties. The ISDA Master Agreement gives a fund the right to terminate all transactions traded under such agreement upon the deterioration in the credit quality of the counterparty beyond specified levels. The ISDA Master Agreement gives each party the right, upon an event of default by the other party or a termination of the agreement, to close out all transactions traded under such agreement and to net amounts owed under each transaction to one net payable by one party to the other. To mitigate counterparty credit risk on bi-lateral OTC derivatives, a fund receives collateral in the form of cash or securities once net unrealized appreciation on outstanding derivative contracts under an ISDA Master Agreement exceeds certain applicable thresholds, subject to certain minimum transfer provisions. The collateral received is held in segregated accounts with the custodian bank in accordance with the collateral agreements entered into between a fund, the counterparty and the custodian bank. A fund could experience delays and costs in gaining access to the collateral even though it is held by the custodian bank. The maximum risk of loss to a fund from counterparty credit risk related to bi-lateral OTC derivatives is generally the aggregate unrealized appreciation and unpaid counterparty payments in excess of any collateral pledged by the counterparty to a fund. A fund may be required to pledge collateral for the benefit of the counterparties on bi-lateral OTC derivatives in an amount not less than each counterparty's unrealized appreciation on outstanding derivative contracts, subject to certain minimum transfer provisions, and any such pledged collateral is identified in the Schedule of Investments. Exchange-traded contracts are not covered by the ISDA Master Agreement; however counterparty credit risk related to these contracts may be mitigated by the protection provided by the exchange on which they trade.
Investing in derivatives may involve greater risks than investing in the underlying assets directly and, to varying degrees, may involve risk of loss in excess of any initial investment and collateral received and amounts recognized in the Statement of Assets and Liabilities. In addition, there may be the risk that the change in value of the derivative contract does not correspond to the change in value of the underlying instrument.
Forward Foreign Currency Contracts. Forward foreign currency contracts represent obligations to purchase or sell foreign currency on a specified future date at a price fixed at the time the contracts are entered into. Forward foreign currency contracts were used to facilitate transactions in foreign-denominated securities and to manage exposure to certain foreign currencies.
Forward foreign currency contracts are valued daily and fluctuations in exchange rates on open contracts are recorded as unrealized appreciation or (depreciation) and reflected in total accumulated earnings (loss) in the Statement of Assets and Liabilities. When the contract is closed, a gain or loss is realized equal to the difference between the closing value and the value at the time it was opened. Non-deliverable forward foreign currency exchange contracts are settled with the counterparty in cash without the delivery of foreign currency. The net realized gain (loss) and change in net unrealized appreciation (depreciation) on forward foreign currency contracts during the period is presented in the Statement of Operations.
Any open forward foreign currency contracts at period end are presented in the Schedule of Investments under the caption "Forward Foreign Currency Contracts." The contract amount and unrealized appreciation (depreciation) reflects each contract's exposure to the underlying currency at period end, and is representative of volume of activity during the period unless an average contract value is presented.
Futures Contracts. A futures contract is an agreement between two parties to buy or sell a specified underlying instrument for a fixed price at a specified future date. Futures contracts were used to manage exposure to the bond market and fluctuations in interest rates.
Upon entering into a futures contract, a fund is required to deposit either cash or securities (initial margin) with a clearing broker in an amount equal to a certain percentage of the face value of the contract. Futures contracts are marked-to-market daily and subsequent daily payments are made or received by a fund depending on the daily fluctuations in the value of the futures contracts and are recorded as unrealized appreciation or (depreciation). This receivable and/or payable, if any, is included in daily variation margin on futures contracts in the Statement of Assets and Liabilities. Realized gain or (loss) is recorded upon the expiration or closing of a futures contract. The net realized gain (loss) and change in net unrealized appreciation (depreciation) on futures contracts during the period is presented in the Statement of Operations.
Any open futures contracts at period end are presented in the Schedule of Investments under the caption "Futures Contracts". The notional amount at value reflects each contract's exposure to the underlying instrument or index at period end, and is representative of volume of activity during the period unless an average notional amount is presented. Any securities deposited to meet initial margin requirements are identified in the Schedule of Investments. Any cash deposited to meet initial margin requirements is presented as segregated cash with brokers for derivative instruments in the Statement of Assets and Liabilities.
5.Purchases and Sales of Investments.
Purchases and sales of securities, other than short-term securities, U.S. government securities and in-kind transactions, as applicable, are noted in the table below.
| | Purchases ($) | Sales ($) |
| Fidelity Emerging Markets Debt Central Fund | 208,423,760 | 150,690,463 |
| Fidelity Emerging Markets Debt Local Currency Central Fund | 58,773,021 | 70,373,096 |
6.Fees and Other Transactions with Affiliates.
Management Fee and Expense Contract. Fidelity Management & Research Company LLC (the investment adviser) provides each Fund with investment management services. The Funds do not pay any fees for these services. Pursuant to each Fund's expense contract, the investment adviser pays all other expenses of each Fund, excluding custody fees, the compensation of the independent Trustees, and certain miscellaneous expenses such as proxy and shareholder meeting expenses.
Interfund Trades. Funds may purchase from or sell securities to other Fidelity Funds under procedures adopted by the Board. The procedures have been designed to ensure these interfund trades are executed in accordance with Rule 17a-7 of the 1940 Act. Any interfund trades are included within the respective purchases and sales amounts shown in the Purchases and Sales of Investments note. During the period, there were no interfund trades.
Affiliated Redemptions In-Kind. Shares that were redeemed in-kind for investments, including accrued interest and cash, if any, are shown in the table below. The net realized gain or loss on investments delivered through in-kind redemptions is included in the "Net realized gain (loss) on: Redemptions in-kind" line in the accompanying Statement of Operations. The amount of the in-kind redemptions is included in share transactions in the accompanying Statement of Changes in Net Assets. There was no gain or loss for federal income tax purposes.
| | Shares | Total net realized gain or loss ($) | Total Proceeds ($) |
| Fidelity Emerging Markets Debt Central Fund | 11,140,913 | (4,462,593) | 86,899,124 |
Sub-Advisory Arrangements. Effective March 1, 2024, the Fund's sub-advisory agreements with FMR Investment Management (UK) Limited, Fidelity Management & Research (Hong Kong) Limited, and Fidelity Management & Research (Japan) Limited were amended to provide that the investment adviser pays each sub-adviser monthly fees equal to 110% of the sub-adviser's costs for providing sub-advisory services.
7.Expense Reductions.
Through arrangements with each applicable Fund's custodian, credits realized as a result of certain uninvested cash balances were used to reduce each applicable Fund's expenses. All of the applicable expense reductions are noted in the table below.
| | Custodian credits ($) |
Fidelity Emerging Markets Debt Central Fund | 3,667 |
Fidelity Emerging Markets Debt Local Currency Central Fund | 1,412 |
8.Other.
A fund's organizational documents provide former and current trustees and officers with a limited indemnification against liabilities arising in connection with the performance of their duties to the fund. In the normal course of business, a fund may also enter into contracts that provide general indemnifications. A fund's maximum exposure under these arrangements is unknown as this would be dependent on future claims that may be made against a fund. The risk of material loss from such claims is considered remote.
At the end of the period, mutual funds and accounts managed by the investment adviser or its affiliates were the owners of record of all of the outstanding shares of the Funds.
9.Credit Risk.
The Fund's relatively large investment in countries with limited or developing capital markets may involve greater risks than investments in more developed markets and the prices of such investments may be volatile. The yields of emerging market debt obligations reflect, among other things, perceived credit risk. The consequences of political, social or economic changes in these markets may have disruptive effects on the market prices of the Fund's investments and the income they generate, as well as the Fund's ability to repatriate such amounts.
10.Risk and Uncertainties.
Many factors affect a fund's performance. Developments that disrupt global economies and financial markets, such as pandemics, epidemics, outbreaks of infectious diseases, war, terrorism, and environmental disasters, may significantly affect a fund's investment performance. The effects of these developments to a fund will be impacted by the types of securities in which a fund invests, the financial condition, industry, economic sector, and geographic location of an issuer, and a fund's level of investment in the securities of that issuer. Significant concentrations in security types, issuers, industries, sectors, and geographic locations may magnify the factors that affect a fund's performance.
Item 8: Changes in and Disagreements with Accountants for Open-End Management Investment Companies
Note: This is not applicable for any fund included in this document.
Item 9: Proxy Disclosures for Open-End Management Investment Companies
Note: This is not applicable for any fund included in this document.
Item 10: Remuneration Paid to Directors, Officers, and others of Open-End Management Investment Companies
Note: This information is disclosed as part of the financial statements for each Fund as part of Item 7: Financial Statements and Financial Highlights for Open-End Management Investment companies.
Item 11: Statement Regarding Basis for Approval of Investment Advisory Contract
Board Approval of Investment Advisory Contracts
Fidelity Emerging Markets Debt Central Fund
Fidelity Emerging Markets Debt Local Currency Central Fund
At its January 2024 meeting, the Board of Trustees, including the Independent Trustees (together, the Board), approved an amended and restated management contract with Fidelity Management & Research Company LLC (FMR) (the Management Contract), and amended and restated sub-advisory agreements (the Sub-Advisory Contracts, and together with the Management Contract, the Advisory Contracts) for each fund, including each fund's sub-advisory agreements with FMR Investment Management (UK) Limited (FMR UK), Fidelity Management & Research (Hong Kong) Limited (FMR H.K.), and Fidelity Management & Research (Japan) Limited (FMR Japan), and, for Fidelity Emerging Markets Debt Central Fund, and FIL Investment Advisors (FIL). The Advisory Contracts will be effective March 1, 2024. The Board will consider the annual renewal of the funds' Advisory Contracts in May 2024, following its review of additional materials provided by FMR.
Management Contract. The Board approved each Management Contract, which eliminates the fee that FMR previously received from each investing fund's investment adviser. The Board noted each fund will continue to pay no management fee to FMR for services provided under the Management Contract.
Sub-Advisory Contracts. In connection with the Management Contract changes, the Board considered the Sub-Advisory Contracts, which simplified the calculation of the fees paid by FMR to the sub-advisers under the agreements. The Board noted that the agreements with FMR UK, FMR H.K., and FMR Japan were amended to provide that FMR will compensate each sub-adviser at a fee rate equal to 110% of the sub-adviser's costs incurred in providing services under the agreement. For Fidelity Emerging Markets Debt Central Fund, the Board further noted that the agreement with FIL was amended to provide that FMR will compensate FIL at a flat fee rate of 0.30% of the fund's net assets sub-advised by FIL. The Board considered that, under the Sub-Advisory Contracts, FMR, and not each fund, will continue to pay the sub-advisory fees to each applicable sub-adviser.
The Board considered that the approval of each fund's Advisory Contracts will not result in any changes in the investment process or strategies employed in the management of each fund's assets or the day-to-day management of each fund or the persons primarily responsible for such management. Further, the Board considered that the Management Contract would not change the obligations and services of FMR and its affiliates on behalf of each fund, and, in particular, there would be no change in the nature and level of advisory, management, administration, transfer agent, and pricing and bookkeeping services provided to each fund by FMR, its affiliates, and each applicable sub-adviser.
In connection with its consideration of future renewals of each fund's Advisory Contracts, the Board will consider: (i) the nature, extent and quality of services provided to the funds, including shareholder and administrative services and investment performance; (ii) the competitiveness of the management fee and total expenses for each fund; (iii) the costs of the services and profitability, including the revenues earned and the expenses incurred in conducting the business of developing, marketing, distributing, managing, administering, and servicing each fund and its shareholders, to the extent applicable; and (iv) whether there have been economies of scale in respect of the Fidelity funds, whether the Fidelity funds (including the funds) have appropriately benefited from any such economies of scale, and whether there is the potential for realization of any further economies.
Based on its evaluation of all of the conclusions noted above, and after considering all factors it believed relevant, the Board concluded that each fund's management fee structure is fair and reasonable, and that the funds' Advisory Contracts should be approved.
Board Approval of Investment Advisory Contracts and Management Fees
Fidelity Emerging Markets Debt Central Fund
Fidelity Emerging Markets Debt Local Currency Central Fund
Each year, the Board of Trustees, including the Independent Trustees (together, the Board), considers the renewal of each fund's management contract with Fidelity Management & Research Company LLC (FMR) and the sub-advisory agreements (together, the Advisory Contracts) for each fund. FMR and the sub-advisers are referred to herein as the Investment Advisers. The Board, assisted by the advice of fund counsel and Independent Trustees' counsel, requests and considers a broad range of information relevant to the renewal of the Advisory Contracts throughout the year.
The Board meets regularly and, at each of its meetings, covers an extensive agenda of topics and materials and considers factors that are relevant to its annual consideration of the renewal of each fund's Advisory Contracts, including the services and support provided to each fund and its shareholders. The Board, acting directly and through its Committees (each of which is composed of and chaired by Independent Trustees), requests and receives information concerning the annual consideration of the renewal of each fund's Advisory Contracts. The Board also meets as needed to review matters specifically related to the Board's annual consideration of the renewal of the Advisory Contracts. Members of the Board may also meet with trustees of other Fidelity funds through joint ad hoc committees to discuss certain matters relevant to all of the Fidelity funds.
At its May 2024 meeting, the Board unanimously determined to renew each fund's Advisory Contracts. The Board considered all factors it believed relevant and reached a determination, with the assistance of fund counsel and Independent Trustees' counsel and through the exercise of its business judgment, that the renewal of the Advisory Contracts was in the best interests of each fund and its shareholders and the fact that no fee is payable under the management contracts was fair and reasonable in light of all of the surrounding circumstances.
Nature, Extent, and Quality of Services Provided. The Board considered staffing as it relates to the funds, including the backgrounds and experience of investment personnel of the Investment Advisers, and also considered the Investment Advisers' implementation of each fund's investment program. The Independent Trustees also had discussions with senior management of Fidelity's investment operations and investment groups. The Board considered the structure of the investment personnel compensation program and whether this structure provides appropriate incentives to act in the best interests of each fund.
Resources Dedicated to Investment Management and Support Services. The Board and the Fund Oversight and Research Committees reviewed the general qualifications and capabilities of Fidelity's investment staff, including its size, education, experience, and resources, as well as Fidelity's approach to recruiting, training, managing, and compensating investment personnel. The Board noted the resources devoted to expansion of Fidelity's global investment organization, and that Fidelity's analysts have extensive resources, tools, and capabilities that allow them to conduct sophisticated quantitative and fundamental analysis, as well as credit analysis of issuers, counterparties, and guarantors. Further, the Board considered that Fidelity's investment professionals have sufficient access to global information and data so as to provide competitive investment results over time, and that those professionals also have access to sophisticated tools that permit them to assess portfolio construction and risk and performance attribution characteristics continuously, as well as to transmit new information and research conclusions rapidly around the world. Additionally, in its deliberations, the Board considered Fidelity's trading, risk management, compliance, and technology and operations capabilities and resources, which are integral parts of the investment management process.
Administrative Services. The Board considered (i) the nature, extent, quality, and cost of advisory and administrative services performed by the Investment Advisers and their affiliates under the Advisory Contracts and under separate agreements covering transfer agency and pricing and bookkeeping services for each fund; (ii) the nature and extent of Fidelity's supervision of third party service providers, principally custodians, subcustodians, and pricing vendors; and (iii) the resources devoted by Fidelity to, and the record of compliance with, each fund's compliance policies and procedures. The Board also reviewed the allocation of fund brokerage, including allocations to brokers affiliated with the Investment Advisers, the use of brokerage commissions to pay fund expenses, and the use of "soft" commission dollars to pay for research services. The Board also considered each fund's securities lending activities and any payments made to Fidelity relating to securities lending under a separate agreement.
Investment Performance. The Board reviewed each fund's absolute investment performance, as well as each fund's relative investment performance and noted that the funds are not publicly offered as a stand-alone investment product. In this regard, the Board noted that each fund is designed to offer a liquid investment option for other investment companies managed by Fidelity and ultimately to enhance the performance of those investment companies.
Based on its review, the Board concluded that the nature, extent, and quality of services provided to each fund under the Advisory Contracts should continue to benefit the shareholders of each fund.
Competitiveness of Management Fee and Total Expense Ratio. The Board considered that while each fund does not pay a management fee, FMR receives fees for providing services to funds that invest in each fund. The Board also noted that FMR bears all expenses of each fund with certain limited exceptions (i.e., custody fees, interest, taxes, fees and expenses of the Independent Trustees, proxy and shareholder meeting expenses, and extraordinary expenses). The Board further noted that each fund pays its non-operating expenses, including brokerage commissions and fees and expenses associated with the fund's securities lending program, if applicable. Based on its review, the Board concluded that the management fee received for providing services to each fund and each fund's total expense ratio was reasonable in light of the services that each fund and its shareholders receive and the other factors considered.
Costs of the Services and Profitability. The Board considered the level of Fidelity's profits in respect of all the Fidelity funds, as well as the profitability of the funds that invest in each fund.
A public accounting firm has been engaged annually by the Board as part of the Board's assessment of Fidelity's profitability analysis. The engagement includes the review and assessment of the methodologies used by Fidelity in determining the revenues and expenses attributable to Fidelity's fund business, and completion of agreed-upon procedures in respect of the mathematical accuracy of certain fund profitability information and its conformity to established allocation methodologies. After considering the reports issued under the engagement and information provided by Fidelity, the Board concluded that while other allocation methods may also be reasonable, Fidelity's profitability methodologies are reasonable in all material respects.
The Board also reviewed Fidelity's non-fund businesses and potential indirect benefits such businesses may have received as a result of their association with Fidelity's fund business (i.e., fall-out benefits) as well as cases where Fidelity's affiliates may benefit from the funds' business. The Board considered areas where potential indirect benefits to the Fidelity funds from their relationships with Fidelity may exist. The Board's consideration of these matters was informed by the findings of a joint ad hoc committee created by it and the boards of other Fidelity funds to evaluate potential fall-out benefits.
The Board concluded that the costs of the services provided by and the profits realized by Fidelity in connection with the operation of each fund were not relevant to the renewal of the Advisory Contracts because each fund pays no advisory fees and FMR bears all expenses of each fund with certain exceptions.
Economies of Scale. The Board concluded that because each fund pays no advisory fees and FMR bears all expenses of each fund with certain exceptions, the realization of economies of scale was not a material factor in the Board's decision to renew each fund's Advisory Contract.
Additional Information Requested by the Board. In order to develop fully the factual basis for consideration of the Fidelity funds' advisory contracts, the Board requested and received additional information on certain topics, including but not limited to: (i) fund flow and performance trends, in particular the underperformance of certain funds and strategies, and Fidelity's long-term strategies for certain funds; (ii) the operation of performance fees and the rationale for implementing performance fees on certain categories of funds but not others; (iii) Fidelity's pricing philosophy compared to competitors; (iv) fund profitability methodology and data; (v) evaluation of competitive fund data and peer group classifications and fee and expense comparisons; (vi) the management fee and expense structures for different funds and classes and information about the differences between various fee and expense structures; (vii) the variable management fee implemented for certain funds effective March 1, 2024; and (viii) information regarding other accounts managed by Fidelity and the funds' sub-advisory arrangements.
Conclusion. Based on its evaluation of all of the conclusions noted above, and after considering all factors it believed relevant, the Board, including the Independent Trustees, concluded that the advisory and sub-advisory fee arrangements are fair and reasonable in light of all of the surrounding circumstances and that the fund's Advisory Contracts should be renewed through May 31, 2025.
1.926208.113
EMC-SANN-0824
Item 8.
Changes in and Disagreements with Accountants for Open-End Management Investment Companies
See Item 7.
Item 9.
Proxy Disclosures for Open-End Management Investment Companies
See Item 7.
Item 10.
Remuneration Paid to Directors, Officers, and Others of Open-End Management Investment Companies
See Item 7.
Item 11.
Statement Regarding Basis for Approval of Investment Advisory Contract
See Item 7.
Item 12.
Disclosure of Proxy Voting Policies and Procedures for Closed-End Management Investment Companies
Not applicable.
Item 13.
Portfolio Managers of Closed-End Management Investment Companies
Not applicable.
Item 14.
Purchases of Equity Securities by Closed-End Management Investment Company and Affiliated Purchasers
Not applicable.
Item 15.
Submission of Matters to a Vote of Security Holders
There were no material changes to the procedures by which shareholders may recommend nominees to the Fidelity Hanover Street Trust’s Board of Trustees.
Item 16.
Controls and Procedures
(a)(i) The President and Treasurer and the Chief Financial Officer have concluded that the Fidelity Hanover Street Trust’s (the “Trust”) disclosure controls and procedures (as defined in Rule 30a-3(c) under the Investment Company Act) provide reasonable assurances that material information relating to the Trust is made known to them by the appropriate persons, based on their evaluation of these controls and procedures as of a date within 90 days of the filing date of this report.
(a)(ii) There was no change in the Trust’s internal control over financial reporting (as defined in Rule 30a-3(d) under the Investment Company Act) that occurred during the period covered by this report that has materially affected, or is reasonably likely to materially affect, the Trust’s internal control over financial reporting.
Item 17.
Disclosure of Securities Lending Activities for Closed-End Management Investment Companies
Not applicable.
Item 18.
Recovery of Erroneously Awarded Compensation
(a)
Not applicable.
(b)
Not applicable.
Item 19.
Exhibits
SIGNATURES
Pursuant to the requirements of the Securities Exchange Act of 1934 and the Investment Company Act of 1940, the registrant has duly caused this report to be signed on its behalf by the undersigned, thereunto duly authorized.
Fidelity Hanover Street Trust
|
By: | /s/Stacie M. Smith |
| Stacie M. Smith |
| President and Treasurer (Principal Executive Officer) |
|
|
Date: | August 22, 2024 |
Pursuant to the requirements of the Securities Exchange Act of 1934 and the Investment Company Act of 1940, this report has been signed below by the following persons on behalf of the registrant and in the capacities and on the dates indicated.
|
By: | /s/Stacie M. Smith |
| Stacie M. Smith |
| President and Treasurer (Principal Executive Officer) |
|
|
Date: | August 22, 2024 |
|
By: | /s/John J. Burke III |
| John J. Burke III |
| Chief Financial Officer (Principal Financial Officer) |
|
|
Date: | August 22, 2024 |