UNITED STATES
SECURITIES AND EXCHANGE COMMISSION
Washington, D.C. 20549
FORM N-CSR
CERTIFIED SHAREHOLDER REPORT OF REGISTERED
MANAGEMENT INVESTMENT COMPANIES
Investment Company Act file number 811-03466
Fidelity Hanover Street Trust
(Exact name of registrant as specified in charter)
245 Summer St., Boston, Massachusetts 02210
(Address of principal executive offices) (Zip code)
Nicole Macarchuk, Secretary
245 Summer St.
Boston, Massachusetts 02210
(Name and address of agent for service)
Registrant's telephone number, including area code:
617-563-7000
| |
Date of fiscal year end: | December 31 |
|
|
Date of reporting period: | December 31, 2024 |
Item 1.
Reports to Stockholders
| |
| | ANNUAL SHAREHOLDER REPORT | AS OF DECEMBER 31, 2024 | This report describes changes to the Fund that occurred during the reporting period. |
| | Fidelity® Emerging Markets Debt Local Currency Central Fund Fidelity® Emerging Markets Debt Local Currency Central Fund true |
| | | |
This annual shareholder report contains information about Fidelity® Emerging Markets Debt Local Currency Central Fund for the period January 1, 2024 to December 31, 2024. You can find additional information about the Fund at fundresearch.fidelity.com/prospectus/sec. You can also request this information by contacting us at 1-800-544-8544.
What were your Fund costs for the last year?(based on hypothetical $10,000 investment)
FUND COST (PREVIOUS YEAR)
| | Costs of a $10,000 investment | Costs paid as a percentage of a $10,000 investment | |
| Fidelity® Emerging Markets Debt Local Currency Central Fund | $ 2 | 0.02% | |
What affected the Fund's performance this period?
•Emerging-markets local-currency debt modestly declined in 2024, significantly hampered by a broadly stronger U.S. dollar and differences in the interest-rates policies between the U.S. and some emerging markets.
•Against this backdrop, country selection notably detracted from the fund's performance versus the J.P. Morgan GBI-EM Global Diversified Index for the year, with an underweight in the currency of Thailand hurting most, given the strong performance of this market.
•An overweight in Brazil and an underweight in China also heavily weighed on relative performance, although security selection in these markets somewhat offset this negative.
•Conversely, security selection overall meaningfully contributed to the fund's relative result, especially our choices in Egypt.
•Also helping versus the benchmark was security selection and an overweight in Turkey, which outperformed, and positioning in Mexico, which underperformed the benchmark for the year.
•Lastly, the fund's cash position was a notable relative detractor in 2024 against a rising market backdrop.
How did the Fund perform over the life of Fund?
CUMULATIVE PERFORMANCE
September 23, 2020 through December 31, 2024.
Initial investment of $10,000.
Fidelity® Emerging Markets Debt Local Currency Central Fund | $10,000 | $10,974 | $10,035 | $9,250 | $10,474 |
J.P. Morgan GBI-EM Global Diversified Index | $10,000 | $10,959 | $10,000 | $8,832 | $9,953 |
| | 2020 | 2021 | 2022 | 2023 | 2024 |
AVERAGE ANNUAL TOTAL RETURNS:| | 1 Year | Life of Fund A |
| Fidelity® Emerging Markets Debt Local Currency Central Fund | -2.42% | 0.51% |
| J.P. Morgan GBI-EM Global Diversified Index | -2.38% | -0.67% |
A From September 23, 2020
Visit www.fidelity.com for more recent performance information. |
The Fund's past performance is not a good predictor of the Fund's future performance. The graph and table do not reflect the deduction of taxes that a shareholder would pay on fund distributions or redemption of fund shares. |
Key Fund Statistics(as of December 31, 2024)
KEY FACTS | | |
| Fund Size | $262,623,981 | |
| Number of Holdings | 238 | |
| Total Advisory Fee | $0 | |
| Portfolio Turnover | 55% | |
What did the Fund invest in?
(as of December 31, 2024)
| U.S. Government and U.S. Government Agency Obligations | 0.5 |
| AAA | 2.9 |
| AA | 4.3 |
| A | 4.5 |
| BBB | 16.7 |
| BB | 11.7 |
| Not Rated | 43.6 |
| Short-Term Investments and Net Other Assets (Liabilities) | 15.8 |
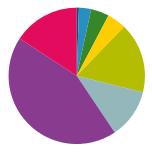
QUALITY DIVERSIFICATION (% of Fund's net assets) |
| |
| | U.S. Government and U.S. Government Agency Obligations - 0.5 |
| | AAA - 2.9 |
| | AA - 4.3 |
| | A - 4.5 |
| | BBB - 16.7 |
| | BB - 11.7 |
| | Not Rated - 43.6 |
| | Short-Term Investments and Net Other Assets (Liabilities) - 15.8 |
| |
| We have used ratings from Moody's Investors Service, Inc. Where Moody's® ratings are not available, we have used S&P® ratings. All ratings are as of the date indicated and do not reflect subsequent changes. |
| Foreign Government and Government Agency Obligations | 80.4 |
| Corporate Bonds | 3.3 |
| U.S. Treasury Obligations | 0.5 |
| Short-Term Investments and Net Other Assets (Liabilities) | 15.8 |
ASSET ALLOCATION (% of Fund's net assets) |
|
| | Foreign Government and Government Agency Obligations - 80.4 |
| | Corporate Bonds - 3.3 |
| | U.S. Treasury Obligations - 0.5 |
| | Short-Term Investments and Net Other Assets (Liabilities) - 15.8 |
| |
| United States | 16.3 |
| Malaysia | 9.6 |
| Mexico | 9.4 |
| South Africa | 8.1 |
| Indonesia | 8.0 |
| Brazil | 7.4 |
| China | 4.7 |
| Poland | 4.6 |
| Thailand | 4.2 |
| Others | 27.7 |
GEOGRAPHIC DIVERSIFICATION (% of Fund's net assets) |
|
| | United States - 16.3 |
| | Malaysia - 9.6 |
| | Mexico - 9.4 |
| | South Africa - 8.1 |
| | Indonesia - 8.0 |
| | Brazil - 7.4 |
| | China - 4.7 |
| | Poland - 4.6 |
| | Thailand - 4.2 |
| | Others - 27.7 |
| |
TOP HOLDINGS(% of Fund's net assets) | | |
| Malaysia Government | 9.6 | |
| United Mexican States | 9.4 | |
| South African Republic | 8.1 | |
| Indonesia Government | 8.0 | |
| Peoples Republic of China | 4.7 | |
| Republic of Poland | 4.6 | |
| Kingdom of Thailand | 4.2 | |
| Romanian Republic | 4.2 | |
| Brazilian Federative Republic | 4.1 | |
| Czech Republic | 3.9 | |
| | 60.8 | |
How has the Fund changed?
This is a summary of certain changes to the Fund since January 1, 2024. For more complete information, you may review the Fund's next prospectus, which we expect to be available by February 28, 2025 at fundresearch.fidelity.com/prospectus/sec or upon request at 1-800-544-8544 .
Effective March 1, 2024, the fund's management contract was amended to remove the fee the investment adviser received from investing funds. | The fund modified its principal investment strategies during the reporting period.
|
| Fidelity, the Fidelity Investments Logo and all other Fidelity trademarks or service marks used herein are trademarks or service marks of FMR LLC. Any third-party marks that are used herein are trademarks or service marks of their respective owners. © 2025 FMR LLC. All rights reserved. |
| | For additional information about the Fund; including its prospectus, financial information, holdings and proxy information, scan the QR code or visit fundresearch.fidelity.com/prospectus/sec 1.9914394.100 6286-TSRA-0225 |
| |
| | ANNUAL SHAREHOLDER REPORT | AS OF DECEMBER 31, 2024 | This report describes changes to the Fund that occurred during the reporting period. |
| | Fidelity® Emerging Markets Debt Central Fund Fidelity® Emerging Markets Debt Central Fund true |
| | | |
This annual shareholder report contains information about Fidelity® Emerging Markets Debt Central Fund for the period January 1, 2024 to December 31, 2024. You can find additional information about the Fund at fundresearch.fidelity.com/prospectus/sec. You can also request this information by contacting us at 1-800-544-8544.
What were your Fund costs for the last year?(based on hypothetical $10,000 investment)
FUND COST (PREVIOUS YEAR)
| | Costs of a $10,000 investment | Costs paid as a percentage of a $10,000 investment | |
| Fidelity® Emerging Markets Debt Central Fund | $ 2 | 0.01% | |
What affected the Fund's performance this period?
•Emerging-markets debt achieved a strong gain in 2024, significantly influenced by economic conditions in the U.S., investors' outlook for the magnitude and timing of U.S. Federal Reserve interest-rate cuts, and geopolitical uncertainty. Notably, market returns were hampered by a broadly stronger U.S. dollar.
•Against this backdrop, security selection modestly contributed to the fund's performance versus the Bloomberg Emerging Markets Aggregate USD Bond Index for the year, with choices in Chile and Mexico helping most, driven by the fund's holdings in corporate bonds.
•Security selection and an underweight in Peru, South Africa and Indonesia also helped.
•Country positioning significantly contributed, especially underweights in Saudi Arabia and South Korea, two markets that underperformed the benchmark in 2024. A slight overweight in Argentina, the strongest-performing country component for the year, also was beneficial.
•Conversely, a non-benchmark stake in U.S. Treasurys was the largest detractor versus the benchmark. We use Treasurys from time to time as a risk-management tool and a means to increase the fund's duration, a measure of sensitivity to interest rates. However, the fund's position returned about -5% in 2024.
•Security selection in Venezuela and Russia, both of which were not part of the benchmark, also weighed on relative performance, given the underperformance of these bond markets.
How did the Fund perform over the past 10 years?
CUMULATIVE PERFORMANCE
December 31, 2014 through December 31, 2024.
Initial investment of $10,000.
Fidelity® Emerging Markets Debt Central Fund | $10,000 | $10,226 | $11,913 | $13,223 | $12,625 | $13,948 | $14,564 | $14,580 | $12,908 | $14,316 | $15,471 |
Bloomberg Emerging Markets Aggregate USD Bond Linked 04/15/2019 Index | $10,000 | $10,123 | $11,155 | $12,194 | $11,632 | $13,280 | $14,146 | $13,912 | $11,791 | $12,891 | $13,740 |
Bloomberg Emerging Markets Aggregate USD Bond 10% Country Capped Index | $10,000 | $10,127 | $11,157 | $12,095 | $11,768 | $13,350 | $14,223 | $14,039 | $11,848 | $12,953 | $13,806 |
J.P. Morgan Emerging Markets Bond Index Global Diversified | $10,000 | $10,118 | $11,146 | $12,289 | $11,765 | $13,534 | $14,246 | $13,990 | $11,502 | $12,778 | $13,613 |
| | 2014 | 2015 | 2016 | 2017 | 2018 | 2019 | 2020 | 2021 | 2022 | 2023 | 2024 |
AVERAGE ANNUAL TOTAL RETURNS:| | 1 Year | 5 Year | 10 Year |
| Fidelity® Emerging Markets Debt Central Fund | 8.07% | 2.09% | 4.46% |
| Bloomberg Emerging Markets Aggregate USD Bond Linked 04/15/2019 Index | 6.59% | 0.68% | 3.23% |
| Bloomberg Emerging Markets Aggregate USD Bond 10% Country Capped Index | 6.59% | 0.67% | 3.28% |
| J.P. Morgan Emerging Markets Bond Index Global Diversified | 6.54% | 0.12% | 3.13% |
Visit www.fidelity.com for more recent performance information. |
The Fund's past performance is not a good predictor of the Fund's future performance. The graph and table do not reflect the deduction of taxes that a shareholder would pay on fund distributions or redemption of fund shares. |
Key Fund Statistics(as of December 31, 2024)
KEY FACTS | | |
| Fund Size | $2,228,303,439 | |
| Number of Holdings | 517 | |
| Total Advisory Fee | $0 | |
| Portfolio Turnover | 18% | |
What did the Fund invest in?
(as of December 31, 2024)
| U.S. Government and U.S. Government Agency Obligations | 3.2 |
| AA | 12.0 |
| A | 4.1 |
| BBB | 20.0 |
| BB | 23.1 |
| B | 15.9 |
| CCC,CC,C | 11.6 |
| D | 0.1 |
| Not Rated | 2.4 |
| Short-Term Investments and Net Other Assets (Liabilities) | 7.6 |
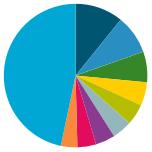
QUALITY DIVERSIFICATION (% of Fund's net assets) |
| |
| | U.S. Government and U.S. Government Agency Obligations - 3.2 |
| | AA - 12.0 |
| | A - 4.1 |
| | BBB - 20.0 |
| | BB - 23.1 |
| | B - 15.9 |
| | CCC,CC,C - 11.6 |
| | D - 0.1 |
| | Not Rated - 2.4 |
| | Short-Term Investments and Net Other Assets (Liabilities) - 7.6 |
| |
| We have used ratings from Moody's Investors Service, Inc. Where Moody's® ratings are not available, we have used S&P® ratings. All ratings are as of the date indicated and do not reflect subsequent changes. |
| Foreign Government and Government Agency Obligations | 43.6 |
| Corporate Bonds | 42.3 |
| Preferred Securities | 3.3 |
| U.S. Treasury Obligations | 3.2 |
| Short-Term Investments and Net Other Assets (Liabilities) | 7.6 |
ASSET ALLOCATION (% of Fund's net assets) |
|
| | Foreign Government and Government Agency Obligations - 43.6 |
| | Corporate Bonds - 42.3 |
| | Preferred Securities - 3.3 |
| | U.S. Treasury Obligations - 3.2 |
| | Short-Term Investments and Net Other Assets (Liabilities) - 7.6 |
| |
| United States | 10.8 |
| Mexico | 8.8 |
| Brazil | 6.9 |
| Saudi Arabia | 5.3 |
| United Arab Emirates | 4.7 |
| Turkey | 4.5 |
| Argentina | 4.4 |
| Colombia | 4.2 |
| Chile | 3.7 |
| Others | 46.7 |
GEOGRAPHIC DIVERSIFICATION (% of Fund's net assets) |
|
| | United States - 10.8 |
| | Mexico - 8.8 |
| | Brazil - 6.9 |
| | Saudi Arabia - 5.3 |
| | United Arab Emirates - 4.7 |
| | Turkey - 4.5 |
| | Argentina - 4.4 |
| | Colombia - 4.2 |
| | Chile - 3.7 |
| | Others - 46.7 |
| |
TOP HOLDINGS(% of Fund's net assets) | | |
| Argentine Republic | 4.0 | |
| Turkish Republic | 3.9 | |
| Petroleos Mexicanos | 3.3 | |
| Indonesia Government | 2.3 | |
| Saudi Arabian Oil Co | 2.1 | |
| Dominican Republic International Bond | 2.0 | |
| United Mexican States | 1.8 | |
| Colombian Republic | 1.7 | |
| US Treasury Notes | 1.7 | |
| QatarEnergy | 1.6 | |
| | 24.4 | |
How has the Fund changed?
This is a summary of certain changes to the Fund since January 1, 2024. For more complete information, you may review the Fund's next prospectus, which we expect to be available by February 28, 2025 at fundresearch.fidelity.com/prospectus/sec or upon request at 1-800-544-8544 .
The fees associated with this class changed during the reporting year. The variations in class fees are primarily the result of the following changes: Effective March 1, 2024, the fund's management contract was amended to remove the fee the investment adviser received from investing funds. | The fund modified its principal investment strategies during the reporting period.
|
The fund's sub-advisory agreement with FIL Investments (Japan) Limited was not renewed. | |
| Fidelity, the Fidelity Investments Logo and all other Fidelity trademarks or service marks used herein are trademarks or service marks of FMR LLC. Any third-party marks that are used herein are trademarks or service marks of their respective owners. © 2025 FMR LLC. All rights reserved. |
| | For additional information about the Fund; including its prospectus, financial information, holdings and proxy information, scan the QR code or visit fundresearch.fidelity.com/prospectus/sec 1.9914342.100 2276-TSRA-0225 |
Item 2.
Code of Ethics
As of the end of the period, December 31, 2024, Fidelity Hanover Street Trust (the trust) has adopted a code of ethics, as defined in Item 2 of Form N-CSR, that applies to its President and Treasurer and its Chief Financial Officer. A copy of the code of ethics is filed as an exhibit to this Form N-CSR.
Item 3.
Audit Committee Financial Expert
The Board of Trustees of the trust has determined that Donald F. Donahue is an audit committee financial expert, as defined in Item 3 of Form N-CSR. Mr. Donahue is independent for purposes of Item 3 of Form N-CSR.
Item 4.
Principal Accountant Fees and Services
Fees and Services
The following table presents fees billed by PricewaterhouseCoopers LLP (“PwC”) in each of the last two fiscal years for services rendered to Fidelity Emerging Markets Debt Central Fund and Fidelity Emerging Markets Debt Local Currency Central Fund (the “Funds”):
Services Billed by PwC
December 31, 2024 FeesA
| | | | |
| Audit Fees | Audit-Related Fees | Tax Fees | All Other Fees |
Fidelity Emerging Markets Debt Central Fund | $51,000 | $4,800 | $9,800 | $1,700 |
Fidelity Emerging Markets Debt Local Currency Central Fund | $53,000 | $5,000 | $11,000 | $1,700 |
| | | | |
| Audit Fees | Audit-Related Fees | Tax Fees | All Other Fees |
Fidelity Emerging Markets Debt Central Fund | $51,200 | $4,700 | $9,800 | $1,500 |
Fidelity Emerging Markets Debt Local Currency Central Fund | $53,100 | $4,800 | $10,300 | $1,600 |
A Amounts may reflect rounding.
The following table(s) present(s) fees billed by PwC that were required to be approved by the Audit Committee for services that relate directly to the operations and financial reporting of the Fund(s) and that are rendered on behalf of Fidelity Management & Research Company LLC ("FMR") and entities controlling, controlled by, or under common control with FMR (not including any sub-adviser whose role is primarily portfolio management and is subcontracted with or overseen by another investment adviser) that provide ongoing services to the Fund(s) (“Fund Service Providers”):
Services Billed by PwC
| | |
| December 31, 2024A | December 31, 2023A |
Audit-Related Fees | $9,701,800 | $8,881,200 |
Tax Fees | $61,000 | $1,000 |
All Other Fees | $35,000 | $- |
A Amounts may reflect rounding.
“Audit-Related Fees” represent fees billed for assurance and related services that are reasonably related to the performance of the fund audit or the review of the fund's financial statements and that are not reported under Audit Fees.
“Tax Fees” represent fees billed for tax compliance, tax advice or tax planning that relate directly to the operations and financial reporting of the fund.
“All Other Fees” represent fees billed for services provided to the fund or Fund Service Provider, a significant portion of which are assurance related, that relate directly to the operations and financial reporting of the fund, excluding those services that are reported under Audit Fees, Audit-Related Fees or Tax Fees.
Assurance services must be performed by an independent public accountant.
* * *
The aggregate non-audit fees billed by PwC for services rendered to the Fund(s), FMR (not including any sub-adviser whose role is primarily portfolio management and is subcontracted with or overseen by another investment adviser), and any Fund Service Provider for each of the last two fiscal years of the Fund(s) are as follows:
| | |
Billed By | December 31, 2024A | December 31, 2023A |
PwC | $15,325,100 | $14,369,000 |
A Amounts may reflect rounding
The trust's Audit Committee has considered non-audit services that were not pre-approved that were provided by PwC to Fund Service Providers to be compatible with maintaining the independence of PwC in its(their) audit of the Fund(s), taking into account representations from PwC, in accordance with Public Company Accounting Oversight Board rules, regarding its independence from the Fund(s) and its(their) related entities and FMR’s review of the appropriateness and permissibility under applicable law of such non-audit services prior to their provision to the Fund(s) Service Providers.
Audit Committee Pre-Approval Policies and Procedures
The trust’s Audit Committee must pre-approve all audit and non-audit services provided by a fund’s independent registered public accounting firm relating to the operations or financial reporting of the fund. Prior to the commencement of any audit or non-audit services to a fund, the Audit Committee reviews the services to determine whether they are appropriate and permissible under applicable law.
The Audit Committee has adopted policies and procedures to, among other purposes, provide a framework for the Committee’s consideration of non-audit services by the audit firms that audit the Fidelity funds. The policies and procedures require that any non-audit service provided by a fund audit firm to a Fidelity fund and any non-audit service provided by a fund auditor to a Fund Service Provider that relates directly to the operations and financial reporting of a Fidelity fund (“Covered Service”) are subject to approval by the Audit Committee before such service is provided.
All Covered Services must be approved in advance of provision of the service either: (i) by formal resolution of the Audit Committee, or (ii) by oral or written approval of the service by the Chair of the Audit Committee (or if the Chair is unavailable, such other member of the Audit Committee as may be designated by the Chair to act in the Chair’s absence). The approval contemplated by (ii) above is permitted where the Treasurer determines that action on such an engagement is necessary before the next meeting of the Audit Committee.
Non-audit services provided by a fund audit firm to a Fund Service Provider that do not relate directly to the operations and financial reporting of a Fidelity fund are reported to the Audit Committee periodically.
Non-Audit Services Approved Pursuant to Rule 2-01(c)(7)(i)(C) and (ii) of Regulation S-X (“De Minimis Exception”)
There were no non-audit services approved or required to be approved by the Audit Committee pursuant to the De Minimis Exception during the Fund’s(s’) last two fiscal years relating to services provided to (i) the Fund(s) or (ii) any Fund Service Provider that relate directly to the operations and financial reporting of the Fund(s).
The Registrant has not retained, for the preparation of the audit report on the financial statements included in the Form N-CSR, a registered public accounting firm that has a branch or office that is located in a foreign jurisdiction and that the Public Company Accounting Oversight Board (the “PCAOB”) has determined that the PCAOB is unable to inspect or investigate completely because of a position taken by an authority in the foreign jurisdiction.
The Registrant is not a “foreign issuer,” as defined in 17 CFR 240.3b-4.
Item 5.
Audit Committee of Listed Registrants
Not applicable.
Item 6.
Investments
(a)
Not applicable.
(b)
Not applicable.
Item 7.
Financial Statements and Financial Highlights for Open-End Management Investment Companies
Fidelity® Emerging Markets Debt Central Fund
Fidelity® Emerging Markets Debt Local Currency Central Fund
Annual Report
December 31, 2024
Contents
To view a fund's proxy voting guidelines and proxy voting record for the 12-month period ended June 30, visit http://www.fidelity.com/proxyvotingresults or visit the Securities and Exchange Commission's (SEC) web site at http://www.sec.gov.
You may also call 1-800-544-8544 to request a free copy of the proxy voting guidelines.
Standard & Poor's, S&P and S&P 500 are registered service marks of The McGraw-Hill Companies, Inc. and have been licensed for use by Fidelity Distributors Corporation.
Other third-party marks appearing herein are the property of their respective owners.
All other marks appearing herein are registered or unregistered trademarks or service marks of FMR LLC or an affiliated company. © 2025 FMR LLC. All rights reserved.
A fund files its complete schedule of portfolio holdings with the SEC for the first and third quarters of each fiscal year on Form N-PORT. Forms N-PORT are available on the SEC's web site at http://www.sec.gov. A fund's Forms N-PORT may be reviewed and copied at the SEC's Public Reference Room in Washington, DC. Information regarding the operation of the SEC's Public Reference Room may be obtained by calling 1-800-SEC-0330.
Item 7: Financial Statements and Financial Highlights for Open-End Management Investment Companies (Annual Report)
Fidelity® Emerging Markets Debt Central Fund
Schedule of Investments December 31, 2024
Showing Percentage of Net Assets
| Foreign Government and Government Agency Obligations - 43.6% |
| | | Principal Amount (a) | Value ($) |
| ANGOLA - 0.8% | | | |
| Angola Republic 8.25% 5/9/2028 (b) | | 5,980,000 | 5,623,054 |
| Angola Republic 8.75% 4/14/2032 (b) | | 4,065,000 | 3,581,224 |
| Angola Republic 9.375% 5/8/2048 (b) | | 2,395,000 | 1,962,631 |
| Angola Republic 9.5% 11/12/2025 (b) | | 7,565,000 | 7,580,508 |
TOTAL ANGOLA | | | 18,747,417 |
| ARGENTINA - 4.4% | | | |
| Argentine Republic 0.75% 7/9/2030 (c) | | 52,619,815 | 40,543,568 |
| Argentine Republic 1% 7/9/2029 | | 8,025,564 | 6,504,720 |
| Argentine Republic 3.5% 7/9/2041 (c) | | 11,065,000 | 6,910,093 |
| Argentine Republic 4.125% 7/9/2035 (c) | | 34,047,842 | 22,590,743 |
| Argentine Republic 5% 1/9/2038 (c) | | 16,906,530 | 11,809,211 |
| Bonos Para La Reconstruccion De Una Argentina Libre 0% 6/30/2025 (d) | | 2,987,520 | 1,492,834 |
| Provincia de Cordoba 6.875% 12/10/2025 (b)(c) | | 824,921 | 811,054 |
| Provincia de Cordoba 6.99% 6/1/2027 (b)(c) | | 5,456,546 | 5,097,178 |
TOTAL ARGENTINA | | | 95,759,401 |
| ARMENIA - 0.1% | | | |
| Republic of Armenia 3.6% 2/2/2031 (b) | | 2,505,000 | 2,060,638 |
| BAHAMAS (NASSAU) - 0.1% | | | |
| Bahamas Government International Bond 6% 11/21/2028 (b) | | 2,980,000 | 2,832,281 |
| BAHRAIN - 0.1% | | | |
| Central Bank of Bahrain Ijara Sukuk 5.625% 5/18/2034 (b) | | 1,330,000 | 1,203,530 |
| Central Bank of Bahrain Ijara Sukuk 7.5% 2/12/2036 (b) | | 1,925,000 | 1,971,412 |
TOTAL BAHRAIN | | | 3,174,942 |
| BARBADOS - 0.2% | | | |
| Barbados Government 6.5% 10/1/2029 (b) | | 3,535,000 | 3,449,382 |
| BENIN - 0.3% | | | |
| Republic of Benin 4.875% 1/19/2032 (b) | EUR | 3,510,000 | 3,283,630 |
| Republic of Benin 7.96% 2/13/2038 (b) | | 2,710,000 | 2,553,328 |
TOTAL BENIN | | | 5,836,958 |
| BERMUDA - 0.6% | | | |
| Bermuda 2.375% 8/20/2030 (b) | | 520,000 | 441,163 |
| Bermuda 3.375% 8/20/2050 (b) | | 1,825,000 | 1,207,931 |
| Bermuda 3.717% 1/25/2027 (b) | | 7,240,000 | 7,020,538 |
| Bermuda 4.75% 2/15/2029 (b) | | 3,960,000 | 3,859,297 |
| Bermuda 5% 7/15/2032 (b) | | 1,590,000 | 1,534,350 |
TOTAL BERMUDA | | | 14,063,279 |
| BRAZIL - 1.3% | | | |
| Federative Republic of Brazil 3.875% 6/12/2030 | | 6,525,000 | 5,742,000 |
| Federative Republic of Brazil 6% 10/20/2033 | | 3,180,000 | 2,966,940 |
| Federative Republic of Brazil 7.125% 1/20/2037 | | 6,165,000 | 6,195,825 |
| Federative Republic of Brazil 7.125% 5/13/2054 | | 835,000 | 776,133 |
| Federative Republic of Brazil 8.25% 1/20/2034 | | 11,540,000 | 12,590,140 |
TOTAL BRAZIL | | | 28,271,038 |
| CHILE - 1.2% | | | |
| Chilean Republic 2.45% 1/31/2031 | | 12,490,000 | 10,714,078 |
| Chilean Republic 2.75% 1/31/2027 | | 2,635,000 | 2,508,520 |
| Chilean Republic 3.1% 1/22/2061 | | 6,730,000 | 3,981,199 |
| Chilean Republic 3.5% 1/31/2034 | | 2,180,000 | 1,882,294 |
| Chilean Republic 4% 1/31/2052 | | 1,910,000 | 1,431,306 |
| Chilean Republic 4.34% 3/7/2042 | | 2,615,000 | 2,200,686 |
| Chilean Republic 5.33% 1/5/2054 | | 4,770,000 | 4,416,734 |
TOTAL CHILE | | | 27,134,817 |
| COLOMBIA - 1.7% | | | |
| Colombian Republic 3% 1/30/2030 | | 8,400,000 | 6,993,000 |
| Colombian Republic 3.125% 4/15/2031 | | 5,855,000 | 4,643,132 |
| Colombian Republic 3.25% 4/22/2032 | | 2,805,000 | 2,147,284 |
| Colombian Republic 4.125% 5/15/2051 | | 2,355,000 | 1,350,592 |
| Colombian Republic 5% 6/15/2045 | | 9,490,000 | 6,360,293 |
| Colombian Republic 5.2% 5/15/2049 | | 6,915,000 | 4,657,253 |
| Colombian Republic 6.125% 1/18/2041 | | 440,000 | 358,819 |
| Colombian Republic 7.375% 9/18/2037 | | 1,475,000 | 1,406,413 |
| Colombian Republic 7.5% 2/2/2034 | | 2,055,000 | 2,026,230 |
| Colombian Republic 8% 11/14/2035 | | 2,860,000 | 2,877,160 |
| Colombian Republic 8% 4/20/2033 | | 1,530,000 | 1,560,631 |
| Colombian Republic 8.75% 11/14/2053 | | 2,695,000 | 2,721,950 |
TOTAL COLOMBIA | | | 37,102,757 |
| COSTA RICA - 0.3% | | | |
| Costa Rica Government International Bond 5.625% 4/30/2043 (b) | | 2,610,000 | 2,335,950 |
| Costa Rica Government International Bond 6.125% 2/19/2031 (b) | | 1,370,000 | 1,373,425 |
| Costa Rica Government International Bond 7.3% 11/13/2054 (b) | | 3,030,000 | 3,133,020 |
TOTAL COSTA RICA | | | 6,842,395 |
| COTE D'IVOIRE - 0.8% | | | |
| Cote d'Ivoire Treasury Bill 5.875% 10/17/2031 (b) | EUR | 4,385,000 | 4,252,637 |
| Cote d'Ivoire Treasury Bill 6.125% 6/15/2033 (b) | | 5,840,000 | 5,206,725 |
| Cote d'Ivoire Treasury Bill 6.375% 3/3/2028 (b) | | 5,285,000 | 5,237,276 |
| Cote d'Ivoire Treasury Bill 8.25% 1/30/2037 (b) | | 2,790,000 | 2,709,788 |
TOTAL COTE D'IVOIRE | | | 17,406,426 |
| DOMINICAN REPUBLIC - 2.0% | | | |
| Dominican Republic International Bond 4.5% 1/30/2030 (b) | | 2,550,000 | 2,334,525 |
| Dominican Republic International Bond 4.875% 9/23/2032 (b) | | 12,965,000 | 11,551,815 |
| Dominican Republic International Bond 5.95% 1/25/2027 (b) | | 6,155,000 | 6,114,993 |
| Dominican Republic International Bond 6% 7/19/2028 (b) | | 3,955,000 | 3,913,473 |
| Dominican Republic International Bond 6.5% 2/15/2048 (b) | | 2,135,000 | 2,031,580 |
| Dominican Republic International Bond 6.6% 6/1/2036 (b) | | 2,112,000 | 2,097,216 |
| Dominican Republic International Bond 6.85% 1/27/2045 (b) | | 3,300,000 | 3,242,151 |
| Dominican Republic International Bond 6.875% 1/29/2026 (b) | | 7,160,000 | 7,213,700 |
| Dominican Republic International Bond 7.05% 2/3/2031 (b) | | 2,795,000 | 2,860,179 |
| Dominican Republic International Bond 7.45% 4/30/2044 (b) | | 3,510,000 | 3,676,725 |
TOTAL DOMINICAN REPUBLIC | | | 45,036,357 |
| ECUADOR - 0.5% | | | |
| Ecuador Government International Bond 5.5% 7/31/2035 (b)(c) | | 7,555,000 | 4,272,352 |
| Ecuador Government International Bond 6.9% 7/31/2030 (b)(c) | | 8,958,515 | 6,226,168 |
TOTAL ECUADOR | | | 10,498,520 |
| EGYPT - 1.4% | | | |
| Arab Republic of Egypt 7.5% 1/31/2027 (b) | | 7,330,000 | 7,231,045 |
| Arab Republic of Egypt 7.5% 2/16/2061 (b) | | 5,040,000 | 3,442,370 |
| Arab Republic of Egypt 7.6003% 3/1/2029 (b) | | 2,520,000 | 2,435,202 |
| Arab Republic of Egypt 7.903% 2/21/2048 (b) | | 4,675,000 | 3,441,735 |
| Arab Republic of Egypt 8.5% 1/31/2047 (b) | | 7,100,000 | 5,504,701 |
| Arab Republic of Egypt 8.7002% 3/1/2049 (b) | | 4,745,000 | 3,723,544 |
| Arab Republic of Egypt Treasury Bills 0% 1/14/2025 (d) | EGP | 89,350,000 | 1,733,573 |
| Arab Republic of Egypt Treasury Bills 0% 3/18/2025 (d) | EGP | 182,650,000 | 3,402,162 |
TOTAL EGYPT | | | 30,914,332 |
| EL SALVADOR - 0.4% | | | |
| El Salvador Republic 0.25% 4/17/2030 (b) | | 2,770,000 | 48,197 |
| El Salvador Republic 7.1246% 1/20/2050 (b) | | 3,170,000 | 2,662,800 |
| El Salvador Republic 7.625% 2/1/2041 (b) | | 935,000 | 867,213 |
| El Salvador Republic 7.65% 6/15/2035 (b) | | 1,490,000 | 1,441,575 |
| El Salvador Republic 9.25% 4/17/2030 (b) | | 2,770,000 | 2,925,813 |
| El Salvador Republic 9.65% 11/21/2054 (b) | | 1,645,000 | 1,721,591 |
TOTAL EL SALVADOR | | | 9,667,189 |
| GABON - 0.3% | | | |
| Gabonese Republic 6.625% 2/6/2031 (b) | | 4,070,000 | 3,011,800 |
| Gabonese Republic 7% 11/24/2031 (b) | | 3,880,000 | 2,883,325 |
TOTAL GABON | | | 5,895,125 |
| GEORGIA - 0.2% | | | |
| Georgia Republic 2.75% 4/22/2026 (b) | | 3,890,000 | 3,659,031 |
| GHANA - 0.2% | | | |
| Ghana Republic 0% 1/3/2030 (b)(d) | | 293,194 | 225,026 |
| Ghana Republic 0% 7/3/2026 (b)(d) | | 319,520 | 296,594 |
| Ghana Republic 5% 7/3/2029 (b)(c) | | 2,671,370 | 2,297,378 |
| Ghana Republic 5% 7/3/2035 (b)(c) | | 3,154,780 | 2,207,400 |
TOTAL GHANA | | | 5,026,398 |
| GUATEMALA - 0.3% | | | |
| Guatemala Government Bond 4.9% 6/1/2030 (b) | | 2,510,000 | 2,364,107 |
| Guatemala Government Bond 5.375% 4/24/2032 (b) | | 1,340,000 | 1,262,950 |
| Guatemala Government Bond 6.125% 6/1/2050 (b) | | 2,420,000 | 2,141,022 |
| Guatemala Government Bond 6.6% 6/13/2036 (b) | | 1,465,000 | 1,449,434 |
TOTAL GUATEMALA | | | 7,217,513 |
| HUNGARY - 0.8% | | | |
| Hungary Government 2.125% 9/22/2031 (b) | | 2,190,000 | 1,734,261 |
| Hungary Government 3.125% 9/21/2051 (b) | | 3,170,000 | 1,847,856 |
| Hungary Government 5.25% 6/16/2029 (b) | | 2,880,000 | 2,833,200 |
| Hungary Government 5.5% 6/16/2034 (b) | | 6,825,000 | 6,507,211 |
| Hungary Government 6.125% 5/22/2028 (b) | | 2,280,000 | 2,320,493 |
| Hungary Government 6.75% 9/25/2052 (b) | | 1,450,000 | 1,472,656 |
TOTAL HUNGARY | | | 16,715,677 |
| INDONESIA - 2.3% | | | |
| Indonesia Government 3.2% 9/23/2061 | | 3,110,000 | 1,913,084 |
| Indonesia Government 4.35% 1/11/2048 | | 3,895,000 | 3,266,931 |
| Indonesia Government 5.125% 1/15/2045 (b) | | 9,205,000 | 8,650,031 |
| Indonesia Government 5.25% 1/17/2042 (b) | | 3,765,000 | 3,623,813 |
| Indonesia Government 5.95% 1/8/2046 (b) | | 4,305,000 | 4,439,531 |
| Indonesia Government 6.625% 2/17/2037 (b) | | 821,000 | 896,942 |
| Indonesia Government 6.75% 1/15/2044 (b) | | 3,510,000 | 3,961,913 |
| Indonesia Government 7.75% 1/17/2038 (b) | | 8,515,000 | 10,228,644 |
| Indonesia Government 8.5% 10/12/2035 (b) | | 8,850,000 | 10,962,938 |
TOTAL INDONESIA | | | 47,943,827 |
| ISRAEL - 0.3% | | | |
| Israel Government 3.375% 1/15/2050 | | 6,505,000 | 4,218,304 |
| Israel Government 5.75% 3/12/2054 | | 2,975,000 | 2,720,456 |
TOTAL ISRAEL | | | 6,938,760 |
| JAMAICA - 0.1% | | | |
| Jamaican Government 7.875% 7/28/2045 | | 1,995,000 | 2,308,095 |
| JORDAN - 0.3% | | | |
| Jordan Government 7.375% 10/10/2047 (b) | | 1,240,000 | 1,097,648 |
| Jordan Government 7.5% 1/13/2029 (b) | | 1,730,000 | 1,717,561 |
| Jordan Government 7.75% 1/15/2028 (b) | | 3,150,000 | 3,157,875 |
TOTAL JORDAN | | | 5,973,084 |
| KENYA - 0.3% | | | |
| Republic of Kenya Government Bond 6.3% 1/23/2034 (b) | | 1,785,000 | 1,405,130 |
| Republic of Kenya Government Bond 7.25% 2/28/2028 (b) | | 1,010,000 | 959,499 |
| Republic of Kenya Government Bond 9.75% 2/16/2031 (b) | | 3,880,000 | 3,832,713 |
TOTAL KENYA | | | 6,197,342 |
| LEBANON - 0.1% | | | |
| Lebanon Republic 5.8% (e)(f) | | 7,047,000 | 909,063 |
| Lebanon Republic 6.375% (e)(f) | | 8,768,000 | 1,131,072 |
TOTAL LEBANON | | | 2,040,135 |
| MEXICO - 1.8% | | | |
| United Mexican States 3.5% 2/12/2034 | | 6,340,000 | 5,046,244 |
| United Mexican States 3.75% 4/19/2071 | | 8,735,000 | 4,825,214 |
| United Mexican States 4.875% 5/19/2033 | | 3,425,000 | 3,069,656 |
| United Mexican States 5.75% 10/12/2110 | | 9,315,000 | 7,157,995 |
| United Mexican States 6% 5/7/2036 | | 5,760,000 | 5,419,800 |
| United Mexican States 6.05% 1/11/2040 | | 7,390,000 | 6,858,844 |
| United Mexican States 6.338% 5/4/2053 | | 2,810,000 | 2,501,778 |
| United Mexican States 6.35% 2/9/2035 | | 4,445,000 | 4,344,988 |
TOTAL MEXICO | | | 39,224,519 |
| MONGOLIA - 0.0% | | | |
| Mongolia Government 7.875% 6/5/2029 (b) | | 840,000 | 871,500 |
| MONTENEGRO - 0.2% | | | |
| Republic of Montenegro 7.25% 3/12/2031 (b) | | 4,915,000 | 5,045,542 |
| MOROCCO - 0.2% | | | |
| Moroccan Kingdom 6.5% 9/8/2033 (b) | | 4,725,000 | 4,874,121 |
| NIGERIA - 1.3% | | | |
| Republic of Nigeria 6.125% 9/28/2028 (b) | | 9,790,000 | 8,869,153 |
| Republic of Nigeria 6.5% 11/28/2027 (b) | | 2,250,000 | 2,132,438 |
| Republic of Nigeria 7.143% 2/23/2030 (b) | | 3,580,000 | 3,229,375 |
| Republic of Nigeria 7.625% 11/21/2025 (b) | | 4,945,000 | 4,913,748 |
| Republic of Nigeria 7.696% 2/23/2038 (b) | | 2,730,000 | 2,219,927 |
| Republic of Nigeria 7.875% 2/16/2032 (b) | | 1,590,000 | 1,429,505 |
| Republic of Nigeria Treasury Bills 0% 3/6/2025 (d) | NGN | 6,029,985,000 | 3,729,452 |
| Republic of Nigeria Treasury Bills 0% 4/10/2025 (d) | NGN | 1,931,500,000 | 1,166,118 |
| Republic of Nigeria Treasury Bills 0% 5/20/2025 (d) | NGN | 1,174,705,000 | 686,501 |
| Republic of Nigeria Treasury Bills 0% 5/27/2025 (d) | NGN | 2,120,655,000 | 1,232,466 |
TOTAL NIGERIA | | | 29,608,683 |
| OMAN - 1.4% | | | |
| Oman Sultanate 5.375% 3/8/2027 (b) | | 1,305,000 | 1,295,173 |
| Oman Sultanate 5.625% 1/17/2028 (b) | | 9,545,000 | 9,518,155 |
| Oman Sultanate 6% 8/1/2029 (b) | | 5,535,000 | 5,602,472 |
| Oman Sultanate 6.25% 1/25/2031 (b) | | 3,525,000 | 3,612,420 |
| Oman Sultanate 6.5% 3/8/2047 (b) | | 1,235,000 | 1,221,539 |
| Oman Sultanate 6.75% 1/17/2048 (b) | | 9,450,000 | 9,585,891 |
| Oman Sultanate 7% 1/25/2051 (b) | | 1,060,000 | 1,110,021 |
TOTAL OMAN | | | 31,945,671 |
| PAKISTAN - 0.6% | | | |
| Islamic Republic of Pakistan 6% 4/8/2026 (b) | | 7,395,000 | 6,950,117 |
| Islamic Republic of Pakistan 6.875% 12/5/2027 (b) | | 3,400,000 | 3,062,141 |
| Islamic Republic of Pakistan 7.375% 4/8/2031 (b) | | 4,895,000 | 4,075,088 |
TOTAL PAKISTAN | | | 14,087,346 |
| PANAMA - 1.0% | | | |
| Panamanian Republic 2.252% 9/29/2032 | | 4,345,000 | 3,040,457 |
| Panamanian Republic 3.298% 1/19/2033 | | 4,585,000 | 3,453,078 |
| Panamanian Republic 3.87% 7/23/2060 | | 6,150,000 | 3,204,581 |
| Panamanian Republic 4.5% 4/16/2050 | | 8,075,000 | 4,976,057 |
| Panamanian Republic 4.5% 5/15/2047 | | 2,510,000 | 1,613,459 |
| Panamanian Republic 6.853% 3/28/2054 | | 1,865,000 | 1,591,078 |
| Panamanian Republic 7.875% 3/1/2057 | | 2,695,000 | 2,599,840 |
| Panamanian Republic 8% 3/1/2038 | | 2,860,000 | 2,868,037 |
TOTAL PANAMA | | | 23,346,587 |
| PARAGUAY - 0.5% | | | |
| Republic of Paraguay 2.739% 1/29/2033 (b) | | 2,485,000 | 2,015,180 |
| Republic of Paraguay 4.95% 4/28/2031 (b) | | 5,285,000 | 5,055,433 |
| Republic of Paraguay 5.4% 3/30/2050 (b) | | 2,220,000 | 1,883,559 |
| Republic of Paraguay 6% 2/9/2036 (b) | | 1,860,000 | 1,841,400 |
TOTAL PARAGUAY | | | 10,795,572 |
| PERU - 0.5% | | | |
| Peruvian Republic 2.783% 1/23/2031 | | 6,570,000 | 5,613,244 |
| Peruvian Republic 3% 1/15/2034 | | 4,535,000 | 3,652,092 |
| Peruvian Republic 3.3% 3/11/2041 | | 4,050,000 | 2,924,859 |
TOTAL PERU | | | 12,190,195 |
| PHILIPPINES - 0.7% | | | |
| Philippine Republic 2.65% 12/10/2045 | | 3,325,000 | 2,098,906 |
| Philippine Republic 2.95% 5/5/2045 | | 1,655,000 | 1,104,713 |
| Philippine Republic 5.5% 1/17/2048 | | 1,885,000 | 1,837,875 |
| Philippine Republic 5.6% 5/14/2049 | | 2,820,000 | 2,777,700 |
| Philippine Republic 5.609% 4/13/2033 | | 3,005,000 | 3,061,344 |
| Philippine Republic 5.95% 10/13/2047 | | 4,915,000 | 5,080,881 |
TOTAL PHILIPPINES | | | 15,961,419 |
| POLAND - 0.7% | | | |
| Bank Gospodarstwa Krajowego 5.375% 5/22/2033 (b) | | 1,780,000 | 1,732,171 |
| Bank Gospodarstwa Krajowego 6.25% 10/31/2028 (b) | | 1,630,000 | 1,691,418 |
| Bank Gospodarstwa Krajowego 6.25% 7/9/2054 (b) | | 4,670,000 | 4,566,140 |
| Republic of Poland 5.5% 3/18/2054 | | 2,745,000 | 2,525,427 |
| Republic of Poland 5.5% 4/4/2053 | | 2,005,000 | 1,854,064 |
| Republic of Poland 5.75% 11/16/2032 | | 4,200,000 | 4,276,440 |
TOTAL POLAND | | | 16,645,660 |
| QATAR - 1.5% | | | |
| State of Qatar 4.4% 4/16/2050 (b) | | 9,040,000 | 7,650,100 |
| State of Qatar 4.625% 6/2/2046 (b) | | 5,790,000 | 5,167,865 |
| State of Qatar 4.817% 3/14/2049 (b) | | 8,905,000 | 8,020,644 |
| State of Qatar 5.103% 4/23/2048 (b) | | 9,945,000 | 9,407,348 |
| State of Qatar 9.75% 6/15/2030 (b) | | 3,280,000 | 4,066,544 |
TOTAL QATAR | | | 34,312,501 |
| ROMANIA - 0.6% | | | |
| Romanian Republic 3% 2/27/2027 (b) | | 2,536,000 | 2,389,102 |
| Romanian Republic 3.625% 3/27/2032 (b) | | 4,866,000 | 3,967,311 |
| Romanian Republic 4% 2/14/2051 (b) | | 3,005,000 | 1,894,878 |
| Romanian Republic 6.625% 2/17/2028 (b) | | 2,190,000 | 2,211,900 |
| Romanian Republic 7.125% 1/17/2033 (b) | | 2,770,000 | 2,802,963 |
TOTAL ROMANIA | | | 13,266,154 |
| RWANDA - 0.2% | | | |
| Rwanda Republic 5.5% 8/9/2031 (b) | | 5,740,000 | 4,825,216 |
| SAUDI ARABIA - 1.5% | | | |
| Kingdom of Saudi Arabia 2.25% 2/2/2033 (b) | | 7,350,000 | 5,845,547 |
| Kingdom of Saudi Arabia 3.45% 2/2/2061 (b) | | 10,930,000 | 6,636,559 |
| Kingdom of Saudi Arabia 3.625% 3/4/2028 (b) | | 3,315,000 | 3,181,339 |
| Kingdom of Saudi Arabia 3.75% 1/21/2055 (b) | | 5,025,000 | 3,332,203 |
| Kingdom of Saudi Arabia 4.5% 10/26/2046 (b) | | 6,645,000 | 5,365,838 |
| Kingdom of Saudi Arabia 4.5% 4/22/2060 (b) | | 2,345,000 | 1,795,285 |
| Kingdom of Saudi Arabia 4.625% 10/4/2047 (b) | | 3,095,000 | 2,530,132 |
| Kingdom of Saudi Arabia 5% 1/18/2053 (b) | | 3,580,000 | 3,028,286 |
| Kingdom of Saudi Arabia 5.75% 1/16/2054 (b) | | 2,960,000 | 2,760,200 |
TOTAL SAUDI ARABIA | | | 34,475,389 |
| SENEGAL - 0.1% | | | |
| Republic of Senegal 6.25% 5/23/2033 (b) | | 3,790,000 | 3,017,788 |
| SERBIA - 0.6% | | | |
| Republic of Serbia 2.125% 12/1/2030 (b) | | 7,890,000 | 6,413,071 |
| Republic of Serbia 6% 6/12/2034 (b) | | 3,250,000 | 3,197,187 |
| Republic of Serbia 6.5% 9/26/2033 (b) | | 4,090,000 | 4,202,475 |
TOTAL SERBIA | | | 13,812,733 |
| SOUTH AFRICA - 0.9% | | | |
| South African Republic 4.85% 9/27/2027 | | 2,690,000 | 2,619,495 |
| South African Republic 4.85% 9/30/2029 | | 2,510,000 | 2,334,990 |
| South African Republic 5% 10/12/2046 | | 3,845,000 | 2,643,591 |
| South African Republic 5.65% 9/27/2047 | | 1,905,000 | 1,421,682 |
| South African Republic 5.75% 9/30/2049 | | 5,505,000 | 4,105,079 |
| South African Republic 5.875% 4/20/2032 | | 2,695,000 | 2,530,039 |
| South African Republic 7.1% 11/19/2036 (b) | | 4,515,000 | 4,391,019 |
TOTAL SOUTH AFRICA | | | 20,045,895 |
| SRI LANKA - 0.5% | | | |
| Democratic Socialist Republic of Sri Lanka 3.1% 1/15/2030 (b)(c) | | 1,601,499 | 1,313,405 |
| Democratic Socialist Republic of Sri Lanka 3.35% 3/15/2033 (b)(c) | | 3,141,315 | 2,324,919 |
| Democratic Socialist Republic of Sri Lanka 3.6% 2/15/2038 (b)(c) | | 2,945,437 | 2,209,078 |
| Democratic Socialist Republic of Sri Lanka 3.6% 5/15/2036 (b)(c) | | 1,472,098 | 1,104,235 |
| Democratic Socialist Republic of Sri Lanka 3.6% 6/15/2035 (b)(c) | | 2,121,112 | 1,527,201 |
| Democratic Socialist Republic of Sri Lanka 4% 4/15/2028 (b) | | 2,134,228 | 1,985,067 |
TOTAL SRI LANKA | | | 10,463,905 |
| TURKEY - 3.9% | | | |
| Turkish Republic 26.2% 10/5/2033 | TRY | 82,770,000 | 2,274,791 |
| Turkish Republic 31.08% 11/8/2028 | TRY | 127,765,000 | 3,571,227 |
| Turkish Republic 37% 2/18/2026 | TRY | 38,515,000 | 1,072,537 |
| Turkish Republic 4.25% 4/14/2026 | | 8,290,000 | 8,144,925 |
| Turkish Republic 4.75% 1/26/2026 | | 10,535,000 | 10,445,453 |
| Turkish Republic 4.875% 10/9/2026 | | 4,395,000 | 4,335,931 |
| Turkish Republic 4.875% 4/16/2043 | | 8,580,000 | 5,968,591 |
| Turkish Republic 5.125% 2/17/2028 | | 2,805,000 | 2,722,168 |
| Turkish Republic 5.25% 3/13/2030 | | 2,085,000 | 1,948,823 |
| Turkish Republic 5.75% 5/11/2047 | | 4,290,000 | 3,190,516 |
| Turkish Republic 6% 1/14/2041 | | 8,310,000 | 6,817,940 |
| Turkish Republic 6% 3/25/2027 | | 1,900,000 | 1,903,563 |
| Turkish Republic 6.625% 2/17/2045 | | 3,000,000 | 2,527,170 |
| Turkish Republic 7.625% 5/15/2034 | | 3,075,000 | 3,124,969 |
| Turkish Republic 9.125% 7/13/2030 | | 2,030,000 | 2,245,688 |
| Turkish Republic 9.375% 1/19/2033 | | 8,105,000 | 9,120,638 |
| Turkish Republic 9.375% 3/14/2029 | | 4,750,000 | 5,241,328 |
| Turkish Republic 9.875% 1/15/2028 | | 9,925,000 | 10,973,328 |
TOTAL TURKEY | | | 85,629,586 |
| UKRAINE - 0.9% | | | |
| Ukraine Government 0% 2/1/2030 (b)(c) | | 1,084,343 | 587,172 |
| Ukraine Government 0% 2/1/2034 (b)(c) | | 4,052,025 | 1,671,460 |
| Ukraine Government 0% 2/1/2035 (b)(c) | | 6,109,246 | 3,604,455 |
| Ukraine Government 0% 2/1/2036 (b)(c) | | 2,853,538 | 1,669,320 |
| Ukraine Government 0% 8/1/2041 (b)(g) | | 3,920,000 | 3,008,600 |
| Ukraine Government 1.75% 2/1/2029 (b)(c) | | 4,348,798 | 2,986,863 |
| Ukraine Government 1.75% 2/1/2034 (b)(c) | | 6,075,034 | 3,406,575 |
| Ukraine Government 1.75% 2/1/2035 (b)(c) | | 4,463,092 | 2,454,701 |
| Ukraine Government 1.75% 2/1/2036 (b)(c) | | 3,088,793 | 1,667,948 |
TOTAL UKRAINE | | | 21,057,094 |
| UNITED ARAB EMIRATES - 1.6% | | | |
| Emirate of Abu Dhabi 3% 9/15/2051 (b) | | 4,675,000 | 3,024,070 |
| Emirate of Abu Dhabi 3.125% 9/30/2049 (b) | | 21,570,000 | 14,310,401 |
| Emirate of Abu Dhabi 3.875% 4/16/2050 (b) | | 6,905,000 | 5,273,694 |
| Emirate of Abu Dhabi 5.5% 4/30/2054 (b) | | 3,745,000 | 3,660,738 |
| Emirate of Dubai 3.9% 9/9/2050 (e) | | 7,425,000 | 5,383,125 |
| Emirate of Dubai 5.25% 1/30/2043 (e) | | 3,180,000 | 3,014,703 |
TOTAL UNITED ARAB EMIRATES | | | 34,666,731 |
| URUGUAY - 0.4% | | | |
| Uruguay Republic 5.1% 6/18/2050 | | 7,425,000 | 6,819,398 |
| Uruguay Republic 5.75% 10/28/2034 | | 2,875,000 | 2,954,961 |
TOTAL URUGUAY | | | 9,774,359 |
| UZBEKISTAN - 0.1% | | | |
| Republic of Uzbekistan 3.7% 11/25/2030 (b) | | 1,300,000 | 1,080,105 |
| Republic of Uzbekistan 3.9% 10/19/2031 (b) | | 1,855,000 | 1,524,578 |
TOTAL UZBEKISTAN | | | 2,604,683 |
| VENEZUELA - 0.3% | | | |
| Venezuela Republic 11.95% (e)(f) | | 13,520,000 | 2,102,360 |
| Venezuela Republic 12.75% (e)(f) | | 2,600,000 | 401,440 |
| Venezuela Republic 9.25% (f) | | 31,105,000 | 4,805,723 |
TOTAL VENEZUELA | | | 7,309,523 |
| ZAMBIA - 0.2% | | | |
| Republic of Zambia 0.5% 12/31/2053 (b) | | 5,114,768 | 2,926,619 |
| Republic of Zambia 5.75% 6/30/2033 (b)(c) | | 719,532 | 630,265 |
TOTAL ZAMBIA | | | 3,556,884 |
| TOTAL FOREIGN GOVERNMENT AND GOVERNMENT AGENCY OBLIGATIONS (Cost $1,055,418,818) | | | 972,128,372 |
| | | | |
| Non-Convertible Corporate Bonds - 42.3% |
| | | Principal Amount (a) | Value ($) |
| AZERBAIJAN - 0.6% | | | |
| Energy - 0.6% | | | |
| Energy Equipment & Services - 0.6% | | | |
| Southern Gas Corridor CJSC 6.875% 3/24/2026 (b) | | 9,935,000 | 10,047,862 |
| State Oil Co of the Azerbaijan Republic 6.95% 3/18/2030 (e) | | 2,515,000 | 2,593,619 |
| | | | |
| TOTAL AZERBAIJAN | | | 12,641,481 |
| BAHRAIN - 0.4% | | | |
| Energy - 0.4% | | | |
| Energy Equipment & Services - 0.4% | | | |
| Bapco Energies BSC Closed 7.5% 10/25/2027 (b) | | 5,740,000 | 5,905,025 |
| Bapco Energies BSC Closed 8.375% 11/7/2028 (b) | | 1,985,000 | 2,116,586 |
| | | | |
| TOTAL BAHRAIN | | | 8,021,611 |
| BRAZIL - 5.0% | | | |
| Consumer Staples - 0.7% | | | |
| Consumer Staples Distribution & Retail - 0.5% | | | |
| Minerva Luxembourg SA 8.875% 9/13/2033 (b) | | 3,080,000 | 3,195,623 |
| NBM US Holdings Inc 6.625% 8/6/2029 (b) | | 6,505,000 | 6,509,099 |
| | | | 9,704,722 |
| Food Products - 0.2% | | | |
| Adecoagro SA 6% 9/21/2027 (b) | | 2,265,000 | 2,209,077 |
| Marb Bondco PLC 3.95% 1/29/2031 (b) | | 3,925,000 | 3,275,530 |
| | | | 5,484,607 |
| Energy - 0.9% | | | |
| Energy Equipment & Services - 0.5% | | | |
| Guara Norte Sarl 5.198% 6/15/2034 (b) | | 4,316,703 | 3,927,509 |
| Yinson Boronia Production BV 8.947% 7/31/2042 (b) | | 6,485,000 | 6,770,016 |
| | | | 10,697,525 |
| Oil, Gas & Consumable Fuels - 0.4% | | | |
| MC Brazil Downstream Trading SARL 7.25% 6/30/2031 (b) | | 9,183,464 | 7,656,713 |
| Petrorio Luxembourg Holding Sarl 6.125% 6/9/2026 (b) | | 2,225,000 | 2,209,008 |
| | | | 9,865,721 |
TOTAL ENERGY | | | 20,563,246 |
| | | | |
| Financials - 0.2% | | | |
| Financial Services - 0.2% | | | |
| Azul Secured Finance II LLP ICE Term SOFR 3M + 8.25%, 12.8203% 1/28/2025 pay-in-kind (b)(g)(h) | | 744,048 | 751,488 |
| Cosan Luxembourg SA 7.25% 6/27/2031 (b) | | 2,870,000 | 2,824,253 |
| | | | 3,575,741 |
| Industrials - 0.7% | | | |
| Aerospace & Defense - 0.4% | | | |
| Embraer Netherlands Finance BV 5.4% 2/1/2027 | | 1,875,000 | 1,873,237 |
| Embraer Netherlands Finance BV 6.95% 1/17/2028 (b) | | 2,725,000 | 2,795,680 |
| Embraer Netherlands Finance BV 7% 7/28/2030 (b) | | 4,705,000 | 4,875,086 |
| | | | 9,544,003 |
| Passenger Airlines - 0.3% | | | |
| Azul Secured Finance LLP 11.5% 5/28/2029 pay-in-kind (b) | | 7,101,079 | 3,976,604 |
| Azul Secured Finance LLP 11.93% 8/28/2028 pay-in-kind (b) | | 2,935,001 | 2,950,586 |
| | | | 6,927,190 |
TOTAL INDUSTRIALS | | | 16,471,193 |
| | | | |
| Materials - 2.4% | | | |
| Chemicals - 0.6% | | | |
| Braskem Netherlands Finance BV 5.875% 1/31/2050 (b) | | 2,860,000 | 1,957,326 |
| Braskem Netherlands Finance BV 7.25% 2/13/2033 (b) | | 3,610,000 | 3,339,250 |
| Braskem Netherlands Finance BV 8% 10/15/2034 (b) | | 2,095,000 | 1,993,958 |
| Braskem Netherlands Finance BV 8.5% 1/12/2031 (b) | | 5,705,000 | 5,696,443 |
| | | | 12,986,977 |
| Metals & Mining - 1.4% | | | |
| CSN Inova Ventures 6.75% 1/28/2028 (b) | | 4,745,000 | 4,438,046 |
| CSN Resources SA 5.875% 4/8/2032 (b) | | 3,790,000 | 3,068,725 |
| CSN Resources SA 8.875% 12/5/2030 (b) | | 1,575,000 | 1,564,668 |
| Nexa Resources SA 6.5% 1/18/2028 (b) | | 3,875,000 | 3,911,348 |
| Nexa Resources SA 6.75% 4/9/2034 (b) | | 1,420,000 | 1,434,200 |
| Samarco Mineracao SA 9% 6/30/2031 pay-in-kind (b)(g) | | 11,870,591 | 11,455,121 |
| Vale Overseas Ltd 6.4% 6/28/2054 | | 4,850,000 | 4,740,875 |
| | | | 30,612,983 |
| Paper & Forest Products - 0.4% | | | |
| LD Celulose International GmbH 7.95% 1/26/2032 (b) | | 3,055,000 | 3,055,947 |
| Suzano Austria GmbH 3.75% 1/15/2031 | | 2,340,000 | 2,061,212 |
| Suzano Austria GmbH 5% 1/15/2030 | | 4,660,000 | 4,477,693 |
| | | | 9,594,852 |
TOTAL MATERIALS | | | 53,194,812 |
| | | | |
| Utilities - 0.1% | | | |
| Water Utilities - 0.1% | | | |
| Aegea Finance Sarl 9% 1/20/2031 (b) | | 1,740,000 | 1,772,624 |
| TOTAL BRAZIL | | | 110,766,945 |
| BURKINA FASO - 0.2% | | | |
| Materials - 0.2% | | | |
| Metals & Mining - 0.2% | | | |
| Endeavour Mining PLC 5% 10/14/2026 (b) | | 5,220,000 | 5,051,968 |
| CANADA - 0.2% | | | |
| Financials - 0.2% | | | |
| Insurance - 0.2% | | | |
| Sagicor Financial Co Ltd 5.3% 5/13/2028 (b) | | 3,595,000 | 3,523,100 |
| CHILE - 2.1% | | | |
| Communication Services - 0.5% | | | |
| Media - 0.1% | | | |
| VTR Finance NV 6.375% 7/15/2028 (b) | | 3,510,000 | 3,316,950 |
| Wireless Telecommunication Services - 0.4% | | | |
| VTR Comunicaciones SpA 5.125% 1/15/2028 (b) | | 7,560,000 | 7,070,944 |
TOTAL COMMUNICATION SERVICES | | | 10,387,894 |
| | | | |
| Energy - 0.1% | | | |
| Oil, Gas & Consumable Fuels - 0.1% | | | |
| Empresa Nacional del Petroleo 5.95% 7/30/2034 (b) | | 1,885,000 | 1,879,703 |
| Empresa Nacional del Petroleo 6.15% 5/10/2033 (b) | | 1,195,000 | 1,205,086 |
| | | | 3,084,789 |
| Materials - 1.3% | | | |
| Metals & Mining - 1.3% | | | |
| Antofagasta PLC 2.375% 10/14/2030 (b) | | 7,745,000 | 6,469,244 |
| Antofagasta PLC 5.625% 5/13/2032 (b) | | 2,640,000 | 2,581,418 |
| Corp Nacional del Cobre de Chile 3% 9/30/2029 (b) | | 1,175,000 | 1,044,787 |
| Corp Nacional del Cobre de Chile 3.15% 1/14/2030 (b) | | 3,075,000 | 2,732,906 |
| Corp Nacional del Cobre de Chile 3.7% 1/30/2050 (b) | | 7,190,000 | 4,817,300 |
| Corp Nacional del Cobre de Chile 5.125% 2/2/2033 (b) | | 2,775,000 | 2,633,648 |
| Corp Nacional del Cobre de Chile 5.95% 1/8/2034 (b) | | 2,985,000 | 2,967,277 |
| Corp Nacional del Cobre de Chile 6.3% 9/8/2053 (b) | | 2,750,000 | 2,677,895 |
| Corp Nacional del Cobre de Chile 6.44% 1/26/2036 (b) | | 1,925,000 | 1,960,492 |
| | | | 27,884,967 |
| Paper & Forest Products - 0.0% | | | |
| Inversiones CMPC SA 3% 4/6/2031 (b) | | 2,340,000 | 1,992,650 |
TOTAL MATERIALS | | | 29,877,617 |
| | | | |
| Utilities - 0.2% | | | |
| Electric Utilities - 0.2% | | | |
| Chile Electricity Lux Mpc II Sarl 5.58% 10/20/2035 (b) | | 1,755,000 | 1,704,983 |
| Chile Electricity Lux MPC Sarl 6.01% 1/20/2033 (b) | | 1,688,750 | 1,704,218 |
| | | | 3,409,201 |
| TOTAL CHILE | | | 46,759,501 |
| CHINA - 2.5% | | | |
| Communication Services - 0.4% | | | |
| Interactive Media & Services - 0.4% | | | |
| Tencent Holdings Ltd 1.81% 1/26/2026 (b) | | 2,605,000 | 2,522,656 |
| Tencent Holdings Ltd 2.39% 6/3/2030 (b) | | 5,400,000 | 4,719,816 |
| Tencent Holdings Ltd 3.975% 4/11/2029 (b) | | 1,960,000 | 1,885,794 |
| | | | 9,128,266 |
| Consumer Discretionary - 1.4% | | | |
| Broadline Retail - 1.1% | | | |
| Alibaba Group Holding Ltd 2.125% 2/9/2031 | | 3,260,000 | 2,746,126 |
| JD.com Inc 3.375% 1/14/2030 | | 7,905,000 | 7,299,319 |
| Prosus NV 2.031% 8/3/2032 (e) | EUR | 2,295,000 | 2,069,086 |
| Prosus NV 3.061% 7/13/2031 (b) | | 1,850,000 | 1,555,165 |
| Prosus NV 3.68% 1/21/2030 (b) | | 4,055,000 | 3,639,363 |
| Prosus NV 4.027% 8/3/2050 (b) | | 6,570,000 | 4,410,113 |
| Prosus NV 4.193% 1/19/2032 (b) | | 2,005,000 | 1,790,725 |
| | | | 23,509,897 |
| Hotels, Restaurants & Leisure - 0.3% | | | |
| Meituan 3.05% 10/28/2030 (b) | | 3,705,000 | 3,268,403 |
| Meituan 4.625% 10/2/2029 (b) | | 2,635,000 | 2,548,290 |
| | | | 5,816,693 |
TOTAL CONSUMER DISCRETIONARY | | | 29,326,590 |
| | | | |
| Information Technology - 0.3% | | | |
| Technology Hardware, Storage & Peripherals - 0.3% | | | |
| Lenovo Group Ltd 3.421% 11/2/2030 (b) | | 5,335,000 | 4,784,428 |
| Lenovo Group Ltd 5.875% 4/24/2025 (e) | | 1,295,000 | 1,297,473 |
| | | | 6,081,901 |
| Materials - 0.2% | | | |
| Chemicals - 0.2% | | | |
| ENN Clean Energy International Investment Ltd 3.375% 5/12/2026 (b) | | 4,855,000 | 4,715,322 |
| Utilities - 0.2% | | | |
| Gas Utilities - 0.2% | | | |
| ENN Energy Holdings Ltd 4.625% 5/17/2027 (b) | | 5,425,000 | 5,368,255 |
| TOTAL CHINA | | | 54,620,334 |
| COLOMBIA - 2.5% | | | |
| Communication Services - 0.1% | | | |
| Diversified Telecommunication Services - 0.1% | | | |
| Colombia Telecomunicaciones SA ESP 4.95% 7/17/2030 (b) | | 2,325,000 | 1,927,424 |
| Energy - 1.5% | | | |
| Energy Equipment & Services - 0.2% | | | |
| Oleoducto Central SA 4% 7/14/2027 (b) | | 4,675,000 | 4,419,324 |
| Oil, Gas & Consumable Fuels - 1.3% | | | |
| Canacol Energy Ltd 5.75% 11/24/2028 (b) | | 2,525,000 | 1,400,163 |
| Ecopetrol SA 4.625% 11/2/2031 | | 3,870,000 | 3,198,787 |
| Ecopetrol SA 8.375% 1/19/2036 | | 2,790,000 | 2,688,165 |
| Ecopetrol SA 8.875% 1/13/2033 | | 11,470,000 | 11,644,459 |
| Geopark Ltd 5.5% 1/17/2027 (b) | | 4,900,000 | 4,705,519 |
| Gran Tierra Energy Inc 9.5% 10/15/2029 (b) | | 5,380,000 | 4,979,513 |
| | | | 28,616,606 |
TOTAL ENERGY | | | 33,035,930 |
| | | | |
| Financials - 0.1% | | | |
| Banks - 0.1% | | | |
| Bancolombia SA 8.625% 12/24/2034 (g) | | 2,800,000 | 2,928,632 |
| Materials - 0.2% | | | |
| Metals & Mining - 0.2% | | | |
| Aris Mining Corp 8% 10/31/2029 (b) | | 4,435,000 | 4,390,784 |
| Utilities - 0.6% | | | |
| Independent Power and Renewable Electricity Producers - 0.6% | | | |
| Enfragen Energia Sur SA 5.375% 12/30/2030 (b) | | 10,370,000 | 8,824,248 |
| Termocandelaria Power SA 7.75% 9/17/2031 (b) | | 4,150,000 | 4,178,967 |
| | | | 13,003,215 |
| TOTAL COLOMBIA | | | 55,285,985 |
| COSTA RICA - 0.2% | | | |
| Financials - 0.2% | | | |
| Financial Services - 0.2% | | | |
| Liberty Costa Rica Senior Secured Finance 10.875% 1/15/2031 (b) | | 4,075,000 | 4,356,420 |
| CZECH REPUBLIC - 0.2% | | | |
| Utilities - 0.2% | | | |
| Independent Power and Renewable Electricity Producers - 0.2% | | | |
| Energo-Pro AS 8.5% 2/4/2027 (b) | | 4,600,000 | 4,670,438 |
| DOMINICAN REPUBLIC - 0.1% | | | |
| Industrials - 0.1% | | | |
| Transportation Infrastructure - 0.1% | | | |
| Aeropuertos Dominicanos Siglo XXI SA 7% 6/30/2034 (b) | | 2,840,000 | 2,912,789 |
| GHANA - 0.9% | | | |
| Energy - 0.9% | | | |
| Oil, Gas & Consumable Fuels - 0.9% | | | |
| Kosmos Energy Ltd 7.5% 3/1/2028 (b) | | 1,360,000 | 1,279,801 |
| Kosmos Energy Ltd 8.75% 10/1/2031 (b) | | 10,990,000 | 10,330,600 |
| Tullow Oil PLC 10.25% 5/15/2026 (b) | | 8,745,000 | 7,476,975 |
| Tullow Oil PLC 7% 3/1/2025 (b) | | 1,285,000 | 1,079,400 |
| | | | |
| TOTAL GHANA | | | 20,166,776 |
| GUATEMALA - 1.0% | | | |
| Communication Services - 0.6% | | | |
| Wireless Telecommunication Services - 0.6% | | | |
| CT Trust 5.125% 2/3/2032 (b) | | 7,360,000 | 6,548,119 |
| Millicom International Cellular SA 4.5% 4/27/2031 (b) | | 3,345,000 | 2,939,419 |
| Millicom International Cellular SA 7.375% 4/2/2032 (b) | | 2,545,000 | 2,523,138 |
| | | | 12,010,676 |
| Consumer Staples - 0.2% | | | |
| Beverages - 0.2% | | | |
| Cntl Amr Bottling Corp 5.25% 4/27/2029 (b) | | 5,695,000 | 5,406,719 |
| Utilities - 0.2% | | | |
| Independent Power and Renewable Electricity Producers - 0.2% | | | |
| Investment Energy Resources Ltd 6.25% 4/26/2029 (b) | | 5,270,000 | 5,067,421 |
| TOTAL GUATEMALA | | | 22,484,816 |
| HUNGARY - 0.2% | | | |
| Financials - 0.2% | | | |
| Banks - 0.2% | | | |
| Magyar Export-Import Bank Zrt 6.125% 12/4/2027 (b) | | 1,825,000 | 1,839,837 |
| OTP Bank Nyrt 8.75% 5/15/2033 (e)(g) | | 2,150,000 | 2,259,521 |
| | | | |
| TOTAL HUNGARY | | | 4,099,358 |
| INDIA - 0.8% | | | |
| Financials - 0.3% | | | |
| Consumer Finance - 0.3% | | | |
| Shriram Finance Ltd 4.15% 7/18/2025 (b) | | 5,205,000 | 5,139,938 |
| Shriram Finance Ltd 6.625% 4/22/2027 (b) | | 2,175,000 | 2,188,594 |
| | | | 7,328,532 |
| Health Care - 0.2% | | | |
| Biotechnology - 0.2% | | | |
| Biocon Biologics Global PLC 6.67% 10/9/2029 (b) | | 4,525,000 | 4,338,037 |
| Information Technology - 0.3% | | | |
| IT Services - 0.3% | | | |
| CA Magnum Holdings 5.375% 10/31/2026 (b) | | 6,365,000 | 6,213,831 |
| TOTAL INDIA | | | 17,880,400 |
| INDONESIA - 1.4% | | | |
| Energy - 0.6% | | | |
| Oil, Gas & Consumable Fuels - 0.6% | | | |
| Medco Laurel Tree Pte Ltd 6.95% 11/12/2028 (b) | | 6,620,000 | 6,586,039 |
| Medco Maple Tree Pte Ltd 8.96% 4/27/2029 (b) | | 5,210,000 | 5,478,628 |
| Medco Oak Tree Pte Ltd 7.375% 5/14/2026 (b) | | 597,000 | 606,206 |
| Pertamina Persero PT 4.175% 1/21/2050 (b) | | 2,365,000 | 1,785,244 |
| | | | 14,456,117 |
| Materials - 0.7% | | | |
| Metals & Mining - 0.7% | | | |
| Freeport Indonesia PT 4.763% 4/14/2027 (b) | | 2,350,000 | 2,326,500 |
| Freeport Indonesia PT 5.315% 4/14/2032 (b) | | 3,980,000 | 3,880,500 |
| Freeport Indonesia PT 6.2% 4/14/2052 (b) | | 2,720,000 | 2,682,328 |
| Indonesia Asahan Aluminium PT / Mineral Industri Indonesia Persero PT 5.45% 5/15/2030 (b) | | 6,445,000 | 6,396,663 |
| | | | 15,285,991 |
| Utilities - 0.1% | | | |
| Independent Power and Renewable Electricity Producers - 0.1% | | | |
| Pertamina Geothermal Energy PT 5.15% 4/27/2028 (b) | | 1,940,000 | 1,927,874 |
| TOTAL INDONESIA | | | 31,669,982 |
| ISRAEL - 1.3% | | | |
| Energy - 0.8% | | | |
| Oil, Gas & Consumable Fuels - 0.8% | | | |
| Energean Israel Finance Ltd 4.875% 3/30/2026 (b)(e) | | 7,160,000 | 6,996,752 |
| Energean PLC 6.5% 4/30/2027 (b) | | 5,725,000 | 5,691,263 |
| Leviathan Bond Ltd 6.125% 6/30/2025 (b)(e) | | 5,160,000 | 5,121,300 |
| | | | 17,809,315 |
| Health Care - 0.4% | | | |
| Pharmaceuticals - 0.4% | | | |
| Teva Pharmaceutical Finance Netherlands III BV 4.75% 5/9/2027 | | 2,895,000 | 2,825,002 |
| Teva Pharmaceutical Finance Netherlands III BV 7.875% 9/15/2029 | | 5,240,000 | 5,647,379 |
| | | | 8,472,381 |
| Utilities - 0.1% | | | |
| Electric Utilities - 0.1% | | | |
| Israel Electric Corp Ltd 3.75% 2/22/2032 (b)(e) | | 3,070,000 | 2,668,155 |
| TOTAL ISRAEL | | | 28,949,851 |
| JAMAICA - 0.0% | | | |
| Industrials - 0.0% | | | |
| Transportation Infrastructure - 0.0% | | | |
| Kingston Airport Revenue Finance Ltd 6.75% 12/15/2036 (b) | | 2,020,000 | 2,029,090 |
| KAZAKHSTAN - 0.5% | | | |
| Energy - 0.5% | | | |
| Oil, Gas & Consumable Fuels - 0.5% | | | |
| KazMunayGas National Co JSC 3.5% 4/14/2033 (b) | | 3,745,000 | 3,091,535 |
| KazMunayGas National Co JSC 5.375% 4/24/2030 (b) | | 685,000 | 665,792 |
| KazMunayGas National Co JSC 5.75% 4/19/2047 (b) | | 1,885,000 | 1,626,397 |
| Tengizchevroil Finance Co International Ltd 3.25% 8/15/2030 (b) | | 6,950,000 | 5,909,655 |
| | | | |
| TOTAL KAZAKHSTAN | | | 11,293,379 |
| KOREA (SOUTH) - 0.2% | | | |
| Materials - 0.2% | | | |
| Metals & Mining - 0.2% | | | |
| POSCO 5.75% 1/17/2028 (b) | | 2,950,000 | 3,002,196 |
| POSCO 5.875% 1/17/2033 (b) | | 1,750,000 | 1,793,087 |
| | | | |
| TOTAL KOREA (SOUTH) | | | 4,795,283 |
| KUWAIT - 0.4% | | | |
| Materials - 0.4% | | | |
| Chemicals - 0.4% | | | |
| MEGlobal BV 2.625% 4/28/2028 (b) | | 2,960,000 | 2,682,500 |
| MEGlobal BV 4.25% 11/3/2026 (b) | | 2,425,000 | 2,371,953 |
| MEGlobal Canada ULC 5% 5/18/2025 (b) | | 3,750,000 | 3,747,525 |
| | | | |
| TOTAL KUWAIT | | | 8,801,978 |
| MALAYSIA - 0.9% | | | |
| Consumer Discretionary - 0.2% | | | |
| Hotels, Restaurants & Leisure - 0.2% | | | |
| GENM Capital Labuan Ltd 3.882% 4/19/2031 (b) | | 5,185,000 | 4,569,281 |
| Energy - 0.3% | | | |
| Oil, Gas & Consumable Fuels - 0.3% | | | |
| Petronas Capital Ltd 3.404% 4/28/2061 (b) | | 4,990,000 | 3,251,484 |
| Petronas Capital Ltd 3.5% 4/21/2030 (b) | | 2,515,000 | 2,326,928 |
| | | | 5,578,412 |
| Industrials - 0.4% | | | |
| Marine Transportation - 0.4% | | | |
| MISC Capital Two Labuan Ltd 3.625% 4/6/2025 (b) | | 3,690,000 | 3,670,812 |
| MISC Capital Two Labuan Ltd 3.75% 4/6/2027 (b) | | 5,890,000 | 5,729,675 |
| | | | 9,400,487 |
| TOTAL MALAYSIA | | | 19,548,180 |
| MAURITIUS - 0.2% | | | |
| Communication Services - 0.2% | | | |
| Wireless Telecommunication Services - 0.2% | | | |
| Axian Telecom 7.375% 2/16/2027 (b) | | 5,485,000 | 5,453,626 |
| MEXICO - 5.7% | | | |
| Communication Services - 0.3% | | | |
| Media - 0.3% | | | |
| TV Azteca SAB de CV 8.25% (e)(f) | | 19,500,000 | 7,215,000 |
| Consumer Discretionary - 0.4% | | | |
| Automobile Components - 0.2% | | | |
| Metalsa Sapi De Cv 3.75% 5/4/2031 (b) | | 4,945,000 | 3,942,105 |
| Hotels, Restaurants & Leisure - 0.2% | | | |
| Bimbo Bakeries USA Inc 6.4% 1/15/2034 (b) | | 3,780,000 | 3,926,172 |
| Consumer Staples - 0.2% | | | |
| Food Products - 0.2% | | | |
| Gruma SAB de CV 5.761% 12/9/2054 (b) | | 4,510,000 | 4,243,639 |
| Energy - 3.4% | | | |
| Oil, Gas & Consumable Fuels - 3.4% | | | |
| FEL Energy VI SARL 5.75% 12/1/2040 (b) | | 2,740,574 | 2,519,629 |
| Petroleos Mexicanos 6.5% 6/2/2041 | | 2,000,000 | 1,417,000 |
| Petroleos Mexicanos 6.625% 6/15/2035 | | 21,045,000 | 16,551,893 |
| Petroleos Mexicanos 6.7% 2/16/2032 | | 11,627,000 | 10,151,824 |
| Petroleos Mexicanos 6.75% 9/21/2047 | | 8,402,000 | 5,776,375 |
| Petroleos Mexicanos 6.875% 8/4/2026 | | 4,835,000 | 4,750,388 |
| Petroleos Mexicanos 6.95% 1/28/2060 | | 5,655,000 | 3,868,359 |
| Petroleos Mexicanos 7.69% 1/23/2050 | | 39,799,000 | 29,928,848 |
| | | | 74,964,316 |
| Financials - 0.2% | | | |
| Banks - 0.2% | | | |
| BBVA Bancomer SA/Texas 5.25% 9/10/2029 (b) | | 4,125,000 | 4,036,313 |
| Industrials - 0.2% | | | |
| Industrial Conglomerates - 0.2% | | | |
| KUO SAB De CV 5.75% 7/7/2027 (b) | | 5,535,000 | 5,387,990 |
| Materials - 0.8% | | | |
| Chemicals - 0.7% | | | |
| Braskem Idesa SAPI 6.99% 2/20/2032 (b) | | 1,965,000 | 1,444,275 |
| Braskem Idesa SAPI 7.45% 11/15/2029 (b) | | 6,340,000 | 5,045,372 |
| Orbia Advance Corp SAB de CV 1.875% 5/11/2026 (b) | | 6,640,000 | 6,268,559 |
| Orbia Advance Corp SAB de CV 2.875% 5/11/2031 (b) | | 3,435,000 | 2,812,166 |
| | | | 15,570,372 |
| Metals & Mining - 0.1% | | | |
| Fresnillo PLC 4.25% 10/2/2050 (b) | | 3,785,000 | 2,669,825 |
TOTAL MATERIALS | | | 18,240,197 |
| | | | |
| Utilities - 0.2% | | | |
| Independent Power and Renewable Electricity Producers - 0.2% | | | |
| Buffalo Energy Mexico Holdings / Buffalo Energy Infrastructure / Buffalo Energy 7.875% 2/15/2039 (b) | | 4,710,000 | 4,854,550 |
| TOTAL MEXICO | | | 126,810,282 |
| MOROCCO - 0.6% | | | |
| Materials - 0.6% | | | |
| Chemicals - 0.6% | | | |
| OCP SA 3.75% 6/23/2031 (b) | | 3,820,000 | 3,301,932 |
| OCP SA 5.125% 6/23/2051 (b) | | 2,190,000 | 1,650,033 |
| OCP SA 6.75% 5/2/2034 (b) | | 2,485,000 | 2,530,973 |
| OCP SA 6.875% 4/25/2044 (b) | | 3,920,000 | 3,807,300 |
| OCP SA 7.5% 5/2/2054 (b) | | 1,890,000 | 1,917,178 |
| | | | |
| TOTAL MOROCCO | | | 13,207,416 |
| NIGERIA - 0.4% | | | |
| Communication Services - 0.3% | | | |
| Diversified Telecommunication Services - 0.3% | | | |
| IHS Holding Ltd 5.625% 11/29/2026 (b) | | 1,679,000 | 1,649,617 |
| IHS Holding Ltd 7.875% 5/29/2030 (b) | | 4,425,000 | 4,362,785 |
| | | | 6,012,402 |
| Energy - 0.0% | | | |
| Oil, Gas & Consumable Fuels - 0.0% | | | |
| SEPLAT Energy PLC 7.75% 4/1/2026 (b) | | 1,080,000 | 1,076,090 |
| Information Technology - 0.1% | | | |
| Communications Equipment - 0.1% | | | |
| IHS Netherlands Holdco BV 8% 9/18/2027 (b) | | 1,213,394 | 1,211,877 |
| TOTAL NIGERIA | | | 8,300,369 |
| PANAMA - 0.8% | | | |
| Communication Services - 0.8% | | | |
| Diversified Telecommunication Services - 0.2% | | | |
| Sable International Finance Ltd 7.125% 10/15/2032 (b) | | 5,075,000 | 4,951,881 |
| Media - 0.4% | | | |
| Telecomunicaciones Digitales SA 4.5% 1/30/2030 (b) | | 9,720,000 | 8,830,037 |
| Wireless Telecommunication Services - 0.2% | | | |
| C&W Senior Finance Ltd 6.875% 9/15/2027 (b) | | 3,561,000 | 3,519,610 |
| Industrials - 0.0% | | | |
| Air Freight & Logistics - 0.0% | | | |
| Aeropuerto Internacional de Tocumen SA 5.125% 8/11/2061 (b) | | 2,115,000 | 1,523,117 |
| TOTAL PANAMA | | | 18,824,645 |
| PARAGUAY - 0.2% | | | |
| Communication Services - 0.2% | | | |
| Diversified Telecommunication Services - 0.2% | | | |
| Telefonica Celular del Paraguay SA 5.875% 4/15/2027 (b) | | 4,185,000 | 4,153,613 |
| PERU - 0.9% | | | |
| Consumer Staples - 0.1% | | | |
| Food Products - 0.1% | | | |
| Camposol SA 6% 2/3/2027 (b) | | 3,128,000 | 2,962,810 |
| Financials - 0.2% | | | |
| Banks - 0.2% | | | |
| Banco de Credito del Peru S.A. 5.8% 3/10/2035 (b)(g) | | 4,525,000 | 4,409,613 |
| Health Care - 0.1% | | | |
| Health Care Providers & Services - 0.1% | | | |
| Auna SA 10% 12/15/2029 (b) | | 2,724,200 | 2,851,039 |
| Materials - 0.4% | | | |
| Metals & Mining - 0.4% | | | |
| Cia de Minas Buenaventura SAA 5.5% 7/23/2026 (b) | | 3,690,000 | 3,664,170 |
| Volcan Cia Minera SAA 8.75% 1/24/2030 (b) | | 4,595,000 | 4,373,935 |
| | | | 8,038,105 |
| Utilities - 0.1% | | | |
| Independent Power and Renewable Electricity Producers - 0.1% | | | |
| Niagara Energy SAC 5.746% 10/3/2034 (b) | | 2,610,000 | 2,518,127 |
| TOTAL PERU | | | 20,779,694 |
| PUERTO RICO - 0.3% | | | |
| Communication Services - 0.3% | | | |
| Media - 0.3% | | | |
| Lcpr Senior Secured Financing Dac 5.125% 7/15/2029 (b) | | 7,065,000 | 5,668,524 |
| QATAR - 1.7% | | | |
| Communication Services - 0.1% | | | |
| Diversified Telecommunication Services - 0.1% | | | |
| Ooredoo International Finance Ltd 2.625% 4/8/2031 (b) | | 4,095,000 | 3,556,261 |
| Energy - 1.6% | | | |
| Oil, Gas & Consumable Fuels - 1.6% | | | |
| QatarEnergy 1.375% 9/12/2026 (b) | | 8,475,000 | 7,985,993 |
| QatarEnergy 2.25% 7/12/2031 (b) | | 13,045,000 | 10,955,061 |
| QatarEnergy 3.125% 7/12/2041 (b) | | 12,920,000 | 9,523,978 |
| QatarEnergy 3.3% 7/12/2051 (b) | | 9,635,000 | 6,621,051 |
| | | | 35,086,083 |
| TOTAL QATAR | | | 38,642,344 |
| RUSSIA - 0.0% | | | |
| Materials - 0.0% | | | |
| Metals & Mining - 0.0% | | | |
| TMK OAO Via TMK Capital SA loan participation 4.3% (e)(f)(i) | | 4,020,000 | 602,999 |
| SAUDI ARABIA - 3.8% | | | |
| Energy - 2.9% | | | |
| Oil, Gas & Consumable Fuels - 2.9% | | | |
| EIG Pearl Holdings Sarl 3.545% 8/31/2036 (b) | | 13,705,000 | 11,739,189 |
| SA Global Sukuk Ltd 1.602% 6/17/2026 (b) | | 8,175,000 | 7,776,469 |
| Saudi Arabian Oil Co 2.25% 11/24/2030 (b) | | 10,775,000 | 9,199,156 |
| Saudi Arabian Oil Co 3.25% 11/24/2050 (b) | | 8,390,000 | 5,442,257 |
| Saudi Arabian Oil Co 3.5% 11/24/2070 (b) | | 3,270,000 | 2,007,976 |
| Saudi Arabian Oil Co 3.5% 4/16/2029 (b) | | 13,480,000 | 12,662,842 |
| Saudi Arabian Oil Co 4.25% 4/16/2039 (b) | | 14,945,000 | 12,822,811 |
| Saudi Arabian Oil Co 4.375% 4/16/2049 (b) | | 2,280,000 | 1,812,600 |
| Saudi Arabian Oil Co 5.875% 7/17/2064 (b) | | 1,590,000 | 1,477,508 |
| | | | 64,940,808 |
| Financials - 0.1% | | | |
| Financial Services - 0.1% | | | |
| Gaci First Investment Co 5.25% 10/13/2032 (e) | | 2,155,000 | 2,127,739 |
| Industrials - 0.8% | | | |
| Construction & Engineering - 0.8% | | | |
| Greensaif Pipelines Bidco Sarl 5.8528% 2/23/2036 (b) | | 1,955,000 | 1,929,956 |
| Greensaif Pipelines Bidco Sarl 6.1027% 8/23/2042 (b) | | 3,605,000 | 3,520,751 |
| Greensaif Pipelines Bidco Sarl 6.129% 2/23/2038 (b) | | 9,650,000 | 9,692,267 |
| Greensaif Pipelines Bidco Sarl 6.51% 2/23/2042 (b) | | 2,955,000 | 2,990,091 |
| | | | 18,133,065 |
| TOTAL SAUDI ARABIA | | | 85,201,612 |
| SERBIA - 0.2% | | | |
| Consumer Discretionary - 0.2% | | | |
| Distributors - 0.2% | | | |
| Telecommunications co Telekom Srbija AD Belgrade 7% 10/28/2029 (b) | | 4,370,000 | 4,362,353 |
| SOUTH AFRICA - 1.8% | | | |
| Communication Services - 0.5% | | | |
| Diversified Telecommunication Services - 0.3% | | | |
| Liquid Telecommunications Financing Plc 5.5% 9/4/2026 (b) | | 8,595,000 | 6,707,538 |
| Wireless Telecommunication Services - 0.2% | | | |
| MTN Mauritius Investments Ltd 6.5% 10/13/2026 (b) | | 3,485,000 | 3,517,689 |
TOTAL COMMUNICATION SERVICES | | | 10,225,227 |
| | | | |
| Materials - 0.6% | | | |
| Chemicals - 0.5% | | | |
| Sasol Financing USA LLC 4.375% 9/18/2026 | | 8,935,000 | 8,558,032 |
| Sasol Financing USA LLC 5.5% 3/18/2031 | | 2,355,000 | 1,986,500 |
| | | | 10,544,532 |
| Metals & Mining - 0.1% | | | |
| Stillwater Mining Co 4% 11/16/2026 (b) | | 3,275,000 | 3,094,875 |
TOTAL MATERIALS | | | 13,639,407 |
| | | | |
| Utilities - 0.7% | | | |
| Electric Utilities - 0.7% | | | |
| Eskom Holdings SOC Ltd 6.35% 8/10/2028 (b) | | 5,840,000 | 5,805,310 |
| Eskom Holdings SOC Ltd 7.125% 2/11/2025 (b) | | 7,180,000 | 7,171,025 |
| Eskom Holdings SOC Ltd 8.45% 8/10/2028 (b) | | 2,350,000 | 2,464,563 |
| | | | 15,440,898 |
| TOTAL SOUTH AFRICA | | | 39,305,532 |
| THAILAND - 0.0% | | | |
| Financials - 0.0% | | | |
| Financial Services - 0.0% | | | |
| PTT Treasury Center Co Ltd 3.7% 7/16/2070 (b) | | 2,530,000 | 1,658,845 |
| TURKEY - 0.6% | | | |
| Financials - 0.1% | | | |
| Banks - 0.1% | | | |
| Turkiye Ihracat Kredi Bankasi AS 9% 1/28/2027 (b) | | 2,875,000 | 3,025,039 |
| Industrials - 0.3% | | | |
| Building Products - 0.3% | | | |
| Sisecam UK PLC 8.625% 5/2/2032 (b) | | 5,680,000 | 5,639,161 |
| Utilities - 0.2% | | | |
| Independent Power and Renewable Electricity Producers - 0.2% | | | |
| Aydem Yenilenebilir Enerji AS 7.75% 2/2/2027 (b) | | 3,690,000 | 3,672,694 |
| TOTAL TURKEY | | | 12,336,894 |
| UKRAINE - 0.2% | | | |
| Energy - 0.2% | | | |
| Oil, Gas & Consumable Fuels - 0.2% | | | |
| NAK Naftogaz Ukraine via Kondor Finance PLC loan participation 7.625% 11/8/2028 pay-in-kind (b) | | 2,749,604 | 2,034,707 |
| NAK Naftogaz Ukraine via Kondor Finance PLC loan participation 7.65% 7/19/2025 pay-in-kind (e) | | 3,218,138 | 2,992,868 |
| | | | |
| TOTAL UKRAINE | | | 5,027,575 |
| UNITED ARAB EMIRATES - 2.8% | | | |
| Energy - 0.7% | | | |
| Oil, Gas & Consumable Fuels - 0.7% | | | |
| Adnoc Murban Rsc Ltd 5.125% 9/11/2054 (b) | | 3,530,000 | 3,186,919 |
| Galaxy Pipeline Assets Bidco Ltd 2.16% 3/31/2034 (b) | | 3,139,746 | 2,690,103 |
| Galaxy Pipeline Assets Bidco Ltd 2.625% 3/31/2036 (b) | | 10,925,000 | 8,867,604 |
| | | | 14,744,626 |
| Financials - 0.9% | | | |
| Financial Services - 0.9% | | | |
| Abu Dhabi Developmental Holding Co PJSC 5.25% 10/2/2054 (b) | | 4,430,000 | 4,076,984 |
| Abu Dhabi Developmental Holding Co PJSC 5.5% 5/8/2034 (b) | | 2,220,000 | 2,253,300 |
| MDGH GMTN RSC Ltd 2.875% 11/7/2029 (b) | | 5,770,000 | 5,227,735 |
| MDGH GMTN RSC Ltd 4.375% 11/22/2033 (b) | | 2,925,000 | 2,741,164 |
| MDGH GMTN RSC Ltd 5.084% 5/22/2053 (b) | | 3,770,000 | 3,456,638 |
| MDGH GMTN RSC Ltd Series 1, 5.5% 4/28/2033 (b) | | 2,985,000 | 3,038,611 |
| | | | 20,794,432 |
| Industrials - 0.4% | | | |
| Transportation Infrastructure - 0.4% | | | |
| DP World Crescent Ltd 3.7495% 1/30/2030 (b) | | 4,165,000 | 3,892,973 |
| DP World Ltd/United Arab Emirates 5.625% 9/25/2048 (b) | | 4,230,000 | 3,981,107 |
| | | | 7,874,080 |
| Real Estate - 0.1% | | | |
| Real Estate Management & Development - 0.1% | | | |
| Alpha Star Holding VIII Ltd 8.375% 4/12/2027 (e) | | 2,320,000 | 2,404,100 |
| Utilities - 0.7% | | | |
| Multi-Utilities - 0.7% | | | |
| Abu Dhabi National Energy Co PJSC 4% 10/3/2049 (b) | | 4,655,000 | 3,621,869 |
| Abu Dhabi National Energy Co PJSC 4.375% 1/24/2029 (b) | | 2,970,000 | 2,901,512 |
| Abu Dhabi National Energy Co PJSC 4.696% 4/24/2033 (b) | | 3,320,000 | 3,195,400 |
| Abu Dhabi National Energy Co PJSC 4.75% 3/9/2037 (b) | | 4,420,000 | 4,140,988 |
| Abu Dhabi National Energy Co PJSC 4.875% 4/23/2030 (b) | | 2,020,000 | 1,999,295 |
| | | | 15,859,064 |
| TOTAL UNITED ARAB EMIRATES | | | 61,676,302 |
| UNITED KINGDOM - 0.0% | | | |
| Materials - 0.0% | | | |
| Metals & Mining - 0.0% | | | |
| Celtic Resources Holdings DAC 4.125% (b)(f)(i) | | 5,060,000 | 725,401 |
| UZBEKISTAN - 0.2% | | | |
| Materials - 0.2% | | | |
| Metals & Mining - 0.2% | | | |
| Navoi Mining & Metallurgical Combinat 6.7% 10/17/2028 (b) | | 1,335,000 | 1,329,994 |
| Navoi Mining & Metallurgical Combinat 6.95% 10/17/2031 (b) | | 2,195,000 | 2,171,689 |
| | | | |
| TOTAL UZBEKISTAN | | | 3,501,683 |
| VENEZUELA - 0.1% | | | |
| Energy - 0.1% | | | |
| Oil, Gas & Consumable Fuels - 0.1% | | | |
| Petroleos de Venezuela SA 12.75% (b)(f) | | 1,258,333 | 139,675 |
| Petroleos de Venezuela SA 5.375% (e)(f) | | 4,800,000 | 516,192 |
| Petroleos de Venezuela SA 5.5% (e)(f) | | 315,000 | 33,847 |
| Petroleos de Venezuela SA 6% (b)(f) | | 9,300,000 | 957,714 |
| Petroleos de Venezuela SA 6% (b)(f) | | 11,650,000 | 1,217,425 |
| Petroleos de Venezuela SA 9.75% (b)(f) | | 1,265,000 | 141,680 |
| | | | |
| TOTAL VENEZUELA | | | 3,006,533 |
| VIETNAM - 0.2% | | | |
| Utilities - 0.2% | | | |
| Electric Utilities - 0.2% | | | |
| Mong Duong Finance Holdings BV 5.125% 5/7/2029 (b) | | 3,850,378 | 3,691,973 |
| TOTAL NON-CONVERTIBLE CORPORATE BONDS (Cost $1,038,391,918) | | | 943,267,880 |
| | | | |
| Preferred Securities - 3.3% |
| | | Principal Amount (a) | Value ($) |
| BRAZIL - 0.6% | | | |
| Consumer Staples - 0.2% | | | |
| Food Products - 0.2% | | | |
| Cosan Overseas Ltd 8.25% (e)(j) | | 4,346,000 | 4,378,371 |
| Financials - 0.4% | | | |
| Banks - 0.4% | | | |
| Banco do Brasil SA/Cayman 10 year U.S. Treasury Note + 4.398%, 8.748% (b)(g)(h)(j) | | 7,155,000 | 7,320,465 |
| Materials - 0.0% | | | |
| Metals & Mining - 0.0% | | | |
| Vale SA 0% (g)(j) | BRL | 10,620,000 | 610,261 |
| TOTAL BRAZIL | | | 12,309,097 |
| CHILE - 0.4% | | | |
| Financials - 0.4% | | | |
| Banks - 0.4% | | | |
| Banco de Credito e Inversiones SA 7.5% (b)(g)(j) | | 2,755,000 | 2,767,396 |
| Banco de Credito e Inversiones SA 8.75% (b)(g)(j) | | 2,785,000 | 3,009,623 |
| Banco del Estado de Chile 7.95% (b)(g)(j) | | 2,485,000 | 2,589,809 |
| | | | |
| TOTAL CHILE | | | 8,366,828 |
| HONG KONG - 0.3% | | | |
| Communication Services - 0.3% | | | |
| Diversified Telecommunication Services - 0.3% | | | |
| CAS Capital No 1 Ltd 4% (e)(g)(j) | | 6,695,000 | 6,531,753 |
| INDIA - 0.4% | | | |
| Information Technology - 0.4% | | | |
| IT Services - 0.4% | | | |
| Network i2i Ltd 3.975% (b)(g)(j) | | 2,535,000 | 2,470,147 |
| Network i2i Ltd 5.65% (b)(g)(j) | | 6,088,000 | 6,152,196 |
| | | | |
| TOTAL INDIA | | | 8,622,343 |
| KUWAIT - 0.0% | | | |
| Financials - 0.0% | | | |
| Banks - 0.0% | | | |
| NBK Tier 1 Ltd 3.625% (b)(g)(j) | | 2,490,000 | 2,394,547 |
| MEXICO - 1.3% | | | |
| Financials - 0.7% | | | |
| Banks - 0.7% | | | |
| Banco Mercantil del Norte SA/Grand Cayman 7.625% (b)(g)(j) | | 7,260,000 | 7,266,207 |
| Banco Mercantil del Norte SA/Grand Cayman 8.375% (b)(g)(j) | | 1,905,000 | 1,909,798 |
| BBVA Bancomer SA/Texas 5.125% 1/18/2033 (b)(g) | | 2,615,000 | 2,487,069 |
| BBVA Bancomer SA/Texas 8.45% 6/29/2038 (b)(g) | | 2,930,000 | 3,036,491 |
| | | | 14,699,565 |
| Materials - 0.6% | | | |
| Construction Materials - 0.6% | | | |
| Cemex SAB de CV 5.125% (b)(g)(j) | | 9,990,000 | 9,951,439 |
| Cemex SAB de CV 9.125% (b)(g)(j) | | 3,615,000 | 3,736,373 |
| | | | 13,687,812 |
| TOTAL MEXICO | | | 28,387,377 |
| RUSSIA - 0.0% | | | |
| Financials - 0.0% | | | |
| Banks - 0.0% | | | |
| Alfa Bank AO Via Alfa Bond Issuance PLC loan participation 6.95% (e)(f)(g)(i)(j) | | 982,000 | 49,100 |
| Tinkoff Bank JSC Via TCS Finance Ltd loan participation 6% (b)(f)(g)(i)(j) | | 2,960,000 | 148,000 |
| | | | |
| TOTAL RUSSIA | | | 197,100 |
| UNITED ARAB EMIRATES - 0.3% | | | |
| Industrials - 0.3% | | | |
| Marine Transportation - 0.3% | | | |
| DP World Salaam 6% (e)(g)(j) | | 6,000,000 | 6,150,000 |
| TOTAL PREFERRED SECURITIES (Cost $75,936,715) | | | 72,959,045 |
| | | | |
| U.S. Treasury Obligations - 3.2% |
| | | Yield (%) (k) | Principal Amount (a) | Value ($) |
| US Treasury Bonds 2.875% 5/15/2052 | | 2.99 to 3.12 | 6,190,000 | 4,328,863 |
| US Treasury Bonds 3.25% 5/15/2042 | | 3.37 to 5.18 | 14,357,000 | 11,677,838 |
| US Treasury Bonds 3.625% 2/15/2053 | | 3.69 to 5.06 | 21,730,000 | 17,655,419 |
| US Treasury Notes 2.875% 5/15/2032 (l) | | 2.91 to 2.95 | 10,848,000 | 9,742,613 |
| US Treasury Notes 3.625% 3/31/2030 | | 3.31 to 3.33 | 9,396,000 | 9,055,399 |
| US Treasury Notes 3.75% 5/31/2030 | | 3.84 | 1,994,000 | 1,929,971 |
| US Treasury Notes 4% 2/28/2030 | | 3.40 | 4,819,000 | 4,729,786 |
| US Treasury Notes 4.125% 3/31/2031 | | 4.66 | 7,644,000 | 7,503,488 |
| US Treasury Notes 4.625% 9/30/2030 | | 5.00 | 3,851,000 | 3,886,787 |
| TOTAL U.S. TREASURY OBLIGATIONS (Cost $78,765,712) | | | | 70,510,164 |
| | | | | |
| Money Market Funds - 6.0% |
| | | Yield (%) | Shares | Value ($) |
Fidelity Cash Central Fund (m) (Cost $134,807,417) | | 4.36 | 134,780,952 | 134,807,909 |
| | | | | |
| TOTAL INVESTMENT IN SECURITIES - 98.4% (Cost $2,383,320,580) | 2,193,673,370 |
NET OTHER ASSETS (LIABILITIES) - 1.6% | 34,630,069 |
| NET ASSETS - 100.0% | 2,228,303,439 |
| | |
| Futures Contracts |
| | Number of contracts | Expiration Date | Notional Amount ($) | Value ($) | Unrealized Appreciation/ (Depreciation) ($) |
| Purchased | | | | | |
| | | | | | |
| Interest Rate Contracts | | | | | |
| CBOT 10-Year U.S. Treasury Note Contracts (United States) | 1,040 | Mar 2025 | 113,100,000 | (960,253) | (960,253) |
| | | | | | |
| The notional amount of futures purchased as a percentage of Net Assets is 5.1% |
Currency Abbreviations
| BRL | - | Brazilian Real |
| EGP | - | Egyptian Pound |
| EUR | - | European Monetary Unit (Euro) |
| NGN | - | Nigerian Naira |
| TRY | - | New Turkish Lira |
Legend
| (a) | Amount is stated in United States dollars unless otherwise noted. |
| (b) | Security exempt from registration under Rule 144A of the Securities Act of 1933. These securities may be resold in transactions exempt from registration, normally to qualified institutional buyers. At the end of the period, the value of these securities amounted to $1,374,481,382 or 61.7% of net assets. |
| (c) | Security initially issued at one coupon which converts to a higher coupon at a specified date. The rate shown is the rate at period end. |
| (d) | Security initially issued in zero coupon form which converts to coupon form at a specified rate and date. The rate shown is the rate at period end. |
| (e) | Security is exempt from registration under Regulation S of the Securities Act of 1933 and may be resold to qualified foreign investors outside of the United States. At the end of the period, the value of securities amounted to $68,949,638 or 3.1% of net assets. |
| (f) | Non-income producing - Security is in default. |
| (g) | Coupon rates for floating and adjustable rate securities reflect the rates in effect at period end. |
| (h) | Coupon is indexed to a floating interest rate which may be multiplied by a specified factor and/or subject to caps or floors. |
| (j) | Security is perpetual in nature with no stated maturity date. |
| (k) | Yield represents either the annualized yield at the date of purchase, or the stated coupon rate, or, for floating and adjustable rate securities, the rate at period end. |
| (l) | Security or a portion of the security was pledged to cover margin requirements for futures contracts. At period end, the value of securities pledged amounted to $2,192,267. |
| (m) | Affiliated fund that is generally available only to investment companies and other accounts managed by Fidelity Investments. The rate quoted is the annualized seven-day yield of the fund at period end. A complete unaudited listing of the fund's holdings as of its most recent quarter end is available upon request. In addition, each Fidelity Central Fund's financial statements, which are not covered by the Fund's Report of Independent Registered Public Accounting Firm, are available on the SEC's website or upon request. |
Affiliated Central Funds
Fiscal year to date information regarding the Fund's investments in Fidelity Central Funds, including the ownership percentage, is presented below.
| Affiliate | Value, beginning of period ($) | Purchases ($) | Sales Proceeds ($) | Dividend Income ($) | Realized Gain (loss) ($) | Change in Unrealized appreciation (depreciation) ($) | Value, end of period ($) | Shares, end of period | % ownership, end of period |
| Fidelity Cash Central Fund | 36,533,365 | 569,296,661 | 471,023,101 | 2,570,378 | 984 | - | 134,807,909 | 134,780,952 | 0.3% |
| Total | 36,533,365 | 569,296,661 | 471,023,101 | 2,570,378 | 984 | - | 134,807,909 | 134,780,952 | |
| | | | | | | | | | |
Amounts in the dividend income column in the above table include any capital gain distributions from underlying funds, which are presented in the corresponding line item in the Statement of Operations, if applicable.
Amounts included in the purchases and sales proceeds columns may include in-kind transactions, if applicable.
Investment Valuation
The following is a summary of the inputs used, as of December 31, 2024, involving the Fund's assets and liabilities carried at fair value. The inputs or methodology used for valuing securities may not be an indication of the risk associated with investing in those securities. For more information on valuation inputs, and their aggregation into the levels used below, please refer to the Investment Valuation section in the accompanying Notes to Financial Statements.
| Valuation Inputs at Reporting Date: |
| Description | Total ($) | Level 1 ($) | Level 2 ($) | Level 3 ($) |
Investments in Securities: | | | | |
|
| Foreign Government and Government Agency Obligations | 972,128,372 | - | 972,128,372 | - |
|
| Non-Convertible Corporate Bonds | | | | |
Communication Services | 93,040,441 | - | 93,040,441 | - |
Consumer Discretionary | 46,126,501 | - | 46,126,501 | - |
Consumer Staples | 27,802,497 | - | 27,802,497 | - |
Energy | 345,497,087 | - | 345,497,087 | - |
Financials | 61,863,764 | - | 61,863,764 | - |
Health Care | 15,661,457 | - | 15,661,457 | - |
Industrials | 69,370,972 | - | 69,370,972 | - |
Information Technology | 13,507,609 | - | 13,507,609 | - |
Materials | 184,068,963 | - | 182,740,563 | 1,328,400 |
Real Estate | 2,404,100 | - | 2,404,100 | - |
Utilities | 83,924,489 | - | 83,924,489 | - |
|
| Preferred Securities | | | | |
Communication Services | 6,531,753 | - | 6,531,753 | - |
Consumer Staples | 4,378,371 | - | 4,378,371 | - |
Financials | 32,978,505 | - | 32,781,405 | 197,100 |
Industrials | 6,150,000 | - | 6,150,000 | - |
Information Technology | 8,622,343 | - | 8,622,343 | - |
Materials | 14,298,073 | - | 14,298,073 | - |
|
| U.S. Treasury Obligations | 70,510,164 | - | 70,510,164 | - |
|
| Money Market Funds | 134,807,909 | 134,807,909 | - | - |
| Total Investments in Securities: | 2,193,673,370 | 134,807,909 | 2,057,339,961 | 1,525,500 |
Derivative Instruments: Liabilities | | | | |
Futures Contracts | (960,253) | (960,253) | - | - |
| Total Liabilities | (960,253) | (960,253) | - | - |
| Total Derivative Instruments: | (960,253) | (960,253) | - | - |
Value of Derivative Instruments
The following table is a summary of the Fund's value of derivative instruments by primary risk exposure as of December 31, 2024. For additional information on derivative instruments, please refer to the Derivative Instruments section in the accompanying Notes to Financial Statements.
Primary Risk Exposure / Derivative Type | Value |
| Asset ($) | Liability ($) |
| Interest Rate Risk | | |
Futures Contracts (a) | 0 | (960,253) |
| Total Interest Rate Risk | 0 | (960,253) |
| Total Value of Derivatives | 0 | (960,253) |
(a)Reflects gross cumulative appreciation (depreciation) on futures contracts as presented in the Schedule of Investments. In the Statement of Assets and Liabilities, the period end daily variation margin is included in receivable or payable for daily variation margin on futures contracts, and the net cumulative appreciation (depreciation) is included in Total accumulated earnings (loss).
Fidelity® Emerging Markets Debt Central Fund
Financial Statements
| Statement of Assets and Liabilities |
As of December 31, 2024 |
| Assets | | | | |
| Investment in securities, at value - See accompanying schedule: | | | | |
Unaffiliated issuers (cost $2,248,513,163) | $ | 2,058,865,461 | | |
Fidelity Central Funds (cost $134,807,417) | | 134,807,909 | | |
| | | | | |
| | | | | |
| Total Investment in Securities (cost $2,383,320,580) | | | $ | 2,193,673,370 |
| Receivable for investments sold | | | | 319,007 |
| Interest receivable | | | | 34,151,400 |
| Distributions receivable from Fidelity Central Funds | | | | 501,693 |
Total assets | | | | 2,228,645,470 |
| Liabilities | | | | |
| Payable for investments purchased | $ | 107,403 | | |
| Distributions payable | | 833 | | |
| Payable for daily variation margin on futures contracts | | 227,500 | | |
| Other payables and accrued expenses | | 6,295 | | |
| Total liabilities | | | | 342,031 |
| Net Assets | | | $ | 2,228,303,439 |
| Net Assets consist of: | | | | |
| Paid in capital | | | $ | 2,703,838,845 |
| Total accumulated earnings (loss) | | | | (475,535,406) |
| Net Assets | | | $ | 2,228,303,439 |
Net Asset Value, offering price and redemption price per share ($2,228,303,439 ÷ 277,123,108 shares) | | | $ | 8.04 |
| Statement of Operations |
| Year ended December 31, 2024 |
| Investment Income | | | | |
| Dividends | | | $ | 4,328,271 |
| Interest | | | | 125,507,651 |
| Income from Fidelity Central Funds | | | | 2,570,378 |
| Income before foreign taxes withheld | | | $ | 132,406,300 |
| Less foreign taxes withheld | | | | (190,682) |
| Total income | | | | 132,215,618 |
| Expenses | | | | |
| Custodian fees and expenses | $ | 13,713 | | |
| Independent trustees' fees and expenses | | 9,362 | | |
| Legal | | 294,866 | | |
| Miscellaneous | | 278 | | |
| Total expenses before reductions | | 318,219 | | |
| Expense reductions | | (10,313) | | |
| Total expenses after reductions | | | | 307,906 |
| Net Investment income (loss) | | | | 131,907,712 |
| Realized and Unrealized Gain (Loss) | | | | |
| Net realized gain (loss) on: | | | | |
| Investment Securities: | | | | |
| Unaffiliated issuers | | (34,932,414) | | |
| Redemptions in-kind | | (4,517,554) | | |
| Fidelity Central Funds | | 984 | | |
| Foreign currency transactions | | (130,740) | | |
| Futures contracts | | (729,937) | | |
| Total net realized gain (loss) | | | | (40,309,661) |
| Change in net unrealized appreciation (depreciation) on: | | | | |
| Investment Securities: | | | | |
| Unaffiliated issuers | | 73,418,440 | | |
| Assets and liabilities in foreign currencies | | (27,160) | | |
| Futures contracts | | (1,079,873) | | |
| Total change in net unrealized appreciation (depreciation) | | | | 72,311,407 |
| Net gain (loss) | | | | 32,001,746 |
| Net increase (decrease) in net assets resulting from operations | | | $ | 163,909,458 |
| Statement of Changes in Net Assets |
| |
| | Year ended December 31, 2024 | | Year ended December 31, 2023 |
| Increase (Decrease) in Net Assets | | | | |
| Operations | | | | |
| Net investment income (loss) | $ | 131,907,712 | $ | 139,682,661 |
| Net realized gain (loss) | | (40,309,661) | | (89,600,719) |
| Change in net unrealized appreciation (depreciation) | | 72,311,407 | | 170,105,814 |
| Net increase (decrease) in net assets resulting from operations | | 163,909,458 | | 220,187,756 |
| Distributions to shareholders | | (122,136,191) | | (126,070,231) |
| | | | | |
| Affiliated share transactions | | | | |
| Proceeds from sales of shares | | 123,175,714 | | 38,287,797 |
| Reinvestment of distributions | | 121,715,427 | | 126,064,824 |
| Cost of shares redeemed | | (197,812,477) | | (291,269,824) |
| | | | | |
Net increase (decrease) in net assets resulting from share transactions | | 47,078,664 | | (126,917,203) |
| Total increase (decrease) in net assets | | 88,851,931 | | (32,799,678) |
| | | | | |
| Net Assets | | | | |
| Beginning of period | | 2,139,451,508 | | 2,172,251,186 |
| End of period | $ | 2,228,303,439 | $ | 2,139,451,508 |
| | | | | |
| Other Information | | | | |
| Shares | | | | |
| Sold | | 15,375,175 | | 5,115,802 |
| Issued in reinvestment of distributions | | 15,219,175 | | 16,684,465 |
| Redeemed | | (25,159,613) | | (38,214,712) |
| Net increase (decrease) | | 5,434,737 | | (16,414,445) |
| | | | | |
Financial Highlights
Fidelity® Emerging Markets Debt Central Fund |
| |
| Years ended December 31, | | 2024 | | 2023 | | 2022 | | 2021 | | 2020 |
Selected Per-Share Data | | | | | | | | | | |
| Net asset value, beginning of period | $ | 7.87 | $ | 7.54 | $ | 8.98 | $ | 9.37 | $ | 9.44 |
| Income from Investment Operations | | | | | | | | | | |
Net investment income (loss) A,B | | .488 | | .507 | | .438 | | .437 | | .501 |
| Net realized and unrealized gain (loss) | | .133 | | .283 | | (1.468) | | (.428) | | (.119) |
| Total from investment operations | | .621 | | .790 | | (1.030) | | .009 | | .382 |
| Distributions from net investment income | | (.451) | | (.460) | | (.410) | | (.399) | | (.452) |
| Total distributions | | (.451) | | (.460) | | (.410) | | (.399) | | (.452) |
| Net asset value, end of period | $ | 8.04 | $ | 7.87 | $ | 7.54 | $ | 8.98 | $ | 9.37 |
Total Return C | | | | 10.91% | | (11.47)% | | .11% | | 4.42% |
Ratios to Average Net Assets B,D,E | | | | | | | | | | |
| Expenses before reductions | | .01% | | .02% | | -% F | | -% F | | -% F |
| Expenses net of fee waivers, if any | | | | .02% | | -% F | | -% F | | -% F |
| Expenses net of all reductions | | .01% | | .02% | | -% F | | -% F | | -% F |
| Net investment income (loss) | | 6.10% | | 6.72% | | 5.58% | | 4.77% | | 5.59% |
| Supplemental Data | | | | | | | | | | |
| Net assets, end of period (000 omitted) | $ | 2,228,303 | $ | 2,139,452 | $ | 2,172,251 | $ | 2,751,450 | $ | 2,751,759 |
Portfolio turnover rate G | | | | 21% | | 22% | | 32% | | 89% |
ACalculated based on average shares outstanding during the period.
BNet investment income (loss) is affected by the timing of the declaration of dividends by any underlying mutual funds or exchange-traded funds (ETFs). Net investment income (loss) of any mutual funds or ETFs is not included in the Fund's net investment income (loss) ratio.
CTotal returns would have been lower if certain expenses had not been reduced during the applicable periods shown.
DFees and expenses of any underlying mutual funds or exchange-traded funds (ETFs) are not included in the Fund's expense ratio. The Fund indirectly bears its proportionate share of these expenses. For additional expense information related to investments in Fidelity Central Funds, please refer to the "Investments in Fidelity Central Funds" note found in the Notes to Financial Statements section of the most recent Annual or Semi-Annual report.
EExpense ratios reflect operating expenses of the class. Expenses before reductions do not reflect amounts reimbursed, waived, or reduced through arrangements with the investment adviser, brokerage services, or other offset arrangements, if applicable, and do not represent the amount paid by the class during periods when reimbursements, waivers or reductions occur.
FAmount represents less than .005%.
GAmount does not include the portfolio activity of any underlying mutual funds or exchange-traded funds (ETFs), derivatives or securities that mature within one year from acquisition.
HPortfolio turnover rate excludes securities received or delivered in-kind.
Fidelity® Emerging Markets Debt Local Currency Central Fund
Schedule of Investments December 31, 2024
Showing Percentage of Net Assets
| Foreign Government and Government Agency Obligations - 80.4% |
| | | Principal Amount (a) | Value ($) |
| BRAZIL - 7.4% | | | |
| Brazilian Federative Republic Treasury Bills 0% 1/1/2026 (b) | BRL | 35,325,000 | 4,949,829 |
| Brazilian Federative Republic Treasury Bills 0% 1/1/2030 (b) | BRL | 12,250,000 | 959,258 |
| Brazilian Federative Republic Treasury Bills 0% 7/1/2026 (b) | BRL | 27,750,000 | 3,603,111 |
| Brazilian Federative Republic Treasury Bills 0% 7/1/2027 (b) | BRL | 5,000,000 | 559,875 |
| Brazilian Federative Republic Treasury Bills 0% 7/1/2028 (b) | BRL | 6,500,000 | 629,519 |
| Brazilian Federative Republic Treasury Notes 10% 1/1/2027 | BRL | 30,750,000 | 4,516,614 |
| Brazilian Federative Republic Treasury Notes 10% 1/1/2029 | BRL | 23,000,000 | 3,128,729 |
| Brazilian Federative Republic Treasury Notes 10% 1/1/2031 | BRL | 4,750,000 | 612,571 |
| Brazilian Federative Republic Treasury Notes 10% 1/1/2035 | BRL | 3,750,000 | 455,116 |
TOTAL BRAZIL | | | 19,414,622 |
| CHILE - 1.3% | | | |
| Chilean Republic 4.7% 9/1/2030 (c)(d) | CLP | 975,000,000 | 925,849 |
| Chilean Republic 5% 3/1/2035 | CLP | 555,000,000 | 518,724 |
| Chilean Republic 6% 1/1/2043 | CLP | 225,000,000 | 233,227 |
| Chilean Republic 6% 4/1/2033 (c)(d) | CLP | 1,775,000,000 | 1,796,846 |
TOTAL CHILE | | | 3,474,646 |
| CHINA - 4.7% | | | |
| Peoples Republic of China 2.04% 11/25/2034 | CNY | 5,000,000 | 706,745 |
| Peoples Republic of China 2.57% 5/20/2054 | CNY | 5,000,000 | 775,453 |
| Peoples Republic of China 2.68% 5/21/2030 | CNY | 24,250,000 | 3,521,428 |
| Peoples Republic of China 2.88% 2/25/2033 | CNY | 19,750,000 | 2,949,519 |
| Peoples Republic of China 3.12% 10/25/2052 | CNY | 7,500,000 | 1,268,840 |
| Peoples Republic of China 3.81% 9/14/2050 | CNY | 16,550,000 | 3,074,933 |
TOTAL CHINA | | | 12,296,918 |
| COLOMBIA - 3.4% | | | |
| Colombian Republic 5.75% 11/3/2027 | COP | 3,350,000,000 | 682,132 |
| Colombian Republic 6% 4/28/2028 | COP | 1,000,000,000 | 199,232 |
| Colombian Republic 7% 3/26/2031 | COP | 3,250,000,000 | 598,788 |
| Colombian Republic 7% 6/30/2032 | COP | 18,800,000,000 | 3,312,876 |
| Colombian Republic 7.25% 10/18/2034 | COP | 8,000,000,000 | 1,337,493 |
| Colombian Republic 7.25% 10/26/2050 | COP | 1,650,000,000 | 221,012 |
| Colombian Republic 7.5% 8/26/2026 | COP | 3,755,000,000 | 827,701 |
| Colombian Republic 9.25% 5/28/2042 | COP | 10,375,000,000 | 1,807,631 |
TOTAL COLOMBIA | | | 8,986,865 |
| CZECH REPUBLIC - 3.9% | | | |
| Czech Republic 0.95% 5/15/2030 (c) | CZK | 64,250,000 | 2,268,591 |
| Czech Republic 1.2% 3/13/2031 | CZK | 119,630,000 | 4,174,795 |
| Czech Republic 1.5% 4/24/2040 | CZK | 12,000,000 | 335,401 |
| Czech Republic 1.95% 7/30/2037 | CZK | 28,000,000 | 884,832 |
| Czech Republic 2% 10/13/2033 | CZK | 56,750,000 | 1,963,402 |
| Czech Republic 2.75% 7/23/2029 | CZK | 17,500,000 | 685,842 |
TOTAL CZECH REPUBLIC | | | 10,312,863 |
| DOMINICAN REPUBLIC - 0.7% | | | |
| Dominican Republic International Bond 10.75% 6/1/2036 (c) | DOP | 54,800,000 | 965,373 |
| Dominican Republic International Bond 13.625% 2/3/2033 (d) | DOP | 17,000,000 | 334,037 |
| Dominican Republic International Bond 9.75% 6/5/2026 (c) | DOP | 40,000,000 | 655,355 |
TOTAL DOMINICAN REPUBLIC | | | 1,954,765 |
| EGYPT - 1.1% | | | |
| Arab Republic of Egypt 14.556% 10/13/2027 | EGP | 7,000,000 | 108,859 |
| Arab Republic of Egypt 16.1% 5/7/2029 | EGP | 2,500,000 | 38,893 |
| Arab Republic of Egypt Treasury Bills 0% 2/18/2025 (b) | EGP | 68,050,000 | 1,284,189 |
| Arab Republic of Egypt Treasury Bills 0% 4/22/2025 (b) | EGP | 34,500,000 | 627,101 |
| Arab Republic of Egypt Treasury Bills 0% 4/29/2025 (b) | EGP | 39,450,000 | 713,631 |
TOTAL EGYPT | | | 2,772,673 |
| HUNGARY - 2.2% | | | |
| Hungary Government 2.25% 4/20/2033 | HUF | 200,000,000 | 368,120 |
| Hungary Government 2.25% 6/22/2034 | HUF | 125,000,000 | 223,048 |
| Hungary Government 2.75% 12/22/2026 | HUF | 967,000,000 | 2,282,859 |
| Hungary Government 3% 10/27/2038 | HUF | 310,000,000 | 511,774 |
| Hungary Government 3.25% 10/22/2031 | HUF | 112,500,000 | 236,406 |
| Hungary Government 4.75% 11/24/2032 | HUF | 265,000,000 | 593,139 |
| Hungary Government 6.75% 10/22/2028 | HUF | 583,000,000 | 1,481,774 |
TOTAL HUNGARY | | | 5,697,120 |
| INDIA - 2.7% | | | |
| Republic of India 6.67% 12/17/2050 | INR | 238,000,000 | 2,666,955 |
| Republic of India 7.18% 7/24/2037 | INR | 197,500,000 | 2,363,128 |
| Republic of India 7.18% 8/14/2033 | INR | 55,000,000 | 657,411 |
| Republic of India 7.3% 6/19/2053 | INR | 106,000,000 | 1,280,016 |
TOTAL INDIA | | | 6,967,510 |
| INDONESIA - 8.0% | | | |
| Indonesia Government 5.125% 4/15/2027 | IDR | 11,000,000,000 | 657,130 |
| Indonesia Government 6.375% 4/15/2032 | IDR | 43,000,000,000 | 2,566,107 |
| Indonesia Government 6.5% 2/15/2031 | IDR | 49,500,000,000 | 2,997,734 |
| Indonesia Government 6.5% 6/15/2025 | IDR | 15,750,000,000 | 976,999 |
| Indonesia Government 6.625% 2/15/2034 | IDR | 44,750,000,000 | 2,703,265 |
| Indonesia Government 7.125% 6/15/2038 | IDR | 24,000,000,000 | 1,494,725 |
| Indonesia Government 7.125% 6/15/2042 | IDR | 7,500,000,000 | 464,818 |
| Indonesia Government 7.125% 6/15/2043 | IDR | 14,100,000,000 | 875,610 |
| Indonesia Government 7.5% 4/15/2040 | IDR | 21,700,000,000 | 1,394,085 |
| Indonesia Government 7.5% 8/15/2032 | IDR | 8,000,000,000 | 507,984 |
| Indonesia Government 8.25% 5/15/2029 | IDR | 25,500,000,000 | 1,654,846 |
| Indonesia Government 8.25% 5/15/2036 | IDR | 250,000,000 | 16,837 |
| Indonesia Government 8.375% 3/15/2034 | IDR | 33,300,000,000 | 2,244,828 |
| Indonesia Government 8.375% 4/15/2039 | IDR | 19,750,000,000 | 1,358,388 |
| Indonesia Government 8.375% 9/15/2026 | IDR | 18,400,000,000 | 1,166,234 |
TOTAL INDONESIA | | | 21,079,590 |
| MALAYSIA - 9.6% | | | |
| Malaysia Government 3.502% 5/31/2027 | MYR | 6,000,000 | 1,342,248 |
| Malaysia Government 3.519% 4/20/2028 | MYR | 28,000,000 | 6,251,549 |
| Malaysia Government 3.582% 7/15/2032 | MYR | 13,500,000 | 2,972,325 |
| Malaysia Government 3.757% 5/22/2040 | MYR | 5,500,000 | 1,190,111 |
| Malaysia Government 3.828% 7/5/2034 | MYR | 650,000 | 145,284 |
| Malaysia Government 3.885% 8/15/2029 | MYR | 11,175,000 | 2,526,077 |
| Malaysia Government 3.906% 7/15/2026 | MYR | 6,500,000 | 1,464,641 |
| Malaysia Government 4.065% 6/15/2050 | MYR | 7,250,000 | 1,593,233 |
| Malaysia Government 4.18% 5/16/2044 | MYR | 3,000,000 | 680,409 |
| Malaysia Government 4.457% 3/31/2053 | MYR | 3,250,000 | 757,163 |
| Malaysia Government 4.504% 4/30/2029 | MYR | 6,500,000 | 1,504,587 |
| Malaysia Government 4.642% 11/7/2033 | MYR | 3,000,000 | 710,547 |
| Malaysia Government 4.696% 10/15/2042 | MYR | 1,550,000 | 372,710 |
| Malaysia Government 4.736% 3/15/2046 | MYR | 3,250,000 | 790,386 |
| Malaysia Government 4.762% 4/7/2037 | MYR | 8,250,000 | 1,990,775 |
| Malaysia Government 4.893% 6/8/2038 | MYR | 4,000,000 | 976,254 |
TOTAL MALAYSIA | | | 25,268,299 |
| MEXICO - 9.4% | | | |
| United Mexican States 10% 11/20/2036 | MXN | 5,000,000 | 233,169 |
| United Mexican States 5.75% 3/5/2026 | MXN | 102,500,000 | 4,697,593 |
| United Mexican States 7.5% 5/26/2033 | MXN | 72,500,000 | 2,947,540 |
| United Mexican States 7.5% 6/3/2027 | MXN | 51,250,000 | 2,336,458 |
| United Mexican States 7.75% 11/13/2042 | MXN | 94,500,000 | 3,472,153 |
| United Mexican States 7.75% 11/23/2034 | MXN | 66,250,000 | 2,657,649 |
| United Mexican States 8% 7/31/2053 | MXN | 48,750,000 | 1,761,930 |
| United Mexican States 8.5% 11/18/2038 | MXN | 16,000,000 | 653,578 |
| United Mexican States 8.5% 5/31/2029 | MXN | 130,500,000 | 5,933,585 |
TOTAL MEXICO | | | 24,693,655 |
| PERU - 2.1% | | | |
| Peruvian Republic 5.35% 8/12/2040 | PEN | 1,850,000 | 413,545 |
| Peruvian Republic 5.4% 8/12/2034 | PEN | 6,350,000 | 1,541,548 |
| Peruvian Republic 5.94% 2/12/2029 | PEN | 2,250,000 | 617,648 |
| Peruvian Republic 6.15% 8/12/2032 | PEN | 2,500,000 | 659,703 |
| Peruvian Republic 6.9% 8/12/2037 | PEN | 3,750,000 | 992,384 |
| Peruvian Republic 6.95% 8/12/2031 | PEN | 1,750,000 | 489,958 |
| Peruvian Republic 7.3% 8/12/2033 (c)(d) | PEN | 2,750,000 | 770,273 |
TOTAL PERU | | | 5,485,059 |
| POLAND - 4.6% | | | |
| Republic of Poland 0.25% 10/25/2026 | PLN | 1,250,000 | 277,678 |
| Republic of Poland 1.25% 10/25/2030 | PLN | 6,800,000 | 1,297,301 |
| Republic of Poland 1.75% 4/25/2032 | PLN | 11,000,000 | 2,036,639 |
| Republic of Poland 2.75% 10/25/2029 | PLN | 14,200,000 | 3,043,346 |
| Republic of Poland 2.75% 4/25/2028 | PLN | 5,750,000 | 1,284,603 |
| Republic of Poland 4.75% 7/25/2029 | PLN | 5,250,000 | 1,230,894 |
| Republic of Poland 5% 10/25/2034 | PLN | 3,750,000 | 848,376 |
| Republic of Poland 6% 10/25/2033 | PLN | 8,250,000 | 2,015,614 |
TOTAL POLAND | | | 12,034,451 |
| ROMANIA - 4.2% | | | |
| Romanian Republic 3.25% 6/24/2026 | RON | 14,750,000 | 2,909,741 |
| Romanian Republic 3.65% 9/24/2031 | RON | 6,000,000 | 1,010,007 |
| Romanian Republic 4.25% 4/28/2036 | RON | 2,000,000 | 317,305 |
| Romanian Republic 4.75% 10/11/2034 | RON | 2,000,000 | 342,477 |
| Romanian Republic 5% 2/12/2029 | RON | 24,150,000 | 4,641,846 |
| Romanian Republic 5.8% 7/26/2027 | RON | 3,250,000 | 654,934 |
| Romanian Republic 6.7% 2/25/2032 | RON | 1,250,000 | 251,041 |
| Romanian Republic 7.2% 10/30/2033 | RON | 4,250,000 | 873,147 |
TOTAL ROMANIA | | | 11,000,498 |
| SOUTH AFRICA - 8.1% | | | |
| South African Republic 6.25% 3/31/2036 | ZAR | 38,500,000 | 1,469,931 |
| South African Republic 6.5% 2/28/2041 | ZAR | 31,250,000 | 1,104,553 |
| South African Republic 7% 2/28/2031 | ZAR | 88,250,000 | 4,153,297 |
| South African Republic 8% 1/31/2030 | ZAR | 133,250,000 | 6,761,337 |
| South African Republic 8.5% 1/31/2037 | ZAR | 55,000,000 | 2,472,118 |
| South African Republic 8.75% 2/28/2048 | ZAR | 63,750,000 | 2,714,981 |
| South African Republic 8.875% 2/28/2035 | ZAR | 54,500,000 | 2,627,494 |
TOTAL SOUTH AFRICA | | | 21,303,711 |
| THAILAND - 4.2% | | | |
| Kingdom of Thailand 1.585% 12/17/2035 | THB | 74,000,000 | 2,005,662 |
| Kingdom of Thailand 1.6% 6/17/2035 | THB | 37,000,000 | 1,004,555 |
| Kingdom of Thailand 2% 6/17/2042 | THB | 70,500,000 | 1,868,091 |
| Kingdom of Thailand 2.875% 6/17/2046 | THB | 9,200,000 | 274,406 |
| Kingdom of Thailand 3.3% 6/17/2038 | THB | 75,000,000 | 2,384,011 |
| Kingdom of Thailand 3.39% 6/17/2037 | THB | 45,000,000 | 1,442,726 |
| Kingdom of Thailand 3.45% 6/17/2043 | THB | 65,000,000 | 2,111,766 |
TOTAL THAILAND | | | 11,091,217 |
| TURKEY - 2.4% | | | |
| Turkish Republic 0% 4/9/2025 (b) | TRY | 27,000,000 | 687,856 |
| Turkish Republic 10.5% 8/11/2027 | TRY | 15,250,000 | 271,186 |
| Turkish Republic 12.6% 10/1/2025 | TRY | 44,000,000 | 1,041,333 |
| Turkish Republic 17.3% 7/19/2028 | TRY | 25,000,000 | 502,435 |
| Turkish Republic 17.8% 7/13/2033 | TRY | 18,000,000 | 356,982 |
| Turkish Republic 26.2% 10/5/2033 | TRY | 37,500,000 | 1,030,623 |
| Turkish Republic 30% 9/12/2029 | TRY | 13,500,000 | 373,410 |
| Turkish Republic 31.08% 11/8/2028 | TRY | 47,750,000 | 1,334,686 |
| Turkish Republic 36% 8/12/2026 | TRY | 22,000,000 | 611,707 |
TOTAL TURKEY | | | 6,210,218 |
| URUGUAY - 0.4% | | | |
| Uruguay Republic 8.25% 5/21/2031 | UYU | 6,500,000 | 138,199 |
| Uruguay Republic 8.5% 3/15/2028 (c) | UYU | 35,825,000 | 801,478 |
| Uruguay Republic 9.75% 7/20/2033 | UYU | 3,680,820 | 84,222 |
TOTAL URUGUAY | | | 1,023,899 |
| TOTAL FOREIGN GOVERNMENT AND GOVERNMENT AGENCY OBLIGATIONS (Cost $223,233,191) | | | 211,068,579 |
| | | | |
| Non-Convertible Corporate Bonds - 3.3% |
| | | Principal Amount (a) | Value ($) |
| MULTI-NATIONAL - 3.3% | | | |
| Financials - 3.3% | | | |
| Banks - 2.6% | | | |
| Corp Andina de Fomento 7.65% 3/5/2031 (c) | INR | 95,000,000 | 1,091,460 |
| European Bank for Reconstruction & Development 6.25% 4/11/2028 | INR | 107,000,000 | 1,218,194 |
| Inter-American Development Bank 5.1% 11/17/2026 | IDR | 5,000,000,000 | 300,913 |
| Inter-American Development Bank 7% 1/25/2029 | INR | 105,000,000 | 1,217,306 |
| Inter-American Development Bank 7% 8/8/2033 | INR | 56,000,000 | 652,240 |
| Inter-American Development Bank 7.35% 10/6/2030 | INR | 205,000,000 | 2,413,751 |
| | | | 6,893,864 |
| Capital Markets - 0.2% | | | |
| Asian Infrastructure Investment Bank/The 6.65% 6/30/2033 (c) | INR | 45,000,000 | 509,998 |
| Financial Services - 0.5% | | | |
| International Bank for Reconstruction & Development 7.05% 7/22/2029 | INR | 115,500,000 | 1,342,419 |
TOTAL FINANCIALS | | | 8,746,281 |
| | | | |
| TOTAL NON-CONVERTIBLE CORPORATE BONDS (Cost $9,087,670) | | | 8,746,281 |
| | | | |
| U.S. Treasury Obligations - 0.5% |
| | | Yield (%) (e) | Principal Amount (a) | Value ($) |
US Treasury Bills 0% 5/15/2025 (Cost $1,338,295) | | 4.38 | 1,360,000 | 1,339,200 |
| | | | | |
| Money Market Funds - 14.1% |
| | | Yield (%) | Shares | Value ($) |
Fidelity Cash Central Fund (f) (Cost $37,039,861) | | 4.36 | 37,032,454 | 37,039,861 |
| | | | | |
| TOTAL INVESTMENT IN SECURITIES - 98.3% (Cost $270,699,017) | 258,193,921 |
NET OTHER ASSETS (LIABILITIES) - 1.7% | 4,430,060 |
| NET ASSETS - 100.0% | 262,623,981 |
| | |
| Forward Foreign Currency Contracts |
Currency Purchased
| Currency Sold | Counterparty | Settlement Date | Unrealized Appreciation/ (Depreciation) ($) |
| | | | | | | |
| HUF | 25,707,000 | USD | 64,844 | Brown Brothers Harriman & Co | 2/18/25 | (275) |
| MXN | 17,824,000 | USD | 852,205 | Brown Brothers Harriman & Co | 2/18/25 | (4,087) |
| USD | 1,161,500 | PLN | 4,781,000 | Canadian Imperial Bank of Commerce | 2/18/25 | 5,823 |
| ZAR | 15,469,000 | USD | 849,072 | Canadian Imperial Bank of Commerce | 2/18/25 | (32,860) |
| USD | 977,144 | CZK | 23,316,000 | Citibank NA | 2/18/25 | 18,014 |
| USD | 655,436 | ZAR | 11,791,000 | Citibank NA | 2/18/25 | 33,291 |
| PLN | 3,144,000 | USD | 773,126 | JPMorgan Chase Bank NA | 2/18/25 | (13,149) |
| COP | 5,114,400,000 | USD | 1,157,104 | Goldman Sachs Bank USA | 2/18/25 | (3,495) |
| EGP | 35,580,000 | USD | 638,206 | Goldman Sachs Bank USA | 3/13/25 | 43,012 |
| IDR | 10,515,500,000 | USD | 647,068 | Royal Bank of Canada | 2/18/25 | 5,198 |
| INR | 162,364,000 | USD | 1,911,852 | State Street Bank & Trust Co | 2/18/25 | (22,918) |
| USD | 729,791 | INR | 62,149,000 | State Street Bank & Trust Co | 2/18/25 | 6,753 |
| USD | 234,194 | MYR | 1,052,000 | State Street Bank & Trust Co | 2/18/25 | (1,480) |
| COP | 9,078,700,000 | USD | 2,074,183 | BNP Paribas SA | 2/18/25 | (26,383) |
| IDR | 58,189,300,000 | USD | 3,637,968 | BNP Paribas SA | 2/18/25 | (28,544) |
| USD | 543,676 | CNY | 3,918,000 | BNP Paribas SA | 2/18/25 | 5,091 |
| USD | 289,786 | CZK | 7,008,000 | BNP Paribas SA | 2/18/25 | 1,504 |
| BRL | 4,325,000 | USD | 714,286 | Bank of America NA | 2/18/25 | (20,275) |
| USD | 702,880 | TRY | 26,536,000 | Citibank NA | 2/18/25 | (14,079) |
| ZAR | 17,738,000 | USD | 967,662 | Citibank NA | 2/18/25 | (31,727) |
| THB | 23,371,000 | USD | 674,644 | JPMorgan Chase Bank NA | 2/18/25 | 8,038 |
| USD | 695,679 | PLN | 2,836,000 | JPMorgan Chase Bank NA | 2/18/25 | 10,153 |
| PLN | 2,914,000 | USD | 714,778 | Goldman Sachs Bank USA | 2/18/25 | (10,397) |
| PEN | 1,491,000 | USD | 401,130 | Royal Bank of Canada | 2/18/25 | (4,939) |
| USD | 670,700 | SGD | 900,000 | Royal Bank of Canada | 2/18/25 | 10,429 |
| CZK | 16,504,000 | USD | 686,289 | Bank of America NA | 2/18/25 | (7,378) |
| SGD | 1,802,000 | USD | 1,327,688 | Bank of America NA | 2/18/25 | (5,678) |
| TRY | 23,613,000 | USD | 627,115 | Bank of America NA | 2/18/25 | 10,869 |
| USD | 1,110,501 | COP | 5,033,900,000 | Bank of America NA | 2/18/25 | (24,951) |
| USD | 1,315,478 | TRY | 50,371,000 | Bank of America NA | 2/18/25 | (45,463) |
| ZAR | 8,716,000 | USD | 479,566 | Bank of America NA | 2/18/25 | (19,672) |
| CNY | 82,769,000 | USD | 11,537,357 | Goldman Sachs Bank USA | 2/18/25 | (159,586) |
| SGD | 904,000 | USD | 676,239 | Goldman Sachs Bank USA | 2/18/25 | (13,033) |
| USD | 2,736,632 | BRL | 17,145,000 | Goldman Sachs Bank USA | 2/18/25 | (14,538) |
| MXN | 5,887,000 | USD | 281,819 | State Street Bank & Trust Co | 2/18/25 | (1,698) |
| CZK | 32,721,000 | USD | 1,381,105 | BNP Paribas SA | 2/18/25 | (35,089) |
| USD | 84,912 | RON | 407,000 | BNP Paribas SA | 2/18/25 | 424 |
| USD | 4,793,563 | CNY | 34,703,000 | Bank of America NA | 2/18/25 | 23,144 |
| USD | 1,101,984 | HUF | 433,315,000 | Bank of America NA | 2/18/25 | 13,628 |
| USD | 392,927 | PEN | 1,491,000 | Bank of America NA | 2/18/25 | (3,264) |
| HUF | 283,859,000 | USD | 720,096 | Canadian Imperial Bank of Commerce | 2/18/25 | (7,128) |
| PLN | 2,694,000 | USD | 655,732 | Canadian Imperial Bank of Commerce | 2/18/25 | (4,531) |
| TRY | 51,053,000 | USD | 1,355,627 | Citibank NA | 2/18/25 | 23,741 |
| USD | 599,163 | CNY | 4,293,000 | Citibank NA | 2/18/25 | 9,029 |
| USD | 907,720 | COP | 4,044,800,000 | Citibank NA | 2/18/25 | (4,629) |
| THB | 30,000,000 | USD | 875,495 | JPMorgan Chase Bank NA | 2/18/25 | 824 |
| USD | 778,594 | THB | 26,562,000 | JPMorgan Chase Bank NA | 2/18/25 | 2,701 |
| USD | 689,323 | BRL | 4,216,000 | BNP Paribas SA | 2/18/25 | 12,803 |
| USD | 1,215,077 | INR | 103,318,000 | BNP Paribas SA | 2/18/25 | 13,081 |
| USD | 728,577 | PLN | 3,000,000 | Bank of America NA | 2/18/25 | 3,408 |
| USD | 766,690 | ZAR | 14,057,000 | Brown Brothers Harriman & Co | 2/18/25 | 24,981 |
| USD | 447,534 | HUF | 172,976,000 | Canadian Imperial Bank of Commerce | 2/18/25 | 13,071 |
| SGD | 896,000 | USD | 670,721 | Citibank NA | 2/18/25 | (13,384) |
| USD | 2,666,523 | INR | 229,437,000 | Citibank NA | 2/18/25 | (2,733) |
| USD | 557,562 | THB | 18,778,000 | JPMorgan Chase Bank NA | 2/18/25 | 9,045 |
| USD | 643,966 | THB | 22,278,000 | JPMorgan Chase Bank NA | 2/18/25 | (6,788) |
| USD | 1,332,797 | INR | 113,581,000 | Goldman Sachs Bank USA | 2/18/25 | 11,403 |
| PLN | 12,762,000 | USD | 3,158,058 | BNP Paribas SA | 2/18/25 | (73,191) |
| RON | 10,116,000 | USD | 2,138,196 | BNP Paribas SA | 2/18/25 | (38,247) |
| HUF | 296,725,000 | USD | 758,594 | Bank of America NA | 2/18/25 | (13,310) |
| USD | 2,382,461 | BRL | 13,991,000 | Bank of America NA | 2/18/25 | 137,397 |
| USD | 694,707 | PLN | 2,854,000 | Bank of America NA | 2/18/25 | 4,830 |
| USD | 1,421,242 | EGP | 74,601,000 | Citibank NA | 2/18/25 | (19,133) |
| PLN | 3,102,000 | USD | 760,471 | JPMorgan Chase Bank NA | 2/18/25 | (10,647) |
| THB | 456,725,000 | USD | 13,081,991 | JPMorgan Chase Bank NA | 2/18/25 | 259,224 |
| THB | 23,749,000 | USD | 688,277 | JPMorgan Chase Bank NA | 2/18/25 | 5,446 |
| THB | 22,265,000 | USD | 662,638 | JPMorgan Chase Bank NA | 2/18/25 | (12,264) |
| CLP | 1,127,186,000 | USD | 1,155,496 | Bank of America NA | 2/18/25 | (22,676) |
| TRY | 31,863,000 | USD | 844,510 | Bank of America NA | 2/18/25 | 16,376 |
| TRY | 8,429,000 | USD | 223,708 | Bank of America NA | 2/18/25 | 4,029 |
| USD | 671,530 | SGD | 900,000 | Brown Brothers Harriman & Co | 2/18/25 | 11,258 |
| USD | 1,376,343 | RON | 6,564,000 | JPMorgan Chase Bank NA | 2/18/25 | 13,742 |
| CNY | 9,925,000 | USD | 1,380,197 | Goldman Sachs Bank USA | 2/18/25 | (15,866) |
| CZK | 15,755,000 | USD | 661,364 | Goldman Sachs Bank USA | 2/18/25 | (13,264) |
| BRL | 3,525,000 | USD | 574,525 | Royal Bank of Canada | 2/18/25 | (8,887) |
| INR | 174,073,000 | USD | 2,053,232 | Royal Bank of Canada | 2/18/25 | (28,077) |
| IDR | 6,261,700,000 | USD | 393,719 | State Street Bank & Trust Co | 2/18/25 | (5,312) |
| INR | 54,522,000 | USD | 644,430 | State Street Bank & Trust Co | 2/18/25 | (10,124) |
| MXN | 27,576,000 | USD | 1,357,701 | Bank of America NA | 2/18/25 | (45,554) |
| PLN | 8,817,000 | USD | 2,163,271 | Bank of America NA | 2/18/25 | (32,000) |
| TRY | 37,088,000 | USD | 993,316 | Bank of America NA | 2/18/25 | 8,740 |
| PLN | 7,187,000 | USD | 1,763,660 | Canadian Imperial Bank of Commerce | 2/18/25 | (26,397) |
| PLN | 2,816,000 | USD | 687,486 | JPMorgan Chase Bank NA | 2/18/25 | (6,794) |
| USD | 671,955 | EGP | 35,580,000 | Goldman Sachs Bank USA | 3/13/25 | (9,264) |
| USD | 656,753 | MXN | 13,499,000 | Goldman Sachs Bank USA | 2/18/25 | 14,431 |
| BRL | 5,421,000 | USD | 887,903 | Royal Bank of Canada | 2/18/25 | (18,022) |
| USD | 899,276 | ZAR | 16,075,000 | State Street Bank & Trust Co | 2/18/25 | 51,088 |
| | | | | | | |
| TOTAL FORWARD FOREIGN CURRENCY CONTRACTS | | (147,161) |
| Unrealized Appreciation | | | 846,019 |
| Unrealized Depreciation | | | (993,180) |
Currency Abbreviations
| BRL | - | Brazilian Real |
| CLP | - | Chilean Peso |
| CNY | - | Chinese (Peoples Rep) Yuan |
| COP | - | Colombian Peso |
| CZK | - | Czech Koruna |
| DOP | - | Dominican Republic Peso |
| EGP | - | Egyptian Pound |
| HUF | - | Hungarian Forint |
| IDR | - | Indonesia Rupiatt |
| INR | - | Indian Rupee |
| MXN | - | Mexican Peso |
| MYR | - | Malaysian Ringet |
| PEN | - | Peruvian New Sol |
| PLN | - | Polish Zloty |
| RON | - | Romanian Leu |
| SGD | - | Singapore Dollar |
| THB | - | Thailand Baht |
| TRY | - | New Turkish Lira |
| USD | - | United States Dollar |
| UYU | - | Uruguay Peso |
| ZAR | - | South African Rand |
Legend
| (a) | Amount is stated in United States dollars unless otherwise noted. |
| (b) | Security initially issued in zero coupon form which converts to coupon form at a specified rate and date. The rate shown is the rate at period end. |
| (c) | Security is exempt from registration under Regulation S of the Securities Act of 1933 and may be resold to qualified foreign investors outside of the United States. At the end of the period, the value of securities amounted to $9,785,223 or 3.7% of net assets. |
| (d) | Security exempt from registration under Rule 144A of the Securities Act of 1933. These securities may be resold in transactions exempt from registration, normally to qualified institutional buyers. At the end of the period, the value of these securities amounted to $3,827,005 or 1.5% of net assets. |
| (e) | Yield represents either the annualized yield at the date of purchase, or the stated coupon rate, or, for floating and adjustable rate securities, the rate at period end. |
| (f) | Affiliated fund that is generally available only to investment companies and other accounts managed by Fidelity Investments. The rate quoted is the annualized seven-day yield of the fund at period end. A complete unaudited listing of the fund's holdings as of its most recent quarter end is available upon request. In addition, each Fidelity Central Fund's financial statements, which are not covered by the Fund's Report of Independent Registered Public Accounting Firm, are available on the SEC's website or upon request. |
Affiliated Central Funds
Fiscal year to date information regarding the Fund's investments in Fidelity Central Funds, including the ownership percentage, is presented below.
| Affiliate | Value, beginning of period ($) | Purchases ($) | Sales Proceeds ($) | Dividend Income ($) | Realized Gain (loss) ($) | Change in Unrealized appreciation (depreciation) ($) | Value, end of period ($) | Shares, end of period | % ownership, end of period |
| Fidelity Cash Central Fund | 40,241,620 | 132,257,872 | 135,459,631 | 1,604,767 | - | - | 37,039,861 | 37,032,454 | 0.1% |
| Total | 40,241,620 | 132,257,872 | 135,459,631 | 1,604,767 | - | - | 37,039,861 | 37,032,454 | |
| | | | | | | | | | |
Amounts in the dividend income column in the above table include any capital gain distributions from underlying funds, which are presented in the corresponding line item in the Statement of Operations, if applicable.
Amounts included in the purchases and sales proceeds columns may include in-kind transactions, if applicable.
Investment Valuation
The following is a summary of the inputs used, as of December 31, 2024, involving the Fund's assets and liabilities carried at fair value. The inputs or methodology used for valuing securities may not be an indication of the risk associated with investing in those securities. For more information on valuation inputs, and their aggregation into the levels used below, please refer to the Investment Valuation section in the accompanying Notes to Financial Statements.
| Valuation Inputs at Reporting Date: |
| Description | Total ($) | Level 1 ($) | Level 2 ($) | Level 3 ($) |
Investments in Securities: | | | | |
|
| Foreign Government and Government Agency Obligations | 211,068,579 | - | 211,068,579 | - |
|
| Non-Convertible Corporate Bonds | | | | |
Financials | 8,746,281 | - | 8,746,281 | - |
|
| U.S. Treasury Obligations | 1,339,200 | - | 1,339,200 | - |
|
| Money Market Funds | 37,039,861 | 37,039,861 | - | - |
| Total Investments in Securities: | 258,193,921 | 37,039,861 | 221,154,060 | - |
Derivative Instruments: Assets | | | | |
Forward Foreign Currency Contracts | 846,019 | - | 846,019 | - |
| Total Assets | 846,019 | - | 846,019 | - |
| Liabilities | | | | |
Forward Foreign Currency Contracts | (993,180) | - | (993,180) | - |
| Total Liabilities | (993,180) | - | (993,180) | - |
| Total Derivative Instruments: | (147,161) | - | (147,161) | - |
Value of Derivative Instruments
The following table is a summary of the Fund's value of derivative instruments by primary risk exposure as of December 31, 2024. For additional information on derivative instruments, please refer to the Derivative Instruments section in the accompanying Notes to Financial Statements.
Primary Risk Exposure / Derivative Type | Value |
| Asset ($) | Liability ($) |
| Foreign Exchange Risk | | |
Forward Foreign Currency Contracts (a) | 846,019 | (993,180) |
| Total Foreign Exchange Risk | 846,019 | (993,180) |
| Total Value of Derivatives | 846,019 | (993,180) |
(a)Gross value is presented in the Statement of Assets and Liabilities in the unrealized appreciation/depreciation on forward foreign currency contracts line-items.
Fidelity® Emerging Markets Debt Local Currency Central Fund
Financial Statements
| Statement of Assets and Liabilities |
As of December 31, 2024 |
| Assets | | | | |
| Investment in securities, at value - See accompanying schedule: | | | | |
Unaffiliated issuers (cost $233,659,156) | $ | 221,154,060 | | |
Fidelity Central Funds (cost $37,039,861) | | 37,039,861 | | |
| | | | | |
| | | | | |
| Total Investment in Securities (cost $270,699,017) | | | $ | 258,193,921 |
| Foreign currency held at value (cost $275,107) | | | | 239,337 |
| Unrealized appreciation on forward foreign currency contracts | | | | 846,019 |
| Interest receivable | | | | 4,266,314 |
| Distributions receivable from Fidelity Central Funds | | | | 109,109 |
Total assets | | | | 263,654,700 |
| Liabilities | | | | |
| Unrealized depreciation on forward foreign currency contracts | $ | 993,180 | | |
| Other payables and accrued expenses | | 37,539 | | |
| Total liabilities | | | | 1,030,719 |
| Net Assets | | | $ | 262,623,981 |
| Net Assets consist of: | | | | |
| Paid in capital | | | $ | 290,270,004 |
| Total accumulated earnings (loss) | | | | (27,646,023) |
| Net Assets | | | $ | 262,623,981 |
Net Asset Value, offering price and redemption price per share ($262,623,981 ÷ 3,196,673 shares) | | | $ | 82.16 |
| Statement of Operations |
| Year ended December 31, 2024 |
| Investment Income | | | | |
| Interest | | | $ | 18,183,255 |
| Income from Fidelity Central Funds | | | | 1,604,767 |
| Income before foreign taxes withheld | | | $ | 19,788,022 |
| Less foreign taxes withheld | | | | (227,281) |
| Total income | | | | 19,560,741 |
| Expenses | | | | |
| Custodian fees and expenses | $ | 47,261 | | |
| Independent trustees' fees and expenses | | 1,219 | | |
| Miscellaneous | | 258 | | |
| Total expenses before reductions | | 48,738 | | |
| Expense reductions | | (2,135) | | |
| Total expenses after reductions | | | | 46,603 |
| Net Investment income (loss) | | | | 19,514,138 |
| Realized and Unrealized Gain (Loss) | | | | |
| Net realized gain (loss) on: | | | | |
| Investment Securities: | | | | |
| Unaffiliated issuers (net of foreign taxes of $28,129) | | (2,624,054) | | |
| Forward foreign currency contracts | | (1,073,819) | | |
| Foreign currency transactions | | (328,628) | | |
| Total net realized gain (loss) | | | | (4,026,501) |
| Change in net unrealized appreciation (depreciation) on: | | | | |
| Investment Securities: | | | | |
| Unaffiliated issuers (net of decrease in deferred foreign taxes of $47,370) | | (21,864,692) | | |
| Forward foreign currency contracts | | (608,940) | | |
| Assets and liabilities in foreign currencies | | (285,075) | | |
| Total change in net unrealized appreciation (depreciation) | | | | (22,758,707) |
| Net gain (loss) | | | | (26,785,208) |
| Net increase (decrease) in net assets resulting from operations | | | $ | (7,271,070) |
| Statement of Changes in Net Assets |
| |
| | Year ended December 31, 2024 | | Year ended December 31, 2023 |
| Increase (Decrease) in Net Assets | | | | |
| Operations | | | | |
| Net investment income (loss) | $ | 19,514,138 | $ | 17,805,607 |
| Net realized gain (loss) | | (4,026,501) | | (3,398,908) |
| Change in net unrealized appreciation (depreciation) | | (22,758,707) | | 15,584,531 |
| Net increase (decrease) in net assets resulting from operations | | (7,271,070) | | 29,991,230 |
| Distributions to shareholders | | (19,417,582) | | (17,272,974) |
| Distributions to shareholders from tax return of capital | | (37,131) | | - |
| | | | | |
| Total Distributions | | (19,454,713) | | (17,272,974) |
| Affiliated share transactions | | | | |
| Proceeds from sales of shares | | 53,164 | | 182,001,326 |
| Reinvestment of distributions | | 19,454,713 | | 17,272,974 |
| Cost of shares redeemed | | (28,170,821) | | (788,275) |
| | | | | |
Net increase (decrease) in net assets resulting from share transactions | | (8,662,944) | | 198,486,025 |
| Total increase (decrease) in net assets | | (35,388,727) | | 211,204,281 |
| | | | | |
| Net Assets | | | | |
| Beginning of period | | 298,012,708 | | 86,808,427 |
| End of period | $ | 262,623,981 | $ | 298,012,708 |
| | | | | |
| Other Information | | | | |
| Shares | | | | |
| Sold | | 611 | | 2,082,339 |
| Issued in reinvestment of distributions | | 229,094 | | 197,058 |
| Redeemed | | (323,542) | | (8,779) |
| Net increase (decrease) | | (93,837) | | 2,270,618 |
| | | | | |
Financial Highlights
Fidelity® Emerging Markets Debt Local Currency Central Fund |
| |
| Years ended December 31, | | 2024 | | 2023 | | 2022 | | 2021 | | 2020 A |
Selected Per-Share Data | | | | | | | | | | |
| Net asset value, beginning of period | $ | 90.57 | $ | 85.12 | $ | 93.30 | $ | 108.21 | $ | 100.00 |
| Income from Investment Operations | | | | | | | | | | |
Net investment income (loss) B,C | | 6.240 | | 6.097 | | 4.389 | | 4.478 | | 1.042 |
| Net realized and unrealized gain (loss) | | (8.316) | | 4.973 | | (11.606) | | (13.557) | | 8.599 |
| Total from investment operations | | (2.076) | | 11.070 | | (7.217) | | (9.079) | | 9.641 |
| Distributions from net investment income | | (6.322) | | (5.620) | | (.963) | | (5.726) | | (1.431) |
| Distributions from net realized gain | | - | | - | | - | | (.105) | | - |
| Distributions from tax return of capital | | (.012) | | - | | - | | - | | - |
| Total distributions | | (6.334) | | (5.620) | | (.963) | | (5.831) | | (1.431) |
| Net asset value, end of period | $ | 82.16 | $ | 90.57 | $ | 85.12 | $ | 93.30 | $ | 108.21 |
Total Return D,E | | | | 13.23% | | (7.82)% | | (8.48)% | | 9.65% |
Ratios to Average Net Assets C,F,G | | | | | | | | | | |
| Expenses before reductions | | .02% | | .02% | | .02% | | .03% | | .04% H |
| Expenses net of fee waivers, if any | | | | .02% | | .02% | | .03% | | .04% H |
| Expenses net of all reductions | | .02% | | .02% | | .02% | | .03% | | .04% H |
| Net investment income (loss) | | 7.06% | | 6.80% | | 5.21% | | 4.37% | | 3.66% H |
| Supplemental Data | | | | | | | | | | |
| Net assets, end of period (000 omitted) | $ | 262,624 | $ | 298,013 | $ | 86,808 | $ | 94,140 | $ | 164,503 |
Portfolio turnover rate I | | | | 63% | | 60% | | 81% | | 30% H |
AFor the period September 23, 2020 (commencement of operations) through December 31, 2020.
BCalculated based on average shares outstanding during the period.
CNet investment income (loss) is affected by the timing of the declaration of dividends by any underlying mutual funds or exchange-traded funds (ETFs). Net investment income (loss) of any mutual funds or ETFs is not included in the Fund's net investment income (loss) ratio.
DTotal returns for periods of less than one year are not annualized.
ETotal returns would have been lower if certain expenses had not been reduced during the applicable periods shown.
FFees and expenses of any underlying mutual funds or exchange-traded funds (ETFs) are not included in the Fund's expense ratio. The Fund indirectly bears its proportionate share of these expenses. For additional expense information related to investments in Fidelity Central Funds, please refer to the "Investments in Fidelity Central Funds" note found in the Notes to Financial Statements section of the most recent Annual or Semi-Annual report.
GExpense ratios reflect operating expenses of the class. Expenses before reductions do not reflect amounts reimbursed, waived, or reduced through arrangements with the investment adviser, brokerage services, or other offset arrangements, if applicable, and do not represent the amount paid by the class during periods when reimbursements, waivers or reductions occur.
HAnnualized.
IAmount does not include the portfolio activity of any underlying mutual funds or exchange-traded funds (ETFs), derivatives or securities that mature within one year from acquisition.
Notes to Financial Statements
For the period ended December 31, 2024
1. Organization.
Fidelity Emerging Markets Debt Central Fund and Fidelity Emerging Markets Debt Local Currency Central Fund (the Funds) are funds of Fidelity Hanover Street Trust (the Trust). Each Fund is authorized to issue an unlimited number of shares. The Trust is registered under the Investment Company Act of 1940, as amended (the 1940 Act), as an open-end management investment company organized as a Massachusetts business trust. Fidelity Emerging Markets Debt Local Currency Central Fund is a non-diversified fund. Investments in emerging markets, if applicable, can be subject to social, economic, regulatory, and political uncertainties and can be extremely volatile.
2. Investments in Fidelity Central Funds.
Funds may invest in Fidelity Central Funds, which are open-end investment companies generally available only to other investment companies and accounts managed by the investment adviser and its affiliates. The Schedule of Investments lists any Fidelity Central Funds held as an investment as of period end, but does not include the underlying holdings of each Fidelity Central Fund. An investing fund indirectly bears its proportionate share of the expenses of the underlying Fidelity Central Funds.
Based on its investment objective, each Fidelity Central Fund may invest or participate in various investment vehicles or strategies that are similar to those of the investing fund. These strategies are consistent with the investment objectives of the investing fund and may involve certain economic risks which may cause a decline in value of each of the Fidelity Central Funds and thus a decline in the value of the investing fund.
| Fidelity Central Fund | Investment Manager | Investment Objective | Investment Practices | Expense RatioA |
| Fidelity Money Market Central Funds | Fidelity Management & Research Company LLC (FMR) | Each fund seeks to obtain a high level of current income consistent with the preservation of capital and liquidity. | Short-term Investments | Less than .005% |
A Expenses expressed as a percentage of average net assets and are as of each underlying Central Fund's most recent annual or semi-annual shareholder report.
A complete unaudited list of holdings for each Fidelity Central Fund is available upon request or at the Securities and Exchange Commission website at www.sec.gov. In addition, the financial statements of the Fidelity Central Funds which contain the significant accounting policies (including investment valuation policies) of those funds, and are not covered by the Report of Independent Registered Public Accounting Firm, are available on the Securities and Exchange Commission website or upon request.
3. Significant Accounting Policies.
Each Fund is an investment company and applies the accounting and reporting guidance of the Financial Accounting Standards Board (FASB) Accounting Standards Codification Topic 946 Financial Services - Investment Companies. The financial statements have been prepared in conformity with accounting principles generally accepted in the United States of America (GAAP), which require management to make certain estimates and assumptions at the date of the financial statements. Actual results could differ from those estimates. Each Fund operates as a single operating segment. Each Fund's income, expenses, assets, and performance are regularly monitored and assessed as a whole by the investment adviser and other individuals responsible for oversight functions of the Trust, using the information presented in the financial statements and financial highlights. Subsequent events, if any, through the date that the financial statements were issued have been evaluated in the preparation of the financial statements. Each Fund's Schedule of Investments lists any underlying mutual funds or exchange-traded funds (ETFs) but does not include the underlying holdings of these funds. The following summarizes the significant accounting policies of each Fund:
Investment Valuation. Investments are valued as of 4:00 p.m. Eastern time on the last calendar day of the period. The Board of Trustees (the Board) has designated each Fund's investment adviser as the valuation designee responsible for the fair valuation function and performing fair value determinations as needed. The investment adviser has established a Fair Value Committee (the Committee) to carry out the day-to-day fair valuation responsibilities and has adopted policies and procedures to govern the fair valuation process and the activities of the Committee. In accordance with these fair valuation policies and procedures, which have been approved by the Board, each Fund attempts to obtain prices from one or more third party pricing services or brokers to value its investments. When current market prices, quotations or currency exchange rates are not readily available or reliable, investments will be fair valued in good faith by the Committee, in accordance with the policies and procedures. Factors used in determining fair value vary by investment type and may include market or investment specific events, transaction data, estimated cash flows, and market observations of comparable investments. The frequency that the fair valuation procedures are used cannot be predicted and they may be utilized to a significant extent. The Committee manages each Fund's fair valuation practices and maintains the fair valuation policies and procedures. Each Fund's investment adviser reports to the Board information regarding the fair valuation process and related material matters.
Each Fund categorizes the inputs to valuation techniques used to value its investments into a disclosure hierarchy consisting of three levels as shown below:
Level 1 - unadjusted quoted prices in active markets for identical investments
Level 2 - other significant observable inputs (including quoted prices for similar investments, interest rates, prepayment speeds, etc.)
Level 3 - unobservable inputs (including the Fund's own assumptions based on the best information available)
Valuation techniques used to value each Fund's investments by major category are as follows:
Debt securities, including restricted securities, are valued based on evaluated prices received from third party pricing services or from brokers who make markets in such securities. Corporate bonds, foreign government and government agency obligations, preferred securities, U.S. government and government agency obligations are valued by pricing services who utilize matrix pricing which considers yield or price of bonds of comparable quality, coupon, maturity and type or by broker-supplied prices. When independent prices are unavailable or unreliable, debt securities may be valued utilizing pricing methodologies which consider similar factors that would be used by third party pricing services. For foreign debt securities, when significant market or security specific events arise, valuations may be determined in good faith in accordance with procedures adopted by the Board. Debt securities are generally categorized as Level 2 in the hierarchy but may be Level 3 depending on the circumstances. The Fund invests a significant portion of its assets in below investment grade securities. The value of these securities can be more volatile due to changes in the credit quality of the issuer and is sensitive to changes in economic, market and regulatory conditions.
The U.S. dollar value of forward foreign currency contracts is determined using currency exchange rates supplied by a pricing service and are categorized as Level 2 in the hierarchy. Futures contracts are valued at the settlement price established each day by the board of trade or exchange on which they are traded and are categorized as Level 1 in the hierarchy. Investments in open-end mutual funds, including the Fidelity Central Funds, are valued at their closing net asset value (NAV) each business day and are categorized as Level 1 in the hierarchy.
Changes in valuation techniques may result in transfers in or out of an assigned level within the disclosure hierarchy. The aggregate value of investments by input level as of December 31, 2024 is included at the end of each Fund's Schedule of Investments.
Foreign Currency. Foreign-denominated assets, including investment securities, and liabilities are translated into U.S. dollars at the exchange rates at period end. Purchases and sales of investment securities, income and dividends received, and expenses denominated in foreign currencies are translated into U.S. dollars at the exchange rate in effect on the transaction date.
The effects of exchange rate fluctuations on investments are included with the net realized and unrealized gain (loss) on investment securities. Other foreign currency transactions resulting in realized and unrealized gain (loss) are disclosed separately.
Realized gains and losses on foreign currency transactions arise from the disposition of foreign currency, realized changes in the value of foreign currency between the trade and settlement dates on security transactions, and the difference between the amounts of dividends, interest and foreign withholding taxes recorded on transaction date and the U.S. dollar equivalent of the amounts actually received or paid. Unrealized gains and losses on assets and liabilities in foreign currencies arise from changes in the value of foreign currency, and from assets and liabilities denominated in foreign currencies, other than investments, which are held at period end.
Investment Transactions and Income. For financial reporting purposes, the Funds' investment holdings and NAV include trades executed through the end of the last business day of the period. The NAV per share for processing shareholder transactions is calculated as of the close of business of the New York Stock Exchange (NYSE), normally 4:00 p.m. Eastern time and includes trades executed through the end of the prior business day. Gains and losses on securities sold are determined on the basis of identified cost and for certain Funds include proceeds received from litigation. Commissions paid to certain brokers with whom the investment adviser, or its affiliates, places trades on behalf of a fund include an amount in addition to trade execution, which may be rebated back to a fund. Any such rebates are included in net realized gain (loss) on investments in the Statement of Operations. Dividend income is recorded on the ex-dividend date, except for certain dividends from foreign securities where the ex-dividend date may have passed, which are recorded as soon as the Funds are informed of the ex-dividend date. Non-cash dividends included in dividend income, if any, are recorded at the fair market value of the securities received. Income and capital gain distributions from Fidelity Central Funds, if any, are recorded on the ex-dividend date. Interest income is accrued as earned and includes coupon interest and amortization of premium and accretion of discount on debt securities as applicable. Paid in Kind (PIK) income is recorded at the fair market value of the securities received. Investment income is recorded net of foreign taxes withheld where recovery of such taxes is uncertain. Debt obligations may be placed on non-accrual status and related interest income may be reduced by ceasing current accruals and writing off interest receivables when the collection of all or a portion of interest has become doubtful based on consistently applied procedures. A debt obligation is removed from non-accrual status when the issuer resumes interest payments or when collectability of interest is reasonably assured. Funds may file withholding tax reclaims in certain jurisdictions to recover a portion of amounts previously withheld. Any withholding tax reclaims income is included in the Statement of Operations in foreign taxes withheld. Any receivables for withholding tax reclaims are included in the Statement of Assets and Liabilities in interest receivable.
Expenses. Expenses directly attributable to a fund are charged to that fund. Expenses attributable to more than one fund are allocated among the respective funds on the basis of relative net assets or other appropriate methods. Expenses included in the accompanying financial statements reflect the expenses of that fund and do not include any expenses associated with any underlying mutual funds or exchange-traded funds. Although not included in a fund's expenses, a fund indirectly bears its proportionate share of these expenses through the net asset value of each underlying mutual fund or exchange-traded fund. Expense estimates are accrued in the period to which they relate and adjustments are made when actual amounts are known.
Income Tax Information and Distributions to Shareholders. Each year, each Fund intends to qualify as a regulated investment company under Subchapter M of the Internal Revenue Code, including distributing substantially all of its taxable income and realized gains. As a result, no provision for U.S. Federal income taxes is required. As of December 31, 2024, each Fund did not have any unrecognized tax benefits in the financial statements; nor is each Fund aware of any tax positions for which it is reasonably possible that the total amounts of unrecognized tax benefits will significantly change in the next twelve months. Each Fund files a U.S. federal tax return, in addition to state and local tax returns as required. Each Fund's federal income tax returns are subject to examination by the Internal Revenue Service (IRS) for a period of three fiscal years after they are filed. State and local tax returns may be subject to examination for an additional fiscal year depending on the jurisdiction. Foreign taxes are provided for based on each Fund's understanding of the tax rules and rates that exist in the foreign markets in which it invests. The Fidelity Emerging Markets Debt Local Currency Central Fund is subject to a tax imposed on capital gains by certain countries in which it invests. An estimated deferred tax liability for net unrealized appreciation on the applicable securities is included in Other payables and accrued expenses on each applicable Fund's Statement of Assets and Liabilities.
Distributions are declared and recorded daily and paid monthly from net investment income. Distributions from realized gains, if any, are declared and recorded on the ex-dividend date. Income and capital gain distributions are determined in accordance with income tax regulations, which may differ from GAAP.
Capital accounts within the financial statements are adjusted for permanent book-tax differences. These adjustments have no impact on net assets or the results of operations. Capital accounts are not adjusted for temporary book-tax differences which will reverse in a subsequent period.
Book-tax differences are primarily due to futures contracts, foreign currency transactions, certain foreign taxes, market discount, redemptions in kind, capital loss carryforwards and losses deferred due to wash sales, futures transactions, and excise tax regulations.
As of period end, the cost and unrealized appreciation (depreciation) in securities, and derivatives if applicable, for federal income tax purposes were as follows for each Fund:
| | Tax cost ($) | Gross unrealized appreciation ($) | Gross unrealized depreciation ($) | Net unrealized appreciation (depreciation)($) |
Fidelity Emerging Markets Debt Central Fund | 2,349,395,953 | 78,992,982 | (234,715,565) | (155,722,583) |
Fidelity Emerging Markets Debt Local Currency Central Fund | 270,987,511 | 3,891,401 | (20,043,913) | (16,152,512) |
The tax-based components of distributable earnings as of period end were as follows for each Fund:
| | Capital loss carryforward ($) | Net unrealized appreciation (depreciation) on securities and other investments ($) |
Fidelity Emerging Markets Debt Central Fund | (318,751,658) | (155,741,618) |
Fidelity Emerging Markets Debt Local Currency Central Fund | (8,484,750) | (16,375,827) |
Capital loss carryforwards are only available to offset future capital gains of the Funds to the extent provided by regulations and may be limited. The capital loss carryforward information presented below, including any applicable limitation, is estimated as of fiscal period end and is subject to adjustment.
| | Short-term ($) | Long-term ($) | Total capital loss carryforward ($) |
Fidelity Emerging Markets Debt Central Fund | (57,829,501) | (260,922,157) | (318,751,658) |
Fidelity Emerging Markets Debt Local Currency Central Fund | (3,126,117) | (5,358,633) | (8,484,750) |
Certain of the funds intend to elect to defer to the next fiscal year ordinary losses recognized during the period November 1, 2024 to December 31, 2024. Loss deferrals are as follows:
| | Ordinary losses ($) |
Fidelity Emerging Markets Debt Local Currency Central Fund | (2,767,329) |
For the period ended December 31, 2024, Fidelity Emerging Markets Debt Local Currency Central Fund distributions exceeded the aggregate amount of taxable income and net realized gains resulting in a return of capital for tax purposes. This was due to reductions in taxable income available for distribution after certain distributions had been made.
The tax character of distributions paid was as follows:
| December 31, 2024 | | | |
| | Ordinary Income ($) | Tax Return of Capital ($) | Total ($) |
Fidelity Emerging Markets Debt Central Fund | 122,136,191 | - | 122,136,191 |
Fidelity Emerging Markets Debt Local Currency Central Fund | 19,417,582 | 37,131 | 19,545,713 |
| December 31, 2023 | | | |
| | Ordinary Income ($) | Tax Return of Capital ($) | Total ($) |
Fidelity Emerging Markets Debt Central Fund | 126,070,231 | - | 126,070,231 |
Fidelity Emerging Markets Debt Local Currency Central Fund | 17,272,974 | - | 17,272,974 |
Restricted Securities (including Private Placements). Funds may invest in securities that are subject to legal or contractual restrictions on resale. These securities generally may be resold in transactions exempt from registration or to the public if the securities are registered. Disposal of these securities may involve time-consuming negotiations and expense, and prompt sale at an acceptable price may be difficult. Information regarding restricted securities held at period end is included at the end of the Schedule of Investments, if applicable.
New Accounting Pronouncement. FASB Accounting Standards Update (ASU) 2023-07 Segment Reporting (Topic 280): Improvements to Reportable Segment Disclosures became effective in this reporting period. ASU 2023-07 enhances segment information disclosure in the notes to financial statements.
4. Derivative Instruments.
Risk Exposures and the Use of Derivative Instruments. Each Fund's investment objectives allow for various types of derivative instruments, including futures contracts and forward foreign currency contracts. Derivatives are investments whose value is primarily derived from underlying assets, indices or reference rates and may be transacted on an exchange or over-the-counter (OTC). Derivatives may involve a future commitment to buy or sell a specified asset based on specified terms, to exchange future cash flows at periodic intervals based on a notional principal amount, or for one party to make one or more payments upon the occurrence of specified events in exchange for periodic payments from the other party.
Derivatives were used to increase returns, to facilitate transactions in foreign-denominated securities and to manage exposure to certain risks as defined below. The success of any strategy involving derivatives depends on analysis of numerous economic factors, and if the strategies for investment do not work as intended, the objectives may not be achieved.
Derivatives were used to increase or decrease exposure to the following risk(s):
| | |
| Foreign Exchange Risk | Foreign exchange rate risk relates to fluctuations in the value of an asset or liability due to changes in currency exchange rates. |
| Interest Rate Risk | Interest rate risk relates to the fluctuations in the value of interest-bearing securities due to changes in the prevailing levels of market interest rates. |
Funds are also exposed to additional risks from investing in derivatives, such as liquidity risk and counterparty credit risk. Liquidity risk is the risk that a fund will be unable to close out the derivative in the open market in a timely manner. Counterparty credit risk is the risk that the counterparty will not be able to fulfill its obligation to a fund. Derivative counterparty credit risk is managed through formal evaluation of the creditworthiness of all potential counterparties. On certain OTC derivatives such as forward foreign currency contracts, a fund attempts to reduce its exposure to counterparty credit risk by entering into an International Swaps and Derivatives Association, Inc. (ISDA) Master Agreement with each of its counterparties. The ISDA Master Agreement gives a fund the right to terminate all transactions traded under such agreement upon the deterioration in the credit quality of the counterparty beyond specified levels. The ISDA Master Agreement gives each party the right, upon an event of default by the other party or a termination of the agreement, to close out all transactions traded under such agreement and to net amounts owed under each transaction to one net payable by one party to the other. To mitigate counterparty credit risk on bi-lateral OTC derivatives, a fund receives collateral in the form of cash or securities once net unrealized appreciation on outstanding derivative contracts under an ISDA Master Agreement exceeds certain applicable thresholds, subject to certain minimum transfer provisions. The collateral received is held in segregated accounts with the custodian bank in accordance with the collateral agreements entered into between a fund, the counterparty and the custodian bank. A fund could experience delays and costs in gaining access to the collateral even though it is held by the custodian bank. The maximum risk of loss to a fund from counterparty credit risk related to bi-lateral OTC derivatives is generally the aggregate unrealized appreciation and unpaid counterparty payments in excess of any collateral pledged by the counterparty to a fund. A fund may be required to pledge collateral for the benefit of the counterparties on bi-lateral OTC derivatives in an amount not less than each counterparty's unrealized appreciation on outstanding derivative contracts, subject to certain minimum transfer provisions, and any such pledged collateral is identified in the Schedule of Investments. Counterparty credit risk related to exchange-traded contracts may be mitigated by the protection provided by the exchange on which they trade.
Investing in derivatives may involve greater risks than investing in the underlying assets directly and, to varying degrees, may involve risk of loss in excess of any initial investment and collateral received and amounts recognized in the Statement of Assets and Liabilities. In addition, there may be the risk that the change in value of the derivative contract does not correspond to the change in value of the underlying instrument.
Forward Foreign Currency Contracts. Forward foreign currency contracts represent obligations to purchase or sell foreign currency on a specified future date at a price fixed at the time the contracts are entered into. Forward foreign currency contracts were used to facilitate transactions in foreign-denominated securities and to manage exposure to certain foreign currencies.
Forward foreign currency contracts are valued daily and fluctuations in exchange rates on open contracts are recorded as unrealized appreciation or (depreciation) and reflected in total accumulated earnings (loss) in the Statement of Assets and Liabilities. When the contract is closed, a gain or loss is realized equal to the difference between the closing value and the value at the time it was opened. Non-deliverable forward foreign currency exchange contracts are settled with the counterparty in cash without the delivery of foreign currency. The net realized gain (loss) and change in net unrealized appreciation (depreciation) on forward foreign currency contracts during the period is presented in the Statement of Operations.
Any open forward foreign currency contracts at period end are presented in the Schedule of Investments under the caption "Forward Foreign Currency Contracts." The contract amount and unrealized appreciation (depreciation) reflects each contract's exposure to the underlying currency at period end, and is representative of volume of activity during the period, unless an average contract value is presented in the table below.
| | Average Contracts Amount ($) |
| Fidelity Emerging Markets Debt Local Currency Central Fund | 110,279,920 |
Futures Contracts. A futures contract is an agreement between two parties to buy or sell a specified underlying instrument for a fixed price at a specified future date. Futures contracts were used to manage exposure to the bond market and fluctuations in interest rates.
Upon entering into a futures contract, a fund is required to deposit either cash or securities (initial margin) with a clearing broker in an amount equal to a certain percentage of the face value of the contract. Futures contracts are marked-to-market daily and subsequent daily payments are made or received by a fund depending on the daily fluctuations in the value of the futures contracts and are recorded as unrealized appreciation or (depreciation). This receivable and/or payable, if any, is included in daily variation margin on futures contracts in the Statement of Assets and Liabilities. Realized gain or (loss) is recorded upon the expiration or closing of a futures contract. The net realized gain (loss) and change in net unrealized appreciation (depreciation) on futures contracts during the period is presented in the Statement of Operations.
Any open futures contracts at period end are presented in the Schedule of Investments under the caption "Futures Contracts". The notional amount at value reflects each contract's exposure to the underlying instrument or index at period end, and is representative of volume of activity during the period.
Any securities deposited to meet initial margin requirements are identified in the Schedule of Investments. Any cash deposited to meet initial margin requirements is presented as segregated cash with brokers for derivative instruments in the Statement of Assets and Liabilities.
5. Purchases and Sales of Investments.
Purchases and sales of securities, other than short-term securities, U.S. government securities and in-kind transactions, as applicable, are noted in the table below.
| | Purchases ($) | Sales ($) |
| Fidelity Emerging Markets Debt Central Fund | 398,319,068 | 341,435,944 |
| Fidelity Emerging Markets Debt Local Currency Central Fund | 128,674,205 | 134,685,645 |
6. Fees and Other Transactions with Affiliates.
Management Fee and Expense Contract. Fidelity Management & Research Company LLC (the investment adviser) provides each Fund with investment management services. The Funds do not pay any fees for these services. Pursuant to each Fund's expense contract, the investment adviser pays all other expenses of each Fund, excluding custody fees, the compensation of the independent Trustees, and certain miscellaneous expenses such as proxy and shareholder meeting expenses.
Interfund Trades. Funds may purchase from or sell securities to other Fidelity Funds under procedures adopted by the Board. The procedures have been designed to ensure these interfund trades are executed in accordance with Rule 17a-7 of the 1940 Act. Any interfund trades are included within the respective purchases and sales amounts shown in the Purchases and Sales of Investments note. During the period, there were no interfund trades.
Affiliated Redemptions In-Kind. Shares that were redeemed in-kind for investments, including accrued interest and cash, if any, are shown in the table below. The net realized gain or loss on investments delivered through in-kind redemptions is included in the "Net realized gain (loss) on: Redemptions in-kind" line in the accompanying Statement of Operations. The amount of the in-kind redemptions is included in share transactions in the accompanying Statement of Changes in Net Assets. There was no gain or loss for federal income tax purposes.
| | Shares | Total net realized gain or loss ($) | Total Proceeds ($) |
| Fidelity Emerging Markets Debt Central Fund | 11,140,913 | (4,517,554) | 86,899,124 |
Sub-Advisory Arrangements. Effective March 1, 2024, the Fund's sub-advisory agreements with FMR Investment Management (UK) Limited, Fidelity Management & Research (Hong Kong) Limited, and Fidelity Management & Research (Japan) Limited were amended to provide that the investment adviser pays each sub-adviser monthly fees equal to 110% of the sub-adviser's costs for providing sub-advisory services. Effective March 1, 2024, Fidelity Emerging Markets Debt Central Fund's sub-advisory agreement with FIL Investment Advisors (FIA) was amended to provide that the investment adviser pays FIA monthly fees at an annual rate of 0.30% with respect to the average daily net assets of the Fund managed by FIA. FIA in turn pays FIA(UK).
7. Expense Reductions.
Through arrangements with each applicable Fund's custodian, credits realized as a result of certain uninvested cash balances were used to reduce each applicable Fund's expenses. All of the applicable expense reductions are noted in the table below.
| | Custodian credits ($) |
Fidelity Emerging Markets Debt Central Fund | 10,313 |
Fidelity Emerging Markets Debt Local Currency Central Fund | 2,135 |
8. Other.
A fund's organizational documents provide former and current trustees and officers with a limited indemnification against liabilities arising in connection with the performance of their duties to the fund. In the normal course of business, a fund may also enter into contracts that provide general indemnifications. A fund's maximum exposure under these arrangements is unknown as this would be dependent on future claims that may be made against a fund. The risk of material loss from such claims is considered remote.
At the end of the period, mutual funds and accounts managed by the investment adviser or its affiliates were the owners of record of all of the outstanding shares of the Funds.
9. Credit Risk.
The Fund's relatively large investment in countries with limited or developing capital markets may involve greater risks than investments in more developed markets and the prices of such investments may be volatile. The yields of emerging market debt obligations reflect, among other things, perceived credit risk. The consequences of political, social or economic changes in these markets may have disruptive effects on the market prices of the Fund's investments and the income they generate, as well as the Fund's ability to repatriate such amounts.
10. Risk and Uncertainties.
Many factors affect a fund's performance. Developments that disrupt global economies and financial markets, such as pandemics, epidemics, outbreaks of infectious diseases, war, terrorism, and environmental disasters, may significantly affect a fund's investment performance. The effects of these developments to a fund will be impacted by the types of securities in which a fund invests, the financial condition, industry, economic sector, and geographic location of an issuer, and a fund's level of investment in the securities of that issuer. Significant concentrations in security types, issuers, industries, sectors, and geographic locations may magnify the factors that affect a fund's performance.
Report of Independent Registered Public Accounting Firm
To the Board of Trustees of Fidelity Hanover Street Trust and Shareholders of Fidelity Emerging Markets Debt Central Fund and Fidelity Emerging Markets Debt Local Currency Central Fund
Opinions on the Financial Statements
We have audited the accompanying statements of assets and liabilities, including the schedules of investments, of Fidelity Emerging Markets Debt Central Fund and Fidelity Emerging Markets Debt Local Currency Central Fund (constituting Fidelity Hanover Street Trust, hereafter collectively referred to as the "Funds") as of December 31, 2024, the related statements of operations for the year ended December 31, 2024, the statements of changes in net assets for each of the two years in the period ended December 31, 2024, including the related notes, and the financial highlights for each of the periods indicated therein (collectively referred to as the "financial statements"). In our opinion, the financial statements present fairly, in all material respects, the financial position of each of the Funds as of December 31, 2024, the results of each of their operations for the year then ended, the changes in each of their net assets for each of the two years in the period ended December 31, 2024 and each of the financial highlights for each of the periods indicated therein in conformity with accounting principles generally accepted in the United States of America.
Basis for Opinions
These financial statements are the responsibility of the Funds' management. Our responsibility is to express an opinion on the Funds' financial statements based on our audits. We are a public accounting firm registered with the Public Company Accounting Oversight Board (United States) (PCAOB) and are required to be independent with respect to the Funds in accordance with the U.S. federal securities laws and the applicable rules and regulations of the Securities and Exchange Commission and the PCAOB.
We conducted our audits of these financial statements in accordance with the standards of the PCAOB. Those standards require that we plan and perform the audit to obtain reasonable assurance about whether the financial statements are free of material misstatement, whether due to error or fraud.
Our audits included performing procedures to assess the risks of material misstatement of the financial statements, whether due to error or fraud, and performing procedures that respond to those risks. Such procedures included examining, on a test basis, evidence regarding the amounts and disclosures in the financial statements. Our audits also included evaluating the accounting principles used and significant estimates made by management, as well as evaluating the overall presentation of the financial statements. Our procedures included confirmation of securities owned as of December 31, 2024 by correspondence with the custodian, issuers of privately offered securities, agent banks and brokers; when replies were not received from brokers, we performed other auditing procedures. We believe that our audits provide a reasonable basis for our opinions.
/s/ PricewaterhouseCoopers LLP
Boston, Massachusetts
February 14, 2025
We have served as the auditor of one or more investment companies in the Fidelity group of funds since 1932.
Distributions
(Unaudited)The dividend and capital gains distributions for the fund(s) are available on Fidelity.com or Institutional.Fidelity.com.
The funds hereby designate the amounts noted below as distributions paid during the fiscal year ended 2024 as qualifying to be taxed as section 163(j) interest dividends:
| Fidelity Emerging Markets Debt Central Fund | $121,186,747 |
| Fidelity Emerging Markets Debt Local Currency Central Fund | $16,107,080 |
The funds will notify shareholders in January 2025 of amounts for use in preparing 2024 income tax returns.
Item 8: Changes in and Disagreements with Accountants for Open-End Management Investment Companies
(Unaudited)
Note: This is not applicable for any fund included in this document.
Item 9: Proxy Disclosures for Open-End Management Investment Companies
(Unaudited)
| A special meeting of shareholders was held on July 16, 2024. The results of votes taken among shareholders on the proposal before them are reported below. Each vote reported represents one dollar of net asset value held on the record date for the meeting. |
| Proposal 1 |
| To elect a Board of Trustees. |
| | # of Votes | % of Votes |
| Bettina Doulton |
| Affirmative | 2,383,186,592.40 | 100.00 |
| TOTAL | 2,383,186,592.40 | 100.00 |
| Robert A. Lawrence |
| Affirmative | 2,383,186,592.40 | 100.00 |
| TOTAL | 2,383,186,592.40 | 100.00 |
| Vijay C. Advani |
| Affirmative | 2,383,186,592.40 | 100.00 |
| TOTAL | 2,383,186,592.40 | 100.00 |
| Thomas P. Bostick |
| Affirmative | 2,383,186,592.40 | 100.00 |
| TOTAL | 2,383,186,592.40 | 100.00 |
| Donald F. Donahue |
| Affirmative | 2,383,186,592.40 | 100.00 |
| TOTAL | 2,383,186,592.40 | 100.00 |
| Vicki L. Fuller |
| Affirmative | 2,383,186,592.40 | 100.00 |
| TOTAL | 2,383,186,592.40 | 100.00 |
| Patricia L. Kampling |
| Affirmative | 2,383,186,592.40 | 100.00 |
| TOTAL | 2,383,186,592.40 | 100.00 |
| Thomas A. Kennedy |
| Affirmative | 2,383,186,592.40 | 100.00 |
| TOTAL | 2,383,186,592.40 | 100.00 |
| Oscar Munoz |
| Affirmative | 2,383,186,592.40 | 100.00 |
| TOTAL | 2,383,186,592.40 | 100.00 |
| Karen B. Peetz |
| Affirmative | 2,383,186,592.40 | 100.00 |
| TOTAL | 2,383,186,592.40 | 100.00 |
| David M. Thomas |
| Affirmative | 2,383,186,592.40 | 100.00 |
| TOTAL | 2,383,186,592.40 | 100.00 |
| Susan Tomasky |
| Affirmative | 2,383,186,592.40 | 100.00 |
| TOTAL | 2,383,186,592.40 | 100.00 |
| Michael E. Wiley |
| Affirmative | 2,383,186,592.40 | 100.00 |
| TOTAL | 2,383,186,592.40 | 100.00 |
| | | |
| Proposal 1 reflects trust-wide proposal and voting results. |
Item 10: Remuneration Paid to Directors, Officers, and others of Open-End Management Investment Companies
(Unaudited)
Note: This information is disclosed as part of the financial statements for each Fund as part of Item 7: Financial Statements and Financial Highlights for Open-End Management Investment companies.
Item 11: Statement Regarding Basis for Approval of Investment Advisory Contract
(Unaudited)
Note: This is not applicable for any fund included in this document.
1.926205.113
EMC-ANN-0225
Item 8.
Changes in and Disagreements with Accountants for Open-End Management Investment Companies
See Item 7.
Item 9.
Proxy Disclosures for Open-End Management Investment Companies
See Item 7.
Item 10.
Remuneration Paid to Directors, Officers, and Others of Open-End Management Investment Companies
See Item 7.
Item 11.
Statement Regarding Basis for Approval of Investment Advisory Contract
See Item 7.
Item 12.
Disclosure of Proxy Voting Policies and Procedures for Closed-End Management Investment Companies
Not applicable.
Item 13.
Portfolio Managers of Closed-End Management Investment Companies
Not applicable.
Item 14.
Purchase of Equity Securities by Closed-End Management Investment Company and Affiliated Purchasers
Not applicable.
Item 15.
Submission of Matters to a Vote of Security Holders
There were no material changes to the procedures by which shareholders may recommend nominees to the trust’s Board of Trustees.
Item 16.
Controls and Procedures
(a)(i) The President and Treasurer and the Chief Financial Officer have concluded that the trust’s disclosure controls and procedures (as defined in Rule 30a-3(c) under the Investment Company Act) provide reasonable assurances that material information relating to the trust is made known to them by the appropriate persons, based on their evaluation of these controls and procedures as of a date within 90 days of the filing date of this report.
(a)(ii) There was no change in the trust’s internal control over financial reporting (as defined in Rule 30a-3(d) under the Investment Company Act) that occurred during the period covered by this report that has materially affected, or is reasonably likely to materially affect, the trust’s internal control over financial reporting.
Item 17.
Disclosure of Securities Lending Activities for Closed-End Management Investment Companies
Not applicable.
Item 18.
Recovery of Erroneously Awarded Compensation
(a)
Not applicable.
(b)
Not applicable.
Item 19.
Exhibits
SIGNATURES
Pursuant to the requirements of the Securities Exchange Act of 1934 and the Investment Company Act of 1940, the registrant has duly caused this report to be signed on its behalf by the undersigned, thereunto duly authorized.
Fidelity Hanover Street Trust
|
By: | /s/Stacie M. Smith |
| Stacie M. Smith |
| President and Treasurer (Principal Executive Officer) |
|
|
Date: | February 21, 2025 |
Pursuant to the requirements of the Securities Exchange Act of 1934 and the Investment Company Act of 1940, this report has been signed below by the following persons on behalf of the registrant and in the capacities and on the dates indicated.
|
By: | /s/Stacie M. Smith |
| Stacie M. Smith |
| President and Treasurer (Principal Executive Officer) |
|
|
Date: | February 21, 2025 |
|
By: | /s/Stephanie Caron |
| Stephanie Caron |
| Chief Financial Officer (Principal Financial Officer) |
|
|
Date: | February 21, 2025 |