Fidelity® Emerging Markets Debt Central Fund
Annual Report December 31, 2018 |
 |
Beginning on January 1, 2021, as permitted by regulations adopted by the Securities and Exchange Commission, paper copies of a fund’s shareholder reports will no longer be sent by mail, unless you specifically request paper copies of the reports from the fund or from your financial intermediary, such as a financial advisor, broker-dealer or bank. Instead, the reports will be made available on a website, and you will be notified by mail each time a report is posted and provided with a website link to access the report.
If you already elected to receive shareholder reports electronically, you will not be affected by this change and you need not take any action. You may elect to receive shareholder reports and other communications from a fund electronically, by contacting your financial intermediary. For Fidelity customers, visit Fidelity's web site or call Fidelity using the contact information listed below.
You may elect to receive all future reports in paper free of charge. If you wish to continue receiving paper copies of your shareholder reports, you may contact your financial intermediary or, if you are a Fidelity customer, visit Fidelity’s website, or call Fidelity at the applicable toll-free number listed below. Your election to receive reports in paper will apply to all funds held with the fund complex/your financial intermediary.
| Account Type | Website | Phone Number |
| Brokerage, Mutual Fund, or Annuity Contracts: | fidelity.com/mailpreferences | 1-800-343-3548 |
| Employer Provided Retirement Accounts: | netbenefits.fidelity.com/preferences (choose 'no' under Required Disclosures to continue to print) | 1-800-343-0860 |
| Advisor Sold Accounts Serviced Through Your Financial Intermediary: | Contact Your Financial Intermediary | Your Financial Intermediary's phone number |
| Advisor Sold Accounts Serviced by Fidelity: | institutional.fidelity.com | 1-877-208-0098 |
Contents
To view a fund's proxy voting guidelines and proxy voting record for the 12-month period ended June 30, visit http://www.fidelity.com/proxyvotingresults or visit the Securities and Exchange Commission's (SEC) web site at http://www.sec.gov.
You may also call 1-800-544-8544 to request a free copy of the proxy voting guidelines.
Standard & Poor's, S&P and S&P 500 are registered service marks of The McGraw-Hill Companies, Inc. and have been licensed for use by Fidelity Distributors Corporation.
Other third-party marks appearing herein are the property of their respective owners.
All other marks appearing herein are registered or unregistered trademarks or service marks of FMR LLC or an affiliated company. © 2019 FMR LLC. All rights reserved.
A fund files its complete schedule of portfolio holdings with the SEC for the first and third quarters of each fiscal year on Form N-Q. Forms N-Q are available on the SEC’s web site at http://www.sec.gov. A fund's Forms N-Q may be reviewed and copied at the SEC’s Public Reference Room in Washington, DC. Information regarding the operation of the SEC's Public Reference Room may be obtained by calling 1-800-SEC-0330.
Performance: The Bottom Line
Average annual total return reflects the change in the value of an investment, assuming reinvestment of distributions from dividend income and capital gains (the profits earned upon the sale of securities that have grown in value, if any) and assuming a constant rate of performance each year. The hypothetical investment and the average annual total returns do not reflect the deduction of taxes that a shareholder would pay on fund distributions or the redemption of fund shares. During periods of reimbursement by Fidelity, a fund’s total return will be greater than it would be had the reimbursement not occurred. How a fund did yesterday is no guarantee of how it will do tomorrow.
Average Annual Total Returns
| For the periods ended December 31, 2018 | Past 1 year | Past 5 years | Life of fundA |
| Fidelity® Emerging Markets Debt Central Fund | (4.52)% | 5.15% | 6.07% |
A From March 17, 2011
$10,000 Over Life of Fund
Let's say hypothetically that $10,000 was invested in Fidelity® Emerging Markets Debt Central Fund on March 17, 2011, when the fund started.
The chart shows how the value of your investment would have changed, and also shows how the J.P. Morgan Emerging Markets Bond Index Global performed over the same period.
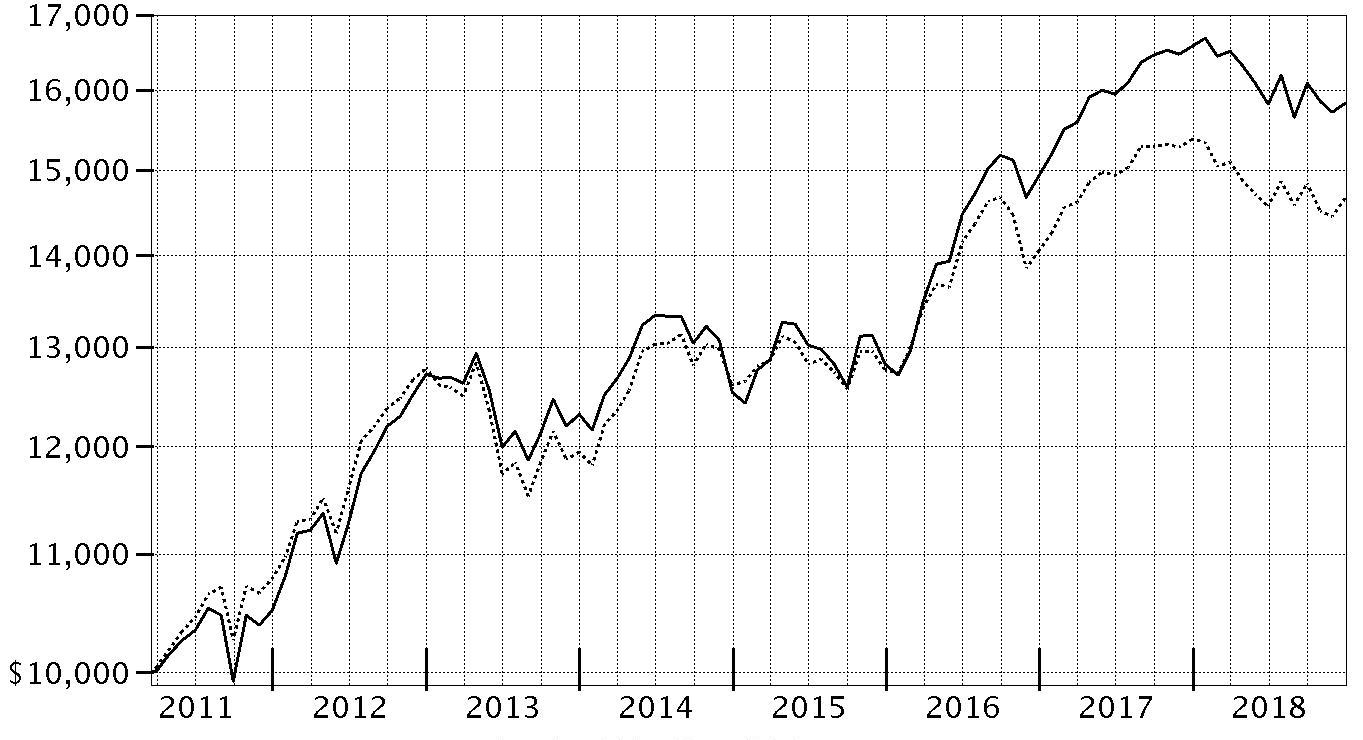
| Period Ending Values |
| $15,831 | Fidelity® Emerging Markets Debt Central Fund |
| $14,664 | J.P. Morgan Emerging Markets Bond Index Global |
Management's Discussion of Fund Performance
Market Recap: Emerging-markets debt returned -4.61% in 2018, as measured by the J.P. Morgan Emerging Markets Bond Index Global, which was held back throughout much of the year by a host of headwinds. These included ongoing trade tension between the U.S. and China, global monetary tightening and China’s growth recession, all of which led to a generally “risk off” environment that spurred higher-quality bonds to outperform riskier credits. In addition, a broadly stronger U.S. dollar was a headwind for local emerging-markets currency. Within the index, several countries were hampered by idiosyncratic factors and a sharp decline in oil prices. As a result, substantially all declined in 2018, with Argentina (-22%) and Venezuela (-20%) the biggest laggards. Even after Argentina’s government took out a record credit with the International Monetary Fund (IMF), the country continued to be plagued by inflation, economic woes and political uncertainty. Meanwhile, Venezuela grappled with a deep economic and oil crisis, with hyperinflation exceeding 1 million percent by year-end. Mexico, the largest index component, on average, for the year, returned roughly -6%. Several countries were held back by the collapsing price of oil, including Ecuador (-9%) and Oman (-8%). Conversely, China (+1%) was a higher-quality issuer that outperformed amid the risk-off market backdrop.
Comments from Co-Portfolio Managers Timothy Gill and Jonathan Kelly: For the year, the fund returned -4.52%, modestly behind the benchmark J.P. Morgan index. Higher-quality investment-grade and quasi-sovereign debt instruments significantly outperformed non-investment-grade bonds amid investors' flight from riskier markets in 2018. The fund had lower exposure to investment-grade debt than its benchmark, which hurt our relative result. In particular, the fund’s underweighting in China hurt relative performance most, as higher-quality Chinese bonds outperformed the index. Elsewhere, the negative of our sizable overweighting in Argentina more than offset positive security selection in this market. Choices and an overweighting in Kazakhstan also hurt. Conversely, security selection in Lebanon was the top contributor, although overweighting this market offset some of the positive. Here, we primarily held short-maturity bonds that outperformed in the volatile market this year. Choices in Nigeria and an overweighting in Brazil also helped. Lastly, the fund’s cash position of 6%, on average, was a positive, as was our non-benchmark position in U.S. Treasuries.
The views expressed above reflect those of the portfolio manager(s) only through the end of the period as stated on the cover of this report and do not necessarily represent the views of Fidelity or any other person in the Fidelity organization. Any such views are subject to change at any time based upon market or other conditions and Fidelity disclaims any responsibility to update such views. These views may not be relied on as investment advice and, because investment decisions for a Fidelity fund are based on numerous factors, may not be relied on as an indication of trading intent on behalf of any Fidelity fund.
Note to shareholders: On December 1, 2018, Timothy Gill assumed co-management responsibilities for the fund, joining Co-Manager Jonathan Kelly.
Investment Summary (Unaudited)
Top Five Countries as of December 31, 2018
| (excluding cash equivalents) | % of fund's net assets |
| Argentina | 12.8 |
| Mexico | 8.9 |
| Turkey | 8.2 |
| Ukraine | 5.3 |
| United States of America | 5.3 |
Percentages are adjusted for the effect of futures contracts, if applicable.
Top Five Holdings as of December 31, 2018
| (by issuer, excluding cash equivalents) | % of fund's net assets |
| Turkish Republic | 6.7 |
| Argentine Republic | 5.4 |
| Ukraine Government | 5.3 |
| Petroleos Mexicanos | 5.1 |
| U.S. Treasury Obligations | 3.1 |
| | 25.6 |
Asset Allocation (% of fund's net assets)
| As of December 31, 2018 |
| | Corporate Bonds | 33.0% |
| | Government Obligations | 54.5% |
| | Supranational Obligations | 0.3% |
| | Preferred Securities | 3.0% |
| | Short-Term Investments and Net Other Assets (Liabilities) | 9.2% |

Schedule of Investments December 31, 2018
Showing Percentage of Net Assets
| Nonconvertible Bonds - 33.0% | | | |
| | | Principal Amount(a) | Value |
| Argentina - 3.2% | | | |
| Aeropuertos Argentina 2000 SA 6.875% 2/1/27 (b) | | $335,000 | $309,038 |
| Banco Hipotecario SA 9.75% 11/30/20 (b) | | 1,070,000 | 1,045,925 |
| Banco Macro SA 6.75% 11/4/26 (b)(c) | | 715,000 | 577,363 |
| Inversiones y Representaciones SA 11.5% 7/20/20 (Reg. S) | | 35,000 | 35,350 |
| IRSA Propiedades Comerciales SA 8.75% 3/23/23 (b) | | 390,000 | 373,538 |
| Petrobras Energia SA 7.375% 7/21/23 (b) | | 195,000 | 175,149 |
| Transportadora de Gas del Sur SA 6.75% 5/2/25 (b) | | 300,000 | 272,628 |
| YPF SA 8.75% 4/4/24 (b) | | 1,360,000 | 1,278,400 |
|
| TOTAL ARGENTINA | | | 4,067,391 |
|
| Azerbaijan - 0.6% | | | |
| Southern Gas Corridor CJSC 6.875% 3/24/26 (b) | | 660,000 | 712,826 |
| Bahrain - 0.4% | | | |
| The Oil and Gas Holding Co.: | | | |
| 7.5% 10/25/27 (b) | | 250,000 | 246,250 |
| 7.625% 11/7/24 (b) | | 200,000 | 205,100 |
|
| TOTAL BAHRAIN | | | 451,350 |
|
| Bangladesh - 1.0% | | | |
| Banglalink Digital Communications Ltd. 8.625% 5/6/19 (b) | | 1,265,000 | 1,271,452 |
| British Virgin Islands - 0.7% | | | |
| 1MDB Global Investments Ltd. 4.4% 3/9/23 | | 1,000,000 | 895,250 |
| Canada - 0.3% | | | |
| First Quantum Minerals Ltd. 7.25% 4/1/23 (b) | | 180,000 | 158,400 |
| Frontera Energy Corp. 9.7% 6/25/23 (b) | | 280,000 | 276,150 |
|
| TOTAL CANADA | | | 434,550 |
|
| Cayman Islands - 1.0% | | | |
| Comcel Trust 6.875% 2/6/24 (b) | | 310,000 | 315,654 |
| CSN Islands XI Corp. 6.875% 9/21/19 (b) | | 660,000 | 656,726 |
| Odebrecht Finance Ltd. 7.125% 6/26/42 (b)(d) | | 1,149,000 | 160,860 |
| Sparc Em Spc 0% 12/5/22 (b) | | 170,833 | 154,819 |
|
| TOTAL CAYMAN ISLANDS | | | 1,288,059 |
|
| Dominican Republic - 0.1% | | | |
| Banco de Reservas de La Republica Dominicana 7% 2/1/23 (b) | | 190,000 | 190,000 |
| Georgia - 0.6% | | | |
| Georgian Oil & Gas Corp. 6.75% 4/26/21 (b) | | 240,000 | 240,086 |
| JSC BGEO Group 6% 7/26/23 (b) | | 460,000 | 446,274 |
| JSC Georgian Railway 7.75% 7/11/22 (b) | | 135,000 | 139,398 |
|
| TOTAL GEORGIA | | | 825,758 |
|
| Indonesia - 0.9% | | | |
| PT Bukit Makmur Mandiri Utama 7.75% 2/13/22 (b) | | 420,000 | 418,473 |
| PT Pertamina Persero: | | | |
| 5.625% 5/20/43 (Reg. S) | | 400,000 | 378,080 |
| 6% 5/3/42 (b) | | 200,000 | 199,034 |
| 6.5% 5/27/41 (b) | | 215,000 | 225,252 |
|
| TOTAL INDONESIA | | | 1,220,839 |
|
| Ireland - 0.4% | | | |
| Borets Finance DAC 6.5% 4/7/22 (b) | | 330,000 | 323,248 |
| CBOM Finance PLC 5.55% 2/14/23 (b) | | 185,000 | 173,124 |
|
| TOTAL IRELAND | | | 496,372 |
|
| Kazakhstan - 0.1% | | | |
| KazMunaiGaz Finance Sub BV 6.375% 10/24/48 (b) | | 120,000 | 120,720 |
| Korea (South) - 0.1% | | | |
| Export-Import Bank of Korea 6.2% 8/7/21 (b) | INR | 12,200,000 | 169,182 |
| Luxembourg - 1.4% | | | |
| CSN Resources SA 6.5% 7/21/20 (b) | | 615,000 | 593,168 |
| Rumo Luxembourg Sarl 7.375% 2/9/24 (b) | | 435,000 | 453,444 |
| SB Capital SA 5.5% 2/26/24 (b)(c) | | 200,000 | 200,000 |
| Sistema International Funding SA 6.95% 5/17/19 (b) | | 515,000 | 517,142 |
|
| TOTAL LUXEMBOURG | | | 1,763,754 |
|
| Mexico - 8.3% | | | |
| America Movil S.A.B. de CV 6.45% 12/5/22 | MXN | 8,200,000 | 368,237 |
| Axtel S.A.B. de CV 6.375% 11/14/24 (b) | | 125,000 | 118,664 |
| CEMEX S.A.B. de CV 7.75% 4/16/26 (b) | | 180,000 | 189,227 |
| Credito Real S.A.B. de CV 7.5% 3/13/19 (b) | | 60,000 | 59,775 |
| Metalsa SA de CV 4.9% 4/24/23 (b) | | 645,000 | 613,498 |
| Mexico City Airport Trust 5.5% 10/31/46 (b) | | 200,000 | 176,000 |
| Pemex Project Funding Master Trust: | | | |
| 6.625% 6/15/35 | | 1,660,000 | 1,449,180 |
| 6.625% 6/15/38 | | 25,000 | 21,375 |
| Petroleos Mexicanos: | | | |
| 4.625% 9/21/23 | | 270,000 | 253,395 |
| 4.875% 1/24/22 | | 395,000 | 384,533 |
| 4.875% 1/18/24 | | 240,000 | 223,680 |
| 5.5% 1/21/21 | | 210,000 | 209,154 |
| 6.375% 1/23/45 | | 1,015,000 | 817,075 |
| 6.5% 3/13/27 | | 270,000 | 253,800 |
| 6.5% 6/2/41 | | 3,105,000 | 2,570,940 |
| 6.625% (b)(e) | | 390,000 | 320,775 |
| 6.75% 9/21/47 | | 1,413,000 | 1,168,396 |
| 6.875% 8/4/26 | | 255,000 | 247,860 |
| TV Azteca SA de CV 8.25% 8/9/24 (Reg. S) | | 1,225,000 | 1,176,012 |
|
| TOTAL MEXICO | | | 10,621,576 |
|
| Mongolia - 0.5% | | | |
| Development Bank of Mongolia 7.25% 10/23/23 (b) | | 200,000 | 196,308 |
| Trade and Development Bank of Mongolia LLC 9.375% 5/19/20 (b) | | 455,000 | 473,665 |
|
| TOTAL MONGOLIA | | | 669,973 |
|
| Netherlands - 4.0% | | | |
| Cimpor Financial Operations BV 5.75% 7/17/24 (b) | | 395,000 | 327,850 |
| GTH Finance BV 7.25% 4/26/23 (b) | | 550,000 | 563,587 |
| Metinvest BV 7.75% 4/23/23 (b) | | 1,150,000 | 1,046,394 |
| Nostrum Oil & Gas Finance BV 8% 7/25/22 (b) | | 1,240,000 | 832,065 |
| Petrobras Global Finance BV 8.75% 5/23/26 | | 1,935,000 | 2,170,103 |
| VTR Finance BV 6.875% 1/15/24 (b) | | 193,000 | 193,000 |
|
| TOTAL NETHERLANDS | | | 5,132,999 |
|
| Nigeria - 1.8% | | | |
| Access Bank PLC 9.25% 6/24/21 (b)(c) | | 335,000 | 332,488 |
| Fidelity Bank PLC 10.5% 10/16/22 (b) | | 310,000 | 310,434 |
| Zenith Bank PLC: | | | |
| 6.25% 4/22/19 (b) | | 1,070,000 | 1,067,184 |
| 7.375% 5/30/22 (b) | | 670,000 | 664,301 |
|
| TOTAL NIGERIA | | | 2,374,407 |
|
| Singapore - 0.4% | | | |
| Indika Energy Capital II Pte. Ltd. 6.875% 4/10/22 (b) | | 465,000 | 465,850 |
| South Africa - 0.1% | | | |
| Eskom Holdings SOC Ltd. 5.75% 1/26/21 (Reg. S) | | 200,000 | 188,410 |
| Tunisia - 0.1% | | | |
| Banque Centrale de Tunisie 5.75% 1/30/25 (b) | | 200,000 | 167,768 |
| Turkey - 1.5% | | | |
| Akbank TAS/Ak Finansal Kiralama A/S: | | | |
| 4% 1/24/20 (b) | | 205,000 | 201,310 |
| 7.2% 3/16/27 (b)(c) | | 180,000 | 157,988 |
| Export Credit Bank of Turkey 5.875% 4/24/19 (b) | | 130,000 | 129,569 |
| Petkim Petrokimya Holding A/S 5.875% 1/26/23 (b) | | 430,000 | 390,211 |
| T.C. Ziraat Bankasi A/S: | | | |
| 4.25% 7/3/19 (b) | | 75,000 | 74,043 |
| 4.75% 4/29/21 (b) | | 90,000 | 84,833 |
| Turkiye Garanti Bankasi A/S: | | | |
| 4.75% 10/17/19 (b) | | 120,000 | 118,368 |
| 6.125% 5/24/27 (b)(c) | | 200,000 | 170,776 |
| Turkiye Vakiflar Bankasi TAO: | | | |
| 5.75% 1/30/23 (b) | | 455,000 | 399,375 |
| 6.875% 2/3/25 (Reg. S) (c) | | 200,000 | 169,206 |
|
| TOTAL TURKEY | | | 1,895,679 |
|
| United Kingdom - 2.7% | | | |
| Biz Finance PLC 9.625% 4/27/22 (b) | | 890,000 | 870,598 |
| DTEK Finance PLC 10.75% 12/31/24 pay-in-kind (c) | | 900,000 | 826,740 |
| Ferrexpo Finance PLC: | | | |
| 10.375% 4/7/19 (b) | | 147,500 | 148,267 |
| 10.375% 4/7/19 (Reg. S) | | 157,500 | 158,319 |
| 10.375% 4/7/19 (Reg. S) | | 150,000 | 150,780 |
| Oschadbank Via SSB #1 PLC 9.375% 3/10/23 (b) | | 200,000 | 196,841 |
| Polyus Finance PLC 5.25% 2/7/23 (b) | | 475,000 | 460,774 |
| Vedanta Resources PLC: | | | |
| 6.375% 7/30/22 (b) | | 365,000 | 326,310 |
| 8.25% 6/7/21 (b) | | 335,000 | 331,818 |
|
| TOTAL UNITED KINGDOM | | | 3,470,447 |
|
| United States of America - 2.2% | | | |
| Azul Investments LLP 5.875% 10/26/24 (b) | | 190,000 | 177,414 |
| Citgo Holding, Inc. 10.75% 2/15/20 (b) | | 195,000 | 198,900 |
| Kosmos Energy Ltd.: | | | |
| 7.875% 8/1/21 (b) | | 780,000 | 776,100 |
| 7.875% 8/1/21 (b) | | 570,000 | 564,300 |
| Pan American Energy LLC 7.875% 5/7/21 (b) | | 305,000 | 305,381 |
| Stillwater Mining Co. 6.125% 6/27/22 (b) | | 825,000 | 762,515 |
|
| TOTAL UNITED STATES OF AMERICA | | | 2,784,610 |
|
| Venezuela - 0.6% | | | |
| Petroleos de Venezuela SA: | | | |
| 5.375% 4/12/27 (d) | | 375,000 | 54,338 |
| 5.5% 4/12/37 (d) | | 330,000 | 49,500 |
| 6% 5/16/24 (b)(d) | | 895,000 | 132,013 |
| 6% 11/15/26 (b)(d) | | 1,650,000 | 243,375 |
| 9.75% 5/17/35 (b)(d) | | 1,315,000 | 243,275 |
| 12.75% 2/17/22 (b)(d) | | 300,000 | 57,030 |
|
| TOTAL VENEZUELA | | | 779,531 |
|
| TOTAL NONCONVERTIBLE BONDS | | | |
| (Cost $46,705,234) | | | 42,458,753 |
|
| Government Obligations - 54.5% | | | |
| Angola - 0.1% | | | |
| Angola Republic 9.375% 5/8/48 (b) | | 125,000 | 116,885 |
| Argentina - 9.6% | | | |
| Argentine Republic: | | | |
| 5.625% 1/26/22 | | 595,000 | 502,031 |
| 6.875% 4/22/21 | | 3,305,000 | 2,986,093 |
| 7.5% 4/22/26 | | 3,585,000 | 2,872,481 |
| 7.625% 4/22/46 | | 875,000 | 633,938 |
| Buenos Aires Province: | | | |
| 6.5% 2/15/23 (b) | | 75,000 | 60,375 |
| 9.95% 6/9/21 (b) | | 500,000 | 470,000 |
| 10.875% 1/26/21 (b) | | 1,000,000 | 985,000 |
| 10.875% 1/26/21 (Reg. S) | | 1,735,000 | 1,708,975 |
| City of Buenos Aires 8.95% 2/19/21 (b) | | 125,000 | 124,213 |
| Province of Santa Fe 7% 3/23/23 (b) | | 740,000 | 626,232 |
| Provincia de Cordoba: | | | |
| 7.125% 6/10/21 (b) | | 1,215,000 | 1,069,200 |
| 7.45% 9/1/24 (b) | | 415,000 | 337,188 |
|
| TOTAL ARGENTINA | | | 12,375,726 |
|
| Armenia - 0.4% | | | |
| Republic of Armenia 6% 9/30/20 (b) | | 515,000 | 519,423 |
| Azerbaijan - 0.0% | | | |
| Azerbaijan Republic 4.75% 3/18/24 (b) | | 55,000 | 54,714 |
| Barbados - 0.1% | | | |
| Barbados Government: | | | |
| 7% 8/4/22 (b)(d) | | 215,000 | 117,981 |
| 7.25% 12/15/21 (b)(d) | | 20,000 | 10,975 |
|
| TOTAL BARBADOS | | | 128,956 |
|
| Belarus - 0.8% | | | |
| Belarus Republic: | | | |
| 6.875% 2/28/23 (b) | | 760,000 | 774,242 |
| 7.625% 6/29/27 (b) | | 280,000 | 286,360 |
|
| TOTAL BELARUS | | | 1,060,602 |
|
| Brazil - 2.4% | | | |
| Brazilian Federative Republic: | | | |
| 5.625% 1/7/41 | | 1,255,000 | 1,204,800 |
| 5.625% 2/21/47 | | 430,000 | 405,709 |
| 8.25% 1/20/34 | | 1,015,000 | 1,243,375 |
| 10% 1/1/21 | BRL | 725,000 | 195,666 |
|
| TOTAL BRAZIL | | | 3,049,550 |
|
| Cameroon - 0.5% | | | |
| Cameroon Republic 9.5% 11/19/25 (b) | | 600,000 | 611,136 |
| Colombia - 0.7% | | | |
| Colombian Republic: | | | |
| 6.125% 1/18/41 | | 115,000 | 124,200 |
| 7.375% 9/18/37 | | 135,000 | 163,283 |
| 10.375% 1/28/33 | | 380,000 | 564,621 |
|
| TOTAL COLOMBIA | | | 852,104 |
|
| Costa Rica - 0.1% | | | |
| Costa Rican Republic 7.158% 3/12/45 (b) | | 145,000 | 124,881 |
| Dominican Republic - 1.5% | | | |
| Dominican Republic: | | | |
| 5.5% 1/27/25 (b) | | 160,000 | 158,600 |
| 5.95% 1/25/27 (b) | | 295,000 | 293,894 |
| 6% 7/19/28 (b) | | 180,000 | 179,550 |
| 6.6% 1/28/24 (b) | | 300,000 | 312,750 |
| 6.85% 1/27/45 (b) | | 255,000 | 251,175 |
| 6.875% 1/29/26 (b) | | 365,000 | 382,794 |
| 7.45% 4/30/44 (b) | | 375,000 | 390,000 |
|
| TOTAL DOMINICAN REPUBLIC | | | 1,968,763 |
|
| Ecuador - 1.2% | | | |
| Ecuador Republic: | | | |
| 7.875% 1/23/28 (b) | | 200,000 | 162,500 |
| 8.875% 10/23/27 (b) | | 920,000 | 791,200 |
| 9.65% 12/13/26 (b) | | 600,000 | 546,000 |
|
| TOTAL ECUADOR | | | 1,499,700 |
|
| Egypt - 2.8% | | | |
| Arab Republic of Egypt: | | | |
| 5.577% 2/21/23 (b) | | 285,000 | 270,083 |
| 5.875% 6/11/25 (b) | | 200,000 | 181,915 |
| 6.125% 1/31/22 (b) | | 1,895,000 | 1,859,147 |
| 7.5% 1/31/27 (b) | | 300,000 | 285,799 |
| 7.903% 2/21/48 (b) | | 270,000 | 232,276 |
| 8.5% 1/31/47 (b) | | 785,000 | 707,524 |
|
| TOTAL EGYPT | | | 3,536,744 |
|
| El Salvador - 1.1% | | | |
| El Salvador Republic: | | | |
| 7.375% 12/1/19 (b) | | 955,000 | 958,581 |
| 7.65% 6/15/35 (Reg. S) | | 160,000 | 151,280 |
| 7.75% 1/24/23 (b) | | 260,000 | 267,475 |
|
| TOTAL EL SALVADOR | | | 1,377,336 |
|
| Gabon - 0.3% | | | |
| Gabonese Republic 6.375% 12/12/24 (b) | | 485,000 | 435,268 |
| Ghana - 0.1% | | | |
| Ghana Republic 8.627% 6/16/49 (b) | | 145,000 | 126,231 |
| Indonesia - 2.1% | | | |
| Indonesian Republic: | | | |
| 5.25% 1/17/42 (b) | | 200,000 | 200,733 |
| 6.625% 2/17/37 (b) | | 250,000 | 289,369 |
| 6.75% 1/15/44 (b) | | 200,000 | 237,866 |
| 7.75% 1/17/38 (b) | | 720,000 | 924,885 |
| 8.5% 10/12/35 (Reg. S) | | 775,000 | 1,042,356 |
|
| TOTAL INDONESIA | | | 2,695,209 |
|
| Iraq - 1.4% | | | |
| Republic of Iraq: | | | |
| 5.8% 1/15/28 (Reg. S) | | 1,685,000 | 1,506,761 |
| 6.752% 3/9/23 (b) | | 250,000 | 237,458 |
|
| TOTAL IRAQ | | | 1,744,219 |
|
| Ivory Coast - 0.4% | | | |
| Ivory Coast 5.75% 12/31/32 | | 536,500 | 472,721 |
| Jordan - 0.1% | | | |
| Jordanian Kingdom 7.375% 10/10/47 (b) | | 200,000 | 177,034 |
| Kenya - 0.3% | | | |
| Republic of Kenya: | | | |
| 6.875% 6/24/24 (b) | | 100,000 | 93,875 |
| 7.25% 2/28/28 (b) | | 85,000 | 75,891 |
| 8.25% 2/28/48 (b) | | 200,000 | 170,006 |
|
| TOTAL KENYA | | | 339,772 |
|
| Lebanon - 2.5% | | | |
| Lebanese Republic: | | | |
| 5.45% 11/28/19 | | 870,000 | 840,751 |
| 5.5% 4/23/19 | | 315,000 | 311,615 |
| 5.8% 4/14/20 | | 210,000 | 199,899 |
| 6% 5/20/19 | | 1,165,000 | 1,154,515 |
| 6% 1/27/23 | | 285,000 | 240,700 |
| 6.375% 3/9/20 | | 480,000 | 461,981 |
|
| TOTAL LEBANON | | | 3,209,461 |
|
| Malaysia - 0.2% | | | |
| Malaysian Government 3.955% 9/15/25 | MYR | 1,255,000 | 302,176 |
| Mexico - 0.4% | | | |
| United Mexican States 6.5% 6/9/22 | MXN | 9,740,000 | 465,139 |
| Mongolia - 0.4% | | | |
| Mongolian People's Republic 8.75% 3/9/24 (b) | | 490,000 | 523,883 |
| Morocco - 0.2% | | | |
| Moroccan Kingdom 4.25% 12/11/22 (b) | | 235,000 | 235,588 |
| Netherlands - 0.1% | | | |
| Republic of Angola 7% 8/17/19 (Issued by Northern Lights III BV for Republic of Angola) (Reg. S) | | 189,375 | 189,883 |
| Nigeria - 0.3% | | | |
| Republic of Nigeria: | | | |
| 7.696% 2/23/38 (b) | | 135,000 | 117,665 |
| 9.248% 1/21/49 (b) | | 270,000 | 261,858 |
|
| TOTAL NIGERIA | | | 379,523 |
|
| Oman - 0.4% | | | |
| Sultanate of Oman: | | | |
| 5.375% 3/8/27 (b) | | 125,000 | 109,284 |
| 6.5% 3/8/47 (b) | | 160,000 | 128,826 |
| 6.75% 1/17/48 (b) | | 350,000 | 288,750 |
|
| TOTAL OMAN | | | 526,860 |
|
| Pakistan - 1.5% | | | |
| Islamic Republic of Pakistan: | | | |
| 6.75% 12/3/19 (b) | | 590,000 | 584,138 |
| 7.25% 4/15/19 (b) | | 1,065,000 | 1,062,551 |
| 8.25% 4/15/24 (b) | | 345,000 | 347,505 |
|
| TOTAL PAKISTAN | | | 1,994,194 |
|
| Papua New Guinea - 0.2% | | | |
| Papua New Guinea 8.375% 10/4/28 (b) | | 200,000 | 201,250 |
| Peru - 0.3% | | | |
| Peruvian Republic 4% 3/7/27 (f) | | 380,000 | 375,717 |
| Qatar - 0.6% | | | |
| State of Qatar 4.5% 4/23/28 (b) | | 730,000 | 761,938 |
| Romania - 0.1% | | | |
| Romanian Republic 3.25% 4/29/24 | RON | 550,000 | 127,773 |
| Russia - 2.3% | | | |
| Ministry of Finance of the Russian Federation: | | | |
| 5.25% 6/23/47 (b) | | 1,000,000 | 932,586 |
| 5.875% 9/16/43 (b) | | 510,000 | 536,827 |
| 7.6% 7/20/22 | RUB | 22,190,000 | 314,651 |
| 12.75% 6/24/28 (Reg. S) | | 770,000 | 1,217,125 |
|
| TOTAL RUSSIA | | | 3,001,189 |
|
| Rwanda - 0.2% | | | |
| Rwanda Republic 6.625% 5/2/23 (b) | | 215,000 | 212,850 |
| Serbia - 0.1% | | | |
| Republic of Serbia 7.25% 9/28/21 (b) | | 170,000 | 182,973 |
| South Africa - 0.4% | | | |
| South African Republic 10.5% 12/21/26 | ZAR | 6,605,000 | 499,398 |
| Sri Lanka - 1.2% | | | |
| Democratic Socialist Republic of Sri Lanka: | | | |
| 5.125% 4/11/19 (b) | | 210,000 | 207,900 |
| 5.75% 4/18/23 (b) | | 200,000 | 184,038 |
| 6% 1/14/19 (b) | | 480,000 | 477,600 |
| 6.2% 5/11/27 (b) | | 200,000 | 176,029 |
| 6.25% 10/4/20 (b) | | 175,000 | 169,759 |
| 6.25% 7/27/21 (b) | | 160,000 | 153,943 |
| 6.85% 11/3/25 (b) | | 200,000 | 187,072 |
|
| TOTAL SRI LANKA | | | 1,556,341 |
|
| Turkey - 6.7% | | | |
| Turkish Republic: | | | |
| 5.125% 3/25/22 | | 245,000 | 238,384 |
| 5.625% 3/30/21 | | 740,000 | 739,945 |
| 5.75% 5/11/47 | | 165,000 | 134,267 |
| 6% 3/25/27 | | 350,000 | 329,106 |
| 6.25% 9/26/22 | | 2,950,000 | 2,966,927 |
| 6.75% 5/30/40 | | 515,000 | 471,101 |
| 6.875% 3/17/36 | | 835,000 | 781,702 |
| 7% 3/11/19 | | 565,000 | 566,876 |
| 7% 6/5/20 | | 575,000 | 586,066 |
| 7.25% 12/23/23 | | 275,000 | 282,296 |
| 7.25% 3/5/38 | | 565,000 | 546,277 |
| 7.375% 2/5/25 | | 825,000 | 849,998 |
| 8% 2/14/34 | | 125,000 | 130,204 |
|
| TOTAL TURKEY | | | 8,623,149 |
|
| Ukraine - 5.3% | | | |
| Ukraine Government: | | | |
| 7.75% 9/1/19 (b) | | 565,000 | 558,558 |
| 7.75% 9/1/20 (b) | | 1,345,000 | 1,295,628 |
| 7.75% 9/1/21 (b) | | 3,156,000 | 2,966,640 |
| 7.75% 9/1/22 (b) | | 1,856,000 | 1,700,764 |
| 9.75% 11/1/28 (b) | | 275,000 | 257,697 |
|
| TOTAL UKRAINE | | | 6,779,287 |
|
| United States of America - 3.1% | | | |
| U.S. Treasury Bonds 3% 2/15/48 | | 1,638,000 | 1,632,083 |
| U.S. Treasury Notes 2% 11/15/26 | | 2,471,000 | 2,360,436 |
|
| TOTAL UNITED STATES OF AMERICA | | | 3,992,519 |
|
| Uruguay - 0.1% | | | |
| Uruguay Republic 7.875% 1/15/33 pay-in-kind | | 145,000 | 190,573 |
| Venezuela - 0.9% | | | |
| Venezuelan Republic: | | | |
| 9.25% 9/15/27 (d) | | 2,840,000 | 660,300 |
| 11.95% 8/5/31 (Reg. S) (d) | | 1,880,000 | 441,800 |
| 12.75% 8/23/22 (d) | | 330,000 | 77,550 |
|
| TOTAL VENEZUELA | | | 1,179,650 |
|
| Vietnam - 1.0% | | | |
| Vietnamese Socialist Republic: | | | |
| 6 month U.S. LIBOR + 0.813% 3.375% 3/13/28 (c)(g)(h) | | 45,000 | 41,013 |
| 5.5% 3/12/28 | | 1,244,000 | 1,238,758 |
|
| TOTAL VIETNAM | | | 1,279,771 |
|
| TOTAL GOVERNMENT OBLIGATIONS | | | |
| (Cost $74,873,621) | | | 70,058,059 |
|
| Supranational Obligations - 0.3% | | | |
European Bank for Reconstruction & Development 6% 5/4/20 (Reg. S)
(Cost $346,571) | INR | 22,500,000 | 316,679 |
|
| Preferred Securities - 3.0% | | | |
| Brazil - 0.3% | | | |
| Itau Unibanco Holding SA 6.125% (b)(c)(e) | | 400,000 | 376,346 |
| Cayman Islands - 1.6% | | | |
| Banco Do Brasil SA 9% (b)(c)(e) | | 910,000 | 928,056 |
| Cosan Overseas Ltd. 8.25% (e) | | 960,000 | 979,467 |
| Odebrecht Finance Ltd. 7.5% (b)(e) | | 1,135,000 | 168,831 |
|
| TOTAL CAYMAN ISLANDS | | | 2,076,354 |
|
| Colombia - 0.2% | | | |
| Colombia Telecomunicaciones SA 8.5% (b)(c)(e) | | 210,000 | 220,363 |
| Ireland - 0.7% | | | |
| Alfa Bond Issuance PLC 8% (Reg. S) (c)(e) | | 475,000 | 428,842 |
| Tinkoff Credit Systems 9.25% (Reg. S) (c)(e) | | 400,000 | 395,347 |
|
| TOTAL IRELAND | | | 824,189 |
|
| Mexico - 0.2% | | | |
| Banco Mercantil del Norte SA 7.625% (b)(c)(e) | | 305,000 | 300,589 |
| TOTAL PREFERRED SECURITIES | | | |
| (Cost $4,361,818) | | | 3,797,841 |
| | | Shares | Value |
|
| Money Market Funds - 7.6% | | | |
| Fidelity Cash Central Fund, 2.42% (i) | | | |
| (Cost $9,771,240) | | 9,769,778 | 9,771,732 |
| TOTAL INVESTMENT IN SECURITIES - 98.4% | | | |
| (Cost $136,058,484) | | | 126,403,064 |
| NET OTHER ASSETS (LIABILITIES) - 1.6% | | | 2,092,087 |
| NET ASSETS - 100% | | | $128,495,151 |
Currency Abbreviations
BRL – Brazilian real
INR – Indian rupee
MXN – Mexican peso
MYR – Malyasian ringgit
RON – Romanian leu
RUB – Russian ruble
ZAR – South African rand
Categorizations in the Schedule of Investments are based on country or territory of incorporation.
Legend
(a) Amount is stated in United States dollars unless otherwise noted.
(b) Security exempt from registration under Rule 144A of the Securities Act of 1933. These securities may be resold in transactions exempt from registration, normally to qualified institutional buyers. At the end of the period, the value of these securities amounted to $62,546,009 or 48.7% of net assets.
(c) Coupon rates for floating and adjustable rate securities reflect the rates in effect at period end.
(d) Non-income producing - Security is in default.
(e) Security is perpetual in nature with no stated maturity date.
(f) Security initially issued at one coupon which converts to a higher coupon at a specified date. The rate shown is the rate at period end.
(g) Level 3 security
(h) Coupon is indexed to a floating interest rate which may be multiplied by a specified factor and/or subject to caps or floors.
(i) Affiliated fund that is generally available only to investment companies and other accounts managed by Fidelity Investments. The rate quoted is the annualized seven-day yield of the fund at period end. A complete unaudited listing of the fund's holdings as of its most recent quarter end is available upon request. In addition, each Fidelity Central Fund's financial statements, which are not covered by the Fund's Report of Independent Registered Public Accounting Firm, are available on the SEC's website or upon request.
Affiliated Central Funds
Information regarding fiscal year to date income earned by the Fund from investments in Fidelity Central Funds is as follows:
| Fund | Income earned |
| Fidelity Cash Central Fund | $169,384 |
| Total | $169,384 |
Amounts in the income column in the above table include any capital gain distributions from underlying funds, which are presented in the corresponding line-item in the Statement of Operations if applicable.
Investment Valuation
The following is a summary of the inputs used, as of December 31, 2018, involving the Fund's assets and liabilities carried at fair value. The inputs or methodology used for valuing securities may not be an indication of the risk associated with investing in those securities. For more information on valuation inputs, and their aggregation into the levels used below, please refer to the Investment Valuation section in the accompanying Notes to Financial Statements.
| | Valuation Inputs at Reporting Date: |
| Description | Total | Level 1 | Level 2 | Level 3 |
| Investments in Securities: | | | | |
| Corporate Bonds | $42,458,753 | $-- | $42,458,753 | $-- |
| Government Obligations | 70,058,059 | -- | 70,017,046 | 41,013 |
| Supranational Obligations | 316,679 | -- | 316,679 | -- |
| Preferred Securities | 3,797,841 | -- | 3,797,841 | -- |
| Money Market Funds | 9,771,732 | 9,771,732 | -- | -- |
| Total Investments in Securities: | $126,403,064 | $9,771,732 | $116,590,319 | $41,013 |
The following is a reconciliation of Investments in Securities for which Level 3 inputs were used in determining value:
| Investments in Securities: | |
| Government Obligations | |
| Beginning Balance | $1,703,548 |
| Net Realized Gain (Loss) on Investment Securities | -- |
| Net Unrealized Gain (Loss) on Investment Securities | 622 |
| Cost of Purchases | -- |
| Proceeds of Sales | -- |
| Amortization/Accretion | 471 |
| Transfers into Level 3 | -- |
| Transfers out of Level 3 | (1,663,628) |
| Ending Balance | $41,013 |
| The change in unrealized gain (loss) for the period attributable to Level 3 securities held at December 31, 2018 | $622 |
| Other Investments in Securities | |
| Beginning Balance | $515 |
| Net Realized Gain (Loss) on Investment Securities | (503,623) |
| Net Unrealized Gain (Loss) on Investment Securities | 503,114 |
| Cost of Purchases | -- |
| Proceeds of Sales | (6) |
| Amortization/Accretion | -- |
| Transfers into Level 3 | -- |
| Transfers out of Level 3 | -- |
| Ending Balance | $-- |
| The change in unrealized gain (loss) for the period attributable to Level 3 securities held at December 31, 2018 | $-- |
The information used in the above reconciliation represents fiscal year to date activity for any Investments in Securities identified as using Level 3 inputs at either the beginning or the end of the current fiscal period. Transfers into Level 3 were attributable to a lack of observable market data resulting from decreases in market activity, decreases in liquidity, security restructurings or corporate actions. Transfers out of Level 3 were attributable to observable market data becoming available for those securities. Transfers in or out of Level 3 represent the beginning value of any Security or Instrument where a change in the pricing level occurred from the beginning to the end of the period. The cost of purchases and the proceeds of sales may include securities received or delivered through corporate actions or exchanges. Realized and unrealized gains (losses) disclosed in the reconciliation are included in Net Gain (Loss) on the Fund's Statement of Operations.
Other Information
The composition of credit quality ratings as a percentage of Total Net Assets is as follows (Unaudited):
| U.S. Government and U.S. Government Agency Obligations | 3.1% |
| AAA,AA,A | 2.2% |
| BBB | 11.0% |
| BB | 23.5% |
| B | 35.9% |
| CCC,CC,C | 8.1% |
| D | 0.4% |
| Not Rated | 6.6% |
| Short-Term Investments and Net Other Assets | 9.2% |
| | 100.0% |
We have used ratings from Moody's Investors Service, Inc. Where Moody's® ratings are not available, we have used S&P® ratings. All ratings are as of the date indicated and do not reflect subsequent changes.
See accompanying notes which are an integral part of the financial statements.
Financial Statements
Statement of Assets and Liabilities
| | | December 31, 2018 |
| Assets | | |
Investment in securities, at value — See accompanying schedule:
Unaffiliated issuers (cost $126,287,244) | $116,631,332 | |
| Fidelity Central Funds (cost $9,771,240) | 9,771,732 | |
| Total Investment in Securities (cost $136,058,484) | | $126,403,064 |
| Cash | | 272,579 |
| Foreign currency held at value (cost $9,005) | | 8,703 |
| Receivable for fund shares sold | | 52,333 |
| Interest receivable | | 2,158,394 |
| Distributions receivable from Fidelity Central Funds | | 20,072 |
| Total assets | | 128,915,145 |
| Liabilities | | |
| Payable for investments purchased | $352,451 | |
| Payable for fund shares redeemed | 64,172 | |
| Distributions payable | 21 | |
| Other payables and accrued expenses | 3,350 | |
| Total liabilities | | 419,994 |
| Net Assets | | $128,495,151 |
| Net Assets consist of: | | |
| Paid in capital | | $140,532,099 |
| Total distributable earnings (loss) | | (12,036,948) |
| Net Assets, for 14,109,321 shares outstanding | | $128,495,151 |
| Net Asset Value, offering price and redemption price per share ($128,495,151 ÷ 14,109,321 shares) | | $9.11 |
See accompanying notes which are an integral part of the financial statements.
Statement of Operations
| | | Year ended December 31, 2018 |
| Investment Income | | |
| Dividends | | $377,724 |
| Interest | | 7,188,671 |
| Income from Fidelity Central Funds | | 169,384 |
| Income before foreign taxes withheld | | 7,735,779 |
| Less foreign taxes withheld | | (452) |
| Total income | | 7,735,327 |
| Expenses | | |
| Custodian fees and expenses | $11,932 | |
| Independent trustees' fees and expenses | 707 | |
| Total expenses before reductions | 12,639 | |
| Expense reductions | (7,609) | |
| Total expenses after reductions | | 5,030 |
| Net investment income (loss) | | 7,730,297 |
| Realized and Unrealized Gain (Loss) | | |
| Net realized gain (loss) on: | | |
| Investment securities: | | |
| Unaffiliated issuers | (2,676,664) | |
| Fidelity Central Funds | (8) | |
| Foreign currency transactions | (19,708) | |
| Total net realized gain (loss) | | (2,696,380) |
| Change in net unrealized appreciation (depreciation) on: | | |
| Investment securities: | | |
| Unaffiliated issuers | (11,168,068) | |
| Fidelity Central Funds | 19 | |
| Assets and liabilities in foreign currencies | (76) | |
| Total change in net unrealized appreciation (depreciation) | | (11,168,125) |
| Net gain (loss) | | (13,864,505) |
| Net increase (decrease) in net assets resulting from operations | | $(6,134,208) |
See accompanying notes which are an integral part of the financial statements.
Statement of Changes in Net Assets
| | Year ended December 31, 2018 | Year ended December 31, 2017 |
| Increase (Decrease) in Net Assets | | |
| Operations | | |
| Net investment income (loss) | $7,730,297 | $8,401,615 |
| Net realized gain (loss) | (2,696,380) | 1,502,356 |
| Change in net unrealized appreciation (depreciation) | (11,168,125) | 2,796,803 |
| Net increase (decrease) in net assets resulting from operations | (6,134,208) | 12,700,774 |
| Distributions to shareholders | (7,559,273) | – |
| Distributions to shareholders from net investment income | – | (8,988,172) |
| Distributions to shareholders from net realized gain | – | (329,641) |
| Total distributions | (7,559,273) | (9,317,813) |
| Share transactions | | |
| Proceeds from sales of shares | 10,922,043 | 9,078,739 |
| Reinvestment of distributions | 7,559,250 | 9,317,813 |
| Cost of shares redeemed | (9,430,277) | (5,164,925) |
| Net increase (decrease) in net assets resulting from share transactions | 9,051,016 | 13,231,627 |
| Total increase (decrease) in net assets | (4,642,465) | 16,614,588 |
| Net Assets | | |
| Beginning of period | 133,137,616 | 116,523,028 |
| End of period | $128,495,151 | $133,137,616 |
| Other Information | | |
| Undistributed net investment income end of period | | $479,405 |
| Shares | | |
| Sold | 1,127,992 | 892,925 |
| Issued in reinvestment of distributions | 796,396 | 916,404 |
| Redeemed | (988,322) | (509,245) |
| Net increase (decrease) | 936,066 | 1,300,084 |
See accompanying notes which are an integral part of the financial statements.
Financial Highlights
Fidelity Emerging Markets Debt Central Fund
| | | | | | |
| Years ended December 31, | 2018 | 2017 | 2016 | 2015 | 2014 |
| Selected Per–Share Data | | | | | |
| Net asset value, beginning of period | $10.11 | $9.81 | $9.04 | $9.47 | $9.94 |
| Income from Investment Operations | | | | | |
| Net investment income (loss)A | .564 | .686 | .754 | .744 | .702 |
| Net realized and unrealized gain (loss) | (1.013) | .370 | .707 | (.526) | (.501) |
| Total from investment operations | (.449) | 1.056 | 1.461 | .218 | .201 |
| Distributions from net investment income | (.551) | (.730) | (.691) | (.648) | (.627) |
| Distributions from net realized gain | – | (.026) | – | – | (.044) |
| Total distributions | (.551) | (.756) | (.691) | (.648) | (.671) |
| Net asset value, end of period | $9.11 | $10.11 | $9.81 | $9.04 | $9.47 |
| Total ReturnB,C | (4.52)% | 10.99% | 16.50% | 2.26% | 1.81% |
| Ratios to Average Net AssetsD,E | | | | | |
| Expenses before reductions | .01% | .01% | .01% | .01% | .01% |
| Expenses net of fee waivers, if any | .01% | .01% | .01% | .01% | .01% |
| Expenses net of all reductions | - %F | .01% | .01% | .01% | .01% |
| Net investment income (loss) | 5.91% | 6.76% | 7.80% | 7.89% | 6.96% |
| Supplemental Data | | | | | |
| Net assets, end of period (000 omitted) | $128,495 | $133,138 | $116,523 | $103,080 | $104,125 |
| Portfolio turnover rateG | 40% | 57% | 48% | 39% | 42% |
A Calculated based on average shares outstanding during the period.
B Total returns for periods of less than one year are not annualized.
C Total returns would have been lower if certain expenses had not been reduced during the applicable periods shown.
D Fees and expenses of any underlying Fidelity Central Funds are not included in the Fund's expense ratio. The Fund indirectly bears its proportionate share of the expenses of any underlying Fidelity Central Funds.
E Expense ratios reflect operating expenses of the Fund. Expenses before reductions do not reflect amounts reimbursed by the investment adviser or reductions from expense offset arrangements and do not represent the amount paid by the Fund during periods when reimbursements or reductions occur. Expenses net of fee waivers reflect expenses after reimbursement by the investment adviser but prior to reductions from expense offset arrangements. Expenses net of all reductions represent the net expenses paid by the Fund.
F Amount represents less than .005%.
G Amount does not include the portfolio activity of any underlying Fidelity Central Funds.
See accompanying notes which are an integral part of the financial statements.
Notes to Financial Statements
For the period ended December 31, 2018
1. Organization.
Fidelity Emerging Markets Debt Central Fund (the Fund) is a non-diversified fund of Fidelity Hanover Street Trust (the Trust) and is authorized to issue an unlimited number of shares. Shares of the Fund are only offered to other investment companies and accounts managed by Fidelity Management & Research Company (FMR), or its affiliates (the Investing Funds). The Trust is registered under the Investment Company Act of 1940, as amended (the 1940 Act), as an open-end management investment company organized as a Massachusetts business trust.
2. Investments in Fidelity Central Funds.
The Fund invests in Fidelity Central Funds, which are open-end investment companies generally available only to other investment companies and accounts managed by the investment adviser and its affiliates. The Fund's Schedule of Investments lists each of the Fidelity Central Funds held as of period end, if any, as an investment of the Fund, but does not include the underlying holdings of each Fidelity Central Fund. As an Investing Fund, the Fund indirectly bears its proportionate share of the expenses of the underlying Fidelity Central Funds.
The Money Market Central Funds seek preservation of capital and current income and are managed by Fidelity Investments Money Management, Inc. (FIMM), an affiliate of the investment adviser. Annualized expenses of the Money Market Central Funds as of their most recent shareholder report date are less than .005%.
A complete unaudited list of holdings for each Fidelity Central Fund is available upon request or at the Securities and Exchange Commission (the SEC) website at www.sec.gov. In addition, the financial statements of the Fidelity Central Funds, which are not covered by the Fund's Report of Independent Registered Public Accounting Firm, are available on the SEC website or upon request.
3. Significant Accounting Policies.
The Fund is an investment company and applies the accounting and reporting guidance of the Financial Accounting Standards Board (FASB) Accounting Standards Codification Topic 946 Financial Services – Investments Companies. The financial statements have been prepared in conformity with accounting principles generally accepted in the United States of America (GAAP), which require management to make certain estimates and assumptions at the date of the financial statements. Actual results could differ from those estimates. Subsequent events, if any, through the date that the financial statements were issued have been evaluated in the preparation of the financial statements. The following summarizes the significant accounting policies of the Fund:
Investment Valuation. Investments are valued as of 4:00 p.m. Eastern time on the last calendar day of the period. The Board of Trustees (the Board) has delegated the day to day responsibility for the valuation of the Fund's investments to the Fair Value Committee (the Committee) established by the Fund's investment adviser. In accordance with valuation policies and procedures approved by the Board, the Fund attempts to obtain prices from one or more third party pricing vendors or brokers to value its investments. When current market prices, quotations or currency exchange rates are not readily available or reliable, investments will be fair valued in good faith by the Committee, in accordance with procedures adopted by the Board. Factors used in determining fair value vary by investment type and may include market or investment specific events, changes in interest rates and credit quality. The frequency with which these procedures are used cannot be predicted and they may be utilized to a significant extent. The Committee oversees the Fund's valuation policies and procedures and reports to the Board on the Committee's activities and fair value determinations. The Board monitors the appropriateness of the procedures used in valuing the Fund's investments and ratifies the fair value determinations of the Committee.
The Fund categorizes the inputs to valuation techniques used to value its investments into a disclosure hierarchy consisting of three levels as shown below:
- Level 1 – quoted prices in active markets for identical investments
- Level 2 – other significant observable inputs (including quoted prices for similar investments, interest rates, prepayment speeds, etc.)
- Level 3 – unobservable inputs (including the Fund's own assumptions based on the best information available)
Valuation techniques used to value the Fund's investments by major category are as follows:
Debt securities, including restricted securities, are valued based on evaluated prices received from third party pricing vendors or from brokers who make markets in such securities. Corporate bonds, foreign government and government agency obligations, preferred securities, supranational obligations and U.S. government and government agency obligations are valued by pricing vendors who utilize matrix pricing which considers yield or price of bonds of comparable quality, coupon, maturity and type or by broker-supplied prices. When independent prices are unavailable or unreliable, debt securities may be valued utilizing pricing methodologies which consider similar factors that would be used by third party pricing vendors. For foreign debt securities, when significant market or security specific events arise, valuations may be determined in good faith in accordance with procedures adopted by the Board. Debt securities are generally categorized as Level 2 in the hierarchy but may be Level 3 depending on the circumstances. The Fund invests a significant portion of its assets in below investment grade securities. The value of these securities can be more volatile due to changes in the credit quality of the issuer and is sensitive to changes in economic, market and regulatory conditions.
Equity securities, including restricted securities, for which market quotations are readily available, are valued at the last reported sale price or official closing price as reported by a third party pricing vendor on the primary market or exchange on which they are traded and are categorized as Level 1 in the hierarchy. In the event there were no sales during the day or closing prices are not available, securities are valued at the last quoted bid price or may be valued using the last available price and are generally categorized as Level 2 in the hierarchy. For foreign equity securities, when market or security specific events arise, comparisons to the valuation of American Depositary Receipts (ADRs), futures contracts, Exchange-Traded Funds (ETFs) and certain indexes as well as quoted prices for similar securities may be used and would be categorized as Level 2 in the hierarchy. Utilizing these techniques may result in transfers between Level 1 and Level 2. For equity securities, including restricted securities, where observable inputs are limited, assumptions about market activity and risk are used and these securities may be categorized as Level 3 in the hierarchy.
Investments in open-end mutual funds, including the Fidelity Central Funds, are valued at their closing net asset value (NAV) each business day and are categorized as Level 1 in the hierarchy.
Changes in valuation techniques may result in transfers in or out of an assigned level within the disclosure hierarchy. The aggregate value of investments by input level as of December 31, 2018, as well as a roll forward of Level 3 investments, is included at the end of the Fund's Schedule of Investments.
Foreign Currency. The Fund may use foreign currency contracts to facilitate transactions in foreign-denominated securities. Gains and losses from these transactions may arise from changes in the value of the foreign currency or if the counterparties do not perform under the contracts' terms.
Foreign-denominated assets, including investment securities, and liabilities are translated into U.S. dollars at the exchange rates at period end. Purchases and sales of investment securities, income and dividends received and expenses denominated in foreign currencies are translated into U.S. dollars at the exchange rate in effect on the transaction date.
The effects of exchange rate fluctuations on investments are included with the net realized and unrealized gain (loss) on investment securities. Other foreign currency transactions resulting in realized and unrealized gain (loss) are disclosed separately.
Investment Transactions and Income. For financial reporting purposes, the Fund's investment holdings and NAV include trades executed through the end of the last business day of the period. The NAV per share for processing shareholder transactions is calculated as of the close of business of the New York Stock Exchange (NYSE), normally 4:00 p.m. Eastern time and includes trades executed through the end of the prior business day. Gains and losses on securities sold are determined on the basis of identified cost and include proceeds received from litigation. Dividend income is recorded on the ex-dividend date, except for certain dividends from foreign securities where the ex-dividend date may have passed, which are recorded as soon as the Fund is informed of the ex-dividend date. Non-cash dividends included in dividend income, if any, are recorded at the fair market value of the securities received. Income and capital gain distributions from Fidelity Central Funds, if any, are recorded on the ex-dividend date. Interest income is accrued as earned and includes coupon interest and amortization of premium and accretion of discount on debt securities as applicable. Paid in Kind (PIK) income is recorded at the fair market value of the securities received. Investment income is recorded net of foreign taxes withheld where recovery of such taxes is uncertain. Debt obligations may be placed on non-accrual status and related interest income may be reduced by ceasing current accruals and writing off interest receivables when the collection of all or a portion of interest has become doubtful based on consistently applied procedures. A debt obligation is removed from non-accrual status when the issuer resumes interest payments or when collectability of interest is reasonably assured.
Expenses. Expenses directly attributable to a fund are charged to that fund. Expenses attributable to more than one fund are allocated among the respective funds on the basis of relative net assets or other appropriate methods. Expense estimates are accrued in the period to which they relate and adjustments are made when actual amounts are known.
Income Tax Information and Distributions to Shareholders. Each year, the Fund intends to qualify as a regulated investment company under Subchapter M of the Internal Revenue Code, including distributing substantially all of its taxable income and realized gains. As a result, no provision for U.S. Federal income taxes is required. As of December 31, 2018, the Fund did not have any unrecognized tax benefits in the financial statements; nor is the Fund aware of any tax positions for which it is reasonably possible that the total amounts of unrecognized tax benefits will significantly change in the next twelve months. The Fund files a U.S. federal tax return, in addition to state and local tax returns as required. The Fund's federal income tax returns are subject to examination by the Internal Revenue Service (IRS) for a period of three fiscal years after they are filed. State and local tax returns may be subject to examination for an additional fiscal year depending on the jurisdiction. Foreign taxes are provided for based on the Fund's understanding of the tax rules and rates that exist in the foreign markets in which it invests.
Distributions are declared and recorded daily and paid monthly from net investment income. Distributions from realized gains, if any, are declared and recorded on the ex-dividend date. Income and capital gain distributions are determined in accordance with income tax regulations, which may differ from GAAP.
Capital accounts within the financial statements are adjusted for permanent book-tax differences. These adjustments have no impact on net assets or the results of operations. Capital accounts are not adjusted for temporary book-tax differences which will reverse in a subsequent period.
Book-tax differences are primarily due to foreign currency transactions, market discount, capital loss carryforwards and losses deferred due to wash sales and excise tax regulations.
As of period end, the cost and unrealized appreciation (depreciation) in securities, and derivatives if applicable, for federal income tax purposes were as follows:
| Gross unrealized appreciation | $1,572,515 |
| Gross unrealized depreciation | (10,765,203) |
| Net unrealized appreciation (depreciation) | $(9,192,688) |
| Tax Cost | $135,595,752 |
The tax-based components of distributable earnings as of period end were as follows:
| Capital loss carryforward | $(2,535,313) |
| Net unrealized appreciation (depreciation) on securities and other investments | $(9,193,187) |
Capital loss carryforwards are only available to offset future capital gains of the Fund to the extent provided by regulations and may be limited. Under the Regulated Investment Company Modernization Act of 2010 (the Act), the Fund is permitted to carry forward capital losses incurred in taxable years beginning after December 22, 2010 for an unlimited period and such capital losses are required to be used prior to any losses that expire. The capital loss carryforward information presented below, including any applicable limitation, is estimated as of fiscal period end and is subject to adjustment.
| No expiration | |
| Short-term | $(660,336) |
| Long-term | (1,874,977) |
| Total capital loss carryforward | $(2,535,313) |
The tax character of distributions paid was as follows:
| | December 31, 2018 | December 31, 2017 |
| Ordinary Income | $7,559,273 | $ 9,114,957 |
| Long-term Capital Gains | – | 202,856 |
| Total | $7,559,273 | $ 9,317,813 |
Restricted Securities. The Fund may invest in securities that are subject to legal or contractual restrictions on resale. These securities generally may be resold in transactions exempt from registration or to the public if the securities are registered. Disposal of these securities may involve time-consuming negotiations and expense, and prompt sale at an acceptable price may be difficult. Information regarding restricted securities is included at the end of the Fund's Schedule of Investments.
New Rule Issuance. During August 2018, the U.S. Securities and Exchange Commission issued Final Rule Release No. 33-10532, Disclosure Update and Simplification. This Final Rule includes amendments specific to registered investment companies that are intended to eliminate overlap in disclosure requirements between Regulation S-X and GAAP. In accordance with these amendments, certain line-items in the Fund's financial statements have been combined or removed for the current period as outlined in the table below.
| Financial Statement | Current Line-Item Presentation | Prior Line-Item Presentation |
| Statement of Assets and Liabilities | Total distributable earnings (loss) | Undistributed/Distributions in excess of/Accumulated net investment income (loss)
Accumulated/Undistributed net realized gain (loss)
Net unrealized appreciation (depreciation) |
| Statement of Changes in Net Assets | N/A - removed | Undistributed/Distributions in excess of/Accumulated net investment income (loss) end of period |
| Statement of Changes in Net Assets | Distributions to shareholders | Distributions to shareholders from net investment income
Distributions to shareholders from net realized gain |
4. Purchases and Sales of Investments.
Purchases and sales of securities, other than short-term securities, aggregated $54,152,827 and $45,874,984, respectively.
5. Fees and Other Transactions with Affiliates.
Management Fee and Expense Contract. FMR Co., Inc. (the investment adviser), an affiliate of FMR, provides the Fund with investment management services. The Fund does not pay any fees for these services. Pursuant to the Fund's management contract with the investment adviser, FMR pays the investment adviser a portion of the management fees it receives from the Investing Funds. In addition, under an expense contract, FMR also pays all other expenses of the Fund, excluding custody fees, the compensation of the independent Trustees, and certain miscellaneous expenses such as proxy and shareholder meeting expenses.
Interfund Trades. The Fund may purchase from or sell securities to other Fidelity Funds under procedures adopted by the Board. The procedures have been designed to ensure these interfund trades are executed in accordance with Rule 17a-7 of the 1940 Act. Interfund trades are included within the respective purchases and sales amounts shown in the Purchases and Sales of Investments note.
6. Expense Reductions.
Through arrangements with the Fund's custodian, credits realized as a result of certain uninvested cash balances were used to reduce the Fund's expenses. During the period, these credits reduced the Fund's custody expenses by $7,609.
7. Other.
The Fund's organizational documents provide former and current trustees and officers with a limited indemnification against liabilities arising in connection with the performance of their duties to the Fund. In the normal course of business, the Fund may also enter into contracts that provide general indemnifications. The Fund's maximum exposure under these arrangements is unknown as this would be dependent on future claims that may be made against the Fund. The risk of material loss from such claims is considered remote.
At the end of the period, mutual funds managed by FMR or its affiliates were the owners of record of all of the outstanding shares of the Fund.
8. Credit Risk.
The Fund's relatively large investment in countries with limited or developing capital markets may involve greater risks than investments in more developed markets and the prices of such investments may be volatile. The yields of emerging market debt obligations reflect, among other things, perceived credit risk. The consequences of political, social or economic changes in these markets may have disruptive effects on the market prices of the Fund's investments and the income they generate, as well as the Fund's ability to repatriate such amounts.
Report of Independent Registered Public Accounting Firm
To the Board of Trustees of Fidelity Hanover Street Trust and Shareholders of Fidelity Emerging Markets Debt Central Fund:
Opinion on the Financial Statements
We have audited the accompanying statement of assets and liabilities, including the schedule of investments, of Fidelity Emerging Markets Debt Central Fund (one of the funds constituting Fidelity Hanover Street Trust, referred to hereafter as the "Fund") as of December 31, 2018, the related statement of operations for the year ended December 31, 2018, the statement of changes in net assets for each of the two years in the period ended December 31, 2018, including the related notes, and the financial highlights for each of the five years in the period ended December 31, 2018 (collectively referred to as the “financial statements”). In our opinion, the financial statements present fairly, in all material respects, the financial position of the Fund as of December 31, 2018, the results of its operations for the year then ended, the changes in its net assets for each of the two years in the period ended December 31, 2018 and the financial highlights for each of the five years in the period ended December 31, 2018 in conformity with accounting principles generally accepted in the United States of America.
Basis for Opinion
These financial statements are the responsibility of the Fund’s management. Our responsibility is to express an opinion on the Fund’s financial statements based on our audits. We are a public accounting firm registered with the Public Company Accounting Oversight Board (United States) (PCAOB) and are required to be independent with respect to the Fund in accordance with the U.S. federal securities laws and the applicable rules and regulations of the Securities and Exchange Commission and the PCAOB.
We conducted our audits of these financial statements in accordance with the standards of the PCAOB. Those standards require that we plan and perform the audit to obtain reasonable assurance about whether the financial statements are free of material misstatement, whether due to error or fraud.
Our audits included performing procedures to assess the risks of material misstatement of the financial statements, whether due to error or fraud, and performing procedures that respond to those risks. Such procedures included examining, on a test basis, evidence regarding the amounts and disclosures in the financial statements. Our audits also included evaluating the accounting principles used and significant estimates made by management, as well as evaluating the overall presentation of the financial statements. Our procedures included confirmation of securities owned as of December 31, 2018 by correspondence with the custodian and brokers; when replies were not received from brokers, we performed other auditing procedures. We believe that our audits provide a reasonable basis for our opinion.
PricewaterhouseCoopers LLP
Boston, Massachusetts
February 15, 2019
We have served as the auditor of one or more investment companies in the Fidelity group of funds since 1932.
Trustees and Officers
The Trustees, Members of the Advisory Board (if any), and officers of the trust and fund, as applicable, are listed below. The Board of Trustees governs the fund and is responsible for protecting the interests of shareholders. The Trustees are experienced executives who meet periodically throughout the year to oversee the fund's activities, review contractual arrangements with companies that provide services to the fund, oversee management of the risks associated with such activities and contractual arrangements, and review the fund's performance. Except for Michael E. Wiley, each of the Trustees oversees 283 funds. Mr. Wiley oversees 192 funds.
The Trustees hold office without limit in time except that (a) any Trustee may resign; (b) any Trustee may be removed by written instrument, signed by at least two-thirds of the number of Trustees prior to such removal; (c) any Trustee who requests to be retired or who has become incapacitated by illness or injury may be retired by written instrument signed by a majority of the other Trustees; and (d) any Trustee may be removed at any special meeting of shareholders by a two-thirds vote of the outstanding voting securities of the trust. Each Trustee who is not an interested person (as defined in the 1940 Act) of the trust and the fund is referred to herein as an Independent Trustee. Each Independent Trustee shall retire not later than the last day of the calendar year in which his or her 75th birthday occurs. The Independent Trustees may waive this mandatory retirement age policy with respect to individual Trustees. Officers and Advisory Board Members hold office without limit in time, except that any officer or Advisory Board Member may resign or may be removed by a vote of a majority of the Trustees at any regular meeting or any special meeting of the Trustees. Except as indicated, each individual has held the office shown or other offices in the same company for the past five years.
The fund’s Statement of Additional Information (SAI) includes more information about the Trustees. To request a free copy, call Fidelity at 1-800-544-8544.
Experience, Skills, Attributes, and Qualifications of the Trustees. The Governance and Nominating Committee has adopted a statement of policy that describes the experience, qualifications, attributes, and skills that are necessary and desirable for potential Independent Trustee candidates (Statement of Policy). The Board believes that each Trustee satisfied at the time he or she was initially elected or appointed a Trustee, and continues to satisfy, the standards contemplated by the Statement of Policy. The Governance and Nominating Committee also engages professional search firms to help identify potential Independent Trustee candidates who have the experience, qualifications, attributes, and skills consistent with the Statement of Policy. From time to time, additional criteria based on the composition and skills of the current Independent Trustees, as well as experience or skills that may be appropriate in light of future changes to board composition, business conditions, and regulatory or other developments, have also been considered by the professional search firms and the Governance and Nominating Committee. In addition, the Board takes into account the Trustees' commitment and participation in Board and committee meetings, as well as their leadership of standing and ad hoc committees throughout their tenure.
In determining that a particular Trustee was and continues to be qualified to serve as a Trustee, the Board has considered a variety of criteria, none of which, in isolation, was controlling. The Board believes that, collectively, the Trustees have balanced and diverse experience, qualifications, attributes, and skills, which allow the Board to operate effectively in governing the fund and protecting the interests of shareholders. Information about the specific experience, skills, attributes, and qualifications of each Trustee, which in each case led to the Board's conclusion that the Trustee should serve (or continue to serve) as a trustee of the fund, is provided below.
Board Structure and Oversight Function. James C. Curvey is an interested person and currently serves as Chairman. The Trustees have determined that an interested Chairman is appropriate and benefits shareholders because an interested Chairman has a personal and professional stake in the quality and continuity of services provided to the fund. Independent Trustees exercise their informed business judgment to appoint an individual of their choosing to serve as Chairman, regardless of whether the Trustee happens to be independent or a member of management. The Independent Trustees have determined that they can act independently and effectively without having an Independent Trustee serve as Chairman and that a key structural component for assuring that they are in a position to do so is for the Independent Trustees to constitute a substantial majority for the Board. The Independent Trustees also regularly meet in executive session. Ned C. Lautenbach serves as Chairman of the Independent Trustees and as such (i) acts as a liaison between the Independent Trustees and management with respect to matters important to the Independent Trustees and (ii) with management prepares agendas for Board meetings.
Fidelity® funds are overseen by different Boards of Trustees. The fund's Board oversees Fidelity's high income and certain equity funds, and other Boards oversee Fidelity's investment-grade bond, money market, asset allocation, and other equity funds. The asset allocation funds may invest in Fidelity® funds overseen by the fund's Board. The use of separate Boards, each with its own committee structure, allows the Trustees of each group of Fidelity® funds to focus on the unique issues of the funds they oversee, including common research, investment, and operational issues. On occasion, the separate Boards establish joint committees to address issues of overlapping consequences for the Fidelity® funds overseen by each Board.
The Trustees operate using a system of committees to facilitate the timely and efficient consideration of all matters of importance to the Trustees, the fund, and fund shareholders and to facilitate compliance with legal and regulatory requirements and oversight of the fund's activities and associated risks. The Board, acting through its committees, has charged FMR and its affiliates with (i) identifying events or circumstances the occurrence of which could have demonstrably adverse effects on the fund's business and/or reputation; (ii) implementing processes and controls to lessen the possibility that such events or circumstances occur or to mitigate the effects of such events or circumstances if they do occur; and (iii) creating and maintaining a system designed to evaluate continuously business and market conditions in order to facilitate the identification and implementation processes described in (i) and (ii) above. Because the day-to-day operations and activities of the fund are carried out by or through FMR, its affiliates, and other service providers, the fund's exposure to risks is mitigated but not eliminated by the processes overseen by the Trustees. While each of the Board's committees has responsibility for overseeing different aspects of the fund's activities, oversight is exercised primarily through the Operations, Audit, and Compliance Committees. In addition, the Independent Trustees have worked with Fidelity to enhance the Board's oversight of investment and financial risks, legal and regulatory risks, technology risks, and operational risks, including the development of additional risk reporting to the Board. Appropriate personnel, including but not limited to the fund's Chief Compliance Officer (CCO), FMR's internal auditor, the independent accountants, the fund's Treasurer and portfolio management personnel, make periodic reports to the Board's committees, as appropriate, including an annual review of Fidelity's risk management program for the Fidelity® funds. The responsibilities of each standing committee, including their oversight responsibilities, are described further under "Standing Committees of the Trustees."
Interested Trustees*:
Correspondence intended for a Trustee who is an interested person may be sent to Fidelity Investments, 245 Summer Street, Boston, Massachusetts 02210.
Name, Year of Birth; Principal Occupations and Other Relevant Experience+
James C. Curvey (1935)
Year of Election or Appointment: 2007
Trustee
Chairman of the Board of Trustees
Mr. Curvey also serves as Trustee of other Fidelity® funds. Mr. Curvey is Vice Chairman (2007-present) and Director of FMR LLC (diversified financial services company). In addition, Mr. Curvey is an Overseer Emeritus for the Boston Symphony Orchestra, a Director of Artis-Naples, and a Trustee of Brewster Academy in Wolfeboro, New Hampshire. Previously, Mr. Curvey served as a Director of Fidelity Research & Analysis Co. (investment adviser firm, 2009-2018), Director of Fidelity Investments Money Management, Inc. (investment adviser firm, 2009-2014) and a Director of FMR and FMR Co., Inc. (investment adviser firms, 2007-2014).
* Determined to be an “Interested Trustee” by virtue of, among other things, his or her affiliation with the trust or various entities under common control with FMR.
+ The information includes the Trustee's principal occupation during the last five years and other information relating to the experience, attributes, and skills relevant to the Trustee's qualifications to serve as a Trustee, which led to the conclusion that the Trustee should serve as a Trustee for the fund.
Independent Trustees:
Correspondence intended for an Independent Trustee may be sent to Fidelity Investments, P.O. Box 55235, Boston, Massachusetts 02205-5235.
Name, Year of Birth; Principal Occupations and Other Relevant Experience+
Dennis J. Dirks (1948)
Year of Election or Appointment: 2007
Trustee
Mr. Dirks also serves as Trustee of other Fidelity® funds. Prior to his retirement in May 2003, Mr. Dirks was Chief Operating Officer and a member of the Board of The Depository Trust & Clearing Corporation (DTCC). He also served as President, Chief Operating Officer, and Board member of The Depository Trust Company (DTC) and President and Board member of the National Securities Clearing Corporation (NSCC). In addition, Mr. Dirks served as Chief Executive Officer and Board member of the Government Securities Clearing Corporation, Chief Executive Officer and Board member of the Mortgage-Backed Securities Clearing Corporation, as a Trustee and a member of the Finance Committee of Manhattan College (2005-2008), as a Trustee and a member of the Finance Committee of AHRC of Nassau County (2006-2008), as a member of the Independent Directors Council (IDC) Governing Council (2010-2015), and as a member of the Board of Directors for The Brookville Center for Children’s Services, Inc. (2009-2017). Mr. Dirks is a member of the Finance Committee (2016-present) and Board of Directors (2017-present) and is Treasurer (2018-present) of the Asolo Repertory Theatre.
Donald F. Donahue (1950)
Year of Election or Appointment: 2018
Trustee
Mr. Donahue also serves as a Trustee of other Fidelity® funds. Mr. Donahue is President and Chief Executive Officer of Miranda Partners, LLC (risk consulting for the financial services industry, 2012-present). Previously, Mr. Donahue served as a Member of the Advisory Board of certain Fidelity® funds (2015-2018) and Chief Executive Officer (2006-2012), Chief Operating Officer (2003-2006), and Managing Director, Customer Marketing and Development (1999-2003) of The Depository Trust & Clearing Corporation (financial markets infrastructure). Mr. Donahue serves as a Member (2007-present) and Co-Chairman (2016-present) of the Board of Directors of United Way of New York, Member of the Board of Directors of NYC Leadership Academy (2012-present) and Member of the Board of Advisors of Ripple Labs, Inc. (financial services, 2015-present). He also served as Chairman (2010-2012) and Member of the Board of Directors (2012-2013) of Omgeo, LLC (financial services), Treasurer of United Way of New York (2012-2016), and Member of the Board of Directors of XBRL US (financial services non-profit, 2009-2012) and the International Securities Services Association (2009-2012).
Alan J. Lacy (1953)
Year of Election or Appointment: 2008
Trustee
Mr. Lacy also serves as Trustee of other Fidelity® funds. Mr. Lacy serves as a Director of Bristol-Myers Squibb Company (global pharmaceuticals, 2008-present). He is a Trustee of the California Chapter of The Nature Conservancy (2015-present) and a Director of the Center for Advanced Study in the Behavioral Sciences at Stanford University (2015-present). In addition, Mr. Lacy served as Senior Adviser (2007-2014) of Oak Hill Capital Partners, L.P. (private equity) and also served as Chief Executive Officer (2005) and Vice Chairman (2005-2006) of Sears Holdings Corporation (retail) and Chief Executive Officer and Chairman of the Board of Sears, Roebuck and Co. (retail, 2000-2005). Previously, Mr. Lacy served as Chairman (2014-2017) and a member (2010-2017) of the Board of Directors of Dave & Buster’s Entertainment, Inc. (restaurant and entertainment complexes), as Chairman (2008-2011) and a member (2006-2015) of the Board of Trustees of the National Parks Conservation Association, and as a member of the Board of Directors for The Hillman Companies, Inc. (hardware wholesalers, 2010-2014), Earth Fare, Inc. (retail grocery, 2010-2014), and The Western Union Company (global money transfer, 2006-2011).
Ned C. Lautenbach (1944)
Year of Election or Appointment: 2007
Trustee
Chairman of the Independent Trustees
Mr. Lautenbach also serves as Trustee of other Fidelity® funds. Mr. Lautenbach currently serves as Chair (2018-present) and Member (2013-present) of the Board of Governors, State University System of Florida and is a member of the Council on Foreign Relations (1994-present). He is also a member and has most recently served as Chairman of the Board of Directors of Artis-Naples (2012-present). Previously, Mr. Lautenbach served as a member and then Lead Director of the Board of Directors of Eaton Corporation (diversified industrial, 1997-2016). He was also a Partner and Advisory Partner at Clayton, Dubilier & Rice, LLC (private equity investment, 1998-2010), as well as a Director of Sony Corporation (2006-2007). In addition, Mr. Lautenbach also had a 30-year career with IBM (technology company) during which time he served as Senior Vice President and a member of the Corporate Executive Committee (1968-1998).
Joseph Mauriello (1944)
Year of Election or Appointment: 2008
Trustee
Mr. Mauriello also serves as Trustee of other Fidelity® funds. Prior to his retirement in January 2006, Mr. Mauriello served in numerous senior management positions including Deputy Chairman and Chief Operating Officer (2004-2005), and Vice Chairman of Financial Services (2002-2004) of KPMG LLP US (professional services, 1965-2005). Mr. Mauriello currently serves as a member of the Independent Directors Council (IDC) Governing Council (2015-present). Previously, Mr. Mauriello served as a member of the Board of Directors of XL Group plc. (global insurance and re-insurance, 2006-2018).
Cornelia M. Small (1944)
Year of Election or Appointment: 2007
Trustee
Ms. Small also serves as Trustee of other Fidelity® funds. Ms. Small is a member of the Board of Directors (2009-present) and Chair of the Investment Committee (2010-present) of the Teagle Foundation. Ms. Small also serves on the Investment Committee of the Berkshire Taconic Community Foundation (2008-present). Previously, Ms. Small served as Chairperson (2002-2008) and a member of the Investment Committee and Chairperson (2008-2012) and a member of the Board of Trustees of Smith College. In addition, Ms. Small served as Chief Investment Officer, Director of Global Equity Investments, and a member of the Board of Directors of Scudder, Stevens & Clark and Scudder Kemper Investments.
Garnett A. Smith (1947)
Year of Election or Appointment: 2018
Trustee
Mr. Smith also serves as Trustee of other Fidelity® funds. Prior to Mr. Smith's retirement, he served as Chairman and Chief Executive Officer of Inbrand Corp. (manufacturer of personal absorbent products, 1990-1997). He also served as President (1986-1990) of Inbrand Corp. Prior to his employment with Inbrand Corp., he was employed by a retail fabric chain and North Carolina National Bank. In addition, Mr. Smith served as a Member of the Advisory Board of certain Fidelity® funds (2012-2013) and as a board member of the Jackson Hole Land Trust (2009-2012).
David M. Thomas (1949)
Year of Election or Appointment: 2008
Trustee
Mr. Thomas also serves as Trustee of other Fidelity® funds. Mr. Thomas serves as Non-Executive Chairman of the Board of Directors of Fortune Brands Home and Security (home and security products, 2011-present) and as a member of the Board of Directors (2004-present) and Presiding Director (2013-present) of Interpublic Group of Companies, Inc. (marketing communication). Previously, Mr. Thomas served as Executive Chairman (2005-2006) and Chairman and Chief Executive Officer (2000-2005) of IMS Health, Inc. (pharmaceutical and healthcare information solutions), a Director of Fortune Brands, Inc. (consumer products, 2000-2011), and a member of the Board of Trustees of the University of Florida (2013-2018).
Michael E. Wiley (1950)
Year of Election or Appointment: 2018
Trustee
Mr. Wiley also serves as Trustee or Member of the Advisory Board of other Fidelity® funds. Mr. Wiley serves as a Director of High Point Resources (exploration and production, 2005-present). Previously, Mr. Wiley served as a Director of Andeavor Corporation (independent oil refiner and marketer, 2005-2018), a Director of Andeavor Logistics LP (natural resources logistics, 2015-2018), a Director of Post Oak Bank (privately-held bank, 2004-2018), a Director of Asia Pacific Exploration Consolidated (international oil and gas exploration and production, 2008-2013), a member of the Board of Trustees of the University of Tulsa (2000-2006; 2007-2010), a Senior Energy Advisor of Katzenbach Partners, LLC (consulting, 2006-2007), an Advisory Director of Riverstone Holdings (private investment), a Director of Spinnaker Exploration Company (exploration and production, 2001-2005) and Chairman, President, and CEO of Baker Hughes, Inc. (oilfield services, 2000-2004).
+ The information includes the Trustee's principal occupation during the last five years and other information relating to the experience, attributes, and skills relevant to the Trustee's qualifications to serve as a Trustee, which led to the conclusion that the Trustee should serve as a Trustee for the fund.
Advisory Board Members and Officers:
Correspondence intended for a Member of the Advisory Board (if any) may be sent to Fidelity Investments, P.O. Box 55235, Boston, Massachusetts 02205-5235. Correspondence intended for an officer or Peter S. Lynch may be sent to Fidelity Investments, 245 Summer Street, Boston, Massachusetts 02210. Officers appear below in alphabetical order.
Name, Year of Birth; Principal Occupation
Vicki L. Fuller (1957)
Year of Election or Appointment: 2018
Member of the Advisory Board
Ms. Fuller also serves as Member of the Advisory Board of other Fidelity® funds. Ms. Fuller serves as a member of the Board of Directors, Audit Committee, and Nominating and Governance Committee of The Williams Companies, Inc. (natural gas infrastructure, 2018-present). Previously, Ms. Fuller served as the Chief Investment Officer of the New York State Common Retirement Fund (2012-2018) and held a variety of positions at AllianceBernstein L.P. (global asset management, 1985-2012), including Managing Director (2006-2012) and Senior Vice President and Senior Portfolio Manager (2001-2006).
Peter S. Lynch (1944)
Year of Election or Appointment: 2003
Member of the Advisory Board
Mr. Lynch also serves as Member of the Advisory Board of other Fidelity® funds. Mr. Lynch is Vice Chairman and a Director of FMR (investment adviser firm) and FMR Co., Inc. (investment adviser firm). In addition, Mr. Lynch serves as a Trustee of Boston College and as the Chairman of the Inner-City Scholarship Fund. Previously, Mr. Lynch served on the Special Olympics International Board of Directors (1997-2006).
Carol B. Tomé (1957)
Year of Election or Appointment: 2018
Member of the Advisory Board
Ms. Tomé also serves as Member of the Advisory Board of other Fidelity® funds. Ms. Tomé is Chief Financial Officer (2001-present) and Executive Vice President of Corporate Services (2007-present) of The Home Depot, Inc. (home improvement retailer) and a Director (2003-present) and Chair of the Audit Committee (2004-present) of United Parcel Service, Inc. (package delivery and supply chain management). Previously, Ms. Tomé served as Trustee of certain Fidelity® funds (2017), Senior Vice President of Finance and Accounting/Treasurer (2000-2007) and Vice President and Treasurer (1995-2000) of The Home Depot, Inc. and Chair of the Board (2010-2012), Vice Chair of the Board (2009 and 2013), and a Director (2008-2013) of the Federal Reserve Bank of Atlanta. Ms. Tomé is also a director or trustee of many community and professional organizations.
Elizabeth Paige Baumann (1968)
Year of Election or Appointment: 2017
Anti-Money Laundering (AML) Officer
Ms. Baumann also serves as AML Officer of other funds. She is Chief AML Officer (2012-present) and Senior Vice President (2014-present) of FMR LLC (diversified financial services company) and is an employee of Fidelity Investments. Previously, Ms. Baumann served as AML Officer of the funds (2012-2016), and Vice President (2007-2014) and Deputy Anti-Money Laundering Officer (2007-2012) of FMR LLC.
Craig S. Brown (1977)
Year of Election or Appointment: 2019
Assistant Treasurer
Mr. Brown also serves as Assistant Treasurer of other funds. Mr. Brown is an employee of Fidelity Investments (2013-present).
John J. Burke III (1964)
Year of Election or Appointment: 2018
Chief Financial Officer
Mr. Burke also serves as Chief Financial Officer of other funds. Mr. Burke serves as Head of Investment Operations for Fidelity Fund and Investment Operations (2018-present) and is an employee of Fidelity Investments (1998-present). Previously Mr. Burke served as head of Asset Management Investment Operations (2012-2018).
William C. Coffey (1969)
Year of Election or Appointment: 2018
Secretary and Chief Legal Officer (CLO)
Mr. Coffey also serves as Secretary and CLO of other funds. Mr. Coffey serves as CLO, Secretary, and Senior Vice President of Fidelity Management & Research Company and FMR Co., Inc. (investment adviser firms, 2018-present); Secretary of Fidelity SelectCo, LLC and Fidelity Investments Money Management, Inc. (investment adviser firms, 2018-present); and CLO of Fidelity Management & Research (Hong Kong) Limited, FMR Investment Management (UK) Limited, and Fidelity Management & Research (Japan) Limited (investment adviser firms, 2018-present). He is Senior Vice President and Deputy General Counsel of FMR LLC (diversified financial services company, 2010-present), and is an employee of Fidelity Investments. Previously, Mr. Coffey served as Assistant Secretary of certain funds (2009-2018) and as Vice President and Associate General Counsel of FMR LLC (2005-2009).
Timothy M. Cohen (1969)
Year of Election or Appointment: 2018
Vice President
Mr. Cohen also serves as Vice President of other funds. Mr. Cohen serves as Co-Head of Global Equity Research (2016-present), a Director of Fidelity Management & Research (Japan) Limited (investment adviser firm, 2016-present), and is an employee of Fidelity Investments. Previously, Mr. Cohen served as Chief Investment Officer - Equity and a Director of Fidelity Management & Research (U.K.) Inc. (investment adviser firm, 2013-2015) and as a Director of Fidelity Management & Research (Hong Kong) Limited (investment adviser firm, 2017).
Jonathan Davis (1968)
Year of Election or Appointment: 2010
Assistant Treasurer
Mr. Davis also serves as Assistant Treasurer of other funds. Mr. Davis serves as Assistant Treasurer of FMR Capital, Inc. (2017-present) and is an employee of Fidelity Investments. Previously, Mr. Davis served as Vice President and Associate General Counsel of FMR LLC (diversified financial services company, 2003-2010).
Adrien E. Deberghes (1967)
Year of Election or Appointment: 2016
Assistant Treasurer
Mr. Deberghes also serves as an officer of other funds. He serves as Assistant Treasurer of FMR Capital, Inc. (2017-present), Executive Vice President of Fidelity Investments Money Management, Inc. (FIMM) (investment adviser firm, 2016-present), and is an employee of Fidelity Investments (2008-present). Previously, Mr. Deberghes served as President and Treasurer of certain Fidelity® funds (2013-2018). Prior to joining Fidelity Investments, Mr. Deberghes was Senior Vice President of Mutual Fund Administration at State Street Corporation (2007-2008), Senior Director of Mutual Fund Administration at Investors Bank & Trust (2005-2007), and Director of Finance for Dunkin' Brands (2000-2005). Previously, Mr. Deberghes served in other fund officer roles.
Laura M. Del Prato (1964)
Year of Election or Appointment: 2018
Assistant Treasurer
Ms. Del Prato also serves as an officer of other funds. Ms. Del Prato is an employee of Fidelity Investments (2017-present). Prior to joining Fidelity Investments, Ms. Del Prato served as a Managing Director and Treasurer of the JPMorgan Mutual Funds (2014-2017). Prior to JPMorgan, Ms. Del Prato served as a partner at Cohen Fund Audit Services (accounting firm, 2012-2013) and KPMG LLP (accounting firm, 2004-2012).
Colm A. Hogan (1973)
Year of Election or Appointment: 2016
Deputy Treasurer
Mr. Hogan also serves as an officer of other funds. Mr. Hogan serves as Assistant Treasurer of FMR Capital, Inc. (2017-present) and is an employee of Fidelity Investments (2005-present). Previously, Mr. Hogan served as Assistant Treasurer of certain Fidelity® funds (2016-2018).
Pamela R. Holding (1964)
Year of Election or Appointment: 2018
Vice President
Ms. Holding also serves as Vice President of other funds. Ms. Holding serves as Co-Head of Global Equity Research (2018-present) and is an employee of Fidelity Investments (2013-present).
Chris Maher (1972)
Year of Election or Appointment: 2013
Assistant Treasurer
Mr. Maher serves as Assistant Treasurer of other funds. Mr. Maher is Vice President of Valuation Oversight, serves as Assistant Treasurer of FMR Capital, Inc. (2017-present), and is an employee of Fidelity Investments. Previously, Mr. Maher served as Vice President of Asset Management Compliance (2013), Vice President of the Program Management Group of FMR (investment adviser firm, 2010-2013), and Vice President of Valuation Oversight (2008-2010).
Kenneth B. Robins (1969)
Year of Election or Appointment: 2016
Chief Compliance Officer
Mr. Robins also serves as an officer of other funds. Mr. Robins serves as Compliance Officer of Fidelity Management & Research Company and FMR Co., Inc. (investment adviser firms, 2016-present) and is an employee of Fidelity Investments (2004-present). Previously, Mr. Robins served as Executive Vice President of Fidelity Investments Money Management, Inc. (investment adviser firm, 2013-2016) and served in other fund officer roles.
Stacie M. Smith (1974)
Year of Election or Appointment: 2016
President and Treasurer
Ms. Smith also serves as an officer of other funds. Ms. Smith serves as Assistant Treasurer of FMR Capital, Inc. (2017-present), is an employee of Fidelity Investments (2009-present), and has served in other fund officer roles. Prior to joining Fidelity Investments, Ms. Smith served as Senior Audit Manager of Ernst & Young LLP (accounting firm, 1996-2009). Previously, Ms. Smith served as Assistant Treasurer (2013-2018) and Deputy Treasurer (2013-2016) of certain Fidelity® funds.
Marc L. Spector (1972)
Year of Election or Appointment: 2016
Assistant Treasurer
Mr. Spector also serves as an officer of other funds. Mr. Spector serves as Assistant Treasurer of FMR Capital, Inc. (2017-present) and is an employee of Fidelity Investments (2016-present). Prior to joining Fidelity Investments, Mr. Spector served as Director at the Siegfried Group (accounting firm, 2013-2016), and prior to Siegfried Group as audit senior manager at Deloitte & Touche (accounting firm, 2005-2013).
Jim Wegmann (1979)
Year of Election or Appointment: 2019
Assistant Treasurer
Mr. Wegmann also serves as Assistant Treasurer of other funds. Mr. Wegmann is an employee of Fidelity Investments (2011-present).
Shareholder Expense Example
As a shareholder of the Fund, you incur two types of costs: (1) transaction costs, and (2) ongoing costs, including other Fund expenses. This Example is intended to help you understand your ongoing costs (in dollars) of investing in the Fund and to compare these costs with the ongoing costs of investing in other mutual funds.
The Example is based on an investment of $1,000 invested at the beginning of the period and held for the entire period (July 1, 2018 to December 31, 2018).
Actual Expenses
The first line of the accompanying table provides information about actual account values and actual expenses. You may use the information in this line, together with the amount you invested, to estimate the expenses that you paid over the period. Simply divide your account value by $1,000.00 (for example, an $8,600 account value divided by $1,000.00 = 8.6), then multiply the result by the number in the first line under the heading entitled "Expenses Paid During Period" to estimate the expenses you paid on your account during this period. In addition, the Fund, as a shareholder in the underlying Fidelity Central Funds, will indirectly bear its pro-rata share of the fees and expenses incurred by the underlying Fidelity Central Funds. These fees and expenses are not included in the Fund's annualized expense ratio used to calculate the expense estimate in the table below.
Hypothetical Example for Comparison Purposes
The second line of the accompanying table provides information about hypothetical account values and hypothetical expenses based on the Fund's actual expense ratio and an assumed rate of return of 5% per year before expenses, which is not the Fund's actual return. The hypothetical account values and expenses may not be used to estimate the actual ending account balance or expenses you paid for the period. You may use this information to compare the ongoing costs of investing in the Fund and other funds. To do so, compare this 5% hypothetical example with the 5% hypothetical examples that appear in the shareholder reports of the other funds. In addition, the Fund, as a shareholder in the underlying Fidelity Central Funds, will indirectly bear its pro-rata share of the fees and expenses incurred by the underlying Fidelity Central Funds. These fees and expenses are not included in the Fund's annualized expense ratio used to calculate the expense estimate in the table below.
Please note that the expenses shown in the table are meant to highlight your ongoing costs only and do not reflect any transaction costs. Therefore, the second line of the table is useful in comparing ongoing costs only, and will not help you determine the relative total costs of owning different funds.
| | Annualized Expense Ratio-A | Beginning
Account Value
July 1, 2018 | Ending
Account Value
December 31, 2018 | Expenses Paid
During Period-B
July 1, 2018
to December 31, 2018 |
| Actual | .0087% | $1,000.00 | $1,001.10 | $.04 |
| Hypothetical-C | | $1,000.00 | $1,025.16 | $.04 |
A Annualized expense ratio reflects expenses net of applicable fee waivers.
B Expenses are equal to the Fund's annualized expense ratio, multiplied by the average account value over the period, multiplied by 184/365 (to reflect the one-half year period).
C 5% return per year before expenses
Distributions (Unaudited)
The fund will notify shareholders in January 2019 of amounts for use in preparing 2018 income tax returns.
Board Approval of Investment Advisory Contracts
Fidelity Emerging Markets Debt Central Fund
At its July 2018 meeting, the Board of Trustees, including the Independent Trustees (together, the Board), voted to continue the management contract with FMR Co., Inc. (FMRC) and the sub-advisory agreements (together, the Advisory Contracts) for the fund for six months through January 31, 2019, in connection with the reunification of the Fidelity Equity High Income Funds Board, which oversees the fund, and the Sector Portfolios Board.
The Board considered that the approval of the fund's Advisory Contracts will not result in any changes in (i) the investment process or strategies employed in the management of the fund's assets; (ii) the fees and expenses paid by shareholders; (iii) the nature, extent or quality of services provided under the fund's Advisory Contracts; or (iv) the day-to-day management of the fund or the persons primarily responsible for such management. The Board concluded that the fund's Advisory Contracts are fair and reasonable, and that the fund's Advisory Contracts should be renewed, without modification, through January 31, 2019, with the understanding that the Board will consider the annual renewal for a full one year period in January 2019.
In connection with its consideration of future renewals of the fund's Advisory Contracts, the Board will consider: (i) the nature, extent and quality of services provided to the fund, including shareholder and administrative services and investment performance; (ii) the competitiveness of the management fee and total expenses for the fund; (iii) the costs of the services and profitability, including the revenues earned and the expenses incurred in conducting the business of developing, marketing, distributing, managing, administering, and servicing the fund and its shareholders, to the extent applicable, as well as potential fall-out benefits from Fidelity's non-fund businesses; and (iv) whether there have been economies of scale in respect of the Fidelity funds, whether the Fidelity funds (including the fund) have appropriately benefited from any such economies of scale, and whether there is the potential for realization of any further economies.
Based on its evaluation of all of the conclusions noted above, and after considering all factors it believed relevant, the Board ultimately concluded that the fund's management fee structure is fair and reasonable, and that the continuation of the fund's Advisory Contracts should be approved.

Corporate Headquarters
245 Summer St.
Boston, MA 02210
www.fidelity.com
EMC-ANN-0219
1.926205.107