SECURITIES AND EXCHANGE COMMISSION
WASHINGTON, D.C. 20549
FORM 6-K
Report of Foreign Issuer
Pursuant to Rule 13a-16 or 15d-16 of
the Securities Exchange Act of 1934
For the month of January , 2006
SHELL CANADA LIMITED
(Translation of registrant's name into English)
400 4th Avenue S.W., Calgary, Alberta, T2P 0J4
(Address of principal executive offices)
(indicate by check mark whether the registrant files or will file annual reports under cover Form 20-F or Form 40-F)
Form 20-F o Form 40-F þ
(indicate by check mark whether the registrant by furnishing the information contained in this Form is also thereby furnishing the information to the Commission pursuant to Rule 12g3-2(b) under the Securities Exchange Act of 1934.)
Yes o No þ
Pursuant to the requirements of the Securities Exchange Act of 1934, the registrant has duly caused this report to be signed on its behalf by the undersigned, thereunto duly authorized.
| | | | |
| | | SHELL CANADA LIMITED |
| | | Registrant | |
| Date: January 25, 2006 | | | |
| | | | |
| | By: | "S.L. COSMESCU" |
| | | (Signature) | |
| | | | |
| | | | |
| | | S.L. COSMESCU, Assistant Secretary |
| | | (Name and Title) |

FOR IMMEDIATE RELEASE
WEDNESDAY, JANUARY 25, 2006
Fourth Quarter 2005
SHELL CANADA ANNOUNCES RECORD EARNINGS OF $2 BILLION
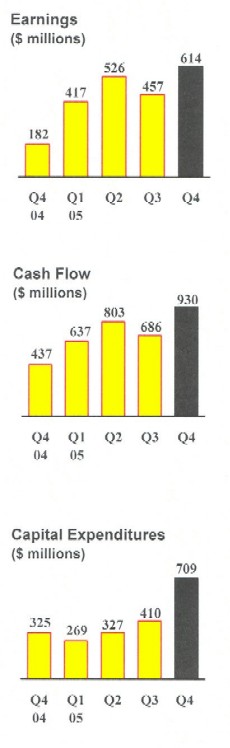 |
Calgary, Alberta - Shell Canada Limited announces record annual earnings of $2,014 million or $2.44 per common share in 2005, up more than 50 per cent from $1,286 million or $1.56 per common share in 2004. The earnings increase was primarily driven by strong commodity prices and refining margins, and a strong contribution from the Athabasca Oil Sands Project. Fourth-quarter earnings were $614 million or $0.74 per common share, more than triple the $182 million or $0.22 per common share for the corresponding period in 2004. Cash flow from operations reached a record $3,056 million in 2005, up over 40 per cent from $2,129 million in 2004. Capital, exploration and predevelopment expenditures reached $1,715 million compared with $951 million for 2004 due to higher investment in all three of the Company's businesses. “Shell Canada achieved record production in 2005, which enabled it to take advantage of strong commodity prices and deliver record earnings and cash flow. Breaking through the $2 billion barrier was a tremendous achievement,” said Clive Mather, President and Chief Executive Officer, Shell Canada Limited. “There were many exciting milestones including sustained Oil Sands production above design rates and launching our new unconventional gas business. The company also laid the foundations for long-term growth with major land acquisitions, and record graduate and experienced hires.”
Investor Inquiries: Media Inquiries: Jim Fahner Jan Rowley Investor Relations Public Affairs (403) 691-2175 (403) 691-3899
Visit Shell Canada’s Internet website: www.shell.ca |
SHELL CANADA LIMITED
MANAGEMENT’S DISCUSSION AND ANALYSIS
Total Company
Shell Canada Limited earnings for 2005 were $2,014 million compared with $1,286 million for 2004. Record volumes supported by strong commodity prices and refining margins more than offset higher costs. The impact of the Company’s Long Term Incentive Plan (LTIP) resulted in a $173 million charge to earnings due to strong appreciation in the share price during the year. The use of non-capital losses increased earnings by $164 million in 2005 and, along with higher proceeds from insurance settlements, outweighed the effect of the higher LTIP charge.
Earnings for the fourth quarter of 2005 were $614 million, up $432 million from $182 million for the corresponding period in 2004. Higher volumes and continuing strong commodity prices and refining margins contributed to the results. Fourth-quarter results included a favourable adjustment of $65 million related to the use of non-capital losses from the acquisition of an affiliated company, and a $27 million charge relating to the LTIP.
Total investment in 2005 was $1,715 million, up from $951 million in 2004. Investments included more than $350 million in new land purchases at Crown land sales to acquire more than 250,000 net acres in key strategic areas of Western Canada. Total hydrocarbon production surpassed all previous years and reached a record 228,700 barrels of oil equivalent per day (boe/d), up from 219,700 boe/d in 2004.
Exploration & Production
In 2005, Exploration & Production (E&P) delivered record earnings of $665 million, up $216 million from $449 million for 2004. The positive impact of strong commodity prices was partially offset by increased expenses, and lower volumes due to natural field decline, plant turnarounds, and adverse weather conditions. Results in 2005 reflected positive tax adjustments of $39 million and an insurance settlement of $12 million, offset by a charge of $50 million related to the LTIP. Exploration and predevelopment expenses in 2005 were below those of 2004, with lower dry hole expenses partially offsetting higher exploration expenses. During 2005, the Company’s E&P investment included the acquisition of almost 200,000 net acres at Crown land sales in Alberta and British Columbia. These purchases were in addition to the previously announced 20 per cent interest the Company acquired in eight exploration licenses in the Orphan Basin earlier in the year.
E&P earnings in the fourth quarter of 2005 were $263 million, up $190 million from $73 million for the corresponding period in 2004. Gains from strong commodity prices combined with lower exploration and lower LTIP charges were partially offset by higher operating costs. A $32 million charge due to predevelopment expenses on the Mackenzie Gas Project negatively impacted fourth-quarter results in 2004. Fourth-quarter results in 2005 included LTIP charges of $8 million compared with $24 million in 2004.
SHELL CANADA LIMITED
MANAGEMENT’S DISCUSSION AND ANALYSIS (continued)
Total natural gas production for the fourth quarter of 2005 was on par with the same period of 2004, despite plant turnaround activities that extended into October. Increased fourth-quarter production from the Sable Offshore Energy Project (SOEP) along with new production from Tay River and basin-centered gas (BCG) more than offset natural field decline. As a result, gas production was higher at year-end 2005 than at year-end 2004.
In the Foothills region, installation of an additional unit to increase sulphur recovery at the Jumping Pound facility was completed in October. Re-tubing of the Tay River well was also completed in October and the result has exceeded expectations with sustained total production rates (raw gas) of more than 95 million cubic feet per day (mmcf/d). Foothills natural gas production for both November and December exceeded 2004 rates for the same months.
At SOEP, strong gas production from the Alma and South Venture fields largely offset natural field decline in 2005 and SOEP production in the second half was higher than in the same period of 2004. Production from a new well in the Venture field began late December and a third well in the Alma field will be drilled in the first quarter of 2006. In addition, a compression project is expected to come on-stream in the fourth quarter of 2006.
BCG production began in November 2005 from four wells. Because of a lack of processing infrastructure, production was limited to 17 mmcf/d. Land acquisitions of over 140,000 net acres in 2005 more than tripled the Company’s BCG landholdings and, together with encouraging drilling results, provide the basis for a substantial future expansion of drilling and production operations. The BCG drilling program will employ four dedicated rigs throughout 2006. Evaluation of infrastructure options continues, including a possible new gas plant, to accommodate anticipated production increases over the next five years.
Significant progress was made during the second half of 2005 regarding clarity of the Mackenzie Gas Project (MGP) regulatory process, the negotiation of benefits and access agreements with northern aboriginal groups, and fiscal framework discussions with governments. The MGP public hearings will start in the first quarter of 2006.
Peace River bitumen volumes for the fourth quarter of 2005 were up from the corresponding period of 2004, mainly due to steam cycle phasing. Drilling of two additional well pads continues and the resulting new production is expected to come on stream in late 2006. Effective January 1, 2006, the Peace River business was transferred from E&P to the Oil Sands business unit.
Oil Sands
Oil Sands generated record earnings of $790 million in 2005, more than double the $378 million in 2004 due to higher volumes and prices. The earnings increase also reflects higher proceeds from insurance settlements in 2005, offset by higher LTIP charges and reduced contributions from tax adjustments. Total LTIP charges were $29 million in 2005.
Oil Sands earnings in the fourth quarter of 2005 were $196 million, up significantly from $13 million in the fourth quarter of 2004 when planned and unplanned maintenance activities impacted operations. The increase was due to higher volumes, higher prices and
SHELL CANADA LIMITED
MANAGEMENT’S DISCUSSION AND ANALYSIS (continued)
lower unit costs. Fourth-quarter earnings included charges of $5 million related to the LTIP in 2005 compared to $11 million in 2004.
The Company’s share of bitumen production in the fourth quarter of 2005 averaged 106,800 barrels per day (bbls/d) compared with 65,900 bbls/d for the same period in 2004 when operations were restricted to a single train. Total bitumen production reached a new record in the fourth quarter of 2005, averaging 178,000 bbls/d, and the Scotford Upgrader also achieved new production records. For the full year 2005, total bitumen production was 159,900 bbls/d, above the 155,000 bbls/d design rate. High bitumen production during the fourth quarter at times prompted the blending and sale of additional heavy synthetic product at the upgrader.
In the fourth quarter of 2005, commodity prices and the average synthetic crude oil price were down somewhat from the preceding quarter, but considerably higher than in the fourth quarter of 2004. Heavy oil market differentials widened during the fourth quarter and were higher than in the same period of 2004. As a result, the average synthetic crude oil price differential relative to Edmonton light crude was wider than in both the third quarter of 2005 and the fourth quarter of 2004. Compared with the prior year, Edmonton light crude prices were up 31 per cent, heavy oil market differentials increased by more than 50 per cent and the average synthetic crude oil price rose by 29 per cent.
Unit cash operating costs in the fourth quarter of 2005 were $23.87 per barrel. This was down $0.38 per barrel from the preceding quarter, and down significantly from the fourth quarter of 2004 when high maintenance costs and low volumes heavily influenced unit costs. Unit cash operating costs for 2005 averaged $23.16 per barrel, down slightly versus 2004. Improved reliability and production offset increased costs for energy, materials and services in the high commodity price environment.
During the fourth quarter, the Company’s investment in Oil Sands continued with the acquisition of three additional Athabasca oil sands leases with mining potential. In 2005, the Company acquired seven leases with a combined area of about 69,000 acres through Alberta Crown land sales. Core hole drilling will be required to determine the resource potential of these lands and its impact on the long-term growth of the Oil Sands business.
The first major planned turnaround of the Athabasca Oil Sands Project (AOSP) is scheduled to start in the second quarter of 2006. Both trains at the Muskeg River Mine and the Scotford Upgrader will be down for maintenance. It is expected that operations will be interrupted for approximately eight weeks before returning to normal at mid-year.
The use of tax pools created during construction of the AOSP has resulted in no cash taxes being payable on operating income thus far. The Company expects that these tax pools will be exhausted during the first quarter of 2006, at which time Oil Sands operations will become cash taxable.
MANAGEMENT’S DISCUSSION AND ANALYSIS (continued)
Reserves
Additions to gross proved natural gas reserves essentially replaced production in 2005. After production of 187 billion cubic feet (bcf), gross proved natural gas reserves were 1,592 bcf for 2005 compared with 1,595 bcf for 2004. Reserve additions of 184 bcf from extensions and discoveries, and an acquisition of 9 bcf in the Burmis region, were partially offset by net downward technical and economic revisions of 9 bcf that resulted from the annual review process. Extensions and discoveries included an additional 74 bcf for Tay River and a booking of 52 bcf for the Company’s early investment position in BCG. After 2005 production of 14 million barrels, gross proved natural gas liquids reserves decreased by just 7 million barrels from 2004 mainly as a result of net positive technical and economic revisions.
In 2005, 28 million gross proved barrels of Peace River bitumen reserves were re-booked. In 2004, adherence to United States Securities and Exchange Commission reserve reporting rules and related guidance prescribing the use of constant year-end pricing and costs for proved reserves determination resulted in the Company de-booking all proved Peace River bitumen reserves.
Over 2005, Shell Canada developed a new strategy for development of the Peace River lease, which includes plans for a proposed expansion project. The 28 million barrels re-booked for 2005 is solely the reserve portion attributable to the existing and currently-drilling wells, and existing facilities. Progression of the engineering and regulatory work for the expansion will continue over the next two years before reaching a final investment decision. Once this key project milestone is reached, the Company expects that the expansion project will incorporate the booking of further reserves to the asset.
In 2005, the Company’s gross proved mineable bitumen reserves increased to 808 million barrels from 621 million barrels in 2004. Core-hole drilling activity resulted in the reclassification of 222 million barrels from the probable to proved category, partially offset by production of 35 million barrels of bitumen. Total gross proved and probable mineable bitumen reserves decreased by the 35 million barrels produced, from 971 million barrels in 2004 to 936 million barrels for 2005.
Shell Canada’s 2005 Annual Report will provide full gross and net reserves information.
Oil Products
Oil Products 2005 annual earnings were $438 million, down slightly from record earnings of $451 million for 2004. Strong refining margins and improved refinery light oil yields contributed to earnings but were more than offset by lower refinery utilization and higher expenses. Expenses increased in 2005 versus 2004 due to higher refinery maintenance costs, high costs for purchased product and higher LTIP charges. However, the increase over 2004 was partially offset by a charge in 2004 relating to a provision for the AIR
SHELL CANADA LIMITEDMANAGEMENT’S DISCUSSION AND ANALYSIS (continued)
MILESÒ reward miles program. LTIP charges in 2005 were $51 million. Planned maintenance work at the Scotford Refinery and unplanned maintenance at the Montreal East Refinery (MER) resulted in reduced utilization during the second half of the year. High spot prices for purchased products compounded the impact of these maintenance activities. Periods within the year were marked by supply disruptions and fuel price volatility in North America following the hurricane activity. However, the Company was able to maintain a reliable supply to customers at competitive prices throughout.
Oil Products earnings in the fourth quarter were $106 million compared with $109 million for the same period in 2004. Stronger refining and marketing margins were offset by lower prices for benzene, lower refinery utilization and higher expenses. Higher maintenance and insurance costs, project related expenses and commodity price-related costs were offset by lower LTIP charges of $6 million in 2005, compared to $30 million in 2004. Fourth-quarter results were further reduced by a negative tax adjustment of $8 million.
At the Montreal East and Scotford Refineries, construction has been completed on two new diesel hydrotreater units that will produce ultra-low-sulphur diesel (ULSD). The $400 million investment is on schedule and budget and will be commissioned in the first quarter, ahead of legislative requirements that are currently scheduled to take effect June 1, 2006.
Oil Products will be making arrangements to purchase other feedstock for the Scotford Refinery to replace supplies that will not be available in the second quarter of 2006 due to planned maintenance at the Scotford Upgrader. The Sarnia refinery also has a major turnaround planned for late in the third quarter of 2006.
Corporate
Corporate earnings for 2005 were $121 million compared with earnings of $8 million for 2004. Results were improved by $164 million due to the use of non-capital losses and were reduced by $43 million due to the LTIP charge.
Corporate earnings for the fourth quarter of 2005 were $49 million compared with negative earnings of $13 million for the corresponding period in 2004. The increase was mainly due to the use of non-capital losses available to the Company resulting from the acquisition of an affiliated company, Coral Resources Canada ULC, in the fourth quarter of 2004. Fourth-quarter earnings also include an $8 million charge related to the LTIP, compared to $6 million in 2004.
_______________________
Ò Trademark of AIR MILES International Trading B.V. Used under license by Loyalty Management Group Canada Inc. and Shell Canada Products.
SHELL CANADA LIMITEDMANAGEMENT’S DISCUSSION AND ANALYSIS (continued)
Cash Flow and Financing
In 2005, cash flow from operations was a record $3,056 million, up from $2,129 million in 2004. Cash flow from operations was $930 million for the fourth quarter of 2005, up from $437 million for the same quarter last year. These increases are largely attributable to higher volumes and prices.
The Consolidated Statement of Cash Flows reflects certain items, primarily exploration expense and pension contributions, as reductions of cash from operating activities. These items were reflected in 2004 as investing activities. The reclassification of these 2004 items reflects exploration costs of $70 million (Q4 - $16 million) in earnings from continuing operations, and a pension contribution of $68 million (Q4 - $77 million) as a movement in working capital. In addition, the Company reclassified certain LTIP expenses of $151 million in 2004 (Q4 - $151 million) as a reduction of cash flow from operations offset by a change in working capital.
Capital, exploration and predevelopment expenditures were $1,715 million for 2005 and $709 million for the fourth quarter. This compares with $951 million and $325 million for the same periods in 2004 respectively. The main reasons for the increases were investments in land, drilling, and the ULSD projects at the refineries.
During 2005, the Company paid off all remaining long-term borrowings and terminated its accounts receivable securitization program. The combined reduction of long-term debt and accounts receivable sales in 2005 amounted to $285 million. Corporate debt on the balance sheet is now limited to $210 million for the mobile equipment lease. Continued strong cash flows during the fourth quarter further strengthened Shell’s financial position and helped to build up a substantial year-end cash balance. The year-end cash balance of $1,083 million has been invested in short-term money market investments.
Shell Canada’s normal course issuer bid, which began May 4, 2004, and expired May 3, 2005, was used to counter dilution resulting from the issuance of common shares under the LTIP. A total of 3,557,241 common shares (adjusted for the share split) had been repurchased and cancelled at market prices for a cost of $88 million, which included $34 million of shares purchased in 2005.
The Company paid $302 million in dividends on its common shares in 2005. Dividends paid in the fourth quarter were $0.11 per common share totaling $91 million. This reflected a 22 per cent increase over the dividend per share paid in the third quarter and an increase of 32 per cent over the dividend paid in the fourth quarter of 2004.
Outstanding Shares
At January 15, 2006, the Company had 825,107,812 common shares and 100 preference shares outstanding (October 15, 2005 - 825,074,112 common shares and 100 preference shares) and there were 20,833,983 employee stock options outstanding, of which 9,512,120 were exercisable or could be surrendered to exercise an attached share appreciation right (October 15, 2005 - 21,544,416 outstanding and 10,163,103 exercisable).
SHELL CANADA LIMITEDMANAGEMENT’S DISCUSSION AND ANALYSIS (continued)
Additional Information
Additional information relating to Shell Canada Limited filed with Canadian and U.S. securities regulatory authorities, including the Annual Information Form and Form 40-F, can be found online under the Company’s profile at www.sedar.com and www.sec.gov.
This document contains “forward-looking statements” based upon management’s assessment of the Company’s future plans and operations. These forward-looking statements include references to the Company’s plans for growth, future capital and other expenditures, the use of tax pools, drilling, development and expansion plans, construction activities, maintenance turnaround schedules, the submission of regulatory applications, project schedules, oil and gas production levels, resources and reserves estimates.
Readers are cautioned not to place undue reliance on forward-looking statements. Although the Company believes that the expectations represented by such forward-looking statements are reasonable based on the information available to it on the date of this document, there can be no assurance that such expectations will prove to be correct. Forward-looking statements involve numerous known and unknown risks and uncertainties that could cause actual results to differ materially from those anticipated by the Company. These risks and uncertainties include, but are not limited to, the risks of the oil and gas industry (including operating conditions and costs), market competition, demand for oil, gas and related products, disruptions in supply, project schedules and execution, labour availability, material and equipment shortages, the uncertainties involving geology of oil and gas deposits, the uncertainty of reserves estimates, fluctuations in oil and gas prices and foreign currency exchange rates, general economic conditions, commercial negotiations, changes in law or government policy, and other factors, many of which are beyond the control of the Company.
The forward-looking statements contained in this document are made as of the date of this document and the Company does not undertake any obligation to update publicly or revise any of the forward-looking statements contained in this document, whether as a result of new information, future events or otherwise. The forward-looking statements contained in this document are expressly qualified by this cautionary statement.
Certain financial measures are not prescribed by Canadian generally accepted accounting principles (GAAP). These non-GAAP financial measures do not have any standardized meaning and, therefore, may not be comparable with the calculation of similar measures of other companies. The Company includes as non-GAAP measures return on average capital employed (ROACE), cash flow from operations and unit cash operating cost because they are key internal and external financial measures used to evaluate the performance of the Company.
The Company’s reserves disclosure and related information is prepared in reliance on a decision of the applicable Canadian securities regulatory authorities under National Instrument 51-101 - Standards of Disclosure for Oil and Gas Activities (NI 51-101), which permits the Company to present its reserves disclosure and related information in accordance with the applicable requirements of the United States Financial Accounting Standards Board and the United States Securities and Exchange Commission. This disclosure differs from the corresponding information required by NI 51-101.
Reserves estimates are prepared by the Company’s internal qualified reserves evaluators. No independent qualified reserves evaluator or auditor was involved in the preparation of the Company’s reserves data.
Certain volumes have been converted to barrels of oil equivalent (boe). BOEs may be misleading, particularly if used in isolation. A conversion of six thousand cubic feet of natural gas to one barrel of oil, as used in this document, is based on the energy equivalency conversion method primarily applicable at the burner tip and does not represent a value equivalency at the wellhead.
SHELL CANADA LIMITED | | | | | | | | | | | | | |
Financial Highlights | | | | | | | | | | | | | |
| ($ millions, except as noted) | | | | | | | | | | | | | |
(unaudited) | | | | | | | | | | | | | |
| | | Fourth Quarter | | | Total Year | |
| | | | 2005 | | | 2004 | | | 2005 | | | 2004 | |
| | | | | | | | | | | | | | |
| | | | | | | | | | | | | | |
| Earnings | | | 614 | | | 182 | | | 2 014 | | | 1 286 | |
| Revenues | | | 4 043 | | | 3 076 | | | 14 394 | | | 11 288 | |
Cash flow from operations1 (Note 3) | | | 930 | | | 437 | | | 3 056 | | | 2 129 | |
| Return on average common shareholders' equity (%) | | | - | | | - | | | 27.3 | | | 21.3 | |
| Per common share (dollars) (Note 4) | | | | | | | | | | | | | |
Earnings - basic (Note 5) | | | 0.74 | | | 0.22 | | | 2.44 | | | 1.56 | |
Earnings - diluted (Note 5) | | | 0.73 | | | 0.22 | | | 2.41 | | | 1.55 | |
Dividends paid | | | 0.110 | | | 0.083 | | | 0.367 | | | 0.313 | |
| | | | | | | | | | | | | | |
Results by Segment | | | | | | | | | | | | | |
| Earnings | | | | | | | | | | | | | |
| Exploration & Production | | | 263 | | | 73 | | | 665 | | | 449 | |
Oil Sands | | | 196 | | | 13 | | | 790 | | | 378 | |
Oil Products | | | 106 | | | 109 | | | 438 | | | 451 | |
Corporate | | | 49 | | | ( 13 | ) | | 121 | | | 8 | |
| Total | | | 614 | | | 182 | | | 2 014 | | | 1 286 | |
| Revenues | | | | | | | | | | | | | |
Exploration & Production | | | 834 | | | 582 | | | 2 611 | | | 2 198 | |
Oil Sands | | | 855 | | | 445 | | | 3 148 | | | 2 072 | |
Oil Products | | | 2 985 | | | 2 380 | | | 10 779 | | | 8 535 | |
Corporate | | | 2 | | | 4 | | | 63 | | | 55 | |
Inter-segment sales | | | ( 633 | ) | | ( 335 | ) | | ( 2 207 | ) | | ( 1 572 | ) |
| Total | | | 4 043 | | | 3 076 | | | 14 394 | | | 11 288 | |
Cash flow from operations1 (Note 3) | | | | | | | | | | | | | |
Exploration & Production | | | 367 | | | 201 | | | 1 056 | | | 855 | |
Oil Sands | | | 358 | | | 72 | | | 1 388 | | | 686 | |
Oil Products | | | 218 | | | 181 | | | 533 | | | 580 | |
Corporate | | | ( 13 | ) | | ( 17 | ) | | 79 | | | 8 | |
| Total | | | 930 | | | 437 | | | 3 056 | | | 2 129 | |
| Capital, exploration and predevelopment expenditures (Note 3) | | | | | | | | | | | | | |
Exploration & Production | | | 349 | | | 128 | | | 873 | | | 451 | |
Oil Sands | | | 160 | | | 38 | | | 343 | | | 179 | |
Oil Products | | | 191 | | | 158 | | | 484 | | | 313 | |
Corporate | | | 9 | | | 1 | | | 15 | | | 8 | |
| Total | | | 709 | | | 325 | | | 1 715 | | | 951 | |
Return on average capital employed (%)2 | | | | | | | | | | | | | |
Exploration & Production | | | - | | | - | | | 37.2 | | | 28.3 | |
Oil Sands | | | - | | | - | | | 29.4 | | | 12.7 | |
Oil Products | | | - | | | - | | | 19.9 | | | 21.3 | |
| Total | | | - | | | - | | | 26.8 | | | 19.9 | |
SHELL CANADA LIMITED | | | | | | | | | |
Operating Highlights | | | | | | | | | |
(unaudited) | | | | | | | | | |
| | | | | | | | | | |
| | Fourth Quarter | Total Year |
| | | | 2005 | | | 2004 | | | 2005 | | | 2004 | |
| | | | | | | | | | | | | | |
EXPLORATION & PRODUCTION | | | | | | | | | | | | | |
| | | | | | | | | | | | | | |
Production | | | | | | | | | | | | | |
| Natural gas (mmcf/d) | | | | | | | | | | | | | |
Western Canada natural gas | | | 407 | | | 414 | | | 393 | | | 415 | |
Sable natural gas | | | 121 | | | 116 | | | 119 | | | 125 | |
| Total natural gas - gross | | | 528 | | | 530 | | | 512 | | | 540 | |
| Total natural gas - net | | | 428 | | | 445 | | | 413 | | | 449 | |
| | | | | | | | | | | | | | |
| Ethane, propane and butane (bbls/d) - gross | | | 23 600 | | | 25 500 | | | 23 300 | | | 25 100 | |
| Ethane, propane and butane (bbls/d) - net | | | 18 600 | | | 20 200 | | | 18 600 | | | 19 900 | |
| | | | | | | | | | | | | | |
| Condensate (bbls/d) - gross | | | 15 600 | | | 15 200 | | | 15 300 | | | 15 200 | |
| Condensate (bbls/d) - net | | | 12 000 | | | 12 000 | | | 11 800 | | | 11 800 | |
| | | | | | | | | | | | | | |
| Bitumen (bbls/d) - gross | | | 8 900 | | | 6 300 | | | 8 900 | | | 8 100 | |
| Bitumen (bbls/d) - net | | | 8 600 | | | 6 200 | | | 8 700 | | | 7 900 | |
| | | | | | | | | | | | | | |
| Sulphur (tons/d) - gross | | | 5 600 | | | 5 500 | | | 5 300 | | | 5 600 | |
| Sulphur (tons/d) - net | | | 5 000 | | | 4 900 | | | 4 800 | | | 4 900 | |
| | | | | | | | | | | | | | |
Sales3 - gross | | | | | | | | | | | | | |
| Natural gas (mmcf/d) | | | 520 | | | 523 | | | 510 | | | 536 | |
| Ethane, propane and butane (bbls/d) | | | 41 400 | | | 44 400 | | | 38 200 | | | 44 000 | |
| Condensate (bbls/d) | | | 26 700 | | | 21 000 | | | 20 700 | | | 19 600 | |
| Bitumen products (bbls/d) | | | 12 300 | | | 9 600 | | | 11 800 | | | 11 500 | |
| Sulphur (tons/d) | | | 12 300 | | | 12 600 | | | 11 700 | | | 11 300 | |
| | | | | | | | | | | | | | |
| | | | | | | | | | | | | | |
OIL SANDS | | | | | | | | | | | | | |
| | | | | | | | | | | | | | |
Production | | | | | | | | | | | | | |
| Bitumen (bbls/d) - gross | | | 106 800 | | | 65 900 | | | 95 900 | | | 81 300 | |
| Bitumen (bbls/d) - net | | | 105 700 | | | 65 300 | | | 95 000 | | | 80 500 | |
| | | | | | | | | | | | | | |
Sales3 | | | | | | | | | | | | | |
Synthetic crude sales excluding blend stocks (bbls/d) | | | 112 300 | | | 69 400 | | | 99 400 | | | 83 700 | |
Purchased upgrader blend stocks (bbls/d) | | | 42 900 | | | 37 600 | | | 37 100 | | | 38 200 | |
| Total synthetic crude sales (bbls/d) | | | 155 200 | | | 107 000 | | | 136 500 | | | 121 900 | |
| | | | | | | | | | | | | | |
| | | | | | | | | | | | | | |
Unit Costs4 | | | | | | | | | | | | | |
| | | | | | | | | | | | | | |
Cash operating cost - excluding natural gas ($/bbl) | | | 16.72 | | | 27.35 | | | 17.08 | | | 17.79 | |
Cash operating cost - natural gas ($/bbl) | | | 7.15 | | | 6.12 | | | 6.08 | | | 5.53 | |
| Total cash operating cost ($/bbl) | | | 23.87 | | | 33.47 | | | 23.16 | | | 23.32 | |
Depreciation, depletion and amortization ($/bbl) | | | 5.14 | | | 7.68 | | | 5.77 | | | 5.59 | |
| Total unit cost ($/bbl) | | | 29.01 | | | 41.15 | | | 28.93 | | | 28.91 | |
SHELL CANADA LIMITED | | | | | | | | | |
Operating Highlights (continued) | | | | | | | | | |
(unaudited) | | | | | | | | | |
| | | Fourth Quarter | | Total Year | |
| | | | 2005 | | | 2004 | | | 2005 | | | 2004 | |
| | | | | | | | | | | | | | |
OIL PRODUCTS | | | | | | | | | | | | | |
| | | | | | | | | | | | | | |
Sales3 | | | | | | | | | | | | | |
Gasolines (m3/d) | | | 20 900 | | | 21 600 | | | 21 000 | | | 20 900 | |
Middle distillates (m3/d) | | | 22 900 | | | 20 500 | | | 21 000 | | | 19 200 | |
Other products (m3/d) | | | 7 300 | | | 8 500 | | | 7 100 | | | 7 400 | |
Total Oil Products sales (m3/d) | | | 51 100 | | | 50 600 | | | 49 100 | | | 47 500 | |
| | | | | | | | | | | | | | |
Crude oil processed by Shell refineries (m3/d)5 | | | 41 500 | | | 46 800 | | | 44 900 | | | 45 100 | |
| | | | | | | | | | | | | | |
Refinery utilization (per cent)6 | | | 80 | | | 92 | | | 87 | | | 89 | |
| | | | | | | | | | | | | | |
Earnings per litre (cents)7 | | | 2.3 | | | 2.4 | | | 2.4 | | | 2.6 | |
| | | | | | | | | | | | | | |
| | | | | | | | | | | | | | |
Prices | | | | | | | | | | | | | |
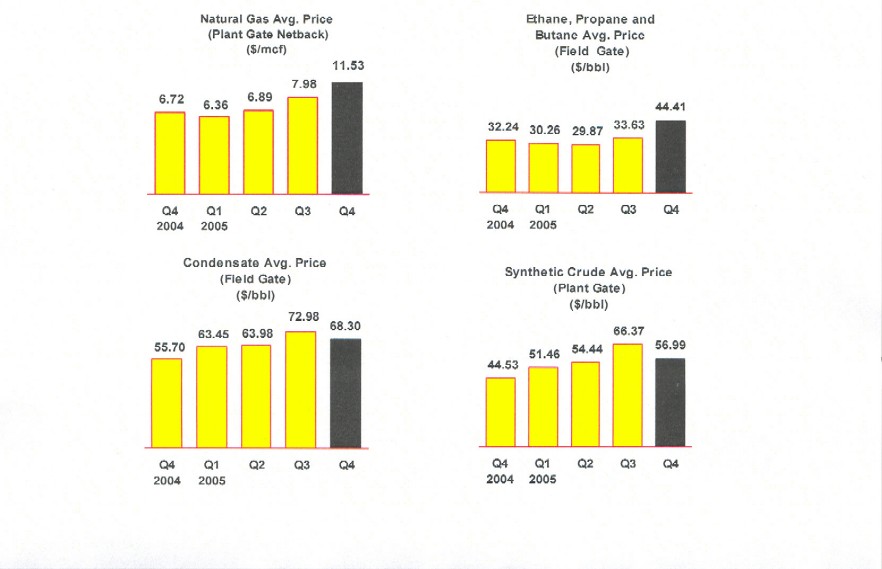
| Natural gas average plant gate netback price ($/mcf) | | | 11.53 | | | 6.72 | | | 8.23 | | | 6.49 | |
| | | | | | | | | | | | | | |
| Ethane, propane and butane average field gate price ($/bbl) | | | 44.41 | | | 32.24 | | | 34.79 | | | 28.71 | |
| | | | | | | | | | | | | | |
| Condensate average field gate price ($/bbl) | | | 68.30 | | | 55.70 | | | 66.76 | | | 50.46 | |
| | | | | | | | | | | | | | |
| Synthetic crude average plant gate price ($/bbl) | | | 56.99 | | | 44.53 | | | 57.55 | | | 44.67 | |
| | | | | | | | | | | | | | |
SHELL CANADA LIMITED | | | |
Financial and Operating Highlights | | | |
(unaudited) | | | |
| | | | |
| | | | |
Non-GAAP Measures | | | |
| | | | |
| Certain financial measures are not prescribed by Canadian generally accepted accounting principles (GAAP). These |
| non-GAAP financial measures do not have any standardized meaning and, therefore, may not be comparable with |
| the calculation of similar measures for other companies. The Corporation includes as non-GAAP measures return on |
| average capital employed (ROACE), cash flow from operations and unit cash operating cost because they are key |
| internal and external financial measures used to evaluate the performance of the Corporation. |
| | | | |
Definitions | | | |
| | | | |
1 Cash flow from operations is a non-GAAP measure and is defined as cash flow from operating activities |
| before movement in working capital and operating activities. See note 3 to the Consolidated Financial Statements. |
| | | | |
2 ROACE is a non-GAAP measure and is defined as earnings plus after-tax interest expense on debt |
| divided by the average of opening and closing common shareholders’ equity plus preferred shares, |
| long-term debt and short-term borrowings. |
| | | | |
3 Exploration & Production and Oil Products sales volumes include sales to third parties only. Oil Sands sales |
| volumes include third-party and inter-segment sales. |
| | | | |
4 Total unit cost for Oil Sands, including unit cash operating and unit depreciation, depletion and amortization |
| (DD&A) costs, is a non-GAAP measure. Unit cash operating cost for Oil Sands is defined as: operating, selling |
| and general expenses plus cash cost items included in cost of goods sold (COGS), divided by synthetic crude |
| sales excluding blend stocks. Cash cost items included in COGS are $201 million in 2005 and $69 million |
| in the fourth quarter of 2005. |
| | | | |
| Unit DD&A cost for Oil Sands is defined as: DD&A cost divided by synthetic crude sales excluding blend |
| stocks. Unit DD&A cost includes preproduction costs, which were written off over the first three years |
| of the project life (2003-2005), and account for $1.59 per barrel of the total unit DD&A cost in 2005, |
| $1.40 per barrel in the fourth quarter of 2005. |
| | | | |
5 Crude oil processed by Shell refineries includes upgrader feedstock supplied to Scotford Refinery. |
| | | | |
6 Refinery utilization equals crude oil processed by Shell refineries divided by total capacity of Shell refineries, |
| including capacity uplifts at Scotford Refinery due to processing of various streams from the upgrader. |
| | | | |
7 Oil Products earnings per litre equals Oil Products earnings after-tax divided by total Oil Products sales volumes. |
SHELL CANADA LIMITED | | | | | | | | | |
Consolidated Statement of Earnings and Retained Earnings | | | | | | | | | |
| ($ millions, except as noted) | | | | | | | | | |
(unaudited) | | | | | | | | | |
| | | Fourth Quarter | | Total Year | |
| | | | 2005 | | | 2004 | | | 2005 | | | 2004 | |
Revenues | | | | | | | | | | | | | |
| Sales and other operating revenues | | | 4 025 | | | 3 061 | | | 14 171 | | | 11 197 | |
| Dividends, interest and other income | | | 18 | | | 15 | | | 223 | | | 91 | |
Total revenues | | | 4 043 | | | 3 076 | | | 14 394 | | | 11 288 | |
Expenses | | | | | | | | | | | | | |
| Cost of goods sold | | | 2 197 | | | 1 775 | | | 7 900 | | | 6 068 | |
| Operating, selling and general | | | 644 | | | 646 | | | 2 400 | | | 2 048 | |
| Transportation | | | 84 | | | 78 | | | 331 | | | 309 | |
| Exploration and predevelopment | | | 37 | | | 100 | | | 184 | | | 230 | |
| Depreciation, depletion, amortization and retirements | | | 216 | | | 196 | | | 782 | | | 722 | |
| Interest on long-term debt | | | 2 | | | 2 | | | 8 | | | 16 | |
| Other interest and financing charges | | | - | | | 2 | | | 3 | | | 10 | |
Total expenses | | | 3 180 | | | 2 799 | | | 11 608 | | | 9 403 | |
Earnings | | | | | | | | | | | | | |
| Earnings before income tax | | | 863 | | | 277 | | | 2 786 | | | 1 885 | |
| Current income tax | | | 161 | | | 85 | | | 602 | | | 617 | |
| Future income tax | | | 88 | | | 10 | | | 170 | | | ( 18 | ) |
| Total income tax | | | 249 | | | 95 | | | 772 | | | 599 | |
Earnings | | | 614 | | | 182 | | | 2 014 | | | 1 286 | |
| Per common share (dollars) (Notes 4 and 5) | | | | | | | | | | | | | |
Earnings - basic | | | 0.74 | | | 0.22 | | | 2.44 | | | 1.56 | |
Earnings - diluted | | | 0.73 | | | 0.22 | | | 2.41 | | | 1.55 | |
| Common shares outstanding (millions - weighted average) | | | 825 | | | 826 | | | 825 | | | 826 | |
Retained Earnings | | | | | | | | | | | | | |
| Balance at beginning of period | | | 7 167 | | | 5 923 | | | 6 011 | | | 5 045 | |
| Earnings | | | 614 | | | 182 | | | 2 014 | | | 1 286 | |
| | | | 7 781 | | | 6 105 | | | 8 025 | | | 6 331 | |
| Common shares buy-back (Note 7) | | | - | | | 25 | | | 33 | | | 61 | |
| Dividends | | | 91 | | | 69 | | | 302 | | | 259 | |
Balance at end of period | | | 7 690 | | | 6 011 | | | 7 690 | | | 6 011 | |
SHELL CANADA LIMITED | | | | | | | | | |
Consolidated Statement of Cash Flows | | | | | | | | | |
| ($ millions) | | | | | | | | | |
(unaudited) | | | | | | | | | |
| | | Fourth Quarter | | Total Year | |
| | | | 2005 | | | 2004 | | | 2005 | | | 2004 | |
| | | | | | | | | | | | | | |
Cash from Operating Activities | | | | | | | | | | | | | |
| Earnings | | | 614 | | | 182 | | | 2 014 | | | 1 286 | |
| Exploration and predevelopment (Note 3) | | | 19 | | | 84 | | | 99 | | | 160 | |
| Non-cash items | | | | | | | | | | | | | |
Depreciation, depletion, amortization and retirements | | | 216 | | | 196 | | | 782 | | | 722 | |
Future income tax | | | 88 | | | 10 | | | 170 | | | ( 18 | ) |
Stock based compensation (Note 3) | | | - | | | ( 25 | ) | | - | | | ( 10 | ) |
Other items | | | ( 7 | ) | | ( 10 | ) | | ( 9 | ) | | ( 11 | ) |
| Cash flow from operations | | | 930 | | | 437 | | | 3 056 | | | 2 129 | |
| Movement in working capital and operating activities | | | | | | | | | | | | | |
Accounts receivable securitization program (Note 8) | | | - | | | - | | | ( 150 | ) | | ( 431 | ) |
Other working capital and operating items (Note 3) | | | 415 | | | 315 | | | 155 | | | 417 | |
| | | | 1 345 | | | 752 | | | 3 061 | | | 2 115 | |
Cash Invested | | | | | | | | | | | | | |
| Capital, exploration and predevelopment expenditures (Note 3) | | | ( 709 | ) | | ( 325 | ) | | ( 1 715 | ) | | ( 951 | ) |
| Movement in working capital from investing activities | | | 53 | | | 8 | | | 69 | | | ( 7 | ) |
| Capital expenditures and movement in working capital | | | ( 656 | ) | | ( 317 | ) | | ( 1 646 | ) | | ( 958 | ) |
| Proceeds on disposal of properties, plant and equipment | | | 1 | | | 2 | | | 6 | | | 4 | |
| Investments and other (Note 3) | | | - | | | 1 | | | - | | | - | |
| | | | ( 655 | ) | | ( 314 | ) | | ( 1 640 | ) | | ( 954 | ) |
Cash from Financing Activities | | | | | | | | | | | | | |
| Common shares buy-back (Note 7) | | | - | | | ( 26 | ) | | ( 34 | ) | | ( 63 | ) |
| Proceeds from exercise of common share stock options | | | - | | | 8 | | | 6 | | | 37 | |
| Dividends paid | | | ( 91 | ) | | ( 69 | ) | | ( 302 | ) | | ( 259 | ) |
| Long-term debt and other | | | - | | | ( 238 | ) | | ( 135 | ) | | ( 600 | ) |
| Short-term financing | | | - | | | - | | | - | | | ( 149 | ) |
| | | | ( 91 | ) | | ( 325 | ) | | ( 465 | ) | | ( 1 034 | ) |
Increase in cash | | | 599 | | | 113 | | | 956 | | | 127 | |
Cash at beginning of period | | | 484 | | | 14 | | | 127 | | | - | |
Cash at December 311 | | | 1 083 | | | 127 | | | 1 083 | | | 127 | |
| | | | | | | | | | | | | | |
Supplemental disclosure of cash flow information | | | | | | | | | | | | | |
Dividends received | | | 5 | | | 4 | | | 15 | | | 14 | |
Interest received | | | 8 | | | 3 | | | 42 | | | 28 | |
Interest paid | | | 2 | | | 4 | | | 12 | | | 28 | |
Income tax paid | | | 123 | | | 44 | | | 683 | | | 303 | |
| | | | | | | | | | | | | | |
| | | | | | | | | | | | | | |
1Cash comprises cash and highly liquid short-term investments. | | | | | | | | | | | | | |
| | | | | | | | | | | | | | |
SHELL CANADA LIMITED | | | | | |
Consolidated Balance Sheet | | | | | |
| ($ millions) | | | | | |
(unaudited) | | | | | |
| | | | | | |
| | | Dec. 31, 2005 | | | Dec. 31, 2004 | |
| | | | | | | | |
Assets | | | | | | | |
| Current assets | | | | | | | |
Cash and short-term investments | | | 1 083 | | | 127 | |
Accounts receivable | | | 1 821 | | | 1 213 | |
Inventories | | | | | | | |
Crude oil, products and merchandise | | | 535 | | | 501 | |
Materials and supplies | | | 92 | | | 83 | |
Prepaid expenses | | | 71 | | | 85 | |
Future income tax | | | 316 | | | 314 | |
| | | 3 918 | | | 2 323 | |
| Investments, long-term receivables and other | | | 671 | | | 549 | |
| Properties, plant and equipment (Note 2) | | | 9 066 | | | 8 034 | |
Total assets | | | 13 655 | | | 10 906 | |
Liabilities | | | | | | | |
| Current liabilities | | | | | | | |
Accounts payable, accrued liabilities and other | | | 2 242 | | | 1 683 | |
Income and other taxes payable | | | 687 | | | 657 | |
Current portion of asset retirement and other long-term obligations | | | 26 | | | 35 | |
Current portion of long-term debt (Note 2) | | | 11 | | | 136 | |
| | | 2 966 | | | 2 511 | |
| Asset retirement and other long-term obligations | | | 545 | | | 417 | |
| Long-term debt (Note 2) | | | 200 | | | 1 | |
| Future income tax | | | 1 730 | | | 1 448 | |
Total liabilities | | | 5 441 | | | 4 377 | |
Shareholders' Equity | | | | | | | |
| Capital stock | | | | | | | |
100 4% preference shares | | | 1 | | | 1 | |
825 102 612 common shares (2004 - 825 727 686) | | | 523 | | | 517 | |
| Retained earnings | | | 7 690 | | | 6 011 | |
Total shareholders' equity | | | 8 214 | | | 6 529 | |
Total liabilities and shareholders' equity | | | 13 655 | | | 10 906 | |
SHELL CANADA LIMITED | | | | | | | | | | | |
Segmented Information | | | | | | | | | | | |
| ($ millions) | | | | | | | | | | | |
(unaudited) | | | | | | | | | | | |
| | | | | | | | | | | | |
| | | Fourth Quarter |
| | | | | Exploration & | | | | | | |
| | | Total | Production | Oil Sands | Oil Products | Corporate |
| | | 2005 | 2004 | 2005 | 2004 | 2005 | 2004 | 2005 | 2004 | 2005 | 2004 |
| | | | | | | | | | | | |
Revenues | | | | | | | | | | | |
| Sales and other operating revenues | | 4 025 | 3 061 | 789 | 551 | 386 | 229 | 2 857 | 2 281 | ( 7) | - |
| Inter-segment sales | | - | - | 44 | 27 | 469 | 215 | 120 | 93 | - | - |
| Dividends, interest and other income | | 18 | 15 | 1 | 4 | - | 1 | 8 | 6 | 9 | 4 |
Total revenues | | 4 043 | 3 076 | 834 | 582 | 855 | 445 | 2 985 | 2 380 | 2 | 4 |
Expenses | | | | | | | | | | | |
| Cost of goods sold | | 2 197 | 1 775 | - | - | 243 | 139 | 1 957 | 1 640 | ( 3) | ( 4) |
| Inter-segment purchases | | - | - | 61 | 41 | 83 | 67 | 489 | 227 | - | - |
| Operating, selling and general | | 644 | 646 | 139 | 150 | 177 | 173 | 304 | 296 | 24 | 27 |
| Transportation | | 84 | 78 | 84 | 78 | - | - | - | - | - | - |
| Exploration and predevelopment | | 37 | 100 | 34 | 100 | 3 | - | - | - | - | - |
| Depreciation, depletion, | | | | | | | | | | | |
amortization and retirements | | 216 | 196 | 99 | 89 | 53 | 49 | 63 | 58 | 1 | - |
| Interest on long-term debt | | 2 | 2 | - | - | - | - | - | - | 2 | 2 |
| Other interest and financing charges | | - | 2 | - | - | - | - | - | - | - | 2 |
Total expenses | | 3 180 | 2 799 | 417 | 458 | 559 | 428 | 2 813 | 2 221 | 24 | 27 |
Earnings (loss) | | | | | | | | | | | |
| Earnings (loss) before income tax | | 863 | 277 | 417 | 124 | 296 | 17 | 172 | 159 | ( 22) | ( 23) |
| Current income tax | | 161 | 85 | 165 | 89 | ( 6) | ( 11) | 11 | 16 | ( 9) | ( 9) |
| Future income tax | | 88 | 10 | ( 11) | ( 38) | 106 | 15 | 55 | 34 | ( 62) | (1) |
| Total income tax | | 249 | 95 | 154 | 51 | 100 | 4 | 66 | 50 | ( 71) | ( 10) |
Earnings (loss) | | 614 | 182 | 263 | 73 | 196 | 13 | 106 | 109 | 49 | ( 13) |
SHELL CANADA LIMITED | | | | | | | | | | | |
Segmented Information (continued) | | | | | | | | | | | |
| ($ millions) | | | | | | | | | | | |
(unaudited) | | | | | | | | | | | |
| | | | | | | | | | | | |
| | | Total Year |
| | | | | Exploration & | | | | | | |
| | | Total | Production | Oil Sands | Oil Products | Corporate |
| | | 2005 | 2004 | 2005 | 2004 | 2005 | 2004 | 2005 | 2004 | 2005 | 2004 |
| | | | | | | | | | | | |
Revenues | | | | | | | | | | | |
| Sales and other operating revenues | | 14 171 | 11 197 | 2 433 | 2 105 | 1 373 | 938 | 10 343 | 8 128 | 22 | 26 |
| Inter-segment sales | | - | - | 152 | 84 | 1 643 | 1 102 | 412 | 386 | - | - |
| Dividends, interest and other income | | 223 | 91 | 26 | 9 | 132 | 32 | 24 | 21 | 41 | 29 |
Total revenues | | 14 394 | 11 288 | 2 611 | 2 198 | 3 148 | 2 072 | 10 779 | 8 535 | 63 | 55 |
Expenses | | | | | | | | | | | |
| Cost of goods sold | | 7 900 | 6 068 | - | - | 790 | 544 | 7 108 | 5 525 | 2 | (1) |
| Inter-segment purchases | | - | - | 225 | 159 | 281 | 283 | 1 701 | 1 130 | - | - |
| Operating, selling and general | | 2 400 | 2 048 | 511 | 422 | 639 | 542 | 1 133 | 1 029 | 117 | 55 |
| Transportation | | 331 | 309 | 331 | 309 | - | - | - | - | - | - |
| Exploration and predevelopment | | 184 | 230 | 168 | 230 | 16 | - | - | - | - | - |
| Depreciation, depletion, | | | | | | | | | | | |
amortization and retirements | | 782 | 722 | 367 | 357 | 209 | 171 | 204 | 193 | 2 | 1 |
| Interest on long-term debt | | 8 | 16 | - | - | - | - | - | - | 8 | 16 |
| Other interest and financing charges | | 3 | 10 | - | - | - | - | - | - | 3 | 10 |
Total expenses | | 11 608 | 9 403 | 1 602 | 1 477 | 1 935 | 1 540 | 10 146 | 7 877 | 132 | 81 |
Earnings (loss) | | | | | | | | | | | |
| Earnings (loss) before income tax | | 2 786 | 1 885 | 1 009 | 721 | 1 213 | 532 | 633 | 658 | ( 69) | ( 26) |
| Current income tax | | 602 | 617 | 407 | 385 | 45 | 16 | 296 | 249 | ( 146) | ( 33) |
| Future income tax | | 170 | ( 18) | ( 63) | ( 113) | 378 | 138 | ( 101) | ( 42) | ( 44) | (1) |
| Total income tax | | 772 | 599 | 344 | 272 | 423 | 154 | 195 | 207 | ( 190) | ( 34) |
Earnings | | 2 014 | 1 286 | 665 | 449 | 790 | 378 | 438 | 451 | 121 | 8 |
| | | | | | | | | | | | |
| | | | | | | | | | | | |
Total assets | | 13 655 | 10 906 | 3 489 | 2 853 | 4 041 | 3 786 | 4 685 | 4 041 | 1 440 | 226 |
| | | | | | | | | | | | |
Capital employed 1 | | 8 425 | 6 666 | 2 052 | 1 523 | 2 519 | 2 860 | 2 280 | 2 130 | 1 574 | 153 |
| | | | | | | | | | | | |
| | | | | | | | | | | | |
| | | | | | | | | | | | |
1 Capital employed is the total of equity, long-term debt and short-term borrowings. |
SHELL CANADA LIMITED |
Notes to Consolidated Financial Statements |
(unaudited) | | | | | | |
1. Accounting Policies
These financial statements follow the same accounting policies and methods of computation as, and should be read in conjunction with,
the Consolidated Financia
l Statements dated December 31, 2004, except as described in note 2 and note 3.
Certain other information provided for prior periods has been reclassified to conform to the current presentation.
1. Change in Accounting Policy
Variable Interest Entities
Effective January 1, 2005, the Corporation adopted Accounting Guideline 15, "Consolidation of Variable Interest Entities." The standard
mandates that certain entities should be consolidated by the primary beneficiary. Accordingly, the Corporation has consolidated a lease
arrangement for large mobile equipment (trucks, scrapers and shovels) used at the Athabasca Oil Sands Project's Muskeg River Mine.
The standard has been applied retroactively without prior-period restatement of the financial statements. The impact of this change on the
December 31, 2005, Consolidated Balance Sheet is an increase in accounts receivable of $16 million, an increase in property plant and
equipment of $170 million, a decrease in accounts payable of $28 million and an increase in debt of $210 million. Adoption of this standard
did not have a material impact on the Corporation's Consolidated Statement of Earnings and Retained Earnings.
3. Accounting Reclassification
The Consolidated Statement of Cash Flows reflects certain items, primarily exploration expense and pension contributions, as reductions
of cash f
rom operating activities. These items were reflected in 2004 as investing activities. The reclassification of these 2004 items reflects
exploration costs of $70 million ($16 million in the fourth quarter) in earnings from continuing operations, and a pension contribution of $68
million ($77 million in the fourth quarter) as a movement in working capital. In addition, the Corporation reclassified certain Long Term
Incentive Plan expenses of $151 million in 2004 ($151 million in the fourth quarter) as a reduction of cash flow from operations offset by a
change in working capital.
4. Common Shares Split
On June 21, 2005, the common shares of the Corporation were split on a three-for-one basis for shareholders of record on June 23, 2005.
Common share data and per share information have been restated to reflect the impact of the share split.
SHELL CANADA LIMITED | | | | | |
Notes to Consolidated Financial Statements (Continued) | | | | | |
(unaudited) | | | | | | |
| | | | | | | |
5. Earnings Per Share | | | | | |
| | | | Fourth Quarter | Total Year |
| | | | 2005 | 2004 | 2005 | 2004 |
| | | | | | | |
| Earnings ($ millions) | | 614 | 182 | 2 014 | 1 286 |
| | | | | | | |
| Weighted average number of common shares (millions) | 825 | 826 | 825 | 826 |
| | | | | | | |
| Dilutive securities (millions) | | | | | |
Options under Long Term Incentive Plan | 10 | 7 | 9 | 6 |
| | | | | | | |
| Basic earnings per share ($ per share) | | 0.74 | 0.22 | 2.44 | 1.56 |
| Diluted earnings per share ($ per share) | | 0.73 | 0.22 | 2.41 | 1.55 |
| | | | | | | |
| | | | | | | |
6. Employee Future Benefits | | | | | |
| | | | | | | |
| The Corporation's pension plans are described in the notes to the Consolidated Financial Statements dated |
| December 31, 2004. The components of the total net benefit costs included in total expenses in the Consolidated |
| Statement of Earnings are as follows: |
| | | | | | | |
| | | | | | | |
| | | | Fourth Quarter |
| ($ millions) | | | Pension Benefits | Other Benefits |
| | | | 2005 | 2004 | 2005 | 2004 |
| Current service cost | | 10 | 8 | - | - |
| Employee contributions | | - | ( 2) | - | - |
| Interest cost | | | 31 | 30 | 3 | 3 |
| Expected return on plan assets | | ( 35) | ( 33) | - | - |
| Amortization of transitional (asset) obligation | ( 9) | ( 9) | 1 | 1 |
| Amortization of net actuarial loss | | 17 | 18 | - | - |
| Net (income) expense | | 14 | 12 | 4 | 4 |
| Defined contribution segment | 5 | 4 | - | - |
| Total | | | 19 | 16 | 4 | 4 |
| | | | | | | |
| | | | Total Year |
| ($ millions) | | | Pension Benefits | Other Benefits |
| | | | 2005 | 2004 | 2005 | 2004 |
| Current service cost | | 37 | 32 | 2 | 1 |
| Employee contributions | | ( 3) | ( 3) | - | - |
| Interest cost | | | 127 | 118 | 10 | 11 |
| Expected return on plan assets | | ( 137) | ( 129) | - | - |
| Amortization of transitional (asset) obligation | ( 36) | ( 36) | 2 | 2 |
| Amortization of net actuarial loss | | 71 | 69 | - | 2 |
| Net (income) expense | | 59 | 51 | 14 | 16 |
| Defined contribution segment | | 15 | 13 | - | - |
| Total | | | 74 | 64 | 14 | 16 |
| | | | | | | |
7. Common Shares Buy-Back | | | | | |
| | | | | | | |
| On April 30, 2004, Shell Canada Limited announced its intention to make a normal course issuer bid, to repurchase for |
| cancellation up to one per cent of its issued and outstanding common shares as at April 27, 2004. The bid began |
| on May 4, 2004, and expired on May 3, 2005. The bid was used to counter dilution resulting from the issuance |
| of common shares under the Corporation's Long Term Incentive Plan. Under this bid, a total of 3,557,241 common shares |
| (adjusted for the share split) were repurchased and cancelled at market prices for a total cost of $88 million, which |
| includes $34 million of shares purchased in 2005. |
SHELL CANADA LIMITED | | | |
Notes to Consolidated Financial Statements (Continued) | | |
(unaudited) | | | | | | |
| | | | | | | |
| | | | | | | |
8. Accounts Receivable Securitization Program | | | |
| | | | | | | |
| During 2005, the remaining $150 million balance under the accounts receivable securitization program was reduced |
| to zero and the Corporation elected to terminate the program. This contributed to the increase in accounts |
| receivable on the Consolidated Balance Sheet as at December 31, 2005. |