The Foothills business made another exploration discovery in northeast British Columbia in the second quarter. This discovery, together with recent successful wells, prompts the Company to begin construction on a gas gathering system and central sour gas dehydration facility at Wolverine River to handle approximately 50 million cubic feet per day (mmcf/d) of raw gas production potential (Shell share approximately 35 mmcf/d). The new wells are expected to be tied in and producing by the end of 2006, while drilling continues on two additional wells. However, gas sales from the region will remain constrained by lack of firm capacity within the main gathering and processing facilities.
Construction on the Sable Offshore Energy Project (SOEP) compression project is on track for startup in fourth quarter 2006. SOEP volumes are below those for the corresponding period in 2005 due to an unplanned outage at the gas processing plant in April and the work involved with the compression project tie-in.
Rising costs and schedule pressures on the Mackenzie Gas Project and Shell’s Niglintgak field development have necessitated a re-examination of project cost estimates.
Oil Sands
Oil Sands earnings in the second quarter of 2006 were $111 million, an expected significant decrease from $259 million for the corresponding period in 2005. The 2006 results included a favourable adjustment of $144 million primarily resulting from changes to federal and Alberta corporate tax rates, which was offset by maintenance costs and lower production associated with the first major scheduled turnaround of both the AOSP mine and upgrader.
Oil Sands earnings for the first half of 2006 were $231 million, including the $144 million adjustment, compared with $357 million in 2005 which included an $82 million insurance settlement. The earnings reduction for the first half was mainly due to the scheduled maintenance turnaround and higher maintenance costs, as well as lower average volumes in the first quarter of 2006 due to a tear in the mine conveyor belt. Effective January 1, 2006, the Peace River business was transferred from E&P to the Oil Sands business unit. Earnings from the Peace River in situ operations are included in both current and prior period earnings.
The Company’s share of AOSP bitumen production for the second quarter averaged 46,800 barrels per day (bbls/d) compared with 98,500 bbls/d for the same period in 2005. The variance in bitumen production year over year is primarily a result of the major scheduled turnarounds at both the mine and upgrader. The turnaround is now complete and both the mine and upgrader are producing in excess of 96,000 bbls/d (Shell share) after a smooth startup.
Unit cash operating costs for the AOSP in the second quarter were $67.29 per barrel as a result of the maintenance costs and lower production volumes associated with the turnaround. Unit cash operating costs are expected to return to the $15- to $22-per-barrel range with the completion of the turnaround in July 2006. This guidance is premised on normal production within a wide range of oil and gas prices.
SHELL CANADA LIMITED
Management’s Discussion and Analysis (continued)
Peace River in situ bitumen production for the second quarter of 2006 was below that for the same period in 2005 due to steam phasing and a facilities turnaround. The Company expects new production from two additional well pads to come on stream late 2006. Plans to increase in situ production at Peace River are progressing, with filing of regulatory applications expected later this year.
As previously released, a conference call will be held July 28, 2006, to provide an Oil Sands strategy update, including AOSP expansion plans.
Oil Products
Oil Products achieved record quarterly earnings of $205 million compared with $128 million for the same period in 2005. The improvement was mainly due to strong refining margins and a favourable adjustment of $43 million resulting from changes to federal and Alberta corporate tax rates, partially offset by reduced refinery yield and utilization. Stronger distillate and gasoline margins offset weaker benzene, black oil and liquid petroleum gas margins.
Refinery yield and utilization were lower in the second quarter of 2006 mainly due to maintenance at Montreal East Refinery and slowdowns at Scotford Refinery related to limited availability of alternative feedstock during the planned maintenance turnaround at the Scotford Upgrader. Supply to customers was maintained during this period. Light oil volumes were three per cent lower than in the second quarter of 2005, mainly due to the effects of wet spring weather on agricultural demand in the Prairies.
Oil Products earnings for the first half of 2006 were a record $359 million compared with $251 million in 2005. Improved refining margins offset reduced refinery yield and utilization, and costs associated with higher commodity prices.
A major turnaround is scheduled to take place at the Sarnia Refinery in the fourth quarter of 2006.
The Company is also evaluating the expansion of its manufacturing capabilities in Eastern Canada to maximize value from increased bitumen production.
Corporate
Corporate earnings for the second quarter of 2006 were $2 million compared with $20 million for the corresponding period in 2005. The change was primarily due to a favourable adjustment in the second quarter of 2005 related to the use of non-capital losses available to the Company resulting from the acquisition of an affiliated company, Coral Resources Canada ULC. Corporate earnings for the first half of 2006 were $2 million compared with $80 million for the corresponding period in 2005, mainly for the same reasons.
Cash Flow and Financing
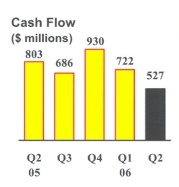
In the second quarter of 2006, cash flow from operations was $527 million, down $276 million from $803 million for the same period last year. The decrease is largely attributable to maintenance costs and lower production associated with the first major scheduled turn-
SHELL CANADA LIMITED
Management’s Discussion and Analysis (continued)
around of the AOSP. Cash flow from operations for the first six months of 2006 was $1,249 million, down $191 million from the same period in 2005. Higher commodity prices and margins were offset by reduced bitumen volumes and utilization associated with the AOSP turnaround and belt failure at the Muskeg River Mine, and higher operating costs.
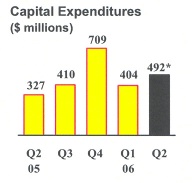
Excluding the acquisition of BlackRock during the second quarter of 2006, capital and predevelopment expenditures amounted to $492 million in the second quarter and $896 million for the first six months of 2006 compared with $327 million and $596 million respectively for 2005. The increase is in support of the Company's growth plans including predevelopment work at the AOSP.
This purchase of BlackRock used all of the cash previously held on the balance sheet. In addition, the Company issued $797 million in commercial paper under its existing $1.5 billion program and borrowed $498 million against a new $1 billion syndicated revolving credit facility. The unused portions of these facilities are available for general corporate purposes. Total debt outstanding at the end of the second quarter 2006 was $1,501 million including the mobile equipment lease of $205 million, compared with debt on the balance sheet of $211 million, mainly comprised of the mobile equipment lease as at December 31, 2005.
Dividends paid in the second quarter of 2006 were $0.11 per common share totalling $91 million. This reflected an equivalent dividend per share to that paid in the first quarter of 2006, and an increase of 32 per cent over the dividend paid in the second quarter of 2005.
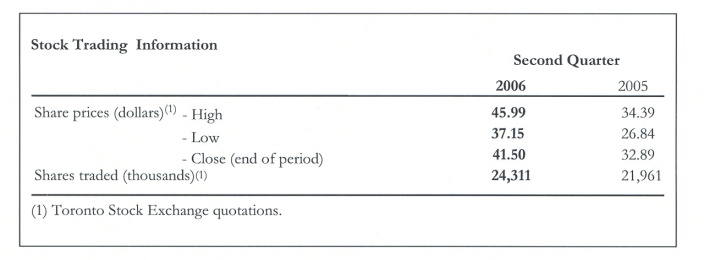
Share Information
At July 15, 2006, the Company had 825,464,564 common shares and 100 preference shares outstanding (April 15, 2006 - 825,367,662 common shares and 100 preference shares) and there were 22,557,058 employee stock options outstanding, of which 11,474,136 were exercisable or could be surrendered to exercise an attached share appreciation right (April 15, 2006 - 22,850,139 outstanding and 11,757,122 exercisable).
SHELL CANADA LIMITED
Management’s Discussion and Analysis (continued)
Additional Information
Additional information relating to Shell Canada Limited filed with Canadian and U.S. securities regulatory authorities, including the Annual Information Form and Form 40-F, can be found online under the Company’s profile at www.sedar.com and www.sec.gov.
Cautionary Note
This document contains “forward-looking statements” based upon management’s assessment of the Company’s future plans and operations. These forward-looking statements include references to the Company’s plans for growth, results of acquisition activity, future capital and other expenditures, drilling, development and expansion plans, construction activities, maintenance turnaround schedules, the submission of regulatory applications, project costs and schedules and oil and gas production levels.
Readers are cautioned not to place undue reliance on forward-looking statements. Although the Company believes that the expectations represented by such forward-looking statements are reasonable based on the information available to it on the date of this document, there can be no assurance that such expectations will prove to be correct. Forward-looking statements involve numerous known and unknown risks and uncertainties that could cause actual results to differ materially from those anticipated by the Company. These risks and uncertainties include, but are not limited to, the risks of the oil and gas industry (including operating conditions and costs), market competition, demand for oil, gas and related products, disruptions in supply, project schedules and execution, labour availability, material and equipment shortages, the uncertainties involving geology of oil and gas deposits, the uncertainty of reserves estimates, fluctuations in oil and gas prices and foreign currency exchange rates, general economic conditions, changes in law or government policy, and other factors, many of which are beyond the control of the Company.
The forward-looking statements contained in this document are made as of the date of this document and the Company does not undertake any obligation to update publicly or revise any of the forward-looking statements contained in this document, whether as a result of new information, future events or otherwise, except as required by law. The forward-looking statements contained in this document are expressly qualified by this cautionary note.
Certain financial measures are not prescribed by Canadian generally accepted accounting principles (GAAP). These non-GAAP financial measures do not have any standardized meaning and, therefore, may not be comparable with the calculation of similar measures of other companies. The Company includes as non-GAAP measures return on average capital employed (ROACE), cash flow from operations and unit cash operating cost because they are key internal and external financial measures used to evaluate the performance of the Company.
Certain volumes have been converted to barrels of oil equivalent (BOE). BOEs may be misleading, particularly if used in isolation. A conversion of six thousand cubic feet of natural gas to one barrel of oil, as used in this document, is based on the energy equivalency conversion method primarily applicable at the burner tip and does not represent a value equivalency at the wellhead.
SHELL CANADA LIMITED | | | | | | | | |
Financial Highlights | | | | | | | | |
| ($ millions, except as noted) | | | | | | | | |
(unaudited) | | | | | | | | |
| | | Second Quarter | | First Half |
| | | 2006 | | 2005 | | 2006 | | 2005 |
| | | | | | | | | | | | | |
| | | | | | | | | | | | | |
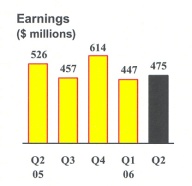
| Earnings | | | 475 | | | 526 | | | 922 | | | 943 |
| Revenues | | | 3 748 | | | 3 390 | | | 7 197 | | | 6 395 |
Cash flow from operations1 | | | 527 | | | 803 | | | 1 249 | | | 1 440 |
| Return on average common shareholders' equity (%) | | | - | | | - | | | 24.5 | | | 23.6 |
| Per common share (dollars) (Note 7) | | | | | | | | | | | | |
| Earnings - basic | | | 0.58 | | | 0.64 | | | 1.12 | | | 1.14 |
| Earnings - diluted | | | 0.57 | | | 0.63 | | | 1.10 | | | 1.13 |
| Dividends paid | | | 0.110 | | | 0.083 | | | 0.220 | | | 0.167 |
| | | | | | | | | | | | | |
Results by Segment (Note 2) | | | | | | | | | | | | |
| | | | | | | | | | | | | |
| Earnings | | | | | | | | | | | | |
| Exploration & Production | | | 157 | | | 119 | | | 330 | | | 255 |
| Oil Sands | | | 111 | | | 259 | | | 231 | | | 357 |
| Oil Products | | | 205 | | | 128 | | | 359 | | | 251 |
| Corporate | | | 2 | | | 20 | | | 2 | | | 80 |
| Total | | | 475 | | | 526 | | | 922 | | | 943 |
| Revenues | | | | | | | | | | | | |
| Exploration & Production | | | 523 | | | 534 | | | 1 182 | | | 1 098 |
| Oil Sands | | | 572 | | | 926 | | | 1 305 | | | 1 494 |
| Oil Products | | | 2 958 | | | 2 516 | | | 5 570 | | | 4 842 |
| Corporate | | | 53 | | | 11 | | | 70 | | | 31 |
| Inter-segment sales | | | ( 358 | ) | | ( 597 | ) | | ( 930 | ) | | ( 1 070) |
| Total | | | 3 748 | | | 3 390 | | | 7 197 | | | 6 395 |
Cash flow from operations1 | | | | | | | | | | | | |
| Exploration & Production | | | 224 | | | 205 | | | 534 | | | 432 |
| Oil Sands | | | 81 | | | 416 | | | 259 | | | 630 |
| Oil Products | | | 201 | | | 149 | | | 433 | | | 265 |
| Corporate | | | 21 | | | 33 | | | 23 | | | 113 |
| Total | | | 527 | | | 803 | | | 1 249 | | | 1 440 |
| Capital and predevelopment expenditures | | | | | | | | | | | | |
| Exploration & Production | | | 184 | | | 202 | | | 375 | | | 343 |
| Oil Sands | | | 209 | | | 28 | | | 362 | | | 96 |
| Oil Products | | | 72 | | | 95 | | | 128 | | | 154 |
| Corporate | | | 27 | | | 2 | | | 31 | | | 3 |
| Total | | | 492 | | | 327 | | | 896 | | | 596 |
Return on average capital employed (%)2 | | | | | | | | | | | | |
| Exploration & Production | | | - | | | - | | | 37.9 | | | 26.0 |
| Oil Sands | | | - | | | - | | | 15.7 | | | 18.1 |
| Oil Products | | | - | | | - | | | 22.7 | | | 21.5 |
| Total | | | - | | | - | | | 22.3 | | | 22.1 |
SHELL CANADA LIMITED | | | | | | | | |
Operating Highlights | | | | | | | | |
(unaudited) | | | | | | | | |
| | | | | | | | | |
| | | Second Quarter | | First Half |
| | | 2006 | | 2005 | | 2006 | | 2005 |
| | | | | | | | | | | | | |
EXPLORATION & PRODUCTION (Note 2) | | | | | | | | | | | | |
| | | | | | | | | | | | | |
Production | | | | | | | | | | | | |
| Natural gas (mmcf/d) | | | | | | | | | | | | |
| Western Canada natural gas | | | 411 | | | 372 | | | 418 | | | 387 |
| Sable natural gas | | | 97 | | | 115 | | | 103 | | | 115 |
| Total natural gas - gross | | | 508 | | | 487 | | | 521 | | | 502 |
| Total natural gas - net | | | 416 | | | 393 | | | 420 | | | 405 |
| | | | | | | | | | | | | |
| Ethane, propane and butane (bbls/d) - gross | | | 20 000 | | | 23 500 | | | 21 000 | | | 23 900 |
| Ethane, propane and butane (bbls/d) - net | | | 15 800 | | | 18 600 | | | 16 800 | | | 18 900 |
| | | | | | | | | | | | | |
| Condensate (bbls/d) - gross | | | 12 200 | | | 14 900 | | | 13 300 | | | 15 000 |
| Condensate (bbls/d) - net | | | 9 500 | | | 11 200 | | | 10 500 | | | 11 400 |
| | | | | | | | | | | | | |
| Sulphur (tons/d) - gross | | | 5 300 | | | 5 000 | | | 5 500 | | | 5 200 |
| Sulphur (tons/d) - net | | | 4 900 | | | 4 200 | | | 5 100 | | | 4 500 |
| | | | | | | | | | | | | |
Sales3 - gross | | | | | | | | | | | | |
| Natural gas (mmcf/d) | | | 499 | | | 481 | | | 516 | | | 497 |
| Ethane, propane and butane (bbls/d) | | | 30 000 | | | 35 800 | | | 36 600 | | | 38 500 |
| Condensate (bbls/d) | | | 18 100 | | | 15 200 | | | 22 200 | | | 18 900 |
| Sulphur (tons/d) | | | 12 700 | | | 12 500 | | | 11 900 | | | 11 600 |
| | | | | | | | | | | | | |
| | | | | | | | | | | | | |
OIL SANDS (Note 2) | | | | | | | | | | | | |
| | | | | | | | | | | | | |
Production | | | | | | | | | | | | |
| Bitumen (bbls/d) - gross | | | | | | | | | | | | |
| Minable | | | 46 800 | | | 98 500 | | | 62 000 | | | 88 800 |
| In situ | | | 6 400 | | | 8 500 | | | 6 900 | | | 7 700 |
| Total | | | 53 200 | | | 107 000 | | | 68 900 | | | 96 500 |
| | | | | | | | | | | | | |
| Bitumen (bbls/d) - net | | | | | | | | | | | | |
| Minable | | | 46 400 | | | 97 500 | | | 61 400 | | | 87 900 |
| In situ | | | 6 200 | | | 8 300 | | | 6 800 | | | 7 500 |
| Total | | | 52 600 | | | 105 800 | | | 68 200 | | | 95 400 |
| | | | | | | | | | | | | |
Sales3 | | | | | | | | | | | | |
| Synthetic crude sales excluding blend stocks (bbls/d) | | | 45 600 | | | 102 300 | | | 65 700 | | | 92 000 |
| Purchased upgrader blend stocks (bbls/d) | | | 22 600 | | | 39 900 | | | 31 400 | | | 35 500 |
| Total synthetic crude sales (bbls/d) | | | 68 200 | | | 142 200 | | | 97 100 | | | 127 500 |
| | | | | | | | | | | | | |
| Bitumen product excluding diluent (bbls/d) | | | 6 400 | | | 8 700 | | | 6 900 | | | 8 000 |
| Purchased diluent (bbls/d) | | | 600 | | | 1 600 | | | 1 500 | | | 1 800 |
| Total bitumen products (bbls/d) | | | 7 000 | | | 10 300 | | | 8 400 | | | 9 800 |
| | | | | | | | | | | | | |
| In situ condensate (bbls/d) | | | 2 900 | | | 1 800 | | | 2 800 | | | 2 400 |
| | | | | | | | | | | | | |
Unit Costs4 | | | | | | | | | | | | |
| | | | | | | | | | | | | |
Mining and upgrading operations | | | | | | | | | | | | |
| | | | | | | | | | | | | |
| Cash operating cost - excluding natural gas ($/bbl) | | | 60.88 | | | 15.84 | | | 34.36 | | | 16.91 |
| Cash operating cost - natural gas ($/bbl) | | | 6.41 | | | 4.62 | | | 6.30 | | | 5.20 |
| Total cash operating cost ($/bbl) | | | 67.29 | | | 20.46 | | | 40.66 | | | 22.11 |
| Depreciation, depletion and amortization ($/bbl) | | | 7.29 | | | 5.52 | | | 5.44 | | | 6.21 |
| Total unit cost ($/bbl) | | | 74.58 | | | 25.98 | | | 46.10 | | | 28.32 |
SHELL CANADA LIMITED | | | | | | | | |
Operating Highlights (continued) | | | | | | | | |
(unaudited) | | | | | | | | |
| | | Second Quarter | | First Half |
| | | 2006 | | 2005 | | 2006 | | 2005 |
| | | | | | | | | | | | | |
OIL SANDS (continued) | | | | | | | | | | | | |
| | | | | | | | | | | | | |
Unit Costs4 | | | | | | | | | | | | |
| | | | | | | | | | | | | |
In situ operations | | | | | | | | | | | | |
| | | | | | | | | | | | | |
| Cash operating cost - excluding natural gas ($/bbl) | | | 25.18 | | | 15.44 | | | 19.31 | | | 14.56 |
| Cash operating cost - natural gas ($/bbl) | | | 11.06 | | | 15.68 | | | 11.59 | | | 14.61 |
| Total cash operating cost ($/bbl) | | | 36.24 | | | 31.12 | | | 30.90 | | | 29.17 |
| Depreciation, depletion and amortization ($/bbl) | | | 11.19 | | | 4.29 | | | 11.17 | | | 4.47 |
| Total unit cost ($/bbl) | | | 47.43 | | | 35.41 | | | 42.07 | | | 33.64 |
| | | | | | | | | | | | | |
| | | | | | | | | | | | | |
OIL PRODUCTS | | | | | | | | | | | | |
| | | | | | | | | | | | | |
Sales3 | | | | | | | | | | | | |
Gasolines (m3/d) | | | 21 100 | | | 21 300 | | | 20 600 | | | 20 800 |
Middle distillates (m3/d) | | | 18 600 | | | 19 100 | | | 19 700 | | | 20 400 |
Other products (m3/d) | | | 6 700 | | | 7 300 | | | 6 300 | | | 6 600 |
Total Oil Products sales (m3/d) | | | 46 400 | | | 47 700 | | | 46 600 | | | 47 800 |
| | | | | | | | | | | | | |
Crude oil processed by Shell refineries (m3/d)5 | | | 43 200 | | | 46 500 | | | 43 300 | | | 46 600 |
Refinery utilization (per cent)6 | | | 86 | | | 90 | | | 85 | | | 90 |
Earnings per litre (cents)7 | | | 4.8 | | | 3.0 | | | 4.3 | | | 2.9 |
| | | | | | | | | | | | | |
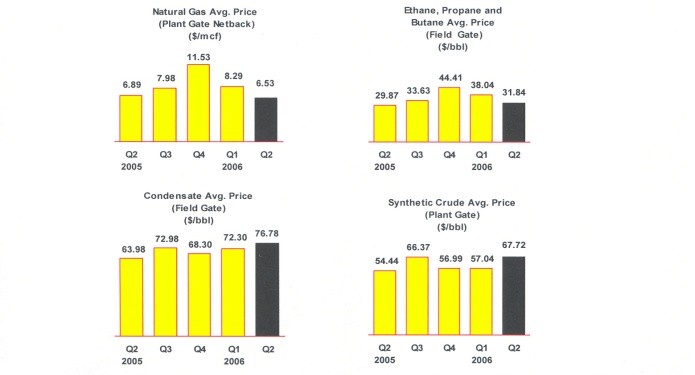
Prices | | | | | | | | | | | | |
| Natural gas average plant gate netback price ($/mcf) | | | 6.53 | | | 6.89 | | | 7.43 | | | 6.62 |
| Ethane, propane and butane average field gate price ($/bbl) | | | 31.84 | | | 29.87 | | | 35.34 | | | 30.08 |
| Condensate average field gate price ($/bbl) | | | 76.78 | | | 63.98 | | | 74.09 | | | 63.67 |
| Synthetic crude average plant gate price ($/bbl) | | | 67.72 | | | 54.44 | | | 60.81 | | | 53.13 |
| | | | | | | | | | | | | |
SHELL CANADA LIMITED | | | | |
Financial and Operating Highlights | | | | |
(unaudited) | | | | |
| | | | | |
| | | | | |
Non-GAAP Measures | | | | |
| | | | | |
| Certain financial measures are not prescribed by Canadian generally accepted accounting principles (GAAP). These |
| non-GAAP financial measures do not have any standardized meaning and, therefore, may not be comparable with |
| the calculation of similar measures for other companies. The Corporation includes as non-GAAP measures return on |
| average capital employed (ROACE), cash flow from operations and unit cash operating cost because they are key |
| internal and external financial measures used to evaluate the performance of the Corporation. |
| | | | | |
Definitions | | | | |
| | | | | |
1 Cash flow from operations is a non-GAAP measure and is defined as cash flow from operating activities |
| before movement in working capital and operating activities. See note 3 to the Consolidated Financial Statements. |
| | | | | |
2 ROACE is a non-GAAP measure and is defined as the last four quarters’ earnings plus after-tax |
| interest expense on debt divided by the average of opening and closing common shareholders’ equity plus |
| preferred shares, long-term debt and short-term borrowings. |
| | | | | |
3 Exploration & Production and Oil Products sales volumes include sales to third parties only. Oil Sands sales |
| volumes include third-party and inter-segment sales. |
| | | | | |
4 Total unit cost for Oil Sands, including unit cash operating and unit depreciation, depletion and amortization |
| (DD&A) costs, is a non-GAAP measure. Unit cash operating cost for Oil Sands mining and upgrading is defined as: |
| operating, selling and general expenses plus cash cost items included in cost of goods sold (COGS), divided by synthetic |
| crude sales excluding blend stocks. Operating, selling and general expenses associated with mining and upgrading |
| were $399 million in the first half of 2006 and $249 million in the second quarter of 2006. Cash cost items included |
| in COGS were $84 million in the first half of 2006 and $29 million in the second quarter of 2006. |
| | | | | |
| Unit cash operating cost for in situ operations is defined as: operating, selling and general expenses plus intersegment |
| purchases of natural gas, divided by bitumen product sales excluding diluent. Operating, selling and general expenses |
| associated with in situ operations were $22 million in the first half of 2006 and $13 million in the second quarter of 2006. |
| Intersegment purchases of natural gas were $15 million in the first half of 2006 and $6 million in the second quarter of 2006. |
| | | | | |
| Unit DD&A cost for Oil Sands mining and upgrading is defined as: DD&A cost divided by synthetic crude sales excluding |
| blend stocks. Unit DD&A cost includes preproduction costs, which were written off over the first three years |
| of the project life (2003-2005). |
| | | | | |
| Unit DD&A cost for in situ operations is defined as: DD&A cost divided by bitumen product sales excluding diluent. |
| | | | | |
5 Crude oil processed by Shell refineries includes upgrader feedstock supplied to Scotford Refinery. |
| | | | | |
6 Refinery utilization equals crude oil processed by Shell refineries divided by total capacity of Shell refineries, |
| including capacity uplifts at Scotford Refinery due to processing of various streams from the upgrader. |
| | | | | |
7 Oil Products earnings per litre equals Oil Products earnings after-tax divided by total Oil Products sales volumes. |
SHELL CANADA LIMITED | | | | | | | | |
Consolidated Statement of Earnings and Retained Earnings | | | | | | |
| ($ millions, except as noted) | | | | | | | | |
(unaudited) | | | | | | | | |
| | | Second Quarter | | First Half |
| | | 2006 | | 2005 | | 2006 | | 2005 |
| | | | | | | | | | | | | |
Revenues | | | | | | | | | | | | |
| Sales and other operating revenues | | | 3 716 | | | 3 238 | | | 7 133 | | | 6 221 |
| Dividends, interest and other income | | | 32 | | | 152 | | | 64 | | | 174 |
Total revenues | | | 3 748 | | | 3 390 | | | 7 197 | | | 6 395 |
Expenses | | | | | | | | | | | | |
| Cost of goods sold | | | 2 364 | | | 1 766 | | | 4 286 | | | 3 434 |
| Operating, selling and general | | | 692 | | | 583 | | | 1 210 | | | 1 062 |
| Transportation | | | 70 | | | 86 | | | 149 | | | 165 |
| Exploration | | | 16 | | | 32 | | | 61 | | | 56 |
| Predevelopment | | | 32 | | | 14 | | | 60 | | | 32 |
| Depreciation, depletion, amortization and retirements | | | 178 | | | 181 | | | 360 | | | 363 |
| Interest on long-term debt | | | 2 | | | 2 | | | 4 | | | 4 |
| Other interest and financing charges | | | 4 | | | 1 | | | 4 | | | 2 |
Total expenses | | | 3 358 | | | 2 665 | | | 6 134 | | | 5 118 |
Earnings | | | | | | | | | | | | |
| Earnings before income tax | | | 390 | | | 725 | | | 1 063 | | | 1 277 |
| Current income tax | | | 74 | | | 128 | | | 255 | | | 251 |
| Future income tax | | | ( 159 | ) | | 71 | | | ( 114 | ) | | 83 |
| Total income tax | | | ( 85 | ) | | 199 | | | 141 | | | 334 |
Earnings | | | 475 | | | 526 | | | 922 | | | 943 |
| Per common share (dollars) (Note 7) | | | | | | | | | | | | |
| Earnings - basic | | | 0.58 | | | 0.64 | | | 1.12 | | | 1.14 |
| Earnings - diluted | | | 0.57 | | | 0.63 | | | 1.10 | | | 1.13 |
| Common shares outstanding (millions - weighted average) | | | 825 | | | 825 | | | 825 | | | 825 |
Retained Earnings | | | | | | | | | | | | |
| Balance at beginning of period | | | 8 046 | | | 6 333 | | | 7 690 | | | 6 011 |
| Earnings | | | 475 | | | 526 | | | 922 | | | 943 |
| | | | 8 521 | | | 6 859 | | | 8 612 | | | 6 954 |
| Common shares buy-back | | | - | | | 7 | | | - | | | 33 |
| Dividends | | | 91 | | | 68 | | | 182 | | | 137 |
Balance at end of period | | | 8 430 | | | 6 784 | | | 8 430 | | | 6 784 |
SHELL CANADA LIMITED | | | | | | | | | |
Consolidated Statement of Cash Flows | | | | | | | | | |
| ($ millions) | | | | | | | | | |
(unaudited) | | | | | | | | | |
| | | Second Quarter | | First Half | |
| | | 2006 | | 2005 | | 2006 | | 2005 | |
| | | | | | | | | | | | | | |
Cash from Operating Activities | | | | | | | | | | | | | |
| Earnings | | | 475 | | | 526 | | | 922 | | | 943 | |
| Exploration (Note 3) | | | 1 | | | 12 | | | 20 | | | 19 | |
| Predevelopment | | | 32 | | | 14 | | | 60 | | | 32 | |
| Non-cash items | | | | | | | | | | | | | |
| Depreciation, depletion, amortization and retirements | | | 178 | | | 181 | | | 360 | | | 363 | |
| Future income tax | | | ( 159 | ) | | 71 | | | ( 114 | ) | | 83 | |
| Other items | | | - | | | ( 1 | ) | | 1 | | | - | |
| Cash flow from operations | | | 527 | | | 803 | | | 1 249 | | | 1 440 | |
| Movement in working capital and operating activities | | | | | | | | | | | | | |
| Working capital and other operating items | | | 91 | | | 33 | | | ( 225 | ) | | ( 355 | ) |
| | | | 618 | | | 836 | | | 1 024 | | | 1 085 | |
Cash Invested | | | | | | | | | | | | | |
| Capital and predevelopment expenditures (Note 3) | | | ( 492 | ) | | ( 327 | ) | | ( 896 | ) | | ( 596 | ) |
| Acquisition of BlackRock Ventures Inc. (Note 4) | | | ( 2 428 | ) | | - | | | ( 2 428 | ) | | - | |
| Movement in working capital from investing activities | | | 25 | | | ( 32 | ) | | 100 | | | ( 24 | ) |
| Capital expenditures and movement in working capital | | | ( 2 895 | ) | | ( 359 | ) | | ( 3 224 | ) | | ( 620 | ) |
| Proceeds on disposal of properties, plant and equipment | | | - | | | 1 | | | - | | | 5 | |
| | | | ( 2 895 | ) | | ( 358 | ) | | ( 3 224 | ) | | ( 615 | ) |
Cash from Financing Activities | | | | | | | | | | | | | |
| Common shares buy-back | | | - | | | ( 7 | ) | | - | | | ( 34 | ) |
| Proceeds from exercise of common share stock options | | | 3 | | | 1 | | | 4 | | | 4 | |
| Dividends paid | | | ( 91 | ) | | ( 68 | ) | | ( 182 | ) | | ( 137 | ) |
| Long-term debt and other | | | 1 | | | 1 | | | - | | | ( 134 | ) |
| Short-term financing | | | 1 295 | | | ( 109 | ) | | 1 295 | | | - | |
| | | 1 208 | | | ( 182 | ) | | 1 117 | | | ( 301 | ) |
(Decrease) Increase in cash | | | ( 1 069 | ) | | 296 | | | ( 1 083 | ) | | 169 | |
Cash at beginning of period | | | 1 069 | | | - | | | 1 083 | | | 127 | |
Cash at June 301 | | | - | | | 296 | | | - | | | 296 | |
| | | | | | | | | | | | | | |
Supplemental disclosure of cash flow information | | | | | | | | | | | | | |
| Dividends received | | | 5 | | | 4 | | | 7 | | | 7 | |
| Interest received | | | 25 | | | 14 | | | 50 | | | 30 | |
| Interest paid | | | 5 | | | 3 | | | 8 | | | 7 | |
| Income tax paid | | | 147 | | | 111 | | | 463 | | | 436 | |
| | | | | | | | | | | | | | |
| | | | | | | | | | | | | | |
1 Cash comprises cash and highly liquid short-term investments. | | | | | | | | | | | | | |
| SHELL CANADA LIMITED | | | | |
Consolidated Balance Sheet | | | | |
| ($ millions) | | | | |
(unaudited) | | | | |
| | | | | |
| | | Jun. 30, 2006 | | Dec. 31, 2005 |
| | | | | | | |
Assets | | | | | | |
| Current assets | | | | | | |
| Cash and short-term investments | | | - | | | 1 083 |
| Accounts receivable | | | 1 804 | | | 1 821 |
| Inventories | | | | | | |
| Crude oil, products and merchandise | | | 631 | | | 535 |
| Materials and supplies | | | 98 | | | 92 |
| Prepaid expenses | | | 100 | | | 71 |
| Future income tax | | | 332 | | | 316 |
| | | | 2 965 | | | 3 918 |
| Investments, long-term receivables and other | | | 696 | | | 671 |
| Properties, plant and equipment | | | 12 619 | | | 9 066 |
| Goodwill (Notes 4 and 5) | | | 234 | | | - |
Total assets | | | 16 514 | | | 13 655 |
Liabilities | | | | | | |
| Current liabilities | | | | | | |
| Short-term borrowings (Note 6) | | | 1 295 | | | - |
| Accounts payable, accrued liabilities and other | | | 2 460 | | | 2 242 |
| Income and other taxes payable | | | 470 | | | 687 |
| Current portion of asset retirement and other long-term obligations | | | 27 | | | 26 |
| Current portion of long-term debt | | | 5 | | | 11 |
| | | | 4 257 | | | 2 966 |
| Asset retirement and other long-term obligations | | | 590 | | | 545 |
| Long-term debt | | | 201 | | | 200 |
| Future income tax | | | 2 486 | | | 1 730 |
Total liabilities | | | 7 534 | | | 5 441 |
| | | | | | | |
Non-controlling interest (Note 4) | | | 22 | | | - |
| | | | | | | |
Shareholders' Equity | | | | | | |
| Capital stock | | | | | | |
| 100 4% preference shares | | | 1 | | | 1 |
| 825 449 564 common shares (2005 - 825 102 612) | | | 527 | | | 523 |
| Retained earnings | | | 8 430 | | | 7 690 |
Total shareholders' equity | | | 8 958 | | | 8 214 |
Total liabilities and shareholders' equity | | | 16 514 | | | 13 655 |

| ___________________________ |
| Clive Mather, Director |

| ___________________________ |
| Kerry L. Hawkins, Director |
SHELL CANADA LIMITED | | | | | | | | | | | | | | | | | | | | | |
Segmented Information | | | | | | | | | | | | | | | | | | | | | |
| ($ millions) | | | | | | | | | | | | | | | | | | | | | |
(unaudited) | | | | | | | | | | | | | | | | | | | | | |
| | | | | | | | | | | | | | | | | | | | | | |
| | | Second Quarter | |
| | | | | | | | | | | | | | | | | | | | | | |
| | | | | | | | | | | | | | | | | | | | | | |
| | | Total | | Exploration & Production | | Oil Sands | | Oil Products | | Corporate | |
| | | 2006 | | 2005 | | 2006 | | 2005 | | 2006 | | 2005 | | 2006 | | 2005 | | 2006 | | 2005 | |
| | | | | | | | (Note 2) | | | (Note 2) | | | | | | | | | | | | | |
Revenues | | | | | | | | | | | | | | | | | | | | | | | | | | | | | | | |
| Sales and other operating revenues | | | 3 716 | | | 3 238 | | | 478 | | | 476 | | | 354 | | | 343 | | | 2 855 | | | 2 422 | | | 29 | | | ( 3 | ) |
| Inter-segment sales | | | - | | | - | | | 43 | | | 56 | | | 218 | | | 452 | | | 97 | | | 89 | | | - | | | - | |
| Dividends, interest and other income | | | 32 | | | 152 | | | 2 | | | 2 | | | - | | | 131 | | | 6 | | | 5 | | | 24 | | | 14 | |
Total revenues | | | 3 748 | | | 3 390 | | | 523 | | | 534 | | | 572 | | | 926 | | | 2 958 | | | 2 516 | | | 53 | | | 11 | |
Expenses | | | | | | | | | | | | | | | | | | | | | | | | | | | | | | | |
| Cost of goods sold | | | 2 364 | | | 1 766 | | | - | | | - | | | 218 | | | 205 | | | 2 148 | | | 1 550 | | | ( 2 | ) | | 11 | |
| Inter-segment purchases | | | - | | | - | | | 57 | | | 57 | | | 83 | | | 95 | | | 218 | | | 445 | | | - | | | - | |
| Operating, selling and general | | | 692 | | | 583 | | | 113 | | | 112 | | | 262 | | | 159 | | | 292 | | | 282 | | | 25 | | | 30 | |
| Transportation | | | 70 | | | 86 | | | 70 | | | 86 | | | - | | | - | | | - | | | - | | | - | | | - | |
| Exploration | | | 16 | | | 32 | | | 16 | | | 32 | | | - | | | - | | | - | | | - | | | - | | | - | |
| Predevelopment | | | 32 | | | 14 | | | 7 | | | 9 | | | 19 | | | 5 | | | 6 | | | - | | | - | | | - | |
| Depreciation, depletion, | | | | | | | | | | | | | | | | | | | | | | | | | | | | | | | |
| amortization and retirements | | | 178 | | | 181 | | | 87 | | | 82 | | | 37 | | | 55 | | | 51 | | | 44 | | | 3 | | | - | |
| Interest on long-term debt | | | 2 | | | 2 | | | - | | | - | | | - | | | - | | | - | | | - | | | 2 | | | 2 | |
| Other interest and financing charges | | | 4 | | | 1 | | | - | | | - | | | - | | | - | | | - | | | - | | | 4 | | | 1 | |
Total expenses | | | 3 358 | | | 2 665 | | | 350 | | | 378 | | | 619 | | | 519 | | | 2 715 | | | 2 321 | | | 32 | | | 44 | |
Earnings (loss) | | | | | | | | | | | | | | | | | | | | | | | | | | | | | | | |
| Earnings (loss) before income tax | | | 390 | | | 725 | | | 173 | | | 156 | | | ( 47 | ) | | 407 | | | 243 | | | 195 | | | 21 | | | ( 33 | ) |
| Current income tax | | | 74 | | | 128 | | | 49 | | | 56 | | | ( 75 | ) | | 47 | | | 96 | | | 90 | | | 4 | | | ( 65 | ) |
| Future income tax | | | ( 159 | ) | | 71 | | | ( 33 | ) | | ( 19 | ) | | ( 83 | ) | | 101 | | | ( 58 | ) | | ( 23 | ) | | 15 | | | 12 | |
| Total income tax | | | ( 85 | ) | | 199 | | | 16 | | | 37 | | | ( 158 | ) | | 148 | | | 38 | | | 67 | | | 19 | | | ( 53 | ) |
Earnings | | | 475 | | | 526 | | | 157 | | | 119 | | | 111 | | | 259 | | | 205 | | | 128 | | | 2 | | | 20 | |
SHELL CANADA LIMITED | | | | | | | | | | | | | | | | | | | | | |
Segmented Information (continued) | | | | | | | | | | | | | | | | | | | | | |
| ($ millions) | | | | | | | | | | | | | | | | | | | | | |
(unaudited) | | | | | | | | | | | | | | | | | | | | | |
| | | | | | | | | | | | | | | | | | | | | | |
| | | First Half | |
| | | | | | | | | | | | | | | | | | | | | | |
| | | | | | | | | | | | | | | | | | | | | | |
| | | Total | | | | Oil Sands | | Oil Products | | Corporate | |
| | | 2006 | | 2005 | | 2006 | | 2005 | | 2006 | | 2005 | | 2006 | | 2005 | | 2006 | | 2005 | |
| | | | | | | | | | (Note 2) | | | (Note 2) | | | | | | | | | | | | | |
Revenues | | | | | | | | | | | | | | | | | | | | | | | | | | | | | | | |
| Sales and other operating revenues | | | 7 133 | | | 6 221 | | | 1 071 | | | 978 | | | 680 | | | 598 | | | 5 361 | | | 4 642 | | | 21 | | | 3 | |
| Inter-segment sales | | | - | | | - | | | 108 | | | 117 | | | 625 | | | 764 | | | 197 | | | 189 | | | - | | | - | |
| Dividends, interest and other income | | | 64 | | | 174 | | | 3 | | | 3 | | | - | | | 132 | | | 12 | | | 11 | | | 49 | | | 28 | |
Total revenues | | | 7 197 | | | 6 395 | | | 1 182 | | | 1 098 | | | 1 305 | | | 1 494 | | | 5 570 | | | 4 842 | | | 70 | | | 31 | |
Expenses | | | | | | | | | | | | | | | | | | | | | | | | | | | | | | | |
| Cost of goods sold | | | 4 286 | | | 3 434 | | | - | | | - | | | 474 | | | 331 | | | 3 807 | | | 3 091 | | | 5 | | | 12 | |
| Inter-segment purchases | | | - | | | - | | | 118 | | | 116 | | | 169 | | | 182 | | | 643 | | | 772 | | | - | | | - | |
| Operating, selling and general | | | 1 210 | | | 1 062 | | | 217 | | | 200 | | | 421 | | | 305 | | | 539 | | | 511 | | | 33 | | | 46 | |
| Transportation | | | 149 | | | 165 | | | 149 | | | 165 | | | - | | | - | | | - | | | - | | | - | | | - | |
| Exploration | | | 61 | | | 56 | | | 61 | | | 56 | | | - | | | - | | | - | | | - | | | - | | | - | |
| Predevelopment | | | 60 | | | 32 | | | 19 | | | 21 | | | 35 | | | 11 | | | 6 | | | - | | | - | | | - | |
| Depreciation, depletion, | | | | | | | | | | | | | | | | | | | | | | | | | | | | | | | |
| amortization and retirements | | | 360 | | | 363 | | | 177 | | | 165 | | | 79 | | | 110 | | | 101 | | | 87 | | | 3 | | | 1 | |
| Interest on long-term debt | | | 4 | | | 4 | | | - | | | - | | | - | | | - | | | - | | | - | | | 4 | | | 4 | |
| Other interest and financing charges | | | 4 | | | 2 | | | - | | | - | | | - | | | - | | | - | | | - | | | 4 | | | 2 | |
Total expenses | | | 6 134 | | | 5 118 | | | 741 | | | 723 | | | 1 178 | | | 939 | | | 5 096 | | | 4 461 | | | 49 | | | 65 | |
Earnings (loss) | | | | | | | | | | | | | | | | | | | | | | | | | | | | | | | |
| Earnings (loss) before income tax | | | 1 063 | | | 1 277 | | | 441 | | | 375 | | | 127 | | | 555 | | | 474 | | | 381 | | | 21 | | | ( 34 | ) |
| Current income tax | | | 255 | | | 251 | | | 130 | | | 151 | | | ( 21 | ) | | 43 | | | 144 | | | 203 | | | 2 | | | ( 146 | ) |
| Future income tax | | | ( 114 | ) | | 83 | | | ( 19 | ) | | ( 31 | ) | | ( 83 | ) | | 155 | | | ( 29 | ) | | ( 73 | ) | | 17 | | | 32 | |
| Total income tax | | | 141 | | | 334 | | | 111 | | | 120 | | | ( 104 | ) | | 198 | | | 115 | | | 130 | | | 19 | | | ( 114 | ) |
Earnings | | | 922 | | | 943 | | | 330 | | | 255 | | | 231 | | | 357 | | | 359 | | | 251 | | | 2 | | | 80 | |
| | | | | | | | | | | | | | | | | | | | | | | | | | | | | | | | |
| | | | | | | | | | | | | | | | | | | | | | | | | | | | | | | | |
Total assets | | | 16 514 | | | 11 873 | | | 3 262 | | | 2 774 | | | 8 003 | | | 4 172 | | | 4 936 | | | 4 451 | | | 313 | | | 476 | |
| | | | | | | | | | | | | | | | | | | | | | | | | | | | | | | | |
Capital employed 1 | | | 10 459 | | | 7 524 | | | 2 158 | | | 1 797 | | | 5 381 | | | 2 937 | | | 2 603 | | | 2 199 | | | 317 | | | 591 | |
| | | | | | | | | | | | | | | | | | | | | | | | | | | | | | | | |
| | | | | | | | | | | | | | | | | | | | | | | | | | | | | | | | |
| | | | | | | | | | | | | | | | | | | | | | | | | | | | | | | | |
1 Capital employed is the total of equity, long-term debt and short-term borrowings. |
SHELL CANADA LIMITED |
Notes to Consolidated Financial Statements |
(unaudited) |
| |
1. Accounting Policies
These financial statements follow the same accounting policies and methods of computation as, and should be read in conjunction with, the Consolidated Financial Statements for the year ended December 31, 2005, except as described in notes 2, 3 and 5.
Certain other information provided for prior periods has been reclassified to conform to the current presentation.
2. Segmented Information
Effective January 1, 2006, the Peace River business was transferred from Exploration & Production to the Oil Sands business unit. Segmented information for the relevant business units has been reclassified for the prior periods.
3. Accounting Reclassification
The Corporation reclassified certain exploration expenses ($37 million in the first half of 2005 and $20 million in the second quarter of 2005) from investing to operating activities in the Consolidated Statement of Cash Flows.
4. Acquisition of BlackRock Ventures Inc.
On June 21, 2006, the Corporation acquired more than 92 per cent of the outstanding common shares of BlackRock Ventures Inc. (BlackRock). The original offer was extended to June 27, 2006, and additional common shares were acquired. In total the Corporation held in excess of 98 per cent as at June 30, 2006. BlackRock was engaged in the development and production of heavy oil in Western Canada.
Shell’s total consideration for the transaction was $2,570 million ($2,428 million net of cash acquired) including acquisition costs of $12 million and working capital of $130 million. Of the consideration paid, $3,092 million was allocated to oil and natural gas properties and $234 million was allocated to goodwill.
The purchase price allocation of the acquisition is subject to refinement. The acquisition was accounted for based on the purchase method and the allocation was supported by a third party valuation. A summary of the preliminary purchase equation is presented as follows:
| Net assets acquired ($ millions) |
| | Oil and natural gas properties | 3 092 | |
| | Goodwill1 | 234 | |
| | Working capital2 | 130 | |
| | Other assets | 1 | |
| | Asset retirement obligations | ( 11) | |
| | Future income tax liability | ( 854) | |
| | Non-controlling interest | ( 22) | |
| | | | 2 570 | |
| | | | | |
| | | | | |
| 1The $234 million of goodwill has no tax basis and was allocated to the Oil Sands business unit. |
| | | | | |
| 2Working capital acquired includes cash of $142 million. |