|
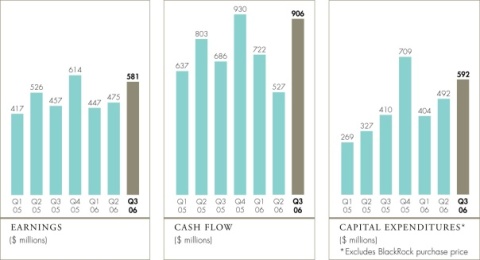
| | Third Quarter Results, October 25, 2006 MANAGEMENT’S DISCUSSION AND ANALYSIS Total Company Shell Canada Limited earnings for the third quarter of 2006 were $581 million, up from $457 million for the corresponding quarter of 2005. Higher crude oil prices and refining light oil margins were offset by lower natural gas prices. The impact of the Company’s Long Term Incentive Plan (LTIP) resulted in a $102 million increase to third-quarter 2006 earnings compared with an $83 million charge for the corresponding quarter in 2005. Prior year results included benefits totalling $41 million related to tax adjustments. Total hydrocarbon production for the quarter was 234,000 barrels of oil equivalent per day (BOE/d), level with production for the same quarter in 2005. Earnings for the first nine months of 2006 were $1,503 million compared with $1,400 million for the corresponding period in 2005. The increase was mainly due to higher crude oil prices, refining light oil margins, a favourable adjustment resulting from changes to federal and Alberta corporate tax rates, and the LTIP. These were offset by reduced production and upgrading associated with the Athabasca Oil Sands Project (AOSP) turnaround. |
THIRD QUARTER RESULTS SHELL CANADA LIMITED 1
MANAGEMENT'S DISCUSSION AND ANALYSIS (continued)
Exploration & Production
Exploration & Production (E&P) earnings in the third quarter of 2006 were $113 million compared with earnings of $149 million reported for the same period in 2005. Earnings were down due to lower natural gas prices, partially offset by an LTIP uplift of $26 million and lower dry hole expenses. Previous year earnings included a $17 million favourable tax adjustment and a $12 million insurance settlement, offset by a charge of $24 million for the LTIP. Natural gas production grew as a result of increases in production from Tay River and basin-centred gas (BCG). Effective January 1, 2006, the Peace River business was transferred from E&P to the Oil Sands business unit. Prior period E&P earnings have been adjusted to exclude Peace River operations.
E&P earnings for the first nine months of 2006 increased to $443 million from $404 million for the same period in 2005. This increase was due to higher natural gas volumes, the impact of the LTIP, and a favourable adjustment resulting from changes to the federal and Alberta corporate tax rates.
The BCG program continues to grow, achieving natural gas sales volumes of 23 million cubic feet per day (mmcf/d) for the quarter. Significant discovered volumes remain constrained by the lack of infrastructure. BCG is expected to deliver 100 mmcf/d by the end of 2007, with the previously announced gas plant expansion and requisite regulatory approvals. Drilling operations continue on the large land holdings, with six rigs currently deployed.
In northeast British Columbia, the Foothills business successfully completed two new wells, which will be tied into new facilities under construction at Wolverine River. However, limitations in the main gathering system and processing facility will restrict gas sales from this region in the near term.
Progress continued on the Sable Offshore Energy Project compression project, and planned outages were taken in the third quarter to facilitate tie-in of the new compression facilities. Startup of these facilities is expected late in the fourth quarter.
Offshore Newfoundland, the first deepwater exploration well in the Orphan Basin was spudded in the third quarter and completion is expected in the fourth quarter. Shell Canada has a 20 per cent interest in eight exploration licenses in the Orphan Basin.
Oil Sands
Oil Sands earnings in the third quarter of 2006 were $262 million, up from $235 million for the corresponding period of 2005. The improvement was mainly due to higher prices and an LTIP uplift of $22 million. Third-quarter earnings in 2005 included a charge of $14 million for the LTIP. The Company’s share of AOSP bitumen production for the third quarter averaged 98,700 barrels per day (bbls/d) compared with 99,100 bbls/d for the same period in 2005.
Oil Sands earnings for the first nine months of 2006 were $493 million, compared with $592 million for the same period in 2005. The reduction in earnings is mainly due to the major scheduled turnaround of both the AOSP mine and upgrader in the second quarter. Effective January 1, 2006, earnings from the Peace River in situ operations are included in both current and prior period earnings.
Unit cash operating costs for the AOSP in the third quarter were $18.93 per barrel. This was $5.32 per barrel lower than the corresponding period last year. The improvement was mainly due to lower natural gas prices and a recovery related to LTIP. The Company realized an average synthetic crude price for the quarter of $68.37.
The Company will make a final investment decision for the AOSP Expansion 1 in the fourth quarter of 2006. Expansion 1 is a fully integrated expansion of the existing AOSP facilities, with both new oil sands mining operations on Lease 13 and associated additional bitumen upgrading at Scotford. As previously disclosed, Shell Canada received conditional approval from the Alberta Energy and Utilities Board for the proposed expansion of the Scotford Upgrader. A regulatory hearing was also completed in September for the expansion of the Muskeg River Mine and a decision is anticipated in the fourth quarter of 2006. On July 28, 2006, Shell Canada issued the formal expansion notice to the other AOSP joint venture owners, to which they have 90 days to respond.
THIRD QUARTER RESULTS SHELL CANADA LIMITED 2
MANAGEMENT'S DISCUSSION AND ANALYSIS (continued)
In the third quarter, the Company decided to defer the upstream portion of the Production Optimization Project (POP), in light of the planned AOSP Expansion 1. A write-down of $15 million is included in earnings for the quarter. The timing and scope of the downstream components of POP, which are a mix of asset integrity and reliability projects at the upgrader, are currently being evaluated.
The Company decided to exercise its right to acquire a 20 per cent working interest in Chevron Canada's Ells River in situ leases, which are located about 50 kilometres northwest of Fort McMurray. This right to participate in the Ells River in situ leases results from the AOSP agreements.
In situ production for the third quarter was 15,300 bbls/d, of which approximately 6,600 bbls/d was due to new volumes from the assets acquired with the purchase of BlackRock Ventures Inc. (BlackRock). New thermal production from two additional well pads at Peace River came on stream in the third quarter of 2006 under budget and ahead of schedule.
The Company plans to file an application for its Carmon Creek project at Peace River later this year. In addition, construction work is progressing on the 10,000 bbls/d first phase of the Orion steam-assisted gravity drainage (SAGD) project at Hilda Lake, acquired in the BlackRock transaction. Building on the BlackRock experience, plans to further increase in situ cold production in the Peace River area are progressing, with the construction of two new cold production well pads and the filing of a regulatory application for a 100-well, cold production program. The Company has decided to divest the assets and properties in the Lloydminster area that were acquired with BlackRock.
Oil Products
Oil Products earnings in the third quarter of 2006 were $201 million, up from $81 million for the third quarter of 2005 due to improved refining margins and better refinery utilization, lower operating expenses and an LTIP uplift of $27 million. Stronger distillate, benzene and black oil margins were offset by weaker liquid petroleum gas margins. Refinery yield was lower in the third quarter of 2006 mainly due to some feedstock limitations at both the Scotford and Montreal East refineries as well as unplanned maintenance at the Sarnia Refinery. Refinery utilization improved as the third quarter 2005 was marked by a planned turnaround at the Scotford Refinery. Third-quarter 2005 earnings were also affected by high spot price purchases of gasoline to meet supply disruptions caused by Hurricanes Katrina and Rita, a charge of $25 million for the LTIP, and a favourable prior year tax adjustment of $25 million.
Oil Products earnings for the first nine months of 2006 were a record $560 million compared with $332 million in 2005. Improved refining light oil margins and an LTIP uplift offset reduced refinery yield.
The previously announced joint venture between Shell Canada's national cardlock network and Flying J's Canadian travel plazas is expected to contribute to increased network efficiency beginning in the fourth quarter. The company is now formed and working on an ambitious site development program, which will feature Shell fuels.
A major turnaround is scheduled to take place at the Sarnia Refinery between mid-October and mid-November.
Corporate
Corporate earnings for the third quarter of 2006 were $5 million compared with negative $8 million for the corresponding period in 2005. The change was due to an LTIP uplift of $27 million offset by higher debt charges, while the corresponding quarter in 2005 had an LTIP charge of $20 million. Corporate earnings for the first nine months of 2006 were $7 million compared with $72 million for the corresponding period in 2005. The change was mainly due to a favourable adjustment in 2005 related to the use of non-capital losses available to the Company resulting from the acquisition of an affiliated company, Coral Resources Canada ULC.
THIRD QUARTER RESULTS SHELL CANADA LIMITED 3
MANAGEMENT'S DISCUSSION AND ANALYSIS (continued)
Cash Flow and Financing
In the third quarter, cash flow from operations increased by $220 million to $906 million from $686 million for the same period last year. The increase is largely attributable to higher earnings and an increase in non-cash items. Cash flow from operations for the first nine months of 2006 was $2,155 million, an increase of $29 million from the same period in 2005.
Capital and predevelopment expenditures amounted to $592 million in the third quarter and $1,488 million for the first nine months of 2006, excluding the acquisition of BlackRock, compared with $410 million and $1,006 million respectively for 2005. The increase reflects an increased level of investment in growth projects including predevelopment work at the AOSP. Total capital and predevelopment expenditures for the year, excluding the BlackRock purchase price of $2.4 billion net of cash acquired, are expected to be in line with the announced investment plan of $2.7 billion for 2006.
Total debt outstanding at the end of the third quarter of 2006 was $1,459 million, which includes $954 million of commercial paper issued under the Company's $1.5 billion program, borrowings of $299 million against a $1 billion syndicated facility established in the second quarter of this year and $206 million for the mobile equipment lease. This compares with debt on the balance sheet of $211 million, mainly comprised of the mobile equipment lease, as at December 31, 2005.
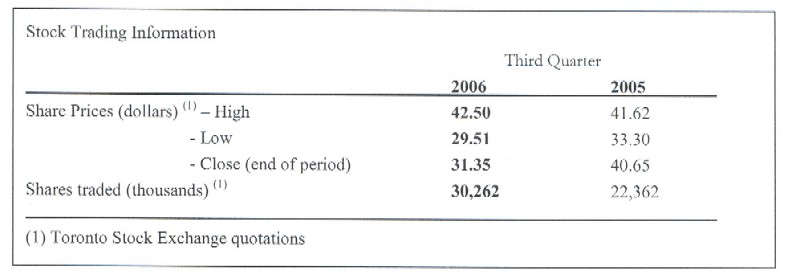
Dividends paid in the third quarter of 2006 were $0.11 per common share totalling $90 million. This same level of dividend was paid in the first and second quarters of 2006 and reflects a 22 per cent increase in the dividend paid in the third quarter of 2005.
Share Information
At October 15, 2006, the Company had 825,541,514 common shares outstanding (July 15, 2006 - 825,464,564 common shares and 100 preference shares) and there were 22,333,630 employee stock options outstanding, of which 11,256,400 were exercisable or could be surrendered to exercise an attached share appreciation right (July 15, 2006 - 22,557,058 outstanding and 11,474,136 exercisable).
Effective September 30, 2006, the previously outstanding 100 preference shares were redeemed by the Company for cash consideration in accordance with their terms.
THIRD QUARTER RESULTS SHELL CANADA LIMITED 4
MANAGEMENT'S DISCUSSION AND ANALYSIS (continued)
Additional Information
Additional information relating to Shell Canada Limited filed with Canadian and U.S. securities regulatory authorities, including the Annual Information Form and Form 40-F, can be found online under the Company’s profile at www.sedar.com and www.sec.gov.
CAUTIONARY NOTE
This document contains “forward-looking statements” based upon management’s assessment of the Company’s future plans and operations. These forward-looking statements include references to the Company’s plans for growth, future capital and other expenditures, drilling, development and expansion plans, construction activities, increased network efficiency, maintenance turnaround schedules, the submission of regulatory applications, the timing of investment decisions, project costs and schedules and oil and gas production levels.
Readers are cautioned not to place undue reliance on forward-looking statements. Although the Company believes that the expectations represented by such forward-looking statements are reasonable based on the information available to it on the date of this document, there can be no assurance that such expectations will prove to be correct. Forward-looking statements involve numerous known and unknown risks and uncertainties that could cause actual results to differ materially from those anticipated by the Company. These risks and uncertainties include, but are not limited to, the risks of the oil and gas industry (including operating conditions and costs), market competition, demand for oil, gas and related products, disruptions in supply, project schedules and execution, labour availability, material and equipment shortages, constraints on infrastructure, the uncertainties involving geology of oil and gas deposits, the uncertainty of reserves estimates, the receipt of regulatory approvals, fluctuations in oil and gas prices and foreign currency exchange rates, general economic conditions, changes in law or government policy, and other factors, many of which are beyond the control of the Company.
The forward-looking statements contained in this document are made as of the date of this document and the Company does not undertake any obligation to update publicly or revise any of the forward-looking statements contained in this document, whether as a result of new information, future events or otherwise, except as required by law. The forward-looking statements contained in this document are expressly qualified by this cautionary note.
Certain financial measures are not prescribed by Canadian generally accepted accounting principles (GAAP). These non-GAAP financial measures do not have any standardized meaning and, therefore, may not be comparable with the calculation of similar measures of other companies. The Company includes as non-GAAP measures return on average capital employed (ROACE), cash flow from operations and unit cash operating cost because they are key internal and external financial measures used to evaluate the performance of the Company.
Certain volumes have been converted to barrels of oil equivalent (BOE). BOEs may be misleading, particularly if used in isolation. A conversion of six thousand cubic feet of natural gas to one barrel of oil, as used in this document, is based on the energy equivalency conversion method primarily applicable at the burner tip and does not represent a value equivalency at the wellhead.
THIRD QUARTER RESULTS SHELL CANADA LIMITED 5
FINANCIAL HIGHLIGHTS |
| | | | | |
| | | | | |
| | Third Quarter | Nine Months |
($ millions, except as noted) (unaudited) | 2006 | 2005 | 2006 | 2005 |
| | | | | |
| | | | | |
| Earnings | 581 | 457 | 1 503 | 1 400 |
| Revenues | 4 028 | 3 956 | 11 225 | 10 351 |
Cash flow from operations1 | 906 | 686 | 2 155 | 2 126 |
| Return on average common shareholders' equity (%) | - | - | 24.7 | 22.4 |
| Per common share (dollars) (Note 6) | | | | |
Earnings - basic | 0.70 | 0.55 | 1.82 | 1.70 |
Earnings - diluted | 0.70 | 0.55 | 1.80 | 1.68 |
Dividends paid | 0.110 | 0.090 | 0.330 | 0.257 |
| | | | | |
RESULTS BY SEGMENT (Note 2) | | | | |
| | | | | |
| Earnings | | | | |
Exploration & Production | 113 | 149 | 443 | 404 |
Oil Sands | 262 | 235 | 493 | 592 |
Oil Products | 201 | 81 | 560 | 332 |
Corporate | 5 | ( 8) | 7 | 72 |
| Total | 581 | 457 | 1 503 | 1 400 |
| Revenues | | | | |
Exploration & Production | 487 | 642 | 1 669 | 1 740 |
Oil Sands | 1 034 | 953 | 2 339 | 2 447 |
Oil Products | 3 156 | 2 952 | 8 726 | 7 794 |
Corporate | 4 | 30 | 74 | 61 |
Inter-segment sales | ( 653) | ( 621) | ( 1 583) | ( 1 691) |
| Total | 4 028 | 3 956 | 11 225 | 10 351 |
Cash flow from operations1 | | | | |
Exploration & Production | 235 | 236 | 769 | 668 |
Oil Sands | 341 | 421 | 600 | 1 051 |
Oil Products | 315 | 50 | 748 | 315 |
Corporate | 15 | ( 21) | 38 | 92 |
| Total | 906 | 686 | 2 155 | 2 126 |
| Capital and predevelopment expenditures | | | | |
Exploration & Production | 183 | 134 | 558 | 477 |
Oil Sands | 315 | 134 | 677 | 230 |
Oil Products | 88 | 139 | 216 | 293 |
Corporate | 6 | 3 | 37 | 6 |
| Total | 592 | 410 | 1 488 | 1 006 |
Return on average capital employed (%)2 | | | | |
Exploration & Production | - | - | 33.9 | 27.8 |
Oil Sands | - | - | 16.3 | 20.8 |
Oil Products | - | - | 26.9 | 19.6 |
| Total | - | - | 22.7 | 21.6 |
THIRD QUARTER RESULTS SHELL CANADA LIMITED 6
OPERATING HIGHLIGHTS |
| | | | | |
| | | | | |
| | Third Quarter | Nine Months |
| (unaudited) | 2006 | 2005 | 2006 | 2005 |
| | | | | |
EXPLORATION & PRODUCTION (Note 2) | | | | |
| | | | | |
Production | | | | |
| Natural gas (mmcf/d) | | | | |
Western Canada natural gas | 414 | 393 | 417 | 389 |
Sable natural gas | 116 | 124 | 107 | 118 |
| Total natural gas - gross | 530 | 517 | 524 | 507 |
| Total natural gas - net | 429 | 412 | 423 | 408 |
| | | | | |
| Ethane, propane and butane (bbls/d) - gross | 18 700 | 21 900 | 20 200 | 23 200 |
| Ethane, propane and butane (bbls/d) - net | 15 100 | 17 300 | 16 200 | 18 600 |
| | | | | |
| Condensate (bbls/d) - gross | 12 700 | 15 400 | 13 100 | 15 100 |
| Condensate (bbls/d) - net | 9 900 | 12 200 | 10 300 | 11 700 |
| | | | | |
| Sulphur (tons/d) - gross | 5 100 | 5 300 | 5 300 | 5 200 |
| Sulphur (tons/d) - net | 5 100 | 4 600 | 5 100 | 4 700 |
| | | | | |
Sales3 - gross | | | | |
| Natural gas (mmcf/d) | 517 | 523 | 516 | 506 |
| Ethane, propane and butane (bbls/d) | 27 500 | 34 500 | 33 600 | 37 100 |
| Condensate (bbls/d) | 18 000 | 10 900 | 20 800 | 18 100 |
| Sulphur (tons/d) | 10 400 | 11 300 | 11 400 | 11 500 |
| | | | | |
OIL SANDS (Note 2) | | | | |
| | | | | |
Production | | | | |
| Bitumen (bbls/d) - gross | | | | |
Minable | 98 700 | 99 100 | 74 400 | 92 300 |
In situ | 15 300 | 11 400 | 9 700 | 9 000 |
| Total | 114 000 | 110 500 | 84 100 | 101 300 |
| | | | | |
| Bitumen (bbls/d) - net | | | | |
Minable | 97 700 | 98 100 | 73 600 | 91 400 |
In situ | 14 200 | 11 200 | 9 300 | 8 800 |
| Total | 111 900 | 109 300 | 82 900 | 100 200 |
| | | | | |
Sales3 | | | | |
Synthetic crude sales excluding blend stocks (bbls/d) | 98 500 | 101 100 | 76 700 | 95 000 |
Purchased upgrader blend stocks (bbls/d) | 39 300 | 34 300 | 34 100 | 35 100 |
| Total synthetic crude sales (bbls/d) | 137 800 | 135 400 | 110 800 | 130 100 |
| | | | | |
Bitumen product excluding diluent (bbls/d) | 15 800 | 13 100 | 9 900 | 9 700 |
Purchased diluent (bbls/d) | 2 900 | 2 100 | 2 000 | 1 900 |
| Total bitumen products (bbls/d) | 18 700 | 15 200 | 11 900 | 11 600 |
| | | | | |
| In situ condensate (bbls/d) | 2 200 | 2 000 | 2 600 | 2 200 |
| | | | | |
Unit Costs4 | | | | |
| | | | | |
Mining and upgrading operations | | | | |
| | | | | |
Cash operating cost - excluding natural gas ($/bbl) | 14.61 | 17.79 | 25.82 | 17.23 |
Cash operating cost - natural gas ($/bbl) | 4.32 | 6.46 | 5.45 | 5.65 |
| Total cash operating cost ($/bbl) | 18.93 | 24.25 | 31.27 | 22.88 |
Depreciation, depletion and amortization ($/bbl) | 6.43 | 5.69 | 5.87 | 6.02 |
| Total unit cost ($/bbl) | 25.36 | 29.94 | 37.14 | 28.90 |
THIRD QUARTER RESULTS SHELL CANADA LIMITED 7
OPERATING HIGHLIGHTS (continued) |
| | | | | |
| | Third Quarter | Nine Months |
| 2006 | 2005 | 2006 | 2005 |
| | | | | |
OIL SANDS (continued) | | | | |
| | | | | |
Unit Costs4 | | | | |
| | | | | |
In situ operations | | | | |
| | | | | |
Cash operating cost - excluding natural gas ($/bbl) | 13.50 | 13.81 | 16.20 | 14.22 |
Cash operating cost - natural gas ($/bbl) | 5.09 | 6.47 | 8.10 | 10.91 |
| Total cash operating cost ($/bbl) | 18.59 | 20.28 | 24.30 | 25.13 |
Depreciation, depletion and amortization ($/bbl) | 5.31 | 4.82 | 8.03 | 4.63 |
| Total unit cost ($/bbl) | 23.90 | 25.10 | 32.33 | 29.76 |
| | | | | |
| | | | | |
OIL PRODUCTS | | | | |
| | | | | |
Sales3 | | | | |
Gasolines (m3/d) | 21 100 | 21 500 | 20 800 | 21 100 |
Middle distillates (m3/d) | 20 300 | 20 400 | 19 900 | 20 400 |
Other products (m3/d) | 6 900 | 7 800 | 6 500 | 7 000 |
Total Oil Products sales (m3/d) | 48 300 | 49 700 | 47 200 | 48 500 |
| | | | | |
Crude oil processed by Shell refineries (m3/d)5 | 47 100 | 45 100 | 44 700 | 46 100 |
Refinery utilization (per cent)6 | 90 | 87 | 87 | 89 |
Earnings per litre (cents)7 | 4.5 | 1.8 | 4.4 | 2.5 |
| | | | | |
Prices | | | | |
| Natural gas average plant gate netback price ($/mcf) | 5.81 | 7.98 | 6.88 | 7.09 |
| Ethane, propane and butane average field gate price ($/bbl) | 34.79 | 33.63 | 35.20 | 31.15 |
| Condensate average field gate price ($/bbl) | 76.69 | 72.98 | 74.81 | 66.22 |
| Synthetic crude average plant gate price ($/bbl) | 68.37 | 66.37 | 63.98 | 57.77 |

THIRD QUARTER RESULTS SHELL CANADA LIMITED 8
FINANCIAL AND OPERATING HIGHLIGHTS |
| | | | | |
| (unaudited) | | | | |
| | | | | |
NON-GAAP MEASURES | | | | |
| | | | | |
| Certain financial measures are not prescribed by Canadian generally accepted accounting principles (GAAP). These |
| non-GAAP financial measures do not have any standardized meaning and, therefore, may not be comparable with |
| the calculation of similar measures for other companies. The Corporation includes as non-GAAP measures return on |
| average capital employed (ROACE), cash flow from operations and unit cash operating cost because they are key |
| internal and external financial measures used to evaluate the performance of the Corporation. |
| | | | | |
DEFINITIONS | | | | |
| | | | | |
1 Cash flow from operations is a non-GAAP measure and is defined as cash flow from operating activities |
| before movement in working capital and operating activities. |
| | | | | |
2 ROACE is a non-GAAP measure and is defined as the last four quarters’ earnings plus after-tax |
| interest expense on debt divided by the average of opening and closing common shareholders’ equity plus |
| preferred shares, long-term debt and short-term borrowings. | | | | |
| | | | | |
3 Exploration & Production and Oil Products sales volumes include sales to third parties only. Oil Sands sales |
| volumes include third-party and inter-segment sales. | | | | |
| | | | | |
4 Total unit cost for Oil Sands, including unit cash operating and unit depreciation, depletion and amortization |
| (DD&A) costs, is a non-GAAP measure. Unit cash operating cost for Oil Sands mining and upgrading is defined as: |
| operating, selling and general expenses plus cash cost items included in cost of goods sold (COGS), divided by synthetic |
| crude sales excluding blend stocks. Operating, selling and general expenses associated with mining and upgrading |
| were $531 million in the first nine months of 2006 and $134 million in the third quarter of 2006. Cash cost items included |
| in COGS were $123 million in the first nine months of 2006 and $39 million in the third quarter of 2006. |
| | | | | |
| Unit cash operating cost for in situ operations is defined as: operating, selling and general expenses plus inter-segment |
| purchases of natural gas, divided by bitumen product sales excluding diluent. Operating, selling and general expenses |
associated with in situ operations were $42 million in the first nine months of 2006 and $18 million in the third quarter of 2006. |
| Inter-segment purchases of natural gas were $22 million in the first nine months of 2006 and $7 million in the third quarter of 2006. |
| | | | | |
| Unit DD&A cost for Oil Sands mining and upgrading is defined as: DD&A cost divided by synthetic crude sales excluding |
| blend stocks. Unit DD&A cost includes preproduction costs, which were written off over the first three years |
| of the project life (2003-2005). | | | | |
| | | | |
| Unit DD&A cost for in situ operations is defined as: DD&A cost divided by bitumen product sales excluding diluent. |
| | | | | |
5 Crude oil processed by Shell refineries includes upgrader feedstock supplied to Scotford Refinery. |
| | | | | |
6 Refinery utilization equals crude oil processed by Shell refineries divided by total capacity of Shell refineries, |
| including capacity uplifts at Scotford Refinery due to processing of various streams from the upgrader. |
| | | | | |
7 Oil Products earnings per litre equals Oil Products earnings after-tax divided by total Oil Products sales volumes. |
THIRD QUARTER RESULTS SHELL CANADA LIMITED 9
CONSOLIDATED STATEMENT OF EARNINGS AND RETAINED EARNINGS |
| | | | | |
| | | | | |
| | Third Quarter | Nine Months |
($ millions, except as noted) (unaudited) | 2006 | 2005 | 2006 | 2005 |
| | | | | |
REVENUES | | | | |
| Sales and other operating revenues | 4 012 | 3 925 | 11 145 | 10 146 |
| Dividends, interest and other income | 16 | 31 | 80 | 205 |
Total revenues | 4 028 | 3 956 | 11 225 | 10 351 |
EXPENSES | | | | |
| Cost of goods sold | 2 371 | 2 269 | 6 657 | 5 703 |
| Operating, selling and general | 424 | 694 | 1 634 | 1 756 |
| Transportation | 72 | 82 | 221 | 247 |
| Exploration | 25 | 42 | 86 | 98 |
| Predevelopment | 40 | 17 | 100 | 49 |
| Depreciation, depletion, amortization and retirements | 230 | 203 | 590 | 566 |
| Interest on long-term debt | 3 | 2 | 7 | 6 |
| Other interest and financing charges | 13 | 1 | 17 | 3 |
Total expenses | 3 178 | 3 310 | 9 312 | 8 428 |
EARNINGS | | | | |
| Earnings before income tax | 850 | 646 | 1 913 | 1 923 |
| Current income tax | 175 | 190 | 430 | 441 |
| Future income tax | 94 | ( 1) | ( 20) | 82 |
| Total income tax | 269 | 189 | 410 | 523 |
Earnings | 581 | 457 | 1 503 | 1 400 |
| Per common share (dollars) (Note 6) | | | | |
Earnings - basic | 0.70 | 0.55 | 1.82 | 1.70 |
Earnings - diluted | 0.70 | 0.55 | 1.80 | 1.68 |
| Common shares outstanding (millions - weighted average) | 826 | 825 | 825 | 825 |
RETAINED EARNINGS | | | | |
| Balance at beginning of period | 8 430 | 6 784 | 7 690 | 6 011 |
| Earnings | 581 | 457 | 1 503 | 1 400 |
| | 9 011 | 7 241 | 9 193 | 7 411 |
| Common shares buy-back | - | - | - | 33 |
| Dividends | 90 | 74 | 272 | 211 |
Balance at end of period | 8 921 | 7 167 | 8 921 | 7 167 |
THIRD QUARTER RESULTS SHELL CANADA LIMITED 10
CONSOLIDATED STATEMENT OF CASH FLOWS |
| | | | | |
| | | | | |
| | Third Quarter | Nine Months |
($ millions) (unaudited) | 2006 | 2005 | 2006 | 2005 |
| | | | | |
CASH FROM OPERATING ACTIVITIES | | | | |
| Earnings | 581 | 457 | 1 503 | 1 400 |
| Exploration and predevelopment | - | 29 | 80 | 80 |
| Non-cash items | | | | |
Depreciation, depletion, amortization and retirements | 230 | 203 | 590 | 566 |
Future income tax | 94 | ( 1) | ( 20) | 82 |
Other items | 1 | ( 2) | 2 | ( 2) |
| Cash flow from operations | 906 | 686 | 2 155 | 2 126 |
| Movement in working capital and operating activities | | | | |
Accounts receivable securitization program | - | ( 150) | - | ( 150) |
Other working capital and operating items | ( 219) | 95 | ( 444) | ( 260) |
| | 687 | 631 | 1 711 | 1 716 |
CASH INVESTED | | | | |
| Capital and predevelopment expenditures | ( 592) | ( 410) | ( 1 488) | ( 1 006) |
| Acquisition of BlackRock Ventures Inc. (Note 3) | - | - | ( 2 428) | - |
| Movement in working capital from investing activities | 62 | 40 | 162 | 16 |
| Capital expenditures and movement in working capital | ( 530) | ( 370) | ( 3 754) | ( 990) |
| Proceeds on disposal of properties, plant and equipment | 1 | - | 1 | 5 |
| Investments and other | ( 26) | - | ( 26) | - |
| | ( 555) | ( 370) | ( 3 779) | ( 985) |
CASH FROM FINANCING ACTIVITIES | | | | |
| Common shares buy-back | - | - | - | ( 34) |
| Proceeds from exercise of common share stock options | 1 | 2 | 5 | 6 |
| Preferred stock redemption (Note 8) | ( 1) | - | ( 1) | - |
| Dividends paid | ( 90) | ( 74) | ( 272) | ( 211) |
| Long-term debt and other | - | ( 1) | - | ( 135) |
| Short-term financing | ( 42) | - | 1 253 | - |
| | ( 132) | ( 73) | 985 | ( 374) |
(Decrease) Increase in cash | - | 188 | ( 1 083) | 357 |
Cash at beginning of period | - | 296 | 1 083 | 127 |
Cash at September 301 | - | 484 | - | 484 |
| | | | | |
Supplemental disclosure of cash flow information | | | | |
Dividends received | 2 | 3 | 9 | 10 |
Interest received | 3 | 4 | 53 | 34 |
Interest paid | 18 | 3 | 26 | 10 |
Income tax paid | 138 | 124 | 601 | 560 |
| | | | | |
1 Cash comprises cash and highly liquid short-term investments. | | | | |
THIRD QUARTER RESULTS SHELL CANADA LIMITED 11
CONSOLIDATED BALANCE SHEET | | | |
| | | | |
| | | | |
| | | | |
| ($ millions) (unaudited) | Sep. 30, 2006 | | Dec. 31, 2005 |
| | | | |
ASSETS | | | |
| Current assets | | | |
Cash and short-term investments | - | | 1 083 |
Accounts receivable | 1 718 | | 1 821 |
Inventories | | | |
Crude oil, products and merchandise | 696 | | 535 |
Materials and supplies | 100 | | 92 |
Prepaid expenses | 104 | | 71 |
Future income tax | 270 | | 316 |
| | 2 888 | | 3 918 |
| Investments, long-term receivables and other | 726 | | 671 |
| Properties, plant and equipment | 13 031 | | 9 066 |
| Goodwill (Notes 3 and 4) | 234 | | - |
Total assets | 16 879 | | 13 655 |
LIABILITIES | | | |
| Current liabilities | | | |
Short-term borrowings (Note 5) | 1 253 | | - |
Accounts payable, accrued liabilities and other | 2 276 | | 2 242 |
Income and other taxes payable | 546 | | 687 |
Current portion of asset retirement and other long-term obligations | 26 | | 26 |
Current portion of long-term debt | 5 | | 11 |
| | 4 106 | | 2 966 |
| Asset retirement and other long-term obligations | 600 | | 545 |
| Long-term debt | 201 | | 200 |
| Future income tax | 2 523 | | 1 730 |
Total liabilities | 7 430 | | 5 441 |
| | | | |
SHAREHOLDERS' EQUITY | | | |
| Capital stock | | | |
100 4% preference shares (Note 8) | - | | 1 |
825 541 514 common shares (2005 - 825 102 612) | 528 | | 523 |
| Retained earnings | 8 921 | | 7 690 |
Total shareholders' equity | 9 449 | | 8 214 |
Total liabilities and shareholders' equity | 16 879 | | 13 655 |
| | | | |
| | | | |
  |
Clive Mather, Director Kerry L. Hawkins, Director | | | |
THIRD QUARTER RESULTS SHELL CANADA LIMITED 12
SEGMENTED INFORMATION |
| | | | | | | | | | | | |
| | | | | | | | | | | | |
| | Third Quarter |
| | | TOTAL | | | OILPRODUCTS | CORPORATE |
($ millions) (unaudited) | | 2006 | 2005 | 2006 | 2005 | 2006 | 2005 | 2006 | 2005 | 2006 | 2005 |
| | | | | | | | | | | | |
REVENUES | | | | | | | | | | | |
| Sales and other operating revenues | | 4 012 | 3 925 | 447 | 535 | 557 | 520 | 3 007 | 2 844 | 1 | 26 |
| Inter-segment sales | | - | - | 38 | 85 | 471 | 433 | 144 | 103 | - | - |
| Dividends, interest and other income | | 16 | 31 | 2 | 22 | 6 | - | 5 | 5 | 3 | 4 |
Total revenues | | 4 028 | 3 956 | 487 | 642 | 1 034 | 953 | 3 156 | 2 952 | 4 | 30 |
EXPENSES | | | | | | | | | | | |
| Cost of goods sold | | 2 371 | 2 269 | - | - | 283 | 216 | 2 086 | 2 060 | 2 | ( 7) |
| Inter-segment purchases | | - | - | 57 | 63 | 128 | 118 | 468 | 440 | - | - |
| Operating, selling and general | | 424 | 694 | 64 | 135 | 152 | 194 | 229 | 318 | ( 21) | 47 |
| Transportation | | 72 | 82 | 72 | 82 | - | - | - | - | - | - |
| Exploration | | 25 | 42 | 25 | 42 | - | - | - | - | - | - |
| Predevelopment | | 40 | 17 | 10 | 9 | 25 | 8 | 5 | - | - | - |
| Depreciation, depletion, | | | | | | | | | | | |
amortization and retirements | | 230 | 203 | 94 | 90 | 66 | 59 | 70 | 54 | - | - |
| Interest on long-term debt | | 3 | 2 | - | - | - | - | - | - | 3 | 2 |
| Other interest and financing charges | | 13 | 1 | - | - | - | - | - | - | 13 | 1 |
Total expenses | | 3 178 | 3 310 | 322 | 421 | 654 | 595 | 2 858 | 2 872 | ( 3) | 43 |
EARNINGS (LOSS) | | | | | | | | | | | |
| Earnings (loss) before income tax | | 850 | 646 | 165 | 221 | 380 | 358 | 298 | 80 | 7 | ( 13) |
| Current income tax | | 175 | 190 | 28 | 97 | 104 | 2 | 52 | 82 | ( 9) | 9 |
| Future income tax | | 94 | ( 1) | 24 | ( 25) | 14 | 121 | 45 | ( 83) | 11 | ( 14) |
| Total income tax | | 269 | 189 | 52 | 72 | 118 | 123 | 97 | ( 1) | 2 | ( 5) |
Earnings (loss) | | 581 | 457 | 113 | 149 | 262 | 235 | 201 | 81 | 5 | ( 8) |
THIRD QUARTER RESULTS SHELL CANADA LIMITED 13
SEGMENTED INFORMATION (continued) |
| | | | | | | | | | | | |
| | | | | | | | | | | | |
| | Nine Months |
| | | TOTAL | | | OIL PRODUCTS | CORPORATE |
($ millions) (unaudited) | | 2006 | 2005 | 2006 | 2005 | 2006 | 2005 | 2006 | 2005 | 2006 | 2005 |
| | | | | | | | | | | | |
REVENUES | | | | | | | | | | | |
| Sales and other operating revenues | | 11 145 | 10 146 | 1 518 | 1 513 | 1 237 | 1 118 | 8 368 | 7 486 | 22 | 29 |
| Inter-segment sales | | - | - | 146 | 202 | 1 096 | 1 197 | 341 | 292 | - | - |
| Dividends, interest and other income | | 80 | 205 | 5 | 25 | 6 | 132 | 17 | 16 | 52 | 32 |
Total revenues | | 11 225 | 10 351 | 1 669 | 1 740 | 2 339 | 2 447 | 8 726 | 7 794 | 74 | 61 |
EXPENSES | | | | | | | | | | | |
| Cost of goods sold | | 6 657 | 5 703 | - | - | 757 | 547 | 5 893 | 5 151 | 7 | 5 |
| Inter-segment purchases | | - | - | 175 | 179 | 297 | 300 | 1 111 | 1 212 | - | - |
| Operating, selling and general | | 1 634 | 1 756 | 281 | 335 | 573 | 499 | 768 | 829 | 12 | 93 |
| Transportation | | 221 | 247 | 221 | 247 | - | - | - | - | - | - |
| Exploration | | 86 | 98 | 86 | 98 | - | - | - | - | - | - |
| Predevelopment | | 100 | 49 | 29 | 30 | 60 | 19 | 11 | - | - | - |
| Depreciation, depletion, | | | | | | | | | | | |
amortization and retirements | | 590 | 566 | 271 | 255 | 145 | 169 | 171 | 141 | 3 | 1 |
| Interest on long-term debt | | 7 | 6 | - | - | - | - | - | - | 7 | 6 |
| Other interest and financing charges | | 17 | 3 | - | - | - | - | - | - | 17 | 3 |
Total expenses | | 9 312 | 8 428 | 1 063 | 1 144 | 1 832 | 1 534 | 7 954 | 7 333 | 46 | 108 |
EARNINGS (LOSS) | | | | | | | | | | | |
| Earnings (loss) before income tax | | 1 913 | 1 923 | 606 | 596 | 507 | 913 | 772 | 461 | 28 | ( 47) |
| Current income tax | | 430 | 441 | 158 | 248 | 83 | 45 | 196 | 285 | ( 7) | ( 137) |
| Future income tax | | ( 20) | 82 | 5 | ( 56) | ( 69) | 276 | 16 | ( 156) | 28 | 18 |
| Total income tax | | 410 | 523 | 163 | 192 | 14 | 321 | 212 | 129 | 21 | ( 119) |
Earnings | | 1 503 | 1 400 | 443 | 404 | 493 | 592 | 560 | 332 | 7 | 72 |
| | | | | | | | | | | | |
| | | | | | | | | | | | |
Total assets | | 16 879 | 12 610 | 3 366 | 2 971 | 8 296 | 4 169 | 4 914 | 4 627 | 303 | 843 |
| | | | | | | | | | | | |
Capital employed 1 | | 10 908 | 7 908 | 2 251 | 1 912 | 5 676 | 2 744 | 2 657 | 2 299 | 324 | 953 |
| | | | | | | | | | | | |
| | | | | | | | | | | | |
| | | | | | | | | | | | |
1 Capital employed is the total of equity, long-term debt and short-term borrowings. | | | | | |
THIRD QUARTER RESULTS SHELL CANADA LIMITED 14
NOTES TO CONSOLIDATED FINANCIAL STATEMENTS |
| |
| |
| (unaudited) |
Note 1. Accounting Policies
These financial statements follow the same accounting policies and methods of computation as, and should be read in conjunction with, the Consolidated Financial Statements for the year ended December 31, 2005, except as described in notes 2, 3 and 4.
Certain other information provided for prior periods has been reclassified to conform to the current presentation.
Note 2. Segmented Information
Effective January 1, 2006, the Peace River business was transferred from Exploration & Production to the Oil Sands business unit. Segmented information for the relevant business units has been reclassified for the prior periods.
Note 3. Acquisition of BlackRock Ventures Inc.
On June 21, 2006, the Corporation acquired more than 92 per cent of the outstanding common shares of BlackRock Ventures Inc. (BlackRock). The original offer was extended to June 27, 2006, and again to July 10, 2006, and additional common shares were acquired. The Corporation completed its acquisition of BlackRock and acquired all of the remaining common shares by way of compulsory acquisition on July 11, 2006. BlackRock was engaged in the development and production of heavy oil in Western Canada.
The Corporation's total consideration for the transaction was $2,570 million ($2,428 million net of cash acquired) including acquisition costs of $12 million and working capital of $108 million. Of the consideration paid, $3,092 million was allocated to oil and natural gas properties and $234 million was allocated to goodwill.
The Corporation's total consideration for the transaction was $2,570 million ($2,428 million net of cash acquired) including acquisition costs of $12 million and working capital of $108 million. Of the consideration paid, $3,092 million was allocated to oil and natural gas properties and $234 million was allocated to goodwill.
The acquisition was accounted for based on the purchase method and the allocation was supported by a third-party valuation. A summary of the purchase equation is presented as follows:
| |
Net assets acquired ($ millions) | | | | |
| | Oil and natural gas properties | 3 092 | | |
| | Goodwill1 | | 234 | | |
| | Working capital2 | | 108 | | |
| | Other assets | | 1 | | |
| | Asset retirement obligations | | ( 11) | | |
| | Future income tax liability | | ( 854) | | |
| | | | 2 570 | | |
| | | | | | |
1The $234 million of goodwill has no tax basis and was allocated to the Oil Sands business unit. |
| | | | | | |
2Working capital acquired includes cash of $142 million. |
THIRD QUARTER RESULTS SHELL CANADA LIMITED 15
NOTES TO CONSOLIDATED FINANCIAL STATEMENTS (continued) |
| |
| |
|
Note 4. Goodwill
The goodwill is entirely due to the timing difference created between the tax basis of the assets compared to the fair value. Goodwill is not subject to amortization, but is tested for impairment on an annual basis, or more frequently if events occur that could result in impairment, by applying a fair value-based test.
Note 5. Short-term borrowings
The Corporation entered into a $1 billion revolving credit facility ("the facility") during the second quarter of 2006. The facility was arranged with a syndicate of banks and matures on June 15, 2008.
This facility, along with the already established $1.5 billion commercial paper program, provided the Corporation with $2.5 billion of borrowing capacity. At September 30, 2006, the outstanding balance on the revolving credit facility was $299 million in the form of short-term borrowings that had an effective interest rate of 4.43 per cent. At September 30, 2006, the outstanding balance on the commercial paper program was $954 million at an effective interest rate of 4.40 per cent.
| Note 6. Earnings Per Share |
| | | | | | | |
| | | | Third Quarter | Nine Months |
| | | | 2006 | 2005 | 2006 | 2005 |
| | | | | | | |
| Earnings ($ millions) | | 581 | 457 | 1 503 | 1 400 |
| | | | | | | |
| Weighted average number of common shares (millions) | 826 | 825 | 825 | 825 |
| | | | | | | |
| Dilutive securities (millions) | | | | |
| Options under Long Term Incentive Plan | 8 | 11 | 9 | 9 |
| | | | | | | |
| Basic earnings per share ($ per share) | 0.70 | 0.55 | 1.82 | 1.70 |
| Diluted earnings per share ($ per share) | 0.70 | 0.55 | 1.80 | 1.68 |
THIRD QUARTER RESULTS SHELL CANADA LIMITED 16
|
NOTES TO CONSOLIDATED FINANCIAL STATEMENTS (continued) | | | |
| | | | | | | |
| | | | | | | |
| (unaudited) | | | | | | |
| | | | | | | |
| | | | | | | |
| Note 7. Employee Future Benefits | | | |
| | | | | | | |
| The Corporation's pension plans are described in the notes to the Consolidated Financial Statements |
| for the year ended December 31, 2005. The components of the pension expense in the Consolidated |
| Statement of Earnings are as follows: |
| | | | | | | |
| | | | | | | |
| | | | Third Quarter |
| | | | Pension Benefits | Other Benefits |
| ($ millions) | | | 2006 | 2005 | 2006 | 2005 |
| Current service cost | | 12 | 9 | 1 | 1 |
| Employee contributions | | ( 1) | ( 1) | - | - |
| Interest cost | | 32 | 32 | 3 | 2 |
| Expected return on plan assets | | ( 37) | ( 34) | - | - |
| Amortization of transitional (asset) obligation | ( 9) | ( 9) | - | - |
| Amortization of net actuarial loss | | 22 | 18 | 1 | - |
| Net expense | | | 19 | 15 | 5 | 3 |
| Defined contribution segment | | 7 | 4 | - | - |
| Total | | | 26 | 19 | 5 | 3 |
| | | | | | | |
| | | | |
| | | | Nine Months |
| | | | Pension Benefits | Other Benefits |
| ($ millions) | | | 2006 | 2005 | 2006 | 2005 |
| Current service cost | | 34 | 27 | 2 | 2 |
| Employee contributions | | ( 3) | ( 3) | - | - |
| Interest cost | | | 96 | 96 | 8 | 7 |
| Expected return on plan assets | | ( 110) | ( 102) | - | - |
| Amortization of transitional (asset) obligation | ( 27) | ( 27) | 1 | 1 |
| Amortization of net actuarial loss | | 66 | 54 | 3 | - |
| Net expense | | | 56 | 45 | 14 | 10 |
| Defined contribution segment | | 20 | 10 | - | - |
| Total | | | 76 | 55 | 14 | 10 |
| | | | | | | |
| | | | | | | |
| Note 8. Preferred Stock Redemption | | | | |
| | | | | | | |
| Effective September 30, 2006, the Corporation redeemed the previously outstanding 100 preference shares |
| for cash consideration in accordance with their terms. |
THIRD QUARTER RESULTS SHELL CANADA LIMITED 17
| Shell Canada Limited | | |
| | FOR INFORMATION: | | |
| | Investor Relations | | |
| | Shell Canada Limited Shell Centre 400 - 4th Avenue S.W. Calgary, Alberta T2P 0J4 Telephone (403) 691-2175 | | |
| | www.shell.ca |
THIRD QUARTER RESULTS SHELL CANADA LIMITED 18