Total natural gas production in 2006 increased to 523 million cubic feet per day (mmcf/d) from 512 mmcf/d in 2005, with increases from the Foothills and basin-centred gas (BCG) businesses.
During the quarter, the Company received Alberta Energy and Utilities Board approval for a downspacing application in the Chinook Ridge region in the BCG business. Approval for downspacing will allow the Company to drill four wells per section and utilize a pad drilling program to reduce costs and environmental impacts. The first four wells on Shell Canada's pad drilling program have been successfully drilled. The BCG program produced natural gas volumes of 23 mmcf/d for the fourth quarter of 2006, up from 8 mmcf/d for the same period in 2005. The BCG program remains on target to deliver production of 100 mmcf/d by the end of 2007.
The Great Barasway deepwater exploration well in the Orphan Basin offshore Newfoundland continued drilling in the fourth quarter. Drilling is taking longer than anticipated and is now expected to conclude during the first quarter of 2007.
The Mackenzie Gas Project is experiencing upward cost pressure, influenced by regional and global energy industry activity. In addition, a recent Federal Court decision regarding Aboriginal consultation by the federal government on the proposed Mackenzie Valley pipeline has resulted in further uncertainty regarding the regulatory process for the project. The project proponents expect to file an updated cost estimate and schedule with regulators later in the first quarter of 2007.
Within the Foothills business, construction is progressing on the northeast British Columbia gas gathering system and dehydration facility, which is designed to connect several existing gas discoveries and increase production in 2007 from the Monkman Pass region. Two wells - a development well and an exploration well - were drilled in 2006 in the same area as the initial Tay River discovery. Neither well was successful in the main target zone.
Oil Sands earnings in 2006 were $718 million compared with $783 million in 2005. Higher oil prices were offset by lower production due to the belt tear at the mine in the first quarter of 2006 and a major scheduled turnaround of both the mine and upgrader at mid year. The 2006 results included a favourable tax adjustment of $144 million resulting from changes to federal and Alberta corporate tax rates. Total LTIP charges were $8 million in 2006 compared to $30 million in 2005.
Oil Sands earnings in the fourth quarter of 2006 were $221 million, up from $193 million for the corresponding period in 2005. Increased in situ production, lower heavy oil differentials and an improved AOSP synthetic product mix were offset by lower crude prices in the quarter. Earnings for the quarter also included $21 million from AOSP Expansion 1 payments received from the other joint venture owners and an insurance settlement of $15 million from the June 30, 2006 fire at the BlackRock Seal battery. These earnings were offset by an LTIP charge of $29 million.
The Company’s share of AOSP bitumen production in 2006 averaged 82,500 barrels per day (bbls/d), down from the average of 95,900 bbls/d achieved in 2005. The lower production was due to the belt tear at the mine in the first quarter of 2006 and a major scheduled turnaround of both the mine and upgrader at mid year. In the fourth quarter of 2006, average bitumen production was 106,600 bbls/d compared with 106,800 bbls/d for the same period in 2005.
Unit cash operating costs for the AOSP averaged $28.73 per barrel in 2006, an increase of $5.51 per barrel compared to 2005. The increase was largely due to the first major scheduled turnaround of the AOSP, which resulted in higher maintenance costs and lower production. Unit cash operating costs in the fourth quarter of 2006 were $24.26 per barrel compared with $23.88 for the same period in 2005. The Company realized an average synthetic crude price of $55.56 for the quarter.
During the quarter, the Company received Alberta Energy and Utilities Board approval for the Muskeg River Mine Expansion, an integral part of AOSP Expansion 1, a 100,000 bbls/d expansion of oil sands mining and upgrading facilities. Construction is well underway on both the upstream and downstream components of Expansion 1, and the project now employs 2,400 people.
Total average in situ production for the full year was 12,400 bbls/d compared to 8,900 bbls/d in 2005. In situ production for the fourth quarter was 20,400 bbls/d, up significantly from 8,900 bbls/d in the fourth quarter of 2005 due to new thermal production at Peace River and new volumes associated with the purchase of BlackRock Ventures Inc. (BlackRock). Year-end capacity was 30,000 bbls/d although, as previously disclosed, production volumes at Peace River continue to be reduced due to the apportionment on the Rainbow Pipeline.
Construction of the 10,000 bbls/d Orion steam-assisted gravity drainage (SAGD) project near Cold Lake is on track with a target start up in mid 2007. During the quarter, the Company filed its regulatory application for the in situ growth plan for a 100,000 bbls/d Peace River development.
Reserves
In 2006, gross proved natural gas reserves were 1,400 billion cubic feet (bcf) compared with 1,592 bcf for 2005, after production of 191 bcf. Natural gas reserve additions from extensions and discoveries of 133 bcf, including 95 bcf from continued drilling success in the BCG region, were offset by downward technical and economic revisions.
Gross proved natural gas liquids reserves decreased to 61 million barrels in 2006 after production of 12 million barrels and a small offset from net positive technical and economic revisions.
SHELL CANADA LIMITED
Management's Discussion and Analysis (continued)
The Company’s gross proved in situ bitumen reserves increased from 28 million barrels in 2005 to 96 million barrels in 2006, due mainly to the acquisition of BlackRock. Reserves additions resulting from infill drilling in the Peace River field were offset by production of 5 million barrels and minor technical revisions.
In accordance with U.S. SEC regulations, the Company booked proved reserves of 34 million barrels for Orion, reflecting only the approved first phase of the project. Reserves for the future phases of Orion will be booked upon final investment decision. Proved reserves for Orion of 95 million barrels previously reported by BlackRock were prepared according to Canadian reserve reporting regulations.
The Company’s gross proved minable bitumen reserves increased by 60 per cent in 2006 to 1,292 million barrels from 808 million barrels in 2005. Following the final investment decision for AOSP Expansion 1, the Company booked 497 million barrels on a gross basis to reflect the project’s full economic life of 38 years. Core-hole drilling activity at the Muskeg River Mine resulted in the reclassification of 17 million barrels from the probable to proved category. The additions were partially offset by production of 30 million barrels in 2006. Total gross proved and probable minable bitumen reserves increased from 936 million barrels in 2005 to 1,695 million barrels for 2006.
Shell Canada’s 2006 Annual Report will provide full gross and net reserves information.
Oil Products
Oil Products 2006 annual earnings were a record $584 million, up significantly from earnings of $434 million for 2005. Stronger refining margins and a favourable second quarter adjustment of $43 million resulting from changes to federal and Alberta corporate tax rates were partially offset by lower refinery yield. Planned turnarounds at both the Montreal East and Sarnia refineries in 2006, as well as feedstock limitations at both the Scotford and Montreal East refineries, impacted refinery yield. Total LTIP charges were $13 million in 2006 compared with $56 million in 2005.
Oil Products earnings in the fourth quarter of 2006 were $22 million compared with $106 million for the same period in 2005. The decrease was mainly due to higher operating expenses, which included an LTIP charge of $36 million, lower refining and marketing margins, and lower refinery yield. The total impact of the planned turnaround at the Sarnia Refinery was $44 million. Refinery yield was also lower in the fourth quarter of 2006 due to feedstock limitations at Montreal East Refinery and lower benzene sales from Scotford.
In the fourth quarter, work progressed on designs for a new heavy oil refinery near Sarnia, Ontario. The team has begun to advance environmental impact assessments and ongoing discussions with various regulatory and community stakeholder groups.
Oil Products has planned a major turnaround for the Montreal East Refinery in the second quarter of 2007. The turnaround will impact a number of process units for approximately one month.
SHELL CANADA LIMITED
Management's Discussion and Analysis (continued)
Corporate
Corporate incurred a loss of $63 million in 2006 compared with earnings of $119 million in 2005. Higher interest charges were offset by lower LTIP charges in 2006. Prior year earnings included a favourable adjustment of $164 million related to the use of non-capital losses available to the Company resulting from the acquisition of an affiliated company, Coral Resources Canada ULC. Total LTIP charges in 2006 were $12 million compared to $46 million in 2005.
Corporate incurred a loss of $73 million in the fourth quarter of 2006 compared with earnings of $49 million for the corresponding period in 2005. The change was mainly due to higher operating expenses, which included a $35 million LTIP charge, higher interest charges in 2006, and a favourable adjustment of $65 million in 2005 related to the use of non-capital losses available to the Company resulting from the acquisition of an affiliated company, Coral Resources Canada ULC.
Cash Flow and Financing
In 2006, cash flow from operations was $2,614 million, down from $3,036 million in 2005. The decrease is largely due to lower bitumen and NGL volumes, lower natural gas prices and higher expenses. These were partially offset by higher oil prices and refining light oil margins, and a favourable adjustment resulting from changes to federal and Alberta corporate tax rates. Cash flow from operations for the fourth quarter of 2006 was $438 million, down from $926 million for the same period in 2005. The decrease was mainly due to lower natural gas prices, higher LTIP charges and the turnaround at the Sarnia Refinery.
Capital and predevelopment expenditures amounted to $2,426 million for 2006 (excluding the BlackRock purchase price of $2.4 billion net of cash acquired) and $938 million for the fourth quarter, compared with $1,715 million and $709 million respectively for 2005. The difference was due to increased investment in growth activities in unconventional oil and gas.
Total debt outstanding at the end of 2006 was $1,435 million, which includes $1,036 million of commercial paper issued under the Company's $1.5 billion program, borrowings of $199 million against a $1-billion syndicated facility established in the second quarter of this year and $200 million for a mobile equipment lease. This compares with debt on the December 31, 2005 balance sheet of $211 million, mainly due to the mobile equipment lease. The Company also held $1,083 million in cash on December 31, 2005.
Dividends paid in the fourth quarter of 2006 were $0.11 per common share, totalling $91 million. This same level of dividend was paid in the third quarter of 2006 and the fourth quarter of 2005.
Share Information
At January 15, 2007, the Company had 825,662,514 common shares outstanding (October 15, 2006 - 825,541,514 common shares) with 21,365,238 employee stock options outstanding, of which 10,360,457 were exercisable or could be surrendered to exercise an attached share appreciation right (October 15, 2006 - 22,333,630 outstanding and 11,256,400 exercisable).
SHELL CANADA LIMITED
Management's Discussion and Analysis (continued)
| Stock Trading Information | | | |
| | Fourth Quarter | |
| | | 2006 | | 2005 | |
| Share Prices (dollars) (1) - High | | 43.85 | | 42.35 | |
| - Low | | 28.90 | | 32.45 | |
| - Close (end of period) | | 43.51 | | 42.05 | |
| Shares traded (thousands) (1) | | | 85,578 | | | 23,719 | |
| |
(1) Toronto Stock Exchange quotations | | | | | | | |
Additional Information
Additional information relating to Shell Canada Limited filed with Canadian and U.S. securities regulatory authorities, including the Annual Information Form and Form 40-F, can be found online under the Company’s profile at www.sedar.com and www.sec.gov.
Cautionary Note
This document contains “forward-looking statements” based upon management’s assessment of the Company’s future plans and operations. These forward-looking statements include references to the Company’s plans for growth, future capital and other expenditures, drilling, development, construction and expansion plans, maintenance activities and schedules, resources and reserves estimates, future production of resources and reserves, the submission and receipt of regulatory applications, project costs and schedules, the impact of compression projects, the apportionment of pipeline capacity and oil and gas production levels.
Readers are cautioned not to place undue reliance on forward-looking statements. Although the Company believes that the expectations represented by such forward-looking statements are reasonable based on the information available to it on the date of this document, there can be no assurance that such expectations will prove to be correct. Forward-looking statements involve numerous known and unknown risks and uncertainties that could cause actual results to differ materially from those anticipated by the Company. These risks and uncertainties include, but are not limited to, the risks of the oil and gas industry (including operating conditions and costs), market competition, demand for oil, gas and related products, disruptions in supply, project start-up, schedules and execution, labour availability, material and equipment shortages, constraints on infrastructure, the uncertainties involving geology of oil and gas deposits and reserves estimates, including the assumption that the quantities estimated can be found and profitably produced in the future, the receipt of regulatory approvals, stakeholder engagement, fluctuations in oil and gas prices and foreign currency exchange rates, general economic conditions, changes in law or government policy, and other factors, many of which are beyond the control of the Company.
The forward-looking statements contained in this document are made as of the date of this document and the Company does not undertake any obligation to update publicly or revise any of the forward-looking statements contained in this document, whether as a result of new information, future events or otherwise, except as required by law. The forward-looking statements contained in this document are expressly qualified by this cautionary note.
SHELL CANADA LIMITED
Management's Discussion and Analysis (continued)
Certain financial measures are not prescribed by Canadian generally accepted accounting principles (GAAP). These non-GAAP financial measures do not have any standardized meaning and, therefore, may not be comparable with the calculation of similar measures of other companies. The Company includes as non-GAAP measures return on average capital employed (ROACE), cash flow from operations and unit cash operating cost because they are key internal and external financial measures used to evaluate the performance of the Company.
The Company’s reserves disclosure and related information are prepared in reliance on a decision of the applicable Canadian securities regulatory authorities under National Instrument 51-101 - Standards of Disclosure for Oil and Gas Activities (NI 51-101), which permits the Company to present its reserves disclosure and related information in accordance with the applicable requirements of the United States Financial Accounting Standards Board and the United States Securities and Exchange Commission. This disclosure differs from the corresponding information required by NI 51-101.
For 2006, reserves estimates associated with the BlackRock properties were prepared by an independent qualified reserves evaluator. Otherwise, the Company’s reserves estimates are prepared by internal qualified reserves evaluators. With the exception of the BlackRock properties, no independent qualified reserves evaluator or auditor was involved in the preparation of the Company’s reserves data.
Certain volumes have been converted to barrels of oil equivalent (BOE). BOEs may be misleading, particularly if used in isolation. A conversion of six thousand cubic feet of natural gas to one barrel of oil, as used in this document, is based on the energy equivalency conversion method primarily applicable at the burner tip and does not represent a value equivalency at the wellhead.
SHELL CANADA LIMITED | | | | |
Financial Highlights | | | | |
| ($ millions, except as noted) | | | | |
(unaudited) | | | | |
| | Fourth Quarter | Total Year |
| | 2006 | 2005 | 2006 | 2005 |
| | | (restated) | | (restated) |
| | | | | |
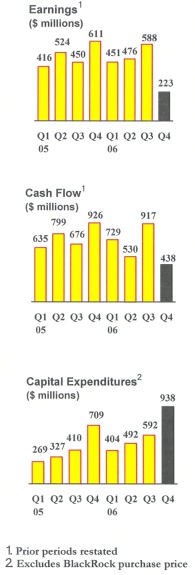
| Earnings | 223 | 611 | 1 738 | 2 001 |
| Revenues | 3 581 | 4 043 | 14 806 | 14 394 |
Cash flow from operations1 | 438 | 926 | 2 614 | 3 036 |
| Return on average common shareholders' equity (%) | - | - | 19.6 | 27.2 |
| Per common share (dollars) (Note 7) | | | | |
Earnings - basic | 0.27 | 0.74 | 2.11 | 2.43 |
Earnings - diluted | 0.27 | 0.73 | 2.09 | 2.40 |
Dividends paid | 0.110 | 0.110 | 0.440 | 0.367 |
| | | | | |
Results by Segment (Note 3) | | | | |
| | | | | |
| Earnings | | | | |
Exploration & Production | 53 | 263 | 499 | 665 |
Oil Sands | 221 | 193 | 718 | 783 |
Oil Products | 22 | 106 | 584 | 434 |
Corporate | ( 73) | 49 | ( 63) | 119 |
| Total | 223 | 611 | 1 738 | 2 001 |
| Revenues | | | | |
Exploration & Production | 531 | 814 | 2 200 | 2 554 |
Oil Sands | 1 024 | 909 | 3 363 | 3 356 |
Oil Products | 2 641 | 2 985 | 11 367 | 10 779 |
Corporate | 4 | 2 | 78 | 63 |
Inter-segment sales | ( 619) | ( 667) | ( 2 202) | ( 2 358) |
| Total | 3 581 | 4 043 | 14 806 | 14 394 |
Cash flow from operations1 | | | | |
Exploration & Production | 215 | 360 | 990 | 1 024 |
Oil Sands | 239 | 363 | 843 | 1 411 |
Oil Products | 78 | 216 | 831 | 527 |
Corporate | ( 94) | ( 13) | ( 50) | 74 |
| Total | 438 | 926 | 2 614 | 3 036 |
| Capital and predevelopment expenditures | | | | |
Exploration & Production | 270 | 319 | 828 | 796 |
Oil Sands | 473 | 190 | 1 150 | 420 |
Oil Products | 186 | 192 | 402 | 484 |
Corporate | 9 | 8 | 46 | 15 |
| Total | 938 | 709 | 2 426 | 1 715 |
Return on average capital employed (%)2 | | | | |
Exploration & Production | - | - | 23.9 | 40.3 |
Oil Sands | - | - | 16.6 | 27.8 |
Oil Products | - | - | 24.0 | 19.8 |
| Total | - | - | 18.2 | 26.7 |
| | | | | |
SHELL CANADA LIMITED | | | | |
Operating Highlights | | | | |
(unaudited) | | | | |
| | | | | |
| | Fourth Quarter | Total Year |
| | 2006 | 2005 | 2006 | 2005 |
| | | (restated) | | (restated) |
EXPLORATION & PRODUCTION (Note 3) | | | | |
| | | | | |
Production | | | | |
| Natural gas (mmcf/d) | | | | |
Western Canada natural gas | 415 | 407 | 416 | 393 |
Sable natural gas | 105 | 121 | 107 | 119 |
| Total natural gas - gross | 520 | 528 | 523 | 512 |
| Total natural gas - net | 431 | 428 | 425 | 413 |
| | | | | |
| Ethane, propane and butane (bbls/d) - gross | 18 600 | 23 600 | 19 800 | 23 300 |
| Ethane, propane and butane (bbls/d) - net | 14 800 | 18 600 | 15 900 | 18 600 |
| | | | | |
| Condensate (bbls/d) - gross | 12 600 | 15 600 | 13 000 | 15 300 |
| Condensate (bbls/d) - net | 9 600 | 12 000 | 10 100 | 11 800 |
| | | | | |
| Sulphur (tons/d) - gross | 4 700 | 5 600 | 5 200 | 5 300 |
| Sulphur (tons/d) - net | 4 700 | 5 000 | 5 000 | 4 800 |
| | | | | |
Sales3 - gross | | | | |
| Natural gas (mmcf/d) | 507 | 520 | 514 | 510 |
| Ethane, propane and butane (bbls/d) | 35 800 | 41 400 | 34 100 | 38 200 |
| Condensate (bbls/d) | 20 200 | 23 600 | 20 600 | 18 100 |
| Sulphur (tons/d) | 13 300 | 12 300 | 11 900 | 11 700 |
| | | | | |
| | | | | |
OIL SANDS (Note 3) | | | | |
| | | | | |
Production | | | | |
| Bitumen (bbls/d) - gross | | | | |
Minable | 106 600 | 106 800 | 82 500 | 95 900 |
In situ | 20 400 | 8 900 | 12 400 | 8 900 |
| Total | 127 000 | 115 700 | 94 900 | 104 800 |
| | | | | |
| Bitumen (bbls/d) - net | | | | |
Minable | 105 600 | 105 700 | 81 700 | 95 000 |
In situ | 20 100 | 8 600 | 12 000 | 8 700 |
| Total | 125 700 | 114 300 | 93 700 | 103 700 |
| | | | | |
Sales3 | | | | |
Synthetic crude sales excluding blend stocks (bbls/d) | 113 100 | 112 300 | 85 900 | 99 400 |
Purchased upgrader blend stocks (bbls/d) | 39 300 | 42 900 | 35 400 | 37 100 |
| Total synthetic crude sales (bbls/d) | 152 400 | 155 200 | 121 300 | 136 500 |
| | | | | |
Bitumen product excluding diluent (bbls/d) | 22 500 | 10 200 | 13 100 | 9 900 |
Purchased diluent (bbls/d) | 6 100 | 2 100 | 3 000 | 1 900 |
| Total bitumen products (bbls/d) | 28 600 | 12 300 | 16 100 | 11 800 |
| | | | | |
| In situ condensate (bbls/d) | 3 200 | 3 100 | 2 700 | 2 400 |
| | | | | |
Unit Costs4 | | | | |
| | | | | |
Mining and upgrading operations | | | | |
| | | | | |
Cash operating cost - excluding natural gas ($/bbl) | 19.42 | 16.73 | 23.49 | 17.14 |
Cash operating cost - natural gas ($/bbl) | 4.84 | 7.15 | 5.24 | 6.08 |
| Total cash operating cost ($/bbl) | 24.26 | 23.88 | 28.73 | 23.22 |
Depreciation, depletion and amortization ($/bbl) | 4.84 | 5.14 | 5.53 | 5.77 |
| Total unit cost ($/bbl) | 29.10 | 29.02 | 34.26 | 28.99 |
SHELL CANADA LIMITED | | | | |
Operating Highlights (continued) | | | | |
(unaudited) | | | | |
| | Fourth Quarter Total Year |
| | 2006 | 2005 | 2006 | 2005 |
| | | (restated) | | (restated) |
OIL SANDS (continued) | | | | |
| | | | | |
Unit Costs4 | | | | |
| | | | | |
In situ operations | | | | |
| | | | | |
Cash operating cost - excluding natural gas ($/bbl) | 11.87 | 12.04 | 14.02 | 13.65 |
Cash operating cost - natural gas ($/bbl) | 2.90 | 5.71 | 5.85 | 9.56 |
| Total cash operating cost ($/bbl) | 14.77 | 17.75 | 19.87 | 23.21 |
Depreciation, depletion and amortization ($/bbl) | 7.61 | 6.45 | 7.85 | 5.11 |
| Total unit cost ($/bbl) | 22.38 | 24.20 | 27.72 | 28.32 |
| | | | | |
| | | | | |
OIL PRODUCTS | | | | |
| | | | | |
Sales3 | | | | |
Gasolines (m3/d) | 20 800 | 20 900 | 20 800 | 21 000 |
Middle distillates (m3/d) | 20 200 | 22 900 | 20 000 | 21 000 |
Other products (m3/d) | 6 400 | 7 300 | 6 500 | 7 100 |
Total Oil Products sales (m3/d) | 47 400 | 51 100 | 47 300 | 49 100 |
| | | | | |
Crude oil processed by Shell refineries (m3/d)5 | 44 200 | 41 500 | 44 600 | 44 900 |
Refinery utilization (per cent)6 | 84 | 80 | 86 | 87 |
Earnings per litre (cents)7 | 0.5 | 2.3 | 3.4 | 2.4 |
| | | | | |
Prices | | | | |
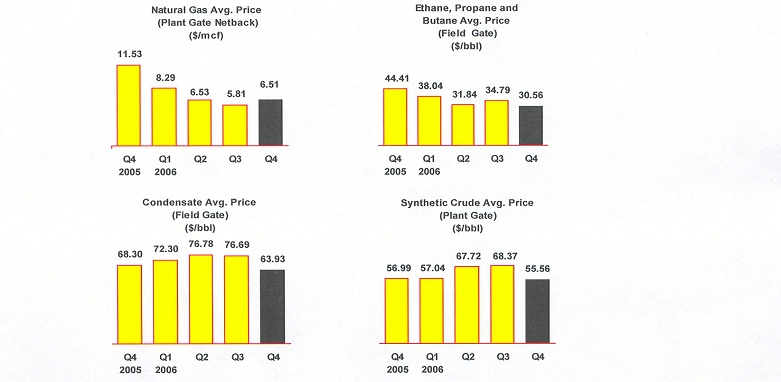
| Natural gas average plant gate netback price ($/mcf) | 6.51 | 11.53 | 6.79 | 8.23 |
| Ethane, propane and butane average field gate price ($/bbl) | 30.56 | 44.41 | 33.94 | 34.79 |
| Condensate average field gate price ($/bbl) | 63.93 | 68.30 | 71.63 | 66.76 |
| Synthetic crude average plant gate price ($/bbl) | 55.56 | 56.99 | 61.32 | 57.55 |
| | | | | |