Annual Report
Franklin New York Tax-Free Income Fund
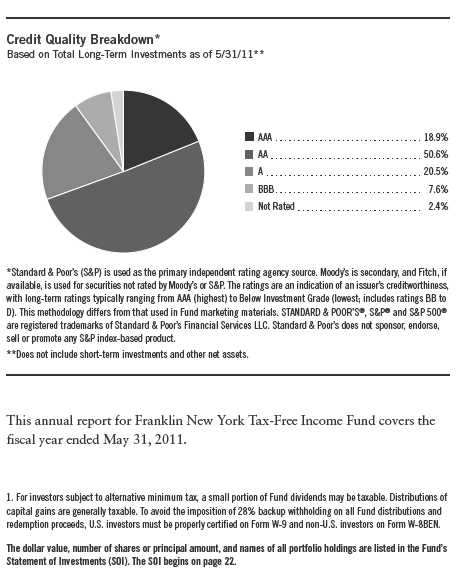
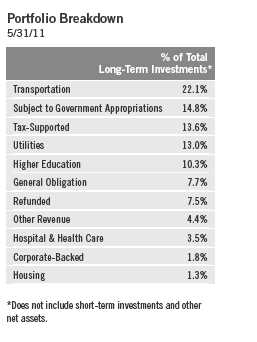
Your Fund’s Goal and Main Investments: Franklin New York Tax-Free Income Fund seeks to provide as high a level of income exempt from federal, New York state and New York City personal income taxes as is consistent with prudent management and preservation of capital by investing at least 80% of its total assets in securities that pay interest free from federal and New York state personal income taxes and at least 65% of its total assets in securities that pay interest free from New York City personal income taxes.1
4 | Annual Report
Performance Overview
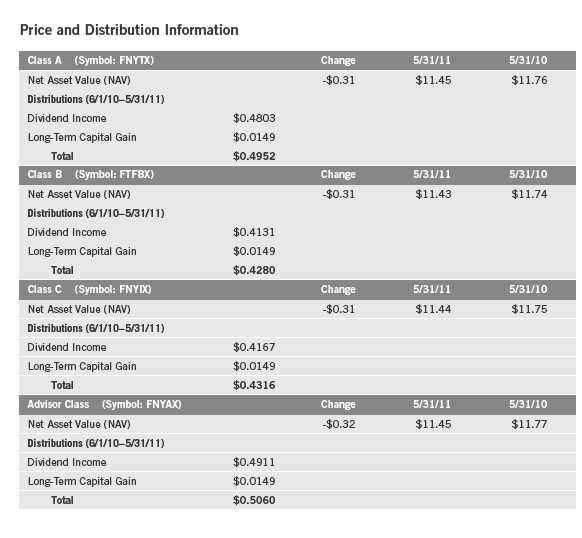
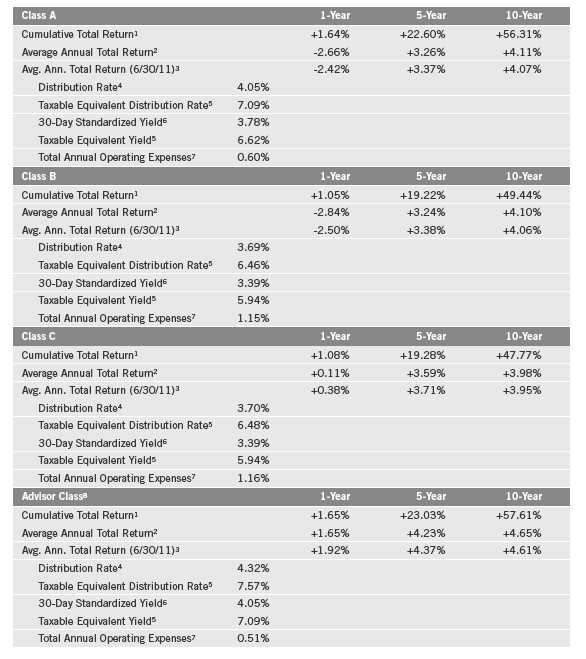
The Fund’s Class A share price, as measured by net asset value, decreased from $11.76 on May 31, 2010, to $11.45 on May 31, 2011. The Fund’s Class A shares paid dividends totaling 48.03 cents per share for the reporting period.2 The Performance Summary beginning on page 11 shows that at the end of this reporting period the Fund’s Class A shares’ distribution rate was 4.05% based on an annualization of May’s 4.04 cent per share dividend and the maximum offering price of $11.96 on May 31, 2011. An investor in the 2011 maximum combined effective federal and New York state and City personal income tax bracket of 42.91% would need to earn a distribution rate of 7.09% from a taxable investment to match the Fund’s Class A tax-free distribution rate. For the Fund’s Class B, C and Advisor shares’ performance, please see the Performance Summary.
State Update
New York’s economic growth outpaced the nation’s during the 12 months under review as the financial sector rebounded and the tourism and export industries strengthened due to the improving global economy and weak U.S. dollar. The state’s housing market boom-bust cycle was less pronounced than those of other states, and with less excess inventory to unwind, the state’s foreclosure rate ranked among the nation’s lowest. However, residential and commercial real estate markets remained weak, extending job losses in the construction sector. Weak manufacturing activities and government spending cuts continued to be a drain on employment. The state’s three largest private employment sectors — professional and business services; education and health services; and trade, transportation and utilities — continued to expand. The financial activities sector, which accounts for approximately 8% of the state’s employment but about 20% of its wage income, also contributed to job growth.3 The state’s unemployment rate declined to 7.9% in May 2011, which was considerably lower than the 9.1% national rate.4
New York has resolved large budget deficits in past years at the time of original budget enactment, including an estimated $9.2 billion gap for fiscal year 2011.3 Based on preliminary results, the state ended fiscal year 2011 with a balanced general fund on a cash budgetary basis and an almost $1.4 billion cash balance.5
2. All Fund distributions will vary depending upon current market conditions, and past distributions are not indicative of future trends.
3. Source: Standard & Poor’s, “New York State; General Obligation,” RatingsDirect, 3/21/11. 4. Source: Bureau of Labor Statistics.
5. Source: “New York State Enacted Budget Financial Plan for Fiscal Year 2012,” 5/6/11.
Performance data represent past performance, which does not guarantee future results. Investment return and principal value will fluctuate, and you may have a gain or loss when you sell your shares. Current performance may differ from figures shown. Please visit franklintempleton.com or call (800) 342-5236 for most recent month-end performance.
Annual Report | 5
| | | | |
| Dividend Distributions2 | | | | |
| | | Dividend per Share | |
| Month | Class A | Class B | Class C | Advisor Class |
| June 2010 | 4.04 cents | 3.50 cents | 3.51 cents | 4.12 cents |
| July 2010 | 4.04 cents | 3.50 cents | 3.51 cents | 4.12 cents |
| August 2010 | 4.04 cents | 3.50 cents | 3.51 cents | 4.12 cents |
| September 2010 | 4.04 cents | 3.47 cents | 3.50 cents | 4.14 cents |
| October 2010 | 4.04 cents | 3.47 cents | 3.50 cents | 4.14 cents |
| November 2010 | 4.04 cents | 3.47 cents | 3.50 cents | 4.14 cents |
| December 2010 | 3.89 cents | 3.29 cents | 3.35 cents | 3.99 cents |
| January 2011 | 3.89 cents | 3.29 cents | 3.35 cents | 3.99 cents |
| February 2011 | 3.89 cents | 3.29 cents | 3.35 cents | 3.99 cents |
| March 2011 | 4.04 cents | 3.51 cents | 3.53 cents | 4.12 cents |
| April 2011 | 4.04 cents | 3.51 cents | 3.53 cents | 4.12 cents |
| May 2011 | 4.04 cents | 3.51 cents | 3.53 cents | 4.12 cents |
On March 31, 2011, the state legislature passed its first on-time budget since 2006, in time for the April 1, 2011, start of fiscal year 2012. The budget, which was a result of bi-partisan and bi-cameral efforts, closed a $10 billion gap largely with recurring measures and spending cuts, the majority of which were in Medicaid and education.5 The enacted budget also included measures to redesign the state government, including the consolidation of eight agencies or authorities into four. Additionally, it reflected the governor’s proposed 10% general fund reductions for all state agency operations, including workforce spending cuts, and comparable reductions for the state and city university systems.5 State officials projected to end fiscal year 2012 with a $1.7 billion general fund reserve, consisting primarily of $1.3 billion in the Rainy Day Reserve Fund, with the rest allocated to other reserve funds.5 The state reached its fiscal goals with no new taxes or borrowing and significantly reduced projected future year budget gaps. This result reflected the short-term impact of the recession on the state’s tax receipts and expenditure programs, the long-term growth in spending, the expiration of a temporary personal income tax surcharge at the end of calendar year 2011, and the end of the federal stimulus program.
New York’s net tax-supported debt was 6.8% of personal income and $3,149 per capita, compared with the 2.8% and $1,066 national medians.6 Although the state’s debt levels ranked among the nation’s highest, they were manageable and in line with those of other northeastern states. Independent credit rating agency Standard & Poor’s rated New York’s general obligation bonds AA with a stable outlook.7 The rating and outlook reflected the state’s diverse economy,
6. Source: Moody’s Investors Service, “Special Comment: 2011 State Debt Medians Report,” 5/25/11.
7. This does not indicate Standard & Poor’s rating of the Fund.
6 | Annual Report
relatively high income levels, history of conservative budgeting, active financial management, an established rainy day fund, and a strong pension funded ratio. These positives were balanced against cyclical finances, moderately high debt levels and large, other postemployment benefit liabilities.
Municipal Bond Market Overview
For the 12 months ended May 31, 2011, the municipal bond market posted a gain of 3.18% as measured by the Barclays Capital (BC) Municipal Bond Index, which tracks investment-grade municipal securities.8 The gain was noteworthy considering the same index endured a record five consecutive months of negative total returns from September 2010 through January 2011. In comparison during the same period, Treasuries rose 4.49%, according to the BC U.S. Treasury Index, which tracks various U.S. Treasury securities.8
For the first three months of the reporting period municipal bond performance was solid, supported by strong investor demand and generally low interest rates resulting in part from the Federal Reserve Board’s (Fed’s) accommodative stance. The market also benefited from lower-than-normal tax-exempt issuance due to the Build America Bonds (BAB) program. The BAB program allowed municipal issuers to sell their bonds in the taxable market and take advantage of a 35% federal government subsidy for all coupon payments made on those municipal bonds. Such taxable bonds, however, are not part of the Fund’s tax-free portfolio. This subsidy enabled municipalities to borrow at significantly lower net yields than they could otherwise obtain in the traditional tax-exempt municipal bond market, which dramatically reduced the supply of new tax-exempt bonds. Of the $433 billion in issuance for the year 2010, $275 billion, or 64%, was in the form of tax-exempt municipal bonds.9 For the year 2008 (prior to the BAB program), municipal issuance totaled $390 billion, with $341 billion, or 88%, in the form of tax-exempt municipal bonds.9
November, December and January were particularly challenging months for many fixed income markets as they pulled back sharply after the Fed announced its intention to implement a second round of quantitative easing (QE2) with a $600 billion bond buying program. During the three-month period the BC Municipal Bond Index: Long Component, which consists of 22-year and longer maturity municipal securities, fell 8.58%, while the BC U.S. Treasury Index: Long Component, which tracks Treasuries with 10-year or longer maturities, dipped 7.07%.8
8. Source: © 2011 Morningstar. All Rights Reserved. The information contained herein: (1) is proprietary to Morningstar and/or its content providers; (2) may not be copied or distributed; and (3) is not warranted to be accurate, complete or timely. Neither Morningstar nor its content providers are responsible for any damages or losses arising from any use of this information.
9. Source: Thomson Reuters.
Annual Report | 7
Several factors contributed to municipal bond market weakness:
- The market seemed dissatisfied that the Fed indicated it would target bonds with maturities of 10 years or less, which contributed to a sell-off in bonds with maturities longer than 10 years.
- Some observers felt QE2 was unnecessary and might even ignite inflation, which contributed to weakness in shorter term bonds. The municipal bond market pulled back as yields generally rose. This was exacerbated as market concerns led to investor redemptions, forcing further sell-offs.
According to the Investment Company Institute, cash flows into munici- pal bond mutual funds during the reporting period first turned negative the week of November 10 and worsened in following weeks. - For most of calendar year 2010, market participants had expected the BAB program to be extended beyond 2010, and they began to anticipate a larger-than-normal supply of municipal bonds going into year-end.
This belief waned, however, as Republicans took over the majority of the House of Representatives and did not propose legislation that would continue the program. - Market participants feared municipalities would concentrate their borrowing needs in tax-free bonds during 2011 as they no longer had the option of using BABs. During the first three months of 2011, how- ever, tax-exempt new-issue supply in the municipal bond market was almost 44% less than in the first three months of 2010.9
- In December, Congress enacted an extension of tax cuts for all Americans, which likely further reduced the appeal of tax-exempt municipal bonds.
- Some observers raised concerns about the ability of municipal market borrowers to meet their debt obligations. High-profile and repetitive media coverage of such comments created panic among some investors.
However, counterarguments citing the historically low level of municipal defaults alleviated these fears somewhat.
Since February, reduced supply has helped drive bond prices higher, and the market turned positive. So far, year-to-date supply as of May 2011 is down a dramatic 51% compared with the same period for 2010.9
Although the municipal bond market experienced recent, short-term volatility, we maintained a long-term perspective. In our view, the rise in yields at times during the reporting period provided us opportunities to buy high-quality, essential use revenue and general obligation bonds at levels that may enhance the Fund’s income-earning potential.
8 | Annual Report
Investment Strategy
We use a consistent, disciplined strategy in an effort to maximize tax-exempt income for our shareholders by seeking to maintain exposure to higher coupon securities while balancing risk and return within the Fund’s range of allowable investments. We generally employ a buy-and-hold approach and invest in securities we believe should provide the most relative value in the market. As we invest during different interest rate environments, the Fund’s portfolio remains diversified with a broad range of securities. This broad diversification may help mitigate interest rate risk. We do not use leverage or exotic derivatives, nor do we use hedging techniques that could add volatility and contribute to underperformance in adverse markets. We generally stay fully invested to help maximize income distribution.
Manager’s Discussion
The combination of our value-oriented philosophy of investing primarily for income and a positive-sloping municipal yield curve favored longer term bonds during the reporting period. Consistent with our strategy, we sought to remain fully invested in bonds ranging from 20 to 30 years in maturity with good call features. We sought to take advantage of strong retail demand for highly rated essential service bonds and sold some AA-rated and AAA-rated securities that were purchased in a lower municipal bond interest rate environment. We also sold some of the Fund’s highly liquid prerefunded bonds at a premium as institutional investors provided liquidity for municipal bonds escrowed in government securities. We used the proceeds to purchase bonds we believed were trading at very attractive relative values in the current, higher interest rate environment
In line with our relative value investment strategy, and to further reduce volatility, we avoided derivative securities and other exotic investment vehicles designed to leverage the portfolio. During the period, the Fund had no exposure to inverse floaters or any other form of leverage. Also, as the alternative minimum tax (AMT) affects more individuals each year, we held no bonds subject to AMT to prevent a taxable situation for individuals subject to AMT.
We believe our conservative, buy-and-hold investment strategy can help us achieve high, current, tax-free income for shareholders.
Annual Report | 9
Thank you for your continued participation in Franklin New York Tax-Free Income Fund. We look forward to serving your future investment needs.
The foregoing information reflects our analysis, opinions and portfolio holdings as of May 31, 2011, the end of the reporting period. The way we implement our main investment strategies and the resulting portfolio holdings may change depending on factors such as market and economic conditions. These opinions may not be relied upon as investment advice or an offer for a particular security. The information is not a complete analysis of every aspect of any market, state, industry, security or the Fund. Statements of fact are from sources considered reliable, but the investment manager makes no representation or warranty as to their completeness or accuracy. Although historical performance is no guarantee of future results, these insights may help you understand our investment management philosophy.
10 | Annual Report
Performance Summary as of 5/31/11
Your dividend income will vary depending on dividends or interest paid by securities in the Fund’s portfolio, adjusted for operating expenses of each class. Capital gain distributions are net profits realized from the sale of portfolio securities. The performance table and graphs do not reflect any taxes that a shareholder would pay on Fund dividends, capital gain distributions, if any, or any realized gains on the sale of Fund shares. Total return reflects reinvestment of the Fund’s dividends and capital gain distributions, if any, and any unrealized gains or losses.
Annual Report | 11
Performance Summary (continued)
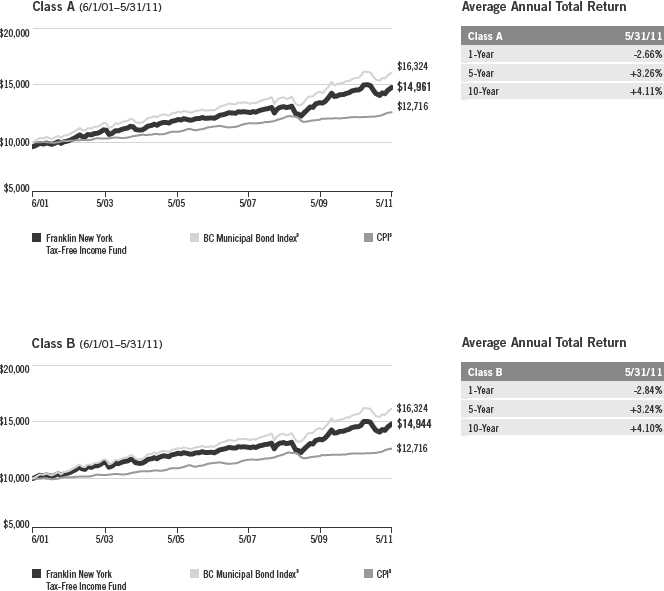
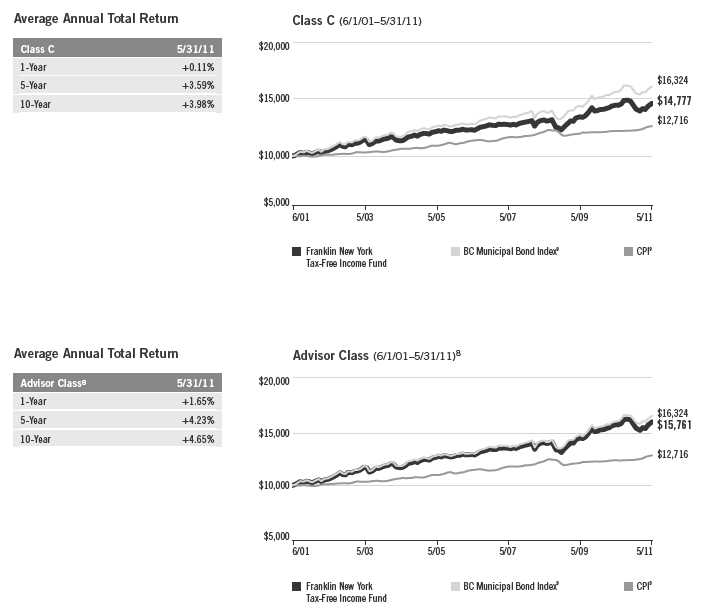
Performance
Cumulative total return excludes sales charges. Average annual total returns include maximum sales charges. Class A: 4.25% maximum initial sales charge; Class B: contingent deferred sales charge (CDSC) declining from 4% to 1% over six years, and eliminated thereafter; Class C: 1% CDSC in first year only; Advisor Class: no sales charges.
Performance data represent past performance, which does not guarantee future results. Investment return and principal value will fluctuate, and you may have a gain or loss when you sell your shares. Current performance may differ from figures shown. For most recent month-end performance, go to franklintempleton.com or call (800) 342-5236.
12 | Annual Report
Performance Summary (continued)
Total Return Index Comparison for a Hypothetical $10,000 Investment
Total return represents the change in value of an investment over the periods shown. It includes any current, applicable, maximum sales charge, Fund expenses, account fees and reinvested distributions. The unmanaged index includes reinvestment of any income or distributions. It differs from the Fund in composition and does not pay management fees or expenses. One cannot invest directly in an index.
Annual Report | 13
Performance Summary (continued)
14 | Annual Report
Performance Summary (continued)
Endnotes
Because municipal bonds are sensitive to interest rate movements, the Fund’s yield and share price will fluctuate with market conditions. Bond prices generally move in the opposite direction of interest rates. Thus, as prices of bonds adjust to a rise in interest rates, the Fund’s share price may decline. Since the Fund concentrates its investments in a single state, it is subject to greater risk of adverse economic and regulatory changes in that state than a geographically diversified fund. The manager applies various techniques and analyses in making investment decisions for the Fund, but there can be no guarantee that these decisions will produce the desired results. The Fund’s prospectus also includes a description of the main investment risks.
| |
Class B: Class C: | These shares have higher annual fees and expenses than Class A shares. Prior to 1/1/04, these shares were offered with an initial sales charge; thus actual total returns would have differed. These shares have higher annual fees and expenses than Class A shares. |
Advisor Class: | Shares are available to certain eligible investors as described in the prospectus. |
1. Cumulative total return represents the change in value of an investment over the periods indicated.
2. Average annual total return represents the average annual change in value of an investment over the periods indicated.
3. In accordance with SEC rules, we provide standardized average annual total return information through the latest calendar quarter.
4. Distribution rate is based on an annualization of the respective class’s May dividend and the maximum offering price (NAV for Classes B, C and Advisor) per share on 5/31/11.
5. Taxable equivalent distribution rate and yield assume the published rates as of 12/28/10 for the maximum combined effective federal and New York state and City personal income tax rate of 42.91%, based on the federal income tax rate of 35.00%.
6. The 30-day standardized yield for the 30 days ended 5/31/11 reflects an estimated yield to maturity (assuming all portfolio securities are held to maturity). It should be regarded as an estimate of the Fund’s rate of investment income, and it may not equal the Fund’s actual income distribution rate (which reflects the Fund’s past dividends paid to shareholders) or the income reported in the Fund’s financial statements.
7. Figures are as stated in the Fund’s prospectus current as of the date of this report. In periods of market volatility, assets may decline significantly, causing total annual Fund operating expenses to become higher than the figures shown.
8. Effective 10/1/01, the Fund began offering Advisor Class shares, which do not have sales charges or a Rule 12b-1 plan. Performance quotations for this class reflect the following methods of calculation: (a) For periods prior to 10/1/01, a restated figure is used based upon the Fund’s Class A performance, excluding the effect of Class A’s maximum initial sales charge, but reflecting the effect of the Class A Rule 12b-1 fees; and (b) for periods after 10/1/01, actual Advisor Class performance is used reflecting all charges and fees applicable to that class. Since 10/1/01 (commencement of sales), the cumulative and average annual total returns of Advisor Class shares were +53.44% and +4.53%.
9. Source: © 2011 Morningstar. The BC Municipal Bond Index is a market value-weighted index engineered for the long-term tax-exempt bond market. To be included in the index, bonds must be fixed rate, have at least one year to final maturity and be rated investment grade (Baa3/BBB-or higher) by at least two of the following agencies: Moody’s, Standard & Poor’s and Fitch. The Consumer Price Index (CPI), calculated by the U.S. Bureau of Labor Statistics, is a commonly used measure of the inflation rate.
Annual Report | 15
Your Fund’s Expenses
As a Fund shareholder, you can incur two types of costs:
- Transaction costs, including sales charges (loads) on Fund purchases; and
- Ongoing Fund costs, including management fees, distribution and service (12b-1) fees, and other Fund expenses. All mutual funds have ongoing costs, sometimes referred to as operating expenses.
The following table shows ongoing costs of investing in the Fund and can help you understand these costs and compare them with those of other mutual funds. The table assumes a $1,000 investment held for the six months indicated.
Actual Fund Expenses
The first line (Actual) for each share class listed in the table provides actual account values and expenses. The “Ending Account Value” is derived from the Fund’s actual return, which includes the effect of Fund expenses.
You can estimate the expenses you paid during the period by following these steps. Of course, your account value and expenses will differ from those in this illustration:
| 1. | Divide your account value by $1,000. |
| | If an account had an $8,600 value, then $8,600 ÷ $1,000 = 8.6. |
| 2. | Multiply the result by the number under the heading “Expenses Paid During Period.” |
| | If Expenses Paid During Period were $7.50, then 8.6 x $7.50 = $64.50. |
In this illustration, the estimated expenses paid this period are $64.50.
Hypothetical Example for Comparison with Other Funds
Information in the second line (Hypothetical) for each class in the table can help you compare ongoing costs of investing in the Fund with those of other mutual funds. This information may not be used to estimate the actual ending account balance or expenses you paid during the period. The hypothetical “Ending Account Value” is based on the actual expense ratio for each class and an assumed 5% annual rate of return before expenses, which does not represent the Fund’s actual return. The figure under the heading “Expenses Paid During Period” shows the hypothetical expenses your account would have incurred under this scenario. You can compare this figure with the 5% hypothetical examples that appear in shareholder reports of other funds.
16 | Annual Report
Your Fund’s Expenses (continued)
Please note that expenses shown in the table are meant to highlight ongoing costs and do not reflect any transaction costs, such as sales charges. Therefore, the second line for each class is useful in comparing ongoing costs only, and will not help you compare total costs of owning different funds. In addition, if transaction costs were included, your total costs would have been higher. Please refer to the Fund prospectus for additional information on operating expenses.
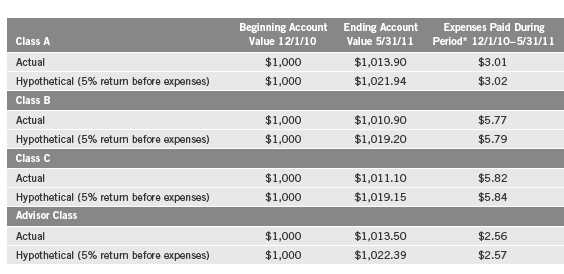
*Expenses are calculated using the most recent six-month expense ratio, annualized for each class (A: 0.60%; B: 1.15%; C: 1.16%; and Advisor: 0.51%), multiplied by the average account value over the period, multiplied by 182/365 to reflect the one-half year period.
Annual Report | 17
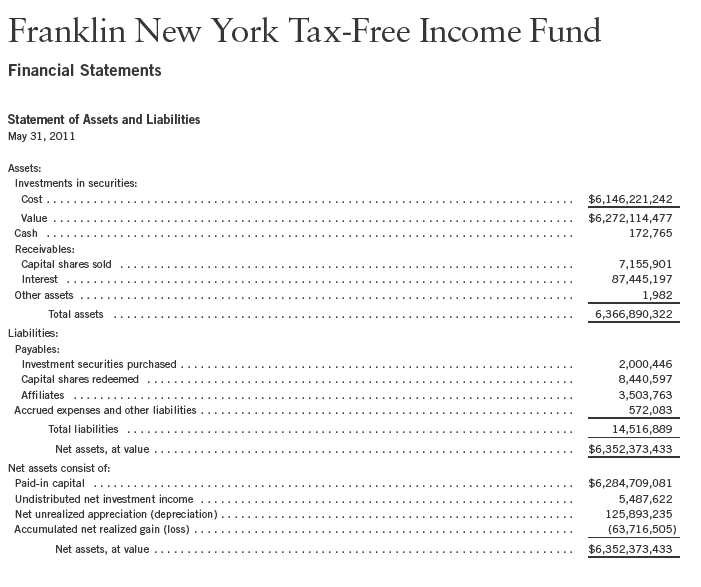
Franklin New York Tax-Free Income Fund
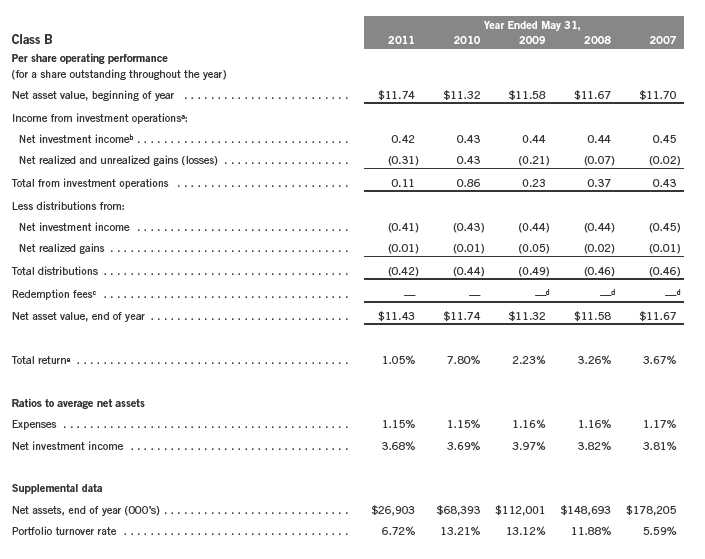
Financial Highlights
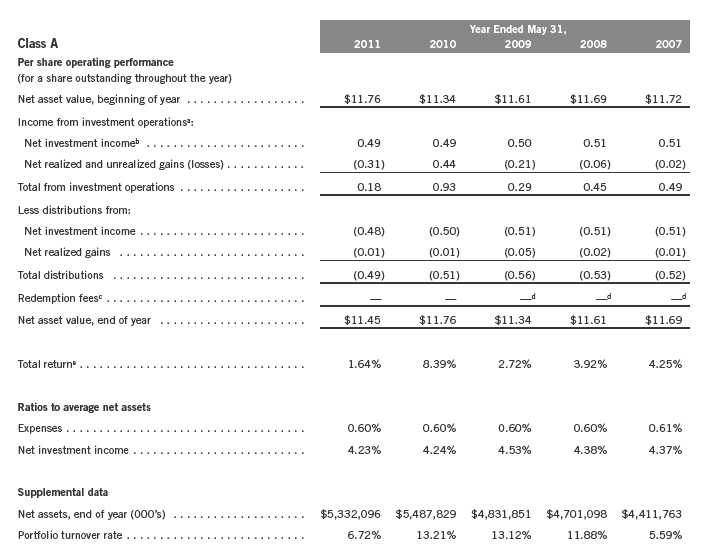
aThe amount shown for a share outstanding throughout the period may not correlate with the Statement of Operations for the period due to the timing of sales and repurchases of
the Fund shares in relation to income earned and/or fluctuating market value of the investments of the Fund.
bBased on average daily shares outstanding.
cEffective September 1, 2008, the redemption fee was eliminated.
dAmount rounds to less than $0.01 per share.
eTotal return does not reflect sales commissions or contingent deferred sales charges, if applicable.
18 | The accompanying notes are an integral part of these financial statements. | Annual Report
Franklin New York Tax-Free Income Fund
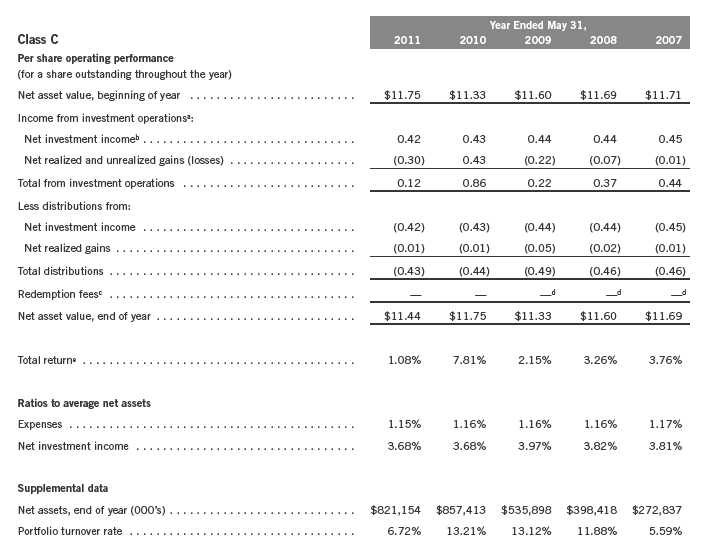
Financial Highlights (continued)
aThe amount shown for a share outstanding throughout the period may not correlate with the Statement of Operations for the period due to the timing of sales and repurchases of
the Fund shares in relation to income earned and/or fluctuating market value of the investments of the Fund.
bBased on average daily shares outstanding.
cEffective September 1, 2008, the redemption fee was eliminated.
dAmount rounds to less than $0.01 per share.
eTotal return does not reflect sales commissions or contingent deferred sales charges, if applicable.
Annual Report | The accompanying notes are an integral part of these financial statements. | 19
Franklin New York Tax-Free Income Fund
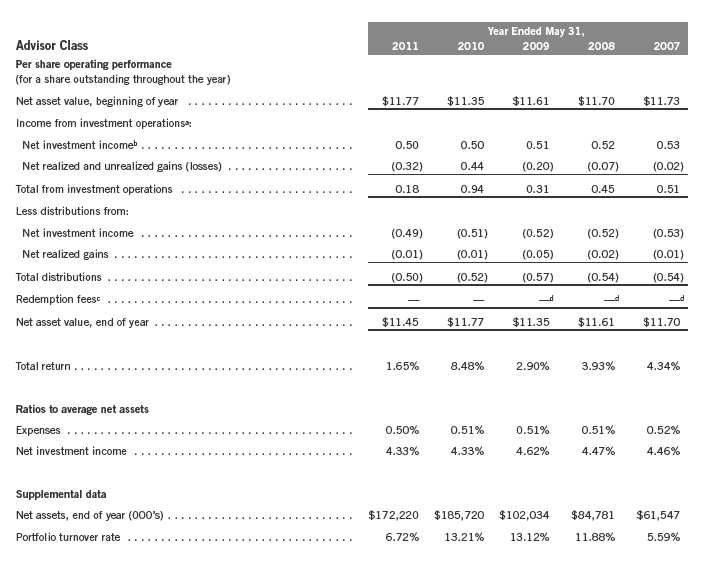
Financial Highlights (continued)
aThe amount shown for a share outstanding throughout the period may not correlate with the Statement of Operations for the period due to the timing of sales and repurchases of
the Fund shares in relation to income earned and/or fluctuating market value of the investments of the Fund.
bBased on average daily shares outstanding.
cEffective September 1, 2008, the redemption fee was eliminated.
dAmount rounds to less than $0.01 per share.
eTotal return does not reflect sales commissions or contingent deferred sales charges, if applicable.
20 | The accompanying notes are an integral part of these financial statements. | Annual Report
Franklin New York Tax-Free Income Fund
Financial Highlights (continued)
aThe amount shown for a share outstanding throughout the period may not correlate with the Statement of Operations for the period due to the timing of sales and repurchases of
the Fund shares in relation to income earned and/or fluctuating market value of the investments of the Fund.
bBased on average daily shares outstanding.
cEffective September 1, 2008, the redemption fee was eliminated.
dAmount rounds to less than $0.01 per share.
Annual Report | The accompanying notes are an integral part of these financial statements. | 21
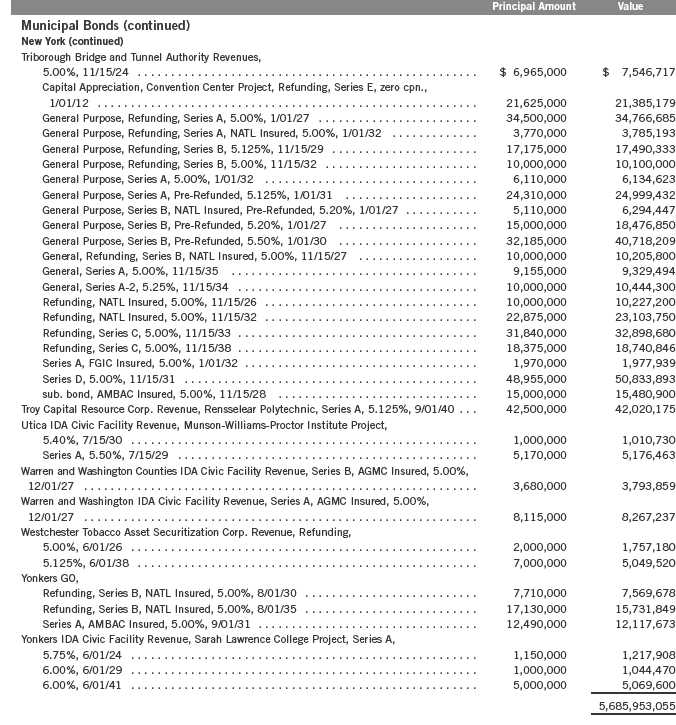
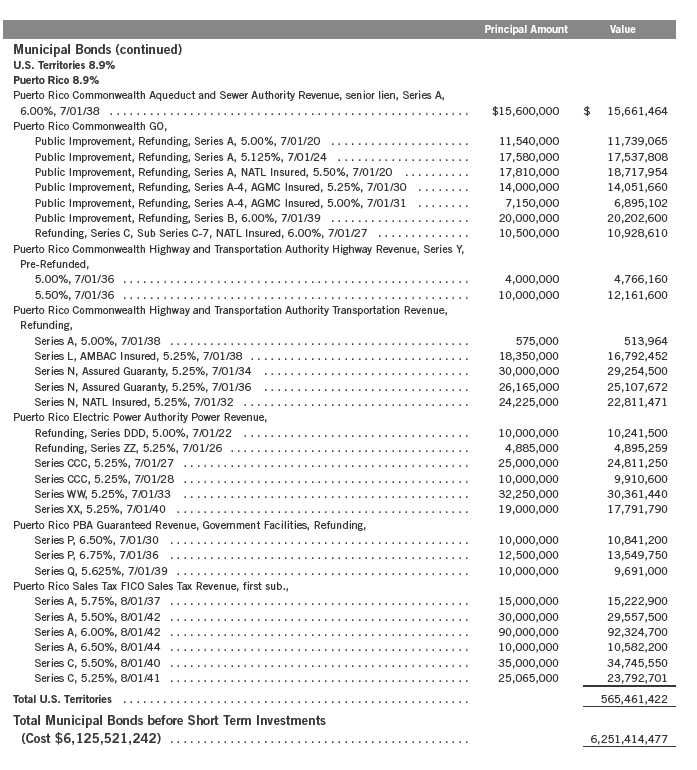
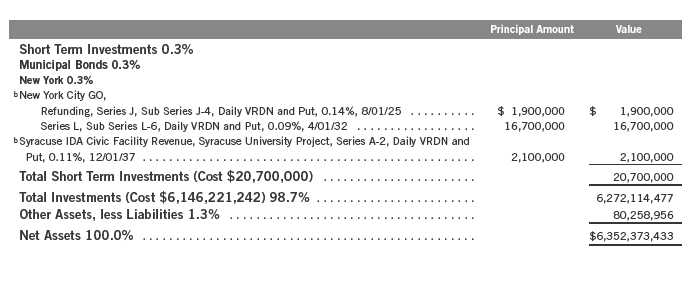
Franklin New York Tax-Free Income Fund
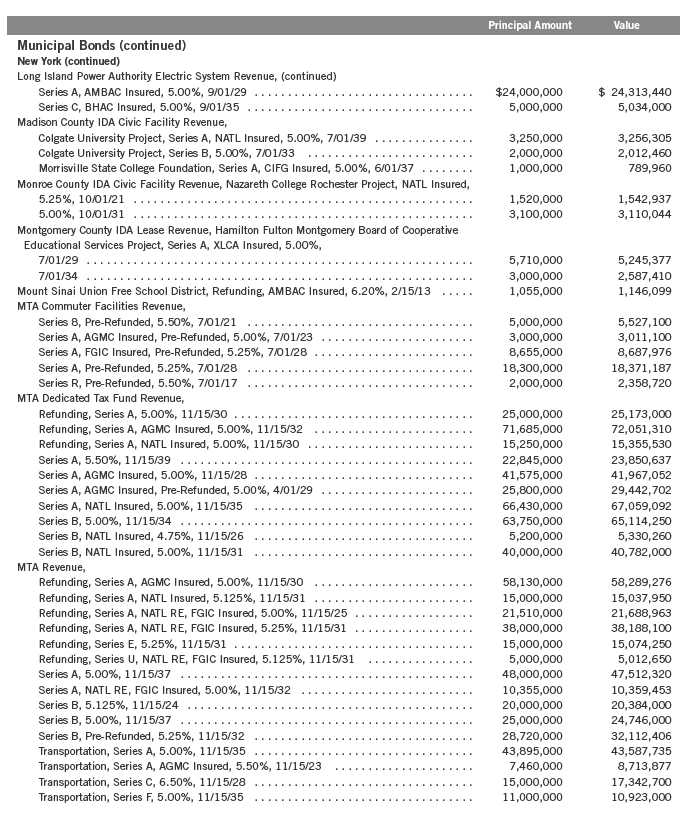
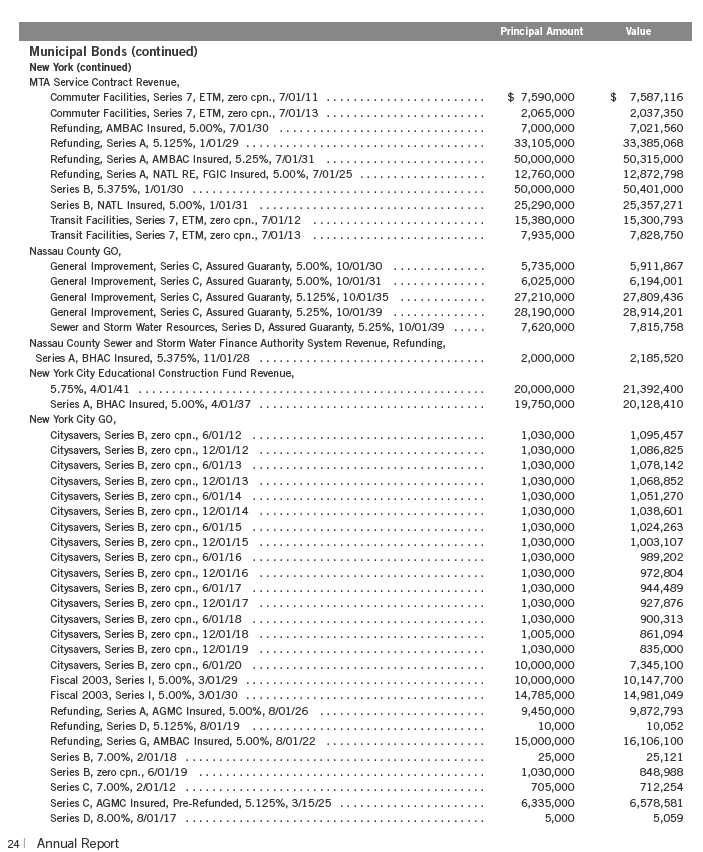
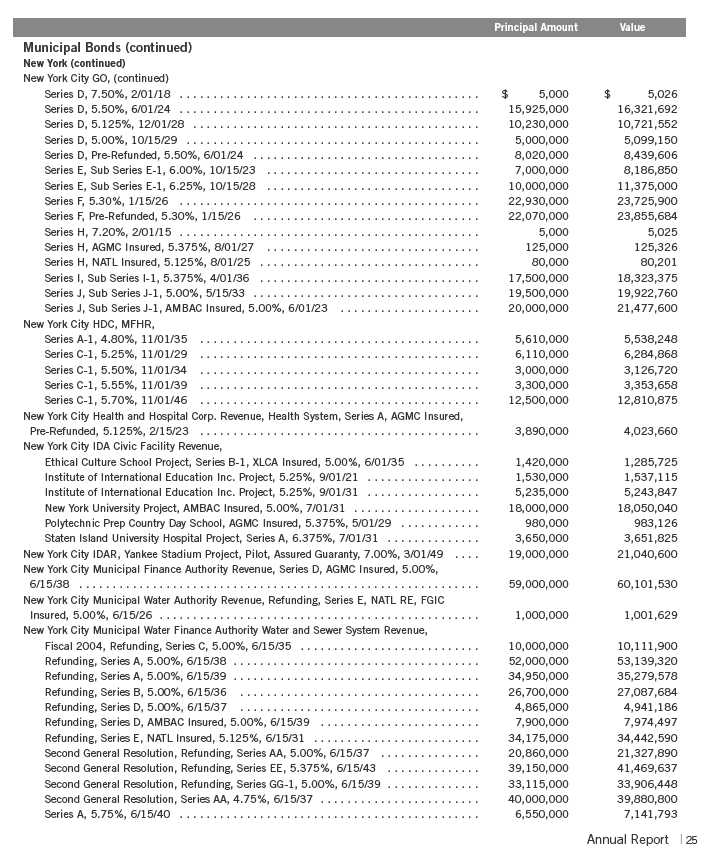
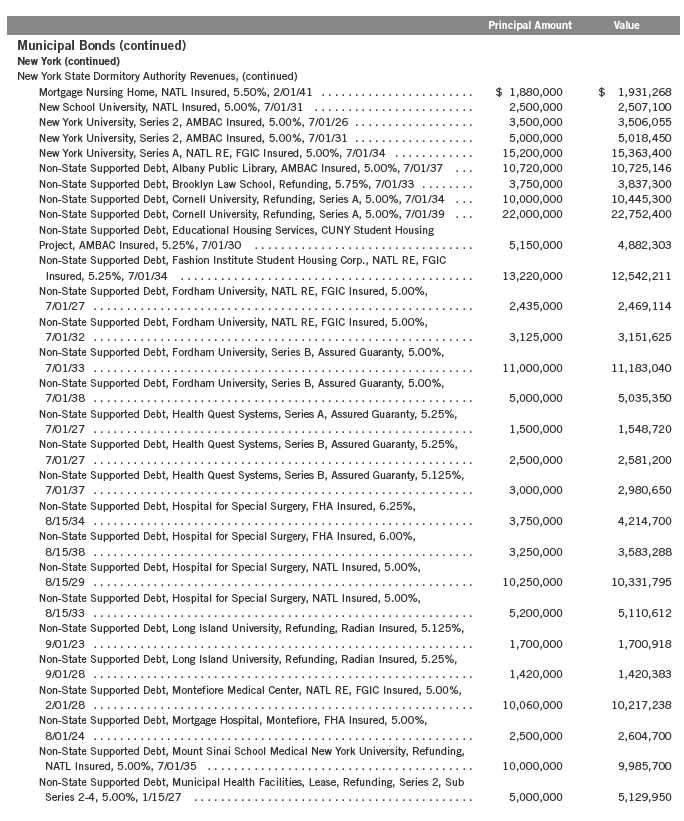
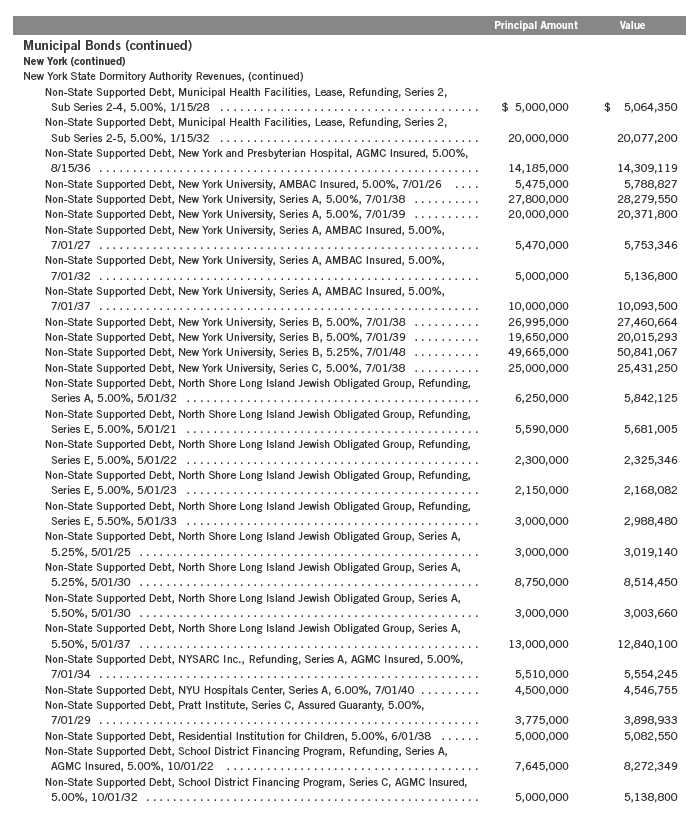
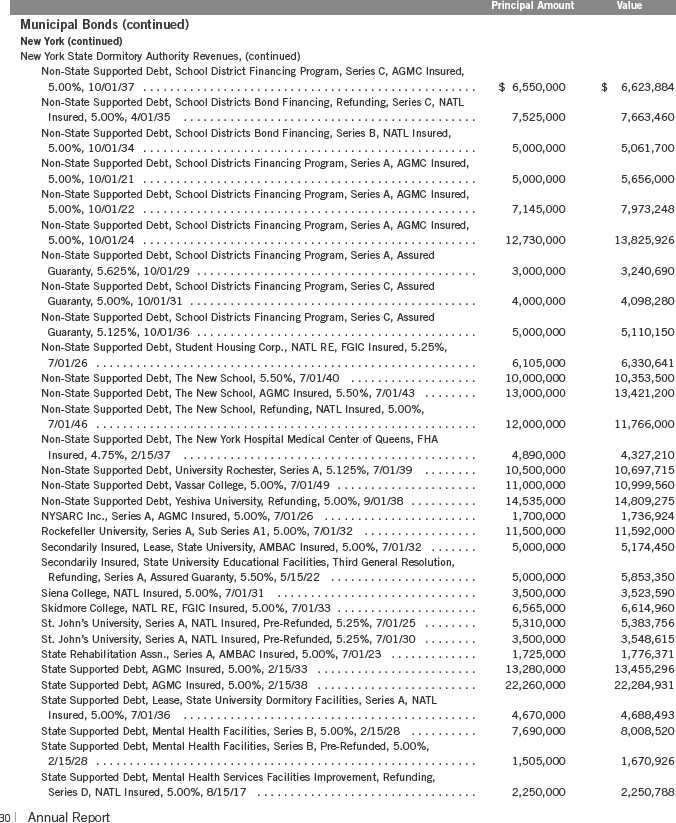
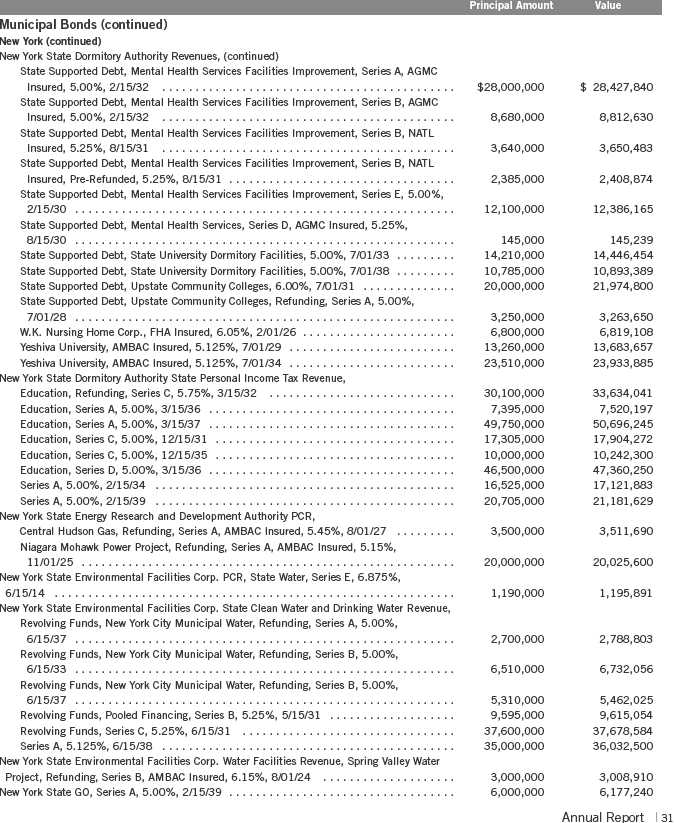
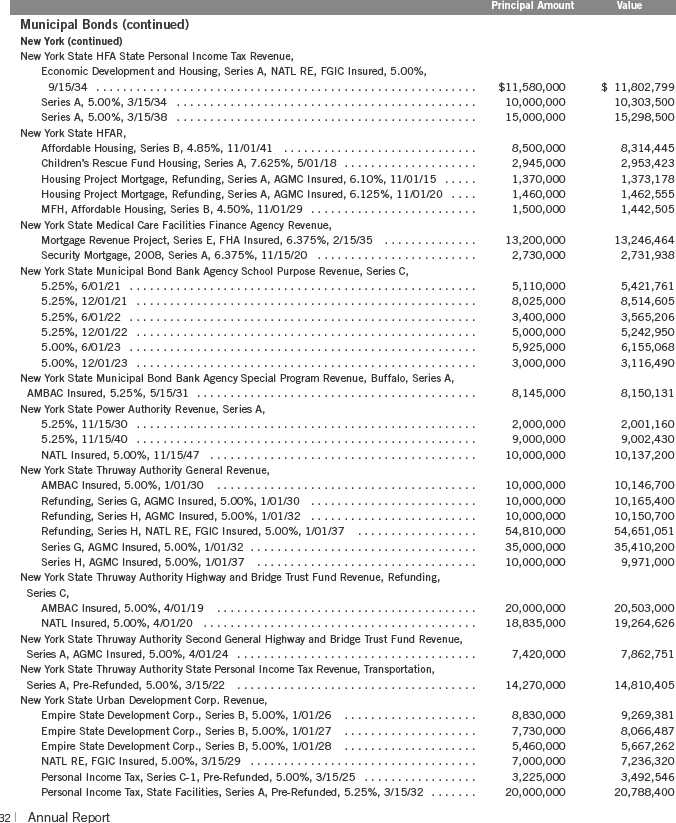
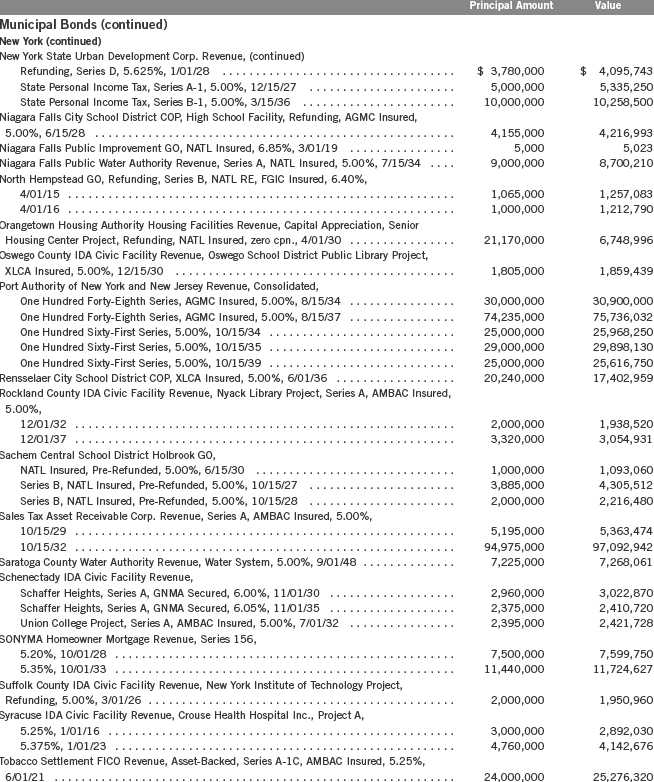
Statement of Investments, May 31, 2011
| | | | |
| | | Principal Amount | | Value |
| Municipal Bonds 98.4% | | | | |
| New York 89.5% | | | | |
| Albany Housing Authority Limited Obligation Revenue, Refunding, 6.25%, 10/01/12 | $ | 2,290,000 | $ | 2,295,061 |
| Albany IDA Civic Facility Revenue, | | | | |
| St. Peter’s Hospital Project, Series A, 5.25%, 11/15/27 | | 5,000,000 | | 4,606,250 |
| St. Peter’s Hospital Project, Series A, 5.25%, 11/15/32 | | 5,000,000 | | 4,418,900 |
| St. Peter’s Hospital Project, Series E, 5.50%, 11/15/27 | | 1,135,000 | | 1,075,004 |
| St. Peter’s Hospital Project, Series E, 5.25%, 11/15/32 | | 1,150,000 | | 1,016,347 |
| St. Rose Project, Series A, AMBAC Insured, Pre-Refunded, 5.375%, 7/01/31 | | 2,750,000 | | 2,788,363 |
| Albany Parking Authority Revenue, | | | | |
| Refunding, Series A, 5.625%, 7/15/20 | | 555,000 | | 564,213 |
| Refunding, Series A, 5.625%, 7/15/25 | | 415,000 | | 421,889 |
| Series A, Pre-Refunded, 5.625%, 7/15/20 | | 695,000 | | 706,141 |
| Series A, Pre-Refunded, 5.625%, 7/15/25 | | 585,000 | | 594,378 |
| Amherst Development Corp. Student Housing Facility Revenue, University of Buffalo | | | | |
| Foundation Facility, Student Housing Corp., Series A, AGMC Insured, 5.00%, | | | | |
| 10/01/40 | | 3,000,000 | | 2,954,400 |
| 10/01/45 | | 3,800,000 | | 3,708,382 |
| Amherst IDA Civic Facility Revenue, University of Buffalo Foundation Faculty, Student | | | | |
| Housing Corp., | | | | |
| Creekside Project, Series A, AMBAC Insured, 5.00%, 8/01/32 | | 2,785,000 | | 2,424,816 |
| Series A, AMBAC Insured, 5.125%, 8/01/20 | | 1,410,000 | | 1,422,084 |
| Series A, AMBAC Insured, 5.25%, 8/01/31 | | 5,055,000 | | 4,743,713 |
| Series B, AMBAC Insured, 5.25%, 8/01/31 | | 1,000,000 | | 938,420 |
| Battery Park City Authority Revenue, Refunding, Series A, 5.00%, | | | | |
| 11/01/24 | | 9,000,000 | | 9,590,670 |
| 11/01/25 | | 12,000,000 | | 12,714,840 |
| 11/01/26 | | 14,250,000 | | 15,040,590 |
| aBuffalo and Erie County Industrial Land Development Corp. Revenue, Buffalo State College | | | | |
| Foundation Housing Corp. Project, Series A, 5.375%, 10/01/41 | | 2,035,000 | | 2,018,272 |
| Clinton County COP, Correctional Facilities Project, 8.125%, 8/01/17 | | 3,550,000 | | 3,902,515 |
| Dutchess County IDA Civic Facility Revenue, Vassar College Project, Pre-Refunded, 5.35%, | | | | |
| 9/01/40 | | 16,000,000 | | 16,290,240 |
| Erie County GO, Sewer District, Series B, NATL Insured, 5.00%, 12/01/35 | | 2,000,000 | | 1,928,840 |
| Geneva IDA Civic Facilities Revenue, Colleges of the Seneca Project, AMBAC Insured, | | | | |
| 5.00%, 9/01/21 | | 2,835,000 | | 2,878,064 |
| 5.125%, 9/01/31 | | 5,045,000 | | 5,109,576 |
| Hempstead Town IDA Civic Facility Revenue, Adelphi University Civic Facility, 5.00%, | | | | |
| 10/01/30 | | 3,000,000 | | 3,034,680 |
| 10/01/35 | | 1,500,000 | | 1,479,120 |
| Hudson Yards Infrastructure Corp. Revenue, Series A, | | | | |
| 5.00%, 2/15/47 | | 40,000,000 | | 36,024,400 |
| AGMC Insured, 5.00%, 2/15/47 | | 15,000,000 | | 14,053,500 |
| Long Island Power Authority Electric System Revenue, | | | | |
| General, Refunding, Series A, 6.00%, 5/01/33 | | 42,000,000 | | 45,948,000 |
| General, Refunding, Series A, BHAC Insured, 5.50%, 5/01/33 | | 5,000,000 | | 5,305,600 |
| General, Refunding, Series B, 5.00%, 12/01/35 | | 5,000,000 | | 5,010,950 |
| General, Refunding, Series E, BHAC Insured, 5.00%, 12/01/22 | | 9,200,000 | | 9,799,104 |
| General, Series A, AMBAC Insured, 5.00%, 9/01/34 | | 20,670,000 | | 20,828,332 |
| General, Series C, 5.00%, 9/01/35 | | 16,000,000 | | 16,035,360 |
22 | Annual Report
Franklin New York Tax-Free Income Fund
Statement of Investments, May 31, 2011 (continued)
Annual Report | 23
Franklin New York Tax-Free Income Fund
Statement of Investments, May 31, 2011 (continued)
Franklin New York Tax-Free Income Fund
Statement of Investments, May 31, 2011 (continued)
Franklin New York Tax-Free Income Fund
Statement of Investments, May 31, 2011 (continued)
| | | | |
| | | Principal Amount | | Value |
| Municipal Bonds (continued) | | | | |
| New York (continued) | | | | |
| New York City Municipal Water Finance Authority Water and Sewer System Revenue, | | | | |
| (continued) | | | | |
| Series A, FGIC Insured, Pre-Refunded, 5.25%, 6/15/33 | $ | 7,000,000 | $ | 7,011,690 |
| Series B, 5.00%, 6/15/26 | | 22,835,000 | | 22,986,396 |
| Series B, Pre-Refunded, 5.00%, 6/15/26 | | 2,165,000 | | 2,168,399 |
| Series G, AGMC Insured, 5.00%, 6/15/34 | | 1,000,000 | | 1,000,320 |
| New York City Transitional Finance Authority Building Aid Revenue, | | | | |
| Fiscal 2007, Series S-1, NATL RE, FGIC Insured, 5.00%, 7/15/31 | | 8,200,000 | | 8,425,664 |
| Fiscal 2007, Series S-2, NATL RE, FGIC Insured, 5.00%, 1/15/37 | | 22,000,000 | | 22,234,740 |
| Fiscal 2008, Refunding, Series S-1, 5.00%, 1/15/34 | | 75,000,000 | | 76,519,500 |
| Fiscal 2008, Series S-1, 5.00%, 1/15/27 | | 10,000,000 | | 10,439,900 |
| Fiscal 2009, Series S-1, 5.75%, 7/15/38 | | 30,000,000 | | 31,829,100 |
| Fiscal 2009, Series S-2, 6.00%, 7/15/38 | | 50,000,000 | | 53,953,000 |
| Fiscal 2009, Series S-3, 5.25%, 1/15/39 | | 29,485,000 | | 30,245,713 |
| Fiscal 2009, Series S-4, 5.75%, 1/15/39 | | 30,000,000 | | 31,916,700 |
| Fiscal 2009, Series S-5, 5.25%, 1/15/39 | | 31,730,000 | | 32,548,634 |
| New York City Transitional Finance Authority Revenue, | | | | |
| Future Tax Secured, Refunding, Series B, 5.00%, 5/01/30 | | 7,285,000 | | 7,368,778 |
| Future Tax Secured, Refunding, Series B, AMBAC Insured, 5.00%, 5/01/30 | | 2,900,000 | | 2,933,350 |
| Future Tax Secured, Series A, 5.25%, 8/01/31 | | 28,205,000 | | 28,815,074 |
| Future Tax Secured, Series A, 5.00%, 5/01/34 | | 20,000,000 | | 20,739,600 |
| Future Tax Secured, Series A, 5.00%, 5/01/38 | | 20,000,000 | | 20,418,200 |
| Future Tax Secured, Series A, Pre-Refunded, 5.25%, 8/01/31 | | 2,400,000 | | 2,652,960 |
| Future Tax Secured, Series B, AMBAC Insured, Pre-Refunded, 5.00%, 5/01/30 | | 100,000 | | 102,975 |
| Future Tax Secured, Series B, NATL Insured, Pre-Refunded, 5.00%, 8/01/32 | | 10,000 | | 11,000 |
| Future Tax Secured, Series B, Pre-Refunded, 5.00%, 5/01/30 | | 235,000 | | 241,991 |
| Future Tax Secured, Series C, NATL Insured, 5.00%, 5/01/29 | | 5,000 | | 5,013 |
| Future Tax Secured, Series D, 5.00%, 2/01/27 | | 62,025,000 | | 63,228,905 |
| Future Tax Secured, Series D, NATL Insured, 5.00%, 2/01/22 | | 2,000,000 | | 2,094,820 |
| Future Tax Secured, Series E, 5.00%, 2/01/25 | | 3,245,000 | | 3,330,668 |
| Future Tax Secured, Series E, 5.00%, 2/01/27 | | 10,000,000 | | 10,194,100 |
| Future Tax Secured, Series E, 5.00%, 2/01/33 | | 8,895,000 | | 8,983,327 |
| Future Tax Secured, Series E, Pre-Refunded, 5.00%, 2/01/25 | | 1,755,000 | | 1,892,171 |
| Refunding, Series B, NATL Insured, 5.00%, 8/01/32 | | 14,990,000 | | 15,209,604 |
| New York City Trust for Cultural Resources Revenue, | | | | |
| Museum of Modern Art 2001, Series D, AMBAC Insured, 5.125%, 7/01/31 | | 23,000,000 | | 23,184,920 |
| Wildlife Conservation Society, NATL RE, FGIC Insured, 5.00%, 2/01/34 | | 10,500,000 | | 10,566,885 |
| New York Convention Center Development Corp. Revenue, Hotel Unit Fee Secured, AMBAC | | | | |
| Insured, 5.00%, | | | | |
| 11/15/35 | | 33,130,000 | | 33,129,006 |
| 11/15/44 | | 41,000,000 | | 39,705,220 |
| New York GO, Refunding, Series C, 5.00%, | | | | |
| 8/01/25 | | 7,575,000 | | 8,179,712 |
| 8/01/26 | | 2,190,000 | | 2,336,380 |
| New York IDA Parking Facility Revenue, Royal Charter Presbyterian, AGMC Insured, 5.25%, | | | | |
| 12/15/32 | | 1,525,000 | | 1,554,997 |
| New York Liberty Development Corp. Liberty Revenue, Second Priority, Bank of America Tower | | | | |
| at One Bryant Park Project, Class 2, Refunding, 5.625%, 7/15/47 | | 17,500,000 | | 17,587,675 |
26 | Annual Report
Franklin New York Tax-Free Income Fund
Statement of Investments, May 31, 2011 (continued)
| | | | |
| | | Principal Amount | | Value |
| Municipal Bonds (continued) | | | | |
| New York (continued) | | | | |
| New York Liberty Development Corp. Revenue, | | | | |
| 5.50%, 10/01/37 | $ | 27,000,000 | $ | 27,682,020 |
| Goldman Sachs Headquarters, 5.25%, 10/01/35 | | 86,360,000 | | 86,353,091 |
| New York State Dormitory Authority Lease Revenue, | | | | |
| Delaware Chenango Madison Otsego Board of Cooperative Education Services, XLCA | | | | |
| Insured, 5.00%, 8/15/27 | | 10,000,000 | | 10,382,300 |
| Master Boces Program, Series A, AGMC Insured, Pre-Refunded, 5.25%, 8/15/21 | | 1,740,000 | | 1,757,417 |
| Mental Health Services Facilities, Refunding, Series A, 5.00%, 8/15/22 | | 5,740,000 | | 6,364,340 |
| Refunding, Series A, NATL RE, FGIC Insured, 5.00%, 7/01/33 | | 12,650,000 | | 12,716,413 |
| State University Dormitory Facilities, FGIC Insured, Pre-Refunded, 5.50%, 7/01/27 | | 2,000,000 | | 2,008,180 |
| State University Dormitory Facilities, FGIC Insured, Pre-Refunded, 5.10%, 7/01/31 | | 7,700,000 | | 7,729,106 |
| State University Dormitory Facilities, Pre-Refunded, 5.00%, 7/01/32 | | 5,500,000 | | 5,782,205 |
| State University Dormitory Facilities, Series A, 5.00%, 7/01/39 | | 7,250,000 | | 7,316,845 |
| New York State Dormitory Authority Personal Income Tax Revenue, Series A, 5.00%, | | | | |
| 3/15/38 | | 5,000,000 | | 5,119,400 |
| New York State Dormitory Authority Revenue, | | | | |
| City University System, Consolidated Fourth General Resolution, Series A, Pre-Refunded, | | | | |
| 5.25%, 7/01/31 | | 12,000,000 | | 12,046,680 |
| FGIC Insured, Pre-Refunded, 5.125%, 5/15/31 | | 22,000,000 | | 23,245,200 |
| Mental Health Services Facilities Improvement, Series B, 5.00%, 2/15/33 | | 35,000,000 | | 35,858,200 |
| Mental Health Services Facilities Improvement, Series B, NATL Insured, Pre-Refunded, | | | | |
| 5.25%, 8/15/31 | | 3,975,000 | | 4,014,790 |
| Mortgage, St. Barnabas Hospital, Series A, FHA Insured, 5.125%, 2/01/22 | | 4,000,000 | | 4,150,640 |
| Mortgage, St. Barnabas Hospital, Series A, FHA Insured, 5.00%, 2/01/31 | | 5,500,000 | | 5,540,370 |
| North Shore Long Island Jewish Obligated Group, Pre-Refunded, 5.50%, 5/01/33 | | 2,500,000 | | 2,748,550 |
| School Districts Financing Program, Series A, NATL Insured, 5.00%, 4/01/31 | | 9,500,000 | | 9,580,750 |
| School Districts Financing Program, Series D, NATL Insured, 5.25%, 10/01/23 | | 1,750,000 | | 1,811,705 |
| School Districts Financing Program, Series D, NATL Insured, 5.00%, 10/01/30 | | 1,750,000 | | 1,780,258 |
| Series 1, NATL Insured, 5.00%, 7/01/24 | | 2,000,000 | | 2,046,660 |
| Teachers College, NATL Insured, 5.00%, 7/01/22 | | 2,885,000 | | 2,937,363 |
| Teachers College, NATL Insured, 5.00%, 7/01/32 | | 6,000,000 | | 6,035,400 |
| Upstate Community Colleges, Series A, 5.00%, 7/01/27 | | 3,720,000 | | 3,753,443 |
| New York State Dormitory Authority Revenues, | | | | |
| 853 Schools Program, Issue 2, Series E, AMBAC Insured, 5.75%, 7/01/19 | | 1,340,000 | | 1,351,738 |
| Buena Vida Nursing Home, Series A, 5.25%, 7/01/28 | | 4,730,000 | | 4,746,981 |
| Fashion Institute of Technology Student Housing Corp., FGIC Insured, Pre-Refunded, | | | | |
| 5.00%, 7/01/29 | | 9,700,000 | | 10,967,790 |
| Fashion Institute of Technology Student Housing Corp., FGIC Insured, Pre-Refunded, | | | | |
| 5.125%, 7/01/34 | | 15,000,000 | | 17,017,500 |
| Fordham University, Refunding, NATL Insured, 5.00%, 7/01/28 | | 490,000 | | 490,074 |
| Good Samaritan Hospital Medical Center, Series A, NATL Insured, 5.50%, 7/01/24 | | 7,000,000 | | 7,007,140 |
| Insured Mortgage, Montefiore Hospital, FGIC Insured, 5.00%, 8/01/33 | | 11,000,000 | | 11,179,410 |
| Maimonides Medical Center, NATL Insured, 5.00%, 8/01/24 | | 6,180,000 | | 6,439,807 |
| Mental Health Services Facilities Improvement, Series A, AMBAC Insured, 5.00%, | | | | |
| 2/15/30 | | 5,000,000 | | 5,118,250 |
| Mental Health Services Facilities Improvement, Series A, NATL Insured, Pre-Refunded, | | | | |
| 5.25%, 8/15/26 | | 2,570,000 | | 2,595,726 |
| Montefiore Hospital, NATL RE, FGIC Insured, 5.00%, 8/01/29 | | 5,995,000 | | 6,111,003 |
| Mortgage Nursing Home, NATL Insured, 5.40%, 2/01/31 | | 315,000 | | 324,041 |
| |
| | | | | Annual Report | 27 |
Franklin New York Tax-Free Income Fund
Statement of Investments, May 31, 2011 (continued)
28 | Annual Report
Franklin New York Tax-Free Income Fund
Statement of Investments, May 31, 2011 (continued)
Annual Report | 29
Franklin New York Tax-Free Income Fund
Statement of Investments, May 31, 2011 (continued)
Franklin New York Tax-Free Income Fund
Statement of Investments, May 31, 2011 (continued)
Franklin New York Tax-Free Income Fund
Statement of Investments, May 31, 2011 (continued)
Franklin New York Tax-Free Income Fund
Statement of Investments, May 31, 2011 (continued)
Annual Report | 33
Franklin New York Tax-Free Income Fund
Statement of Investments, May 31, 2011 (continued)
34 | Annual Report
Franklin New York Tax-Free Income Fund
Statement of Investments, May 31, 2011 (continued)
Annual Report | 35
Franklin New York Tax-Free Income Fund
Statement of Investments, May 31, 2011 (continued)
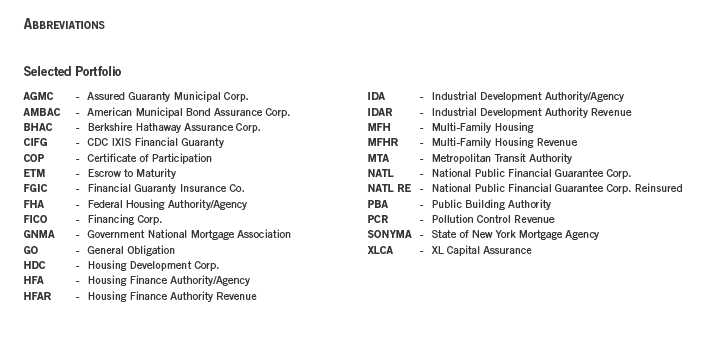
See Abbreviations on page 50.
aSecurity purchased on a when-issued basis. See Note 1(b).
bVariable rate demand notes (VRDNs) are tax-exempt obligations which contain a floating or variable interest rate adjustment formula and an unconditional right of demand to receive payment of the principal balance plus accrued interest at specified dates. The coupon rate shown represents the rate at period end.
36 | The accompanying notes are an integral part of these financial statements. | Annual Report
Annual Report | The accompanying notes are an integral part of these financial statements. | 37
38 | The accompanying notes are an integral part of these financial statements. | Annual Report
Annual Report | The accompanying notes are an integral part of these financial statements. | 39
40 | The accompanying notes are an integral part of these financial statements. | Annual Report
Franklin New York Tax-Free Income Fund
Notes to Financial Statements
1. ORGANIZATION AND SIGNIFICANT ACCOUNTING POLICIES
Franklin New York Tax-Free Income Fund (Trust) is registered under the Investment Company Act of 1940, as amended, (1940 Act) as an open-end investment company, consisting of one fund, the Franklin New York Tax-Free Income Fund (Fund). The Fund offers four classes of shares: Class A, Class B, Class C, and Advisor Class. Each class of shares differs by its initial sales load, contingent deferred sales charges, distribution fees, voting rights on matters affecting a single class and its exchange privilege.
The following summarizes the Fund’s significant accounting policies.
a. Financial Instrument Valuation
The Fund’s investments in securities and other financial instruments are carried at fair value daily. Fair value is the price that would be received to sell an asset or paid to transfer a liability in an orderly transaction between market participants on the measurement date. Under procedures approved by the Fund’s Board of Trustees, the Fund may utilize independent pricing services, quotations from securities and financial instrument dealers, and other market sources to determine fair value.
Debt securities generally trade in the over-the-counter market rather than on a securities exchange. The Fund’s pricing services use multiple valuation techniques to determine fair value. In instances where sufficient market activity exists, the pricing services may utilize a market-based approach through which quotes from market makers are used to determine fair value. In instances where sufficient market activity may not exist or is limited, the pricing services also utilize proprietary valuation models which may consider market characteristics such as benchmark yield curves, option-adjusted spreads, credit spreads, estimated default rates, coupon rates, anticipated timing of principal repayments, underlying collateral, and other unique security features in order to estimate the relevant cash flows, which are then discounted to calculate the fair value.
The Fund has procedures to determine the fair value of securities and other financial instruments for which market prices are not readily available or which may not be reliably priced. Under these procedures, the Fund primarily employs a market-based approach which may use related or comparable assets or liabilities, recent transactions, market multiples, book values, and other relevant information for the investment to determine the fair value of the investment. The Fund may also use an income-based valuation approach in which the anticipated future cash flows of the investment are discounted to calculate fair value. Discounts may also be applied due to the nature or duration of any restrictions on the disposition of the investments. Due to the inherent uncertainty of valuations of such investments, the fair values may differ significantly from the values that would have been used had an active market existed.
Annual Report | 41
Franklin New York Tax-Free Income Fund
Notes to Financial Statements (continued)
| 1. | ORGANIZATION AND SIGNIFICANT ACCOUNTING POLICIES (continued) |
| b. | Securities Purchased on a When-Issued Basis |
The Fund purchases securities on a when-issued basis, with payment and delivery scheduled for a future date. These transactions are subject to market fluctuations and are subject to the risk that the value at delivery may be more or less than the trade date purchase price. Although the Fund will generally purchase these securities with the intention of holding the securities, it may sell the securities before the settlement date. Sufficient assets have been segregated for these securities.
c. Income Taxes
It is the Fund’s policy to qualify as a regulated investment company under the Internal Revenue Code. The Fund intends to distribute to shareholders substantially all of its income and net realized gains to relieve it from federal income and excise taxes. As a result, no provision for U.S. federal income taxes is required. The Fund files U.S. income tax returns as well as tax returns in certain other jurisdictions. The Fund records a provision for taxes in its financial statements including penalties and interest, if any, for a tax position taken on a tax return (or expected to be taken) when it fails to meet the more likely than not (a greater than 50% probability) threshold and based on the technical merits, the tax position may not be sustained upon examination by the tax authorities. As of May 31, 2011, and for all open tax years, the Fund has determined that no provision for income tax is required in the Fund’s financial statements. Open tax years are those that remain subject to examination and are based on each tax jurisdiction statute of limitation.
d. Security Transactions, Investment Income, Expenses and Distributions
Security transactions are accounted for on trade date. Realized gains and losses on security transactions are determined on a specific identification basis. Interest income and estimated expenses are accrued daily. Amortization of premium and accretion of discount on debt securities are included in interest income. Distributions to shareholders are recorded on the ex-dividend date and are determined according to income tax regulations (tax basis). Distributable earnings determined on a tax basis may differ from earnings recorded in accordance with accounting principles generally accepted in the United States of America. These differences may be permanent or temporary. Permanent differences are reclassified among capital accounts to reflect their tax character. These reclassifications have no impact on net assets or the results of operations. Temporary differences are not reclassified, as they may reverse in subsequent periods.
Realized and unrealized gains and losses and net investment income, not including class specific expenses, are allocated daily to each class of shares based upon the relative proportion of net assets of each class. Differences in per share distributions, by class, are generally due to differences in class specific expenses.
42 | Annual Report
Franklin New York Tax-Free Income Fund
Notes to Financial Statements (continued)
1. ORGANIZATION AND SIGNIFICANT ACCOUNTING POLICIES (continued) e. Insurance
The scheduled payments of interest and principal for each insured municipal security in the Fund are insured by either a new issue insurance policy or a secondary insurance policy. Some municipal securities in the Fund are secured by collateral guaranteed by an agency of the U.S. government. Insurance companies typically insure municipal bonds that tend to be of very high quality, with the majority of underlying municipal bonds rated A or better. However, there is a risk that in the event of an issuer default, the insurer may not be able to fulfill its obligations under the terms of the policy.
Depending on the type of coverage, premiums for insurance are either added to the cost basis of the security or paid by a third party.
f. Accounting Estimates
The preparation of financial statements in accordance with accounting principles generally accepted in the United States of America requires management to make estimates and assumptions that affect the reported amounts of assets and liabilities at the date of the financial statements and the amounts of income and expenses during the reporting period. Actual results could differ from those estimates.
g. Guarantees and Indemnifications
Under the Trust’s organizational documents, its officers and trustees are indemnified by the Trust against certain liabilities arising out of the performance of their duties to the Trust. Additionally, in the normal course of business, the Trust, on behalf of the Fund, enters into contracts with service providers that contain general indemnification clauses. The Trust’s maximum exposure under these arrangements is unknown as this would involve future claims that may be made against the Trust that have not yet occurred. Currently, the Trust expects the risk of loss to be remote.
2. SHARES OF BENEFICIAL INTEREST
At May 31, 2011, there were an unlimited number of shares authorized (without par value).
Transactions in the Fund’s shares were as follows:
| | | | | | | | | | | | | |
| | | | | Year Ended May 31, | | | | | | | |
| | 2011 | | 2010 | | | | |
| | Shares | | | Amount | | Shares | | | Amount | | | | |
| Class A Shares: | | | | | | | | | | | | | |
| Shares sold | 52,716,169 | | $ | 609,005,393 | | 79,293,962 | | $ | 916,671,249 | | | | |
| Shares issued on reorganization | | | | | | | | | | | | | |
| (Note 7) | 31,412,038 | | | 376,944,556 | | — | | | — | | | | |
| Shares issued in reinvestment of | | | | | | | | | | | | | |
| distributions | 14,089,167 | | | 161,939,502 | | 12,940,501 | | | 149,158,574 | | | | |
| Shares redeemed | (99,037,971 | ) | | (1,120,680,715 | ) | (51,745,424 | ) | | (598,563,971 | ) | | | |
| Net increase (decrease) | (820,597 | ) | $ | 27,208,736 | | 40,489,039 | | $ | 467,265,852 | | | | |
| |
| | | | | | | | | | | | Annual Report | | | 43 |
Franklin New York Tax-Free Income Fund
Notes to Financial Statements (continued)
2. SHARES OF BENEFICIAL INTEREST (continued)

3. TRANSACTIONS WITH AFFILIATES
Franklin Resources, Inc. is the holding company for various subsidiaries that together are referred to as Franklin Templeton Investments. Certain officers and trustees of the Trust are also officers and/or directors of the following subsidiaries:

44 | Annual Report
Franklin New York Tax-Free Income Fund
Notes to Financial Statements (continued)
| 3. | TRANSACTIONS WITH AFFILIATES (continued) |
| a. | Management Fees |
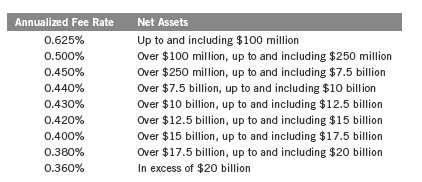
The Fund pays an investment management fee to Advisers based on the month-end net assets of the Fund as follows:
b. Administrative Fees
Under an agreement with Advisers, FT Services provides administrative services to the Fund. The fee is paid by Advisers based on average daily net assets, and is not an additional expense of the Fund.
c. Distribution Fees
The Fund’s Board of Trustees has adopted distribution plans for each share class, with the exception of Advisor Class shares, pursuant to Rule 12b-1 under the 1940 Act. Under the Fund’s Class A reimbursement distribution plan, the Fund reimburses Distributors for costs incurred in connection with the servicing, sale and distribution of the Fund’s shares up to the maximum annual plan rate. Under the Class A reimbursement distribution plan, costs exceeding the maximum for the current plan year cannot be reimbursed in subsequent periods.
In addition, under the Fund’s Class B and C compensation distribution plans, the Fund pays Distributors for costs incurred in connection with the servicing, sale and distribution of the Fund’s shares up to the maximum annual plan rate for each class.
The maximum annual plan rates, based on the average daily net assets, for each class, are as follows:

Annual Report | 45
Franklin New York Tax-Free Income Fund
Notes to Financial Statements (continued)
| 3. | TRANSACTIONS WITH AFFILIATES (continued) |
| d. | Sales Charges/Underwriting Agreements |
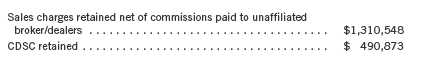
Front-end sales charges and contingent deferred sales charges (CDSC) do not represent expenses of the Fund. These charges are deducted from the proceeds of sales of Fund shares prior to investment or from redemption proceeds prior to remittance, as applicable. Distributors has advised the Fund of the following commission transactions related to the sales and redemptions of the Fund’s shares for the year:
e. Transfer Agent Fees
For the year ended May 31, 2011, the Fund paid transfer agent fees of $2,494,116, of which $1,390,537 was retained by Investor Services.
4. INCOME TAXES
For tax purposes, capital losses may be carried over to offset future capital gains, if any. At May 31, 2011, the capital loss carryforwards were as follows:
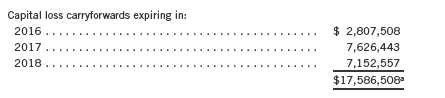
aIncludes $17,586,508 from the reorganized Franklin New York Insured Tax-Free Income Fund, which may be carried over to offset future capital gains, subject to certain limitations.
During the year ended May 31, 2011, the Fund utilized $1,303,727 of capital loss carryforwards.
Under the Regulated Investment Company Modernization Act of 2010, the Fund will be permitted to carry forward capital losses incurred in taxable years beginning after December 22, 2010 for an unlimited period. Post-enactment capital loss carryforwards will retain their character as either short-term or long-term capital losses rather than being considered short-term as under previous law. Any post-enactment capital losses generated will be required to be utilized prior to the losses incurred in pre-enactment tax years.
For tax purposes, realized capital losses occurring subsequent to October 31 may be deferred and treated as occurring on the first day of the following fiscal year. At May 31, 2011, the Fund deferred realized capital losses of $43,725,619.
46 | Annual Report
Franklin New York Tax-Free Income Fund
Notes to Financial Statements (continued)
4. INCOME TAXES (continued)
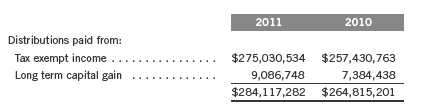
The tax character of distributions paid during the years ended May 31, 2011 and 2010, was as follows:
At May 31, 2011, the cost of investments, net unrealized appreciation (depreciation), undistributed tax exempt and ordinary income and undistributed long term capital gains for income tax purposes were as follows:
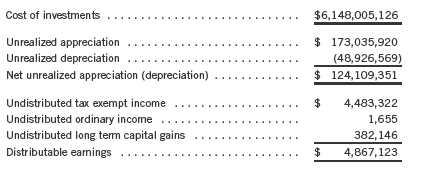
Net investment income differs for financial statement and tax purposes primarily due to differing treatments of bond discounts and non-deductible expenses.
Net realized gains (losses) differ for financial statement and tax purposes primarily due to differing treatments of wash sales and bond discounts.
5. INVESTMENT TRANSACTIONS
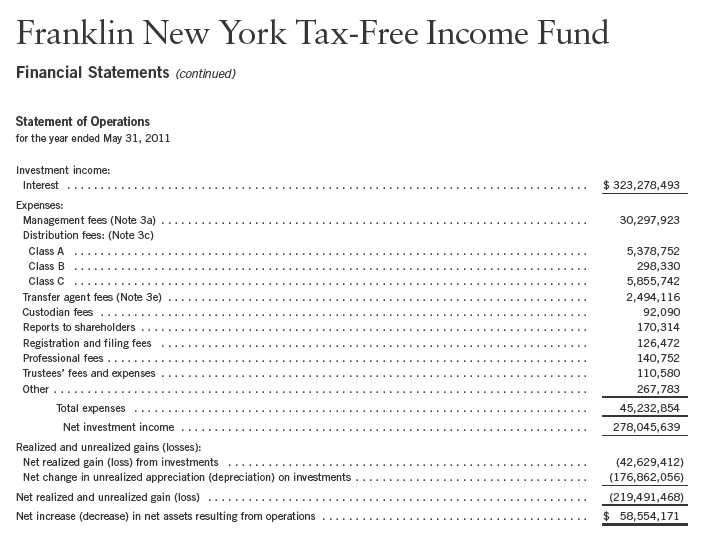
Purchases and sales of investments (excluding short term securities) for the year ended May 31, 2011, aggregated $444,164,988 and $954,824,486, respectively.
6. CONCENTRATION OF RISK
The Fund invests a large percentage of its total assets in obligations of issuers within New York and U.S. territories. Such concentration may subject the Fund to risks associated with industrial or regional matters, and economic, political or legal developments occurring within New York and U.S. territories. In addition, investments in these securities are sensitive to interest rate changes and credit risk of the issuer and may subject the funds to increased market volatility. The market for these investments may be limited, which may make them difficult to buy or sell.
Annual Report | 47
Franklin New York Tax-Free Income Fund
Notes to Financial Statements (continued)
7. REORGANIZATION
On August 30, 2010, the Fund, pursuant to a plan of reorganization approved on April 13, 2010 by the Board of Trustees of the Franklin New York Insured Tax-Free Income Fund (Acquired Fund), acquired 100% of the Acquired Fund’s net assets, primarily made up of investment securities, which included $19,376,404 of unrealized appreciation (depreciation), through a tax-free exchange of 37,415,225 shares of the Fund (valued at $448,863,247). Immediately after the completion of the reorganization, the combined net assets of the Fund were $7,324,800,800.
The primary purpose for the reorganization was to combine the Acquired Fund with a larger, relatively more diversified fund that has the same investment goal and generally similar investment strategies and risks. The estimated cost of the reorganization was $97,080 of which the Fund and the Acquired Fund each paid 25% and Advisers paid 50%. The allocated portion of the Fund’s reorganization expenses are included with other expenses in the Statement of Operations.
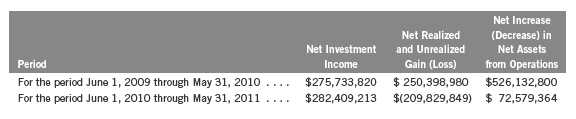
Assuming the reorganization had been completed on June 1, 2009, the Fund’s pro forma results of operations would have been as follows:
Subsequent to the reorganization, the Fund has been managed as a single entity. Accordingly, it is impracticable to identify the amounts of investment income and net investment income attributable to the Acquired Fund’s assets after the completion of the reorganization.
8. CREDIT FACILITY
The Fund, together with other U.S. registered and foreign investment funds (collectively, Borrowers), managed by Franklin Templeton Investments, are borrowers in a joint syndicated senior unsecured credit facility totaling $750 million (Global Credit Facility) which matures on January 20, 2012. This Global Credit Facility provides a source of funds to the Borrowers for temporary and emergency purposes, including the ability to meet future unanticipated or unusually large redemption requests.
Under the terms of the Global Credit Facility, the Fund shall, in addition to interest charged on any borrowings made by the Fund and other costs incurred by the Fund, pay its share of fees and expenses incurred in connection with the implementation and maintenance of the Global Credit Facility, based upon its relative share of the aggregate net assets of all of the Borrowers, including an annual commitment fee of 0.08% based upon the unused portion of the Global Credit Facility, which is reflected in other expenses on the Statement of Operations. During the year ended May 31, 2011, the Fund did not use the Global Credit Facility.
48 | Annual Report
Franklin New York Tax-Free Income Fund
Notes to Financial Statements (continued)
9. FAIR VALUE MEASUREMENTS
The Fund follows a fair value hierarchy that distinguishes between market data obtained from independent sources (observable inputs) and the Fund’s own market assumptions (unobservable inputs). These inputs are used in determining the value of the Fund’s investments and are summarized in the following fair value hierarchy:
- Level 1 – quoted prices in active markets for identical securities
- Level 2 – other significant observable inputs (including quoted prices for similar securities, interest rates, prepayment speed, credit risk, etc.)
- Level 3 – significant unobservable inputs (including the Fund’s own assumptions in determining the fair value of investments)
The inputs or methodology used for valuing securities are not an indication of the risk associated with investing in those securities.
For movements between the levels within the fair value hierarchy, the Fund has adopted a policy of recognizing the transfers as of the date of the underlying event which caused the movement.
At May 31, 2011, all of the Fund’s investments in securities carried at fair value were in Level 2 inputs.
10. NEW ACCOUNTING PRONOUNCEMENTS
In May 2011, the Financial Accounting Standards Board (FASB) issued Accounting Standards Update (ASU) No. 2011-04, Fair Value Measurement (Topic 820): Amendments to Achieve Common Fair Value Measurement and Disclosure Requirements in U.S. GAAP and International Financial Reporting Standards (IFRS). The amendments in the ASU will improve the comparability of fair value measurements presented and disclosed in financial statements prepared in accordance with U.S. GAAP and IFRS and include new guidance for certain fair value measurement principles and disclosure requirements. The ASU is effective for interim and annual periods beginning after December 15, 2011. The Fund is currently evaluating the impact, if any, of applying this provision.
11. SUBSEQUENT EVENTS
The Fund has evaluated subsequent events through the issuance of the financial statements and determined that no events have occurred that require disclosure.
Annual Report | 49
Franklin New York Tax-Free Income Fund
Notes to Financial Statements (continued)
50 | Annual Report
Franklin New York Tax-Free Income Fund
Report of Independent Registered Public Accounting Firm
To the Board of Trustees and Shareholders of Franklin New York Tax-Free Income Fund
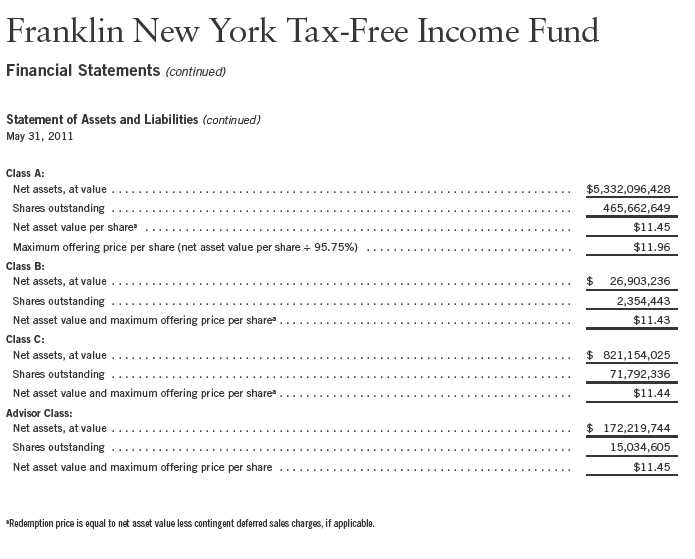
In our opinion, the accompanying statement of assets and liabilities, including the statement of investments, and the related statements of operations and of changes in net assets and the financial highlights present fairly, in all material respects, the financial position of Franklin New York Tax-Free Income Fund (the “Fund”) at May 31, 2011, the results of its operations for the year then ended, the changes in its net assets for each of the two years in the period then ended and the financial highlights for each of the five years in the period then ended, in conformity with accounting principles generally accepted in the United States of America. These financial statements and financial highlights (hereafter referred to as “financial statements”) are the responsibility of the Fund’s management. Our responsibility is to express an opinion on these financial statements based on our audits. We conducted our audits of these financial statements in accordance with the standards of the Public Company Accounting Oversight Board (United States). Those standards require that we plan and perform the audit to obtain reasonable assurance about whether the financial statements are free of material misstatement. An audit includes examining, on a test basis, evidence supporting the amounts and disclosures in the financial statements, assessing the accounting principles used and significant estimates made by management, and evaluating the overall financial statement presentation. We believe that our audits, which included confirmation of securities at May 31, 2011 by correspondence with the custodian and brokers, provides a reasonable basis for our opinion.
PricewaterhouseCoopers LLP
San Francisco, California
July 18, 2011
Annual Report | 51
Franklin New York Tax-Free Income Fund
Tax Designation (unaudited)
Under Section 852(b)(5)(A) of the Internal Revenue Code (Code), the Fund designates 100% of the distributions paid from net investment income as exempt-interest dividends for the fiscal year ended May 31, 2011. A portion of the Fund’s exempt-interest dividends may be subject to the federal alternative minimum tax. In January 2012, shareholders will be notified of amounts for use in preparing their 2011 income tax returns.
Under Section 852(b)(3)(C) of the Code, the Fund designates the maximum amount allowable but no less than $9,086,748 as a long term capital gain dividend for the fiscal year ended May 31, 2011.
52 | Annual Report
Franklin New York Tax-Free Income Fund
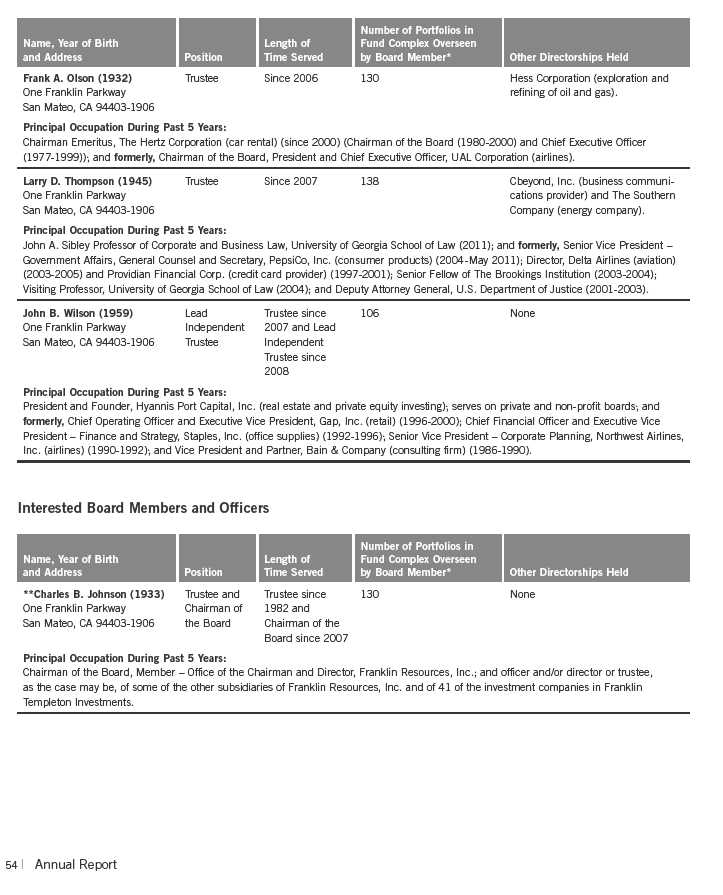
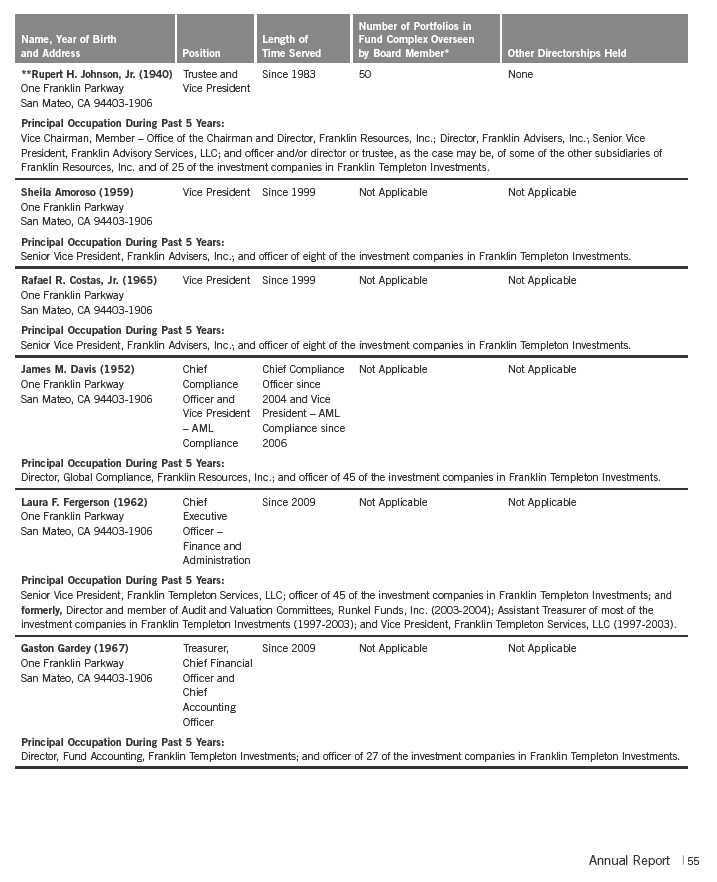
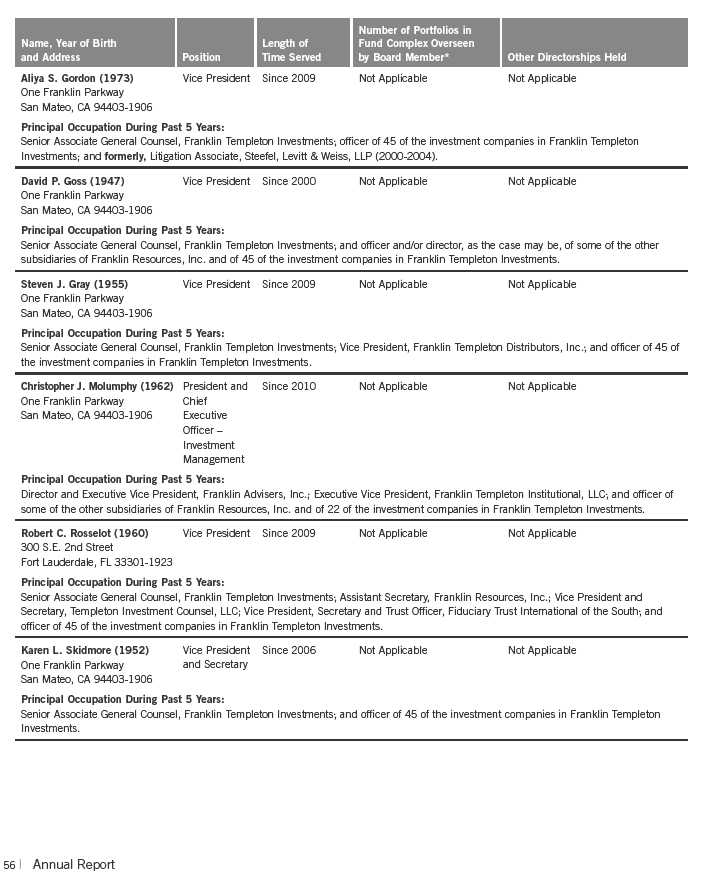
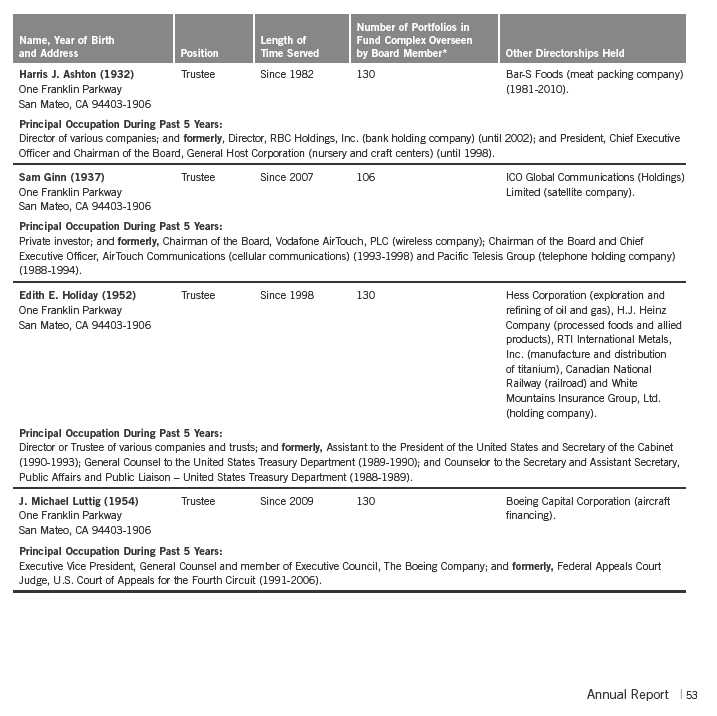
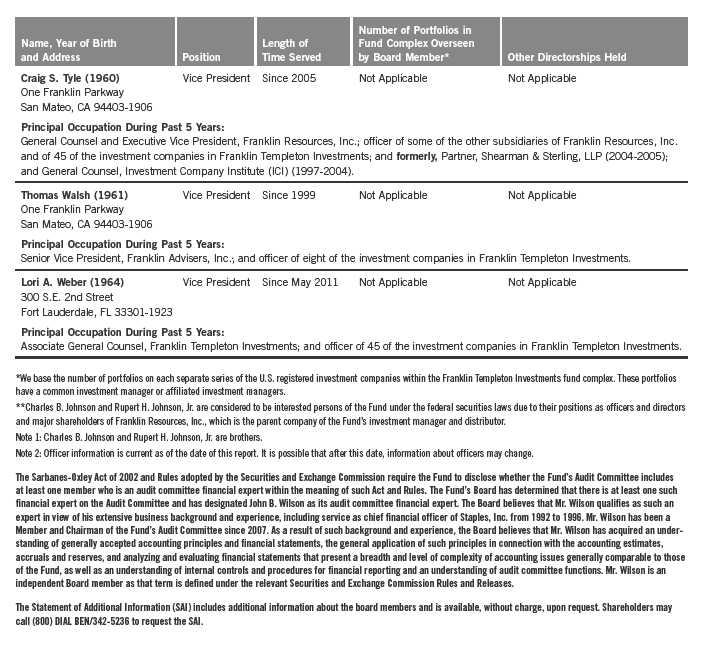
Board Members and Officers
The name, year of birth and address of the officers and board members, as well as their affiliations, positions held with the Trust, principal occupations during the past five years and number of portfolios overseen in the Franklin Templeton Investments fund complex are shown below. Generally, each board member serves until that person’s successor is elected and qualified.
Independent Board Members
Annual Report | 57
Franklin New York Tax-Free Income Fund
Shareholder Information
Board Review of Investment Management Agreement
At a meeting held March 1, 2011, the Board of Trustees (Board), including a majority of non-interested or independent Trustees, approved renewal of the investment management agreement for the Fund. In reaching this decision, the Board took into account information furnished throughout the year at regular Board meetings, as well as information prepared specifically in connection with the annual renewal review process. Information furnished and discussed throughout the year included investment expenses, performance reports and related financial information for the Fund, as well as periodic reports on shareholder services, legal, compliance, pricing, and other services provided by the Investment Manager (Manager) and its affiliates. Information furnished specifically in connection with the renewal process included a report for the Fund prepared by Lipper, Inc. (Lipper), an independent organization, as well as additional material, including a Fund profitability analysis prepared by management. The Lipper report compared the Fund’s investment performance and expenses with those of other mutual funds deemed comparable to the Fund as selected by Lipper. The Fund profitability analysis discussed the profitability to Franklin Templeton Investments from its overall U.S. fund operations, as well as on an individual fund-by-fund basis. Additional material accompanying such profitability analysis included information on a fund-by-fund basis listing portfolio managers and other accounts they manage, as well as information on management fees charged by the Manager and its affiliates to U.S. mutual funds and other accounts, including management’s explanation of differences where relevant. Such material also included a memorandum prepared by management describing project initiatives and capital investments relating to the services provided to the Fund by the Franklin Templeton Investments organization, as well as a memorandum relating to economies of scale and a comparative analysis concerning transfer agent fees charged the Fund.
In considering such materials, the independent Trustees received assistance and advice from and met separately with independent counsel. In approving continuance of the investment management agreement for the Fund, the Board, including a majority of independent Trustees, determined that the existing management fee structure was fair and reasonable and that continuance of the investment management agreement was in the best interests of the Fund and its shareholders. While attention was given to all information furnished, the following discusses some primary factors relevant to the Board’s decision.
NATURE, EXTENT AND QUALITY OF SERVICES. The Board was satisfied with the nature and quality of the overall services provided by the Manager and its affiliates to the Fund and its shareholders. In addition to investment performance and expenses discussed later, the Board’s opinion was based, in part, upon periodic reports furnished it showing that the investment policies and restrictions for the Fund were consistently complied with as well as other reports periodically furnished the Board covering matters such as the compliance of portfolio managers and other management personnel with the code of ethics adopted throughout the Franklin Templeton fund complex, the adherence to fair value pricing procedures established by the Board, and the accuracy of net asset value calculations. The Board also noted the extent of benefits provided Fund shareholders from being part of the Franklin Templeton family of funds, including the right to exchange
58 | Annual Report
Franklin New York Tax-Free Income Fund
Shareholder Information (continued)
Board Review of Investment Management Agreement (continued)
investments between the same class of funds without a sales charge, the ability to reinvest Fund dividends into other funds and the right to combine holdings in other funds to obtain a reduced sales charge. Favorable consideration was given to management’s continuous efforts and expenditures in establishing back-up systems and recovery procedures to function in the event of a natural disaster, it being noted that such systems and procedures had functioned smoothly during the Florida hurricanes and blackouts experienced in previous years. Consideration was also given to the experience of the Fund’s portfolio management team, the number of accounts managed and general method of compensation. In this latter respect, the Board noted that a primary factor in management’s determination of a portfolio manager’s bonus compensation was the relative investment performance of the funds he or she managed and that a portion of such bonus was required to be invested in a predesignated list of funds within such person’s fund management area so as to be aligned with the interests of shareholders. The Board also took into account the quality of transfer agent and shareholder services provided Fund shareholders by an affiliate of the Manager and the continuous enhancements to the Franklin Templeton website. Particular attention was given to management’s conservative approach and diligent risk management procedures, including continuous monitoring of counterparty credit risk and attention given to derivatives and other complex instruments. The Board also took into account, among other things, management’s efforts in establishing a global credit facility for the benefit of the Fund and other accounts managed by Franklin Templeton Investments to provide a source of cash for temporary and emergency purposes or to meet unusual redemption requests as well as the strong financial position of the Manager’s parent company and its commitment to the mutual fund business as evidenced by its subsidization of money market funds.
INVESTMENT PERFORMANCE. The Board placed significant emphasis on the investment performance of the Fund in view of its importance to shareholders. While consideration was given to performance reports and discussions with portfolio managers at Board meetings during the year, particular attention in assessing such performance was given to the Lipper report furnished for the agreement renewal. The Lipper report prepared for the Fund showed the investment performance of its Class A shares during the year ended December 31, 2010, as well as the previous 10 years ended that date in comparison to a performance universe consisting of all retail and institutional New York municipal debt funds as selected by Lipper. The Lipper report showed the Fund’s income return for 2010 to be in the second-highest quintile of its Lipper performance universe, and on an annualized basis to be in the second-highest quintile of such universe for each of the previous three-and five-year periods, and in the highest or best performing quintile of such universe for the previous 10-year period. The Lipper report showed the Fund’s total return for 2010 to be in the lowest quintile of its performance universe, but its total return for each of the previous three-, five- and 10-year periods on an annualized basis to be in either the highest or second-highest quintile of such universe. Management explained that the one-year relative total return performance reflected the fact that the average maturity of investments in the portfolio of the Fund was generally longer than those of its performance universe peers. The Board expressed its satisfaction with the Fund’s comparative performance as shown in the Lipper report, noting management’s explanation and the fact that the primary investment objective of the Fund is to obtain a high level of tax-exempt income.
Annual Report | 59
Franklin New York Tax-Free Income Fund
Shareholder Information (continued)
Board Review of Investment Management Agreement (continued)
COMPARATIVE EXPENSES. Consideration was given to a comparative analysis of the management fees and total expense ratio of the Fund compared with those of a group of other funds selected by Lipper as its appropriate Lipper expense group. Lipper expense data is based upon information taken from each fund’s most recent annual report, which reflects historical asset levels that may be quite different from those currently existing, particularly in a period of market volatility. While recognizing such inherent limitation and the fact that expense ratios generally increase as assets decline and decrease as assets grow, the Board believed the independent analysis conducted by Lipper to be an appropriate measure of comparative expenses. In reviewing comparative costs, Lipper provides information on the Fund’s management fee in comparison with the contractual investment management fee that would have been charged by other funds within its Lipper expense group assuming they were similar in size to the Fund, as well as the actual total expenses of the Fund in comparison with those of its Lipper expense group. The Lipper contractual investment management fee analysis includes administrative charges as being part of a management fee, and total expenses, for comparative consistency, are shown by Lipper for Fund Class A shares. The Lipper report showed the contractual investment management fee rate for the Fund to be in the second least expensive quintile of its Lipper expense group, and its actual total expense ratio to be in the least expensive quintile of such expense group. The Board was satisfied with the expenses of the Fund in comparison to its Lipper expense group as shown in the Lipper report.
MANAGEMENT PROFITABILITY. The Board also considered the level of profits realized by the Manager and its affiliates in connection with the operation of the Fund. In this respect, the Board reviewed the Fund profitability analysis that addresses the overall profitability of Franklin Templeton’s U.S. fund business, as well as its profits in providing management and other services to each of the individual funds during the 12-month period ended September 30, 2010, being the most recent fiscal year-end for Franklin Resources, Inc., the Manager’s parent. In reviewing the analysis, attention was given to the methodology followed in allocating costs to the Fund, it being recognized that allocation methodologies are inherently subjective and various allocation methodologies may each be reasonable while producing different results. In this respect, the Board noted that, while being continuously refined and reflecting changes in the Manager’s own cost accounting, the allocation methodology was consistent with that followed in profitability report presentations for the Fund made in prior years and that the Fund’s independent registered public accounting firm had been engaged by the Manager to review the reasonableness of the allocation methodologies solely for use by the Fund’s Board in reference to the profitability analysis. In reviewing and discussing such analysis, management discussed with the Board its belief that costs incurred in establishing the infrastructure necessary for the type of mutual fund operations conducted by the Manager and its affiliates may not be fully reflected in the expenses allocated to the Fund in determining its profitability, as well as the fact that the level of profits, to a certain extent, reflected operational cost savings and efficiencies initiated by management. The Board also took into account management’s expenditures in improving shareholder services provided the Fund, as well as the need to meet additional regulatory and compliance requirements resulting from the Sarbanes-Oxley
60 | Annual Report
Franklin New York Tax-Free Income Fund
Shareholder Information (continued)
Board Review of Investment Management Agreement (continued)
Act and recent SEC and other regulatory requirements. In addition, the Board considered a third-party study comparing the profitability of the Manager’s parent on an overall basis to other publicly held managers broken down to show profitability from management operations exclusive of distribution expenses, as well as profitability including distribution expenses. The Board also considered the extent to which the Manager and its affiliates might derive ancillary benefits from fund operations, including revenues generated from transfer agent services. Based upon its consideration of all these factors, the Board determined that the level of profits realized by the Manager and its affiliates from providing services to the Fund was not excessive in view of the nature, quality and extent of services provided.
ECONOMIES OF SCALE. The Board also considered whether economies of scale are realized by the Manager as the Fund grows larger and the extent to which this is reflected in the level of management fees charged. While recognizing that any precise determination is inherently subjective, the Board noted that based upon the Fund profitability analysis, it appears that as some funds get larger, at some point economies of scale do result in the Manager realizing a larger profit margin on management services provided such a fund. The Board also noted that economies of scale are shared with a fund and its shareholders through management fee breakpoints so that as a fund grows in size, its effective management fee rate declines. The fee structure under the Fund’s investment management agreement provides an initial fee of 0.625% on the first $100 million of assets; 0.50% on the next $150 million of assets; 0.45% on the next $7.25 billion of net assets; 0.44% on the next $2.5 billion of net assets; 0.43% on the next $2.5 billion of net assets; 0.42% on the next $2.5 billion of net assets; and thereafter declines by 0.02% for each subsequent $2.5 billion of net assets until it reaches a final breakpoint of 0.36% for assets in excess of $20 billion. The Fund’s net assets were approximately $6.7 billion at December 31, 2010, and the Board believes that to the extent any economies of scale may be realized by the Manager and its affiliates, the schedule of fees under the investment management agreement provides a sharing of benefits with the Fund and its shareholders.
Proxy Voting Policies and Procedures
The Fund’s investment manager has established Proxy Voting Policies and Procedures (Policies) that the Fund uses to determine how to vote proxies relating to portfolio securities. Shareholders may view the Fund’s complete Policies online at franklintempleton.com. Alternatively, shareholders may request copies of the Policies free of charge by calling the Proxy Group collect at (954) 527-7678 or by sending a written request to: Franklin Templeton Companies, LLC, 300 S.E. 2nd Street, Fort Lauderdale, FL 33301, Attention: Proxy Group. Copies of the Fund’s proxy voting records are also made available online at franklintempleton.com and posted on the U.S. Securities and Exchange Commission’s website at sec.gov and reflect the most recent 12-month period ended June 30.
Annual Report | 61
Franklin New York Tax-Free Income Fund
Shareholder Information (continued)
Quarterly Statement of Investments
The Fund files a complete statement of investments with the U.S. Securities and Exchange Commission for the first and third quarters for each fiscal year on Form N-Q. Shareholders may view the filed Form N-Q by visiting the Commission’s website at sec.gov. The filed form may also be viewed and copied at the Commission’s Public Reference Room in Washington, DC. Information regarding the operations of the Public Reference Room may be obtained by calling (800) SEC-0330.
Householding of Reports and Prospectuses
You will receive the Fund’s financial reports every six months as well as an annual updated summary prospectus (prospectus available upon request). To reduce Fund expenses, we try to identify related shareholders in a household and send only one copy of the financial reports and summary prospectus. This process, called “householding,” will continue indefinitely unless you instruct us otherwise. If you prefer not to have these documents householded, please call us at (800) 632-2301. At any time you may view current prospectuses/summary prospectuses and financial reports on our website. If you choose, you may receive these documents through electronic delivery.
62 | Annual Report
This page intentionally left blank.
This page intentionally left blank.
Item 2. Code of Ethics.
(a) The Registrant has adopted a code of ethics that applies to its principal executive officers and principal financial and accounting officer.
(c) N/A
(d) N/A
(f) Pursuant to Item 12(a)(1), the Registrant is attaching as an exhibit a copy of its code of ethics that applies to its principal executive officers and principal financial and accounting officer.
Item 3. Audit Committee Financial Expert.
(a)(1) The Registrant has an audit committee financial expert serving on its audit committee.
(2) The audit committee financial expert is John B. Wilson and he is "independent" as defined under the relevant Securities and Exchange Commission Rules and Releases.
Item 4. Principal Accountant Fees and Services.
(a) Audit Fees
The aggregate fees paid to the principal accountant for professional services rendered by the principal accountant for the audit of the registrant’s annual financial statements or for services that are normally provided by the principal accountant in connection with statutory and regulatory filings or engagements were $103,888 for the fiscal year ended May 31, 2011 and $98,079 for the fiscal year ended May 31, 2010.
(b) Audit-Related Fees
There were no fees paid to the principal accountant for assurance and related services rendered by the principal accountant to the registrant that are reasonably related to the performance of the audit of the registrant's financial statements and are not reported under paragraph (a) of Item 4.
There were no fees paid to the principal accountant for assurance and related services rendered by the principal accountant to the registrant's investment adviser and any entity controlling, controlled by or under common control with the investment adviser that provides ongoing services to the registrant that are reasonably related to the performance of the audit of their financial statements.
(c) Tax Fees
There were no fees paid to the principal accountant for professional services rendered by the principal accountant to the registrant for tax compliance, tax advice and tax planning.
The aggregate fees paid to the principal accountant for professional services rendered by the principal accountant to the registrant’s investment adviser and any entity controlling, controlled by or under common control with the investment adviser that provides ongoing services to the registrant for tax compliance, tax advice and tax planning were $85,000 for the fiscal year ended May 31, 2011 and $0 for the fiscal year ended May 31, 2010. The services for which these fees were paid included technical tax consultation for capital gain tax reporting to foreign governments and the application of local country tax laws to investments made by various Franklin Templeton funds.
(d) All Other Fees
The aggregate fees paid to the principal accountant for products and services rendered by the principal accountant to the registrant not reported in paragraphs (a)-(c) of Item 4 were $2,728 for the fiscal year ended May 31, 2011 and $0 for the fiscal year ended May 31, 2010. The services for which these fees were paid included review of materials provided to the fund Board in connection with the investment management contract renewal process.
The aggregate fees paid to the principal accountant for products and services rendered by the principal accountant to the registrant’s investment adviser and any entity controlling, controlled by or under common control with the investment adviser that provides ongoing services to the registrant other than services reported in paragraphs (a)-(c) of Item 4 were $142,072 for the fiscal year ended May 31, 2011 and $0 for the fiscal year ended May 31, 2010. The services for which these fees were paid included review of materials provided to the fund Board in connection with the investment management contract renewal process.
(e) (1) The registrant’s audit committee is directly responsible for approving the services to be provided by the auditors, including:
(i) pre-approval of all audit and audit related services;
(ii) pre-approval of all non-audit related services to be provided to the Fund by the auditors;
(iii) pre-approval of all non-audit related services to be provided to the registrant by the auditors to the registrant’s investment adviser or to any entity that controls, is controlled by or is under common control with the registrant’s investment adviser and that provides ongoing services to the registrant where the non-audit services relate directly to the operations or financial reporting of the registrant; and
(iv) establishment by the audit committee, if deemed necessary or appropriate, as an alternative to committee pre-approval of services to be provided by the auditors, as required by paragraphs (ii) and (iii) above, of policies and procedures to permit such services to be pre-approved by other means, such as through establishment of guidelines or by action of a designated member or members of the committee; provided the policies and procedures are detailed as to the particular service and the committee is informed of each service and such policies and procedures do not include delegation of audit committee responsibilities, as contemplated under the Securities
Exchange Act of 1934, to management; subject, in the case of (ii) through (iv), to any waivers, exceptions or exemptions that may be available under applicable law or rules.
(e) (2) None of the services provided to the registrant described in paragraphs (b)-(d) of Item 4 were approved by the audit committee pursuant to paragraph (c)(7)(i)(C) of Rule 2-01 of regulation S-X.
(f) No disclosures are required by this Item 4(f).
(g) The aggregate non-audit fees paid to the principal accountant for services rendered by the principal accountant to the registrant and the registrant’s investment adviser and any entity controlling, controlled by or under common control with the investment adviser that provides ongoing services to the registrant were $229,800 for the fiscal year ended May 31, 2011 and $0 for the fiscal year ended May 31, 2010.
(h) The registrant’s audit committee of the board has considered whether the provision of non-audit services that were rendered to the registrant’s investment adviser (not including any sub-adviser whose role is primarily portfolio management and is subcontracted with or overseen by another investment adviser), and any entity controlling, controlled by, or under common control with the investment adviser that provides ongoing services to the registrant that were not pre-approved pursuant to paragraph (c)(7)(ii) of Rule 2-01 of Regulation S-X is compatible with maintaining the principal accountant’s independence.
Item 5. Audit Committee of Listed Registrants. N/A
Item 6. Schedule of Investments. N/A
Item 7. Disclosure of Proxy Voting Policies and Procedures for Closed-End Management Investment Companies. N/A
Item 8. Portfolio Managers of Closed-End Management Investment Companies. N/A
Item 9. Purchases of Equity Securities by Closed-End Management Investment Company and Affiliated Purchasers. N/A
Item 10. Submission of Matters to a Vote of Security Holders.
There have been no changes to the procedures by which shareholders may recommend nominees to the Registrant's Board of Trustees that would require disclosure herein.
Item 11. Controls and Procedures.
(a) Evaluation of Disclosure Controls and Procedures. The Registrant maintains disclosure controls and procedures that are designed to
ensure that information required to be disclosed in the Registrant’s filings under the Securities Exchange Act of 1934 and the Investment Company Act of 1940 is recorded, processed, summarized and reported within the periods specified in the rules and forms of the Securities and Exchange Commission. Such information is accumulated and communicated to the Registrant’s management, including its principal executive officer and principal financial officer, as appropriate, to allow timely decisions regarding required disclosure. The Registrant’s management, including the principal executive officer and the principal financial officer, recognizes that any set of controls and procedures, no matter how well designed and operated, can provide only reasonable assurance of achieving the desired control objectives.
Within 90 days prior to the filing date of this Shareholder Report on Form N-CSR, the Registrant had carried out an evaluation, under the supervision and with the participation of the Registrant’s management, including the Registrant’s principal executive officer and the Registrant’s principal financial officer, of the effectiveness of the design and operation of the Registrant’s disclosure controls and procedures. Based on such evaluation, the Registrant’s principal executive officer and principal financial officer concluded that the Registrant’s disclosure controls and procedures are effective.
(b) Changes in Internal Controls. There have been no significant changes in the Registrant’s internal controls or in other factors that could significantly affect the internal controls subsequent to the date of their evaluation in connection with the preparation of this Shareholder Report on Form N-CSR.
Item 12. Exhibits.
(a)(1) Code of Ethics
(a)(2) Certifications pursuant to Section 302 of the Sarbanes-Oxley Act of 2002 of Laura F. Fergerson, Chief Executive Officer - Finance and Administration, and Gaston Gardey, Chief Financial Officer and Chief Accounting Officer
(b) Certifications pursuant to Section 906 of the Sarbanes-Oxley Act of 2002 of Laura F. Fergerson, Chief Executive Officer - Finance and Administration, and Gaston Gardey, Chief Financial Officer and Chief Accounting Officer
SIGNATURES
Pursuant to the requirements of the Securities Exchange Act of 1934 and the Investment Company Act of 1940, the registrant has duly caused this report to be signed on its behalf by the undersigned, thereunto duly authorized.
FRANKLIN NEW YORK TAX-FREE INCOME FUND
By /s/LAURA F. FERGERSON Laura F. Fergerson
Chief Executive Officer - Finance and Administration Date July 27, 2011
Pursuant to the requirements of the Securities Exchange Act of 1934 and the Investment Company Act of 1940, this report has been signed below by the following persons on behalf of the registrant and in the capacities and on the dates indicated.
By /s/LAURA F. FERGERSON
Laura F. Fergerson
Chief Executive Officer - Finance and Administration
Date July 27, 2011
By /s/GASTON GARDEY
Gaston Gardey
Chief Financial Officer and Chief Accounting Officer
Date July 27, 2011
5079-4