UNITED STATES
SECURITIES AND EXCHANGE COMMISSION
Washington, DC 20549
FORM N-CSR
CERTIFIED SHAREHOLDER REPORT OF REGISTERED MANAGEMENT INVESTMENT COMPANIES
Investment Company Act file number_811-03479
Franklin New York Tax-Free Income Fund
(Exact name of registrant as specified in charter)
One Franklin Parkway, San Mateo, CA 94403-1906
(Address of principal executive offices)(Zip code)
Craig S. Tyle, One Franklin Parkway, San Mateo, CA 94403-1906
(Name and address of agent for service)
Registrant's telephone number, including area code: 650 312-2000
Date of fiscal year end: 5/31
Date of reporting period: 5/31/16
Item 1. Reports to Stockholders.
Annual Report
and Shareholder Letter
May 31, 2016
Franklin New York Tax-Free Income Fund

Sign up for electronic delivery at franklintempleton.com/edelivery
| |
| Contents | |
| |
| Annual Report | |
| Franklin New York Tax-Free Income Fund | 3 |
| Performance Summary | 8 |
| Your Fund’s Expenses | 12 |
| Financial Highlights and Statement of Investments | 13 |
| FinancialStatements | 25 |
| Notes to Financial Statements | 28 |
| Report of Independent Registered | |
| Public Accounting Firm | 34 |
| Tax Information | 35 |
| Board Members and Officers | 36 |
| Shareholder Information | 41 |
2
franklintempleton.com
Annual Report
Franklin New York Tax-Free Income Fund
This annual report for Franklin New York Tax-Free Income Fund covers the fiscal year ended May 31, 2016.
Your Fund’s Goal and Main Investments
The Fund seeks to provide investors with as high a level of income exempt from federal, New York state and New York City personal income taxes as is consistent with prudent investment management and preservation of capital by investing at least 80% of its total assets in securities that pay interest free from federal income taxes, including the federal alternative minimum tax, and from New York state personal income taxes, and at least 65% of its total assets in securities that pay interest free from New York City personal income taxes.1
Performance Overview
The Fund’s Class A share price, as measured by net asset value, decreased from $11.58 on May 31, 2015, to $11.54 on May 31, 2016. The Fund’s Class A shares paid dividends totaling 41.28 cents per share for the reporting period.2 The Performance Summary beginning on page 8 shows that at the end of this reporting period the Fund’s Class A shares’ distribution rate was 3.43% based on an annualization of May’s 3.44 cent per share dividend and the maximum offering price of $12.05 on May 31, 2016. An investor in the 2016 maximum combined effective federal and New York state and City personal income tax bracket of 51.07% (including 3.8% Medicare tax) would need to earn a distribution rate of 7.01% from a taxable investment to match the Fund’s Class A tax-free distribution rate. For the Fund’s Class C and Advisor shares’ performance, please see the Performance Summary.
Performance data represent past performance, which does not guarantee future results. Investment return and principal value will fluctuate, and you may have a gain or loss when you sell your shares. Current performance may differ from figures shown. For most recent month-end performance, go to franklintempleton.com or call (800) 342-5236.
| | |
| Credit Quality Breakdown* | | |
| 5/31/16 | | |
| | % of Total | |
| Ratings | Investments | |
| AAA | 19.46 | % |
| AA | 52.85 | % |
| A | 14.02 | % |
| BBB | 0.24 | % |
| Below Investment Grade | 2.11 | % |
| Refunded | 9.73 | % |
| Not Rated | 1.59 | % |
*Securities, except for those labeled Not Rated, are assigned ratings by one or more Nationally Recognized Statistical Credit Rating Organizations (NRSROs), such as Standard & Poor’s, Moody’s and Fitch, that can be considered by the investment manager as part of its independent securities analysis. When ratings from multiple agencies are available, the highest is used, consistent with the portfolio investment process. Ratings reflect an NRSRO’s opinion of an issuer’s creditworthiness and typically range from AAA (highest) to D (lowest). The Below Investment Grade category consists of bonds rated below BBB-. The Refunded category generally consists of refunded bonds secured by U.S. government or other high-quality securities and not rerated by an NRSRO. The Not Rated category consists of ratable securities that have not been rated by an NRSRO. Cash and equivalents are excluded from this breakdown.
State Update
Over the 12-month period under review, New York’s robust and well-diversified economy continued to progress amid an improved housing market and favorable labor market conditions. Consumer confidence in the economy and low mortgage rates helped the state’s real estate market generate healthy price increases and reach record sales levels in February 2016. Although New York experienced job losses in the information and manufacturing sectors, most sectors contributed to job growth, led by construction, education and health services, and leisure and hospitality. Additionally, New York’s unemployment rate declined from 5.4% in May 2015 to 4.7% at period-end, which matched the national average.3 New York features a significant presence of corporate headquarters and attracts a highly educated and global workforce, which supported its above-average resilience during the recovery.
1. For investors subject to alternative minimum tax, a small portion of Fund dividends may be taxable. Distributions of capital gains are generally taxable. To avoid the imposition
of 28% backup withholding on all Fund distributions and redemption proceeds, U.S. investors must be properly certified on Form W-9 and non-U.S. investors on Form W-8BEN.
2. The distribution amount is the sum of the dividend payments to shareholders for the period shown and includes only estimated tax-basis net investment income. All Fund
distributions will vary depending upon current market conditions, and past distributions are not indicative of future trends.
3. Source: Bureau of Labor Statistics.
The dollar value, number of shares or principal amount, and names of all portfolio holdings are listed in the Fund’s Statement of Investments (SOI).
The SOI begins on page 16.
franklintempleton.com
Annual Report
3
FRANKLIN NEW YORK TAX-FREE INCOME FUND
The combination of budget reforms and spending restraint has improved New York’s financial position. Deficits in New York’s general fund, which receives the majority of state taxes and income, were eliminated and turned into operational surpluses used to bolster reserves. In January 2016, New York’s governor released the fiscal year (FY) 2017 executive budget proposal, which limits overall expenditures growth and emphasizes structural balance through controlled spending. The proposed budget included investments in health care and Medicaid reform, education and environmental initiatives. In the FY 2017 executive budget, school aid continues to represent the largest state-supported program. Based on current projections, adherence to a spending benchmark and effectively managing the budget in future fiscal years could produce budget surpluses through FY 2020.
The state has received substantial financial settlements from banks and insurers since FY 2015 and has used these funds to support economic development and bolster infrastructure. The remaining windfall from monetary settlements with financial institutions is set aside primarily for one-time investments and reserves; the FY 2017 executive budget proposes using these funds to supplement state activities. Moreover, the governor announced the “Built to Lead” program, which included proposals to control spending, reduce taxes and improve infrastructure, housing, health care and education.
| | | |
| Dividend Distributions2 | | | |
| 6/1/15–5/31/16 | | | |
| | Dividend per Share (cents) |
| Month | Class A | Class C | Advisor Class |
| June | 3.44 | 2.92 | 3.53 |
| July | 3.44 | 2.92 | 3.53 |
| August | 3.44 | 2.92 | 3.53 |
| September | 3.44 | 2.87 | 3.55 |
| October | 3.44 | 2.87 | 3.55 |
| November | 3.44 | 2.87 | 3.55 |
| December | 3.44 | 2.95 | 3.52 |
| January | 3.44 | 2.95 | 3.52 |
| February | 3.44 | 2.95 | 3.52 |
| March | 3.44 | 2.91 | 3.53 |
| April | 3.44 | 2.91 | 3.53 |
| May | 3.44 | 2.91 | 3.53 |
| Total | 41.28 | 34.95 | 42.39 |
New York’s net tax-supported debt was 5.4% of personal income and $3,021 per capita, compared with the 2.5% and $1,025 national medians.4 During the year under review, independent credit rating agency Moody’s Investors Service affirmed its rating of New York’s general obligation debt at Aa1 with a stable outlook, while Standard & Poor’s (S&P) rated it an equivalent AA+ with a stable outlook.5 Moody’s rating reflected its view of the state’s strong economic recovery, moderate projected budget gaps, superior fiscal governance and a strong financial position with improved reserves. According to Moody’s, these strengths are counterbalanced by revenue volatility stemming from New York’s dependence on the financial services sector and income taxes combined with restricted usage of budgetary reserves. Nevertheless, Moody’s expects New York to close budget gaps and contain its structural fiscal imbalance. Similarly, S&P’s rating reflected its view of the state’s sound financial management and well-established budget practices. S&P noted New York’s stable budget and financial trends due to improved structural alignment, on-time budget enactment, general expenditure restraint and a well-funded pension system. Both credit rating agencies noted New York’s adequate liquidity and continued control of spending growth. New York’s liquidity position continued to improve due to the economic recovery and favorable revenue trends.
Municipal Bond Market Overview
The municipal bond market outperformed the U.S. Treasury and U.S. stock markets during the 12-month period ended May 31, 2016. Investment-grade municipal bonds, as measured by the Barclays Municipal Bond Index, generated a +5.87% total return for the period, while U.S. Treasuries, as measured by the Barclays U.S. Treasury Index, posted a +3.01% total return.6 U.S. equities, as represented by the Standard & Poor’s 500 Index, underperformed with a +1.72% total return for the reporting period.6 The underperformance of U.S. equities was partly fueled by concerns about global economic growth, particularly a continuing slowdown in China and sluggish economic activity in Europe and Japan. Sustained price declines in the commodities markets also put downward pressure on U.S. equities. These factors led to a perceived flight to quality, which seemed to benefit municipal bondholders. In addition, in our opinion, municipal bonds continued to offer significant value relative to Treasuries because of their tax-exempt yields and relatively low risk.
4. Source: Moody’s Investors Service, State Debt Medians 2016: Medians - Total Debt Remains Static in 2016, 5/6/16.
5. These do not indicate ratings of the Fund.
6. Source: Morningstar. Treasuries, if held to maturity, offer a fixed rate of return and a fixed principal value; their interest payments and principal are guaranteed.
4 Annual Report
franklintempleton.com
FRANKLIN NEW YORK TAX-FREE INCOME FUND
The Federal Reserve (Fed) raised its target interest-rate range to 0.25%–0.50% in December, citing labor market improvement and continued U.S. economic growth. This action ended a seven-year period of near-zero short-term interest rates. At the time, the Fed indicated the move would be followed by a “gradual” tightening of monetary policy. Benchmark 10-year and 30-year tax-exempt interest rates ended the period lower than where they began.
Municipal bond funds finished the period with nine consecutive months of inflows, reflecting solid demand for tax-exempt debt. Bonds with longer maturities generally performed better than bonds with shorter maturities. In addition, investment-grade municipal bonds fared better than high yield municipal bonds. High yield tax-exempt bonds, as measured by the Barclays High Yield Municipal Bond Index, generated a +4.70% total return for the period.6 Approximately $341 billion in bonds were issued over the past 12 months; this was offset, however, by the nearly $339 billion in bonds that either matured or were called out of the market, making net supply flat for the period.7
Several developments affected Puerto Rico bonds over the reporting period. Puerto Rico and its municipal issuers continued to experience significant financial difficulties, which created additional strain on a commonwealth already facing economic stagnation and fiscal imbalances. These challenges also led to liquidity issues including reduced access to the financial markets. On February 6, 2015, a federal judge ruled that Puerto Rico’s Public Corporation Debt Enforcement and Recovery Act (the Act), signed into law on June 28, 2014, was unconstitutional. Following the ruling, which was affirmed by the U.S. Court of Appeals on July 6, 2015, independent credit rating agencies Moody’s Investors Service and Standard & Poor’s repeatedly downgraded Puerto Rico’s general obligation debt, as well as the ratings of certain related Puerto Rico issuers. On August 21, 2015, Puerto Rico petitioned the U.S. Supreme Court to review the ruling invalidating the Act. In early December, the U.S. Supreme Court granted Puerto Rico’s request, began hearing oral arguments on March 22, 2016 and, shortly after period-end, upheld the lower court’s ruling that the Act was unconstitutional.
Near the end of June 2015, in conjunction with announcing that Puerto Rico’s debt was “not payable,” Governor Alejandro Garcia Padilla publicly called for a restructuring of Puerto Rico debt obligations, while certain other Puerto Rico issuers
continued to negotiate with creditors for a financial restructuring. During the reporting period, Puerto Rico’s financial issues led to partial defaults by Puerto Rico’s Public Finance Corporation on its debt service payments beginning on August 3, 2015. In September, Governor Garcia Padilla’s working group issued a preliminary report regarding the island’s financial situation and potential restructuring recommendations. In recent months, the government has released two different restructuring proposals to creditors. Both plans seek to reduce the amount of debt outstanding and lessen annual debt service payments. The government proposed doing this through an exchange into two bonds, at levels below current principal values.
Franklin Templeton has been a member of a creditors’ committee (Ad Hoc Group) made up of bondholders of the Puerto Rico Electric Power Authority (PREPA) with the goal of achieving a negotiated, market-based, long-term solution to PREPA’s liquidity and structural issues. On December 23, 2015, a Restructuring Support Agreement was signed. The agreement, which has attained legislative approval, provides for the Ad Hoc Group to exchange its bonds at 85 cents on the dollar into a new “securitization” bond. There are still many details that need to be resolved, and the formulation of the exchange offer and necessary legislation may take several months. However, we are satisfied that implementation of this agreement would allow PREPA to provide reliable and lower cost service, fund its capital needs for the medium term, ensure environmental compliance, diversify generation resources to include more natural gas and provide jobs. One of the conditions to the agreement was for the Puerto Rico legislature to pass legislation to establish the necessary securitization framework for the new PREPA debt, and this was completed on February 16, 2016. On May 19, 2016, certain bondholders purchased half of $115 million principal of bonds pursuant to the Bond Purchase Agreement. The second half is expected to close in June 2016 after certain conditions are met.
On October 21, 2015, the Obama Administration presented a plan with its proposals to help address the Puerto Rico situation to the U.S. Congress. The plan’s proposals included: granting Puerto Rico a “super-Chapter 9” framework by which ALL of Puerto Rico’s debts could be reorganized, a Congressionally-created independent fiscal oversight board for the island, equal treatment for Puerto Rico on the disbursement of Medicaid benefits and participation in the Earned Income Tax Credit program. The House Committee on Natural Resources
7. Source: Goldman Sachs Securities Division, Bloomberg.
See www.franklintempletondatasources.com for additional data provider information.
franklintempleton.com
Annual Report
5
FRANKLIN NEW YORK TAX-FREE INCOME FUND
introduced a second bill, named the Puerto Rico Oversight, Management and Economic Stability Act (PROMESA) on May 19, 2016, that would provide an oversight board as well as restructuring process. During April, Governor Padilla also enacted a debt moratorium on most debt issued by Puerto Rico and its agencies. The legislation further stays all related litigation until January 2017. As a result of the moratorium, the Government Development Bank defaulted on a significant debt service payment in early May 2016. However, on May 16, 2016, the Puerto Rico Senate approved legislation exempting certain securitizations, including the proposed PREPA securitization bond. Puerto Rico and several of its agencies have large debt service payments due in July and August 2016. It remains unclear if the Governor will declare any additional moratoriums in the near future and which bond might experience defaults.
At period-end, we maintained our positive view of the municipal bond market. We believe municipal bonds continue to be an attractive asset class among fixed income securities, and we intend to follow our solid discipline of investing to maximize income while seeking value in the municipal bond market.
Investment Strategy
We use a consistent, disciplined strategy in an effort to maximize tax-exempt income for our shareholders by seeking to maintain exposure to higher coupon securities while balancing risk and return within the Fund’s range of allowable investments. We generally employ a buy-and-hold approach and invest in securities we believe should provide the most relative value in the market. We do not use leverage or derivatives, nor do we use hedging techniques that could add volatility and contribute to underperformance in adverse markets. We generally seek to stay close to fully invested to help maximize income distribution.
Manager’s Discussion
The combination of our value-oriented philosophy of investing primarily for income and a positive-sloping municipal yield curve, in which interest rates for longer term bonds are higher than those for shorter term bonds, led us to favor longer term bonds during the reporting period. Consistent with our strategy, we sought to remain close to fully invested in bonds ranging from 20 to 30 years in maturity with good call features. In line with our relative value investment strategy, and to further reduce volatility, we avoided derivative securities and other investment vehicles designed to leverage the portfolio. During the period, the Fund had no exposure to inverse floaters or any other form of leverage. Also, as the alternative minimum tax
| | |
| Portfolio Breakdown | | |
| 5/31/16 | | |
| | % of Total | |
| | Investments* | |
| Transportation | 21.1 | % |
| Refunded** | 20.4 | % |
| Tax-Supported | 15.9 | % |
| Subject to Government Appropriations | 12.8 | % |
| Utilities | 8.8 | % |
| Higher Education | 6.7 | % |
| General Obligation | 6.3 | % |
| Corporate-Backed | 3.1 | % |
| Hospital & Health Care | 2.2 | % |
| Housing | 1.5 | % |
| Other Revenue | 1.2 | % |
*Does not include cash and cash equivalents.
**Includes all refunded bonds; the percentage may differ from that in the Credit Quality Breakdown.
(AMT) affects more individuals each year, we held no bonds subject to AMT to prevent a taxable situation for individuals subject to AMT.
The Fund holds a small portion of its assets in Puerto Rico bonds. Puerto Rico and its municipal issuers continued to experience significant financial difficulties, which we discussed in the Municipal Bond Market Overview. The Fund is not required to sell securities that have been downgraded to below investment grade, but it is prohibited from making further purchases of such securities as long as the securities are not rated investment grade by at least one U.S. nationally recognized rating service. Rating actions combined with news related to the commonwealth’s financial position and future financing endeavors caused the Puerto Rico bond market to experience volatility during the reporting period. We continue to closely monitor developments in Puerto Rico; however, the municipal bond market’s overall fundamentals, such as general creditworthiness and low default rates, remained stable.
We believe our conservative, buy-and-hold investment strategy can help us achieve high, current, tax-free income for shareholders. Thank you for your continued participation in Franklin New York Tax-Free Income Fund. We look forward to serving your future investment needs.
6 Annual Report
franklintempleton.com
FRANKLIN NEW YORK TAX-FREE INCOME FUND
The foregoing information reflects our analysis, opinions and portfolio
holdings as of May 31, 2016, the end of the reporting period. The way
we implement our main investment strategies and the resulting
portfolio holdings may change depending on factors such as market
and economic conditions. These opinions may not be relied upon as
investment advice or an offer for a particular security. The information
is not a complete analysis of every aspect of any market, state,
industry, security or the Fund. Statements of fact are from sources
considered reliable, but the investment manager makes no
representation or warranty as to their completeness or accuracy.
Although historical performance is no guarantee of future results,
these insights may help you understand our investment management
philosophy.
franklintempleton.com
Annual Report
7
FRANKLIN NEW YORK TAX-FREE INCOME FUND
Performance Summary as of May 31, 2016
Your dividend income will vary depending on dividends or interest paid by securities in the Fund’s portfolio, adjusted for operating expenses of each class. Capital gain distributions are net profits realized from the sale of portfolio securities. The performance tables and graphs do not reflect any taxes that a shareholder would pay on Fund dividends, capital gain distributions, if any, or any realized gains on the sale of Fund shares. Total return reflects reinvestment of the Fund’s dividends and capital gain distributions, if any, and any unrealized gains or losses.
| | | | | | |
| Net Asset Value | | | | | | |
| Share Class (Symbol) | | 5/31/16 | | 5/31/15 | | Change |
| A (FNYTX) | $ | 11.54 | $ | 11.58 | -$ | 0.04 |
| C (FNYIX) | $ | 11.52 | $ | 11.57 | -$ | 0.05 |
| Advisor (FNYAX) | $ | 11.55 | $ | 11.59 | -$ | 0.04 |
| |
| |
| Distributions1 (6/1/15–5/31/16) | | | | | | |
| | | Dividend | | | | |
| Share Class | | Income | | | | |
| A | $ | 0.4128 | | | | |
| C | $ | 0.3495 | | | | |
| Advisor | $ | 0.4239 | | | | |
See page 11 for Performance Summary footnotes.
8 Annual Report
franklintempleton.com
FRANKLIN NEW YORK TAX-FREE INCOME FUND
PERFORMANCE SUMMARY
Performance as of 5/31/16
Cumulative total return excludes sales charges. Average annual total returns include maximum sales charges. Class A: 4.25%
maximum initial sales charge; Class C: 1% contingent deferred sales charge in first year only; Advisor Class: no sales charges.
| | | | | | | | |
| | Cumulative | | Average Annual | | Average Annual | | Total Annual | |
| Share Class | Total Return2 | | Total Return3 | | Total Return (6/30/16)4 | | Operating Expenses5 | |
| A | | | | | | | 0.61 | % |
| 1-Year | +3.30 | % | -1.06 | % | +0.38 | % | | |
| 5-Year | +21.71 | % | +3.10 | % | +3.31 | % | | |
| 10-Year | +49.21 | % | +3.63 | % | +3.79 | % | | |
| C | | | | | | | 1.16 | % |
| 1-Year | +2.64 | % | +1.65 | % | +3.25 | % | | |
| 5-Year | +18.31 | % | +3.42 | % | +3.62 | % | | |
| 10-Year | +41.11 | % | +3.50 | % | +3.67 | % | | |
| Advisor | | | | | | | 0.51 | % |
| 1-Year | +3.40 | % | +3.40 | % | +4.93 | % | | |
| 5-Year | +22.40 | % | +4.13 | % | +4.31 | % | | |
| 10-Year | +50.59 | % | +4.18 | % | +4.34 | % | | |
| |
| |
| | Distribution | | Taxable Equivalent | | 30 | -Day | Taxable Equivalent 30-Day | |
| Share Class | Rate6 | | Distribution Rate7 | | Standardized Yield8 | | Standardized Yield7 | |
| A | 3.43 | % | 7.01 | % | 1.08 | % | 2.21 | % |
| C | 3.03 | % | 6.19 | % | 0.56 | % | 1.14 | % |
| Advisor | 3.67 | % | 7.50 | % | 1.22 | % | 2.49 | % |
Performance data represent past performance, which does not guarantee future results. Investment return and principal value will
fluctuate, and you may have a gain or loss when you sell your shares. Current performance may differ from figures shown. For most
recent month-end performance, go to franklintempleton.com or call (800) 342-5236.
See page 11 for Performance Summary footnotes.
franklintempleton.com
Annual Report
9
FRANKLIN NEW YORK TAX-FREE INCOME FUND
PERFORMANCE SUMMARY
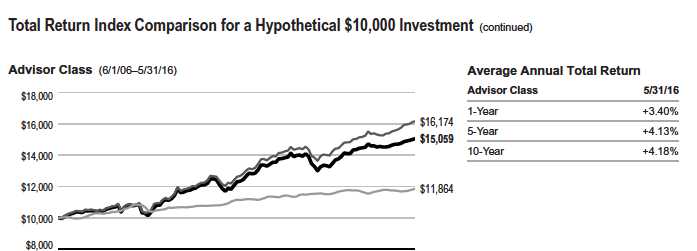
Total Return Index Comparison for a Hypothetical $10,000 Investment
Total return represents the change in value of an investment over the periods shown. It includes any applicable maximum sales charge, Fund expenses, account fees and reinvested distributions. The unmanaged indexes include reinvestment of any income or distributions. They differ from the Fund in composition and do not pay management fees or expenses. One cannot invest directly in an index.

| | | | | |
| 6/06 | 5/08 | 5/10 | 5/12 | 5/14 | 5/16 |
| |
| Franklin New York | Barclays Municipal | Consumer Price Index10 |
| Tax-Free Income Fund | Bond Index9 | | |
See page 11 for Performance Summary footnotes.
10 Annual Report
franklintempleton.com
FRANKLIN NEW YORK TAX-FREE INCOME FUND
PERFORMANCE SUMMARY
6/06 5/08 5/10 5/12 5/14 5/16
Franklin New York Barclays Municipal Consumer Price Index10
Tax-Free Income Fund Bond Index9
All investments involve risks, including possible loss of principal. Because municipal bonds are sensitive to interest rate movements, the Fund’s yield and share
price will fluctuate with market conditions. Bond prices generally move in the opposite direction of interest rates. Thus, as prices of bonds in the Fund adjust to a
rise in interest rates, the Fund’s share price may decline. Because the Fund invests principally in a single state, it is subject to greater risk of adverse economic
and regulatory changes in that state than a geographically diversified fund. The Fund holds a small portion of its assets in Puerto Rico municipal bonds thathave
been impacted by recent adverse economic and market changes, which may cause the Fund’s share price to decline. Changes in the credit rating of a bond, or in
the credit rating or financial strength of a bond’s issuer, insurer or guarantor, may affect the bond’s value. The Fund may invest a significant part of its assets in
municipal securities that finance similar types of projects, such as utilities, hospitals, higher education and transportation. A change that affects one project
would likely affect all similar projects, thereby increasing market risk. The Fund is actively managed but there is no guarantee that the manager’s investment
decisions will produce the desired results. The Fund’s prospectus also includes a description of the main investment risks.
| |
| Class C: | These shares have higher annual fees and expenses than Class A shares. |
| Advisor Class: | Shares are available to certain eligible investors as described in the prospectus. |
1. The distribution amount is the sum of the dividend payments to shareholders for the period shown and includes only estimated tax-basis net investment income.
2. Cumulative total return represents the change in value of an investment over the periods indicated.
3. Average annual total return represents the average annual change in value of an investment over the periods indicated. Return for less than one year, ifany,hasnotbeen
annualized.
4. In accordance with SEC rules, we provide standardized average annual total return information through the latest calendar quarter.
5. Figures are as stated in the Fund’s current prospectus and may differ from the expense ratios disclosed in the Financial Highlights in this report. In periods of market volatility,
assets may decline significantly, causing total annual Fund operating expenses to become higher than the figures shown.
6. Distribution rate is based on an annualization of the respective class’s May dividend and the maximum offering price (NAV for Classes C and Advisor) per share on 5/31/16.
7. Taxable equivalent distribution rate and yield assume the published rates as of 12/21/15 for the maximum combined effective federal and New York state and City personal
income tax rate of 51.07%, based on the federal income tax rate of 39.60% plus 3.8% Medicare tax.
8. The Fund’s 30-day standardized yield is calculated over a trailing 30-day period using the yield to maturity on bonds and/or the dividends accrued on stocks. It may not equal
the Fund’s actual income distribution rate, which reflects the Fund’s past dividends paid to shareholders.
9. Source: Morningstar. The Barclays Municipal Bond Index is a market value-weighted index engineered for the long-term tax-exempt bond market. To be included in the index,
bonds must be fixed rate, have at least one year to final maturity and be rated investment grade (Baa3/BB- or higher) by at least two of the following agencies: Moody’s,
Standard & Poor’s and Fitch.
10. Source: Bureau of Labor Statistics, bls.gov/cpi. The Consumer Price Index is a commonly used measure of the inflation rate.
See www.franklintempletondatasources.com for additional data provider information.
franklintempleton.com
Annual Report
11
FRANKLIN NEW YORK TAX-FREE INCOME FUND
Your Fund’s Expenses
As a Fund shareholder, you can incur two types of costs:
- Transaction costs, including sales charges (loads) on Fund purchases, if applicable; and
- Ongoing Fund costs, including management fees, distribution and service (12b-1) fees, if applicable, and other Fund expenses. All mutual funds have ongoing costs, sometimes referred to as operating expenses.
The following table shows ongoing costs of investing in the Fund and can help you understand these costs and compare them with those of other mutual funds. The table assumes a $1,000 investment held for the six months indicated.
Actual Fund Expenses
The first line (Actual) for each share class listed in the table provides actual account values and expenses. The “Ending Account Value” is derived from the Fund’s actual return, which includes the effect of Fund expenses.
You can estimate the expenses you paid during the period by following these steps. Of course, your account value and expenses will differ from those in this illustration:
| 1. | Divide your account value by $1,000. |
| | If an account had an $8,600 value, then $8,600 ÷ $1,000 = 8.6. |
| 2. | Multiply the result by the number under the heading “Expenses Paid During Period.” |
| | If Expenses Paid During Period were $7.50, then 8.6 x $7.50 = $64.50. |
In this illustration, the estimated expenses paid this period are $64.50.
Hypothetical Example for Comparison with Other Funds
Information in the second line (Hypothetical) for each class in the table can help you compare ongoing costs of investing in the Fund with those of other mutual funds. This information may not be used to estimate the actual ending account balance or expenses you paid during the period. The hypothetical “Ending Account Value” is based on the actual expense ratio for each class and an assumed 5% annual rate of return before expenses, which does not represent the Fund’s actual return. The figure under the heading “Expenses Paid During Period” shows the hypothetical expenses your account would have incurred under this scenario. You can compare this figure with the 5% hypothetical examples that appear in shareholder reports of other funds.
Please note that expenses shown in the table are meant to highlight ongoing costs and do not reflect any transaction costs, such as sales charges. Therefore, the second line for each class is useful in comparing ongoing costs only, and will not help you compare total costs of owning different funds. In addition, if transaction costs were included, your total costs would have been higher. Please refer to the Fund prospectus for additional information on operating expenses.
| | | | | | |
| | | Beginning Account | | Ending Account | | Expenses Paid During |
| Share Class | | Value 12/1/15 | | Value 5/31/16 | | Period* 12/1/15–5/31/16 |
| A | | | | | | |
| Actual | $ | 1,000 | $ | 1,023.40 | $ | 3.09 |
| Hypothetical (5% return before expenses) | $ | 1,000 | $ | 1,021.95 | $ | 3.08 |
| C | | | | | | |
| Actual | $ | 1,000 | $ | 1,019.80 | $ | 5.86 |
| Hypothetical (5% return before expenses) | $ | 1,000 | $ | 1,019.20 | $ | 5.86 |
| Advisor | | | | | | |
| Actual | $ | 1,000 | $ | 1,023.90 | $ | 2.58 |
| Hypothetical (5% return before expenses) | $ | 1,000 | $ | 1,022.45 | $ | 2.58 |
*Expenses are calculated using the most recent six-month expense ratio, annualized for each class (A: 0.61%; C: 1.16%; and Advisor: 0.51%),
multiplied by the average account value over the period, multiplied by 183/366 to reflect the one-half year period.
12 Annual Report
franklintempleton.com
FRANKLIN NEW YORK TAX-FREE INCOME FUND
| | | | | | | | | | | | | | | |
| Financial Highlights | | | | | | | | | | | | | | | |
| | | | | | Year Ended May 31, | | | | |
| | | 2016 | | | 2015 | | | 2014 | | | 2013 | | | 2012 | |
| Class A | | | | | | | | | | | | | | | |
| Per share operating performance | | | | | | | | | | | | | | | |
| (for a share outstanding throughout the year) | | | | | | | | | | | | | | | |
| Net asset value, beginning of year | $ | 11.58 | | $ | 11.69 | | $ | 11.98 | | $ | 12.09 | | $ | 11.45 | |
| Income from investment operationsa: | | | | | | | | | | | | | | | |
| Net investment incomeb | | 0.41 | | | 0.43 | | | 0.46 | | | 0.43 | | | 0.48 | |
| Net realized and unrealized gains (losses) | | (0.04 | ) | | (0.11 | ) | | (0.30 | ) | | (0.11 | ) | | 0.64 | |
| Total from investment operations | | 0.37 | | | 0.32 | | | 0.16 | | | 0.32 | | | 1.12 | |
| Less distributions from: | | | | | | | | | | | | | | | |
| Net investment income | | (0.41 | ) | | (0.43 | ) | | (0.45 | ) | | (0.43 | ) | | (0.48 | ) |
| Net realized gains | | — | | | — | | | — | | | — | | | (—)c | |
| Total distributions | | (0.41 | ) | | (0.43 | ) | | (0.45 | ) | | (0.43 | ) | | (0.48 | ) |
| Net asset value, end of year. | $ | 11.54 | | $ | 11.58 | | $ | 11.69 | | $ | 11.98 | | $ | 12.09 | |
| |
| Total returnd | | 3.30 | % | | 2.76 | % | | 1.52 | % | | 2.65 | % | | 10.03 | % |
| |
| Ratios to average net assets | | | | | | | | | | | | | | | |
| Expenses | | 0.61 | % | | 0.61 | % | | 0.60 | % | | 0.60 | % | | 0.60 | % |
| Net investment income | | 3.59 | % | | 3.67 | % | | 4.03 | % | | 3.55 | % | | 4.04 | % |
| |
| Supplemental data | | | | | | | | | | | | | | | |
| Net assets, end of year (000’s) | $ | 4,131,002 | | $ | 4,319,062 | | $ | 4,599,685 | | $ | 5,532,799 | | $ | 5,634,348 | |
| Portfolio turnover rate | | 4.14 | % | | 6.54 | % | | 4.74 | % | | 12.08 | % | | 5.55 | % |
aThe amount shown for a share outstanding throughout the period may not correlate with the Statement of Operations for the period due to the timing of sales and
repurchases of the Fund’s shares in relation to income earned and/or fluctuating fair value of the investments of the Fund.
bBased on average daily shares outstanding.
cAmount rounds to less than $0.01 per share.
dTotal return does not reflect sales commissions or contingent deferred sales charges, if applicable.
franklintempleton.com
The accompanying notes are an integral part of these financial statements. | Annual Report 13
FRANKLIN NEW YORK TAX-FREE INCOME FUND
FINANCIAL HIGHLIGHTS
| | | | | | | | | | | | | | | |
| | | | | | Year Ended May 31, | | | | | | | |
| | | 2016 | | | 2015 | | | 2014 | | | 2013 | | | 2012 | |
| Class C | | | | | | | | | | | | | | | |
| Per share operating performance | | | | | | | | | | | | | | | |
| (for a share outstanding throughout the year) | | | | | | | | | | | | | | | |
| Net asset value, beginning of year | $ | 11.57 | | $ | 11.67 | | $ | 11.97 | | $ | 12.07 | | $ | 11.44 | |
| Income from investment operationsa: | | | | | | | | | | | | | | | |
| Net investment incomeb | | 0.35 | | | 0.36 | | | 0.39 | | | 0.36 | | | 0.41 | |
| Net realized and unrealized gains (losses) | | (0.05 | ) | | (0.10 | ) | | (0.30 | ) | | (0.10 | ) | | 0.64 | |
| Total from investment operations | | 0.30 | | | 0.26 | | | 0.09 | | | 0.26 | | | 1.05 | |
| Less distributions from: | | | | | | | | | | | | | | | |
| Net investment income | | (0.35 | ) | | (0.36 | ) | | (0.39 | ) | | (0.36 | ) | | (0.42 | ) |
| Net realized gains | | — | | | — | | | — | | | — | | | (—)c | |
| Total distributions | | (0.35 | ) | | (0.36 | ) | | (0.39 | ) | | (0.36 | ) | | (0.42 | ) |
| Net asset value, end of year. | $ | 11.52 | | $ | 11.57 | | $ | 11.67 | | $ | 11.97 | | $ | 12.07 | |
| |
| Total returnd | | 2.64 | % | | 2.28 | % | | 0.87 | % | | 2.17 | % | | 9.35 | % |
| |
| Ratios to average net assets | | | | | | | | | | | | | | | |
| Expenses | | 1.16 | % | | 1.16 | % | | 1.15 | % | | 1.15 | % | | 1.15 | % |
| Net investment income | | 3.04 | % | | 3.12 | % | | 3.48 | % | | 3.00 | % | | 3.49 | % |
| |
| Supplemental data | | | | | | | | | | | | | | | |
| Net assets, end of year (000’s) | $ | 665,206 | | $ | 674,478 | | $ | 700,352 | | $ | 963,878 | | $ | 911,935 | |
| Portfolio turnover rate | | 4.14 | % | | 6.54 | % | | 4.74 | % | | 12.08 | % | | 5.55 | % |
aThe amount shown for a share outstanding throughout the period may not correlate with the Statement of Operations for the period due to the timing of sales and
repurchases of the Fund’s shares in relation to income earned and/or fluctuating fair value of the investments of the Fund.
bBased on average daily shares outstanding.
cAmount rounds to less than $0.01 per share.
dTotal return does not reflect sales commissions or contingent deferred sales charges, if applicable.
14 Annual Report | The accompanying notes are an integral part of these financial statements.
franklintempleton.com
FRANKLIN NEW YORK TAX-FREE INCOME FUND
FINANCIAL HIGHLIGHTS
| | | | | | | | | | | | | | | |
| | | | | | Year Ended May 31, | | | | | | | |
| | | 2016 | | | 2015 | | | 2014 | | | 2013 | | | 2012 | |
| Advisor Class | | | | | | | | | | | | | | | |
| Per share operating performance | | | | | | | | | | | | | | | |
| (for a share outstanding throughout the year) | | | | | | | | | | | | | | | |
| Net asset value, beginning of year | $ | 11.59 | | $ | 11.69 | | $ | 11.99 | | $ | 12.09 | | $ | 11.45 | |
| Income from investment operationsa: | | | | | | | | | | | | | | | |
| Net investment incomeb | | 0.42 | | | 0.44 | | | 0.47 | | | 0.44 | | | 0.49 | |
| Net realized and unrealized gains (losses) | | (0.04 | ) | | (0.10 | ) | | (0.31 | ) | | (0.10 | ) | | 0.64 | |
| Total from investment operations | | 0.38 | | | 0.34 | | | 0.16 | | | 0.34 | | | 1.13 | |
| Less distributions from: | | | | | | | | | | | | | | | |
| Net investment income | | (0.42 | ) | | (0.44 | ) | | (0.46 | ) | | (0.44 | ) | | (0.49 | ) |
| Net realized gains | | — | | | — | | | — | | | — | | | (—)c | |
| Total distributions | | (0.42 | ) | | (0.44 | ) | | (0.46 | ) | | (0.44 | ) | | (0.49 | ) |
| Net asset value, end of year. | $ | 11.55 | | $ | 11.59 | | $ | 11.69 | | $ | 11.99 | | $ | 12.09 | |
| |
| Total return | | 3.40 | % | | 2.94 | % | | 1.53 | % | | 2.84 | % | | 10.14 | % |
| |
| Ratios to average net assets | | | | | | | | | | | | | | | |
| Expenses | | 0.51 | % | | 0.51 | % | | 0.50 | % | | 0.50 | % | | 0.50 | % |
| Net investment income | | 3.69 | % | | 3.77 | % | | 4.13 | % | | 3.65 | % | | 4.14 | % |
| |
| Supplemental data | | | | | | | | | | | | | | | |
| Net assets, end of year (000’s) | $ | 274,034 | | $ | 271,828 | | $ | 180,654 | | $ | 254,797 | | $ | 217,197 | |
| Portfolio turnover rate | | 4.14 | % | | 6.54 | % | | 4.74 | % | | 12.08 | % | | 5.55 | % |
aThe amount shown for a share outstanding throughout the period may not correlate with the Statement of Operations for the period due to the timing of sales and
repurchases of the Fund’s shares in relation to income earned and/or fluctuating fair value of the investments of the Fund.
bBased on average daily shares outstanding.
cAmount rounds to less than $0.01 per share.
franklintempleton.com
The accompanying notes are an integral part of these financial statements. | Annual Report 15
FRANKLIN NEW YORK TAX-FREE INCOME FUND
| | | | |
| Statement of Investments, May 31, 2016 | | | | |
| | | Principal | | |
| | | Amount | | Value |
| |
| Municipal Bonds 94.2% | | | | |
| New York 92.2% | | | | |
| Albany IDA Civic Facility Revenue, | | | | |
| St. Peter’s Hospital Project, Series A, Pre-Refunded, 5.25%, 11/15/27 | $ | 5,000,000 | $ | 5,323,850 |
| St. Peter’s Hospital Project, Series A, Pre-Refunded, 5.25%, 11/15/32 | | 5,000,000 | | 5,323,850 |
| St. Peter’s Hospital Project, Series E, Pre-Refunded, 5.50%, 11/15/27 | | 1,135,000 | | 1,212,600 |
| St. Peter’s Hospital Project, Series E, Pre-Refunded, 5.25%, 11/15/32 | | 1,150,000 | | 1,224,486 |
| Amherst Development Corp. Student Housing Facility Revenue, | | | | |
| University of Buffalo Foundation Facility, Student Housing Corp., Greiner and Hadley Projects at Suny | | | | |
| Buffalo, Series A, AGMC Insured, 5.00%, 10/01/40 | | 3,000,000 | | 3,367,290 |
| University of Buffalo Foundation Facility, Student Housing Corp., Greiner and Hadley Projects at Suny | | | | |
| Buffalo, Series A, AGMC Insured, 5.00%, 10/01/45 | | 3,800,000 | | 4,238,482 |
| Buffalo and Erie County Industrial Land Development Corp. Revenue, | | | | |
| Buffalo State College Foundation Housing Corp. Project, Series A, 5.375%, 10/01/41 | | 2,035,000 | | 2,345,460 |
| Catholic Health System Inc. Project, 5.25%, 7/01/35 | | 1,000,000 | | 1,177,620 |
| Catholic Health System Inc. Project, 5.00%, 7/01/40 | | 1,000,000 | | 1,140,810 |
| City of New Rochelle Corp. for Local Development Revenue, | | | | |
| Iona College Project, Refunding, Series A, 5.00%, 7/01/40 | | 1,250,000 | | 1,433,438 |
| Iona College Project, Refunding, Series A, 5.00%, 7/01/45 | | 1,425,000 | | 1,626,866 |
| Clinton County COP, Correctional Facilities Project, 8.125%, 8/01/17. | | 1,665,000 | | 1,692,339 |
| Erie County GO, Sewer District, Series B, NATL Insured, 5.00%, 12/01/35 | | 2,000,000 | | 2,005,540 |
| Erie County IDA School Facility Revenue, City School District of the City of Buffalo Project, Refunding, | | | | |
| Series A, 5.00%, 5/01/28 | | 8,100,000 | | 9,718,947 |
| Hudson Yards Infrastructure Corp. Revenue, | | | | |
| Hudson Yards, Senior, Fiscal 2007, Series A, 5.00%, 2/15/47 | | 40,000,000 | | 40,964,800 |
| Hudson Yards, Senior, Fiscal 2012, Series A, 5.25%, 2/15/47 | | 35,000,000 | | 39,291,350 |
| Series A, AGMC Insured, 5.00%, 2/15/47 | | 15,000,000 | | 15,375,600 |
| Long Island Power Authority Electric System Revenue, | | | | |
| General, Refunding, Series A, 5.00%, 9/01/42 | | 22,000,000 | | 25,311,660 |
| General, Refunding, Series A, 5.00%, 9/01/44 | | 5,000,000 | | 5,852,750 |
| General, Refunding, Series E, BHAC Insured, 5.00%, 12/01/22 | | 9,200,000 | | 9,398,628 |
| General, Series A, BHAC Insured, Pre-Refunded, 5.50%, 5/01/33 | | 5,000,000 | | 5,642,400 |
| General, Series A, Pre-Refunded, 6.00%, 5/01/33 | | 42,000,000 | | 48,127,380 |
| General, Series B, Pre-Refunded, 5.00%, 12/01/35 | | 5,000,000 | | 5,000,000 |
| General, Series C, BHAC Insured, Pre-Refunded, 5.00%, 9/01/35 | | 5,000,000 | | 5,054,500 |
| General, Series C, Pre-Refunded, 5.00%, 9/01/35 | | 16,000,000 | | 16,178,400 |
| Monroe County IDC Revenue, | | | | |
| University of Rochester Project, Refunding, Series A, 5.00%, 7/01/30 | | 3,275,000 | | 4,040,957 |
| University of Rochester Project, Refunding, Series A, 5.00%, 7/01/32 | | 2,000,000 | | 2,451,120 |
| University of Rochester Project, Refunding, Series A, 5.00%, 7/01/37 | | 1,780,000 | | 2,131,372 |
| University of Rochester Project, Series A, 5.00%, 7/01/38 | | 6,350,000 | | 7,298,309 |
| University of Rochester Project, Series B, 5.00%, 7/01/43 | | 5,000,000 | | 5,701,700 |
| MTA Dedicated Tax Fund Revenue, | | | | |
| Green Bonds, Refunding, Series B, Sub Series B-1, 5.00%, 11/15/46 | | 25,000,000 | | 30,179,500 |
| Series A, NATL Insured, Pre-Refunded, 5.00%, 11/15/35 | | 66,430,000 | | 67,793,144 |
| Series A, Pre-Refunded, 5.50%, 11/15/39 | | 22,845,000 | | 25,438,821 |
| Series B, 5.00%, 11/15/34. | | 63,750,000 | | 71,820,112 |
| Series B, NATL Insured, Pre-Refunded, 4.75%, 11/15/26 | | 5,200,000 | | 5,300,880 |
| Series B, NATL Insured, Pre-Refunded, 5.00%, 11/15/31 | | 40,000,000 | | 40,820,800 |
| MTA Revenue, | | | | |
| Transportation, Refunding, Series D, 5.25%, 11/15/40 | | 21,500,000 | | 24,887,540 |
| Transportation, Refunding, Series D, Sub Series D-1, 5.00%, 11/15/34 | | 5,000,000 | | 6,069,700 |
| Transportation, Refunding, Series D, Sub Series D-1, 5.00%, 11/15/35 | | 5,000,000 | | 6,046,250 |
| Transportation, Series A, 5.00%, 11/15/35 | | 43,895,000 | | 44,642,971 |
| Transportation, Series A, 5.00%, 11/15/37 | | 48,000,000 | | 50,520,960 |
| Transportation, Series A, AGMC Insured, 5.50%, 11/15/23 | | 7,460,000 | | 9,489,568 |
| Transportation, Series B, 5.00%, 11/15/37 | | 25,000,000 | | 26,339,000 |
16 Annual Report
franklintempleton.com
FRANKLIN NEW YORK TAX-FREE INCOME FUND
STATEMENT OF INVESTMENTS
| | | | |
| | | Principal | | |
| | | Amount | | Value |
| |
| Municipal Bonds (continued) | | | | |
| New York (continued) | | | | |
| MTA Revenue, (continued) | | | | |
| Transportation, Series B, 5.00%, 11/15/38 | $ | 11,320,000 | $ | 13,400,276 |
| Transportation, Series B, 5.00%, 11/15/43 | | 10,670,000 | | 12,570,540 |
| Transportation, Series C, 6.50%, 11/15/28 | | 3,785,000 | | 4,292,493 |
| Transportation, Series C, 5.00%, 11/15/38 | | 10,000,000 | | 11,837,700 |
| Transportation, Series C, 5.00%, 11/15/42 | | 10,000,000 | | 11,781,200 |
| Transportation, Series C, 5.00%, 11/15/47 | | 16,125,000 | | 18,327,191 |
| Transportation, Series C, Pre-Refunded, 6.50%, 11/15/28 | | 11,215,000 | | 12,745,175 |
| Nassau County GO, | | | | |
| General Improvement, Refunding, Series C, Assured Guaranty, 5.00%, 10/01/30 | | 270,000 | | 302,335 |
| General Improvement, Refunding, Series C, Assured Guaranty, 5.00%, 10/01/31 | | 285,000 | | 318,143 |
| General Improvement, Refunding, Series C, Assured Guaranty, 5.125%, 10/01/35. | | 1,275,000 | | 1,424,456 |
| General Improvement, Refunding, Series C, Assured Guaranty, 5.25%, 10/01/39 | | 1,320,000 | | 1,475,496 |
| General Improvement, Series C, AGMC Insured, 5.00%, 4/01/43 | | 26,665,000 | | 30,860,738 |
| General Improvement, Series C, Assured Guaranty, Pre-Refunded, 5.00%, 10/01/30 | | 5,465,000 | | 6,178,674 |
| General Improvement, Series C, Assured Guaranty, Pre-Refunded, 5.00%, 10/01/31 | | 5,740,000 | | 6,489,587 |
| General Improvement, Series C, Assured Guaranty, Pre-Refunded, 5.125%, 10/01/35 | | 25,935,000 | | 29,427,666 |
| General Improvement, Series C, Assured Guaranty, Pre-Refunded, 5.25%, 10/01/39 | | 26,870,000 | | 30,598,212 |
| Sewer and Storm Water Resources District, Series D, Assured Guaranty, 5.25%, 10/01/39. | | 7,620,000 | | 8,488,832 |
| Nassau County Sewer and Storm Water Finance Authority System Revenue, Series A, BHAC Insured, | | | | |
| Pre-Refunded, 5.375%, 11/01/28 | | 2,000,000 | | 2,215,000 |
| New York City Educational Construction Fund Revenue, | | | | |
| Series A, 5.75%, 4/01/41 | | 20,000,000 | | 23,769,200 |
| Series A, BHAC Insured, 5.00%, 4/01/37 | | 19,750,000 | | 20,361,065 |
| New York City GO, | | | | |
| Citysavers, Series B, zero cpn., 6/01/16 | | 1,030,000 | | 1,107,250 |
| Citysavers, Series B, zero cpn., 12/01/16 | | 1,030,000 | | 1,103,326 |
| Citysavers, Series B, zero cpn., 6/01/17 | | 1,030,000 | | 1,097,187 |
| Citysavers, Series B, zero cpn., 12/01/17 | | 1,030,000 | | 1,089,895 |
| Citysavers, Series B, zero cpn., 6/01/18 | | 1,030,000 | | 1,083,292 |
| Citysavers, Series B, zero cpn., 12/01/18 | | 1,005,000 | | 1,047,833 |
| Citysavers, Series B, zero cpn., 6/01/19 | | 1,030,000 | | 1,063,207 |
| Citysavers, Series B, zero cpn., 12/01/19 | | 1,030,000 | | 1,056,028 |
| Citysavers, Series B, zero cpn., 6/01/20 | | 10,000,000 | | 9,446,700 |
| Fiscal 2002, Series D, 5.50%, 6/01/24 | | 145,000 | | 145,571 |
| Fiscal 2007, Refunding, Series A, AGMC Insured, 5.00%, 8/01/26 | | 9,450,000 | | 9,517,662 |
| Fiscal 2009, Series J, Sub Series J-1, 5.00%, 5/15/33 | | 19,500,000 | | 21,521,565 |
| Fiscal 2010, Refunding, Series C, 5.00%, 8/01/25 | | 7,575,000 | | 8,492,787 |
| Fiscal 2010, Refunding, Series C, 5.00%, 8/01/26 | | 2,190,000 | | 2,453,873 |
| Fiscal 2012, Refunding, Series I, 5.00%, 8/01/26 | | 11,000,000 | | 13,221,560 |
| Fiscal 2012, Refunding, Series I, 5.00%, 8/01/27 | | 10,000,000 | | 12,013,100 |
| Fiscal 2013, Series A, Sub Series A-1, 5.00%, 10/01/29 | | 7,355,000 | | 8,809,966 |
| Fiscal 2014, Refunding, Series J, 5.00%, 8/01/32 | | 10,000,000 | | 12,072,700 |
| Fiscal 2015, Refunding, Series C, 5.00%, 8/01/29 | | 20,640,000 | | 25,247,054 |
| Fiscal 2015, Refunding, Series C, 5.00%, 8/01/31 | | 10,000,000 | | 12,152,800 |
| Fiscal 2015, Refunding, Series C, 5.00%, 8/01/32 | | 4,000,000 | | 4,847,120 |
| Fiscal 2015, Refunding, Series C, 5.00%, 8/01/33 | | 3,000,000 | | 3,619,620 |
| Fiscal 2015, Refunding, Series C, 5.00%, 8/01/34 | | 1,500,000 | | 1,803,300 |
| Refunding, Series C, 5.00%, 8/01/32 | | 5,000,000 | | 6,148,800 |
| Refunding, Series D, 5.125%, 8/01/19 | | 10,000 | | 10,035 |
| Refunding, Series G, AMBAC Insured, 5.00%, 8/01/22 | | 10,000 | | 10,035 |
| Series E, Sub Series E-1, 6.00%, 10/15/23 | | 5,155,000 | | 5,784,735 |
| Series E, Sub Series E-1, 6.25%, 10/15/28 | | 260,000 | | 292,955 |
| Series E, Sub Series E-1, Pre-Refunded, 6.00%, 10/15/23 | | 1,845,000 | | 2,067,138 |
| Series E, Sub Series E-1, Pre-Refunded, 6.25%, 10/15/28 | | 9,740,000 | | 10,969,578 |
franklintempleton.com
Annual Report
17
FRANKLIN NEW YORK TAX-FREE INCOME FUND
STATEMENT OF INVESTMENTS
| | | | |
| | | Principal | | |
| | | Amount | | Value |
| |
| Municipal Bonds (continued) | | | | |
| New York (continued) | | | | |
| New York City GO, (continued) | | | | |
| Series I, Sub Series I-1, 5.375%, 4/01/36 | $ | 14,510,000 | $ | 16,167,622 |
| Series I, Sub Series I-1, Pre-Refunded, 5.375%, 4/01/36 | | 2,990,000 | | 3,358,248 |
| Series J, Sub Series J-1, AMBAC Insured, Pre-Refunded, 5.00%, 6/01/23 | | 20,000,000 | | 20,000,000 |
| Sub Series D-1, 5.125%, 12/01/28 | | 4,165,000 | | 4,430,769 |
| Sub Series D-1, Pre-Refunded, 5.125%, 12/01/28 | | 6,065,000 | | 6,462,318 |
| New York City HDC, | | | | |
| MFHR, Series A-1, 4.80%, 11/01/35. | | 5,610,000 | | 6,108,897 |
| MFHR, Series C-1, 5.25%, 11/01/29 | | 6,110,000 | | 6,796,275 |
| MFHR, Series C-1, 5.50%, 11/01/34 | | 3,000,000 | | 3,356,010 |
| MFHR, Series C-1, 5.55%, 11/01/39 | | 3,300,000 | | 3,690,786 |
| MFHR, Series C-1, 5.70%, 11/01/46 | | 12,500,000 | | 14,020,250 |
| New York City IDAR, Yankee Stadium Project, Pilot, Assured Guaranty, 7.00%, 3/01/49 | | 19,000,000 | | 22,027,460 |
| New York City Municipal Water Finance Authority Water and Sewer System Revenue, | | | | |
| Fiscal 2006, Series D, AGMC Insured, 5.00%, 6/15/38 | | 59,000,000 | | 59,202,370 |
| Fiscal 2008, Refunding, Series A, 5.00%, 6/15/38 | | 52,000,000 | | 54,231,840 |
| Fiscal 2009, Series A, 5.75%, 6/15/40 | | 5,100,000 | | 5,616,885 |
| Fiscal 2009, Series A, Pre-Refunded, 5.75%, 6/15/40 | | 1,450,000 | | 1,593,855 |
| Second General Resolution, Fiscal 2008, Refunding, Series AA, 5.00%, 6/15/37 | | 20,860,000 | | 21,757,606 |
| Second General Resolution, Fiscal 2009, Refunding, Series GG-1, 5.00%, 6/15/39 | | 33,115,000 | | 36,946,737 |
| Second General Resolution, Fiscal 2011, Refunding, Series EE, 5.375%, 6/15/43 | | 39,150,000 | | 45,943,308 |
| Second General Resolution, Fiscal 2013, Series BB, 5.00%, 6/15/47 | | 15,000,000 | | 17,503,050 |
| Second General Resolution, Refunding, Series AA, 4.75%, 6/15/37 | | 18,145,000 | | 18,171,129 |
| Second General Resolution, Series AA, Pre-Refunded, 4.75%, 6/15/37 | | 21,855,000 | | 21,886,034 |
| New York City Transitional Finance Authority Building Aid Revenue, | | | | |
| Fiscal 2007, Series S-1, NATL Insured, 5.00%, 7/15/31 | | 8,200,000 | | 8,402,048 |
| Fiscal 2007, Series S-2, NATL Insured, 5.00%, 1/15/37 | | 22,000,000 | | 22,517,220 |
| Fiscal 2008, Refunding, Series S-1, 5.00%, 1/15/34 | | 75,000,000 | | 79,598,250 |
| Fiscal 2008, Series S-1, 5.00%, 1/15/27 | | 10,000,000 | | 10,674,900 |
| Fiscal 2009, Series S-1, 5.75%, 7/15/38 | | 30,000,000 | | 32,963,400 |
| Fiscal 2009, Series S-2, 6.00%, 7/15/38 | | 50,000,000 | | 55,200,000 |
| Fiscal 2009, Series S-3, 5.25%, 1/15/39 | | 29,485,000 | | 32,463,280 |
| Fiscal 2009, Series S-4, 5.75%, 1/15/39 | | 30,000,000 | | 33,555,000 |
| Fiscal 2009, Series S-5, 5.25%, 1/15/39 | | 31,730,000 | | 34,935,047 |
| New York City Transitional Finance Authority Revenue, | | | | |
| Future Tax Secured, Fiscal 2010, sub. bond, Series A, Sub Series A-1, 5.00%, 5/01/34 | | 17,520,000 | | 19,370,988 |
| Future Tax Secured, Fiscal 2010, sub. bond, Series A, Sub Series A-1, 5.00%, 5/01/38 | | 20,000,000 | | 22,040,600 |
| Future Tax Secured, Fiscal 2010, sub. bond, Series A, Sub Series A-1, Pre-Refunded, 5.00%, | | | | |
| 5/01/34 | | 2,480,000 | | 2,770,730 |
| Future Tax Secured, Fiscal 2011, sub. bond, Series C, 5.00%, 11/01/39 | | 17,250,000 | | 19,682,767 |
| Future Tax Secured, Fiscal 2012, sub. bond, Series E, Sub Series E-1, 5.00%, 2/01/37 | | 10,000,000 | | 11,662,000 |
| Future Tax Secured, Fiscal 2013, sub. bond, Series F, Sub Series F-1, 5.00%, 2/01/34 | | 5,000,000 | | 5,931,000 |
| Future Tax Secured, Fiscal 2013, sub. bond, Series F, Sub Series F-1, 5.00%, 2/01/36 | | 8,250,000 | | 9,668,175 |
| Future Tax Secured, Fiscal 2013, sub. bond, Series I, 5.00%, 5/01/42 | | 45,000,000 | | 51,944,400 |
| Future Tax Secured, Fiscal 2014, sub. bond, Series D, Sub Series D-1, 5.00%, 2/01/38 | | 17,000,000 | | 20,298,850 |
| Future Tax Secured, Fiscal 2014, sub. bond, Series D, Sub Series D-1, 5.00%, 2/01/39 | | 24,135,000 | | 28,669,001 |
| Future Tax Secured, Fiscal 2014, sub. bond, Series D, Sub Series D-1, 5.00%, 2/01/40 | | 18,300,000 | | 21,639,018 |
| Future Tax Secured, Fiscal 2015, sub. bond, Series A, Sub Series A-1, 5.00%, 8/01/34 | | 5,115,000 | | 6,200,710 |
| Future Tax Secured, Fiscal 2015, sub. bond, Series B, Sub Series B-1, 5.00%, 8/01/34 | | 5,000,000 | | 6,061,300 |
| Future Tax Secured, Fiscal 2015, sub. bond, Series E, Sub Series E-1, 5.00%, 2/01/34 | | 10,000,000 | | 12,065,400 |
| Future Tax Secured, Fiscal 2015, sub. bond, Series E, Sub Series E-1, 5.00%, 2/01/35 | | 10,000,000 | | 12,022,000 |
18 Annual Report
franklintempleton.com
FRANKLIN NEW YORK TAX-FREE INCOME FUND
STATEMENT OF INVESTMENTS
| | | | |
| | | Principal | | |
| | | Amount | | Value |
| |
| Municipal Bonds (continued) | | | | |
| New York (continued) | | | | |
| New York Liberty Development Corp. Liberty Revenue, | | | | |
| One World Trade Center, Port Authority Consolidated, Secured, 5.25%, 12/15/43 | $ | 50,000,000 | $ | 58,528,500 |
| Second Priority, Bank of America Tower at One Bryant Park Project, Class 2, Refunding, 5.625%, | | | | |
| 7/15/47 | | 17,500,000 | | 20,145,125 |
| Seven World Trade Center Project, Refunding, 5.00%, 9/15/40 | | 18,000,000 | | 20,902,680 |
| New York Liberty Development Corp. Revenue, | | | | |
| Goldman Sachs Headquarters Issue, 5.25%, 10/01/35 | | 86,360,000 | | 110,710,929 |
| Goldman Sachs Headquarters Issue, 5.50%, 10/01/37 | | 27,000,000 | | 35,647,830 |
| New York State Dormitory Authority Lease Revenues, | | | | |
| Delaware Chenango Madison Otsego Board of Cooperative Education Services, XLCA Insured, | | | | |
| Pre-Refunded, 5.00%, 8/15/27 | | 10,000,000 | | 10,522,800 |
| State University Dormitory Facilities Issue, Series A, 5.00%, 7/01/39 | | 7,250,000 | | 7,975,870 |
| Third General Resolution, State University Educational Facilities Issue, Refunding, Series A, 5.00%, | | | | |
| 5/15/28 | | 4,000,000 | | 4,763,920 |
| Third General Resolution, State University Educational Facilities Issue, Refunding, Series A, 5.00%, | | | | |
| 5/15/29 | | 3,000,000 | | 3,567,300 |
| Third General Resolution, State University Educational Facilities Issue, Refunding, Series A, 5.00%, | | | | |
| 5/15/30 | | 1,000,000 | | 1,185,360 |
| New York State Dormitory Authority Revenues, | | | | |
| 853 Schools Program, Issue 2, Series E, AMBAC Insured, 5.75%, 7/01/19 | | 685,000 | | 687,343 |
| Mental Health Services Facilities Improvement, Refunding, Series A, 5.00%, 8/15/22. | | 5,740,000 | | 6,661,385 |
| Mortgage Hospital, Montefiore Medical Center, FGIC Insured, 5.00%, 8/01/33 | | 11,000,000 | | 11,019,470 |
| Mortgage Hospital, Montefiore Medical Center, NATL Insured, 5.00%, 8/01/29 | | 5,995,000 | | 6,005,611 |
| Non-State Supported Debt, Albany Public Library, AMBAC Insured, 5.00%, 7/01/37 | | 10,720,000 | | 10,969,562 |
| Non-State Supported Debt, Brooklyn Law School, Refunding, 5.75%, 7/01/33 | | 3,750,000 | | 4,226,363 |
| Non-State Supported Debt, Columbia University, Series A-2, 5.00%, 10/01/46 | | 10,000,000 | | 14,634,400 |
| Non-State Supported Debt, Columbia University, Series A-2, 5.00%, 10/01/46 | | 1,500,000 | | 1,838,115 |
| Non-State Supported Debt, Cornell University, Refunding, Series A, 5.00%, 7/01/34 | | 10,000,000 | | 11,141,500 |
| Non-State Supported Debt, Cornell University, Refunding, Series A, 5.00%, 7/01/39 | | 22,000,000 | | 24,462,020 |
| Non-State Supported Debt, Educational Housing Services, CUNY Student Housing Project, AMBAC | | | | |
| Insured, 5.25%, 7/01/30 | | 5,150,000 | | 6,527,316 |
| Non-State Supported Debt, Fashion Institute of Technology Student Housing Corp., NATL Insured, | | | | |
| 5.25%, 7/01/34 | | 13,220,000 | | 16,020,789 |
| Non-State Supported Debt, Fordham University, Series B, Assured Guaranty, Pre-Refunded, 5.00%, | | | | |
| 7/01/33 | | 11,000,000 | | 11,954,800 |
| Non-State Supported Debt, Fordham University, Series B, Assured Guaranty, Pre-Refunded, 5.00%, | | | | |
| 7/01/38 | | 5,000,000 | | 5,434,000 |
| Non-State Supported Debt, Health Quest Systems, Series A, Assured Guaranty, 5.25%, 7/01/27 | | 1,500,000 | | 1,567,995 |
| Non-State Supported Debt, Health Quest Systems, Series B, Assured Guaranty, 5.25%, 7/01/27 | | 2,500,000 | | 2,613,325 |
| Non-State Supported Debt, Health Quest Systems, Series B, Assured Guaranty, 5.125%, 7/01/37 | | 3,000,000 | | 3,118,110 |
| Non-State Supported Debt, Hospital for Special Surgery, FHA Insured, 6.25%, 8/15/34 | | 3,705,000 | | 4,308,359 |
| Non-State Supported Debt, Hospital for Special Surgery, FHA Insured, 6.00%, 8/15/38 | | 3,250,000 | | 3,741,563 |
| Non-State Supported Debt, Mortgage Hospital, Montefiore Medical Center, FHA Insured, 5.00%, | | | | |
| 8/01/24 | | 2,500,000 | | 2,630,925 |
| Non-State Supported Debt, Mortgage Hospital, Montefiore Medical Center, FHA Insured, 5.00%, | | | | |
| 2/01/28 | | 10,060,000 | | 10,077,806 |
| Non-State Supported Debt, Mount Sinai School of Medicine of New York University, NATL Insured, | | | | |
| Pre-Refunded, 5.00%, 7/01/35 | | 10,000,000 | | 10,464,200 |
| Non-State Supported Debt, Municipal Health Facilities Improvement Program, Lease, New York City | | | | |
| Issue, Refunding, Series 2, Sub Series 2-4, 5.00%, 1/15/27 | | 5,000,000 | | 5,308,250 |
| Non-State Supported Debt, Municipal Health Facilities Improvement Program, Lease, New York City | | | | |
| Issue, Refunding, Series 2, Sub Series 2-4, 5.00%, 1/15/28 | | 5,000,000 | | 5,301,600 |
| Non-State Supported Debt, Municipal Health Facilities Improvement Program, Lease, New York City | | | | |
| Issue, Refunding, Series 2, Sub Series 2-5, 5.00%, 1/15/32 | | 20,000,000 | | 21,156,600 |
franklintempleton.com
Annual Report
19
FRANKLIN NEW YORK TAX-FREE INCOME FUND
STATEMENT OF INVESTMENTS
| | | | |
| | | Principal | | |
| | | Amount | | Value |
| |
| Municipal Bonds (continued) | | | | |
| New York (continued) | | | | |
| New York State Dormitory Authority Revenues, (continued) | | | | |
| Non-State Supported Debt, The New School, 5.50%, 7/01/40 | $ | 10,000,000 | $ | 11,572,100 |
| Non-State Supported Debt, The New School, AGMC Insured, 5.50%, 7/01/43 | | 13,000,000 | | 15,049,320 |
| Non-State Supported Debt, The New School, NATL Insured, Pre-Refunded, 5.00%, 7/01/46 | | 12,000,000 | | 12,041,160 |
| Non-State Supported Debt, The New School, Refunding, Series A, 5.00%, 7/01/40 | | 5,500,000 | | 6,444,625 |
| Non-State Supported Debt, The New School, Refunding, Series A, 5.00%, 7/01/45 | | 8,500,000 | | 9,915,505 |
| Non-State Supported Debt, The New York Hospital Medical Center of Queens, FHA Insured, 4.75%, | | | | |
| 2/15/37 | | 4,890,000 | | 5,011,272 |
| Non-State Supported Debt, New York University, Refunding, Series A, 5.00%, 7/01/45 | | 5,000,000 | | 5,933,550 |
| Non-State Supported Debt, New York University, Series A, 5.00%, 7/01/37 | | 7,000,000 | | 8,275,190 |
| Non-State Supported Debt, New York University, Series A, 5.00%, 7/01/39 | | 20,000,000 | | 22,104,000 |
| Non-State Supported Debt, New York University, Series A, 5.00%, 7/01/42 | | 10,000,000 | | 11,584,600 |
| Non-State Supported Debt, New York University, Series A, AMBAC Insured, Pre-Refunded, 5.00%, | | | | |
| 7/01/26 | | 5,475,000 | | 5,729,149 |
| Non-State Supported Debt, New York University, Series A, AMBAC Insured, Pre-Refunded, 5.00%, | | | | |
| 7/01/27 | | 5,470,000 | | 5,723,917 |
| Non-State Supported Debt, New York University, Series A, AMBAC Insured, Pre-Refunded, 5.00%, | | | | |
| 7/01/32 | | 5,000,000 | | 5,232,100 |
| Non-State Supported Debt, New York University, Series A, AMBAC Insured, Pre-Refunded, 5.00%, | | | | |
| 7/01/37 | | 10,000,000 | | 10,464,200 |
| Non-State Supported Debt, New York University, Series A, Pre-Refunded, 5.00%, 7/01/38 | | 27,800,000 | | 30,183,016 |
| Non-State Supported Debt, New York University, Series B, 5.00%, 7/01/39 | | 19,650,000 | | 21,710,892 |
| Non-State Supported Debt, New York University, Series B, Pre-Refunded, 5.00%, 7/01/38 | | 26,995,000 | | 29,309,011 |
| Non-State Supported Debt, New York University, Series B, Pre-Refunded, 5.25%, 7/01/48 | | 49,665,000 | | 54,177,562 |
| Non-State Supported Debt, New York University, Series C, Pre-Refunded, 5.00%, 7/01/38 | | 25,000,000 | | 27,143,000 |
| Non-State Supported Debt, New York University Hospitals Center, Refunding, 5.00%, 7/01/27 | | 2,025,000 | | 2,470,966 |
| Non-State Supported Debt, New York University Hospitals Center, Refunding, 5.00%, 7/01/30 | | 1,000,000 | | 1,206,990 |
| Non-State Supported Debt, New York University Hospitals Center, Refunding, 5.00%, 7/01/32 | | 1,000,000 | | 1,198,800 |
| Non-State Supported Debt, New York University Hospitals Center, Refunding, 5.00%, 7/01/34 | | 7,250,000 | | 8,614,812 |
| Non-State Supported Debt, North Shore-Long Island Jewish Obligated Group, Refunding, Series A, | | | | |
| 5.00%, 5/01/22 | | 2,300,000 | | 2,548,929 |
| Non-State Supported Debt, North Shore-Long Island Jewish Obligated Group, Refunding, Series A, | | | | |
| 5.00%, 5/01/36 | | 11,000,000 | | 12,896,510 |
| Non-State Supported Debt, North Shore-Long Island Jewish Obligated Group, Refunding, Series E, | | | | |
| 5.00%, 5/01/21 | | 3,090,000 | | 3,415,532 |
| Non-State Supported Debt, North Shore-Long Island Jewish Obligated Group, Refunding, Series E, | | | | |
| 5.00%, 5/01/23 | | 2,150,000 | | 2,380,416 |
| Non-State Supported Debt, North Shore-Long Island Jewish Obligated Group, Refunding, Series E, | | | | |
| 5.50%, 5/01/33 | | 3,000,000 | | 3,343,260 |
| Non-State Supported Debt, North Shore-Long Island Jewish Obligated Group, Series A, Pre- | | | | |
| Refunded, 5.25%, 5/01/30 | | 8,750,000 | | 9,825,025 |
| Non-State Supported Debt, North Shore-Long Island Jewish Obligated Group, Series A, Pre- | | | | |
| Refunded, 5.50%, 5/01/30 | | 3,000,000 | | 3,390,060 |
| Non-State Supported Debt, North Shore-Long Island Jewish Obligated Group, Series A, Pre- | | | | |
| Refunded, 5.00%, 5/01/32 | | 6,250,000 | | 6,496,562 |
| Non-State Supported Debt, North Shore-Long Island Jewish Obligated Group, Series A, Pre- | | | | |
| Refunded, 5.50%, 5/01/37 | | 13,000,000 | | 14,690,260 |
| Non-State Supported Debt, North Shore-Long Island Jewish Obligated Group, Series B, 5.00%, | | | | |
| 5/01/39 | | 10,000,000 | | 11,213,800 |
| Non-State Supported Debt, North Shore-Long Island Jewish Obligated Group, Series E, Pre- | | | | |
| Refunded, 5.00%, 5/01/21 | | 2,500,000 | | 2,789,250 |
| Non-State Supported Debt, NYU Hospitals Center, Refunding, Series A, 5.00%, 7/01/28 | | 1,400,000 | | 1,726,914 |
| Non-State Supported Debt, NYU Hospitals Center, Refunding, Series A, 5.00%, 7/01/30 | | 1,210,000 | | 1,482,819 |
| Non-State Supported Debt, NYU Hospitals Center, Series A, Pre-Refunded, 6.00%, 7/01/40 | | 4,500,000 | | 5,390,820 |
20 Annual Report
franklintempleton.com
FRANKLIN NEW YORK TAX-FREE INCOME FUND
STATEMENT OF INVESTMENTS
| | | | |
| | | Principal | | |
| | | Amount | | Value |
| |
| Municipal Bonds (continued) | | | | |
| New York (continued) | | | | |
| New York State Dormitory Authority Revenues, (continued) | | | | |
| Non-State Supported Debt, Pratt Institute, Series C, Assured Guaranty, 5.00%, 7/01/29. | $ | 3,775,000 | $ | 4,169,714 |
| Non-State Supported Debt, Residential Institutions for Children, 5.00%, 6/01/38 | | 5,000,000 | | 5,362,050 |
| Non-State Supported Debt, School District Financing Program, Refunding, Series A, AGMC Insured, | | | | |
| 5.00%, 10/01/22. | | 7,645,000 | | 8,337,484 |
| Non-State Supported Debt, School Districts Financing Program, Refunding, Series C, Assured | | | | |
| Guaranty, 5.00%, 10/01/31 | | 4,000,000 | | 4,443,080 |
| Non-State Supported Debt, School Districts Financing Program, Refunding, Series C, Assured | | | | |
| Guaranty, 5.125%, 10/01/36 | | 5,000,000 | | 5,480,150 |
| Non-State Supported Debt, School Districts Financing Program, Series A, AGMC Insured, 5.00%, | | | | |
| 10/01/21 | | 5,000,000 | | 5,755,500 |
| Non-State Supported Debt, School Districts Financing Program, Series A, AGMC Insured, 5.00%, | | | | |
| 10/01/22 | | 7,145,000 | | 8,273,481 |
| Non-State Supported Debt, School Districts Financing Program, Series A, AGMC Insured, 5.00%, | | | | |
| 10/01/24 | | 12,730,000 | | 14,740,576 |
| Non-State Supported Debt, School Districts Financing Program, Series A, Assured Guaranty, | | | | |
| 5.625%, 10/01/29 | | 3,000,000 | | 3,438,090 |
| Non-State Supported Debt, School Districts Financing Program, Series C, AGMC Insured, 5.00%, | | | | |
| 10/01/32 | | 5,000,000 | | 5,247,400 |
| Non-State Supported Debt, School Districts Financing Program, Series C, AGMC Insured, 5.00%, | | | | |
| 10/01/37 | | 6,550,000 | | 6,860,797 |
| Non-State Supported Debt, St. John’s University, Refunding, Series A, 5.00%, 7/01/26 | | 2,400,000 | | 2,954,640 |
| Non-State Supported Debt, St. John’s University, Refunding, Series A, 5.00%, 7/01/27 | | 650,000 | | 792,435 |
| Non-State Supported Debt, St. John’s University, Refunding, Series A, 5.00%, 7/01/29 | | 1,375,000 | | 1,661,289 |
| Non-State Supported Debt, St. John’s University, Refunding, Series A, 5.00%, 7/01/30 | | 1,675,000 | | 2,014,673 |
| Non-State Supported Debt, St. John’s University, Refunding, Series A, 5.00%, 7/01/31 | | 3,700,000 | | 4,430,380 |
| Non-State Supported Debt, St. John’s University, Refunding, Series A, 5.00%, 7/01/34 | | 2,000,000 | | 2,368,100 |
| Non-State Supported Debt, State University Facilities, Refunding, Series A, 5.00%, 7/01/38 | | 5,000,000 | | 5,736,300 |
| Non-State Supported Debt, State University Facilities, Refunding, Series A, 5.00%, 7/01/43 | | 4,150,000 | | 4,729,548 |
| Non-State Supported Debt, Student Housing Corp., NATL Insured, 5.25%, 7/01/26 | | 6,105,000 | | 7,198,772 |
| Non-State Supported Debt, University of Rochester, Series A, 5.125%, 7/01/39 | | 10,500,000 | | 11,643,870 |
| Non-State Supported Debt, Vassar College, 5.00%, 7/01/49 | | 11,000,000 | | 12,304,270 |
| Secondarily Insured, Lease, State University, AMBAC Insured, Pre-Refunded, 5.00%, 7/01/32 | | 5,000,000 | | 5,234,850 |
| Secondarily Insured, State University Educational Facilities, Third General Resolution, Refunding, | | | | |
| Series A, Assured Guaranty, 5.50%, 5/15/22 | | 5,000,000 | | 6,166,400 |
| State Supported Debt, Lease, State University Dormitory Facilities Issue, Refunding, Series A, | | | | |
| 5.00%, 7/01/37 | | 25,000,000 | | 28,915,250 |
| State Supported Debt, Lease, State University Dormitory Facilities Issue, Refunding, Series A, | | | | |
| 5.00%, 7/01/42 | | 15,000,000 | | 17,211,300 |
| State Supported Debt, Lease, State University Dormitory Facilities Issue, Series A, 5.00%, 7/01/38 | | 10,785,000 | | 11,545,019 |
| State Supported Debt, Lease, State University Dormitory Facilities Issue, Series A, NATL Insured, | | | | |
| Pre-Refunded, 5.00%, 7/01/36 | | 4,670,000 | | 4,686,579 |
| State Supported Debt, Lease, State University Dormitory Facilities Issue, Series A, Pre-Refunded, | | | | |
| 5.00%, 7/01/33 | | 14,210,000 | | 15,443,428 |
| State Supported Debt, Mental Health Services Facilities Improvement, Series A, AGMC Insured, | | | | |
| 5.00%, 2/15/32 | | 2,190,000 | | 2,250,773 |
| State Supported Debt, Mental Health Services Facilities Improvement, Series A, AGMC Insured, | | | | |
| 5.00%, 2/15/33 | | 9,000,000 | | 9,748,440 |
| State Supported Debt, Mental Health Services Facilities Improvement, Series A, AGMC Insured, | | | | |
| 5.00%, 2/15/38 | | 22,245,000 | | 24,018,816 |
| State Supported Debt, Mental Health Services Facilities Improvement, Series A, AGMC Insured, | | | | |
| Pre-Refunded, 5.00%, 2/15/32 | | 25,810,000 | | 26,609,336 |
| State Supported Debt, Mental Health Services Facilities Improvement, Series A, AGMC Insured, | | | | |
| Pre-Refunded, 5.00%, 2/15/33 | | 5,000 | | 5,458 |
franklintempleton.com
Annual Report
21
FRANKLIN NEW YORK TAX-FREE INCOME FUND
STATEMENT OF INVESTMENTS
| | | | |
| | | Principal | | |
| | | Amount | | Value |
| |
| Municipal Bonds (continued) | | | | |
| New York (continued) | | | | |
| New York State Dormitory Authority Revenues, (continued) | | | | |
| State Supported Debt, Mental Health Services Facilities Improvement, Series A, AGMC Insured, | | | | |
| Pre-Refunded, 5.00%, 2/15/38 | $ | 15,000 | $ | 16,374 |
| State Supported Debt, Mental Health Services Facilities Improvement, Series B, 5.00%, 2/15/33 | | 4,990,000 | | 5,007,964 |
| State Supported Debt, Mental Health Services Facilities Improvement, Series B, AGMC Insured, | | | | |
| 5.00%, 2/15/33 | | 4,275,000 | | 4,630,509 |
| State Supported Debt, Mental Health Services Facilities Improvement, Series B, AGMC Insured, | | | | |
| Pre-Refunded, 5.00%, 2/15/32 | | 8,680,000 | | 8,948,820 |
| State Supported Debt, Upstate Community Colleges, Series C, 6.00%, 7/01/31 | | 20,000,000 | | 22,593,200 |
| New York State Dormitory Authority Sales Tax Revenue, | | | | |
| Series B, 5.00%, 3/15/40 | | 12,640,000 | | 15,277,968 |
| Series B, 5.00%, 3/15/41 | | 10,520,000 | | 12,696,167 |
| State Supported Debt, Series A, 5.00%, 3/15/29 | | 12,480,000 | | 15,327,312 |
| State Supported Debt, Series A, 5.00%, 3/15/30 | | 18,415,000 | | 22,526,701 |
| State Supported Debt, Series A, 5.00%, 3/15/31 | | 15,685,000 | | 19,123,779 |
| State Supported Debt, Series A, 5.00%, 3/15/43 | | 16,675,000 | | 19,362,176 |
| State Supported Debt, Series A, 5.00%, 3/15/44 | | 37,250,000 | | 44,145,347 |
| New York State Dormitory Authority State Personal Income Tax Revenue, | | | | |
| Education, Refunding, Series C, 5.75%, 3/15/32 | | 29,870,000 | | 33,684,100 |
| Education, Series A, 5.00%, 3/15/38 | | 5,000,000 | | 5,492,450 |
| Education, Series A, Pre-Refunded, 5.00%, 3/15/37. | | 49,750,000 | | 51,445,480 |
| Education, Series C, Pre-Refunded, 5.00%, 12/15/31. | | 17,305,000 | | 17,707,860 |
| Education, Series C, Pre-Refunded, 5.75%, 3/15/32 | | 230,000 | | 260,319 |
| Education, Series C, Pre-Refunded, 5.00%, 12/15/35. | | 10,000,000 | | 10,235,600 |
| Education, Series D, Pre-Refunded, 5.00%, 3/15/36. | | 46,500,000 | | 47,101,642 |
| General Purpose, Refunding, Series A, 5.00%, 3/15/31 | | 5,000,000 | | 6,134,850 |
| General Purpose, Series B, 5.00%, 3/15/37 | | 6,915,000 | | 8,145,801 |
| General Purpose, Series C, 5.00%, 3/15/34 | | 10,000,000 | | 11,564,400 |
| Series A, 5.00%, 2/15/34 | | 16,510,000 | | 18,143,830 |
| Series A, 5.00%, 2/15/39 | | 20,685,000 | | 22,645,111 |
| Series A, Pre-Refunded, 5.00%, 2/15/34. | | 15,000 | | 16,624 |
| Series A, Pre-Refunded, 5.00%, 2/15/39. | | 20,000 | | 22,165 |
| New York State Environmental Facilities Corp. State Clean Water and Drinking Water Revenue, | | | | |
| Revolving Funds, New York City Municipal Water Finance Authority Projects, Second Resolution, | | | | |
| Subordinated SRF, Refunding, Series A, 5.00%, 6/15/31 | | 5,000,000 | | 6,130,300 |
| Revolving Funds, New York City Municipal Water Finance Authority Projects, Second Resolution, | | | | |
| Subordinated SRF, Refunding, Series B, 5.00%, 6/15/33 | | 6,510,000 | | 7,021,816 |
| Revolving Funds, New York City Municipal Water Finance Authority Projects, Second Resolution, | | | | |
| Subordinated SRF, Refunding, Series B, 5.00%, 6/15/37 | | 8,010,000 | | 8,619,561 |
| Revolving Funds, New York City Municipal Water Finance Authority Projects, Second Resolution, | | | | |
| Subordinated SRF, Series A, 5.125%, 6/15/38 | | 35,000,000 | | 39,068,750 |
| New York State GO, Series A, 5.00%, 2/15/39 | | 6,000,000 | | 6,571,920 |
| New York State HFA State Personal Income Tax Revenue, | | | | |
| Economic Development and Housing, Series A, Pre-Refunded, 5.00%, 3/15/34 | | 10,000,000 | | 10,562,900 |
| Economic Development and Housing, Series A, Pre-Refunded, 5.00%, 3/15/38 | | 15,000,000 | | 15,844,350 |
| New York State HFAR, | | | | |
| Affordable Housing, Series B, 4.50%, 11/01/29 | | 1,500,000 | | 1,570,785 |
| Affordable Housing, Series B, 4.85%, 11/01/41 | | 8,500,000 | | 8,877,060 |
| Children’s Rescue Fund Housing, Series A, 7.625%, 5/01/18 | | 860,000 | | 864,773 |
| Housing Project Mortgage, Refunding, Series A, AGMC Insured, 6.125%, 11/01/20. | | 130,000 | | 130,571 |
| New York State Medical Care Facilities Finance Agency Revenue, Security Mortgage, 2008, Series A, | | | | |
| 6.375%, 11/15/20 | | 1,580,000 | | 1,586,794 |
| New York State Power Authority Revenue, Series A, NATL Insured, 5.00%, 11/15/47 | | 10,000,000 | | 10,485,300 |
22 Annual Report
franklintempleton.com
FRANKLIN NEW YORK TAX-FREE INCOME FUND
STATEMENT OF INVESTMENTS
| | | | |
| | | Principal | | |
| | | Amount | | Value |
| |
| Municipal Bonds (continued) | | | | |
| New York (continued) | | | | |
| New York State Thruway Authority General Junior Indebtedness Obligations Revenue, junior lien, Series A, | | | | |
| 5.00%, 1/01/46 | $ | 25,000,000 | $ | 29,523,000 |
| New York State Thruway Authority General Revenue, | | | | |
| Refunding, Series H, AGMC Insured, 5.00%, 1/01/32 | | 10,000,000 | | 10,587,200 |
| Refunding, Series H, NATL Insured, 5.00%, 1/01/37 | | 54,810,000 | | 57,754,393 |
| Refunding, Series I, 5.00%, 1/01/37 | | 21,250,000 | | 24,793,862 |
| Series H, AGMC Insured, 5.00%, 1/01/37 | | 10,000,000 | | 10,546,800 |
| Series I, 5.00%, 1/01/42 | | 45,000,000 | | 52,013,700 |
| New York State Thruway Authority Second General Highway and Bridge Trust Fund Revenue, | | | | |
| Refunding, Series A, 5.00%, 4/01/29 | | 10,000,000 | | 11,921,300 |
| Series A, 5.00%, 4/01/27 | | 27,000,000 | | 32,303,880 |
| Series A, 5.00%, 4/01/28 | | 11,600,000 | | 13,850,168 |
| Series A, 5.00%, 4/01/30 | | 9,000,000 | | 10,663,020 |
| Series A, 5.00%, 4/01/31 | | 10,250,000 | | 12,106,480 |
| Series A, 5.00%, 4/01/32 | | 11,100,000 | | 13,070,028 |
| Series A, AGMC Insured, Pre-Refunded, 5.00%, 4/01/24 | | 7,420,000 | | 7,689,717 |
| New York State Urban Development Corp. Revenue, | | | | |
| Empire State Development Corp., Refunding, Series D, 5.625%, 1/01/28 | | 3,780,000 | | 4,232,012 |
| Empire State Development Corp., Series B, 5.00%, 1/01/26 | | 8,830,000 | | 9,584,965 |
| Empire State Development Corp., Series B, 5.00%, 1/01/27 | | 7,730,000 | | 8,380,866 |
| Empire State Development Corp., Series B, 5.00%, 1/01/28 | | 5,460,000 | | 5,913,835 |
| State Personal Income Tax, Series A-1, 5.00%, 12/15/27 | | 1,615,000 | | 1,717,649 |
| State Personal Income Tax, Series A-1, Pre-Refunded, 5.00%, 12/15/27 | | 3,385,000 | | 3,606,074 |
| State Personal Income Tax, State Facilities and Equipment, Series B-1, 5.00%, 3/15/36 | | 10,000,000 | | 11,039,900 |
| Niagara Falls Public Improvement GO, NATL Insured, 6.85%, 3/01/19 | | 5,000 | | 5,020 |
| Orangetown Housing Authority Housing Facilities Revenue, Capital Appreciation, Senior Housing Center | | | | |
| Project, Refunding, NATL Insured, zero cpn., 4/01/30 | | 13,500,000 | | 7,000,290 |
| Oswego County IDA Civic Facility Revenue, Oswego School District Public Library Project, XLCA Insured, | | | | |
| 5.00%, 12/15/30 | | 1,805,000 | | 1,847,526 |
| Port Authority of New York and New Jersey Revenue, | | | | |
| Consolidated, One Hundred Forty-Eighth Series, AGMC Insured, 5.00%, 8/15/34 | | 30,000,000 | | 31,512,600 |
| Consolidated, One Hundred Forty-Eighth Series, AGMC Insured, 5.00%, 8/15/37 | | 74,235,000 | | 77,977,929 |
| Consolidated, One Hundred Sixty-First Series, 5.00%, 10/15/34 | | 25,000,000 | | 28,240,000 |
| Consolidated, One Hundred Sixty-First Series, 5.00%, 10/15/35 | | 29,000,000 | | 32,737,810 |
| Consolidated, One Hundred Sixty-First Series, 5.00%, 10/15/39 | | 25,000,000 | | 28,054,500 |
| Rensselaer City School District COP, School Campus Project, XLCA Insured, 5.00%, 6/01/36 | | 20,240,000 | | 20,272,991 |
| Rockland County IDA Civic Facility Revenue, | | | | |
| Nyack Library Project, Series A, AMBAC Insured, 5.00%, 12/01/32 | | 2,000,000 | | 2,072,900 |
| Nyack Library Project, Series A, AMBAC Insured, 5.00%, 12/01/37 | | 3,320,000 | | 3,426,672 |
| Sales Tax Asset Receivable Corp. Revenue, | | | | |
| Sales Tax Asset, Fiscal 2015, Refunding, Series A, 5.00%, 10/15/27 | | 32,000,000 | | 40,145,920 |
| Sales Tax Asset, Fiscal 2015, Refunding, Series A, 5.00%, 10/15/30 | | 4,900,000 | | 6,074,089 |
| Saratoga County Water Authority Revenue, Water System, Pre-Refunded, 5.00%, 9/01/48 | | 7,225,000 | | 7,898,587 |
| Suffolk County IDA Civic Facility Revenue, New York Institute of Technology Project, Refunding, 5.00%, | | | | |
| 3/01/26. | | 1,995,000 | | 2,033,284 |
| Triborough Bridge and Tunnel Authority Revenues, | | | | |
| General, MTA Bridges and Tunnels, Refunding, Series C, 5.00%, 11/15/33 | | 31,840,000 | | 34,938,987 |
| General, MTA Bridges and Tunnels, Refunding, Series C, 5.00%, 11/15/38 | | 18,375,000 | | 20,083,691 |
| General, MTA Bridges and Tunnels, Series A, Pre-Refunded, 5.00%, 11/15/24 | | 6,965,000 | | 7,401,497 |
| General, MTA Bridges and Tunnels, Series A, Pre-Refunded, 5.00%, 11/15/35 | | 9,155,000 | | 9,342,861 |
| General, MTA Bridges and Tunnels, Series A-2, 5.25%, 11/15/34 | | 10,000,000 | | 11,041,400 |
| General, MTA Bridges and Tunnels, Series B, 5.00%, 11/15/45 | | 5,000,000 | | 6,004,300 |
| General, MTA Bridges and Tunnels, Series C, 5.00%, 11/15/38 | | 5,000,000 | | 5,806,700 |
| General Purpose, Series B, NATL Insured, Pre-Refunded, 5.20%, 1/01/27 | | 5,110,000 | | 6,169,661 |
franklintempleton.com
Annual Report
23
FRANKLIN NEW YORK TAX-FREE INCOME FUND
STATEMENT OF INVESTMENTS
| | | | |
| | | Principal | | |
| | | Amount | | Value |
| |
| Municipal Bonds (continued) | | | | |
| New York (continued) | | | | |
| Triborough Bridge and Tunnel Authority Revenues, (continued) | | | | |
| General Purpose, Series B, Pre-Refunded, 5.20%, 1/01/27 | $ | 15,000,000 | $ | 18,110,550 |
| General Purpose, Series B, Pre-Refunded, 5.50%, 1/01/30 | | 32,185,000 | | 38,931,620 |
| MTA Bridges and Tunnels, sub. bond, Series D, 5.00%, 11/15/31 | | 48,955,000 | | 53,283,601 |
| Troy Capital Resource Corp. Revenue, Rensselaer Polytechnic Institute Project, Series A, 5.125%, 9/01/40. | | 42,500,000 | | 47,840,550 |
| Utility Debt Securitization Authority Revenue, Restructuring, Refunding, Series A, 5.00%, 12/15/35 | | 20,000,000 | | 24,874,400 |
| Western Nassau County Water Authority Water System Revenue, | | | | |
| Series A, 5.00%, 4/01/40 | | 1,400,000 | | 1,645,350 |
| Series A, 5.00%, 4/01/45 | | 2,250,000 | | 2,630,858 |
| Yonkers GO, Series A, AMBAC Insured, Pre-Refunded, 5.00%, 9/01/31. | | 12,490,000 | | 12,629,263 |
| | | | | 4,673,981,482 |
| |
| |
| U.S. Territories 2.0% | | | | |
| Puerto Rico 2.0% | | | | |
| Puerto Rico Electric Power Authority Power Revenue, Series WW, 5.25%, 7/01/33 | | 32,250,000 | | 19,027,500 |
| Puerto Rico Sales Tax FICO Sales Tax Revenue, | | | | |
| first subordinate, Series A, 5.75%, 8/01/37 | | 15,000,000 | | 6,187,500 |
| first subordinate, Series A, 5.50%, 8/01/42 | | 50,000,000 | | 20,375,000 |
| first subordinate, Series A, 6.00%, 8/01/42 | | 90,000,000 | | 36,900,000 |
| first subordinate, Series A, 6.50%, 8/01/44 | | 10,000,000 | | 4,112,500 |
| first subordinate, Series C, 5.50%, 8/01/40 | | 35,000,000 | | 14,262,500 |
| | | | | 100,865,000 |
| Total Municipal Bonds (Cost $4,520,703,100) 94.2% | | | | 4,774,846,482 |
| Other Assets, less Liabilities 5.8% | | | | 295,395,543 |
| Net Assets 100.0% | | | $ | 5,070,242,025 |
See Abbreviations on page 33.
24 Annual Report | The accompanying notes are an integral part of these financial statements.
franklintempleton.com
FRANKLIN NEW YORK TAX-FREE INCOME FUND
Financial Statements
Statement of Assets and Liabilities
May 31, 2016
| | | |
| Assets: | | | |
| Investments in securities: | | | |
| Cost | $ | 4,520,703,100 | |
| Value. | $ | 4,774,846,482 | |
| Cash. | | 237,833,285 | |
| Receivables: | | | |
| Capital shares sold | | 3,320,307 | |
| Interest | | 60,406,447 | |
| Other assets | | 2,697 | |
| Total assets | | 5,076,409,218 | |
| Liabilities: | | | |
| Payables: | | | |
| Capital shares redeemed | | 3,092,017 | |
| Management fees | | 1,922,403 | |
| Distribution fees | | 705,208 | |
| Transfer agent fees | | 256,817 | |
| Accrued expenses and other liabilities. | | 190,748 | |
| Total liabilities | | 6,167,193 | |
| Net assets, at value | $ | 5,070,242,025 | |
| Net assets consist of: | | | |
| Paid-in capital | $ | 4,979,353,542 | |
| Undistributed net investment income | | 6,326,628 | |
| Net unrealized appreciation (depreciation) | | 254,143,382 | |
| Accumulated net realized gain (loss) | | (169,581,527 | ) |
| Net assets, at value | $ | 5,070,242,025 | |
| Class A: | | | |
| Net assets, at value | $ | 4,131,001,739 | |
| Shares outstanding. | | 357,996,181 | |
| Net asset value per sharea | $ | 11.54 | |
| Maximum offering price per share (net asset value per share ÷ 95.75%) | $ | 12.05 | |
| Class C: | | | |
| Net assets, at value | $ | 665,206,394 | |
| Shares outstanding. | | 57,722,373 | |
| Net asset value and maximum offering price per sharea | $ | 11.52 | |
| Advisor Class: | | | |
| Net assets, at value | $ | 274,033,892 | |
| Shares outstanding. | | 23,735,656 | |
| Net asset value and maximum offering price per share | $ | 11.55 | |
aRedemption price is equal to net asset value less contingent deferred sales charges, if applicable.
franklintempleton.com
The accompanying notes are an integral part of these financial statements. | Annual Report 25
FRANKLIN NEW YORK TAX-FREE INCOME FUND
FINANCIAL STATEMENTS
| | | |
| Statement of Operations | | | |
| for the year ended May 31, 2016 | | | |
| |
| Investment income: | | | |
| Interest. | $ | 214,256,308 | |
| Expenses: | | | |
| Management fees (Note 3a) | | 23,216,073 | |
| Distribution fees: (Note 3c) | | | |
| Class A. | | 4,060,284 | |
| Class C | | 4,278,041 | |
| Transfer agent fees: (Note 3e) | | | |
| Class A. | | 1,626,746 | |
| Class C | | 255,196 | |
| Advisor Class | | 103,143 | |
| Custodian fees | | 41,741 | |
| Reports to shareholders | | 132,469 | |
| Registration and filing fees | | 41,747 | |
| Professional fees | | 253,729 | |
| Trustees’ fees and expenses | | 92,462 | |
| Other | | 141,855 | |
| Total expenses | | 34,243,486 | |
| Net investment income | | 180,012,822 | |
| Realized and unrealized gains (losses): | | | |
| Net realized gain (loss) from investments | | 1,203,141 | |
| Net change in unrealized appreciation (depreciation) on investments | | (21,245,206 | ) |
| Net realized and unrealized gain (loss) | | (20,042,065 | ) |
| Net increase (decrease) in net assets resulting from operations | $ | 159,970,757 | |
26 Annual Report | The accompanying notes are an integral part of these financial statements.
franklintempleton.com
FRANKLIN NEW YORK TAX-FREE INCOME FUND
FINANCIAL STATEMENTS
| | | | | | |
| Statements of Changes in Net Assets | | | | | | |
| |
| | | Year Ended May 31, | |
| | | 2016 | | | 2015 | |
| Increase (decrease) in net assets: | | | | | | |
| Operations: | | | | | | |
| Net investment income | $ | 180,012,822 | | $ | 194,607,026 | |
| Net realized gain (loss) | | 1,203,141 | | | (70,223,562 | ) |
| Net change in unrealized appreciation (depreciation) | | (21,245,206 | ) | | 20,920,667 | |
| Net increase (decrease) in net assets resulting from operations | | 159,970,757 | | | 145,304,131 | |
| Distributions to shareholders from: | | | | | | |
| Net investment income: | | | | | | |
| Class A | | (150,390,793 | ) | | (163,963,640 | ) |
| Class C | | (19,989,044 | ) | | (21,368,585 | ) |
| Advisor Class. | | (9,781,804 | ) | | (9,089,171 | ) |
| Total distributions to shareholders | | (180,161,641 | ) | | (194,421,396 | ) |
| Capital share transactions: (Note 2) | | | | | | |
| Class A | | (171,513,592 | ) | | (239,794,285 | ) |
| Class C | | (6,680,297 | ) | | (19,543,871 | ) |
| Advisor Class. | | 3,258,756 | | | 93,131,965 | |
| Total capital share transactions | | (174,935,133 | ) | | (166,206,191 | ) |
| Net increase (decrease) in net assets | | (195,126,017 | ) | | (215,323,456 | ) |
| Net assets: | | | | | | |
| Beginning of year | | 5,265,368,042 | | | 5,480,691,498 | |
| End of year | $ | 5,070,242,025 | | $ | 5,265,368,042 | |
| Undistributed net investment income included in net assets: | | | | | | |
| End of year | $ | 6,326,628 | | $ | 6,600,794 | |
franklintempleton.com
The accompanying notes are an integral part of these financial statements. | Annual Report 27
FRANKLIN NEW YORK TAX-FREE INCOME FUND
Notes to Financial Statements
1. Organization and Significant Accounting Policies
Franklin New York Tax-Free Income Fund (Fund) is registered under the Investment Company Act of 1940 (1940 Act) as an open-end management investment company and applies the specialized accounting and reporting guidance in U.S. Generally Accepted Accounting Principles (U.S. GAAP). The Fund offers three classes of shares: Class A, Class C, and Advisor Class. Each class of shares differs by its initial sales load, contingent deferred sales charges, voting rights on matters affecting a single class, its exchange privilege and fees primarily due to differing arrangements for distribution and transfer agent fees.
The following summarizes the Fund’s significant accounting policies.
a. Financial Instrument Valuation
The Fund’s investments in financial instruments are carried at fair value daily. Fair value is the price that would be received to sell an asset or paid to transfer a liability in an orderly transaction between market participants on the measurement date. The Fund calculates the net asset value per share as of 4 p.m. Eastern time each day the New York Stock Exchange (NYSE) is open for trading. Under compliance policies and procedures approved by the Fund’s Board of Trustees (the Board), the Fund’s administrator has responsibility for oversight of valuation, including leading the cross-functional Valuation Committee (VC). The VC provides administration and oversight of the Fund’s valuation policies and procedures, which are approved annually by the Board. Among other things, these procedures allow the Fund to utilize independent pricing services, quotations from securities and financial instrument dealers, and other market sources to determine fair value.
Debt securities generally trade in the over-the-counter market rather than on a securities exchange. The Fund’s pricing services use multiple valuation techniques to determine fair value. In instances where sufficient market activity exists, the pricing services may utilize a market-based approach through which quotes from market makers are used to determine fair value. In instances where sufficient market activity may not exist or is limited, the pricing services also utilize proprietary valuation models which may consider market characteristics such as benchmark yield curves, credit spreads, estimated default rates, anticipated market interest rate volatility, coupon rates, anticipated timing of principal repayments, underlying
collateral, and other unique security features in order to estimate the relevant cash flows, which are then discounted to calculate the fair value.
The Fund has procedures to determine the fair value of financial instruments for which market prices are not reliable or readily available. Under these procedures, the VC convenes on a regular basis to review such financial instruments and considers a number of factors, including significant unobservable valuation inputs, when arriving at fair value. The VC primarily employs a market-based approach which may use related or comparable assets or liabilities, recent transactions, market multiples, book values, and other relevant information for the investment to determine the fair value of the investment. An income-based valuation approach may also be used in which the anticipated future cash flows of the investment are discounted to calculate fair value. Discounts may also be applied due to the nature or duration of any restrictions on the disposition of the investments. Due to the inherent uncertainty of valuations of such investments, the fair values may differ significantly from the values that would have been used had an active market existed. The VC employs various methods for calibrating these valuation approaches including a regular review of key inputs and assumptions, transactional back-testing or disposition analysis, and reviews of any related market activity.
b. Income Taxes
It is the Fund’s policy to qualify as a regulated investment company under the Internal Revenue Code. The Fund intends to distribute to shareholders substantially all of its income and net realized gains to relieve it from federal income and excise taxes. As a result, no provision for U.S. federal income taxes is required.
The Fund may recognize an income tax liability related to its uncertain tax positions under U.S. GAAP when the uncertain tax position has a less than 50% probability that it will be sustained upon examination by the tax authorities based on its technical merits. As of May 31, 2016, the Fund has determined that no tax liability is required in its financial statements related to uncertain tax positions for any open tax years (or expected to be taken in future tax years). Open tax years are those that remain subject to examination and are based on each tax jurisdiction’s statute of limitation.
28 Annual Report
franklintempleton.com
c. Security Transactions, Investment Income, Expenses and Distributions
Security transactions are accounted for on trade date. Realized gains and losses on security transactions are determined on a specific identification basis. Interest income and estimated expenses are accrued daily. Amortization of premium and accretion of discount on debt securities are included in interest income. Distributions to shareholders are recorded on the ex-dividend date and are determined according to income tax regulations (tax basis). Distributable earnings determined on a tax basis may differ from earnings recorded in accordance with U.S. GAAP. These differences may be permanent or temporary. Permanent differences are reclassified among capital accounts to reflect their tax character. These reclassifications have no impact on net assets or the results of operations. Temporary differences are not reclassified, as they may reverse in subsequent periods.
Realized and unrealized gains and losses and net investment income, not including class specific expenses, are allocated daily to each class of shares based upon the relative proportion of net assets of each class. Differences in per share distributions, by class, are generally due to differences in class specific expenses.
d. Insurance
The scheduled payments of interest and principal for each insured municipal security in the Fund are insured by either a new issue insurance policy or a secondary insurance policy. Depending on the type of coverage, premiums for insurance are either added to the cost basis of the security or paid by a third party.
FRANKLIN NEW YORK TAX-FREE INCOME FUND
NOTES TO FINANCIAL STATEMENTS
Insurance companies typically insure municipal bonds that tend to be of very high quality, with the majority of underlying municipal bonds rated A or better. However, an event involving an insurer could have an adverse effect on the value of the securities insured by that insurance company. There can be no assurance the insurer will be able to fulfill its obligations under the terms of the policy.
e. Accounting Estimates
The preparation of financial statements in accordance with U.S. GAAP requires management to make estimates and assumptions that affect the reported amounts of assets and liabilities at the date of the financial statements and the amounts of income and expenses during the reporting period. Actual results could differ from those estimates.
f. Guarantees and Indemnifications
Under the Fund’s organizational documents, its officers and trustees are indemnified by the Fund against certain liabilities arising out of the performance of their duties to the Fund. Additionally, in the normal course of business, the Fund enters into contracts with service providers that contain general indemnification clauses. The Fund’s maximum exposure under these arrangements is unknown as this would involve future claims that may be made against the Fund that have not yet occurred. Currently, the Fund expects the risk of loss to be remote.
2. Shares of Beneficial Interest
At May 31, 2016, there were an unlimited number of shares authorized (without par value). Transactions in the Fund’s shares were as follows:
| | | | | | | | | | |
| | | | | Year Ended May 31, | | | | |
| | | | | 2016 | | | | | 2015 | |
| | Shares | | | Amount | | Shares | | | Amount | |
| Class A Shares: | | | | | | | | | | |
| Shares sold | 20,609,611 | | $ | 236,981,304 | | 20,127,251 | | $ | 234,826,815 | |
| Shares issued in reinvestment of distributions | 10,611,911 | | | 121,814,794 | | 11,293,728 | | | 131,629,165 | |
| Shares redeemed | (46,145,086 | ) | | (530,309,690 | ) | (52,042,176 | ) | | (606,250,265 | ) |
| Net increase (decrease) | (14,923,564 | ) | $ | (171,513,592 | ) | (20,621,197 | ) | $ | (239,794,285 | ) |
franklintempleton.com
Annual Report
29
FRANKLIN NEW YORK TAX-FREE INCOME FUND
NOTES TO FINANCIAL STATEMENTS
| | | | | | | | | | | |
| 2. Shares of Beneficial Interest (continued) | | | | | | | | | | | |
| |
| | | | | Year Ended May 31, | | | | | |
| | | | 2016 | | | | | | 2015 | | |
| | Shares | | | Amount | | Shares | | | | Amount | |
| Class C Shares: | | | | | | | | | | | |
| Shares sold | 6,139,381 | | $ | 70,544,894 | | 5,207,453 | | | $ | 60,681,363 | |
| Shares issued in reinvestment of distributions | 1,496,672 | | | 17,165,757 | | 1,576,243 | | | | 18,357,703 | |
| Shares redeemed | (8,221,555 | ) | | (94,390,948 | ) | (8,470,176 | ) | | | (98,582,937 | ) |
| Net increase (decrease) | (585,502 | ) | $ | (6,680,297 | ) | (1,686,480 | ) | | $ | (19,543,871 | ) |
| Advisor Class Shares: | | | | | | | | | | | |
| Shares sold | 6,295,781 | | $ | 72,490,149 | | 11,663,595 | | $ | 135,764,575 | |
| Shares issued in reinvestment of distributions | 698,742 | | | 8,025,506 | | 622,027 | | | | 7,257,871 | |
| Shares redeemed | (6,717,766 | ) | | (77,256,899 | ) | (4,277,476 | ) | | | (49,890,481 | ) |
| Net increase (decrease) | 276,757 | | $ | 3,258,756 | | 8,008,146 | | | $ | 93,131,965 | |
3. Transactions with Affiliates
Franklin Resources, Inc. is the holding company for various subsidiaries that together are referred to as Franklin Templeton Investments. Certain officers and trustees of the Fund are also officers and/or directors of the following subsidiaries:
| |
| Subsidiary | Affiliation |
| Franklin Advisers, Inc. (Advisers) | Investment manager |
| Franklin Templeton Services, LLC (FT Services) | Administrative manager |
| Franklin Templeton Distributors, Inc. (Distributors) | Principal underwriter |
| Franklin Templeton Investor Services, LLC (Investor Services) | Transfer agent |
| |
| a. Management Fees | |
The Fund pays an investment management fee to Advisers based on the month-end net assets of the Fund as follows:
| | |
| Annualized Fee Rate | | Net Assets |
| 0.625 | % | Up to and including $100 million |
| 0.500 | % | Over $100 million, up to and including $250 million |
| 0.450 | % | Over $250 million, up to and including $7.5 billion |
| 0.440 | % | Over $7.5 billion, up to and including $10 billion |
| 0.430 | % | Over $10 billion, up to and including $12.5 billion |
| 0.420 | % | Over $12.5 billion, up to and including $15 billion |
| 0.400 | % | Over $15 billion, up to and including $17.5 billion |
| 0.380 | % | Over $17.5 billion, up to and including $20 billion |
| 0.360 | % | In excess of $20 billion |
For the year ended May 31, 2016, the effective investment management fee rate was 0.455% of the Fund’s average daily net assets.
b. Administrative Fees
Under an agreement with Advisers, FT Services provides administrative services to the Fund. The fee is paid by Advisers based on
the Fund’s average daily net assets, and is not an additional expense of the Fund.
30 Annual Report
franklintempleton.com
FRANKLIN NEW YORK TAX-FREE INCOME FUND
NOTES TO FINANCIAL STATEMENTS
c. Distribution Fees
The Board has adopted distribution plans for each share class, with the exception of Advisor Class shares, pursuant to Rule 12b-1 under the 1940 Act. Under the Fund’s Class A reimbursement distribution plan, the Fund reimburses Distributors for costs incurred in connection with the servicing, sale and distribution of the Fund’s shares up to the maximum annual plan rate. Under the Class A reimbursement distribution plan, costs exceeding the maximum for the current plan year cannot be reimbursed in subsequent periods. In addition, under the Fund’s Class C compensation distribution plan, the Fund pays Distributors for costs incurred in connection with the servicing, sale and distribution of the Fund’s shares up to the maximum annual plan rate. The plan year, for purposes of monitoring compliance with the maximum annual plan rate, is February 1 through January 31.
The maximum annual plan rates, based on the average daily net assets, for each class, are as follows:
| | |
| Class A | 0.10 | % |
| Class C | 0.65 | % |
| |
| d. Sales Charges/Underwriting Agreements | | |
Front-end sales charges and contingent deferred sales charges (CDSC) do not represent expenses of the Fund. These charges are deducted from the proceeds of sales of Fund shares prior to investment or from redemption proceeds prior to remittance, as applicable. Distributors has advised the Fund of the following commission transactions related to the sales and redemptions of the Fund’s shares for the year:
| | |
| Sales charges retained net of commissions paid to | | |
| unaffiliated brokers/dealers | $ | 526,938 |
| CDSC retained | $ | 65,101 |
| |
| e. Transfer Agent Fees | | |
Each class of shares pays transfer agent fees to Investor Services for its performance of shareholder servicing obligations and reimburses Investor Services for out of pocket expenses incurred, including shareholder servicing fees paid to third parties. These fees are allocated daily based upon their relative proportion of such classes’ aggregate net assets.
For the year ended May 31, 2016, the Fund paid transfer agent fees of $1,985,085, of which $855,077 was retained by Investor Services.
4. Income Taxes
For tax purposes, capital losses may be carried over to offset future capital gains. Capital loss carryforwards with no expiration, if any, must be fully utilized before those losses with expiration dates.
At May 31, 2016, capital loss carryforwards were as follows:
| | |
| Capital loss carryforwards subject to expiration: | | |
| 2017 | $ | 7,626,443 |
| 2018 | | 7,152,557 |
| Capital loss carryforwards not subject to expiration: | | |
| Short term | | 53,439,832 |
| Long term | | 96,051,809 |
| Total capital loss carryforwards | $ | 164,270,641 |
During the year ended May 31, 2016, the Fund utilized $1,257,912 of capital loss carry forwards.
On May 31, 2016, the Fund had expired capital loss carryforwards of $2,807,508, which were reclassified to paid in capital.
franklintempleton.com
Annual Report
31
FRANKLIN NEW YORK TAX-FREE INCOME FUND
NOTES TO FINANCIAL STATEMENTS
4. Income Taxes (continued)
The tax character of distributions paid during the years ended May 31, 2016 and 2015, was as follows:
| | | | |
| | | 2016 | | 2015 |
| Distributions from tax exempt income | $ | 180,161,641 | $ | 194,421,396 |
At May 31, 2016, the cost of investments, net unrealized appreciation (depreciation), and undistributed tax exempt income for income tax purposes were as follows:
| | | |
| Cost of investments. | $ | 4,525,417,413 | |
| |
| Unrealized appreciation | $ | 384,191,715 | |
| Unrealized depreciation | | (134,762,646 | ) |
| Net unrealized appreciation (depreciation) | $ | 249,429,069 | |
| Distributable earnings - undistributed tax exempt | | | |
| income | $ | 5,730,048 | |
Differences between income and/or capital gains as determined on a book basis and a tax basis are primarily due to differing treatments of bond discounts and premiums and bond workout expenditures.
5. Investment Transactions
Purchases and sales of investments (excluding short term securities) for the year ended May 31, 2016, aggregated $196,989,056 and $330,637,665, respectively.
6. Concentration of Risk
The Fund invests a large percentage of its total assets in obligations of issuers within New York and U.S. territories. Such concentration may subject the Fund to risks associated with industrial or regional matters, and economic, political or legal developments occurring within New York and U.S. territories. Investing in Puerto Rico securities may expose the Fund to heightened risks due to recent adverse economic and market changes, credit downgrades and ongoing restructuring discussions. In addition, investments in these securities are sensitive to interest rate changes and credit risk of the issuer and may subject the Fund to increased market volatility. The market for these investments may be limited, which may make them difficult to buy or sell.
7. Credit Facility
The Fund, together with other U.S. registered and foreign investment funds (collectively, Borrowers), managed by Franklin Templeton Investments, are borrowers in a joint syndicated senior unsecured credit facility totaling $2 billion (Global Credit Facility) which matures on February 10, 2017. This Global Credit Facility provides a source of funds to the Borrowers for temporary and emergency purposes, including the ability to meet future unanticipated or unusually large redemption requests.
Under the terms of the Global Credit Facility, the Fund shall, in addition to interest charged on any borrowings made by the Fund and other costs incurred by the Fund, pay its share of fees and expenses incurred in connection with the implementation and maintenance of the Global Credit Facility, based upon its relative share of the aggregate net assets of all of the Borrowers, including an annual commitment fee of 0.07% based upon the unused portion of the Global Credit Facility. Effective February 12, 2016, the annual commitment fee is 0.15%. These fees are reflected in other expenses in the Statement of Operations. During the year ended May 31, 2016, the Fund did not use the Global Credit Facility.
32 Annual Report
franklintempleton.com
FRANKLIN NEW YORK TAX-FREE INCOME FUND
NOTES TO FINANCIAL STATEMENTS
8. Fair Value Measurements
The Fund follows a fair value hierarchy that distinguishes between market data obtained from independent sources (observable inputs) and the Fund’s own market assumptions (unobservable inputs). These inputs are used in determining the value of the Fund’s financial instruments and are summarized in the following fair value hierarchy:
- Level 1 – quoted prices in active markets for identical financial instruments
- Level 2 – other significant observable inputs (including quoted prices for similar financial instruments, interest rates, prepayment speed, credit risk, etc.)
- Level 3 – significant unobservable inputs (including the Fund’s own assumptions in determining the fair value of financial instruments)
The input levels are not necessarily an indication of the risk or liquidity associated with financial instruments at that level.
For movements between the levels within the fair value hierarchy, the Fund has adopted a policy of recognizing the transfers as of the date of the underlying event which caused the movement.
At May 31, 2016, all of the Fund’s investments in financial instruments carried at fair value were valued using Level 2 inputs.
9. Subsequent Events
The Fund has evaluated subsequent events through the issuance of the financial statements and determined that no events have occurred that require disclosure.
Abbreviations
Selected Portfolio
| |
| AGMC | Assured Guaranty Municipal Corp. |
| AMBAC | American Municipal Bond Assurance Corp. |
| BHAC | Berkshire Hathaway Assurance Corp. |
| COP | Certificate of Participation |
| FGIC | Financial Guaranty Insurance Co. |
| FHA | Federal Housing Authority/Agency |
| FICO | Financing Corp. |
| GO | General Obligation |
| HDC | Housing Development Corp. |
| HFA | Housing Finance Authority/Agency |
| HFAR | Housing Finance Authority Revenue |
| IDA | Industrial Development Authority/Agency |
| IDAR | Industrial Development Authority Revenue |
| IDC | Industrial Development Corp. |
| MFHR | Multi-Family Housing Revenue |
| MTA | Metropolitan Transit Authority |
| NATL | National Public Financial Guarantee Corp. |
| XLCA | XL Capital Assurance |
franklintempleton.com
Annual Report
33
FRANKLIN NEW YORK TAX-FREE INCOME FUND
Report of Independent Registered Public Accounting Firm
To the Board of Trustees and Shareholders of Franklin New York Tax-Free Income Fund
In our opinion, the accompanying statement of assets and liabilities, including the statement of investments, and the related statements of operations and of changes in net assets and the financial highlights present fairly, in all material respects, the financial position of Franklin New York Tax-Free Income Fund (the "Fund") at May 31, 2016, the results of its operations for the year then ended, the changes in its net assets for each of the two years in the period then ended and the financial highlights for each of the five years in the period then ended, in conformity with accounting principles generally accepted in the United States of America. These financial statements and financial highlights (hereafter referred to as "financial statements") are the responsibility of the Fund’s management. Our responsibility is to express an opinion on these financial statements based on our audit. We conducted our audit of these financial statements in accordance with the standards of the Public Company Accounting Oversight Board (United States). Those standards require that we plan and perform the audit to obtain reasonable assurance about whether the financial statements are free of material misstatement. An audit includes examining, on a test basis, evidence supporting the amounts and disclosures in the financial statements, assessing the accounting principles used and significant estimates made by management, and evaluating the overall financial statement presentation. We believe that our audit, which included confirmation of securities at May 31, 2016 by correspondence with the custodian and brokers, provides a reasonable basis for our opinion.
PricewaterhouseCoopers LLP
San Francisco, California
July 15, 2016
34 Annual Report
franklintempleton.com
FRANKLIN NEW YORK TAX-FREE INCOME FUND
Tax Information (unaudited)
Under Section 852(b)(5)(A) of the Internal Revenue Code, the Fund hereby reports 100% of the distributions paid from net investment income as exempt-interest dividends for the fiscal year ended May 31, 2016. A portion of the Fund’s exempt-interest dividends may be subject to the federal alternative minimum tax. By mid-February 2017, shareholders will be notified of amounts for use in preparing their 2016 income tax returns.
franklintempleton.com
Annual Report
35
FRANKLIN NEW YORK TAX-FREE INCOME FUND
Board Members and Officers
The name, year of birth and address of the officers and board members, as well as their affiliations, positions held with the Trust, principal occupations during at least the past five years and number of U.S. registered portfolios overseen in the Franklin Templeton Investments fund complex, are shown below. Generally, each board member serves until that person’s successor is elected and qualified.
| | | | |
| Independent Board Members | | | |
| |
| | | | Number of Portfolios in | |
| Name, Year of Birth | | Length of | Fund Complex Overseen | Other Directorships Held |
| and Address | Position | Time Served | by Board Member* | During at Least the Past 5 Years |
| |
| Harris J. Ashton (1932) | Trustee | Since 1982 | 145 | Bar-S Foods (meat packing company) |
| One Franklin Parkway | | | | (1981-2010). |
| San Mateo, CA 94403-1906 | | | | |
| Principal Occupation During at Least the Past 5 Years: | | |
| Director of various companies; and formerly, Director, RBC Holdings, Inc. (bank holding company) (until 2002); and President, Chief Executive |
| Officer and Chairman of the Board, General Host Corporation (nursery and craft centers) (until 1998). | |
| |
| Mary C. Choksi (1950) | Trustee | Since 2014 | 121 | Avis Budget Group Inc. (car rental) |
| One Franklin Parkway | | | | (2007-present), Omnicom Group Inc. |
| San Mateo, CA 94403-1906 | | | | (advertising and marketing |
| | | | | communications services) |
| | | | | (2011-present) and H.J. Heinz |
| | | | | Company (processed foods and allied |
| | | | | products) (1998-2006) |
| Principal Occupation During at Least the Past 5 Years: | | |
| Senior Advisor, Strategic Investment Group (investment management group) (2015-present); director of various companies; and formerly, |
| Founding Partner and Senior Managing Director, Strategic Investment Group (1987–2015); Founding Partner and Managing Director, Emerging |
| Markets Management LLC (investment management firm) (1987-2011); and Loan Officer/Senior Loan Officer/Senior Pension Investment |
| Officer, World Bank Group (international financial institution) (1977-1987). | |
| |
| Edith E. Holiday (1952) | Trustee | Since 1998 | 145 | Hess Corporation (exploration and |
| One Franklin Parkway | | | | refining of oil and gas) (1993-present), |
| San Mateo, CA 94403-1906 | | | | Canadian National Railway (railroad) |
| | | | | (2001-present), White Mountains |
| | | | | Insurance Group, Ltd. (holding |
| | | | | company) (2004-present), RTI |
| | | | | International Metals, Inc. (manufacture |
| | | | | and distribution of titanium) |
| | | | | (1999-2015) and H.J. Heinz Company |
| | | | | (processed foods and allied products) |
| | | | | (1994-2013). |
| Principal Occupation During at Least the Past 5 Years: | | |
| Director or Trustee of various companies and trusts; and formerly, Assistant to the President of the United States and Secretary of the |
| Cabinet (1990-1993); General Counsel to the United States Treasury Department (1989-1990); and Counselor to the Secretary and Assistant |
| Secretary for Public Affairs and Public Liaison – United States Treasury Department (1988-1989). | |
| |
| J. Michael Luttig (1954) | Trustee | Since 2009 | 145 | Boeing Capital Corporation (aircraft |
| One Franklin Parkway | | | | financing) (2006-2013). |
| San Mateo, CA 94403-1906 | | | | |
| Principal Occupation During at Least the Past 5 Years: | | |
| Executive Vice President, General Counsel and member of the Executive Council, The Boeing Company (aerospace company) (2006-present); |
| and formerly, Federal Appeals Court Judge, U.S. Court of Appeals for the Fourth Circuit (1991-2006). | |
| |
| Frank A. Olson (1932) | Trustee | Since 2006 | 145 | Hess Corporation (exploration and |
| One Franklin Parkway | | | | refining of oil and gas) (1998-2013). |
| San Mateo, CA 94403-1906 | | | | |
| Principal Occupation During at Least the Past 5 Years: | | |
| Director of various companies; and formerly, Chairman of the Board, The Hertz Corporation (car rental) (1980-2000) and Chief Executive |
| Officer (1977-1999); and Chairman of the Board, President and Chief Executive Officer, UAL Corporation (airlines) (June – December 1987). |
36 Annual Report
franklintempleton.com
FRANKLIN NEW YORK TAX-FREE INCOME FUND
| | | | |
| Independent Board Members (continued) | | |
| |
| |
| |
| | | | Number of Portfolios in | |
| Name, Year of Birth | | Length of | Fund Complex Overseen | Other Directorships Held |
| and Address | Position | Time Served | by Board Member* | During at Least the Past 5 Years |
| |
| Larry D. Thompson (1945) | Trustee | Since 2007 | 145 | The Southern Company (energy |
| One Franklin Parkway | | | | company) (2014-present; previously |
| San Mateo, CA 94403-1906 | | | | 2010-2012), Graham Holdings |
| | | | | Company (education and media |
| | | | | organization) (2011-present) and |
| | | | | Cbeyond, Inc. (business |
| | | | | communications provider) |
| | | | | (2010-2012). |
| Principal Occupation During at Least the Past 5 Years: | | |
| Director of various companies; John A. Sibley Professor of Corporate and Business Law, University of Georgia School of Law (2015-present; |
| previously 2011-2012); and formerly, Executive Vice President - Government Affairs, General Counsel and Corporate Secretary, PepsiCo, Inc. |
| (consumer products) (2012-2014); Senior Vice President - Government Affairs, General Counsel and Secretary, PepsiCo, Inc. (2004-2011); |
| Senior Fellow of The Brookings Institution (2003-2004); Visiting Professor, University of Georgia School of Law (2004); and Deputy Attorney |
| General, U.S. Department of Justice (2001-2003). | | | |
| |
| John B. Wilson (1959) | Lead | Trustee since | 121 | None |
| One Franklin Parkway | Independent | 2007 and Lead | | |
| San Mateo, CA 94403-1906 | Trustee | Independent | | |
| | | Trustee since | | |
| | | 2008 | | |
| Principal Occupation During at Least the Past 5 Years: | | |
| President, Staples Europe (office supplies) (2012-present); President and Founder, Hyannis Port Capital, Inc. (real estate and private equity |
| investing); serves on private and non-profit boards; and formerly, Chief Operating Officer and Executive Vice President, Gap, Inc. (retail) |
| (1996-2000); Chief Financial Officer and Executive Vice President – Finance and Strategy, Staples, Inc. (1992-1996); Senior Vice President – |
| Corporate Planning, Northwest Airlines, Inc. (airlines) (1990-1992); and Vice President and Partner, Bain & Company (consulting firm) |
| (1986-1990). | | | | |
| |
| |
| Interested Board Members and Officers | | |
| |
| | | | Number of Portfolios in | |
| Name, Year of Birth | | Length of | Fund Complex Overseen | Other Directorships Held |
| and Address | Position | Time Served | by Board Member* | During at Least the Past 5 Years |
| |
| **Gregory E. Johnson (1961) | Trustee | Since 2013 | 160 | None |
| One Franklin Parkway | | | | |
| San Mateo, CA 94403-1906 | | | | |
| Principal Occupation During at Least the Past 5 Years: | | |
| Chairman of the Board, Member - Office of the Chairman, Director and Chief Executive Officer, Franklin Resources, Inc.; officer and/or director |
| or trustee, as the case may be, of some of the other subsidiaries of Franklin Resources, Inc. and of 44 of the investment companies in Franklin |
| Templeton Investments; Vice Chairman, Investment Company Institute; and formerly, President, Franklin Resources, Inc. (1994-2015). |
| |
| **Rupert H. Johnson, Jr. (1940) | Chairman of | Chairman of the | 145 | None |
| One Franklin Parkway | the Board, | Board since | | |
| San Mateo, CA 94403-1906 | Trustee and | 2013, Trustee and | | |
| | Vice President | Vice President | | |
| | | since 1983 | | |
| Principal Occupation During at Least the Past 5 Years: | | |
| Vice Chairman, Member – Office of the Chairman and Director, Franklin Resources, Inc.; Director, Franklin Advisers, Inc.; Senior Vice |
| President, Franklin Advisory Services, LLC; and officer and/or director or trustee, as the case may be, of some of the other subsidiaries of |
| Franklin Resources, Inc. and of 42 of the investment companies in Franklin Templeton Investments. | |
| |
| Sheila Amoroso (1959) | Vice President | Since 1999 | Not Applicable | Not Applicable |
| One Franklin Parkway | | | | |
| San Mateo, CA 94403-1906 | | | | |
| Principal Occupation During at Least the Past 5 Years: | | |
| Senior Vice President, Franklin Advisers, Inc.; and officer of seven of the investment companies in Franklin Templeton Investments. |
franklintempleton.com
Annual Report
37
FRANKLIN NEW YORK TAX-FREE INCOME FUND
| | | | |
| Interested Board Members and Officers (continued) | |
| |
| |
| |
| | | | Number of Portfolios in | |
| Name, Year of Birth | | Length of | Fund Complex Overseen | Other Directorships Held |
| and Address | Position | Time Served | by Board Member* | During at Least the Past 5 Years |
| |
| Alison E. Baur (1964) | Vice President | Since 2012 | Not Applicable | Not Applicable |
| One Franklin Parkway | | | | |
| San Mateo, CA 94403-1906 | | | | |
| Principal Occupation During at Least the Past 5 Years: | | |
| Deputy General Counsel, Franklin Templeton Investments; and officer of some of the other subsidiaries of Franklin Resources, Inc. and of 45 |
| of the investment companies in Franklin Templeton Investments. | | |
| |
| Rafael R. Costas, Jr. (1965) | Vice President | Since 1999 | Not Applicable | Not Applicable |
| One Franklin Parkway | | | | |
| San Mateo, CA 94403-1906 | | | | |
| Principal Occupation During at Least the Past 5 Years: | | |
| Senior Vice President, Franklin Advisers, Inc.; and officer of seven of the investment companies in Franklin Templeton Investments. |
| |
| Laura F. Fergerson (1962) | Chief | Since 2009 | Not Applicable | Not Applicable |
| One Franklin Parkway | Executive | | | |
| San Mateo, CA 94403-1906 | Officer – | | | |
| | Finance and | | | |
| | Administration | | | |
| Principal Occupation During at Least the Past 5 Years: | | |
| Senior Vice President, Franklin Templeton Services, LLC; Vice President, Franklin Advisers, Inc. and Franklin Templeton Institutional, LLC; and |
| officer of 45 of the investment companies in Franklin Templeton Investments. | |
| |
| Gaston Gardey (1967) | Treasurer, | Since 2009 | Not Applicable | Not Applicable |
| One Franklin Parkway | Chief Financial | | | |
| San Mateo, CA 94403-1906 | Officer and | | | |
| | Chief | | | |
| | Accounting | | | |
| | Officer | | | |
| Principal Occupation During at Least the Past 5 Years: | | |
| Treasurer, U.S. Fund Administration & Reporting, Franklin Templeton Investments; and officer of 28 of the investment companies in Franklin |
| Templeton Investments. | | | | |
| |
| Aliya S. Gordon (1973) | Vice President | Since 2009 | Not Applicable | Not Applicable |
| One Franklin Parkway | | | | |
| San Mateo, CA 94403-1906 | | | | |
| Principal Occupation During at Least the Past 5 Years: | | |
| Senior Associate General Counsel, Franklin Templeton Investments; and officer of 45 of the investment companies in Franklin Templeton |
| Investments. | | | | |
| |
| Steven J. Gray (1955) | Vice President | Since 2009 | Not Applicable | Not Applicable |
| One Franklin Parkway | | | | |
| San Mateo, CA 94403-1906 | | | | |
| Principal Occupation During at Least the Past 5 Years: | | |
| Senior Associate General Counsel, Franklin Templeton Investments; Vice President, Franklin Templeton Distributors, Inc. and Franklin |
| Alternative Strategies Advisers, LLC; and officer of 45 of the investment companies in Franklin Templeton Investments. |
| |
| Robert Lim (1948) | Vice President | Since May 2016 | Not Applicable | Not Applicable |
| One Franklin Parkway | – AML | | | |
| San Mateo, CA 94403-1906 | Compliance | | | |
| Principal Occupation During at Least the Past 5 Years: | | |
| Vice President, Franklin Templeton Companies, LLC; Chief Compliance Officer, Franklin Templeton Distributors, Inc. and Franklin Templeton |
| Investor Services, LLC; and officer of 45 of the investment companies in Franklin Templeton Investments. |
38 Annual Report
franklintempleton.com
FRANKLIN NEW YORK TAX-FREE INCOME FUND
| | | | |
| Interested Board Members and Officers (continued) | |
| |
| |
| |
| | | | Number of Portfolios in | |
| Name, Year of Birth | | Length of | Fund Complex Overseen | Other Directorships Held |
| and Address | Position | Time Served | by Board Member* | During at Least the Past 5 Years |
| |
| Christopher J. Molumphy | President and | Since 2010 | Not Applicable | Not Applicable |
| (1962) | Chief | | | |
| One Franklin Parkway | Executive | | | |
| San Mateo, CA 94403-1906 | Officer – | | | |
| | Investment | | | |
| | Management | | | |
| Principal Occupation During at Least the Past 5 Years: | | |
| Director and Executive Vice President, Franklin Advisers, Inc.; Executive Vice President, Franklin Templeton Institutional, LLC; and officer of |
| some of the other subsidiaries of Franklin Resources, Inc. and of 22 of the investment companies in Franklin Templeton Investments. |
| |
| Kimberly H. Novotny (1972) | Vice President | Since 2013 | Not Applicable | Not Applicable |
| 300 S.E. 2nd Street | | | | |
| Fort Lauderdale, FL 33301-1923 | | | | |
| Principal Occupation During at Least the Past 5 Years: | | |
| Associate General Counsel, Franklin Templeton Investments; Vice President and Corporate Secretary, Fiduciary Trust International of the |
| South; Vice President, Templeton Investment Counsel, LLC; Assistant Secretary, Franklin Resources, Inc.; and officer of 45 of the investment |
| companies in Franklin Templeton Investments. | | | |
| |
| Robert C. Rosselot (1960) | Chief | Since 2013 | Not Applicable | Not Applicable |
| 300 S.E. 2nd Street | Compliance | | | |
| Fort Lauderdale, FL 33301-1923 | Officer | | | |
| Principal Occupation During at Least the Past 5 Years: | | |
| Director, Global Compliance, Franklin Templeton Investments; Vice President, Franklin Templeton Companies, LLC; officer of 45 of the |
| investment companies in Franklin Templeton Investments; and formerly, Senior Associate General Counsel, Franklin Templeton Investments |
| (2007-2013); and Secretary and Vice President, Templeton Group of Funds (2004-2013). | |
| |
| Karen L. Skidmore (1952) | Vice President | Since 2006 | Not Applicable | Not Applicable |
| One Franklin Parkway | and Secretary | | | |
| San Mateo, CA 94403-1906 | | | | |
| Principal Occupation During at Least the Past 5 Years: | | |
| Senior Associate General Counsel, Franklin Templeton Investments; and officer of 45 of the investment companies in Franklin Templeton |
| Investments. | | | | |
| |
| Navid Tofigh (1972) | Vice President | Since November | Not Applicable | Not Applicable |
| One Franklin Parkway | | 2015 | | |
| San Mateo, CA 94403-1906 | | | | |
| Principal Occupation During at Least the Past 5 Years: | | |
| Associate General Counsel, Franklin Templeton Investments; and officer of 45 of the investment companies in Franklin Templeton Investments. |
| |
| Craig S. Tyle (1960) | Vice President | Since 2005 | Not Applicable | Not Applicable |
| One Franklin Parkway | | | | |
| San Mateo, CA 94403-1906 | | | | |
| Principal Occupation During at Least the Past 5 Years: | | |
| General Counsel and Executive Vice President, Franklin Resources, Inc.; and officer of some of the other subsidiaries of Franklin Resources, |
| Inc. and of 45 of the investment companies in Franklin Templeton Investments. | |
| |
| Thomas Walsh (1961) | Vice President | Since 1999 | Not Applicable | Not Applicable |
| One Franklin Parkway | | | | |
| San Mateo, CA 94403-1906 | | | | |
| Principal Occupation During at Least the Past 5 Years: | | |
| Senior Vice President, Franklin Advisers, Inc.; and officer of seven of the investment companies in Franklin Templeton Investments. |
franklintempleton.com
Annual Report
39
FRANKLIN NEW YORK TAX-FREE INCOME FUND
| | | | |
| Interested Board Members and Officers (continued) | |
| |
| |
| |
| | | | Number of Portfolios in | |
| Name, Year of Birth | | Length of | Fund Complex Overseen | Other Directorships Held |
| and Address | Position | Time Served | by Board Member* | During at Least the Past 5 Years |
| |
| Lori A. Weber (1964) | Vice President | Since 2011 | Not Applicable | Not Applicable |
| 300 S.E. 2nd Street | | | | |
| Fort Lauderdale,FL 33301-1923 | | | | |
Principal Occupation During at Least the Past 5 Years:
Senior Associate General Counsel, Franklin Templeton Investments; Assistant Secretary, Franklin Resources, Inc.; Vice President and
Secretary, Templeton Investment Counsel, LLC; and officer of 45 of the investment companies in Franklin Templeton Investments.
*We base the number of portfolios on each separate series of the U.S. registered investment companies within the Franklin Templeton Investments fund complex. These
portfolios have a common investment manager or affiliated investment managers.
**Gregory E. Johnson is considered to be an interested person of the Fund under the federal securities laws due to his position as an officer and director ofFranklin
Resources, Inc. (Resources), which is the parent company of the Fund’s investment manager and distributor. Rupert H. Johnson, Jr. is considered to be an interested person
of the Fund under the federal securities laws due to his position as officer and director and major shareholder of Resources.
Note 1: Rupert H. Johnson, Jr. is the uncle of Gregory E. Johnson.
Note 2: Officer information is current as of the date of this report. It is possible that after this date, information about officers may change.
The Sarbanes-Oxley Act of 2002 and Rules adopted by the Securities and Exchange Commission require the Fund to disclose whether the Fund’s Audit
Committee includes at least one member who is an audit committee financial expert within the meaning of such Act and Rules. The Fund’s Board has determined
that there is at least one such financial expert on the Audit Committee and has designated John B. Wilson as its audit committee financial expert. The Board
believes that Mr. Wilson qualifies as such an expert in view of his extensive business background and experience, including service as chief financial officer of
Staples, Inc. from 1992 to 1996. Mr. Wilson has been a Member and Chairman of the Fund’s Audit Committee since 2007. As a result of such background and
experience, the Board believes that Mr. Wilson has acquired an understanding of generally accepted accounting principles and financial statements, the general
application of such principles in connection with the accounting estimates, accruals and reserves, and analyzing and evaluating financial statements that
present a breadth and level of complexity of accounting issues generally comparable to those of the Fund, as well as an understanding of internal controls and
procedures for financial reporting and an understanding of audit committee functions. Mr. Wilson is an independent Board member as that term is defined under
the relevant Securities and Exchange Commission Rules and Releases.
The Statement of Additional Information (SAI) includes additional information about the board members and is available, without charge, upon request.
Shareholders may call (800) DIAL BEN/342-5236 to request the SAI.
40 Annual Report
franklintempleton.com
FRANKLIN NEW YORK TAX-FREE INCOME FUND
Shareholder Information
Board Review of Investment Management Agreement
At a meeting held February 23, 2016, the Board of Trustees (Board), including a majority of trustees that are not “interested persons” as such term is defined in section 2(a)(19) of the Investment Company Act of 1940 (hereinafter referred to as “non-interested Trustees” or “independent Trustees”), approved renewal of the investment management agreement for Franklin New York Tax-Free Income Fund (Fund). In reaching this decision, the Board took into account information furnished throughout the year at regular Board meetings, as well as information prepared specifically in connection with the annual renewal review process. Information furnished and discussed throughout the year included investment expenses, performance reports and related financial information for the Fund, along with periodic reports on shareholder services, legal and compliance matters, risk control, pricing, and other services provided by the Investment Manager (Manager) and its affiliates, as well as marketing support payments made to financial intermediaries. Information furnished specifically in connection with the renewal process included a report for the Fund prepared by Broadridge Financial Solutions, Inc. (Broadridge), an independent organization, as well as additional material, including a Fund profitability analysis prepared by management. The Broadridge report, which utilized data from Lipper, Inc. (Lipper), compared the Fund’s investment performance and expenses with those of other mutual funds deemed comparable to the Fund as selected by Lipper. The Fund profitability analysis discussed the profitability to Franklin Templeton Investments (FTI) from its overall U.S. fund operations, as well as on an individual fund-by-fund basis. Additional material accompanying such profitability analysis included information on a fund-by-fund basis listing portfolio managers and other accounts they manage, as well as information on management fees charged by the Manager and its affiliates to U.S. funds and other accounts, including management’s explanation of differences where relevant. Such material also included a memorandum prepared by management describing project initiatives and capital investments relating to the services provided to the Fund by the FTI organization, as well as a memorandum relating to economies of scale and an analysis concerning transfer agent fees charged by an affiliate of the Manager. The Boards also received a report on all marketing support payments made by FTI to financial intermediaries during the past year, as well as a memorandum relating to third-party servicing arrangements in response to a Guidance Update from the U.S. Securities and
Exchange Commission (SEC) relating to mutual fund distribution and sub-accounting fees.
In considering such materials, the independent Trustees received assistance and advice from and met separately with independent counsel. In approving continuance of the investment management agreement for the Fund, the Board, including a majority of independent Trustees, determined that the existing management fee structure was fair and reasonable and that continuance of the investment management agreement was in the best interests of the Fund and its shareholders. While attention was given to all information furnished, the following discusses some primary factors relevant to the Board’s decision.
NATURE, EXTENT AND QUALITY OF SERVICES. The Board was satisfied with the nature and quality of the overall services provided by the Manager and its affiliates to the Fund and its shareholders. In addition to investment performance and expenses discussed later, the Board’s opinion was based, in part, upon periodic reports furnished to it showing that the investment policies and restrictions for the Fund were consistently complied with as well as other reports periodically furnished to the Board covering matters such as the compliance of portfolio managers and other management personnel with the code of ethics adopted throughout the Franklin Templeton fund complex, the adherence to fair value pricing procedures established by the Board, and the accuracy of net asset value calculations. The Board also noted the extent of benefits provided to Fund shareholders from being part of the Franklin Templeton family of funds, including the right to exchange investments between the same class of shares of different funds without a sales charge, the ability to reinvest Fund dividends into other funds and the right to combine holdings in other funds to obtain a reduced sales charge. Favorable consideration was given to management’s continual efforts and expenditures in establishing effective business continuity plans and developing strategies to address cybersecurity threats. Additionally, the Board noted the Manager’s continued attention to pricing and valuation issues, particularly with respect to complex securities. Consideration was also given to the experience of the Fund’s portfolio management team, the number of accounts managed and general method of compensation. In this latter respect, the Board noted that a primary factor in management’s determination of a portfolio manager’s bonus compensation was the relative investment performance of the funds he or she managed and that a portion of such bonus was required to be invested in a predesignated list of funds within such person’s fund management area so as
franklintempleton.com
Annual Report
41
FRANKLIN NEW YORK TAX-FREE INCOME FUND
SHAREHOLDER INFORMATION
to be aligned with the interests of shareholders. The Board also took into account the quality of transfer agent and shareholder services provided Fund shareholders by an affiliate of the Manager and steps taken by FTI to enhance analytical support to the investment management groups and provide additional oversight of liquidity risk and complex securities. The Board also took into account, among other things, management’s efforts in establishing a global credit facility for the benefit of the Fund and other accounts managed by FTI to provide a source of cash for temporary and emergency purposes or to meet unusual redemption requests as well as the strong financial position of the Manager’s parent company and its commitment to the mutual fund business as evidenced by its continued introduction of new funds and reassessment of the fund offerings in response to the market environment.
INVESTMENT PERFORMANCE. The Board placed significant emphasis on the investment performance of the Fund in view of its importance to shareholders. While consideration was given to performance reports and discussions with portfolio managers at Board meetings during the year, particular attention in assessing such performance was given to the Broadridge report furnished for the agreement renewal. The Broadridge report prepared for the Fund showed the investment performance of its Class A shares during the year ended December 31, 2015, as well as the previous 10 years ended that date in comparison to a performance universe consisting of the Fund and all retail and institutional New York municipal debt funds as selected by Lipper. The Broadridge report showed the Fund’s income return for 2015 to be in the second-highest quintile of its Lipper performance universe, and on an annualized basis to also be in the second-highest quintile of such universe for each of the previous three-, five- and 10-year periods. The Broadridge report showed the Fund’s total return for 2015 to be in the lowest performing quintile of its performance universe, and on an annualized basis to be in the second-lowest performing quintile of such universe for the previous three- and five-year periods, and the middle performing quintile of such universe for the previous 10-year period. The Board found the Fund’s comparative performance as shown in the Broadridge report to be acceptable in view of the Fund’s income oriented investment objective and it noted the Fund’s more favorable comparative longer term total return.
COMPARATIVE EXPENSES. Consideration was given to the management fees and total expense ratio of the Fund compared with those of a group of other funds selected by Lipper as its appropriate Lipper expense group. Lipper expense data is based upon information taken from each Fund’s most
recent annual report, which reflects historical asset levels that may be quite different from those currently existing, particularly in a period of market volatility. While recognizing such inherent limitation and the fact that expense ratios generally increase as assets decline and decrease as assets grow, the Board believed the independent analysis conducted by Lipper to be an appropriate measure of comparative expenses. In reviewing comparative costs, Lipper provides information on the Fund’s management fee in comparison with the contractual investment management fee that would have been charged by other funds within its Lipper expense group assuming they were similar in size to the Fund, as well as the actual total expenses of the Fund in comparison with those of its Lipper expense group. The Lipper contractual investment management fee analysis includes administrative charges as being part of a management fee, and total expenses, for comparative consistency, are shown by Lipper for Fund Class A shares. The Broadridge report showed the contractual investment management fee rate for the Fund was below the median of its Lipper expense group, and its actual total expense ratio was the least expensive within such expense group. The Board was satisfied with the expenses of the Fund in comparison to its Lipper expense group as shown in the Broadridge report.
MANAGEMENT PROFITABILITY. The Board also considered the level of profits realized by the Manager and its affiliates in connection with the operation of each Fund. In this respect, the Board reviewed the Fund profitability analysis that addresses the overall profitability of Franklin Templeton’s U.S. fund business, as well as its profits in providing management and other services to each of the individual funds during the 12-month period ended September 30, 2015, being the most recent fiscal year-end for Franklin Resources, Inc., the Manager’s parent. In reviewing the analysis, the Board recognized that allocation methodologies are inherently subjective and various allocation methodologies may be reasonable while producing different results. In this respect, the Board noted that while management continuously makes refinements to its methodologies in response to organizational and product related changes, the overall approach as defined by the primary drivers and activity measurements has remained consistent with that used in the Fund’s profitability report presentations from prior years. Additionally, the Fund’s independent registered public accounting firm had been engaged by the Manager to periodically review the reasonableness of the allocation methodologies to be used solely by the Fund’s Board in reference to the profitability analysis. In reviewing and discussing such analysis,
42 Annual Report
franklintempleton.com
FRANKLIN NEW YORK TAX-FREE INCOME FUND
SHAREHOLDER INFORMATION
management discussed with the Board its belief that costs incurred in establishing the infrastructure necessary for the type of mutual fund operations conducted by the Manager and its affiliates may not be fully reflected in the expenses allocated to the Fund in determining its profitability, as well as the fact that the level of profits, to a certain extent, reflected operational cost savings and efficiencies initiated by management. The Board also took into account management’s expenditures in improving shareholder services provided the Fund, as well as the need to implement systems and meet additional regulatory and compliance requirements resulting from statutes such as the Sarbanes-Oxley and Dodd-Frank Acts and recent SEC and other regulatory requirements. In addition, the Board considered a third-party study comparing the profitability of the Manager’s parent on an overall basis to other publicly held managers broken down to show profitability from management operations exclusive of distribution expenses, as well as profitability including distribution expenses. The Board also considered the extent to which the Manager and its affiliates might derive ancillary benefits from fund operations, including revenues generated from transfer agent services and potential benefits resulting from personnel and systems enhancements necessitated by fund growth, as well as increased leverage with the service providers and counter-parties. Based upon its consideration of all these factors, the Board determined that the level of profits realized by the Manager and its affiliates from providing services to the Fund was not excessive in view of the nature, quality and extent of services provided.
ECONOMIES OF SCALE. The Board also considered whether economies of scale are realized by the Manager as the Fund grows larger and the extent to which this is reflected in the level of management fees charged. While recognizing that any precise determination is inherently subjective, the Board noted that based upon the Fund profitability analysis, it appears that as some funds get larger, at some point economies of scale do result in the Manager realizing a larger profit margin on management services provided such a fund. The Board also noted that economies of scale are shared with a fund and its shareholders through management fee breakpoints so that as a fund grows in size, its effective management fee rate declines. The fee structure under the Fund’s investment management agreement provides an initial fee of 0.625% on the first $100 million of net assets; 0.50% on the next $150 million of net assets; 0.45% on the next $7.25 billion of net assets; 0.44% on the next $2.5 billion of net assets; 0.43% on the next $2.5 billion of net assets; 0.42% on the next $2.5 billion of net assets; and thereafter declines by 0.02% for each subsequent $2.5 billion of net assets until it reaches a final breakpoint of
0.36% for net assets in excess of $20 billion. The Fund’s net assets were approximately $5.05 billion as of December 31, 2015, and the Board believes that to the extent any economies of scale may be realized by the Manager and its affiliates, the schedule of fees under the investment management agreement provides a sharing of benefits with the Fund and its shareholders.
Proxy Voting Policies and Procedures
The Fund’s investment manager has established Proxy Voting Policies and Procedures (Policies) that the Fund uses to determine how to vote proxies relating to portfolio securities. Shareholders may view the Fund’s complete Policies online at franklintempleton.com. Alternatively, shareholders may request copies of the Policies free of charge by calling the Proxy Group collect at (954) 527-7678 or by sending a written request to: Franklin Templeton Companies, LLC, 300 S.E. 2nd Street, Fort Lauderdale, FL 33301, Attention: Proxy Group. Copies of the Fund’s proxy voting records are also made available online at franklintempleton.com and posted on the U.S. Securities and Exchange Commission’s website at sec.gov and reflect the most recent 12-month period ended June 30.
Quarterly Statement of Investments
The Fund files a complete statement of investments with the U.S. Securities and Exchange Commission for the first and third quarters for each fiscal year on Form N-Q. Shareholders may view the filed Form N-Q by visiting the Commission’s website at sec.gov. The filed form may also be viewed and copied at the Commission’s Public Reference Room in Washington, DC. Information regarding the operations of the Public Reference Room may be obtained by calling (800) SEC-0330.
Householding of Reports and Prospectuses
You will receive the Fund’s financial reports every six months as well as an annual updated summary prospectus (prospectus available upon request). To reduce Fund expenses, we try to identify related shareholders in a household and send only one copy of the financial reports and summary prospectus. This process, called “householding,” will continue indefinitely unless you instruct us otherwise. If you prefer not to have these documents householded, please call us at (800) 632-2301. At any time you may view current prospectuses/summary prospectuses and financial reports on our website. If you choose, you may receive these documents through electronic delivery.
franklintempleton.com
Annual Report
43
This page intentionally left blank.
Annual Report and Shareholder Letter
Franklin New York Tax-Free Income Fund
Investment Manager
Franklin Advisers, Inc.
Distributor
Franklin Templeton Distributors, Inc.
(800) DIAL BEN® / 342-5236
franklintempleton.com
Shareholder Services
(800) 632-2301
Authorized for distribution only when accompanied or preceded by a summary prospectus and/or prospectus. Investors should carefully consider a fund’s investment goals, risks, charges and expenses before investing. A prospectus contains this and other information; please read it carefully before investing.
To help ensure we provide you with quality service, all calls to and from our service areas are monitored and/or recorded.
| |
| © 2016 Franklin Templeton Investments. All rights reserved. | 115 A 07/16 |
Item 2. Code of Ethics.
(a) The Registrant has adopted a code of ethics that applies to its principal executive officers and principal financial and accounting officer.
(c) N/A
(d) N/A
(f) Pursuant to Item 12(a)(1), the Registrant is attaching as an exhibit a copy of its code of ethics that applies to its principal executive officers and principal financial and accounting officer.
Item 3. Audit Committee Financial Expert.
(a)(1) The Registrant has an audit committee financial expert serving on its audit committee.
(2) The audit committee financial expert is John B. Wilson and he is "independent" as defined under the relevant Securities and Exchange Commission Rules and Releases.
Item 4. Principal Accountant Fees and Services.
(a) Audit Fees
The aggregate fees paid to the principal accountant for professional services rendered by the principal accountant for the audit of the registrant’s annual financial statements or for services that are normally provided by the principal accountant in connection with statutory and regulatory filings or engagements were $46,961 for the fiscal year ended May 31, 2016 and $48,519 for the fiscal year ended May 31, 2015.
(b) Audit-Related Fees
There were no fees paid to the principal accountant for assurance and related services rendered by the principal accountant to the registrant that are reasonably related to the performance of the audit of the registrant's financial statements and are not reported under paragraph (a) of Item 4.
There were no fees paid to the principal accountant for assurance and related services rendered by the principal accountant to the registrant's investment adviser and any entity controlling, controlled by or under common control with the investment adviser that provides ongoing services to the registrant that are reasonably related to the performance of the audit of their financial statements.
(c) Tax Fees
There were no fees paid to the principal accountant for professional services rendered by the principal accountant to the registrant for tax compliance, tax advice and tax planning.
There were no fees paid to the principal accountant for professional services rendered by the principal accountant to the registrant’s investment adviser and any entity controlling, controlled by or under common control with the investment adviser that provides ongoing services to the registrant for tax compliance, tax advice and tax planning.
(d) All Other Fees
The aggregate fees paid to the principal accountant for products and services rendered by the principal accountant to the registrant not reported in paragraphs (a)-(c) of Item 4 were $1,856 for the fiscal year ended May 31, 2016 and $0 for the fiscal year ended May 31, 2015. The services for which these fees were paid included review of materials provided to the fund Board in connection with the investment management contract renewal process.
The aggregate fees paid to the principal accountant for products and services rendered by the principal accountant to the registrant’s investment adviser and any entity controlling, controlled by or under common control with the investment adviser that provides ongoing services to the registrant other than services reported in paragraphs (a)-(c) of Item 4 were $663,151 for the fiscal year ended May 31, 2016 and $9,000 for the fiscal year ended May 31, 2015. The services for which these fees were paid included preparation and review of materials provided to the fund Board in connection with the investment management contract renewal process and derivatives assessment, and review of system processes related to fixed income securities.
(e) (1) The registrant’s audit committee is directly responsible for approving the services to be provided by the auditors, including:
(i) pre-approval of all audit and audit related services;
(ii) pre-approval of all non-audit related services to be provided to the Fund by the auditors;
(iii) pre-approval of all non-audit related services to be provided to the registrant by the auditors to the registrant’s investment adviser or to any entity that controls, is controlled by or is under common control with the registrant’s investment adviser and that provides ongoing services to the registrant where the non-audit services relate directly to the operations or financial reporting of the registrant; and
(iv) establishment by the audit committee, if deemed necessary or appropriate, as an alternative to committee pre-approval of services to be provided by the auditors, as required by paragraphs (ii) and (iii) above, of policies and procedures to permit such services to be pre-approved by other means, such as through establishment of guidelines or by action of a designated member or members of the committee; provided the policies and procedures are detailed as to the particular service and the committee is informed of each service and such policies and procedures do not include delegation of audit committee responsibilities, as contemplated under the Securities Exchange Act of 1934, to management; subject, in the case of (ii) through (iv), to any waivers, exceptions or exemptions that may be available under applicable law or rules.
(e) (2) None of the services provided to the registrant described in paragraphs (b)-(d) of Item 4 were approved by the audit committee pursuant to paragraph (c)(7)(i)(C) of Rule 2-01 of regulation S-X.
(f) No disclosures are required by this Item 4(f).
(g) The aggregate non-audit fees paid to the principal accountant for services rendered by the principal accountant to the registrant and the registrant’s investment adviser and any entity controlling, controlled by or under common control with the investment adviser that provides ongoing services to the registrant were $665,007 for the fiscal year ended May 31, 2016 and $9,000 for the fiscal year ended May 31, 2015.
(h) The registrant’s audit committee of the board has considered whether the provision of non-audit services that were rendered to the registrant’s investment adviser (not including any sub-adviser whose role is primarily portfolio management and is subcontracted with or overseen by another investment adviser), and any entity controlling, controlled by, or under common control with the investment adviser that provides ongoing services to the registrant that were not pre-approved pursuant to paragraph (c)(7)(ii) of Rule 2-01 of Regulation S-X is compatible with maintaining the principal accountant’s independence.
Item 5. Audit Committee of Listed Registrants. N/A
Item 6. Schedule of Investments. N/A
Item 7. Disclosure of Proxy Voting Policies and Procedures for Closed-End Management Investment Companies. N/A
Item 8. Portfolio Managers of Closed-End Management Investment Companies. N/A
Item 9. Purchases of Equity Securities by Closed-End Management Investment Company and Affiliated Purchasers. N/A
Item 10. Submission of Matters to a Vote of Security Holders.
There have been no changes to the procedures by which shareholders may recommend nominees to the Registrant's Board of Trustees that would require disclosure herein.
Item 11. Controls and Procedures.
(a) Evaluation of Disclosure Controls and Procedures. The Registrant maintains disclosure controls and procedures that are designed to ensure that information required to be disclosed in the Registrant’s filings under the Securities Exchange Act of 1934 and the Investment Company Act of 1940 is recorded, processed, summarized and reported within the periods specified in the rules and forms of the Securities and Exchange Commission. Such information is accumulated and communicated to the Registrant’s management, including its principal executive officer and principal financial officer, as appropriate, to allow timely decisions regarding required disclosure. The Registrant’s management, including the principal executive officer and the principal financial officer, recognizes that any set of controls and procedures, no matter how well designed and operated, can provide only reasonable assurance of achieving the desired control objectives.
Within 90 days prior to the filing date of this Shareholder Report on Form N-CSR, the Registrant had carried out an evaluation, under the supervision and with the participation of the Registrant’s management, including the Registrant’s principal executive officer and the Registrant’s principal financial officer, of the effectiveness of the design and operation of the Registrant’s disclosure controls and procedures. Based on such evaluation, the Registrant’s principal executive officer and principal financial officer concluded that the Registrant’s disclosure controls and procedures are effective.
(b) Changes in Internal Controls. There have been no changes in the Registrant’s internal controls or in other factors that could materially affect the internal controls over financial reporting subsequent to the date of their evaluation in connection with the preparation of this Shareholder Report on Form N-CSR.
Item 12. Exhibits.
(a)(1) Code of Ethics
(a)(2) Certifications pursuant to Section 302 of the Sarbanes-Oxley Act of 2002 of Laura F. Fergerson, Chief Executive Officer - Finance and Administration, and Gaston Gardey, Chief Financial Officer and Chief Accounting Officer
(b) Certifications pursuant to Section 906 of the Sarbanes-Oxley Act of 2002 of Laura F. Fergerson, Chief Executive Officer - Finance and Administration, and Gaston Gardey, Chief Financial Officer and Chief Accounting Officer
SIGNATURES
Pursuant to the requirements of the Securities Exchange Act of 1934 and the Investment Company Act of 1940, the registrant has duly caused this report to be signed on its behalf by the undersigned, thereunto duly authorized.
FRANKLIN NEW YORK TAX-FREE INCOME FUND
By /s/ Laura F. Fergerson
Laura F. Fergerson
Chief Executive Officer –
Finance and Administration
Date July 27, 2016
Pursuant to the requirements of the Securities Exchange Act of 1934 and the Investment Company Act of 1940, this report has been signed below by the following persons on behalf of the registrant and in the capacities and on the dates indicated.
By /s/ Laura F. Fergerson
Laura F. Fergerson
Chief Executive Officer –
Finance and Administration
Date July 27, 2016
By /s/ Gaston Gardey
Gaston Gardey
Chief Financial Officer and
Chief Accounting Officer
Date July 27, 2016