UNITED STATES
SECURITIES AND EXCHANGE COMMISSION
Washington, DC 20549
FORM N-CSRS
CERTIFIED SHAREHOLDER REPORT OF REGISTERED
MANAGEMENT INVESTMENT COMPANIES
Investment Company Act file number 811-03479
Franklin New York Tax-Free Income Fund
(Exact name of registrant as specified in charter)
One Franklin Parkway, San Mateo, CA 94403-1906
(Address of principal executive offices) (Zip code)
Alison Baur, One Franklin Parkway, San Mateo, CA 94403-1906
(Name and address of agent for service)
Registrant’s telephone number, including area code: 650 312-2000
Date of fiscal year end: 2/28
Date of reporting period: 8/31/24
Item 1. Reports to Stockholders.
| a.) | The following is a copy of the report transmitted to shareholders pursuant to Rule 30e-1 under the Investment Company Act of 1940, as amended (the “1940 Act”) (17 CFR 270.30e-1).
|
| b.) | Include a copy of each notice transmitted to stockholders in reliance on Rule 30e-3 under the Act (17 CFR 270.30e-3) that contains disclosures specified by paragraph (c)(3) of that rule. |
Not Applicable.
| | |
Franklin New York Tax-Free Income Fund | |
| Class A [FNYQX] |
| Semi-Annual Shareholder Report | August 31, 2024 |
|
This semi-annual shareholder report contains important information about Franklin New York Tax-Free Income Fund for the period March 1, 2024, to August 31, 2024.
You can find additional information about the Fund at https://www.franklintempleton.com/regulatory-fund-documents. You can also request this information by contacting us at (800) DIAL BEN/342-5236.
WHAT WERE THE FUND COSTS FOR THE LAST SIX MONTHS? (based on a hypothetical $10,000 investment)
| | |
Class Name | Costs of a $10,000 investment | Costs paid as a percentage of a $10,000 investment† |
| Class A | $40 | 0.78% |
KEY FUND STATISTICS (as of August 31, 2024)
| |
Total Net Assets | $2,797,288,102 |
Total Number of Portfolio Holdings* | 441 |
Portfolio Turnover Rate | 6.08% |
| * | Does not include derivatives, except purchased options, if any. |
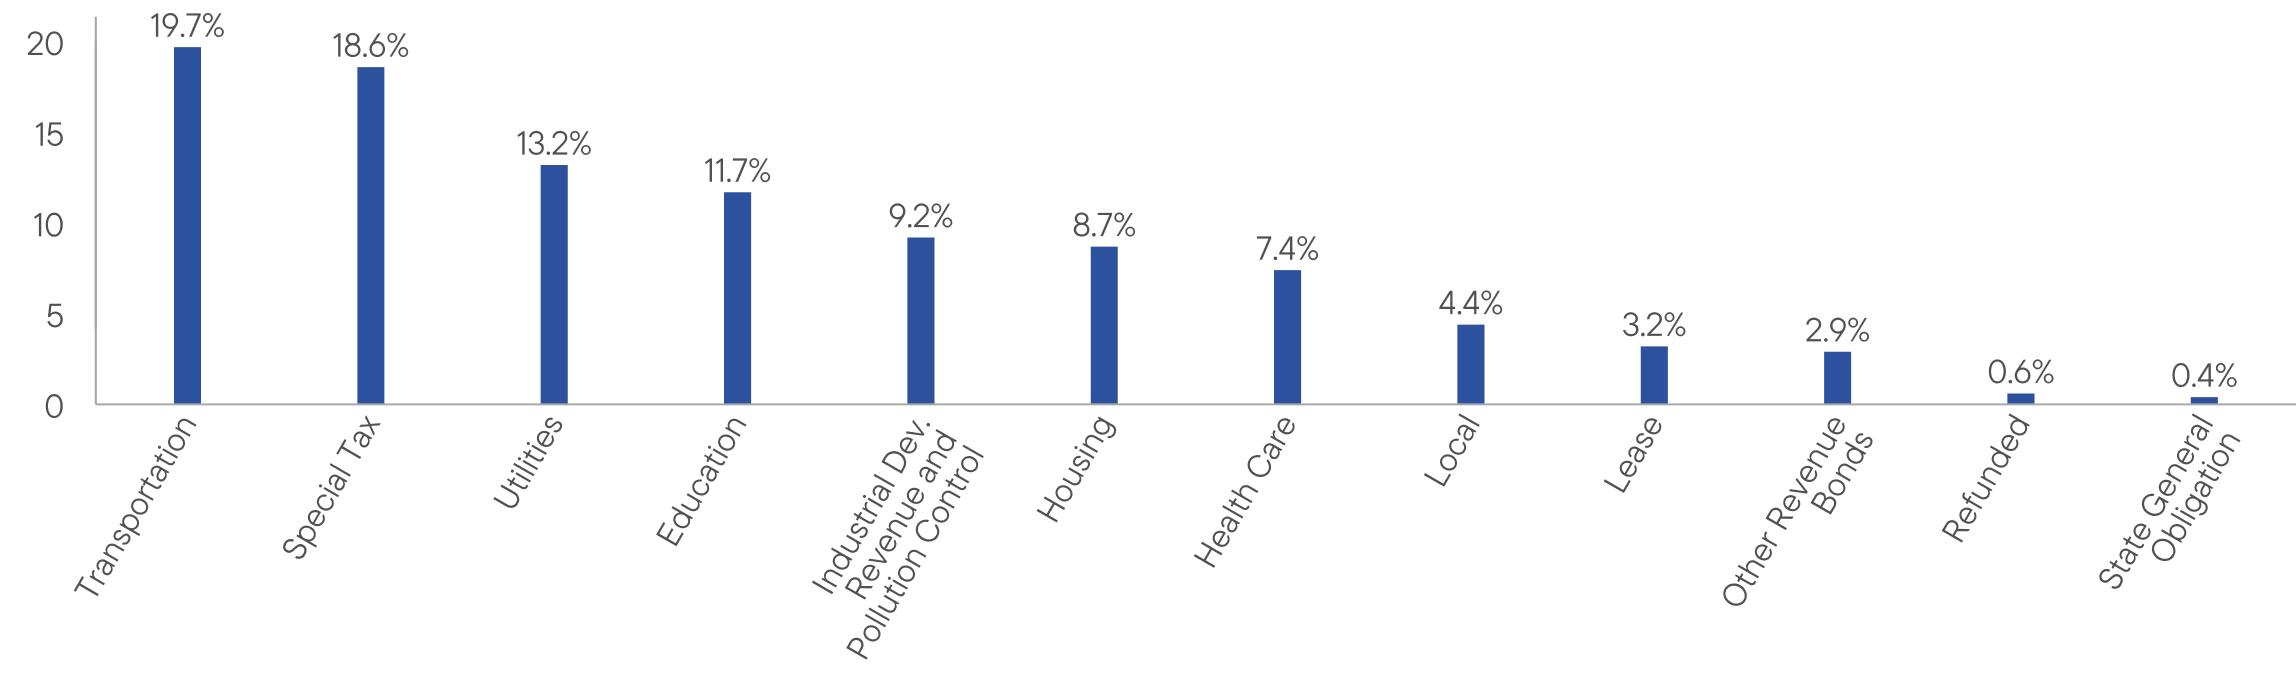
WHAT DID THE FUND INVEST IN? (as of August 31, 2024)
Portfolio Composition* (% of Total Investments)
| * | Does not include derivatives, except purchased options, if any. |
| |
| WHERE CAN I FIND ADDITIONAL INFORMATION ABOUT THE FUND? |
Additional information is available on https://www.franklintempleton.com/regulatory-fund-documents, including its: |
| • prospectus • proxy voting information • financial information • holdings • tax information |
| Franklin New York Tax-Free Income Fund | PAGE 1 | 1115-STSR-1024 |
19.718.613.211.79.28.77.44.43.22.90.60.4
| | |
Franklin New York Tax-Free Income Fund | |
| Class A1 [FNYTX] |
| Semi-Annual Shareholder Report | August 31, 2024 |
|
This semi-annual shareholder report contains important information about Franklin New York Tax-Free Income Fund for the period March 1, 2024, to August 31, 2024.
You can find additional information about the Fund at https://www.franklintempleton.com/regulatory-fund-documents. You can also request this information by contacting us at (800) DIAL BEN/342-5236.
WHAT WERE THE FUND COSTS FOR THE LAST SIX MONTHS? (based on a hypothetical $10,000 investment)
| | |
Class Name | Costs of a $10,000 investment | Costs paid as a percentage of a $10,000 investment† |
| Class A1 | $32 | 0.63% |
KEY FUND STATISTICS (as of August 31, 2024)
| |
Total Net Assets | $2,797,288,102 |
Total Number of Portfolio Holdings* | 441 |
Portfolio Turnover Rate | 6.08% |
| * | Does not include derivatives, except purchased options, if any. |
WHAT DID THE FUND INVEST IN? (as of August 31, 2024)
Portfolio Composition* (% of Total Investments)
| * | Does not include derivatives, except purchased options, if any. |
| |
| WHERE CAN I FIND ADDITIONAL INFORMATION ABOUT THE FUND? |
Additional information is available on https://www.franklintempleton.com/regulatory-fund-documents, including its: |
| • prospectus • proxy voting information • financial information • holdings • tax information |
| Franklin New York Tax-Free Income Fund | PAGE 1 | 115-STSR-1024 |
19.718.613.211.79.28.77.44.43.22.90.60.4
| | |
Franklin New York Tax-Free Income Fund | |
| Class C [FNYIX] |
| Semi-Annual Shareholder Report | August 31, 2024 |
|
This semi-annual shareholder report contains important information about Franklin New York Tax-Free Income Fund for the period March 1, 2024, to August 31, 2024.
You can find additional information about the Fund at https://www.franklintempleton.com/regulatory-fund-documents. You can also request this information by contacting us at (800) DIAL BEN/342-5236.
WHAT WERE THE FUND COSTS FOR THE LAST SIX MONTHS? (based on a hypothetical $10,000 investment)
| | |
Class Name | Costs of a $10,000 investment | Costs paid as a percentage of a $10,000 investment† |
| Class C | $60 | 1.18% |
KEY FUND STATISTICS (as of August 31, 2024)
| |
Total Net Assets | $2,797,288,102 |
Total Number of Portfolio Holdings* | 441 |
Portfolio Turnover Rate | 6.08% |
| * | Does not include derivatives, except purchased options, if any. |
WHAT DID THE FUND INVEST IN? (as of August 31, 2024)
Portfolio Composition* (% of Total Investments)
| * | Does not include derivatives, except purchased options, if any. |
| |
| WHERE CAN I FIND ADDITIONAL INFORMATION ABOUT THE FUND? |
Additional information is available on https://www.franklintempleton.com/regulatory-fund-documents, including its: |
| • prospectus • proxy voting information • financial information • holdings • tax information |
| Franklin New York Tax-Free Income Fund | PAGE 1 | 215-STSR-1024 |
19.718.613.211.79.28.77.44.43.22.90.60.4
| | |
Franklin New York Tax-Free Income Fund | |
| Class R6 [FKTJX] |
| Semi-Annual Shareholder Report | August 31, 2024 |
|
This semi-annual shareholder report contains important information about Franklin New York Tax-Free Income Fund for the period March 1, 2024, to August 31, 2024.
You can find additional information about the Fund at https://www.franklintempleton.com/regulatory-fund-documents. You can also request this information by contacting us at (800) DIAL BEN/342-5236.
WHAT WERE THE FUND COSTS FOR THE LAST SIX MONTHS? (based on a hypothetical $10,000 investment)
| | |
Class Name | Costs of a $10,000 investment | Costs paid as a percentage of a $10,000 investment† |
| Class R6 | $25 | 0.49% |
KEY FUND STATISTICS (as of August 31, 2024)
| |
Total Net Assets | $2,797,288,102 |
Total Number of Portfolio Holdings* | 441 |
Portfolio Turnover Rate | 6.08% |
| * | Does not include derivatives, except purchased options, if any. |
WHAT DID THE FUND INVEST IN? (as of August 31, 2024)
Portfolio Composition* (% of Total Investments)
| * | Does not include derivatives, except purchased options, if any. |
| |
| WHERE CAN I FIND ADDITIONAL INFORMATION ABOUT THE FUND? |
Additional information is available on https://www.franklintempleton.com/regulatory-fund-documents, including its: |
| • prospectus • proxy voting information • financial information • holdings • tax information |
| Franklin New York Tax-Free Income Fund | PAGE 1 | 8115-STSR-1024 |
19.718.613.211.79.28.77.44.43.22.90.60.4
| | |
Franklin New York Tax-Free Income Fund | |
| Advisor Class [FNYAX] |
| Semi-Annual Shareholder Report | August 31, 2024 |
|
This semi-annual shareholder report contains important information about Franklin New York Tax-Free Income Fund for the period March 1, 2024, to August 31, 2024.
You can find additional information about the Fund at https://www.franklintempleton.com/regulatory-fund-documents. You can also request this information by contacting us at (800) DIAL BEN/342-5236.
WHAT WERE THE FUND COSTS FOR THE LAST SIX MONTHS? (based on a hypothetical $10,000 investment)
| | |
Class Name | Costs of a $10,000 investment | Costs paid as a percentage of a $10,000 investment† |
| Advisor Class | $27 | 0.53% |
KEY FUND STATISTICS (as of August 31, 2024)
| |
Total Net Assets | $2,797,288,102 |
Total Number of Portfolio Holdings* | 441 |
Portfolio Turnover Rate | 6.08% |
| * | Does not include derivatives, except purchased options, if any. |
WHAT DID THE FUND INVEST IN? (as of August 31, 2024)
Portfolio Composition* (% of Total Investments)
| * | Does not include derivatives, except purchased options, if any. |
| |
| WHERE CAN I FIND ADDITIONAL INFORMATION ABOUT THE FUND? |
Additional information is available on https://www.franklintempleton.com/regulatory-fund-documents, including its: |
| • prospectus • proxy voting information • financial information • holdings • tax information |
| Franklin New York Tax-Free Income Fund | PAGE 1 | 615-STSR-1024 |
19.718.613.211.79.28.77.44.43.22.90.60.4
Item 2. Code of Ethics. N/A
Item 3. Audit Committee Financial Expert. N/A
Item 4. Principal Accountant Fees and Services. N/A
Item 5. Audit Committee of Listed Registrants. N/A
Item 6. Schedule of Investments.
(a) Please see schedule of investments contained in the Financial Statements and Financial Highlights included under Item 7 of this Form N-CSR.
(b) N/A
Item 7. Financial Statements and Financial Highlights for Open-End Management Investment Companies.
Franklin
New
York
Tax-Free
Income
Fund
Financial
Statements
and
Other
Important
Information
Semiannual
|
August
31,
2024
Financial
Statements
and
Other
Important
Information—Semiannual
Financial
Highlights
and
Schedule
of
Investments
2
Financial
Statements
19
Notes
to
Financial
Statements
(unaudited)
23
Changes
In
and
Disagreements
with
Accountants
30
Results
of
Meeting(s)
of
Shareholders
30
Remuneration
Paid
to
Directors,
Officers
and
Others
30
Board
Approval
of
Management
and
Subadvisory
Agreements
30
Franklin
New
York
Tax-Free
Income
Fund
Semiannual
Report
The
accompanying
notes
are
an
integral
part
of
these
financial
statements.
a
Six
Months
Ended
August
31,
2024
(unaudited)
Year
Ended
February
28,
Year
Ended
February
28,
2022
b
Year
Ended
May
31,
Year
Ended
May
31,
2019
c
2024
a
2023
2021
2020
Class
A
Per
share
operating
performance
(for
a
share
outstanding
throughout
the
period)
Net
asset
value,
beginning
of
period
..............
$10.02
$9.72
$10.83
$11.38
$11.09
$11.10
$10.75
Income
from
investment
operations
d
:
Net
investment
income
e
.
0.16
0.30
0.27
0.19
0.28
0.29
0.24
Net
realized
and
unrealized
gains
(losses)
0.03
0.30
(1.11)
(0.55)
0.29
(0.01)
0.34
Total
from
investment
operations
.............
0.19
0.60
(0.84)
(0.36)
0.57
0.28
0.58
Less
distributions
from:
Net
investment
income
..
(0.16)
(0.30)
(0.27)
(0.19)
(0.28)
(0.29)
(0.23)
Net
asset
value,
end
of
period
................
$10.05
$10.02
$9.72
$10.83
$11.38
$11.09
$11.10
Total
return
f
............
1.89%
6.29%
(7.77)%
(3.25)%
5.15%
2.51%
5.46%
Ratios
to
average
net
assets
g
Expenses
h
............
0.78%
0.75%
0.81%
0.82%
0.78%
0.78%
0.78%
Net
investment
income
...
3.10%
3.08%
2.74%
2.21%
2.48%
2.59%
3.09%
Supplemental
data
Net
assets,
end
of
period
(000’s)
...............
$354,551
$361,554
$351,002
$409,409
$367,358
$291,562
$177,982
Portfolio
turnover
rate
....
6.08%
15.99%
22.81%
11.94%
12.15%
21.27%
19.78%
a
For
the
year
ended
February
29.
b
For
the
period
June
1,
2021
to
February
28,
2022.
c
For
the
period
September
10,
2018
(effective
date)
to
May
31,
2019.
d
The
amount
shown
for
a
share
outstanding
throughout
the
period
may
not
correlate
with
the
Statement
of
Operations
for
the
period
due
to
the
timing
of
sales
and
repurchas-
es
of
the
Fund’s
shares
in
relation
to
income
earned
and/or
fluctuating
fair
value
of
the
investments
of
the
Fund.
e
Based
on
average
daily
shares
outstanding.
f
Total
return
does
not
reflect
sales
commissions
or
contingent
deferred
sales
charges,
if
applicable,
and
is
not
annualized
for
periods
less
than
one
year.
g
Ratios
are
annualized
for
periods
less
than
one
year.
h
Benefit
of
expense
reduction
rounds
to
less
than
0.01%.
Franklin
New
York
Tax-Free
Income
Fund
Financial
Highlights
The
accompanying
notes
are
an
integral
part
of
these
financial
statements.
Semiannual
Report
a
Six
Months
Ended
August
31,
2024
(unaudited)
Year
Ended
February
28,
Year
Ended
February
28,
2022
b
Year
Ended
May
31,
2024
a
2023
2021
2020
2019
Class
A1
Per
share
operating
performance
(for
a
share
outstanding
throughout
the
period)
Net
asset
value,
beginning
of
period
..............
$10.03
$9.73
$10.84
$11.39
$11.10
$11.10
$10.86
Income
from
investment
operations
c
:
Net
investment
income
d
.
0.16
0.32
0.29
0.20
0.30
0.31
0.35
Net
realized
and
unrealized
gains
(losses)
0.02
0.29
(1.12)
(0.55)
0.28
(0.01)
0.25
Total
from
investment
operations
.............
0.18
0.61
(0.83)
(0.35)
0.58
0.30
0.60
Less
distributions
from:
Net
investment
income
..
(0.16)
(0.31)
(0.28)
(0.20)
(0.29)
(0.30)
(0.36)
Net
asset
value,
end
of
period
................
$10.05
$10.03
$9.73
$10.84
$11.39
$11.10
$11.10
Total
return
e
...........
1.87%
6.44%
(7.63)%
(3.13)%
5.31%
2.75%
5.67%
Ratios
to
average
net
assets
f
Expenses
g
............
0.63%
0.60%
0.66%
0.67%
0.63%
0.63%
0.63%
Net
investment
income
...
3.25%
3.23%
2.89%
2.36%
2.63%
2.74%
3.24%
Supplemental
data
Net
assets,
end
of
period
(000’s)
...............
$1,799,531
$1,891,646
$2,010,712
$2,514,275
$2,775,454
$2,902,606
$3,192,168
Portfolio
turnover
rate
....
6.08%
15.99%
22.81%
11.94%
12.15%
21.27%
19.78%
a
For
the
year
ended
February
29.
b
For
the
period
June
1,
2021
to
February
28,
2022.
c
The
amount
shown
for
a
share
outstanding
throughout
the
period
may
not
correlate
with
the
Statement
of
Operations
for
the
period
due
to
the
timing
of
sales
and
repurchas-
es
of
the
Fund’s
shares
in
relation
to
income
earned
and/or
fluctuating
fair
value
of
the
investments
of
the
Fund.
d
Based
on
average
daily
shares
outstanding.
e
Total
return
does
not
reflect
sales
commissions
or
contingent
deferred
sales
charges,
if
applicable,
and
is
not
annualized
for
periods
less
than
one
year.
f
Ratios
are
annualized
for
periods
less
than
one
year.
g
Benefit
of
expense
reduction
rounds
to
less
than
0.01%.
Franklin
New
York
Tax-Free
Income
Fund
Financial
Highlights
Semiannual
Report
The
accompanying
notes
are
an
integral
part
of
these
financial
statements.
a
Six
Months
Ended
August
31,
2024
(unaudited)
Year
Ended
February
28,
Year
Ended
February
28,
2022
b
Year
Ended
May
31,
2024
a
2023
2021
2020
2019
Class
C
Per
share
operating
performance
(for
a
share
outstanding
throughout
the
period)
Net
asset
value,
beginning
of
period
..............
$10.02
$9.72
$10.82
$11.38
$11.08
$11.09
$10.85
Income
from
investment
operations
c
:
Net
investment
income
d
.
0.14
0.26
0.23
0.15
0.24
0.24
0.29
Net
realized
and
unrealized
gains
(losses)
0.02
0.30
(1.10)
(0.56)
0.29
(0.01)
0.25
Total
from
investment
operations
.............
0.16
0.56
(0.87)
(0.41)
0.53
0.23
0.54
Less
distributions
from:
Net
investment
income
..
(0.14)
(0.26)
(0.23)
(0.15)
(0.23)
(0.24)
(0.30)
Net
asset
value,
end
of
period
................
$10.04
$10.02
$9.72
$10.82
$11.38
$11.08
$11.09
Total
return
e
...........
1.59%
5.86%
(8.06)%
(3.62)%
4.83%
2.10%
5.10%
Ratios
to
average
net
assets
f
Expenses
g
............
1.18%
1.15%
1.21%
1.22%
1.18%
1.18%
1.18%
Net
investment
income
...
2.70%
2.67%
2.33%
1.82%
2.10%
2.19%
2.69%
Supplemental
data
Net
assets,
end
of
period
(000’s)
...............
$55,149
$64,099
$89,134
$129,772
$202,215
$257,275
$332,093
Portfolio
turnover
rate
....
6.08%
15.99%
22.81%
11.94%
12.15%
21.27%
19.78%
a
For
the
year
ended
February
29.
b
For
the
period
June
1,
2021
to
February
28,
2022.
c
The
amount
shown
for
a
share
outstanding
throughout
the
period
may
not
correlate
with
the
Statement
of
Operations
for
the
period
due
to
the
timing
of
sales
and
repurchas-
es
of
the
Fund’s
shares
in
relation
to
income
earned
and/or
fluctuating
fair
value
of
the
investments
of
the
Fund.
d
Based
on
average
daily
shares
outstanding.
e
Total
return
does
not
reflect
sales
commissions
or
contingent
deferred
sales
charges,
if
applicable,
and
is
not
annualized
for
periods
less
than
one
year.
f
Ratios
are
annualized
for
periods
less
than
one
year.
g
Benefit
of
expense
reduction
rounds
to
less
than
0.01%.
Franklin
New
York
Tax-Free
Income
Fund
Financial
Highlights
The
accompanying
notes
are
an
integral
part
of
these
financial
statements.
Semiannual
Report
a
Six
Months
Ended
August
31,
2024
(unaudited)
Year
Ended
February
28,
Year
Ended
February
28,
2022
b
Year
Ended
May
31,
2024
a
2023
2021
2020
2019
Class
R6
Per
share
operating
performance
(for
a
share
outstanding
throughout
the
period)
Net
asset
value,
beginning
of
period
..............
$10.04
$9.74
$10.85
$11.41
$11.11
$11.12
$10.88
Income
from
investment
operations
c
:
Net
investment
income
d
.
0.17
0.33
0.30
0.21
0.31
0.32
0.36
Net
realized
and
unrealized
gains
(losses)
0.03
0.30
(1.11)
(0.55)
0.30
(0.01)
0.25
Total
from
investment
operations
.............
0.20
0.63
(0.81)
(0.34)
0.61
0.31
0.61
Less
distributions
from:
Net
investment
income
..
(0.17)
(0.33)
(0.30)
(0.22)
(0.31)
(0.32)
(0.37)
Net
asset
value,
end
of
period
................
$10.07
$10.04
$9.74
$10.85
$11.41
$11.11
$11.12
Total
return
e
...........
2.04%
6.55%
(7.48)%
(3.10)%
5.54%
2.80%
5.80%
Ratios
to
average
net
assets
f
Expenses
g
............
0.49%
0.49%
0.51%
0.50%
0.50%
0.50%
0.50%
h
Net
investment
income
...
3.39%
3.34%
3.04%
2.52%
2.76%
2.87%
3.37%
Supplemental
data
Net
assets,
end
of
period
(000’s)
...............
$106,154
$98,748
$86,891
$97,268
$89,785
$71,991
$62,689
Portfolio
turnover
rate
....
6.08%
15.99%
22.81%
11.94%
12.15%
21.27%
19.78%
a
For
the
year
ended
February
29.
b
For
the
period
June
1,
2021
to
February
28,
2022.
c
The
amount
shown
for
a
share
outstanding
throughout
the
period
may
not
correlate
with
the
Statement
of
Operations
for
the
period
due
to
the
timing
of
sales
and
repurchas-
es
of
the
Fund’s
shares
in
relation
to
income
earned
and/or
fluctuating
fair
value
of
the
investments
of
the
Fund.
d
Based
on
average
daily
shares
outstanding.
e
Total
return
is
not
annualized
for
periods
less
than
one
year.
f
Ratios
are
annualized
for
periods
less
than
one
year.
g
Benefit
of
expense
reduction
rounds
to
less
than
0.01%.
h
Benefit
of
waiver
and
payments
by
affiliates
rounds
to
less
than
0.01%.
Franklin
New
York
Tax-Free
Income
Fund
Financial
Highlights
Semiannual
Report
The
accompanying
notes
are
an
integral
part
of
these
financial
statements.
a
Six
Months
Ended
August
31,
2024
(unaudited)
Year
Ended
February
28,
Year
Ended
February
28,
2022
b
Year
Ended
May
31,
2024
a
2023
2021
2020
2019
Advisor
Class
Per
share
operating
performance
(for
a
share
outstanding
throughout
the
period)
Net
asset
value,
beginning
of
period
..............
$10.04
$9.74
$10.84
$11.40
$11.10
$11.11
$10.87
Income
from
investment
operations
c
:
Net
investment
income
d
.
0.17
0.33
0.30
0.21
0.31
0.32
0.36
Net
realized
and
unrealized
gains
(losses)
0.02
0.29
(1.11)
(0.56)
0.29
(0.02)
0.25
Total
from
investment
operations
.............
0.19
0.62
(0.81)
(0.35)
0.60
0.30
0.61
Less
distributions
from:
Net
investment
income
..
(0.17)
(0.32)
(0.29)
(0.21)
(0.30)
(0.31)
(0.37)
Net
asset
value,
end
of
period
................
$10.06
$10.04
$9.74
$10.84
$11.40
$11.10
$11.11
Total
return
e
...........
1.92%
6.54%
(7.44)%
(3.15)%
5.50%
2.76%
5.77%
Ratios
to
average
net
assets
f
Expenses
g
............
0.53%
0.50%
0.57%
0.57%
0.53%
0.53%
0.53%
Net
investment
income
...
3.35%
3.35%
3.01%
2.46%
2.73%
2.84%
3.34%
Supplemental
data
Net
assets,
end
of
period
(000’s)
...............
$481,902
$489,421
$328,181
$277,600
$287,411
$266,050
$220,727
Portfolio
turnover
rate
....
6.08%
15.99%
22.81%
11.94%
12.15%
21.27%
19.78%
a
For
the
year
ended
February
29.
b
For
the
period
June
1,
2021
to
February
28,
2022.
c
The
amount
shown
for
a
share
outstanding
throughout
the
period
may
not
correlate
with
the
Statement
of
Operations
for
the
period
due
to
the
timing
of
sales
and
repurchas-
es
of
the
Fund’s
shares
in
relation
to
income
earned
and/or
fluctuating
fair
value
of
the
investments
of
the
Fund.
d
Based
on
average
daily
shares
outstanding.
e
Total
return
is
not
annualized
for
periods
less
than
one
year.
f
Ratios
are
annualized
for
periods
less
than
one
year.
g
Benefit
of
expense
reduction
rounds
to
less
than
0.01%.
Franklin
New
York
Tax-Free
Income
Fund
Schedule
of
Investments
(unaudited),
August
31,
2024
The
accompanying
notes
are
an
integral
part
of
these
financial
statements.
Semiannual
Report
a
a
Principal
Amount
a
Value
a
a
a
a
a
Corporate
Bonds
0.2%
Software
0.2%
a
Haven
at
Elgin
LLC
,
5.25
%
,
12/31/53
....................................
$
6,700,000
$
6,887,395
Total
Corporate
Bonds
(Cost
$
6,700,000
)
.......................................
6,887,395
Municipal
Bonds
98.2%
California
0.2%
California
Municipal
Finance
Authority
,
Integrity
Housing
Obligated
Group
,
Revenue
,
2022
A-1
,
4.25
%
,
12/01/37
...........................................
5,800,000
5,138,966
Florida
1.9%
Capital
Trust
Agency,
Inc.
,
Kingdom
Development
West
Palm
Beach
Portfolio
Obligated
Group
,
Revenue
,
2021
A-1
,
3.75
%
,
12/01/36
.............................................
18,760,000
16,758,019
Kingdom
Development
West
Palm
Beach
Portfolio
Obligated
Group
,
Revenue
,
2021
A-2
,
5.5
%
,
12/01/30
..............................................
2,770,000
2,510,617
b
SHI
-
Lake
Osborne
LLC
,
Revenue
,
144A,
2021
A-1
,
3.68
%
,
1/01/57
...........
3,990,000
2,888,523
b
Capital
Trust
Authority
,
Gulf
Coast
Portfolio
Obligated
Group
,
Revenue
,
144A,
2024
,
Refunding
,
Zero
Cpn.,
3/01/29
........................................
23,200,000
18,410,520
b
Leon
County
Housing
Finance
Authority
,
Revenue
,
144A,
2022
A
,
Zero
Cpn.,
5/01/57
15,500,000
13,775,625
54,343,304
Georgia
0.3%
b
Development
Authority
of
Rockdale
County
,
AHPC
Terraces
at
Fieldstone
LLC
,
Revenue
,
144A,
2021
A-1
,
3.5
%
,
12/01/36
...............................
11,550,000
9,777,930
Illinois
1.0%
Metropolitan
Pier
&
Exposition
Authority
,
State
of
Illinois
McCormick
Place
Expansion
Project
Fund
,
Revenue
,
2022
A
,
Refunding
,
4
%
,
12/15/42
...........................................
6,970,000
6,887,777
State
of
Illinois
McCormick
Place
Expansion
Project
Fund
,
Revenue
,
2022
A
,
Refunding
,
4
%
,
6/15/52
............................................
10,310,000
9,598,834
State
of
Illinois
,
GO
,
2003
,
5.1
%
,
6/01/33
............................................
4,705,882
4,737,160
GO
,
2020
B
,
5
%
,
10/01/29
...........................................
1,000,000
1,096,730
GO
,
2021
A
,
5
%
,
3/01/31
............................................
650,000
723,731
GO
,
2021
A
,
5
%
,
3/01/32
............................................
500,000
553,941
GO
,
2021
A
,
5
%
,
3/01/34
............................................
2,000,000
2,202,386
GO
,
2021
A
,
4
%
,
3/01/38
............................................
2,600,000
2,586,289
28,386,848
Kentucky
0.2%
b
Louisville/Jefferson
County
Metropolitan
Government
,
PSG
Vesta
Derby
Oaks
LLC
,
Revenue
,
144A,
2022
A
,
Zero
Cpn.,
5/01/52
..............................
7,600,000
6,071,780
New
Jersey
0.5%
New
Jersey
Economic
Development
Authority
,
State
of
New
Jersey
,
Revenue
,
2021
QQQ
,
4
%
,
6/15/50
.................................................
1,500,000
1,443,315
New
Jersey
Transportation
Trust
Fund
Authority
,
State
of
New
Jersey
,
Revenue
,
2020
AA
,
5
%
,
6/15/50
......................
4,750,000
4,994,244
State
of
New
Jersey
,
Revenue
,
2022
A
,
4
%
,
6/15/41
........................
1,500,000
1,496,173
State
of
New
Jersey
,
Revenue
,
2022
BB
,
4
%
,
6/15/46
......................
5,000,000
4,831,574
12,765,306
New
York
89.7%
Albany
Capital
Resource
Corp.
,
Albany
College
of
Pharmacy
and
Health
Sciences
,
Revenue
,
2022
A
,
Refunding
,
5.25
%
,
12/01/38
.................................................
6,505,000
6,846,723
Equitable
School
Revolving
Fund
LLC
Obligated
Group
,
Revenue
,
2021
D
,
4
%
,
11/01/51
.......................................................
2,000,000
1,934,464
Franklin
New
York
Tax-Free
Income
Fund
Schedule
of
Investments
(unaudited)
Semiannual
Report
The
accompanying
notes
are
an
integral
part
of
these
financial
statements.
a
a
Principal
Amount
a
Value
a
a
a
a
a
Municipal
Bonds
(continued)
New
York
(continued)
Albany
Capital
Resource
Corp.,
(continued)
KIPP
Capital
Region
Public
Charter
Schools
,
Revenue
,
2024
,
4.75
%
,
6/01/54
....
$
1,200,000
$
1,202,291
KIPP
Capital
Region
Public
Charter
Schools
,
Revenue
,
2024
,
5
%
,
6/01/64
.......
2,250,000
2,272,288
Allegany
County
Capital
Resource
Corp.
,
Alfred
University
,
Revenue
,
2024
,
5.25
%
,
4/01/49
..........................
1,700,000
1,784,087
Alfred
University
,
Revenue
,
2024
,
5.25
%
,
4/01/54
..........................
3,000,000
3,124,980
Battery
Park
City
Authority
,
Revenue,
Senior
Lien
,
2019
A
,
5
%
,
11/01/49
.............................
6,130,000
6,556,653
Revenue,
Senior
Lien
,
2023
A
,
5
%
,
11/01/48
.............................
20,000,000
22,175,846
Brookhaven
Local
Development
Corp.
,
Active
Retirement
Community,
Inc.
Obligated
Group
,
Revenue
,
2020
A
,
4
%
,
11/01/45
1,500,000
1,427,789
Active
Retirement
Community,
Inc.
Obligated
Group
,
Revenue
,
2020
A
,
4
%
,
11/01/55
8,000,000
7,209,061
Broome
County
Local
Development
Corp.
,
Good
Shepherd
Village
at
Endwell
Obligated
Group
,
Revenue
,
2021
,
Refunding
,
4
%
,
7/01/36
........................................................
1,600,000
1,544,260
Good
Shepherd
Village
at
Endwell
Obligated
Group
,
Revenue
,
2021
,
Refunding
,
4
%
,
7/01/41
........................................................
1,530,000
1,407,998
Good
Shepherd
Village
at
Endwell
Obligated
Group
,
Revenue
,
2021
,
Refunding
,
4
%
,
7/01/47
........................................................
1,160,000
1,008,789
United
Health
Services
Hospitals
Obligated
Group
,
Revenue
,
2020
,
Refunding
,
AGMC
Insured
,
3
%
,
4/01/45
........................................
7,045,000
5,531,249
Buffalo
&
Erie
County
Industrial
Land
Development
Corp.
,
Catholic
Health
System
Obligated
Group
,
Revenue
,
2015
,
5.25
%
,
7/01/35
.......
1,000,000
987,744
Catholic
Health
System
Obligated
Group
,
Revenue
,
2015
,
5
%
,
7/01/40
.........
1,000,000
954,650
D'Youville
University
,
Revenue
,
2020
A
,
Refunding
,
4
%
,
11/01/50
..............
2,500,000
2,094,464
Build
NYC
Resource
Corp.
,
Academic
Leadership
Charter
School
,
Revenue
,
2021
,
4
%
,
6/15/36
............
400,000
385,367
Classical
Charter
School,
Inc.
,
Revenue
,
2023
A
,
4.5
%
,
6/15/43
...............
700,000
698,469
Classical
Charter
School,
Inc.
,
Revenue
,
2023
A
,
4.75
%
,
6/15/53
..............
850,000
844,185
Classical
Charter
School,
Inc.
,
Revenue
,
2023
A
,
4.75
%
,
6/15/58
..............
725,000
713,785
Grand
Concourse
Academy
Charter
School
,
Revenue
,
2022
A
,
5
%
,
7/01/42
......
600,000
616,992
Grand
Concourse
Academy
Charter
School
,
Revenue
,
2022
A
,
5
%
,
7/01/52
......
725,000
735,046
Grand
Concourse
Academy
Charter
School
,
Revenue
,
2022
A
,
5
%
,
7/01/56
......
570,000
575,898
KIPP
NYC
Public
Charter
Schools
,
Revenue
,
2022
,
5.25
%
,
7/01/52
............
4,000,000
4,173,328
KIPP
NYC
Public
Charter
Schools
,
Revenue
,
2022
,
5.25
%
,
7/01/57
............
1,000,000
1,040,720
KIPP
NYC
Public
Charter
Schools
,
Revenue
,
2022
,
5.25
%
,
7/01/62
............
1,500,000
1,556,091
c
Chautauqua
County
Capital
Resource
Corp.
,
NRG
Energy,
Inc.
,
Revenue
,
2020
,
Refunding
,
Mandatory
Put
,
4.25
%
,
4/03/28
...............................
2,000,000
2,048,838
City
of
Long
Beach
,
GO
,
2022
B
,
BAM
Insured
,
5.25
%
,
7/15/42
.................
1,010,000
1,095,055
City
of
New
Rochelle
,
Iona
College
,
Revenue
,
2015
A
,
Refunding
,
5
%
,
7/01/45
.....
2,675,000
2,684,490
City
of
New
York
,
GO
,
2017
B
,
5
%
,
12/01/41
...........................................
7,000,000
7,218,559
GO
,
2018
B-1
,
5
%
,
10/01/38
.........................................
6,250,000
6,549,514
GO
,
2018
E-1
,
5
%
,
3/01/40
..........................................
14,330,000
15,053,165
GO
,
2018
E-1
,
5
%
,
3/01/44
..........................................
12,500,000
13,046,305
GO
,
2018
F-1
,
5
%
,
4/01/40
..........................................
16,210,000
17,045,959
GO
,
2018
F-1
,
5
%
,
4/01/45
..........................................
10,000,000
10,431,427
GO
,
2019
D-1
,
4
%
,
12/01/43
.........................................
10,000,000
9,858,235
GO
,
2022
D-1
,
5.25
%
,
5/01/41
........................................
1,500,000
1,678,032
GO
,
2023
A-1
,
4
%
,
9/01/46
..........................................
5,000,000
4,927,770
GO
,
2023
E-1
,
4
%
,
4/01/45
..........................................
3,000,000
2,962,376
GO
,
2023
E-1
,
5.25
%
,
4/01/47
........................................
10,000,000
11,046,494
GO
,
2024
C
,
5.25
%
,
3/01/53
.........................................
7,750,000
8,558,261
GO
,
2024
D
,
5.25
%
,
4/01/54
.........................................
2,000,000
2,208,448
d
GO
,
2025
C-1
,
5.25
%
,
9/01/50
........................................
1,000,000
1,111,246
Dutchess
County
Local
Development
Corp.
,
Culinary
Institute
of
America
(The)
,
Revenue
,
2021
,
Refunding
,
5
%
,
7/01/32
......
175,000
188,855
Franklin
New
York
Tax-Free
Income
Fund
Schedule
of
Investments
(unaudited)
The
accompanying
notes
are
an
integral
part
of
these
financial
statements.
Semiannual
Report
a
a
Principal
Amount
a
Value
a
a
a
a
a
Municipal
Bonds
(continued)
New
York
(continued)
Dutchess
County
Local
Development
Corp.,
(continued)
Culinary
Institute
of
America
(The)
,
Revenue
,
2021
,
Refunding
,
5
%
,
7/01/33
......
$
185,000
$
198,891
Culinary
Institute
of
America
(The)
,
Revenue
,
2021
,
Refunding
,
5
%
,
7/01/34
......
500,000
537,345
Culinary
Institute
of
America
(The)
,
Revenue
,
2021
,
Refunding
,
4
%
,
7/01/35
......
200,000
200,016
Culinary
Institute
of
America
(The)
,
Revenue
,
2021
,
Refunding
,
4
%
,
7/01/36
......
200,000
198,613
Culinary
Institute
of
America
(The)
,
Revenue
,
2021
,
Refunding
,
4
%
,
7/01/37
......
250,000
246,301
Culinary
Institute
of
America
(The)
,
Revenue
,
2021
,
Refunding
,
4
%
,
7/01/38
......
250,000
242,264
Culinary
Institute
of
America
(The)
,
Revenue
,
2021
,
Refunding
,
4
%
,
7/01/39
......
100,000
95,616
Culinary
Institute
of
America
(The)
,
Revenue
,
2021
,
Refunding
,
4
%
,
7/01/40
......
100,000
94,764
Nuvance
Health
Obligated
Group
,
Revenue
,
2016
B
,
5
%
,
7/01/31
.............
10,550,000
10,779,214
Nuvance
Health
Obligated
Group
,
Revenue
,
2019
B
,
Refunding
,
4
%
,
7/01/44
.....
1,900,000
1,822,839
Nuvance
Health
Obligated
Group
,
Revenue
,
2019
B
,
Refunding
,
4
%
,
7/01/49
.....
4,425,000
4,234,692
Vassar
College
,
Revenue
,
2017
,
Refunding
,
5
%
,
7/01/42
....................
5,000,000
5,162,058
Vassar
College
,
Revenue
,
2017
,
Refunding
,
4
%
,
7/01/46
....................
5,715,000
5,651,478
Genesee
County
Funding
Corp.
(The)
,
Rochester
Regional
Health
Obligated
Group
,
Revenue
,
2022
A
,
Refunding
,
5.25
%
,
12/01/52
............................
4,250,000
4,436,300
Hempstead
Town
Local
Development
Corp.
,
Hofstra
University
,
Revenue
,
2017
,
Refunding
,
5
%
,
7/01/42
..................
1,250,000
1,288,993
Hofstra
University
,
Revenue
,
2017
,
Refunding
,
5
%
,
7/01/47
..................
5,250,000
5,380,038
Hofstra
University
,
Revenue
,
2021
A
,
Refunding
,
4
%
,
7/01/39
.................
575,000
579,427
Hofstra
University
,
Revenue
,
2021
A
,
Refunding
,
4
%
,
7/01/40
.................
715,000
716,602
Hofstra
University
,
Revenue
,
2021
A
,
Refunding
,
4
%
,
7/01/41
.................
625,000
621,267
Hofstra
University
,
Revenue
,
2021
A
,
Refunding
,
3
%
,
7/01/51
.................
3,000,000
2,239,592
Hudson
Yards
Infrastructure
Corp.
,
Revenue
,
2017
A
,
Refunding
,
5
%
,
2/15/42
...............................
15,000,000
15,494,423
Revenue
,
2017
A
,
Refunding
,
AGMC
Insured
,
4
%
,
2/15/47
...................
13,680,000
13,414,947
Long
Island
Power
Authority
,
Revenue
,
2016
B
,
Refunding
,
5
%
,
9/01/41
...............................
15,250,000
15,710,350
Revenue
,
2018
,
5
%
,
9/01/39
.........................................
5,000,000
5,299,220
Revenue
,
2021
A
,
Refunding
,
4
%
,
9/01/42
...............................
1,500,000
1,526,392
Revenue
,
2022
A
,
Refunding
,
5
%
,
9/01/44
...............................
3,000,000
3,310,064
Revenue
,
2023
E
,
5
%
,
9/01/53
........................................
3,500,000
3,808,078
Revenue
,
2024
A
,
Refunding
,
5
%
,
9/01/54
...............................
8,000,000
8,755,149
Revenue
,
2024
A
,
Refunding
,
5.25
%
,
9/01/54
.............................
2,500,000
2,794,022
Metropolitan
Transportation
Authority
,
Revenue
,
2015
C-1
,
Refunding
,
5
%
,
11/15/35
............................
5,000,000
5,093,201
Revenue
,
2016
B
,
Refunding
,
5
%
,
11/15/33
..............................
6,000,000
6,213,505
Revenue
,
2016
B
,
Refunding
,
5
%
,
11/15/35
..............................
4,000,000
4,131,158
Revenue
,
2016
B
,
Refunding
,
5
%
,
11/15/37
..............................
18,500,000
19,059,033
Revenue
,
2016
D
,
Refunding
,
5
%
,
11/15/30
..............................
10,305,000
10,713,964
Revenue
,
2017
A-1
,
Refunding
,
5
%
,
11/15/51
.............................
2,505,000
2,570,299
Revenue
,
2017
C-1
,
Refunding
,
5
%
,
11/15/30
............................
6,215,000
6,668,844
Revenue
,
2017
D
,
Refunding
,
4
%
,
11/15/42
..............................
20,000,000
19,746,522
Revenue
,
2017
D
,
Refunding
,
4
%
,
11/15/46
..............................
5,000,000
4,838,398
Revenue
,
2019
C
,
AGMC
Insured
,
4
%
,
11/15/45
...........................
8,000,000
7,864,750
Revenue
,
2020
A-1
,
5
%
,
11/15/48
.....................................
17,000,000
17,795,236
Revenue
,
2020
C-1
,
4.75
%
,
11/15/45
...................................
2,950,000
3,025,926
Revenue
,
2020
C-1
,
5
%
,
11/15/50
.....................................
9,150,000
9,554,694
Revenue
,
2020
D
,
5
%
,
11/15/44
.......................................
15,000,000
15,910,307
Revenue
,
2020
D
,
4
%
,
11/15/50
.......................................
10,000,000
9,576,483
Revenue
,
2021
A-2
,
4
%
,
11/15/42
.....................................
5,000,000
4,955,633
Revenue
,
2024
A
,
Refunding
,
4
%
,
11/15/43
..............................
6,220,000
6,126,834
Revenue
,
2024
A
,
Refunding
,
5.25
%
,
11/15/49
............................
6,000,000
6,547,681
Dedicated
Tax
Fund
,
Revenue
,
2012
A
,
Refunding
,
Zero
Cpn.,
11/15/32
.........
10,000,000
7,564,938
Dedicated
Tax
Fund
,
Revenue
,
2017
A
,
5
%
,
11/15/47
.......................
30,375,000
31,230,867
Dedicated
Tax
Fund
,
Revenue
,
2017
B-1
,
Refunding
,
5
%
,
11/15/42
............
5,000,000
5,199,617
Dedicated
Tax
Fund
,
Revenue
,
2017
B-1
,
Refunding
,
5
%
,
11/15/47
............
13,505,000
13,961,628
Franklin
New
York
Tax-Free
Income
Fund
Schedule
of
Investments
(unaudited)
Semiannual
Report
The
accompanying
notes
are
an
integral
part
of
these
financial
statements.
a
a
Principal
Amount
a
Value
a
a
a
a
a
Municipal
Bonds
(continued)
New
York
(continued)
Metropolitan
Transportation
Authority,
(continued)
Dedicated
Tax
Fund
,
Special
Tax
,
2024
A
,
5
%
,
11/15/49
.....................
$
2,500,000
$
2,744,921
Dedicated
Tax
Fund
,
Special
Tax
,
2024
A
,
5.25
%
,
11/15/54
...................
7,500,000
8,371,688
Monroe
County
Industrial
Development
Corp.
,
Rochester
Regional
Health
Obligated
Group
,
Revenue
,
2017
,
5
%
,
12/01/46
......
17,000,000
17,142,132
Rochester
Regional
Health
Obligated
Group
,
Revenue
,
2020
A
,
Refunding
,
5
%
,
12/01/31
.......................................................
1,500,000
1,581,336
Rochester
Regional
Health
Obligated
Group
,
Revenue
,
2020
A
,
Refunding
,
5
%
,
12/01/32
.......................................................
4,200,000
4,417,078
Rochester
Regional
Health
Obligated
Group
,
Revenue
,
2020
A
,
Refunding
,
5
%
,
12/01/33
.......................................................
1,000,000
1,049,783
Rochester
Regional
Health
Obligated
Group
,
Revenue
,
2020
A
,
Refunding
,
5
%
,
12/01/34
.......................................................
2,510,000
2,629,235
Rochester
Regional
Health
Obligated
Group
,
Revenue
,
2020
A
,
Refunding
,
4
%
,
12/01/35
.......................................................
1,100,000
1,103,765
Rochester
Regional
Health
Obligated
Group
,
Revenue
,
2020
A
,
Refunding
,
4
%
,
12/01/46
.......................................................
8,560,000
7,871,044
St.
John
Fisher
University
,
Revenue
,
2024
,
Refunding
,
5.25
%
,
6/01/49
..........
635,000
697,914
St.
John
Fisher
University
,
Revenue
,
2024
,
Refunding
,
5.25
%
,
6/01/54
..........
1,670,000
1,813,351
b
True
North
Rochester
Prep
Charter
School
,
Revenue
,
144A,
2020
A
,
5
%
,
6/01/50
.
2,360,000
2,394,935
b
True
North
Rochester
Prep
Charter
School
,
Revenue
,
144A,
2020
A
,
5
%
,
6/01/59
.
2,345,000
2,370,890
University
of
Rochester
,
Revenue
,
2015
A
,
Refunding
,
5
%
,
7/01/37
............
1,780,000
1,805,435
University
of
Rochester
,
Revenue
,
2017
C
,
Refunding
,
4
%
,
7/01/43
............
22,895,000
22,936,783
University
of
Rochester
,
Revenue
,
2017
D
,
Refunding
,
4
%
,
7/01/43
............
21,550,000
21,589,329
University
of
Rochester
,
Revenue
,
2023
A
,
5
%
,
7/01/53
.....................
10,000,000
10,905,146
Nassau
County
Local
Economic
Assistance
Corp.
,
Roosevelt
Children's
Academy
Charter
School
,
Revenue
,
2023
A
,
5
%
,
7/01/43
....
1,440,000
1,507,179
Roosevelt
Children's
Academy
Charter
School
,
Revenue
,
2023
A
,
5
%
,
7/01/55
....
2,605,000
2,662,080
New
York
City
Health
and
Hospitals
Corp.
,
Revenue
,
2020
A
,
Refunding
,
3
%
,
2/15/45
...............................
1,250,000
1,009,923
Revenue
,
2020
A
,
Refunding
,
4
%
,
2/15/45
...............................
1,800,000
1,768,469
Revenue
,
2020
A
,
Refunding
,
4
%
,
2/15/48
...............................
880,000
846,785
New
York
City
Housing
Development
Corp.
,
Revenue
,
2018
K
,
4
%
,
11/01/48
.......................................
36,505,000
34,984,125
Revenue
,
2019
G-1-B
,
Refunding
,
3
%
,
11/01/44
...........................
9,405,000
7,632,896
Revenue
,
2019
J
,
3
%
,
11/01/44
.......................................
4,935,000
4,059,557
Revenue
,
2020
C
,
FNMA
Insured
,
2.75
%
,
2/01/51
.........................
10,000,000
6,942,619
New
York
City
Industrial
Development
Agency
,
Queens
Ballpark
Co.
LLC
,
Revenue
,
2021
A
,
Refunding
,
AGMC
Insured
,
3
%
,
1/01/46
5,000,000
4,074,011
Yankee
Stadium
LLC
,
Revenue
,
2020
A
,
Refunding
,
AGMC
Insured
,
3
%
,
3/01/49
..
10,000,000
7,782,442
New
York
City
Municipal
Water
Finance
Authority
,
New
York
City
Water
&
Sewer
System
,
Revenue
,
2024
CC-1
,
4.25
%
,
6/15/54
.....
2,500,000
2,521,582
Water
&
Sewer
System
,
Revenue
,
2017
AA
,
4
%
,
6/15/46
....................
24,290,000
24,290,794
Water
&
Sewer
System
,
Revenue
,
2017
DD
,
5
%
,
6/15/47
....................
33,800,000
34,924,678
Water
&
Sewer
System
,
Revenue
,
2018
BB-1
,
5
%
,
6/15/46
..................
36,375,000
37,612,470
Water
&
Sewer
System
,
Revenue
,
2018
CC-1
,
5
%
,
6/15/48
..................
11,225,000
11,590,444
Water
&
Sewer
System
,
Revenue
,
2018
FF
,
Refunding
,
5
%
,
6/15/40
............
15,000,000
15,852,117
Water
&
Sewer
System
,
Revenue
,
2019
DD-1
,
5
%
,
6/15/49
..................
19,000,000
19,836,857
Water
&
Sewer
System
,
Revenue
,
2020
AA
,
Refunding
,
5
%
,
6/15/40
...........
10,000,000
10,800,223
Water
&
Sewer
System
,
Revenue
,
2022
AA-1
,
5
%
,
6/15/48
..................
8,825,000
9,459,384
Water
&
Sewer
System
,
Revenue
,
2023
AA-1
,
5.25
%
,
6/15/52
................
16,750,000
18,456,249
New
York
City
Transitional
Finance
Authority
,
Future
Tax
Secured
,
Revenue
,
2016
A-1
,
5
%
,
8/01/36
......................
10,000,000
10,159,080
Future
Tax
Secured
,
Revenue
,
2017
E-1
,
5
%
,
2/01/33
......................
6,500,000
6,786,289
Future
Tax
Secured
,
Revenue
,
2017
F-1
,
5
%
,
5/01/42
......................
17,500,000
18,128,254
Future
Tax
Secured
,
Revenue
,
2018
A-3
,
5
%
,
8/01/40
......................
3,270,000
3,409,655
Future
Tax
Secured
,
Revenue
,
2018
C-3
,
4
%
,
5/01/42
......................
7,410,000
7,420,034
Franklin
New
York
Tax-Free
Income
Fund
Schedule
of
Investments
(unaudited)
The
accompanying
notes
are
an
integral
part
of
these
financial
statements.
Semiannual
Report
a
a
Principal
Amount
a
Value
a
a
a
a
a
Municipal
Bonds
(continued)
New
York
(continued)
New
York
City
Transitional
Finance
Authority,
(continued)
Future
Tax
Secured
,
Revenue
,
2019
A-1
,
5
%
,
8/01/40
......................
$
9,340,000
$
9,848,624
Future
Tax
Secured
,
Revenue
,
2020
B-1
,
4
%
,
11/01/41
.....................
7,205,000
7,240,269
Future
Tax
Secured
,
Revenue
,
2021
C-1
,
4
%
,
5/01/43
......................
5,000,000
5,003,712
Future
Tax
Secured
,
Revenue
,
2023
D-1
,
5
%
,
11/01/46
.....................
10,000,000
10,893,132
Future
Tax
Secured
,
Revenue
,
2024
A-1
,
4
%
,
5/01/53
......................
3,000,000
2,919,731
Future
Tax
Secured
,
Revenue
,
2024
G-1
,
4.125
%
,
5/01/52
...................
6,500,000
6,455,056
Future
Tax
Secured
,
Revenue
,
2024
G-1
,
5
%
,
5/01/52
......................
4,000,000
4,353,207
State
of
New
York
,
Revenue
,
2018
S-3
,
5
%
,
7/15/43
........................
10,000,000
10,493,311
State
of
New
York
,
Revenue
,
2019
S-1
,
5
%
,
7/15/43
........................
22,230,000
23,326,630
State
of
New
York
,
Revenue
,
2020
S-1
,
4
%
,
7/15/41
........................
8,465,000
8,512,207
State
of
New
York
,
Revenue
,
2020
S-1B
,
4
%
,
7/15/41
......................
2,465,000
2,486,405
New
York
Convention
Center
Development
Corp.
,
New
York
City
Hotel
Unit
Fee
,
Revenue,
Senior
Lien
,
2016
A
,
5
%
,
11/15/46
.............................
5,000,000
5,106,091
New
York
Liberty
Development
Corp.
,
Revenue
,
2021
A
,
Refunding
,
3
%
,
11/15/51
..............................
18,000,000
13,408,047
Goldman
Sachs
Headquarters
LLC
,
Revenue
,
2005
,
Refunding
,
5.25
%
,
10/01/35
..
91,360,000
106,820,433
Goldman
Sachs
Headquarters
LLC
,
Revenue
,
2007
,
5.5
%
,
10/01/37
...........
27,000,000
32,399,490
Port
Authority
of
New
York
&
New
Jersey
,
Revenue
,
1WTC
2021
,
Refunding
,
3
%
,
2/15/42
........................................................
5,000,000
4,253,693
Port
Authority
of
New
York
&
New
Jersey
,
Revenue
,
1WTC-2021
,
Refunding
,
4
%
,
2/15/43
........................................................
5,000,000
4,946,630
New
York
Power
Authority
,
Revenue
,
2020
A
,
Refunding
,
4
%
,
11/15/60
..............................
11,455,000
11,148,546
SFP
Transmission
Project
,
Revenue
,
2023
A
,
AGMC
Insured
,
5
%
,
11/15/53
......
3,000,000
3,314,487
New
York
State
Dormitory
Authority
,
Revenue
,
2008
A-1
,
5
%
,
6/01/38
......................................
3,970,000
3,974,429
Revenue
,
2009
A
,
AGMC
Insured
,
5.625
%
,
10/01/29
.......................
300,000
300,600
Revenue
,
2009
C
,
AGMC
Insured
,
5
%
,
10/01/31
..........................
45,000
45,067
Revenue
,
2009
C
,
AGMC
Insured
,
5.125
%
,
10/01/36
.......................
60,000
60,100
Revenue
,
2010
A
,
AGMC
Insured
,
5
%
,
10/01/24
...........................
710,000
710,950
Catholic
Health
System
Obligated
Group
,
Revenue
,
2019
A
,
Refunding
,
4
%
,
7/01/37
1,705,000
1,478,855
Catholic
Health
System
Obligated
Group
,
Revenue
,
2019
A
,
Refunding
,
4
%
,
7/01/38
2,200,000
1,888,974
Catholic
Health
System
Obligated
Group
,
Revenue
,
2019
A
,
Refunding
,
4
%
,
7/01/39
1,305,000
1,104,667
Catholic
Health
System
Obligated
Group
,
Revenue
,
2019
A
,
Refunding
,
4
%
,
7/01/40
1,300,000
1,098,037
Catholic
Health
System
Obligated
Group
,
Revenue
,
2019
A
,
Refunding
,
5
%
,
7/01/41
2,100,000
1,989,957
Catholic
Health
System
Obligated
Group
,
Revenue
,
2019
A
,
Refunding
,
4
%
,
7/01/45
5,835,000
4,738,564
Educational
Housing
Services,
Inc.
,
Revenue
,
2005
,
AMBAC
Insured
,
5.25
%
,
7/01/30
5,150,000
5,388,330
Fashion
Institute
of
Technology
,
Revenue
,
2007
,
NATL
Insured
,
5.25
%
,
7/01/26
...
6,105,000
6,224,804
Fashion
Institute
of
Technology
,
Revenue
,
2007
,
NATL
Insured
,
5.25
%
,
7/01/34
...
13,220,000
13,839,906
Fordham
University
,
Revenue
,
2020
,
4
%
,
7/01/50
..........................
4,500,000
4,349,602
b
Garnet
Health
Medical
Center
Obligated
Group
,
Revenue
,
144A,
2015
,
Refunding
,
5
%
,
12/01/45
...................................................
1,000,000
938,841
b
Garnet
Health
Medical
Center
Obligated
Group
,
Revenue
,
144A,
2017
,
Refunding
,
5
%
,
12/01/32
...................................................
500,000
500,296
b
Garnet
Health
Medical
Center
Obligated
Group
,
Revenue
,
144A,
2017
,
Refunding
,
5
%
,
12/01/33
...................................................
4,000,000
3,997,502
b
Garnet
Health
Medical
Center
Obligated
Group
,
Revenue
,
144A,
2017
,
Refunding
,
5
%
,
12/01/35
...................................................
1,100,000
1,089,962
b
Garnet
Health
Medical
Center
Obligated
Group
,
Revenue
,
144A,
2017
,
Refunding
,
5
%
,
12/01/36
...................................................
2,100,000
2,066,432
b
Garnet
Health
Medical
Center
Obligated
Group
,
Revenue
,
144A,
2017
,
Refunding
,
5
%
,
12/01/37
...................................................
2,000,000
1,957,248
Iona
College
,
Revenue
,
2021
A
,
5
%
,
7/01/46
.............................
925,000
946,940
Iona
College
,
Revenue
,
2021
A
,
5
%
,
7/01/51
.............................
1,100,000
1,116,882
Iona
College
,
Revenue
,
2022
,
Refunding
,
5
%
,
7/01/31
......................
325,000
352,803
Iona
College
,
Revenue
,
2022
,
Refunding
,
5
%
,
7/01/32
......................
300,000
327,402
Franklin
New
York
Tax-Free
Income
Fund
Schedule
of
Investments
(unaudited)
Semiannual
Report
The
accompanying
notes
are
an
integral
part
of
these
financial
statements.
a
a
Principal
Amount
a
Value
a
a
a
a
a
Municipal
Bonds
(continued)
New
York
(continued)
New
York
State
Dormitory
Authority,
(continued)
Iona
College
,
Revenue
,
2022
,
Refunding
,
5
%
,
7/01/37
......................
$
225,000
$
239,368
Iona
College
,
Revenue
,
2022
,
Refunding
,
5
%
,
7/01/42
......................
275,000
285,775
Memorial
Sloan-Kettering
Cancer
Center
,
Revenue
,
2017-1
,
Refunding
,
4
%
,
7/01/47
5,000,000
4,916,305
Montefiore
Obligated
Group
,
Revenue
,
2018
A
,
Refunding
,
5
%
,
8/01/31
.........
525,000
544,948
Montefiore
Obligated
Group
,
Revenue
,
2018
A
,
Refunding
,
5
%
,
8/01/33
.........
1,150,000
1,190,142
Montefiore
Obligated
Group
,
Revenue
,
2020
A
,
Refunding
,
5
%
,
9/01/30
.........
1,800,000
1,895,844
Montefiore
Obligated
Group
,
Revenue
,
2020
A
,
Refunding
,
4
%
,
9/01/45
.........
10,900,000
10,305,658
Montefiore
Obligated
Group
,
Revenue
,
2020
A
,
Refunding
,
4
%
,
9/01/50
.........
1,370,000
1,243,505
New
School
(The)
,
Revenue
,
2015
A
,
Pre-Refunded
,
5
%
,
7/01/40
.............
380,000
386,939
New
School
(The)
,
Revenue
,
2015
A
,
5
%
,
7/01/45
.........................
13,845,000
13,914,703
New
School
(The)
,
Revenue
,
2015
A
,
Pre-Refunded
,
5
%
,
7/01/45
.............
660,000
672,052
New
School
(The)
,
Revenue
,
2022
A
,
Refunding
,
4
%
,
7/01/47
................
4,000,000
3,891,633
New
York
Institute
of
Technology
,
Revenue
,
2024
,
5.25
%
,
7/01/49
.............
1,300,000
1,411,886
New
York
Institute
of
Technology
,
Revenue
,
2024
,
5.25
%
,
7/01/54
.............
2,900,000
3,120,426
New
York
University
,
Revenue
,
2017
A
,
Refunding
,
5
%
,
7/01/38
...............
5,000,000
5,224,893
New
York
University
,
Revenue
,
2017
A
,
Refunding
,
5
%
,
7/01/40
...............
6,745,000
7,017,698
New
York
University
,
Revenue
,
2017
A
,
Refunding
,
5
%
,
7/01/43
...............
3,000,000
3,107,981
New
York
University
,
Revenue
,
2018
A
,
5
%
,
7/01/48
........................
5,000,000
5,260,364
New
York
University
,
Revenue
,
2019
A
,
4
%
,
7/01/45
........................
3,415,000
3,387,856
New
York
University
,
Revenue
,
2019
A
,
5
%
,
7/01/49
........................
50,000,000
52,983,725
Northwell
Health
Obligated
Group
,
Revenue
,
2022
A
,
Refunding
,
5
%
,
5/01/52
....
13,490,000
14,395,968
NYU
Langone
Hospitals
Obligated
Group
,
Revenue
,
2020
A
,
3
%
,
7/01/48
.......
4,000,000
3,229,062
NYU
Langone
Hospitals
Obligated
Group
,
Revenue
,
2020
A
,
4
%
,
7/01/50
.......
20,420,000
19,831,526
NYU
Langone
Hospitals
Obligated
Group
,
Revenue
,
2020
A
,
4
%
,
7/01/53
.......
25,280,000
24,512,163
Pace
University
,
Revenue
,
2024
A
,
5.5
%
,
5/01/49
..........................
500,000
550,205
Pace
University
,
Revenue
,
2024
A
,
5.5
%
,
5/01/56
..........................
1,000,000
1,094,566
Rochester
Institute
of
Technology
,
Revenue
,
2019
A
,
5
%
,
7/01/49
..............
3,500,000
3,653,679
Rochester
Institute
of
Technology
,
Revenue
,
2022
A
,
5
%
,
7/01/41
..............
1,000,000
1,103,284
Rochester
Institute
of
Technology
,
Revenue
,
2022
A
,
5
%
,
7/01/42
..............
1,000,000
1,099,584
Rockefeller
University
(The)
,
Revenue
,
2020
A
,
Refunding
,
5
%
,
7/01/53
.........
6,500,000
6,895,744
St.
John's
University
,
Revenue
,
2021
A
,
Refunding
,
4
%
,
7/01/48
...............
6,250,000
5,971,354
St.
Joseph's
College
,
Revenue
,
2021
,
4
%
,
7/01/40
.........................
225,000
196,891
St.
Joseph's
College
,
Revenue
,
2021
,
5
%
,
7/01/51
.........................
725,000
672,191
State
of
New
York
Personal
Income
Tax
,
Revenue
,
2017
A
,
Pre-Refunded
,
5
%
,
2/15/39
........................................................
15,000
15,872
State
of
New
York
Personal
Income
Tax
,
Revenue
,
2017
B
,
Pre-Refunded
,
5
%
,
2/15/40
........................................................
10,000
10,715
State
of
New
York
Personal
Income
Tax
,
Revenue
,
2017
B
,
5
%
,
2/15/41
.........
9,895,000
10,372,463
State
of
New
York
Personal
Income
Tax
,
Revenue
,
2017
B
,
Pre-Refunded
,
5
%
,
2/15/41
........................................................
30,000
32,145
State
of
New
York
Personal
Income
Tax
,
Revenue
,
2017
B
,
5
%
,
2/15/43
.........
17,050,000
17,818,948
State
of
New
York
Personal
Income
Tax
,
Revenue
,
2017
B
,
Pre-Refunded
,
5
%
,
2/15/43
........................................................
30,000
32,145
State
of
New
York
Personal
Income
Tax
,
Revenue
,
2017
B
,
4
%
,
2/15/46
.........
19,985,000
19,672,405
State
of
New
York
Personal
Income
Tax
,
Revenue
,
2017
B
,
Pre-Refunded
,
4
%
,
2/15/46
........................................................
15,000
15,648
State
of
New
York
Personal
Income
Tax
,
Revenue
,
2018
A
,
Refunding
,
5
%
,
3/15/45
10,000,000
10,427,632
State
of
New
York
Personal
Income
Tax
,
Revenue
,
2024
A
,
Refunding
,
5.25
%
,
3/15/49
........................................................
10,000,000
11,148,140
State
of
New
York
Personal
Income
Tax
,
Revenue
,
2024
A
,
Refunding
,
5.25
%
,
3/15/52
........................................................
8,850,000
9,827,824
State
of
New
York
Sales
Tax
,
Revenue
,
2016
A
,
5
%
,
3/15/36
.................
9,800,000
10,147,938
State
of
New
York
Sales
Tax
,
Revenue
,
2017
A
,
5
%
,
3/15/41
.................
10,000,000
10,330,672
State
of
New
York
Sales
Tax
,
Revenue
,
2017
A
,
5
%
,
3/15/42
.................
10,000,000
10,315,915
State
of
New
York
Sales
Tax
,
Revenue
,
2018
A
,
4
%
,
3/15/46
.................
25,000,000
24,675,118
State
of
New
York
Sales
Tax
,
Revenue
,
2018
C
,
Refunding
,
4
%
,
3/15/44
........
5,310,000
5,289,762
Franklin
New
York
Tax-Free
Income
Fund
Schedule
of
Investments
(unaudited)
The
accompanying
notes
are
an
integral
part
of
these
financial
statements.
Semiannual
Report
a
a
Principal
Amount
a
Value
a
a
a
a
a
Municipal
Bonds
(continued)
New
York
(continued)
New
York
State
Dormitory
Authority,
(continued)
State
of
New
York
Sales
Tax
,
Revenue
,
2018
E
,
Refunding
,
5
%
,
3/15/37
........
$
15,340,000
$
16,383,431
State
of
New
York
Sales
Tax
,
Revenue
,
2018
E
,
Refunding
,
5
%
,
3/15/45
........
6,235,000
6,546,792
State
University
of
New
York
Dormitory
Facilities
,
Revenue
,
2017
A
,
5
%
,
7/01/42
..
2,970,000
3,077,308
State
University
of
New
York
Dormitory
Facilities
,
Revenue
,
2017
A
,
Pre-Refunded
,
5
%
,
7/01/42
....................................................
780,000
835,230
State
University
of
New
York
Dormitory
Facilities
,
Revenue
,
2017
A
,
Pre-Refunded
,
5
%
,
7/01/46
....................................................
4,000,000
4,283,229
State
University
of
New
York
Dormitory
Facilities
,
Revenue
,
2018
A
,
5
%
,
7/01/43
..
4,300,000
4,460,582
State
University
of
New
York
Dormitory
Facilities
,
Revenue
,
2018
A
,
5
%
,
7/01/48
..
7,950,000
8,228,500
State
University
of
New
York
Dormitory
Facilities
,
Revenue
,
2018
A
,
Pre-Refunded
,
5
%
,
7/01/48
....................................................
5,975,000
6,524,243
State
University
of
New
York
Dormitory
Facilities
,
Revenue
,
2019
A
,
3
%
,
7/01/42
..
4,165,000
3,497,380
State
University
of
New
York
Dormitory
Facilities
,
Revenue
,
2019
A
,
4
%
,
7/01/43
..
1,200,000
1,187,489
Teachers
College
,
Revenue
,
2022
,
Refunding
,
4
%
,
7/01/46
..................
6,175,000
6,087,348
New
York
State
Environmental
Facilities
Corp.
,
State
of
New
York
State
Revolving
Fund
,
Revenue
,
2017
A
,
Refunding
,
5
%
,
6/15/46
17,250,000
17,850,704
State
of
New
York
State
Revolving
Fund
,
Revenue
,
2017
E
,
5
%
,
6/15/42
........
8,355,000
8,692,774
State
of
New
York
State
Revolving
Fund
,
Revenue
,
2017
E
,
5
%
,
6/15/47
........
4,345,000
4,490,759
State
of
New
York
State
Revolving
Fund
,
Revenue
,
2018
B
,
5
%
,
6/15/43
........
8,000,000
8,390,800
State
of
New
York
State
Revolving
Fund
,
Revenue
,
2018
B
,
5
%
,
6/15/48
........
18,610,000
19,368,037
State
of
New
York
State
Revolving
Fund
,
Revenue
,
2022
B
,
5.25
%
,
9/15/52
......
5,000,000
5,536,506
New
York
State
Housing
Finance
Agency
,
Revenue
,
2020
E
,
2.45
%
,
11/01/50
......
3,000,000
1,958,165
New
York
State
Thruway
Authority
,
Revenue
,
2019
B
,
4
%
,
1/01/41
........................................
12,000,000
11,998,949
Revenue
,
2019
B
,
3
%
,
1/01/46
........................................
4,200,000
3,388,091
Revenue
,
2019
B
,
4
%
,
1/01/50
........................................
20,000,000
19,430,934
Revenue
,
2019
B
,
4
%
,
1/01/53
........................................
15,000,000
14,463,670
Revenue
,
L
,
Refunding
,
5
%
,
1/01/35
...................................
3,000,000
3,196,493
Revenue
,
N
,
4
%
,
1/01/46
............................................
10,000,000
9,838,945
Revenue
,
P
,
Refunding
,
5.25
%
,
1/01/54
.................................
1,000,000
1,122,944
State
of
New
York
Personal
Income
Tax
,
Revenue
,
2022
A
,
Refunding
,
5
%
,
3/15/46
4,125,000
4,488,607
State
of
New
York
Personal
Income
Tax
,
Revenue
,
2022
A
,
Refunding
,
5
%
,
3/15/48
25,000,000
27,032,850
New
York
State
Urban
Development
Corp.
,
State
of
New
York
Personal
Income
Tax
,
Revenue
,
2017
C
,
Refunding
,
5
%
,
3/15/40
8,400,000
8,783,064
State
of
New
York
Personal
Income
Tax
,
Revenue
,
2019
A
,
5
%
,
3/15/42
.........
10,000,000
10,488,475
State
of
New
York
Personal
Income
Tax
,
Revenue
,
2020
A
,
5
%
,
3/15/41
.........
5,000,000
5,441,094
New
York
Transportation
Development
Corp.
,
Delta
Air
Lines,
Inc.
,
Revenue
,
2018
,
5
%
,
1/01/32
..........................
5,500,000
5,684,377
Delta
Air
Lines,
Inc.
,
Revenue
,
2020
,
4
%
,
10/01/30
.........................
12,400,000
12,402,264
Delta
Air
Lines,
Inc.
,
Revenue
,
2020
,
5
%
,
10/01/35
.........................
6,305,000
6,631,916
Delta
Air
Lines,
Inc.
,
Revenue
,
2020
,
5
%
,
10/01/40
.........................
11,000,000
11,370,085
Delta
Air
Lines,
Inc.
,
Revenue
,
2020
,
4.375
%
,
10/01/45
.....................
26,500,000
25,526,676
Delta
Air
Lines,
Inc.
,
Revenue
,
2023
,
5.625
%
,
4/01/40
......................
5,000,000
5,389,378
Empire
State
Thruway
Partners
LLC
,
Revenue
,
2021
,
4
%
,
10/31/41
............
2,130,000
1,964,687
Empire
State
Thruway
Partners
LLC
,
Revenue
,
2021
,
4
%
,
10/31/46
............
6,000,000
5,333,954
Empire
State
Thruway
Partners
LLC
,
Revenue
,
2021
,
4
%
,
4/30/53
.............
19,875,000
17,070,594
JFK
International
Air
Terminal
LLC
,
Revenue
,
2020
A
,
Refunding
,
5
%
,
12/01/34
...
450,000
480,050
JFK
International
Air
Terminal
LLC
,
Revenue
,
2020
A
,
Refunding
,
5
%
,
12/01/35
...
400,000
425,368
JFK
International
Air
Terminal
LLC
,
Revenue
,
2020
A
,
Refunding
,
5
%
,
12/01/36
...
400,000
423,767
JFK
International
Air
Terminal
LLC
,
Revenue
,
2020
A
,
Refunding
,
5
%
,
12/01/37
...
350,000
369,847
JFK
International
Air
Terminal
LLC
,
Revenue
,
2020
A
,
Refunding
,
4
%
,
12/01/38
...
300,000
296,778
JFK
International
Air
Terminal
LLC
,
Revenue
,
2020
A
,
Refunding
,
4
%
,
12/01/39
...
400,000
394,349
JFK
International
Air
Terminal
LLC
,
Revenue
,
2020
A
,
Refunding
,
4
%
,
12/01/40
...
2,555,000
2,499,721
JFK
International
Air
Terminal
LLC
,
Revenue
,
2020
A
,
Refunding
,
4
%
,
12/01/42
...
910,000
877,701
JFK
International
Air
Terminal
LLC
,
Revenue
,
2020
C
,
Refunding
,
5
%
,
12/01/33
...
1,200,000
1,310,143
JFK
International
Air
Terminal
LLC
,
Revenue
,
2020
C
,
Refunding
,
5
%
,
12/01/34
...
2,000,000
2,172,936
Franklin
New
York
Tax-Free
Income
Fund
Schedule
of
Investments
(unaudited)
Semiannual
Report
The
accompanying
notes
are
an
integral
part
of
these
financial
statements.
a
a
Principal
Amount
a
Value
a
a
a
a
a
Municipal
Bonds
(continued)
New
York
(continued)
New
York
Transportation
Development
Corp.,
(continued)
JFK
International
Air
Terminal
LLC
,
Revenue
,
2020
C
,
Refunding
,
5
%
,
12/01/36
...
$
2,000,000
$
2,157,899
JFK
International
Air
Terminal
LLC
,
Revenue
,
2020
C
,
Refunding
,
4
%
,
12/01/39
...
4,545,000
4,555,915
JFK
International
Air
Terminal
LLC
,
Revenue
,
2020
C
,
Refunding
,
4
%
,
12/01/41
...
10,300,000
10,208,786
JFK
International
Air
Terminal
LLC
,
Revenue
,
2020
C
,
Refunding
,
4
%
,
12/01/42
...
9,690,000
9,588,135
JFK
International
Air
Terminal
LLC
,
Revenue
,
2022
,
5
%
,
12/01/42
.............
6,000,000
6,283,523
JFK
NTO
LLC
,
Revenue
,
2023
,
6
%
,
6/30/54
..............................
6,500,000
7,105,723
JFK
NTO
LLC
,
Revenue
,
2023
,
AGMC
Insured
,
5.125
%
,
6/30/60
..............
10,000,000
10,420,986
JFK
NTO
LLC
,
Revenue
,
2023
,
5.375
%
,
6/30/60
..........................
15,160,000
15,819,698
JFK
NTO
LLC
,
Revenue
,
2024
,
5
%
,
6/30/60
..............................
13,000,000
13,284,775
JFK
NTO
LLC
,
Revenue
,
2024
,
5.5
%
,
6/30/60
............................
10,500,000
11,191,683
Oneida
County
Local
Development
Corp.
,
Mohawk
Valley
Health
System
Obligated
Group
,
Revenue
,
2021
A
,
AGMC
Insured
,
4
%
,
12/01/51
.....................
4,000,000
3,800,152
b
Oneida
Indian
Nation
of
New
York
,
Revenue
,
144A,
2024
B
,
6
%
,
9/01/43
..........
2,150,000
2,369,088
Onondaga
Civic
Development
Corp.
,
Le
Moyne
College
,
Revenue
,
2021
,
4
%
,
7/01/38
...........................
200,000
194,217
Le
Moyne
College
,
Revenue
,
2021
,
4
%
,
7/01/41
...........................
245,000
230,044
Le
Moyne
College
,
Revenue
,
2021
,
5
%
,
7/01/46
...........................
460,000
470,640
Le
Moyne
College
,
Revenue
,
2021
,
5
%
,
7/01/51
...........................
820,000
831,629
Le
Moyne
College
,
Revenue
,
2022
,
Refunding
,
5
%
,
7/01/32
..................
725,000
776,972
Le
Moyne
College
,
Revenue
,
2022
,
Refunding
,
4
%
,
7/01/34
..................
315,000
315,003
Le
Moyne
College
,
Revenue
,
2022
,
Refunding
,
4
%
,
7/01/36
..................
350,000
346,277
Le
Moyne
College
,
Revenue
,
2022
,
Refunding
,
4
%
,
7/01/39
..................
475,000
454,177
Le
Moyne
College
,
Revenue
,
2022
,
Refunding
,
4
%
,
7/01/42
..................
530,000
492,067
Onondaga
County
Trust
for
Cultural
Resources
,
Syracuse
University
,
Revenue
,
2019
,
Refunding
,
5
%
,
12/01/43
................
5,000,000
5,326,785
Syracuse
University
,
Revenue
,
2019
,
Refunding
,
4
%
,
12/01/47
................
17,000,000
16,815,589
Port
Authority
of
New
York
&
New
Jersey
,
Revenue
,
194
,
Refunding
,
5
%
,
10/15/41
.................................
10,000,000
10,182,052
Revenue
,
200
,
Refunding
,
5
%
,
4/15/57
.................................
11,040,000
11,343,542
Revenue
,
2014
,
5
%
,
9/01/34
.........................................
2,500,000
2,639,347
Revenue
,
205th
,
Refunding
,
5
%
,
5/15/57
................................
13,000,000
13,452,052
Revenue
,
211th
,
Refunding
,
5
%
,
9/01/48
................................
41,730,000
43,514,504
Revenue
,
214th
,
4
%
,
9/01/38
.........................................
5,000,000
5,006,423
Revenue
,
217th
,
4
%
,
11/01/41
........................................
10,000,000
9,997,366
Revenue
,
221
,
4
%
,
7/15/45
..........................................
7,610,000
7,330,259
Revenue
,
221
,
4
%
,
7/15/50
..........................................
15,250,000
14,353,036
Revenue
,
234
,
Refunding
,
5.5
%
,
8/01/52
................................
4,000,000
4,340,087
Revenue
,
238
,
Refunding
,
5
%
,
7/15/37
.................................
4,000,000
4,395,879
Revenue
,
240
,
Refunding
,
5
%
,
7/15/53
.................................
2,500,000
2,725,178
Saratoga
County
Capital
Resource
Corp.
,
Skidmore
College
,
Revenue
,
2020
A
,
4
%
,
7/01/50
......................................................
2,250,000
2,174,801
Schenectady
County
Capital
Resource
Corp.
,
Trustees
of
Union
College
,
Revenue
,
2017
,
Refunding
,
5
%
,
1/01/40
............
2,600,000
2,691,524
Trustees
of
Union
College
,
Revenue
,
2017
,
Refunding
,
5
%
,
1/01/47
............
6,590,000
6,761,342
Trustees
of
Union
College
,
Revenue
,
2022
,
Refunding
,
5.25
%
,
7/01/52
.........
700,000
772,174
St.
Lawrence
County
Industrial
Development
Agency
,
Clarkson
University
,
Revenue
,
2021
B
,
Refunding
,
5
%
,
9/01/34
...............
465,000
499,722
Clarkson
University
,
Revenue
,
2021
B
,
Refunding
,
5
%
,
9/01/35
...............
475,000
508,622
Clarkson
University
,
Revenue
,
2021
B
,
Refunding
,
5
%
,
9/01/36
...............
500,000
532,838
Clarkson
University
,
Revenue
,
2021
B
,
Refunding
,
5
%
,
9/01/37
...............
525,000
558,205
Clarkson
University
,
Revenue
,
2021
B
,
Refunding
,
5
%
,
9/01/38
...............
435,000
459,647
Clarkson
University
,
Revenue
,
2021
B
,
Refunding
,
5
%
,
9/01/39
...............
400,000
419,335
Clarkson
University
,
Revenue
,
2021
B
,
Refunding
,
5
%
,
9/01/40
...............
475,000
496,230
Clarkson
University
,
Revenue
,
2021
B
,
Refunding
,
5
%
,
9/01/41
...............
525,000
546,623
St.
Lawrence
University
,
Revenue
,
2022
,
Refunding
,
5.25
%
,
7/01/47
...........
1,820,000
1,992,826
St.
Lawrence
University
,
Revenue
,
2022
,
Refunding
,
5.25
%
,
7/01/52
...........
2,500,000
2,717,061
Franklin
New
York
Tax-Free
Income
Fund
Schedule
of
Investments
(unaudited)
The
accompanying
notes
are
an
integral
part
of
these
financial
statements.
Semiannual
Report
a
a
Principal
Amount
a
Value
a
a
a
a
a
Municipal
Bonds
(continued)
New
York
(continued)
Suffolk
County
Water
Authority
,
Revenue
,
2018
A
,
4
%
,
6/01/41
.................
$
25,000,000
$
25,143,598
Suffolk
Tobacco
Asset
Securitization
Corp.
,
Revenue
,
2021
A-2
,
Refunding
,
4
%
,
6/01/35
.............................
2,345,000
2,383,223
Revenue
,
2021
A-2
,
Refunding
,
4
%
,
6/01/36
.............................
2,425,000
2,455,406
Revenue
,
2021
A-2
,
Refunding
,
4
%
,
6/01/37
.............................
1,250,000
1,263,133
Revenue
,
2021
A-2
,
Refunding
,
4
%
,
6/01/38
.............................
1,000,000
1,006,385
Revenue
,
2021
A-2
,
Refunding
,
4
%
,
6/01/39
.............................
1,465,000
1,467,506
Revenue
,
2021
A-2
,
Refunding
,
4
%
,
6/01/40
.............................
1,415,000
1,406,752
Revenue
,
2021
A-2
,
Refunding
,
4
%
,
6/01/41
.............................
1,340,000
1,322,215
Revenue
,
2021
A-2
,
Refunding
,
4
%
,
6/01/50
.............................
4,500,000
4,130,453
Revenue
,
2021
B-1
,
Refunding
,
4
%
,
6/01/50
.............................
4,285,000
4,284,096
Syracuse
Regional
Airport
Authority
,
Revenue
,
2021
,
Refunding
,
4
%
,
7/01/35
.................................
735,000
731,268
Revenue
,
2021
,
Refunding
,
4
%
,
7/01/36
.................................
750,000
742,021
Tompkins
County
Development
Corp.
,
Kendal
at
Ithaca,
Inc.
,
Revenue
,
2022
A
,
Refunding
,
4
%
,
7/01/42
.............................................
3,440,000
3,358,329
Triborough
Bridge
&
Tunnel
Authority
,
Revenue
,
2013
A
,
Refunding
,
Zero
Cpn.,
11/15/31
.........................
5,000,000
3,920,529
Revenue
,
2017
A
,
Refunding
,
5
%
,
11/15/38
..............................
3,000,000
3,119,793
Revenue
,
2017
A
,
Refunding
,
5
%
,
11/15/47
..............................
18,120,000
18,635,392
Revenue
,
2017
B
,
Refunding
,
5
%
,
11/15/37
..............................
8,055,000
8,386,168
Revenue
,
2017
C-2
,
5
%
,
11/15/42
.....................................
18,190,000
18,940,061
Revenue
,
2020
A
,
5
%
,
11/15/49
.......................................
10,000,000
10,621,171
Revenue
,
2020
A
,
5
%
,
11/15/54
.......................................
10,000,000
10,592,694
Revenue
,
2024
A-1
,
5.25
%
,
11/15/51
...................................
5,000,000
5,579,700
Metropolitan
Transportation
Authority
Payroll
Mobility
Tax
,
Revenue,
Senior
Lien
,
2021
A-1
,
Refunding
,
5
%
,
5/15/51
....................................
20,000,000
21,312,448
Metropolitan
Transportation
Authority
Payroll
Mobility
Tax
,
Revenue,
Senior
Lien
,
2022
D-1B
,
Refunding
,
Zero
Cpn.,
11/15/36
............................
6,250,000
3,945,927
Metropolitan
Transportation
Authority
Payroll
Mobility
Tax
,
Revenue,
Senior
Lien
,
2022
D-1B
,
Refunding
,
Zero
Cpn.,
11/15/39
............................
1,115,000
603,887
Metropolitan
Transportation
Authority
Payroll
Mobility
Tax
,
Revenue,
Senior
Lien
,
2024
B-1
,
Refunding
,
4.125
%
,
5/15/54
................................
5,000,000
4,952,944
Metropolitan
Transportation
Authority
Payroll
Mobility
Tax
,
Revenue,
Senior
Lien
,
2024
B-1
,
Refunding
,
5.25
%
,
5/15/54
.................................
19,000,000
21,081,438
Sales
Tax
,
Revenue
,
2023
A
,
4
%
,
5/15/48
...............................
9,175,000
9,036,199
Sales
Tax
,
Revenue
,
2024
A-1
,
5.25
%
,
5/15/64
...........................
10,000,000
11,002,071
Troy
Capital
Resource
Corp.
,
Revenue
,
2021
,
Refunding
,
4
%
,
9/01/33
.................................
100,000
102,746
Revenue
,
2021
,
Refunding
,
4
%
,
9/01/34
.................................
160,000
164,158
Revenue
,
2021
,
Refunding
,
4
%
,
9/01/35
.................................
180,000
183,494
Revenue
,
2021
,
Refunding
,
4
%
,
9/01/36
.................................
280,000
283,914
Rensselaer
Polytechnic
Institute
,
Revenue
,
2020
A
,
Refunding
,
5
%
,
9/01/35
......
3,200,000
3,501,588
Rensselaer
Polytechnic
Institute
,
Revenue
,
2020
A
,
Refunding
,
5
%
,
9/01/37
......
5,000,000
5,411,939
Rensselaer
Polytechnic
Institute
,
Revenue
,
2020
A
,
Refunding
,
5
%
,
9/01/38
......
3,800,000
4,090,650
Rensselaer
Polytechnic
Institute
,
Revenue
,
2020
A
,
Refunding
,
4
%
,
9/01/40
......
1,500,000
1,486,931
Trust
for
Cultural
Resources
of
The
City
of
New
York
(The)
,
Lincoln
Center
for
the
Performing
Arts,
Inc.
,
Revenue
,
2020
A
,
Refunding
,
4
%
,
12/01/34
.......................................................
1,000,000
1,039,848
Lincoln
Center
for
the
Performing
Arts,
Inc.
,
Revenue
,
2020
A
,
Refunding
,
4
%
,
12/01/35
.......................................................
1,250,000
1,292,760
Utility
Debt
Securitization
Authority
,
Revenue
,
2017
,
5
%
,
12/15/39
........................................
5,750,000
6,045,063
Revenue
,
2017
,
5
%
,
12/15/40
........................................
10,000,000
10,497,545
Revenue
,
2017
,
5
%
,
12/15/41
........................................
8,500,000
8,907,509
Westchester
County
Local
Development
Corp.
,
Kendal
on
Hudson
Obligated
Group
,
Revenue
,
2022
B
,
Refunding
,
4.25
%
,
1/01/45
2,925,000
2,870,153
Franklin
New
York
Tax-Free
Income
Fund
Schedule
of
Investments
(unaudited)
Semiannual
Report
The
accompanying
notes
are
an
integral
part
of
these
financial
statements.
a
a
Principal
Amount
a
Value
a
a
a
a
a
Municipal
Bonds
(continued)
New
York
(continued)
Westchester
County
Local
Development
Corp.,
(continued)
Kendal
on
Hudson
Obligated
Group
,
Revenue
,
2022
B
,
Refunding
,
5
%
,
1/01/51
...
$
2,500,000
$
2,568,015
New
York
Blood
Center,
Inc.
,
Revenue
,
2024
,
5
%
,
7/01/35
...................
2,250,000
2,504,682
New
York
Blood
Center,
Inc.
,
Revenue
,
2024
,
5
%
,
7/01/38
...................
2,260,000
2,488,606
Westchester
County
Health
Care
Corp.
Obligated
Group
,
Revenue
,
2023
,
AGMC
Insured
,
5.75
%
,
11/01/49
..........................................
1,000,000
1,134,486
Westchester
County
Health
Care
Corp.
Obligated
Group
,
Revenue
,
2023
,
AGMC
Insured
,
5
%
,
11/01/51
.............................................
1,200,000
1,279,537
Westchester
County
Health
Care
Corp.
Obligated
Group
,
Revenue
,
2023
,
6.25
%
,
11/01/52
.......................................................
1,000,000
1,141,103
Westchester
County
Health
Care
Corp.
Obligated
Group
,
Revenue
,
2023
,
AGMC
Insured
,
5.75
%
,
11/01/53
..........................................
1,000,000
1,127,862
Western
Nassau
County
Water
Authority
,
Revenue
,
2015
A
,
Pre-Refunded
,
5
%
,
4/01/40
............................
1,400,000
1,418,606
Revenue
,
2015
A
,
Pre-Refunded
,
5
%
,
4/01/45
............................
2,250,000
2,279,903
Yonkers
Industrial
Development
Agency
,
Revenue
,
2022
,
5.25
%
,
5/01/51
.........
1,600,000
1,724,565
2,510,124,683
South
Carolina
1.1%
South
Carolina
Jobs-Economic
Development
Authority
,
b
Revenue
,
144A,
2021
A-1
,
3.65
%
,
12/01/36
..............................
6,900,000
6,042,697
AHPC
Vista
Towers
2021
LLC
,
Revenue
,
2021
A-1
,
3.65
%
,
12/01/36
...........
6,900,000
6,042,697
b
Columbia
Portfolio
Obligated
Group
,
Revenue
,
144A,
2022
A-2
,
Zero
Cpn.,
6/01/52
16,250,000
12,380,449
b
South
Carolina
State
Housing
Finance
&
Development
Authority
,
Garden
Oaks
LP
,
Revenue
,
144A,
2021
A
,
4.2
%
,
12/01/39
................................
6,000,000
5,085,461
29,551,304
Texas
0.5%
City
of
Dallas
,
DHFC
-
Briscoe
Apartments
LLC
(The)
,
Revenue,
Senior
Lien
,
2022
A
,
6
%
,
12/01/62
.....................................................
4,390,000
4,363,424
b
Pecan
Public
Facility
Corp.
,
Revenue
,
144A,
2022
A-2
,
5
%
,
12/01/52
............
10,000,000
8,214,243
12,577,667
Washington
0.2%
b
Washington
State
Housing
Finance
Commission
,
Madison
at
Rivers
Edge
Apartments
LLC
,
Revenue
,
144A,
2021
A
,
3.65
%
,
1/01/37
............................
6,900,000
6,044,308
Wisconsin
0.3%
b
Public
Finance
Authority
,
Revenue
,
144A,
2022
,
B-1
,
4
%
,
12/28/44
................................
6,500,000
5,472,409
Pine
Forest
2022
Obligated
Group
,
Revenue
,
144A,
2022
A
,
6.5
%
,
12/01/52
.....
1,500,000
1,552,969
7,025,378
U.S.
Territories
2.3%
Guam
0.3%
Antonio
B
Won
Pat
International
Airport
Authority
,
Revenue
,
2023
A
,
Refunding
,
5
%
,
10/01/28
..............................
540,000
553,267
Revenue
,
2023
A
,
Refunding
,
5.25
%
,
10/01/29
............................
700,000
730,767
Revenue
,
2023
A
,
Refunding
,
5.25
%
,
10/01/31
............................
775,000
806,987
Revenue
,
2023
A
,
Refunding
,
5.375
%
,
10/01/33
...........................
525,000
551,134
Revenue
,
2023
A
,
Refunding
,
5.25
%
,
10/01/36
............................
685,000
704,870
Revenue
,
2023
A
,
Refunding
,
5.375
%
,
10/01/40
...........................
525,000
540,190
Revenue
,
2023
A
,
Refunding
,
5.375
%
,
10/01/43
...........................
1,250,000
1,276,780
Guam
Power
Authority
,
Revenue
,
2024
A
,
Refunding
,
5
%
,
10/01/34
..............................
710,000
807,557
Revenue
,
2024
A
,
Refunding
,
5
%
,
10/01/35
..............................
500,000
566,248
Revenue
,
2024
A
,
Refunding
,
5
%
,
10/01/36
..............................
450,000
506,464
Franklin
New
York
Tax-Free
Income
Fund
Schedule
of
Investments
(unaudited)
The
accompanying
notes
are
an
integral
part
of
these
financial
statements.
Semiannual
Report
a
a
Principal
Amount
a
Value
a
a
a
a
a
Municipal
Bonds
(continued)
U.S.
Territories
(continued)
Guam
(continued)
Guam
Power
Authority,
(continued)
Revenue
,
2024
A
,
Refunding
,
5
%
,
10/01/37
..............................
$
455,000
$
509,153
Revenue
,
2024
A
,
Refunding
,
5
%
,
10/01/38
..............................
575,000
641,107
Revenue
,
2024
A
,
Refunding
,
5
%
,
10/01/40
..............................
520,000
572,538
Revenue
,
2024
A
,
Refunding
,
5
%
,
10/01/42
..............................
250,000
271,818
9,038,880
Puerto
Rico
2.0%
HTA
TRRB
Custodial
Trust
,
Revenue
,
2007
N
,
5.25
%
,
7/01/34
.....................................
119,118
119,487
Revenue
,
2007
N
,
5.25
%
,
7/01/36
.....................................
164,300
164,951
Puerto
Rico
Electric
Power
Authority
,
Revenue
,
VV
,
Refunding
,
NATL
Insured
,
5.25
%
,
7/01/32
.........................................................
1,050,000
1,037,880
Puerto
Rico
Sales
Tax
Financing
Corp.
,
Sales
Tax
,
Revenue
,
A-1
,
4.75
%
,
7/01/53
................................
22,313,000
22,145,641
Sales
Tax
,
Revenue
,
A-1
,
5
%
,
7/01/58
..................................
26,245,000
26,361,069
Sales
Tax
,
Revenue
,
A-1
,
Zero
Cpn.,
7/01/51
.............................
20,000,000
4,908,246
54,737,274
Total
U.S.
Territories
....................................................................
63,776,154
Total
Municipal
Bonds
(Cost
$
2,768,814,877
)
...................................
2,745,583,628
Total
Long
Term
Investments
(Cost
$
2,775,514,877
)
.............................
2,752,471,023
a
a
a
a
a
Short
Term
Investments
0.6%
Municipal
Bonds
0.6%
New
York
0.6%
e
City
of
New
York
,
GO
,
2020
B-3
,
Daily
VRDN
and
Put
,
4
%
,
10/01/46
.............
4,300,000
4,300,000
e
New
York
City
Municipal
Water
Finance
Authority
,
Water
&
Sewer
System
,
Revenue
,
2017
BB-1B
,
SPA
State
Street
Bank
&
Trust
Co.
,
Daily
VRDN
and
Put
,
4
%
,
6/15/49
....................................
100,000
100,000
Water
&
Sewer
System
,
Revenue
,
2021
EE-1
,
SPA
US
Bank
NA
,
Daily
VRDN
and
Put
,
3.6
%
,
6/15/45
...............................................
1,490,000
1,490,000
Water
&
Sewer
System
,
Revenue
,
2022
DD
,
Refunding
,
Daily
VRDN
and
Put
,
4
%
,
6/15/33
........................................................
8,700,000
8,700,000
Water
&
Sewer
System
,
Revenue
,
BB-1
A
,
SPA
State
Street
Bank
&
Trust
Co.
,
Daily
VRDN
and
Put
,
4
%
,
6/15/49
........................................
2,800,000
2,800,000
17,390,000
Total
Municipal
Bonds
(Cost
$
17,390,000
)
......................................
17,390,000
Total
Short
Term
Investments
(Cost
$
17,390,000
)
................................
17,390,000
a
Total
Investments
(Cost
$
2,792,904,877
)
99.0
%
..................................
$2,769,861,023
Other
Assets,
less
Liabilities
1.0
%
.............................................
27,427,079
Net
Assets
100.0%
...........................................................
$2,797,288,102
Franklin
New
York
Tax-Free
Income
Fund
Schedule
of
Investments
(unaudited)
Semiannual
Report
The
accompanying
notes
are
an
integral
part
of
these
financial
statements.
See
Abbreviations
on
page
29
.
a
Fair
valued
using
significant
unobservable
inputs.
See
Note
9
regarding
fair
value
measurements.
b
Security
was
purchased
pursuant
to
Rule
144A
or
Regulation
S
under
the
Securities
Act
of
1933.
144A
securities
may
be
sold
in
transactions
exempt
from
registration
only
to
qualified
institutional
buyers
or
in
a
public
offering
registered
under
the
Securities
Act
of
1933.
Regulation
S
securities
cannot
be
sold
in
the
United
States
without
either
an
effective
registration
statement
filed
pursuant
to
the
Securities
Act
of
1933,
or
pursuant
to
an
exemption
from
registration.
At
August
31,
2024,
the
aggregate
value
of
these
securities
was
$113,402,108,
representing
4.1%
of
net
assets.
c
The
maturity
date
shown
represents
the
mandatory
put
date.
d
A
portion
or
all
of
the
security
purchased
on
a
delayed
delivery
basis.
See
Note
1(b).
e
Variable
rate
demand
notes
(VRDNs)
are
obligations
which
contain
a
floating
or
variable
interest
rate
adjustment
formula
and
an
unconditional
right
of
demand
to
receive
payment
of
the
principal
balance
plus
accrued
interest
at
specified
dates.
Unless
otherwise
noted,
the
coupon
rate
is
determined
based
on
factors
including
supply
and
demand,
underlying
credit,
tax
treatment,
and
current
short
term
rates.
The
coupon
rate
shown
represents
the
rate
at
period
end.
Franklin
New
York
Tax-Free
Income
Fund
Financial
Statements
Statement
of
Assets
and
Liabilities
August
31,
2024
(unaudited)
The
accompanying
notes
are
an
integral
part
of
these
financial
statements.
Semiannual
Report
Franklin
New
York
Tax-Free
Income
Fund
Assets:
Investments
in
securities:
Cost
-
Unaffiliated
issuers
...................................................................
$2,792,904,877
Value
-
Unaffiliated
issuers
..................................................................
$2,769,861,023
Cash
....................................................................................
683,460
Receivables:
Capital
shares
sold
........................................................................
590,186
Interest
.................................................................................
33,488,270
Total
assets
..........................................................................
2,804,622,939
Liabilities:
Payables:
Investment
securities
purchased
..............................................................
1,110,660
Capital
shares
redeemed
...................................................................
3,860,657
Management
fees
.........................................................................
1,072,899
Distribution
fees
..........................................................................
259,226
Transfer
agent
fees
........................................................................
344,258
Trustees'
fees
and
expenses
.................................................................
4,459
Distributions
to
shareholders
.................................................................
550,570
Accrued
expenses
and
other
liabilities
...........................................................
132,108
Total
liabilities
.........................................................................
7,334,837
Net
assets,
at
value
.................................................................
$2,797,288,102
Net
assets
consist
of:
Paid-in
capital
.............................................................................
$3,228,028,869
Total
distributable
earnings
(losses)
.............................................................
(430,740,767)
Net
assets,
at
value
.................................................................
$2,797,288,102
Franklin
New
York
Tax-Free
Income
Fund
Financial
Statements
Statement
of
Assets
and
Liabilities
(continued)
August
31,
2024
(unaudited)
Semiannual
Report
The
accompanying
notes
are
an
integral
part
of
these
financial
statements.
Franklin
New
York
Tax-Free
Income
Fund
Class
A:
Net
assets,
at
value
.......................................................................
$354,551,433
Shares
outstanding
........................................................................
35,286,215
Net
asset
value
per
share
a
,b
..................................................................
$10.05
Maximum
offering
price
per
share
(net
asset
value
per
share
÷
96
.25
%
)
b
................................
$10.44
Class
A1:
Net
assets,
at
value
.......................................................................
$1,799,531,288
Shares
outstanding
........................................................................
178,976,755
Net
asset
value
per
share
a
,b
..................................................................
$10.05
Maximum
offering
price
per
share
(net
asset
value
per
share
÷
96
.25
%
)
b
................................
$10.44
Class
C:
Net
assets,
at
value
.......................................................................
$55,148,837
Shares
outstanding
........................................................................
5,491,168
Net
asset
value
and
maximum
offering
price
per
share
a
,b
............................................
$10.04
Class
R6:
Net
assets,
at
value
.......................................................................
$106,154,348
Shares
outstanding
........................................................................
10,543,987
Net
asset
value
and
maximum
offering
price
per
share
b
.............................................
$10.07
Advisor
Class:
Net
assets,
at
value
.......................................................................
$481,902,196
Shares
outstanding
........................................................................
47,895,955
Net
asset
value
and
maximum
offering
price
per
share
b
.............................................
$10.06
a
Redemption
price
is
equal
to
net
asset
value
less
contingent
deferred
sales
charges,
if
applicable.
b
Net
asset
value
per
share
may
not
recalculate
due
to
rounding.
Franklin
New
York
Tax-Free
Income
Fund
Financial
Statements
Statement
of
Operations
for
the
six
months
ended
August
31,
2024
(unaudited)
The
accompanying
notes
are
an
integral
part
of
these
financial
statements.
Semiannual
Report
Franklin
New
York
Tax-Free
Income
Fund
Investment
income:
Interest:
Unaffiliated
issuers
........................................................................
$55,438,871
Expenses:
Management
fees
(Note
3
a
)
...................................................................
6,472,598
Distribution
fees:
(Note
3c
)
Class
A
................................................................................
444,957
Class
A1
...............................................................................
925,837
Class
C
................................................................................
193,838
Transfer
agent
fees:
(Note
3e
)
Class
A
................................................................................
100,659
Class
A1
...............................................................................
523,538
Class
C
................................................................................
16,854
Class
R6
...............................................................................
8,995
Advisor
Class
............................................................................
138,622
Custodian
fees
(Note
4
)
......................................................................
8,603
Reports
to
shareholders
fees
..................................................................
37,474
Registration
and
filing
fees
....................................................................
60,496
Professional
fees
...........................................................................
32,047
Trustees'
fees
and
expenses
..................................................................
17,461
Other
....................................................................................
95,894
Total
expenses
.........................................................................
9,077,873
Expense
reductions
(Note
4
)
...............................................................
(11,398)
Net
expenses
.........................................................................
9,066,475
Net
investment
income
................................................................
46,372,396
Realized
and
unrealized
gains
(losses):
Net
realized
gain
(loss)
from:
Investments:
Unaffiliated
issuers
......................................................................
(5,348,780)
Net
change
in
unrealized
appreciation
(depreciation)
on:
Investments:
Unaffiliated
issuers
......................................................................
11,387,298
Net
realized
and
unrealized
gain
(loss)
............................................................
6,038,518
Net
increase
(decrease)
in
net
assets
resulting
from
operations
..........................................
$52,410,914
Franklin
New
York
Tax-Free
Income
Fund
Financial
Statements
Statements
of
Changes
in
Net
Assets
Semiannual
Report
The
accompanying
notes
are
an
integral
part
of
these
financial
statements.
Franklin
New
York
Tax-Free
Income
Fund
Six
Months
Ended
August
31,
2024
(unaudited)
Year
Ended
February
29,
2024
Increase
(decrease)
in
net
assets:
Operations:
Net
investment
income
.................................................
$46,372,396
$91,806,923
Net
realized
gain
(loss)
.................................................
(5,348,780)
(21,584,688)
Net
change
in
unrealized
appreciation
(depreciation)
...........................
11,387,298
112,617,703
Net
increase
(decrease)
in
net
assets
resulting
from
operations
................
52,410,914
182,839,938
Distributions
to
shareholders:
Class
A
.............................................................
(5,505,612)
(10,877,666)
Class
A1
............................................................
(29,999,346)
(62,187,850)
Class
C
.............................................................
(802,745)
(2,028,402)
Class
R6
............................................................
(1,747,207)
(2,960,499)
Advisor
Class
........................................................
(8,184,247)
(13,095,135)
Total
distributions
to
shareholders
..........................................
(46,239,157)
(91,149,552)
Capital
share
transactions:
(Note
2
)
Class
A
.............................................................
(7,786,052)
(88,705)
Class
A1
............................................................
(96,000,501)
(175,889,187)
Class
C
.............................................................
(9,063,045)
(26,842,622)
Class
R6
............................................................
7,111,439
9,158,421
Advisor
Class
........................................................
(8,613,476)
141,520,411
Total
capital
share
transactions
............................................
(114,351,635)
(52,141,682)
Net
increase
(decrease)
in
net
assets
...................................
(108,179,878)
39,548,704
Net
assets:
Beginning
of
period
.....................................................
2,905,467,980
2,865,919,276
End
of
period
..........................................................
$2,797,288,102
$2,905,467,980
Franklin
New
York
Tax-Free
Income
Fund
Notes
to
Financial
Statements
(unaudited)
1.
Organization
and
Significant
Accounting
Policies
Franklin
New
York
Tax-Free
Income
Fund (Fund)
is
registered
under
the
Investment
Company
Act
of
1940
(1940
Act)
as
an
open-end
management
investment
company.
The Fund
follows
the
accounting
and
reporting
guidance
in
Financial
Accounting
Standards
Board
(FASB)
Accounting
Standards
Codification
Topic
946,
Financial
Services
–
Investment
Companies
(ASC
946)
and
applies
the
specialized
accounting
and
reporting
guidance
in
U.S.
Generally
Accepted
Accounting
Principles
(U.S.
GAAP),
including,
but
not
limited
to,
ASC
946.
The
Fund
offers five
classes
of
shares:
Class
A,
Class
A1,
Class
C,
Class
R6
and
Advisor
Class.
Class
C
shares
automatically
convert
to
Class
A
shares
on
a
monthly
basis,
after
they
have
been
held
for
8
years.
Each
class
of
shares
may
differ
by
its
initial
sales
load,
contingent
deferred
sales
charges,
voting
rights
on
matters
affecting
a
single
class,
its
exchange
privilege
and
fees
due
to
differing
arrangements
for
distribution
and
transfer
agent
fees.
The
following
summarizes
the Fund's
significant
accounting
policies.
a.
Financial
Instrument
Valuation
The
Fund's
investments
in
financial
instruments
are
carried
at
fair
value
daily.
Fair
value
is
the
price
that
would
be
received
to
sell
an
asset
or
paid
to
transfer
a
liability
in
an
orderly
transaction
between
market
participants
on
the
measurement
date.
The
Fund
calculates
the
net
asset
value
(NAV)
per
share
each business
day as
of
4
p.m.
Eastern
time
or
the
regularly
scheduled
close
of
the
New
York
Stock
Exchange
(NYSE),
whichever
is
earlier.
Under
compliance
policies
and
procedures
approved
by
the Fund's
Board
of
Trustees
(the
Board),
the
Board
has
designated
the
Fund’s
investment
manager
as
the
valuation
designee
and
has
responsibility
for
oversight
of
valuation.
The
investment
manager
is
assisted
by
the
Fund’s
administrator
in
performing
this
responsibility,
including
leading
the
cross-
functional
Valuation
Committee
(VC).
The
Fund
may
utilize
independent
pricing
services,
quotations
from
securities
and
financial
instrument
dealers,
and
other
market
sources
to
determine
fair
value.
Debt
securities
generally
trade
in
the over-the-counter
(OTC)
market
rather
than
on
a
securities
exchange.
The
Fund's
pricing
services
use
multiple
valuation
techniques
to
determine
fair
value.
In
instances
where
sufficient
market
activity
exists,
the
pricing
services
may
utilize
a
market-based
approach
through
which
quotes
from
market
makers
are
used
to
determine
fair
value.
In
instances
where
sufficient
market
activity
may
not
exist
or
is
limited,
the
pricing
services
also
utilize
proprietary
valuation
models
which
may
consider
market
characteristics
such
as
benchmark
yield
curves,
credit
spreads,
estimated
default
rates,
anticipated
market
interest
rate
volatility,
coupon
rates,
anticipated
timing
of
principal
repayments,
underlying
collateral,
and
other
unique
security
features
in
order
to
estimate
the
relevant
cash
flows,
which
are
then
discounted
to
calculate
the
fair
value.
The
Fund
has
procedures
to
determine
the
fair
value
of
financial
instruments
for
which
market
prices
are
not
reliable
or
readily
available.
Under
these
procedures,
the Fund
primarily
employs
a
market-based
approach
which
may
use
related
or
comparable
assets
or
liabilities,
recent
transactions,
market
multiples,
and
other
relevant
information
for
the
investment
to
determine
the
fair
value
of
the
investment.
An
income-based
valuation
approach
may
also
be
used
in
which
the
anticipated
future
cash
flows
of
the
investment
are
discounted
to
calculate
fair
value.
Discounts
may
also
be
applied
due
to
the
nature
or
duration
of
any
restrictions
on
the
disposition
of
the
investments.
Due
to
the
inherent
uncertainty
of
valuations
of
such
investments,
the
fair
values
may
differ
significantly
from
the
values
that
would
have
been
used
had
an
active
market
existed.
b.
Securities
Purchased
on
a
When-Issued,
Forward
Commitment or
Delayed
Delivery
Basis
The
Fund
may
purchase
securities
on
a when-issued,
forward
commitment
or
delayed
delivery basis,
with
payment
and
delivery
scheduled
for
a
future
date.
These
transactions
are
subject
to
market
fluctuations
and
are
subject
to
the
risk
that
the
value
at
delivery
may
be
more
or
less
than
the
trade
date
purchase
price.
Although
the
Fund
will
generally
purchase
these
securities
with
the
intention
of
holding
the
securities, it
may
sell
the
securities
before
the
settlement
date.
c.
Income
Taxes
It
is the Fund's
policy
to
qualify
as
a
regulated
investment
company
under
the
Internal
Revenue
Code. The Fund
intends
to
distribute
to
shareholders
substantially
all
of
its
taxable
income
and
net
realized
gains
to
relieve
it
from
federal
income
and
excise
taxes.
As
a
result,
no
provision
for
U.S.
federal
income
taxes
is
required.
Franklin
New
York
Tax-Free
Income
Fund
Notes
to
Financial
Statements
(unaudited)
The Fund
may
recognize
an
income
tax
liability
related
to
its
uncertain
tax
positions
under
U.S.
GAAP
when
the
uncertain
tax
position
has
a
less
than
50%
probability
that
it
will
be
sustained
upon
examination
by
the
tax
authorities
based
on
its
technical
merits.
As
of
August
31,
2024, the Fund
has
determined
that
no
tax
liability
is
required
in
its
financial
statements
related
to
uncertain
tax
positions
for
any
open
tax
years
(or
expected
to
be
taken
in
future
tax
years).
Open
tax
years
are
those
that
remain
subject
to
examination
and
are
based
on
the
statute
of
limitations
in
each
jurisdiction
in
which
the Fund
invests.
d.
Security
Transactions,
Investment
Income,
Expenses
and
Distributions
Security
transactions
are
accounted
for
on
trade
date.
Realized
gains
and
losses
on
security
transactions
are
determined
on
a
specific
identification
basis.
Interest
income
(including
interest
income
from
payment-in-kind
securities,
if
any)
and
estimated
expenses
are
accrued
daily.
Amortization
of
premium
and
accretion
of
discount
on
debt
securities
are
included
in
interest
income.
Paydown
gains
and
losses
are
recorded
as
an
adjustment
to
interest
income.
Dividends
from
net
investment
income
are
normally
declared
daily;
these
dividends
may
be
reinvested
or
paid
monthly
to
shareholders.
Distributions
from
realized
capital
gains
and
other
distributions,
if
any,
are
recorded
on
the
ex-dividend
date.
Distributable
earnings
are
determined
according
to
income
tax
regulations
(tax
basis)
and
may
differ
from
earnings
recorded
in
accordance
with
U.S.
GAAP.
These
differences
may
be
permanent
or
temporary.
Permanent
differences
are
reclassified
among
capital
accounts
to
reflect
their
tax
character.
These
reclassifications
have
no
impact
on
net
assets
or
the
results
of
operations.
Temporary
differences
are
not
reclassified,
as
they
may
reverse
in
subsequent
periods.
Realized
and
unrealized
gains
and
losses
and
net
investment
income,
excluding
class
specific
expenses,
are
allocated
daily
to
each
class
of
shares
based
upon
the
relative
proportion
of
net
assets
of
each
class.
Differences
in
per
share
distributions
by
class
are
generally
due
to
differences
in
class
specific
expenses.
e.
Insurance
The
scheduled
payments
of
interest
and
principal
for
each
insured
municipal
security
in
the
Fund
are
insured
by
either
a
new
issue
insurance
policy
or
a
secondary
insurance
policy.
Depending
on
the
type
of
coverage,
premiums
for
insurance
are
either
added
to
the
cost
basis
of
the
security
or
paid
by
a
third
party.
Insurance
companies
typically
insure
municipal
bonds
that
tend
to
be
of
very
high
quality,
with
the
majority
of
underlying
municipal
bonds
rated
A
or
better.
However,
an
event
involving
an
insurer
could
have
an
adverse
effect
on
the
value
of
the
securities
insured
by
that
insurance
company.
There
can
be
no
assurance
the
insurer
will
be
able
to
fulfill
its
obligations
under
the
terms
of
the
policy.
f.
Accounting
Estimates
The
preparation
of
financial
statements
in
accordance
with
U.S.
GAAP
requires
management
to
make
estimates
and
assumptions
that
affect
the
reported
amounts
of
assets
and
liabilities
at
the
date
of
the
financial
statements
and
the
amounts
of
income
and
expenses
during
the
reporting
period.
Actual
results
could
differ
from
those
estimates.
g.
Guarantees
and
Indemnifications
Under
the Fund's
organizational
documents,
its
officers
and trustees
are
indemnified
by
the
Fund against
certain
liabilities
arising
out
of
the
performance
of
their
duties
to
the
Fund.
Additionally,
in
the
normal
course
of
business,
the
Fund
enters
into
contracts
with
service
providers
that
contain
general
indemnification
clauses.
The Fund's
maximum
exposure
under
these
arrangements
is
unknown
as
this
would
involve
future
claims
that
may
be
made
against
the Fund
that
have
not
yet
occurred.
Currently,
the Fund
expects
the
risk
of
loss
to
be
remote.
1.
Organization
and
Significant
Accounting
Policies
(continued)
c.
Income
Taxes
(continued)
Franklin
New
York
Tax-Free
Income
Fund
Notes
to
Financial
Statements
(unaudited)
2.
Shares
of
Beneficial
Interest
At
August
31,
2024,
there
were
an
unlimited
number
of
shares
authorized
(without
par
value).
Transactions
in
the
Fund's
shares
were
as
follows:
3
.
Transactions
with
Affiliates
Franklin
Resources,
Inc.
is
the
holding
company
for
various
subsidiaries
that
together
are
referred
to
as
Franklin
Templeton.
Certain
officers
and trustees
of
the Fund are
also
officers
and/or
directors
of
the
following
subsidiaries:
Six
Months
Ended
August
31,
2024
Year
Ended
February
29,
2024
Shares
Amount
Shares
Amount
Class
A
Shares:
Shares
sold
a
...................................
2,230,239
$22,290,628
6,270,850
$61,249,057
Shares
issued
in
reinvestment
of
distributions
..........
511,112
5,084,420
1,008,368
9,876,215
Shares
redeemed
...............................
(3,525,111)
(35,161,100)
(7,303,081)
(71,213,977)
Net
increase
(decrease)
..........................
(783,760)
$(7,786,052)
(23,863)
$(88,705)
Class
A1
Shares:
Shares
sold
...................................
900,820
$8,996,633
2,951,490
$29,183,191
Shares
issued
in
reinvestment
of
distributions
..........
2,553,840
25,412,111
5,307,682
52,014,086
Shares
redeemed
...............................
(13,069,900)
(130,409,245)
(26,287,428)
(257,086,464)
Net
increase
(decrease)
..........................
(9,615,240)
$(96,000,501)
(18,028,256)
$(175,889,187)
Class
C
Shares:
Shares
sold
...................................
179,395
$1,786,681
476,435
$4,655,446
Shares
issued
in
reinvestment
of
distributions
..........
77,264
767,967
198,347
1,940,517
Shares
redeemed
a
..............................
(1,163,268)
(11,617,693)
(3,446,584)
(33,438,585)
Net
increase
(decrease)
..........................
(906,609)
$(9,063,045)
(2,771,802)
$(26,842,622)
Class
R6
Shares:
Shares
sold
...................................
1,243,687
$12,427,000
2,780,893
$27,498,026
Shares
issued
in
reinvestment
of
distributions
..........
154,231
1,537,435
262,561
2,578,133
Shares
redeemed
...............................
(686,033)
(6,852,996)
(2,128,802)
(20,917,738)
Net
increase
(decrease)
..........................
711,885
$7,111,439
914,652
$9,158,421
Advisor
Class
Shares:
Shares
sold
...................................
4,540,948
$45,340,911
32,768,105
$311,543,494
Shares
issued
in
reinvestment
of
distributions
..........
800,458
7,973,038
1,273,591
12,501,147
Shares
redeemed
...............................
(6,205,903)
(61,927,425)
(18,982,074)
(182,524,230)
Net
increase
(decrease)
..........................
(864,497)
$(8,613,476)
15,059,622
$141,520,411
a
May
include
a
portion
of
Class
C
shares
that
were
automatically
converted
to
Class
A.
Subsidiary
Affiliation
Franklin
Advisers,
Inc.
(Advisers)
Investment
manager
Franklin
Templeton
Services,
LLC
(FT
Services)
Administrative
manager
Franklin
Distributors,
LLC
(Distributors)
Principal
underwriter
Franklin
Templeton
Investor
Services,
LLC
(Investor
Services)
Transfer
agent
Franklin
New
York
Tax-Free
Income
Fund
Notes
to
Financial
Statements
(unaudited)
a.
Management
Fees
The
Fund
pays
an
investment
management
fee,
calculated
daily
and
paid
monthly,
to
Advisers
based
on
the
month-end
net
assets
of
the
Fund
as
follows:
For
the
period
ended
August
31,
2024,
the
annualized
gross
effective
investment
management
fee
rate
was 0.452%
of
the
Fund’s
average daily
net
assets.
b.
Administrative
Fees
Under
an
agreement
with
Advisers,
FT
Services
provides
administrative
services
to
the
Fund.
The
fee
is
paid
by
Advisers
based
on
the
Fund's
average
daily
net
assets,
and
is
not
an
additional
expense
of
the
Fund.
c.
Distribution
Fees
The
Board
has
adopted
distribution
plans
for
each
share
class,
with
the
exception
of
Class
R6
and
Advisor
Class
shares,
pursuant
to
Rule
12b-1
under
the
1940
Act.
Under
the
Fund's
Class
A
and
A1
reimbursement
distribution
plans,
the
Fund
reimburses
Distributors
for
costs
incurred
in
connection
with
the
servicing,
sale
and
distribution
of the
Fund's
shares
up
to
the
maximum
annual
plan
rate
for
each
class.
Under
the
Class
A
and
A1
reimbursement
distribution
plans,
costs
exceeding
the
maximum
for
the
current
plan
year
cannot
be
reimbursed
in
subsequent
periods.
In
addition,
under
the
Fund's
Class
C
compensation
distribution
plan,
the
Fund
pays
Distributors
for
costs
incurred
in
connection
with
the
servicing,
sale
and
distribution
of
the
Fund's
shares
up
to
the
maximum
annual
plan
rate.
The
plan
year,
for
purposes
of
monitoring
compliance
with
the
maximum
annual
plan
rates,
is
February
1
through
January
31.
The
maximum
annual
plan
rates,
based
on
the
average
daily
net
assets,
for
each
class,
are
as
follows:
d.
Sales
Charges/Underwriting
Agreements
Front-end
sales
charges
and
contingent
deferred
sales
charges
(CDSC)
do
not
represent
expenses
of
the
Fund.
These
charges
are
deducted
from
the
proceeds
of
sales
of
fund
shares
prior
to
investment
or
from
redemption
proceeds
prior
to
remittance,
as
applicable.
Distributors
has
advised
the
Fund
of
the
following
commission
transactions
related
to
the
sales
and
redemptions
of
the
Fund's
shares
for
the
period:
Annualized
Fee
Rate
Net
Assets
0.625%
Up
to
and
including
$100
million
0.500%
Over
$100
million,
up
to
and
including
$250
million
0.450%
Over
$250
million,
up
to
and
including
$7.5
billion
0.440%
Over
$7.5
billion,
up
to
and
including
$10
billion
0.430%
Over
$10
billion,
up
to
and
including
$12.5
billion
0.420%
Over
$12.5
billion,
up
to
and
including
$15
billion
0.400%
Over
$15
billion,
up
to
and
including
$17.5
billion
0.380%
Over
$17.5
billion,
up
to
and
including
$20
billion
0.360%
In
excess
of
$20
billion
Class
A
....................................................................................
0.25%
Class
A1
...................................................................................
0.10%
Class
C
....................................................................................
0.65%
Sales
charges
retained
net
of
commissions
paid
to
unaffiliated
brokers/dealers
..............................
$9,288
CDSC
retained
..............................................................................
$7,833
3
.
Transactions
with
Affiliates
(continued)
Franklin
New
York
Tax-Free
Income
Fund
Notes
to
Financial
Statements
(unaudited)
e.
Transfer
Agent
Fees
Each
class
of
shares pays
transfer
agent
fees,
calculated
monthly
and
paid
monthly, to
Investor
Services
for
its
performance
of
shareholder
servicing
obligations. The
fees
are based
on
a
fixed
margin
earned
by
Investor
Services
and
are allocated
to
the Fund
based
upon
relative
assets
and
relative
transactions. In
addition,
each
class reimburses
Investor
Services
for
out
of
pocket
expenses
incurred
and,
except
for
Class
R6, reimburses
shareholder
servicing
fees
paid
to
third
parties.
These
fees
paid
to
third
parties
are
accrued
and
allocated
daily
based
upon
their
relative
proportion
of
such
classes'
aggregate
net
assets.
Class
R6
pays
Investor
Services
transfer
agent
fees
allocated
specifically
to
that
class
based
upon
its
relative
assets
and
relative
transactions.
For
the
period
ended
August
31,
2024,
the Fund
paid
transfer
agent
fees
as
noted
in
the
Statement of
Operations,
of
which
$299,472
was
retained
by
Investor
Services.
f.
Waiver
and
Expense
Reimbursements
Advisers
has contractually
agreed
in
advance
to
waive
or
limit
its fees
and
to
assume
as
its
own
expense
certain
expenses
otherwise
payable
by
the
Fund
so
that
the
operating expenses
(excluding
interest
expense,
distribution
fees,
acquired
fund
fees
and
expenses
and
certain
non-routine
expenses
or
costs,
including
those
relating
to
litigation,
indemnification,
reorganizations,
and
liquidations)
for
each
class
of
the
Fund
do
not
exceed 0.65%
based
on
the
average
net
assets
of
each
class
until
June
30,
2025.
Total
expenses
waived
or
paid
are
not
subject
to
recapture
subsequent
to
the
Fund's
fiscal
year
end.
Transfer
agent
fees
on
Class
R6
shares
of
the
Fund have
been
capped
so
that
transfer
agent
fees
for
that
class
do
not
exceed
0.03%
based
on
the
average
net
assets
of
the
class
until
June
30,
2025.
g.
Interfund
Transactions
The
Fund
engaged
in
purchases
and
sales
of
investments
with
funds
or
other
accounts
that
have
common
investment
managers
(or
affiliated
investment
managers),
directors,
trustees
or
officers.
During
the
period
ended
August
31,
2024,
these
purchase
and
sale
transactions
aggregated
$87,785,000
and
$77,180,000,
respectively.
4.
Expense
Offset
Arrangement
The Fund has
entered
into
an
arrangement
with
its
custodian
whereby
credits
realized
as
a
result
of
uninvested
cash
balances
are
used
to
reduce
a
portion
of
the
Fund's
custodian
expenses.
During
the
period
ended
August
31,
2024,
the
custodian
fees
were
reduced
as
noted
in
the
Statement
of
Operations.
5.
Income
Taxes
For
tax
purposes,
capital
losses
may
be
carried
over
to
offset
future
capital
gains.
At
February
29,
2024,
the
capital
loss
carryforwards
were
as
follows:
Capital
loss
carryforwards
not
subject
to
expiration:
Short
term
................................................................................
$92,665,269
Long
term
................................................................................
312,512,002
Total
capital
loss
carryforwards
...............................................................
$405,177,271
3
.
Transactions
with
Affiliates
(continued)
Franklin
New
York
Tax-Free
Income
Fund
Notes
to
Financial
Statements
(unaudited)
At
August
31,
2024,
the
cost
of
investments
and
net
unrealized
appreciation
(depreciation)
for
income
tax
purposes
were
as
follows:
6.
Investment
Transactions
Purchases
and
sales
of
investments (excluding
short
term
securities) for
the
period
ended
August
31,
2024,
aggregated
$169,648,915 and
$263,752,678,
respectively.
7.
Concentration
of
Risk
The
Fund
invests
a
large
percentage
of
its total
assets
in
obligations
of
issuers
within
New
York
and
U.S.
territories.
Such
concentration
may
subject
the
Fund
to
risks
associated
with
industrial
or
regional
matters,
and
economic,
political
or
legal
developments
occurring
within
New
York
and
U.S.
territories. Investments
in
these
securities
are
sensitive
to
interest
rate
changes
and
credit
risk
of
the
issuer
and
may
subject
the
Fund
to
increased
market
volatility.
The
market
for
these
investments
may
be
limited,
which
may
make
them
difficult
to
buy
or
sell.
8.
Credit
Facility
The
Fund,
together
with
other
U.S.
registered
and
foreign
investment
funds
(collectively,
Borrowers),
managed
by
Franklin
Templeton,
are
borrowers
in
a
joint
syndicated
senior
unsecured
credit
facility
totaling
$2.675
billion
(Global
Credit
Facility)
which
matures
on
January
31,
2025.
This
Global
Credit
Facility
provides
a
source
of
funds
to
the
Borrowers
for
temporary
and
emergency
purposes,
including
the
ability
to
meet
future
unanticipated
or
unusually
large
redemption
requests.
Under
the
terms
of
the
Global
Credit
Facility,
the
Fund
shall,
in
addition
to
interest
charged
on
any
borrowings
made
by
the
Fund
and
other
costs
incurred
by
the
Fund,
pay
its
share
of
fees
and
expenses
incurred
in
connection
with
the
implementation
and
maintenance
of
the
Global
Credit
Facility,
based
upon
its
relative
share
of
the
aggregate
net
assets
of
all
of
the
Borrowers,
including
an
annual
commitment
fee
of
0.15%
based
upon
the
unused
portion
of
the
Global
Credit
Facility.
These
fees
are
reflected
in
other
expenses
in
the
Statement
of
Operations.
During
the
period
ended
August
31,
2024,
the Fund
did
not
use
the
Global
Credit
Facility.
9.
Fair
Value
Measurements
The
Fund
follows
a
fair
value
hierarchy
that
distinguishes
between
market
data
obtained
from
independent
sources
(observable
inputs)
and
the Fund's
own
market
assumptions
(unobservable
inputs).
These
inputs
are
used
in
determining
the
value
of
the
Fund's financial
instruments
and
are
summarized
in
the
following
fair
value
hierarchy:
Level
1
–
quoted
prices
in
active
markets
for
identical
financial
instruments
Level
2
–
other
significant
observable
inputs
(including
quoted
prices
for
similar
financial
instruments,
interest
rates,
prepayment
speed,
credit
risk,
etc.)
Level
3
–
significant
unobservable
inputs
(including
the
Fund's
own
assumptions
in
determining
the
fair
value
of
financial
instruments)
Cost
of
investments
..........................................................................
$2,793,136,348
Unrealized
appreciation
........................................................................
$58,140,979
Unrealized
depreciation
........................................................................
(81,416,304)
Net
unrealized
appreciation
(depreciation)
..........................................................
$(23,275,325)
Franklin
New
York
Tax-Free
Income
Fund
Notes
to
Financial
Statements
(unaudited)
The
input
levels
are
not
necessarily
an
indication
of
the
risk
or
liquidity
associated
with
financial
instruments
at
that
level.
A
summary
of
inputs
used
as
of August
31,
2024,
in
valuing
the
Fund's
assets
carried
at
fair
value,
is
as
follows:
A
reconciliation
in
which
Level
3
inputs
are
used
in
determining
fair
value
is
presented
when
there
are
significant
Level
3
assets
and/or
liabilities
at
the
beginning
and/or
end
of
the period.
10.
Subsequent
Events
The
Fund
has
evaluated
subsequent
events
through
the
issuance
of
the
financial
statements
and
determined
that
no
events
have
occurred
that
require
disclosure.
Abbreviations
Level
1
Level
2
Level
3
Total
Franklin
New
York
Tax-Free
Income
Fund
Assets:
Investments
in
Securities:
Corporate
Bonds
........................
$
—
$
—
$
6,887,395
$
6,887,395
Municipal
Bonds
.........................
—
2,745,583,628
—
2,745,583,628
Short
Term
Investments
...................
—
17,390,000
—
17,390,000
Total
Investments
in
Securities
...........
$—
$2,762,973,628
$6,887,395
$2,769,861,023
Selected
Portfolio
AGMC
Assured
Guaranty
Municipal
Corp.
AMBAC
American
Municipal
Bond
Assurance
Corp.
BAM
Build
America
Mutual
Assurance
Co.
FNMA
Federal
National
Mortgage
Association
GO
General
Obligation
NATL
National
Reinsurance
Corp.
SPA
Standby
Purchase
Agreement
9.
Fair
Value
Measurements
(continued)
Franklin
New
York
Tax-Free
Income
Fund
FRANKLIN
NEW
YORK
TAX-FREE
INCOME
FUND
(Fund)
At
an
in-person
meeting
held
on
April
16,
2024
(Meeting),
the
Board
of
Trustees
(Board)
of
the
Fund,
including
a
majority
of
the
trustees
who
are
not
“interested
persons”
as
defined
in
the
Investment
Company
Act
of
1940
(Independent
Trustees),
reviewed
and
approved
the
continuance
of
the
investment
management
agreement
between
Franklin
Advisers,
Inc.
(Manager)
and
the
Fund
(Management
Agreement)
for
an
additional
one-year
period.
The
Independent
Trustees
received
advice
from
and
met
separately
with
Independent
Trustee
counsel
in
considering
whether
to
approve
the
continuation
of
the
Management
Agreement.
In
considering
the
continuation
of
the
Management
Agreement,
the
Board
reviewed
and
considered
information
provided
by
the
Manager
at
the
Meeting
and
throughout
the
year
at
meetings
of
the
Board
and
its
committees.
The
Board
also
reviewed
and
considered
information
provided
in
response
to
a
detailed
set
of
requests
for
information
submitted
to
the
Manager
by
Independent
Trustee
counsel
on
behalf
of
the
Independent
Trustees
in
connection
with
the
annual
contract
renewal
process.
In
addition,
prior
to
the
Meeting,
the
Independent
Trustees
held
a
virtual
contract
renewal
meeting
at
which
the
Independent
Trustees
first
conferred
amongst
themselves
and
Independent
Trustee
counsel
about
contract
renewal
matters,
and
then
met
with
management
to
request
additional
information
that
the
Independent
Trustees
reviewed
and
considered
prior
to
and
at
the
Meeting.
The
Board
reviewed
and
considered
all
of
the
factors
it
deemed
relevant
in
approving
the
continuance
of
the
Management
Agreement,
including,
but
not
limited
to:
(i)
the
nature,
extent
and
quality
of
the
services
provided
by
the
Manager;
(ii)
the
investment
performance
of
the
Fund;
(iii)
the
costs
of
the
services
provided
and
profits
realized
by
the
Manager
and
its
affiliates
from
the
relationship
with
the
Fund;
(iv)
the
extent
to
which
economies
of
scale
are
realized
as
the
Fund
grows;
and
(v)
whether
fee
levels
reflect
these
economies
of
scale
for
the
benefit
of
Fund
investors.
In
approving
the
continuance
of
the
Management
Agreement,
the
Board,
including
a
majority
of
the
Independent
Trustees,
determined,
through
the
exercise
of
its
business
judgment,
that
the
terms
of
the
Management
Agreement
are
fair
and
reasonable
and
that
the
continuance
of
the
Management
Agreement
is
in
the
best
interests
of
the
Fund
and
its
shareholders.
While
attention
was
given
to
all
information
furnished,
the
following
discusses
some
primary
factors
relevant
to
the
Board’s
determination.
Changes
In
and
Disagreements
with
Accountants
For
the
period
covered
by
this
report
Not
applicable.
Results
of
Meeting(s)
of
Shareholders
For
the
period
covered
by
this
report
Not
applicable.
Remuneration
Paid
to
Directors,
Officers
and
Others
For
the
period
covered
by
this
report
Refer
to
the
financial
statements
included
herein.
Board
Approval
of
Management
and
Subadvisory
Agreements
For
the
period
covered
by
this
report
Franklin
New
York
Tax-Free
Income
Fund
Nature,
Extent
and
Quality
of
Services
The
Board
reviewed
and
considered
information
regarding
the
nature,
extent
and
quality
of
investment
management
services
provided
by
the
Manager
and
its
affiliates
to
the
Fund
and
its
shareholders.
This
information
included,
among
other
things,
the
qualifications,
background
and
experience
of
the
senior
management
and
investment
personnel
of
the
Manager,
as
well
as
information
on
succession
planning
where
appropriate;
the
structure
of
investment
personnel
compensation;
oversight
of
third-
party
service
providers;
investment
performance
reports
and
related
financial
information
for
the
Fund;
reports
on
expenses
and
shareholder
services;
legal
and
compliance
matters;
risk
controls;
pricing
and
other
services
provided
by
the
Manager
and
its
affiliates;
and
management
fees
charged
by
the
Manager
and
its
affiliates
to
US
funds
and
other
accounts,
including
management’s
explanation
of
differences
among
accounts
where
relevant.
The
Board
also
reviewed
and
considered
an
annual
report
on
payments
made
by
Franklin
Templeton
(FT)
or
the
Fund
to
financial
intermediaries,
as
well
as
a
memorandum
relating
to
third-party
servicing
arrangements.
The
Board
acknowledged
the
ongoing
integration
of
the
Putnam
family
of
funds
into
the
FT
family
of
funds
and
management’s
continued
development
of
strategies
to
address
areas
of
heightened
concern
in
the
mutual
fund
industry,
including
various
regulatory
initiatives
and
continuing
geopolitical
concerns.
The
Board
also
reviewed
and
considered
the
benefits
provided
to
Fund
shareholders
of
investing
in
a
fund
that
is
part
of
the
FT
family
of
funds.
The
Board
noted
the
financial
position
of
Franklin
Resources,
Inc.
(FRI),
the
Manager’s
parent,
and
its
commitment
to
the
mutual
fund
business
as
evidenced
by
its
continued
reassessment
of
the
fund
offerings
in
response
to
FT
acquisitions
and
the
market
environment,
as
well
as
project
initiatives
and
capital
investments
relating
to
the
services
provided
to
the
Fund
by
the
FT
organization.
The
Board
specifically
noted
FT’s
commitment
to
technological
innovation
and
advancement,
including
its
initiative
to
create
a
new
enterprise-wide
artificial
intelligence
platform.
Following
consideration
of
such
information,
the
Board
was
satisfied
with
the
nature,
extent
and
quality
of
services
provided
by
the
Manager
and
its
affiliates
to
the
Fund
and
its
shareholders.
Fund
Performance
The
Board
reviewed
and
considered
the
performance
results
of
the
Fund
over
various
time
periods
ended
December
31,
2023.
The
Board
considered
the
performance
returns
for
the
Fund
in
comparison
to
the
performance
returns
of
mutual
funds
deemed
comparable
to
the
Fund
included
in
a
universe
(Performance
Universe)
selected
by
Broadridge
Financial
Solutions,
Inc.
(Broadridge),
an
independent
provider
of
investment
company
data.
The
Board
received
a
description
of
the
methodology
used
by
Broadridge
to
select
the
mutual
funds
included
in
a
Performance
Universe.
The
Board
also
reviewed
and
considered
Fund
performance
reports
provided
and
discussions
that
occurred
with
portfolio
managers
at
Board
meetings
throughout
the
year.
A
summary
of
the
Fund’s
performance
results
is
below.
The
Performance
Universe
for
the
Fund
included
the
Fund
and
all
retail
and
institutional
New
York
municipal
debt
funds.
The
Board
noted
that
the
Fund’s
annualized
income
return
for
the
one-,
three-,
five-
and
10-year
periods
was
above
the
median
of
its
Performance
Universe.
The
Board
also
noted
that
the
Fund’s
annualized
total
return
for
the
one-,
three-,
five-
and
10-
year
periods
was
below
the
median
of
its
Performance
Universe.
The
Board
further
noted
management’s
view
regarding
the
income-related
attributes
of
the
Fund
(e.g.,
a
fund’s
investment
objective)
as
set
forth
in
the
Fund’s
registration
statement
and
that
the
evaluation
of
the
Fund’s
performance
relative
to
its
peers
on
an
income
return
basis
was
appropriate
given
these
attributes.
The
Board
also
noted
that
the
Fund’s
annualized
income
return
for
each
period
was
positive.
The
Board
concluded
that
the
Fund’s
performance
was
satisfactory.
Comparative
Fees
and
Expenses
The
Board
reviewed
and
considered
information
regarding
the
Fund’s
actual
total
expense
ratio
and
its
various
components,
including,
as
applicable,
management
fees;
transfer
agent
expenses;
underlying
fund
expenses;
Rule
12b-1
and
non-Rule
12b-1
service
fees;
and
other
non-management
fees.
The
Board
also
noted
the
quarterly
and
annual
reports
it
receives
on
all
marketing
support
payments
made
by
FT
to
financial
intermediaries.
The
Board
considered
the
actual
total
expense
ratio
and,
separately,
the
contractual
management
fee
rate,
without
the
effect
of
fee
waivers,
if
any
(Management
Rate)
of
the
Fund
in
comparison
to
the
median
expense
ratio
and
median
Management
Rate,
respectively,
of
other
mutual
funds
deemed
comparable
to
and
with
a
similar
expense
structure
to
the
Fund
selected
by
Broadridge
(Expense
Group).
Broadridge
fee
Franklin
New
York
Tax-Free
Income
Fund
and
expense
data
is
based
upon
information
taken
from
each
fund’s
most
recent
annual
or
semi-annual
report,
which
reflects
historical
asset
levels
that
may
be
quite
different
from
those
currently
existing,
particularly
in
a
period
of
market
volatility.
While
recognizing
such
inherent
limitation
and
the
fact
that
expense
ratios
and
Management
Rates
generally
increase
as
assets
decline
and
decrease
as
assets
grow,
the
Board
believed
the
independent
analysis
conducted
by
Broadridge
to
be
an
appropriate
measure
of
comparative
fees
and
expenses.
The
Broadridge
Management
Rate
includes
administrative
charges,
and
the
actual
total
expense
ratio,
for
comparative
consistency,
was
shown
for
Class
A1
shares
for
the
Fund
and
for
Class
A
shares
and
Class
M
shares
for
the
other
funds
in
the
Expense
Group.
The
Board
received
a
description
of
the
methodology
used
by
Broadridge
to
select
the
mutual
funds
included
in
the
Expense
Group.
The
Expense
Group
for
the
Fund
included
the
Fund
and
10
other
New
York
municipal
debt
funds.
The
Board
noted
that
the
Management
Rate
for
the
Fund
was
slightly
above
the
median
of
its
Expense
Group,
but
its
actual
total
expense
ratio
was
below
the
median
and
in
the
first
quintile
(least
expensive)
of
its
Expense
Group.
The
Board
also
noted
that
the
Fund’s
actual
total
expense
ratio
reflected
an
expense
cap
on
operating
expenses.
The
Board
concluded
that
the
Management
Rate
charged
to
the
Fund
is
reasonable.
Profitability
The
Board
reviewed
and
considered
information
regarding
the
profits
realized
by
the
Manager
and
its
affiliates
in
connection
with
the
operation
of
the
Fund.
In
this
respect,
the
Board
considered
the
Fund
profitability
analysis
provided
by
the
Manager
that
addresses
the
overall
profitability
of
FT’s
US
fund
business,
as
well
as
its
profits
in
providing
investment
management
and
other
services
to
each
of
the
individual
funds
during
the
12-month
period
ended
September
30,
2023,
being
the
most
recent
fiscal
year-end
for
FRI.
The
Board
noted
that
although
management
continually
makes
refinements
to
its
methodologies
used
in
calculating
profitability
in
response
to
organizational
and
product-related
changes,
the
overall
methodology
has
remained
consistent
with
that
used
in
the
Fund’s
profitability
report
presentations
from
prior
years.
The
Board
also
noted
that
an
independent
registered
public
accounting
firm
has
been
engaged
by
the
Manager
to
periodically
review
and
assess
the
allocation
methodologies
to
be
used
solely
by
the
Fund’s
Board
with
respect
to
the
profitability
analysis.
The
Board
noted
management’s
belief
that
costs
incurred
in
establishing
the
infrastructure
necessary
for
the
type
of
mutual
fund
operations
conducted
by
the
Manager
and
its
affiliates
may
not
be
fully
reflected
in
the
expenses
allocated
to
the
Fund
in
determining
its
profitability,
as
well
as
the
fact
that
the
level
of
profits,
to
a
certain
extent,
reflected
operational
cost
savings
and
efficiencies
initiated
by
management.
As
part
of
this
evaluation,
the
Board
considered
management’s
outsourcing
of
certain
operations,
which
effort
has
required
considerable
up-front
expenditures
by
the
Manager
but,
over
the
long
run
is
expected
to
result
in
greater
efficiencies.
The
Board
also
noted
management’s
expenditures
in
improving
shareholder
services
provided
to
the
Fund,
as
well
as
the
need
to
implement
systems
and
meet
additional
regulatory
and
compliance
requirements
resulting
from
recent
US
Securities
and
Exchange
Commission
and
other
regulatory
requirements.
The
Board
also
considered
the
extent
to
which
the
Manager
and
its
affiliates
might
derive
ancillary
benefits
from
fund
operations,
including
revenues
generated
from
transfer
agent
services,
potential
benefits
resulting
from
personnel
and
systems
enhancements
necessitated
by
fund
growth,
as
well
as
increased
leverage
with
service
providers
and
counterparties.
Based
upon
its
consideration
of
all
these
factors,
the
Board
concluded
that
the
level
of
profits
realized
by
the
Manager
and
its
affiliates
from
providing
services
to
the
Fund
was
not
excessive
in
view
of
the
nature,
extent
and
quality
of
services
provided
to
the
Fund.
Economies
of
Scale
The
Board
reviewed
and
considered
the
extent
to
which
the
Manager
may
realize
economies
of
scale,
if
any,
as
the
Fund
grows
larger
and
whether
the
Fund’s
management
fee
structure
reflects
any
economies
of
scale
for
the
benefit
of
shareholders.
With
respect
to
possible
economies
of
scale,
the
Board
noted
the
existence
of
management
fee
breakpoints,
which
operate
generally
to
share
any
economies
of
scale
with
the
Fund’s
shareholders
by
reducing
the
Fund’s
effective
management
fees
as
the
Fund
grows
in
size.
The
Board
considered
the
Manager’s
view
that
any
analyses
of
potential
Franklin
New
York
Tax-Free
Income
Fund
economies
of
scale
in
managing
a
particular
fund
are
inherently
limited
in
light
of
the
joint
and
common
costs
and
investments
the
Manager
incurs
across
the
FT
family
of
funds
as
a
whole.
The
Board
concluded
that
to
the
extent
economies
of
scale
may
be
realized
by
the
Manager
and
its
affiliates,
the
Fund’s
management
fee
structure
provided
a
sharing
of
benefits
with
the
Fund
and
its
shareholders
as
the
Fund
grows.
Conclusion
Based
on
its
review,
consideration
and
evaluation
of
all
factors
it
believed
relevant,
including
the
above-described
factors
and
conclusions,
the
Board
unanimously
approved
the
continuation
of
the
Management
Agreement
for
an
additional
one-year
period.
©
2024
Franklin
Templeton.
All
rights
reserved.
Item 8. Changes in and Disagreements with Accountants for Open-End Management Investment Companies.
The information is disclosed as part of the Financial Statements included in Item 7 of this Form N-CSR.
Item 9. Proxy Disclosures for Open-End Management Investment Companies.
The information is disclosed as part of the Financial Statements included in Item 7 of this Form N-CSR.
Item 10. Remuneration Paid to Directors, Officers, and Others of Open-End Management Investment Companies.
The information is disclosed as part of the Financial Statements included in Item 7 of this Form N-CSR.
Item 11. Statement Regarding Basis for Approval of Investment Advisory Contract.
The information is disclosed as part of the Financial Statements included in Item 7 of this Form N-CSR.
Item 12. Disclosure of Proxy Voting Policies and Procedures for Closed-End Management Investment Companies. N/A
Item 13. Portfolio Managers of Closed-End Management Investment Companies. N/A
Item 14. Purchases of Equity Securities by Closed-End Management Investment Company and Affiliated Purchasers. N/A
Item 15. Submission of Matters to a Vote of Security Holders.
There have been no changes to the procedures by which shareholders may recommend nominees to the Registrant’s Board of Trustees that would require disclosure herein.
Item 16. Controls and Procedures.
(a) Evaluation of Disclosure Controls and Procedures. The Registrant maintains disclosure controls and procedures that are designed to provide reasonable assurance that information required to be disclosed in the Registrant’s filings under the Securities Exchange Act of 1934, as amended, and the Investment Company Act of 1940 is recorded, processed, summarized and reported within the periods specified in the rules and forms of the Securities and Exchange Commission. Such information is accumulated and communicated to the Registrant’s management, including its principal executive officer and principal financial officer, as appropriate, to allow timely decisions regarding required disclosure. The Registrant’s management, including the principal executive officer and the principal financial officer, recognizes that any set of controls and procedures, no matter how well designed and operated, can provide only reasonable assurance of achieving the desired control objectives.
Within 90 days prior to the filing date of this Shareholder Report on Form N-CSRS, the Registrant had carried out an evaluation, under the supervision and with the participation of the Registrant’s management, including the Registrant’s principal executive officer and the Registrant’s principal financial officer, of the effectiveness of the design and operation of the Registrant’s disclosure controls and procedures. Based on such evaluation, the Registrant’s principal executive officer and principal financial officer concluded that the Registrant’s disclosure controls and procedures are effective.
(b) Changes in Internal Controls. There have been no changes in the Registrant’s internal control over financial reporting that occurred during the period covered by this report that has materially affected or is reasonably likely to materially affect the internal control over financial reporting.
Item 17. Disclosure of Securities Lending Activities for Closed-End Management Investment Company N/A
Item 18. Recovery of Erroneously Awarded Compensation.
(a) N/A
(b) N/A
Item 19. Exhibits.
(a) (1) N/A
(a) (2) Certifications pursuant to Section 302 of the Sarbanes-Oxley Act of 2002 of Christopher Kings, Chief Executive Officer - Finance and Administration, and Jeffrey White, Chief Financial Officer, Chief Accounting Officer and Treasurer
(b) Certifications pursuant to Section 906 of the Sarbanes-Oxley Act of 2002 of Christopher Kings, Chief Executive Officer - Finance and Administration, and Jeffrey White, Chief Financial Officer, Chief Accounting Officer and Treasurer
SIGNATURES
Pursuant to the requirements of the Securities Exchange Act of 1934 and the Investment Company Act of 1940, the registrant has duly caused this report to be signed on its behalf by the undersigned, thereunto duly authorized.
FRANKLIN NEW YORK TAX-FREE INCOME FUND
| By | /s/ CHRISTOPHER KINGS | |
| | Christopher Kings | |
| | Chief Executive Officer - Finance and Administration | |
| | | |
| Date | October 31, 2024 | |
Pursuant to the requirements of the Securities Exchange Act of 1934 and the Investment Company Act of 1940, this report has been signed below by the following persons on behalf of the registrant and in the capacities and on the dates indicated.
| By | /s/ CHRISTOPHER KINGS | |
| | Christopher Kings | |
| | Chief Executive Officer - Finance and Administration | |
| | | |
| Date | October 31, 2024 | |
| By | /s/ JEFFREY WHITE | |
| | Jeffrey White | |
| | Chief Financial Officer, Chief Accounting Officer and Treasurer | |
| | | |
| Date | October 31, 2024 | |