| | | | | | | | | | | | | | | | | | | | | | | |
| UNITED STATES |
| SECURITIES AND EXCHANGE COMMISSION |
| Washington, DC 20549 |
| | | | | | | |
| Form 10-K |
| | | | | | | |
ý Annual report pursuant to Section 13 or 15(d) of the Securities Exchange Act of 1934 for the fiscal year ended December 31, 2024 |
| OR |
¨ Transition report pursuant to Section 13 or 15(d) of the Securities Exchange Act of 1934 for the transition period from to |
| | | | | | | |
Commission File Number 1-7293 |
| | | | | | | |
| | | | | | | |
| TENET HEALTHCARE CORPORATION |
| (Exact name of Registrant as specified in its charter) |
| | | | | | | |
| Nevada | | | 95-2557091 | |
| (State of Incorporation) | | | (IRS Employer Identification No.) | |
| | | | | | | |
| 14201 Dallas Parkway |
| Dallas, TX 75254 |
| (Address of principal executive offices, including zip code) |
| | | | | | | |
| (469) 893-2200 |
| (Registrant’s telephone number, including area code) |
| | | | | | | |
| | | | | | | |
| Securities registered pursuant to Section 12(b) of the Act: |
| | | | | | | | | | | | | | | | | | | | |
| Title of each class | | Trading symbol | | Name of each exchange on which registered | |
| Common stock, $0.05 par value | | THC | | New York Stock Exchange | |
| 6.875% Senior Notes due 2031 | | THC31 | | New York Stock Exchange | |
| | | | | | | | | | | | | | | | | | | | | | | |
Securities registered pursuant to Section 12(g) of the Act: None |
|
| | | | | | | |
Indicate by check mark if the Registrant is a well-known seasoned issuer, as defined in Rule 405 of the Securities Act. Yes ý No ¨ |
| | | | | | | |
Indicate by check mark if the Registrant is not required to file reports pursuant to Section 13 or Section 15(d) of the Exchange Act. Yes ¨ No ý |
| | | | | | | |
Indicate by check mark whether the Registrant (1) has filed all reports required to be filed by Section 13 or 15(d) of the Exchange Act during the preceding 12 months, and (2) has been subject to such filing requirements for the past 90 days. Yes ý No ¨ |
| | | | | | | |
Indicate by check mark whether the Registrant has submitted electronically every Interactive Data File required to be submitted pursuant to Rule 405 of Regulation S-T during the preceding 12 months. Yes ý No ¨ |
| | | | | | | |
| Indicate by check mark whether the Registrant is a large accelerated filer, an accelerated filer, a non-accelerated filer, a smaller reporting company or an emerging growth company (each as defined in Exchange Act Rule 12b-2). |
| | | | | | | | | | | | | | |
Large accelerated filer ý | Accelerated filer ¨ | Non-accelerated filer ¨ |
| | | | | | | | | | | | | | |
| Smaller reporting company ☐ | | Emerging growth company ☐ | |
| | |
If an emerging growth company, indicate by check mark if the Registrant has elected not to use the extended transition period for complying with any new or revised financial accounting standards provided pursuant to Section 13(a) of the Exchange Act. ¨ |
|
Indicate by check mark whether the Registrant has filed a report on and attestation to its management’s assessment of the effectiveness of its internal control over financial reporting under Section 404(b) of the Sarbanes-Oxley Act (15 U.S.C. 7262(b)) by the registered public accounting firm that prepared or issued its audit report. ý |
|
| If securities are registered pursuant to Section 12(b) of the Exchange Act, indicate by check mark whether the financial statements of the Registrant included in the filing reflect the correction of an error to previously issued financial statements. ☐ |
|
Indicate by check mark whether any of those error corrections are restatements that required a recovery analysis of incentive-based compensation received by any of the Registrant’s executive officers during the relevant recovery period pursuant to §240.10D-1(b). ¨ |
|
Indicate by check mark whether the Registrant is a shell company (as defined in Exchange Act Rule 12b-2). Yes ¨ No ý |
|
| As of June 30, 2024, the aggregate market value of the shares of common stock held by non-affiliates of the Registrant (treating directors, executive officers who were SEC reporting persons, and holders of 10% or more of the common stock outstanding as of that date, for this purpose, as affiliates) was approximately $9.97 billion based on the closing price of the Registrant’s shares on the New York Stock Exchange on Friday, June 28, 2024. As of January 31, 2025, there were 95,121 shares (in thousands) of common stock outstanding. |
|
DOCUMENTS INCORPORATED BY REFERENCE |
|
| Portions of the Registrant’s definitive proxy statement for the 2025 annual meeting of shareholders are incorporated by reference into Part III of this Form 10-K. |
PART I.
ITEM 1. BUSINESS
OVERVIEW
Tenet Healthcare Corporation (“Tenet”) is a diversified healthcare services company with its headquarters in Dallas, Texas, and a Global Business Center (“GBC”) in the Philippines, that supports various enterprise-wide administrative functions. We operate our expansive, nationwide care delivery network through direct and indirect subsidiaries, as well as downstream partnerships and joint ventures; the terms “we,” “our” and “us,” as used in this report and unless otherwise stated or indicated by the context, refer to Tenet and these entities. Our business is organized into two separate reporting segments – Hospital Operations and Services (“Hospital Operations”) and Ambulatory Care.
At December 31, 2024, our Hospital Operations segment was comprised of: (1) 49 acute care and specialty hospitals, a network of employed physicians, and 135 outpatient facilities, including urgent care centers (each, a “UCC”), imaging centers, off-campus hospital emergency departments (“EDs”) and micro‑hospitals; and (2) the revenue cycle management and value‑based care services we provide to hospitals, health systems, physician practices, employers and other clients through our Conifer Health Solutions, LLC joint venture (“Conifer JV”). Our Ambulatory Care segment, through our USPI Holding Company, Inc. subsidiary (“USPI”), held ownership interests in 518 ambulatory surgery centers (each, an “ASC”) and 25 surgical hospitals at December 31, 2024. Additional information about our reporting segments is provided below; statistical data for the segments can be found in Item 7, Management’s Discussion and Analysis of Financial Condition and Results of Operations, of Part II of this report (“MD&A”).
OPERATIONS
HOSPITAL OPERATIONS AND SERVICES SEGMENT
In 2024, we continued to pursue advantageous opportunities to grow our portfolio of hospitals and other healthcare facilities. In July, we opened the newly constructed, 92‑bed Westover Hills Baptist Hospital in San Antonio, and, in September, we acquired a majority ownership interest in a 36‑bed rehabilitation hospital in El Paso. In addition, we continued construction in 2024 on a new medical campus located in Port St. Lucie, which will include the 54‑bed Florida Coast Surgical Hospital, as well as medical office space. We expect to complete construction of the Port St. Lucie medical campus in late 2025.
From time to time, we also capitalize on opportunities to refine our portfolio of hospitals and other healthcare facilities when we believe such refinements will help us improve profitability, allocate capital more effectively in areas where we have a stronger presence, deploy proceeds toward higher-return investments across our business, enhance cash flow generation or reduce our debt, among other things. To that end, we sold six hospitals in California and three hospitals in South Carolina, along with certain related operations, in 2024; in addition, we completed the sale of our majority ownership interests in several entities that owned or leased five hospitals and certain related operations in Alabama.
At December 31, 2024, our subsidiaries operated 49 acute care and specialty hospitals serving primarily urban and suburban communities in eight states. Our subsidiaries had sole ownership of 45 of these hospitals, two were owned by entities that are majority owned by a Tenet subsidiary, and two were owned by third parties and leased by our wholly owned subsidiaries.
Our general hospitals offer acute care services, operating and recovery rooms, radiology services, respiratory therapy services, clinical laboratories and pharmacies; in addition, most have: intensive care, critical care and/or coronary care units; cardiovascular, digestive disease, neurosciences, musculoskeletal and obstetrics services; and outpatient services, including physical therapy. Many of our hospitals provide tertiary care services, such as cardiothoracic surgery, complex spinal surgery, neonatal intensive care and neurosurgery, and our Children’s Hospital of Michigan also offers pediatric quaternary care through its heart, kidney and liver transplant programs. Moreover, a number of our hospitals offer advanced treatment options for patients, including limb‑salvaging vascular procedures, acute level 1 trauma services, comprehensive intravascular stroke care, minimally invasive cardiac valve replacement, cutting‑edge imaging technology, surgical robotic capabilities and telemedicine access for select medical specialties.
All of the hospitals in our Hospital Operations segment are licensed under appropriate state laws, and each is accredited by The Joint Commission or, in the case of The Hospitals of Providence Rehabilitation Hospital East, with the Center for Improvement in Healthcare Quality. With such accreditation, our hospitals are deemed to meet the Medicare Conditions of Participation and Conditions for Coverage, and they are eligible to participate in Medicare, Medicaid and other government‑sponsored provider programs.
The following table lists, by state, the hospitals wholly owned, operated as part of a joint venture, or leased and operated by our wholly owned subsidiaries at December 31, 2024:
| | | | | | | | | | | | | | | | | | | | |
| Hospital | | Location | | Licensed Beds | | Status |
| Arizona | | | | | | |
Abrazo Arizona Heart Hospital(1) | | Phoenix | | 59 | | Owned |
| Abrazo Arrowhead Campus | | Glendale | | 229 | | Owned |
| Abrazo Central Campus | | Phoenix | | 206 | | Owned |
| Abrazo Scottsdale Campus | | Phoenix | | 120 | | Owned |
| Abrazo West Campus | | Goodyear | | 216 | | Owned |
Holy Cross Hospital(2) | | Nogales | | 25 | | Owned |
| St. Joseph’s Hospital | | Tucson | | 451 | | Owned |
| St. Mary’s Hospital | | Tucson | | 400 | | Owned |
| | | | | | |
| California | | | | | | |
Desert Regional Medical Center(3) | | Palm Springs | | 385 | | Leased |
| Doctors Hospital of Manteca | | Manteca | | 73 | | Owned |
| Doctors Medical Center | | Modesto | | 461 | | Owned |
| Emanuel Medical Center | | Turlock | | 209 | | Owned |
Hi-Desert Medical Center(4) | | Joshua Tree | | 179 | | Leased |
| John F. Kennedy Memorial Hospital | | Indio | | 145 | | Owned |
San Ramon Regional Medical Center(5) | | San Ramon | | 123 | | JV/Owned |
| | | | | | |
| Florida | | | | | | |
| Delray Medical Center | | Delray Beach | | 536 | | Owned |
| Good Samaritan Medical Center | | West Palm Beach | | 333 | | Owned |
| Palm Beach Gardens Medical Center | | Palm Beach Gardens | | 199 | | Owned |
| St. Mary’s Medical Center | | West Palm Beach | | 420 | | Owned |
| West Boca Medical Center | | Boca Raton | | 195 | | Owned |
| | | | | | |
| Massachusetts | | | | | | |
| MetroWest Medical Center – Framingham Union Campus | | Framingham | | 136 | | Owned |
MetroWest Medical Center – Leonard Morse Campus(1) | | Natick | | 103 | | Owned |
| Saint Vincent Hospital | | Worcester | | 290 | | Owned |
| | | | | | |
| Michigan | | | | | | |
| Children’s Hospital of Michigan | | Detroit | | 228 | | Owned |
| Detroit Receiving Hospital | | Detroit | | 273 | | Owned |
| Harper University Hospital | | Detroit | | 470 | | Owned |
| Huron Valley-Sinai Hospital | | Commerce Township | | 158 | | Owned |
| Hutzel Women’s Hospital | | Detroit | | 114 | | Owned |
Rehabilitation Institute of Michigan(1) | | Detroit | | 69 | | Owned |
| Sinai-Grace Hospital | | Detroit | | 404 | | Owned |
| | | | | | |
| South Carolina | | | | | | |
| Piedmont Medical Center | | Rock Hill | | 294 | | Owned |
| Piedmont Medical Center Fort Mill | | Fort Mill | | 100 | | Owned |
| | | | | | |
| Tennessee | | | | | | |
| Saint Francis Hospital | | Memphis | | 479 | | Owned |
| Saint Francis Hospital – Bartlett | | Bartlett | | 196 | | Owned |
| | | | | | |
| | | | | | | | | | | | | | | | | | | | |
| Hospital | | Location | | Licensed Beds | | Status |
| Texas | | | | | |
| Baptist Medical Center | | San Antonio | | 607 | | Owned |
| The Hospitals of Providence East Campus | | El Paso | | 218 | | Owned |
| The Hospitals of Providence Memorial Campus | | El Paso | | 480 | | Owned |
The Hospitals of Providence Rehabilitation Hospital East(1) | | El Paso | | 36 | | JV/Owned |
| The Hospitals of Providence Sierra Campus | | El Paso | | 306 | | Owned |
| The Hospitals of Providence Transmountain Campus | | El Paso | | 108 | | Owned |
| Mission Trail Baptist Hospital | | San Antonio | | 114 | | Owned |
| Nacogdoches Medical Center | | Nacogdoches | | 161 | | Owned |
| North Central Baptist Hospital | | San Antonio | | 443 | | Owned |
| Northeast Baptist Hospital | | San Antonio | | 351 | | Owned |
| Resolute Baptist Hospital | | New Braunfels | | 128 | | Owned |
| St. Luke’s Baptist Hospital | | San Antonio | | 287 | | Owned |
| Valley Baptist Medical Center | | Harlingen | | 586 | | Owned |
| Valley Baptist Medical Center – Brownsville | | Brownsville | | 240 | | Owned |
| Westover Hills Baptist Hospital | | Westover Hills | | 92 | | Owned |
| Total Licensed Beds | | | | 12,435 | | |
(1)Specialty hospital.
(2)Designated by the Centers for Medicare & Medicaid Services (“CMS”) as a critical access hospital.
(3)Current lease expires on May 30, 2027. In December 2024, we entered into a new lease-purchase agreement with a term of May 31, 2027 through May 30, 2057; in accordance with the provisions of the agreement, we will take ownership of the hospital at the end of the term.
(4)Lease expires in July 2045.
(5)Owned by a limited liability company formed as part of a joint venture with John Muir Health, a not‑for‑profit health system in the San Francisco Bay area; a Tenet subsidiary owned a 51% interest in the entity at December 31, 2024, and John Muir Health owned a 49% interest.
Information regarding the utilization of licensed beds and other operating statistics at December 31, 2024 and 2023 can be found in MD&A.
Our Hospital Operations segment also included 135 outpatient centers at December 31, 2024, primarily freestanding UCCs (nearly all of which are jointly owned with and managed by NextCare in Arizona), provider‑based and freestanding imaging centers, off-campus hospital EDs and micro‑hospitals. Approximately 72% of the outpatient centers in our Hospital Operations segment at December 31, 2024 were in Arizona and Texas. Strong concentrations of facilities within operating areas may help us expand our managed care payer network, reduce management, marketing and other expenses, and more efficiently utilize resources. However, these concentrations increase the risk that, should any adverse economic, regulatory, environmental, competitive or other condition (including an epidemic or outbreak of an infectious disease) occur in these areas, our overall business, financial condition, results of operations or cash flows could be materially adversely affected.
In addition to the hospitals and outpatient facilities discussed above, our Hospital Operations segment includes physician practices and other associated healthcare businesses, as well as our Conifer JV’s revenue cycle management and value‑based care service offerings. At December 31, 2024, we owned 76.2% of the Conifer JV, and CommonSpirit Health held a 23.8% ownership position. The term “Conifer,” as used in Part I of this report and unless otherwise stated or indicated by the context, refers to our Conifer JV and its direct or indirect wholly owned subsidiaries.
The revenue cycle management solutions we offer consist of: (1) patient services, including: centralized insurance and benefit verification; financial clearance, pre‑certification, registration and check‑in services; and financial counseling services, including reviews of eligibility for government healthcare or financial assistance programs, for both insured and uninsured patients, as well as qualified health plan coverage; (2) clinical revenue integrity solutions, including: clinical admission reviews; coding; clinical documentation improvement; coding compliance audits; charge description master management; and health information services; and (3) accounts receivable management solutions, including: third‑party billing and collections; denials management; and patient collections. All of these solutions include ongoing measurement and monitoring of key revenue cycle metrics, as well as productivity and quality improvement programs. In addition, we provide customized communications and engagement solutions to optimize the relationship between providers and patients. We also offer value‑based care services, including clinical integration, financial risk management and population health management, all of which aim to assist clients in improving the cost and quality of their healthcare delivery, as well as their patient outcomes.
At December 31, 2024, we provided one or more of the business process services described above to approximately 620 Tenet and non‑Tenet hospitals and other clients nationwide. Tenet and CommonSpirit Health facilities represented approximately 43% of these clients, and the remainder were unaffiliated health systems, hospitals, physician practices, self‑insured organizations, health plans and other entities.
AMBULATORY CARE SEGMENT
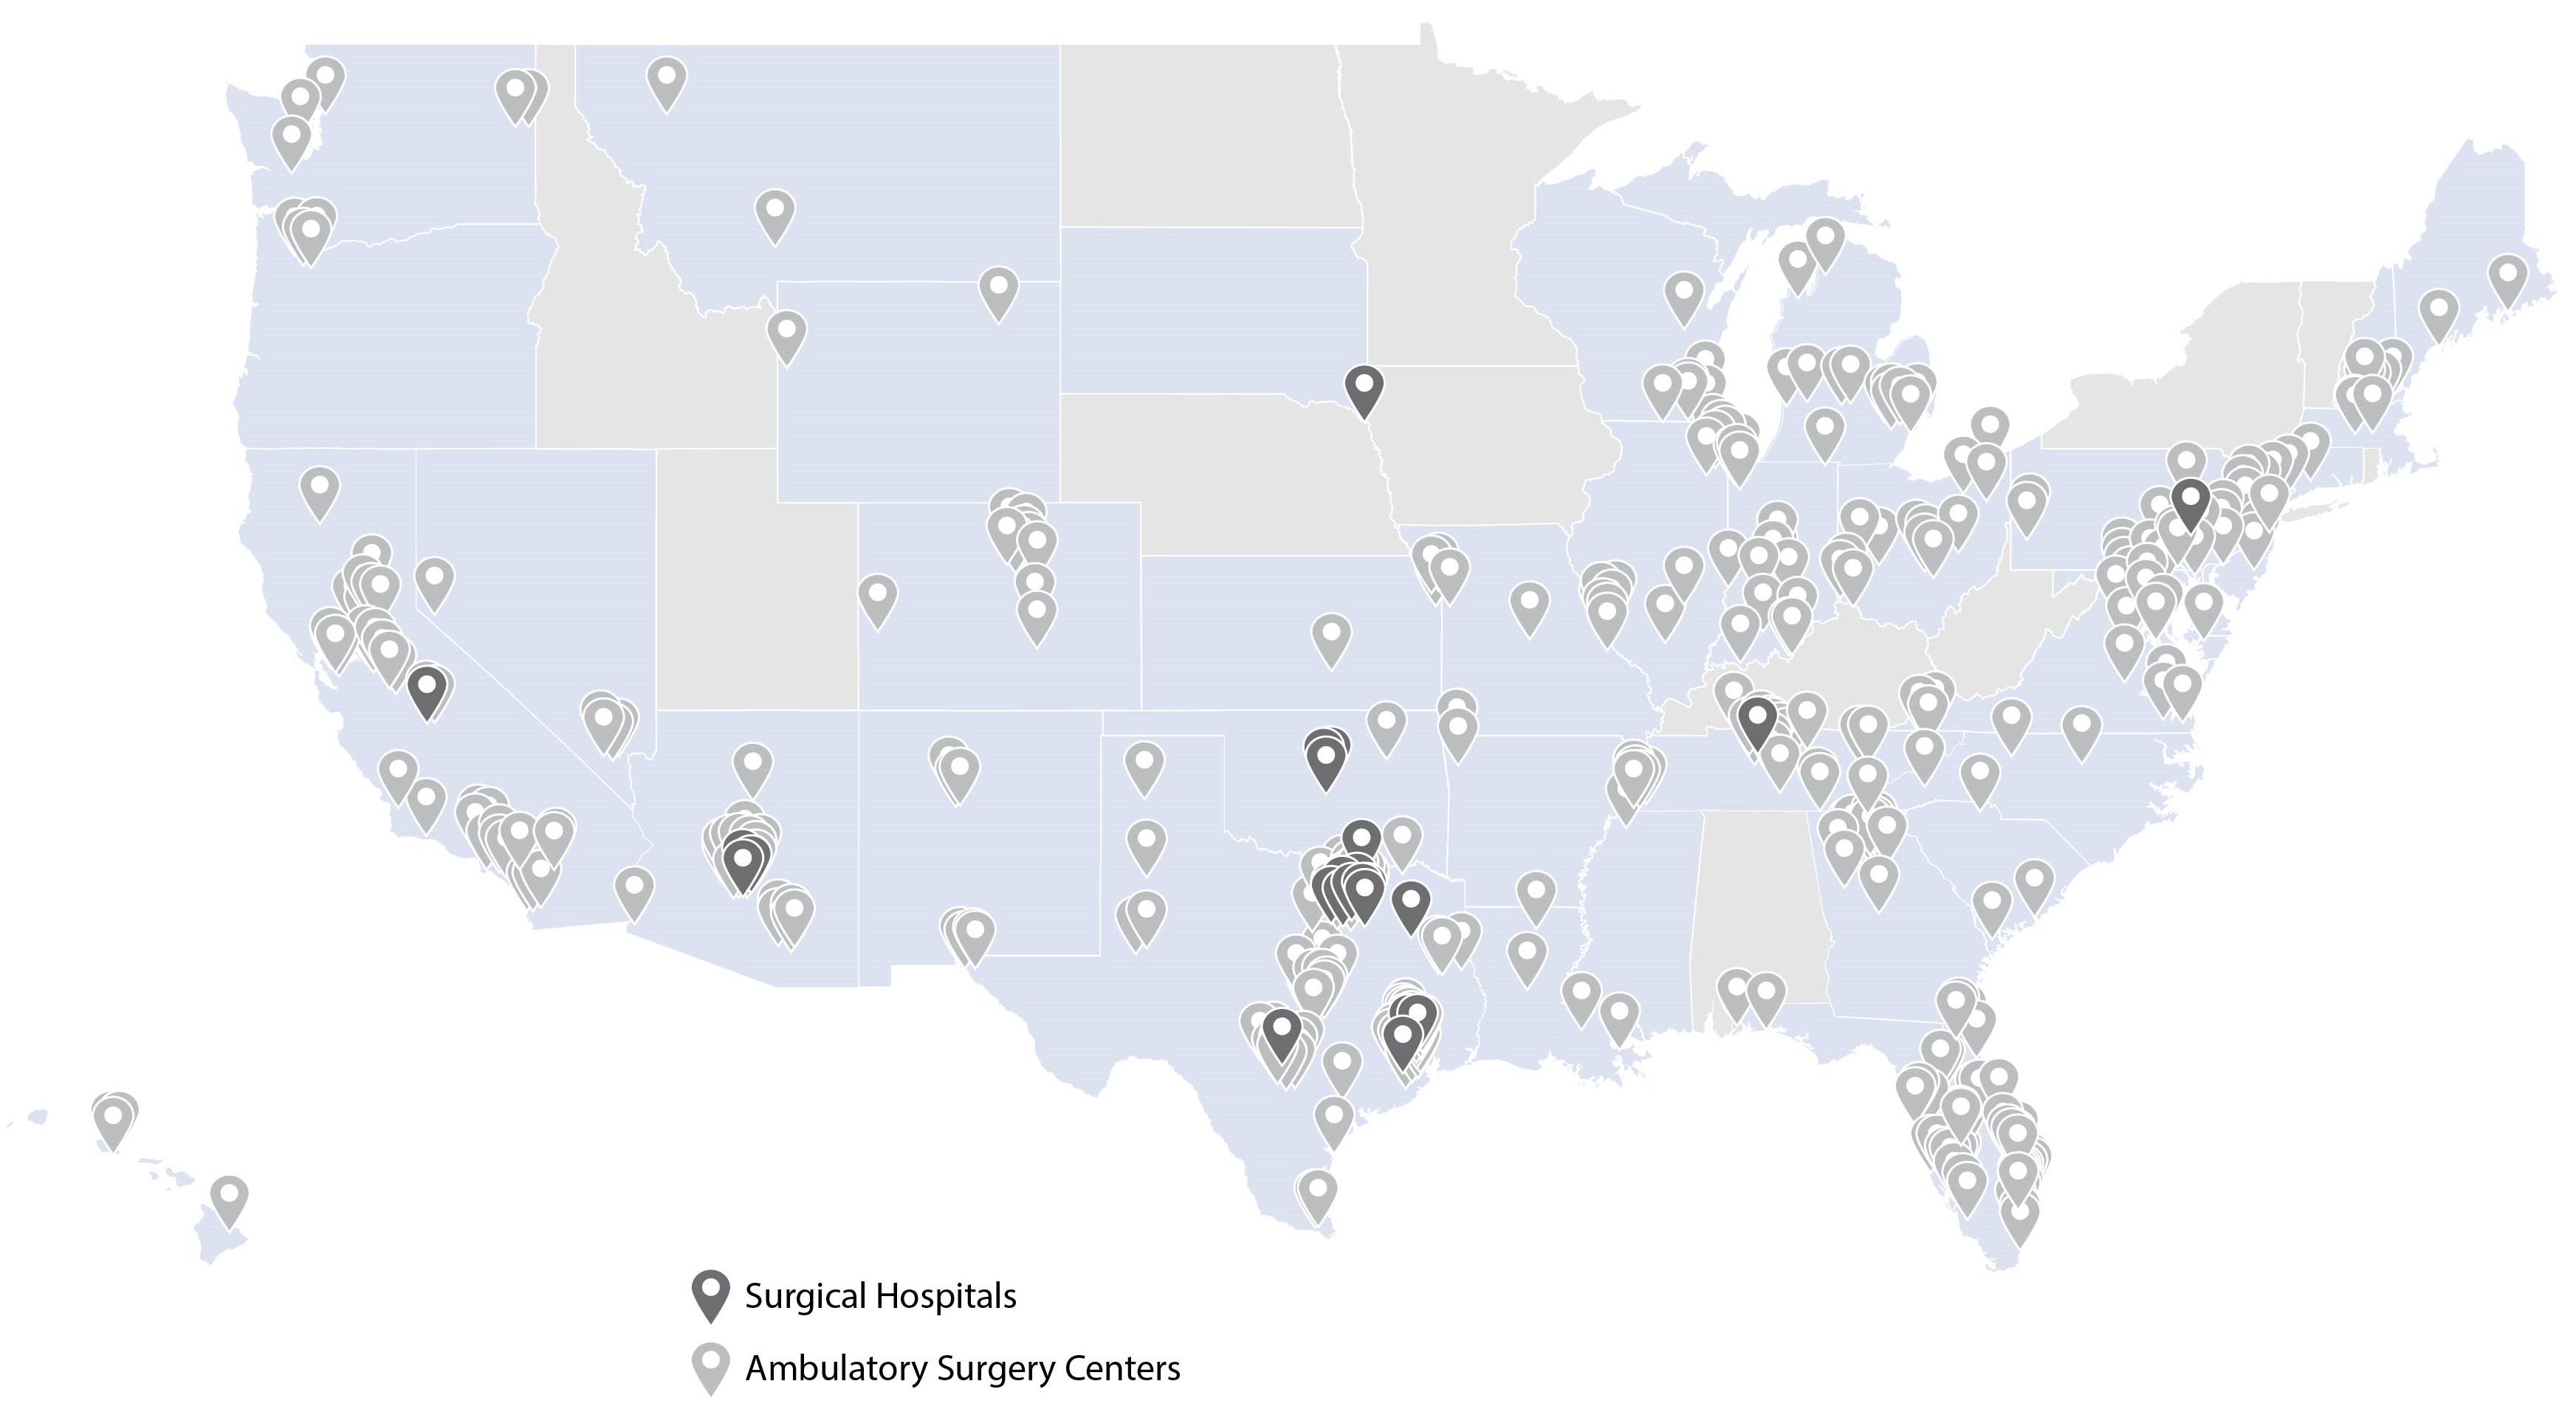
At December 31, 2024, USPI held indirect ownership interests in 518 ASCs and 25 surgical hospitals in 37 states.
USPI’s facilities offer a range of procedures and service lines, including, among other specialties: orthopedics, total joint replacement, and spinal and other musculoskeletal procedures; gastroenterology; pain management; otolaryngology (ear, nose and throat); ophthalmology; and urology.
We believe USPI’s ASCs and surgical hospitals offer many advantages to patients and physicians, including greater affordability, predictability, flexibility and convenience. Moreover, due in part to advancements in surgical techniques, medical technology and anesthesia, as well as the lower cost structure and greater efficiencies that are attainable at a specialized outpatient site, we believe the volume and complexity of surgical cases performed in the outpatient setting will continue to increase over time. For these reasons, we remain focused on opportunities to expand our Ambulatory Care segment through acquisitions, organic growth in physician relationships and service lines, construction of new outpatient centers and strategic partnerships. Detailed information about our Ambulatory Care acquisition and development activity in the year ended December 31, 2024 can be found in MD&A.
Operations of USPI—USPI acquires and develops its facilities primarily through the formation of joint ventures with physicians and/or health system partners. USPI’s subsidiaries hold ownership interests in the facilities directly or indirectly, and we operate the facilities on a day‑to‑day basis through management services contracts. We structure our joint ventures and adopt staffing, scheduling, and clinical systems and protocols with the goals of increasing physician productivity and satisfaction.
REAL PROPERTY
The locations of our acute care and specialty hospitals and the number of licensed beds at each at December 31, 2024 are set forth in the table beginning on page 2. The locations of USPI’s surgical hospitals and ASCs are reflected on the map above. We lease the majority of our outpatient facilities in both our Hospital Operations segment and our Ambulatory Care segment, and our physician practices also lease space in medical office buildings. These leases typically have initial terms ranging from five to 10 years, and most of the leases contain options to extend the lease periods. In addition, our subsidiaries own some medical office buildings located on, or nearby, our hospital campuses. We typically lease our office space under operating lease agreements. Our corporate headquarters are in Dallas, Texas. In addition, we maintain administrative offices in regions where we operate hospitals and other businesses, as well as our GBC
in the Philippines. We believe that all of our properties are suitable for their respective uses and are, in general, adequate for our present needs.
HUMAN CAPITAL RESOURCES
PHYSICIANS
Our operations depend in large part on the number, quality, specialties, and admitting and scheduling practices of the licensed physicians who are members of the medical staffs of our hospitals and other facilities, as well as physicians who affiliate with us and use our facilities as an extension of their practices. Under state laws and other licensing standards, medical staffs are generally self‑governing organizations subject to ultimate oversight by the facility’s local governing board. Members of the medical staffs of our facilities also often serve on the medical staffs of facilities we do not operate, and they are free to terminate their association with our facilities or admit their patients to competing facilities at any time. It is essential to our ongoing business and clinical program development that we attract an appropriate number of quality physicians in the specialties required to support our services and that we maintain good relations with those physicians.
Although we have no contractual relationship with most of the physicians who practice at our hospitals and outpatient centers, at December 31, 2024, we owned over 650 physician practices, and our subsidiaries employed (where permitted by state law) or were otherwise affiliated with nearly 1,135 physicians. Our ability to employ physicians is closely regulated, with a number of states prohibiting the corporate practice of medicine or otherwise regulating what types of entities may employ physicians, and we structure our arrangements with healthcare providers to comply with these state laws.
In 2024, we continued to experience challenges in recruiting and retaining physicians. In some of the regions where we operate, physician recruitment and retention are affected by a shortage of qualified physicians in certain higher-demand clinical service lines and specialties. Moreover, we continue to refine our physician base and provider programs to focus on experienced, high-quality and collaborative specialists.
EMPLOYEES
We believe each employee across our network has a role integral to our mission, which is to provide quality, compassionate care in the communities we serve. At December 31, 2024, we employed approximately 98,000 people (of which approximately 24% were part‑time and on-call employees) in our two reporting segments, as follows:
| | | | | |
| Hospital Operations | 73,000 | |
| Ambulatory Care | 25,000 | |
| |
| Total | 98,000 | |
At December 31, 2024, our overall employee headcount was approximately 8% lower than at December 31, 2023, primarily due to the divestiture of 14 hospitals and related operations during 2024, partially offset by an increase in our Ambulatory Care employees as a result of acquisition and development activity. We had employees in all 50 U.S. states and the District of Columbia, as well as approximately 4,000 GBC employees providing support across our entire network, at December 31, 2024. Approximately 32% of our employees are nurses.
Board Oversight—Our board of directors and its committees oversee human capital matters through regular reports from management and advisors. The board’s human resources committee (“HR Committee”) is responsible for establishing general compensation policies that (1) support our overall business strategies and objectives, (2) enhance our efforts to attract and retain skilled employees, (3) link compensation with our business objectives and organizational performance, and (4) provide competitive compensation opportunities for key executives. The HR Committee also provides, among other things, its perspectives regarding performance management, succession planning, leadership development, equality of opportunity, recruiting, retention and employee training. The board’s environmental, social and governance (“ESG”) committee provides oversight with respect to our ESG strategy and guidance on ESG matters that are relevant to our business.
Human Resources Practices—We have established – and continue to enhance and refine – a comprehensive set of practices for recruiting, managing and optimizing the human resources of our organization. We seek to recruit and retain qualified employees across all demographics; to conduct fair and open competition; and to select and advance employees based on their knowledge, skills, abilities and performance. In many cases, we utilize objective benchmarking and other tools in our efforts in such areas as organizational effectiveness, engagement, voluntary turnover and staffing efficiencies.
Compensation and Benefits—In general, we seek to attract, develop and retain a qualified, diverse, resilient and engaged workforce and to cultivate a performance‑oriented culture that embraces data‑driven decision‑making. To that end, we offer:
•a competitive range of compensation and benefit programs (which vary by location and other factors) designed to reward performance and promote well‑being, including an employee stock purchase plan, a 401(k) plan, health care and insurance benefits, health savings and flexible spending accounts, and paid time off;
•opportunities for continuing education and advancement through a broad range of clinical training and leadership development experiences, including in‑person and online courses and mentoring opportunities;
•a supportive, inclusive and patient‑centered culture aligned with our values and based on respect for others;
•company‑sponsored efforts encouraging and recognizing volunteerism and community service; and
•a code of conduct that promotes integrity, accountability and transparency, among other high ethical standards.
Employee Safety and Welfare—We place a high priority on maintaining a secure and healthy workplace. We promote a culture of well‑being and reporting by connecting employee safety policies with patient safety policies, and we review and refine the policies regularly. At our hospitals, outpatient facilities and other care sites, we align staffing to need in our nursing units, and we invest in appropriate training to improve the competency of our caregivers. In addition, we maintain up‑to‑date infection-prevention protocols and availability of personal protective equipment and disinfection supplies.
We also offer resources to help employees manage challenging circumstances, including a comprehensive employee assistance program comprised of counseling services, financial guidance and legal aid. The Tenet Care Fund (the “Care Fund”) is a 501(c)(3) public charity that provides financial assistance to our employees who have experienced hardship due to, among other things, fires, natural disasters, catastrophic injuries and extended illnesses.
Culture—We continue to focus on fostering an engaging culture through the hiring, advancement and retention of a workforce and leadership teams that represent the communities we serve. We have a Community Healthcare Engagement Council, which consists of leaders representing different facets of our enterprise, to support our efforts in the areas of recruiting, talent development, new‑hire mentoring, community partnerships, and educational opportunities. The Council works to provide tools, guidelines and training with respect to best practices in these areas.
Competition; Staffing and Labor Trends—Our operations are dependent on the availability, efforts, abilities and experience of management and medical support personnel, including nurses, therapists, pharmacists and lab technicians, among others. We compete with other healthcare providers in recruiting and retaining qualified personnel responsible for the operation of our facilities. There is limited availability of experienced medical support personnel nationwide, which drives up the wages and benefits required to recruit and retain employees. In particular, like others in the healthcare industry, we continue to experience shortages of advanced practice providers and critical‑care nurses in certain disciplines and geographic areas. At times, we have to pay premiums above standard compensation for essential workers and rely on higher-cost contract labor, which we compete with other healthcare providers to secure.
We also depend on the general labor pool of available workers in the areas where we operate. In some of our communities, employers across various industries have increased their minimum wage, which has created more competition and, in some cases, higher labor costs for this sector of employees. Furthermore, state-mandated minimum wage increases in California became effective for healthcare workers in October 2024, with further annual increases anticipated through 2028. The current and expected future increases will result in higher compensation costs for certain of our employees and vendors.
As a result of the aforementioned challenges, as well as inflationary pressures, we have been, and we may continue to be, required to enhance wages and benefits to recruit and retain experienced employees, pay premiums above standard compensation for essential workers, or hire more expensive temporary or contract employees, which we also compete with other healthcare providers to secure. We have also made greater investments in education and training for newly licensed medical support personnel. We continue to work within our communities to increase access to healthcare programs and careers, including at our Baptist School of Health Professions in San Antonio and through our nationwide nursing extern and immersion program, which provides students with relevant hands-on training prior to graduation. Through these efforts, we have streamlined onboarding and training time of some of our new nurses, and we have reduced certain of our expenses related to new-hire training.
Union Activity and Labor Relations—At December 31, 2024, approximately 21% of the employees in our Hospital Operations segment were represented by labor unions. None of the employees in our Ambulatory Care segment belong to a
union. Unionized employees – primarily registered nurses and service, technical and maintenance workers – are located at 27 of our hospitals, the majority of which are in California, Florida and Michigan. Organizing activities by labor unions could increase our level of union representation in future periods, which could impact our labor costs.
When we are negotiating collective bargaining agreements with unions (whether such agreements are renewals or first contracts), work stoppages and strikes may be threatened or occur. Although relatively uncommon, extended strikes have had, and could in the future have, an adverse effect on our patient volumes, net operating revenues and labor costs at individual hospitals or in local markets.
Staffing Ratio Requirements—Our acute care hospitals in California are required to maintain minimum nurse‑to‑patient staffing ratios, which impacts our labor costs. Moreover, from time to time, we are required to limit admissions if we do not have the necessary number of nurses available to meet the required ratios, which has a corresponding adverse effect on our revenues.
ESG Report—Additional information on matters relating to human capital resources can be found in our most recent ESG Report, which is available on our website. The information found on our website, including the information in our ESG Reports, is not incorporated by reference into nor part of this or any other report or document we file with or furnish to the U.S. Securities and Exchange Commission (“SEC”).
COMPETITION
We believe our hospitals and outpatient facilities compete within local areas and regions on the basis of many factors, including: quality of care; location and ease of access; the scope and breadth of services offered; reputation; and the caliber of the facilities, equipment and employees. Trends toward clinical and pricing transparency may also impact a healthcare facility’s competitive position in ways that are difficult to predict. In addition, the competitive positions of hospitals and outpatient facilities depend in part on the number, quality, specialties, and admitting and scheduling practices of the licensed physicians who are members of the medical staffs of those facilities, as well as physicians who affiliate with and use outpatient centers as an extension of their practices. Physicians often serve on the medical staffs of more than one facility, and they are typically free to terminate their association with such facilities or admit their patients to competing facilities at any time.
Some competing healthcare facilities are owned by tax‑supported government agencies, and many others are owned by not‑for‑profit organizations that may have financial advantages not available to our facilities, including (1) support through endowments, charitable contributions and tax revenues, (2) access to tax‑exempt financing, (3) exemptions from sales, property and income taxes, and (4) discounted prescription drug pricing. In addition, in certain areas where we operate, large teaching hospitals provide highly specialized facilities, equipment and services that may not be available at most of our hospitals.
The existence or absence of state laws that require findings of need for construction and expansion of healthcare facilities or services (as described in the Healthcare Regulation and Licensing – Certificate of Need Requirements subsection below) may also impact competition. In recent years, the number of freestanding specialty hospitals, surgery centers, EDs, imaging centers and UCCs in the geographic areas where we operate has increased significantly. Some of these facilities are physician‑owned. Moreover, we expect to encounter additional competition from system‑affiliated hospitals and healthcare companies, as well as health insurers and private equity companies seeking to acquire providers, in certain regions in the future.
Another factor in the competitive position of a hospital or outpatient facility is the scope and terms of its relationships with managed care plans. Health maintenance organizations (“HMOs”), preferred provider organizations (“PPOs”), third‑party administrators and other third‑party payers use managed care contracts to encourage patients to use certain facilities in exchange for discounts from the facilities’ established charges. Our ability to enter into, maintain and renew favorable contracts with HMOs, insurers offering preferred provider arrangements and other managed care plans, as well as add new facilities to our existing agreements at contracted rates, significantly affects our revenues and operating results. Generally, we compete for managed care contracts on the basis of price, market reputation, geographic location, quality and range of services, caliber of the medical staff and convenience. Other healthcare providers may affect our ability to enter into acceptable managed care contractual arrangements or negotiate commercial rate increases. For example, some of our competitors may negotiate exclusivity provisions with managed care plans or otherwise restrict the ability of managed care companies to contract with us through the formation of narrow networks or other similar structures. Vertical integration efforts involving third‑party payers and healthcare providers, among other factors, may increase competitive challenges.
Our strategies are designed to help our hospitals and outpatient facilities remain competitive, to attract and retain an appropriate number of physicians of distinction in various specialties, as well as skilled clinical personnel and other healthcare professionals, and to increase patient volumes. To that end, we have made significant investments in equipment, technology,
education and operational strategies designed to improve clinical quality at our facilities. In addition, we continually collaborate with physicians to implement the most current evidence‑based medicine techniques to improve the way we provide care, while using labor management tools and supply‑chain initiatives to reduce variable costs. Moreover, we participate in various value‑based programs to improve quality and cost of care. We believe the use of these practices will promote the most effective and efficient utilization of resources and result in more appropriate lengths of stay, as well as reductions in readmissions for hospitalized patients. In general, we believe that quality of care improvements may have the effects of: (1) reducing costs; (2) increasing payments from Medicare and certain managed care payers for our services; and (3) increasing physician and patient satisfaction, which may improve our volumes. Other competing health systems may implement similar strategies.
In addition, we have significantly increased our focus on operating our outpatient centers with improved accessibility and more convenient service for patients, increased predictability and efficiency for physicians, and (for most services) lower costs for payers and patients than would be incurred with a hospital visit. We believe that emphasis on higher‑demand clinical service lines (including outpatient services), focus on expanding our ambulatory care business, cultivation of our culture of service and participation in Medicare Advantage health plans that have been experiencing higher growth rates than traditional Medicare, among other strategies, will help us address competitive challenges.
We also recognize that our future success depends, in part, on our ability to maintain and renew our existing managed care contracts and enter into new managed care contracts on competitive terms. To bolster our competitive position, we have sought to include all of our hospitals, outpatient centers and physician practices in the related geographic area or nationally when negotiating new managed care contracts, which may result in additional volumes at facilities that were not previously a part of such managed care networks. We also continue to engage in contracting strategies that create shared value with payers and patients.
The market for our revenue cycle management services is also competitive. To be successful, we must respond more quickly and effectively than our competitors to new or changing opportunities, technologies, standards, regulations and client requirements.
HEALTHCARE REGULATION AND LICENSING
OVERVIEW
Like others in the healthcare industry, we are subject to an extensive and complex framework of government regulation at the federal, state and local levels. These legal and regulatory standards relate to, among other topics: ownership and operation of facilities and physician practices; licensure, certification and enrollment in government programs; the necessity and adequacy of medical care; quality of medical equipment and services; relationships with and qualifications of physicians and employees; operating conduct, policies and procedures; screening, stabilization and transfer of individuals who have emergency medical conditions; rate-setting, billing and coding for services; the preparation and filing of cost reports; the handling of overpayments; contractual arrangements; relationships with referral sources and referral recipients; privacy and security; maintenance of adequate records; construction, acquisition, expansion and closure of healthcare facilities or services; environmental protection; compliance with fire prevention and building codes; debt collection; and communications with patients and consumers. In addition, various permits are required to dispense narcotics, operate pharmacies, handle radioactive materials and operate certain equipment. Our facilities are also subject to periodic inspection by governmental and other authorities to determine their compliance with applicable regulations, as well as the standards necessary for licensing and accreditation.
We believe that our healthcare facilities hold all required governmental approvals, licenses and permits material to the operation of their business. Furthermore, we have extensive policies and procedures in place to facilitate compliance with applicable laws, rules and regulations; however, these policies and procedures cannot ensure compliance in every case. Moreover, as discussed in greater detail below, government regulations often change, and we may have to make adjustments to our facilities, equipment, personnel and services to remain in compliance.
The potential consequences for failing to comply with applicable laws, rules and regulations include (1) required refunds of previously received government program payments, (2) the assessment of civil monetary penalties, including treble damages, (3) fines, which could be significant, (4) exclusion from participation in federal healthcare programs and (5) criminal sanctions, including sanctions against current or former employees. Our Medicare and Medicaid payments may be suspended pending even an investigation of what the government determines to be a credible allegation of fraud. Any of the aforementioned consequences could have a material adverse effect on our business, financial condition, results of operations or cash flows.
POTENTIAL CHANGES IN HEALTHCARE POLICY
The Patient Protection and Affordable Care Act, as amended by the Health Care and Education Reconciliation Act of 2010 (the “Affordable Care Act”), extended health coverage to millions of uninsured legal U.S. residents through a combination of private sector health insurance reforms and public program expansion. The expansion of health insurance coverage under the Affordable Care Act resulted in an increase in the number of patients using our facilities with either private or public program coverage and a decrease in uninsured and charity care admissions, along with reductions in Medicare and Medicaid reimbursement to healthcare providers, including us. Of the eight states in which we operate hospitals, four have taken action in accordance with the Affordable Care Act to expand their Medicaid programs; however, over half of our licensed beds at December 31, 2024 were located in four states, namely Florida, South Carolina, Tennessee and Texas, that have not expanded Medicaid under the law.
Over the past several years, various laws and regulations lengthened the enrollment period, expanded income eligibility, and reduced premium caps for subsidies for individuals purchasing Affordable Care Act coverage through state and federal marketplaces – all of which led to increased enrollment numbers, particularly in states that have not expanded Medicaid. Certain of these provisions are set to expire at the end of 2025; if they are not extended, it could result in significant increases in premiums, potentially leading to decreased enrollment and a corresponding rise in the number of uninsured Americans or a shift of individuals from commercial coverage to government program coverage beginning in 2026. We cannot predict whether or how the new Congress may extend or modify provisions of or relating to the Affordable Care Act or other laws affecting the healthcare industry generally, nor can we predict how the new administration will influence, promulgate or implement rules, regulations or executive orders that affect the healthcare industry directly or indirectly. We may also experience potential impacts on our business, in ways we cannot anticipate, from healthcare-related policy changes at the state level. Some federal and state changes, initiatives and requirements could, among other things, negatively impact our patient volumes, case mix and revenue mix, increase our operating costs, adversely affect the reimbursement we receive for our services, impact our competitive position or require us to expend resources to modify certain aspects of our operations.
More specifically, we are also unable to predict the effect of future government healthcare funding policy changes on our business. The Medicare and Medicaid programs are subject to:
•statutory and regulatory changes, administrative and judicial rulings, executive orders, interpretations and determinations concerning eligibility requirements, funding levels and the method of calculating reimbursements, among other things;
•requirements for utilization review; and
•federal and state funding restrictions.
Any of these factors could materially increase or decrease payments from government programs in the future, as well as affect the cost of providing services to our patients and the timing of payments to our facilities. If the rates paid by governmental payers are reduced, if the scope of services covered by governmental payers is limited, if eligibility or enrollment is further restricted, if there are changes to align payment rates for certain procedures across various care settings, or if we or one or more of our hospitals are excluded from participation in the Medicare or Medicaid program or any other government healthcare program, there could be a material adverse effect on our business, financial condition, results of operations or cash flows. Furthermore, we cannot predict the impact healthcare policy risks and uncertainties may have on the trading price of our common stock.
ANTIFRAUD AND ABUSE LAWS
A number of federal statutes, and the regulations implementing them, govern our participation in the Medicare and Medicaid payment programs, including:
•the anti‑kickback and antifraud and abuse amendments codified under Section 1128B(b) of the Social Security Act (the “Anti‑kickback Statute”), which prohibit the knowing and willful remuneration of anything of value intended to induce or reward patient referrals or the generation of business involving any item or service payable by federal healthcare programs, subject to certain government-established “safe harbor” exceptions;
•the False Claims Act (“FCA”), which prohibits the submission of claims for payment to government programs that are known to be, or should be known to be, fraudulent;
•the Stark law, which generally restricts physician referrals of Medicare or Medicaid patients to entities the physician or an immediate family member has a financial relationship with, regardless of any intent to violate the law, unless one of several exceptions applies; and
•the Civil Monetary Penalties Law, which authorizes the Secretary of the U.S. Department of Health and Human Services (“HHS”) to impose civil penalties for various forms of fraud and abuse involving the Medicare and Medicaid programs.
States in which we operate have adopted laws that prohibit payments in exchange for patient referrals, similar to the federal Anti‑kickback Statute, or that otherwise prohibit fraud and abuse activities. Many states have also passed self‑referral legislation similar to the Stark law. Often these state laws are broader in scope in terms of the providers and services regulated, and certain of the laws apply regardless of the source of payment for care. These statutes typically provide for criminal and civil penalties, as well as loss of licensure.
Application to Our Operations—We regularly enter into financial arrangements with physicians and other providers in a manner we believe complies with the Anti‑kickback Statute, the Stark law, and other applicable antifraud and abuse laws. At December 31, 2024, the majority of the surgical hospitals and ASCs in our Ambulatory Care segment were owned by joint ventures with physicians and/or health systems. In addition, we have contracts with physicians and non‑physician referral sources providing for a variety of financial arrangements, including employment agreements, leases and professional service contracts, such as medical director agreements. We also provide financial incentives to recruit physicians to relocate to communities served by our hospitals, including income and collection guarantees and reimbursement of relocation costs.
As described below, the primary focus of our quality, compliance and ethics program is compliance with the requirements of Medicare, Medicaid and other federally funded healthcare programs. However, if our arrangements are found to fail to comply with applicable antifraud and abuse laws, our operations could be adversely affected. In addition, any determination by a federal or state agency or court that we or one of our subsidiaries has violated any of these laws could give certain of our joint venture partners or business process solutions clients a right to terminate their relationships with us. Moreover, any violations by and resulting penalties or exclusions imposed upon USPI’s joint venture partners could adversely affect their financial condition and, in turn, have a material adverse effect on our business and results of operations.
Government Enforcement Efforts and Qui Tam Lawsuits—The healthcare industry is subject to heightened and coordinated civil and criminal enforcement efforts from both federal and state government agencies. The U.S. Office of Inspector General, which is an independent and objective oversight unit of HHS, conducts audits, evaluations and investigations relating to HHS programs and operations and, when appropriate, imposes civil monetary penalties, assessments and administrative sanctions.
Healthcare providers are also subject to qui tam or “whistleblower” lawsuits under the FCA, which allows private individuals to bring actions on behalf of the government, alleging that a hospital or healthcare provider has defrauded a government program, such as Medicare or Medicaid. If the government intervenes in the action and prevails, the defendant may be required to pay three times the damages sustained by the government, plus mandatory civil penalties for each false claim submitted to the government. As part of the resolution of a qui tam case, the qui tam plaintiff may share in a portion of any settlement or judgment. If the government does not intervene in the action, the qui tam plaintiff may continue to pursue the action independently. Qui tam actions can also be filed under certain state false claims laws if the fraud involves Medicaid funds or funding from state and local agencies.
We have paid significant amounts to resolve government investigations and qui tam matters brought against us in the past, and we are unable to predict the impact of any future actions on our business, financial condition, results of operations or cash flows.
HEALTH INSURANCE PORTABILITY AND ACCOUNTABILITY ACT
The Health Insurance Portability and Accountability Act of 1996 (“HIPAA”) requires administrative, physical and technical safeguards to protect the confidentiality, integrity and availability of protected health information (“PHI”) and sets forth the rights of patients to understand and control how their information is used and disclosed. We have developed an expansive set of policies and procedures in our efforts to comply with HIPAA, and similar state privacy laws, under the guidance of our ethics and compliance department. Our compliance officers and information security officers are responsible for implementing and monitoring enterprise‑wide compliance with our HIPAA privacy and security policies and procedures. We have also created an internal web‑based HIPAA training program, which is mandatory for all employees.
Under HIPAA, we are required to report breaches of unsecured PHI to affected individuals without unreasonable delay, but not longer than 60 days following discovery of the breach. We are also required to notify HHS and, in certain situations involving large breaches, the media. All non-permitted uses or disclosures of unsecured PHI are presumed to be breaches unless it can be established that there is a low probability the information has been compromised. Various state laws
and regulations may also require us to notify the applicable state agency and affected individuals in the event of a data breach involving personally identifiable information (“PII”).
Violations of the HIPAA privacy and security regulations may result in criminal penalties and in substantial civil penalties per violation. In addition to enforcement by HHS, state attorneys general are authorized to bring civil actions seeking either injunction or damages in response to violations of HIPAA privacy and security regulations that threaten the privacy of state residents. HHS may resolve HIPAA violations through informal means, such as allowing a company to implement a corrective action plan, but HHS has the discretion to move directly to impose monetary penalties and is required to impose penalties for violations resulting from willful neglect. We are also subject to any federal or state privacy-related laws that are more restrictive than the privacy regulations issued under HIPAA. These laws vary and could impose additional penalties and subject us to additional privacy and security restrictions. In addition, various states have enacted, and other states are considering, new laws and regulations concerning the privacy and security of consumer and other personal information. To the extent we are subject to such requirements, these laws and regulations often have far-reaching effects, are subject to amendments, changing requirements and updates to regulators’ enforcement priorities, may require us to modify our data processing practices and policies, may require us to incur substantial costs and expenses to comply, and may subject our business to a risk of increased potential liability. These laws and regulations often provide for civil penalties for violations, as well as a private right of action for data breaches, which may increase the likelihood or impact of data breach litigation.
UTILIZATION REVIEW COMPLIANCE AND HOSPITAL GOVERNANCE
The Social Security Act and Medicare regulations generally require that services that may be paid for under the Medicare program or state healthcare programs are (1) provided economically and only when, and to the extent, they are medically reasonable and necessary, (2) of a quality that meets professionally recognized standards of healthcare, and (3) supported by appropriate evidence of medical necessity and quality. The Quality Improvement Organization program established under the Social Security Act seeks: to improve the effectiveness, efficiency, economy and quality of services delivered to Medicare beneficiaries; to use data to track healthcare quality improvements at the local level; to preserve the Medicare Trust Fund by ensuring that Medicare pays only for services that are reasonable and necessary and that are provided in the most appropriate setting; and to protect Medicare beneficiaries by expeditiously addressing complaints, violations under the Emergency Medical Treatment and Active Labor Act, and other quality‑related issues.
Medical and surgical services and practices are extensively supervised by committees of staff physicians at each of our healthcare facilities, are overseen by each facility’s local governing board, the members of which primarily are community members and physicians, and are reviewed by our clinical quality personnel. The local governing board also helps maintain standards for quality care, develop short‑term and long‑range plans, and establish, review and enforce practices and procedures, as well as approves the credentials, disciplining and, if necessary, the termination of privileges of medical staff members.
CERTIFICATE OF NEED REQUIREMENTS
Some states require state approval for construction, acquisition and closure of healthcare facilities, including findings of need for additional or expanded healthcare facilities or services. Certificates or determinations of need, which are issued by governmental agencies with jurisdiction over healthcare facilities, are at times required for capital expenditures exceeding a prescribed amount, changes in bed capacity or services, and certain other matters. Approximately 27% of our licensed hospital beds are located in four states (namely, Massachusetts, Michigan, South Carolina and Tennessee) that currently require a form of state approval under certificate of need programs applicable to acute care hospitals. (In 2023, South Carolina enacted a law that sunsets its hospital certificate of need program effective January 1, 2027.) Certificate of need programs apply to ASCs in 10 states where we have such facilities.
Failure to obtain necessary state approval can result in the inability to expand facilities, add services, acquire a facility or change ownership. Further, violation of such laws may result in the imposition of civil sanctions or the revocation of a facility’s license. We are unable to predict whether we will be required or able to obtain any additional certificates of need in any jurisdiction where they are required, or if any jurisdiction will eliminate or alter its certificate of need requirements in a manner that will increase competition and, thereby, affect our competitive position. In those states that do not have certificate of need requirements or that do not require review of healthcare capital expenditure amounts below a relatively high threshold, competition in the form of new services, facilities and capital spending may be more prevalent.
ENVIRONMENTAL MATTERS
Our healthcare operations are subject to a number of federal, state and local environmental laws, rules and regulations that govern, among other things, our disposal of solid waste, as well as our use, storage, transportation and disposal of hazardous and toxic materials (including radiological materials). Our operations also generate medical waste that must be
discarded in compliance with statutes and regulations that vary from state to state. In addition, our operating expenses could be adversely affected if legal and regulatory developments related to climate change or other initiatives result in increased energy or other costs. Moreover, we could be affected by climate change and other environmental issues to the extent such issues adversely affect the general economy or result in severe weather or natural disasters affecting the communities in which our facilities are located. At this time, we do not believe that the costs of complying with environmental laws, including regulations relating to climate change issues, will have a material adverse effect on our future capital expenditures, results of operations or cash flows. There were no material capital expenditures for environmental matters in the year ended December 31, 2024.
ANTITRUST LAWS
The federal government and most states have enacted antitrust laws that prohibit specific types of anti‑competitive conduct, including price fixing, wage fixing, anticompetitive hiring practices, restrictive covenants, concerted refusals to deal, price discrimination and tying arrangements, as well as monopolization and acquisitions of competitors that have, or may have, a substantial adverse effect on competition. Violations of federal or state antitrust laws can result in various sanctions, including criminal and civil penalties.
Antitrust enforcement in the healthcare industry is a priority of the U.S. Federal Trade Commission (“FTC”) and analogous state regulatory agencies. In recent years, the FTC has filed multiple administrative complaints and public comments challenging hospital and other healthcare transactions in several states. The FTC has focused its enforcement efforts on preventing hospital transactions that may, in the government’s view, leave insufficient local options for patient services, which could result in higher costs to consumers. In addition, the FTC has given increased attention to the effect of combinations involving other healthcare providers, including physician practices, as well as to the use of restrictive covenants that limit the ability of owners, employees and others to engage in certain competitive activities. The FTC has also entered into numerous consent decrees in the past several years settling allegations of price‑fixing among providers. Moreover, a number of states, including California and Massachusetts, have enacted antitrust laws requiring state agency notification and review of proposed healthcare industry transactions that are below federal reporting thresholds. We cannot predict the impact of these laws on our ability to complete transactions in the related states.
LAWS AND REGULATIONS AFFECTING REVENUE CYCLE MANAGEMENT SERVICES
Conifer is subject to civil and criminal statutes and regulations governing consumer finance, medical billing, coding, collections and other operations. In connection with these laws and regulations, Conifer has been and may continue to be party to various lawsuits, claims, and federal and state regulatory investigations from time to time. Some of these actions may involve large demands, as well as substantial defense costs. We cannot predict the outcome of current or future legal actions against Conifer or the effect that judgments, penalties or settlements in such matters may have.
The federal Fair Debt Collection Practices Act (“FDCPA”) regulates persons who regularly collect or attempt to collect, directly or indirectly, consumer debts owed or asserted to be owed to another person. Certain of the accounts receivable handled by Conifer’s third‑party debt collection vendors are subject to the FDCPA, which establishes specific guidelines and procedures that debt collectors must follow in communicating with consumer debtors, including the time, place and manner of such communications. We audit and monitor our vendors for compliance, but there can be no assurance that such audits and monitoring will detect all instances of potential non‑compliance.
Many states also regulate the billing and collection practices of creditors who collect their own debt, as well as the companies a creditor engages to bill and collect from consumers on the creditor’s behalf. These state regulations may be more stringent than the FDCPA. In addition, state regulations may be specific to medical billing and collections or the same or similar to state regulations applicable to third‑party collectors. Certain of the accounts receivable Conifer or its billing, servicing and collections subsidiary, PSS Patient Solution Services, LLC, manages for its clients are subject to these state regulations.
Conifer is also subject to laws under which both federal and state regulatory agencies have the authority to investigate consumer complaints relating to unfair, deceptive and abusive acts and practices, as well as a variety of consumer protection laws, including but not limited to the Telephone Consumer Protection Act and all applicable state equivalents. These agencies may initiate enforcement actions, including actions to seek restitution and monetary penalties from, or to require changes in business practices of, regulated entities. In addition, affected consumers may bring lawsuits, including class action suits, to seek monetary remedies (including statutory damages) for violations of the federal and state provisions discussed above.
LAWS, REGULATIONS AND OTHER MATTERS AFFECTING OUR GBC
Our GBC operations in the Philippines are subject to certain U.S. healthcare industry-specific requirements, as well as U.S. and foreign laws applicable to businesses generally, including anti-corruption laws. One such law, the Foreign Corrupt
Practices Act (“FCPA”), regulates U.S. companies in their dealings with foreign officials, prohibiting bribes and similar practices, and requires that they maintain records that fairly and accurately reflect transactions and appropriate internal accounting controls. FCPA enforcement actions continue to be a high priority for the SEC and the U.S. Department of Justice. Our failure to comply with the FCPA could result in the imposition of fines and other civil and criminal penalties, which could be significant. Moreover, our offshore operations could expose us to foreign political and economic instability, compliance and regulatory challenges, and natural disasters not typically experienced in the United States, such as volcanic activity and tsunamis.
COMPLIANCE AND ETHICS
General—Our ethics and compliance department maintains our values‑based ethics and compliance program, which is designed to: (1) help staff in our corporate and USPI offices, hospitals, outpatient centers and physician practices meet or exceed applicable standards established by federal and state statutes and regulations, as well as industry practice; (2) monitor and raise awareness of ethical issues among employees and others, and stress the importance of understanding and complying with our Code of Conduct; and (3) provide a channel for employees to make confidential ethics and compliance‑related reports, anonymously if they choose. The ethics and compliance department operates independently – it has its own operating budget; it has the authority to hire outside counsel, access any company document and interview any of our personnel; and our chief compliance officer reports directly to our chief executive officer, as well as to the quality, compliance and ethics committee of our board of directors.
Program Charter—Our Quality, Compliance and Ethics Program Charter is the governing document for our ethics and compliance program. Our adherence to the charter is intended to:
•support and maintain our present and future responsibilities with regard to participation in federal healthcare programs; and
•further our goals of operating an organization that (1) fosters and maintains the highest ethical standards among all employees, officers and directors, physicians practicing at our facilities, and contractors that furnish healthcare items or services, (2) values compliance with all state and federal statutes and regulations as a foundation of its corporate philosophy, and (3) aligns its behaviors and decisions with Tenet’s core values.
The primary focus of our quality, compliance and ethics program is compliance with the requirements of Medicare, Medicaid and other federally funded healthcare programs. Pursuant to the terms of the charter, our ethics and compliance department is responsible for, among other things, the following activities: (1) assessing, critiquing, and (as appropriate) drafting and distributing company policies and procedures; (2) developing, providing, and tracking ethics and compliance training and other training programs, including job‑specific training to those who work in clinical quality, coding, billing, cost reporting and referral source arrangements, in collaboration with the respective department responsible for oversight of each of these areas; (3) creating and disseminating our Code of Conduct and obtaining certifications of adherence to the Code of Conduct as a condition of employment; (4) maintaining and promoting our Ethics Action Line, a 24‑hour, toll‑free hotline that allows for confidential reporting of issues on an anonymous basis and emphasizes our no‑retaliation policy; and (5) responding to and resolving all compliance‑related issues that arise from the Ethics Action Line and compliance reports received from facilities and compliance officers (utilizing any compliance reporting software that we may employ for this purpose) or any other source that results in a report to the ethics and compliance department.
Code of Conduct—All of our employees and officers, including our chief executive officer, chief financial officer and principal accounting officer, are required to abide by our Code of Conduct to advance our mission that our business be conducted in a legal and ethical manner. The members of our board of directors and all of our contractors having functional roles similar to our employees are also required to abide by our Code of Conduct. The standards therein reflect our basic values and form the foundation of a comprehensive process that includes compliance with all corporate policies, procedures and practices. Our Code of Conduct covers such areas as quality patient care, compliance with all applicable statutes and regulations, appropriate use of our assets, protection of patient information and avoidance of conflicts of interest.
As part of the program, we provide compliance training at least annually to every employee and officer, as well as our board of directors and certain physicians and contractors. All such persons are required to report incidents that they believe in good faith may be in violation of the Code of Conduct or our policies, and all are encouraged to contact our Ethics Action Line when they have questions about any aspect of our Code of Conduct or any ethics concerns. All reports to the Ethics Action Line are kept confidential to the extent allowed by law, and any individual who makes a report has the option to remain anonymous. Incidents of alleged financial improprieties reported to the Ethics Action Line or the ethics and compliance department are communicated to the audit committee of our board of directors. Reported cases that involve a possible violation of the law or regulatory policies and procedures are referred to the ethics and compliance department for investigation, although certain matters may be referred to the law or human resources department. Retaliation against anyone in connection with reporting
ethical concerns is considered a serious violation of our Code of Conduct, and, if it occurs, it will result in discipline, up to and including termination of employment.
Availability of Documents—The full text of our Quality, Compliance and Ethics Program Charter, our Code of Conduct, and a number of our ethics and compliance policies and procedures are published on our website, at www.tenethealth.com, under the “Our Commitment to Compliance” caption in the “About” section. Amendments to the Code of Conduct and any grant of a waiver from a provision of the Code of Conduct requiring disclosure under applicable SEC rules will be disclosed at the same location as the Code of Conduct on our website.
INSURANCE
We maintain captive insurance companies to self‑insure for the majority of our professional and general liability claims, and we purchase insurance from third parties to cover catastrophic claims. Commercial insurance we purchase is subject to per‑claim and policy period aggregate limits. If the policy period aggregate limit of any of these policies is exhausted, in whole or in part, it could deplete or reduce the limits available to pay other material claims applicable to that policy period. Any losses not covered by or in excess of the amounts maintained under our professional and general liability insurance policies will be funded from our working capital or other sources of liquidity.
In addition to the reserves recorded by our captive insurance subsidiaries, we maintain reserves, including reserves for incurred but not reported claims, for our self‑insured professional liability retentions and claims in excess of the policies’ aggregate limits, based on modeled estimates of losses and related expenses. We provide standby letters of credit to some of our insurers, which can be drawn upon under certain circumstances, to collateralize the deductible and self‑insured retentions under a select number of our professional and general liability insurance programs.
We also purchase property, business interruption, cyber-liability and other insurance coverage from third parties. Our commercial insurance does not cover all claims against us and may not offset the financial impact of a material loss event. The rise in the number and severity of hurricanes, wildfires, tornadoes and other events has led to higher insurance premiums and reductions in coverage for property owners. Commercial insurance may not continue to be available at a reasonable cost for us to maintain at adequate levels in the future. In addition, our insurance against cybersecurity risks and cyber-attacks may not provide the coverage we anticipate or offset the financial impact of a material loss event. Moreover, the occurrence of cybersecurity incidents and the continued and elevated risk of attacks (including ransomware), system and data breaches, and other disruptions to information technology systems in the current environment has caused increases in our cyber insurance premiums and lower coverage limits. For further information regarding our insurance coverage, see Note 16 to our Consolidated Financial Statements.
COMPANY INFORMATION
We file annual, quarterly and current reports, proxy statements and other documents with the SEC under the Securities Exchange Act of 1934, as amended (the “Exchange Act”). Our reports, proxy statements and other documents filed electronically with the SEC are available at the website maintained by the SEC at www.sec.gov.
Our website, www.tenethealth.com, also offers, free of charge, access to our annual, quarterly and current reports (and amendments to such reports), and other filings made with, or furnished to, the SEC as soon as reasonably practicable after such documents are submitted to the SEC. The information found on our website is not incorporated by reference into nor part of this or any other report or document we file with or furnish to the SEC.
FORWARD-LOOKING STATEMENTS
This report includes “forward‑looking statements” within the meaning of Section 27A of the Securities Act of 1933 and Section 21E of the Exchange Act, each as amended. All statements, other than statements of historical or present facts, that address activities, events, outcomes, business strategies and other matters that we plan, expect, intend, assume, believe, budget, predict, forecast, project, target, estimate or anticipate (and other similar expressions) will, should or may occur in the future are forward‑looking statements, including (but not limited to) disclosures regarding (1) our future earnings, financial position, and operational and strategic initiatives, (2) developments in the healthcare industry, and (3) the anticipated impacts of economic and public health conditions on our business. Forward‑looking statements represent management’s expectations, based on currently available information, as to the outcome and timing of future events, but, by their nature, address matters that are indeterminate. They involve known and unknown risks, uncertainties and other factors, many of which we are unable to predict
or control, that may cause our actual results, performance or achievements to be materially different from those expressed or implied by forward‑looking statements. Such factors include, but are not limited to, the following:
•Our ability to enter into or renew managed care provider arrangements on acceptable terms; changes in service mix, revenue mix and surgical volumes, including potential declines in the population covered under managed care agreements; and the impact of alternative payment models and value-based purchasing initiatives;
•The impacts on our business from the enactment, amendment or expiration of statutes and regulations affecting the healthcare industry, and potential reductions to Medicare and Medicaid payment rates, changes in reimbursement practices or funding levels, or modification of Medicaid supplemental payment programs;
•Our success in recruiting and retaining physicians, nurses and other healthcare professionals;
•The effect of competition generally, and clinical and price transparency regulations, on our business;
•The timing, outcome and impact of: government investigations and litigation; changes in federal tax laws, regulations and policies (including those related to tariffs and trade restrictions); and future tax audits, disputes and litigation associated with our tax positions;
•The potential emergence and effects of a future pandemic, epidemic or outbreak of an infectious disease on our operations, financial condition and liquidity;
•Security threats, catastrophic events and other disruptions that affect our information technology and related information systems and confidential business data;
•Our ability to achieve operating and financial targets, attain expected levels of patient volumes, and identify and execute on measures designed to save or control costs or streamline operations;
•Operational and other risks associated with acquisitions, divestitures and joint venture arrangements, including the integration of newly acquired businesses and the risk that transactions may not receive necessary government clearances;
•The impact of our indebtedness; the availability and terms of capital, if needed, to refinance existing debt, fund our operations and expand our business; and our ability to comply with our debt covenants and effectively manage our capital structure and leverage ratio;
•The effect that inflation, consumer behavior and other economic factors have on our volumes and our ability to collect outstanding receivables on a timely basis, among other things; and increases in the number of uninsured accounts, as well as deductibles, co‑insurance amounts and co‑pays for insured accounts; and
•Other factors and risks referenced in this report and our other public filings.
When considering forward‑looking statements, you should keep in mind the risk factors and other cautionary statements in this report. Should one or more of the risks and uncertainties described in this report occur, or should underlying assumptions prove incorrect, our actual results and plans could differ materially from those expressed in any forward‑looking statement. We specifically disclaim any obligation to update any information contained in a forward‑looking statement or any forward‑looking statement in its entirety, except as required by law.
All forward‑looking statements attributable to us are expressly qualified in their entirety by this cautionary information.
ITEM 1A. RISK FACTORS
Our business is subject to a number of risks and uncertainties, many of which are beyond our control, that may cause our actual operating results or financial performance to be materially different from our expectations and make an investment in our securities risky. If one or more of the events discussed in this report were to occur, actual outcomes could differ materially from those expressed in or implied by any forward‑looking statements we make in this report or our other filings with the SEC, and our business, financial condition, results of operations or liquidity could be materially adversely affected; furthermore, the trading price of our common stock could decline and our shareholders could lose all or part of their investment. Additional risks and uncertainties not presently known, or currently deemed immaterial, may also constrain our business and operations.
Risks Related to Our Overall Operations
If we are unable to enter into, maintain and renew managed care contractual arrangements on competitive terms, if we experience material reductions in the contracted rates we receive from managed care payers or if we have difficulty collecting from managed care payers, our results of operations could be adversely affected.
Our ability to enter into, maintain and renew favorable contracts with HMOs, insurers offering preferred provider arrangements and other managed care plans, as well as add new facilities to our existing agreements at contracted rates, significantly affects our revenues and operating results. For the year ended December 31, 2024, approximately 70%, or $9.809 billion, of our net patient service revenues for the hospitals and related outpatient facilities in our Hospital Operations segment was attributable to managed care payers, including Medicare and Medicaid managed care programs. Moreover, in 2024, our commercial managed care net inpatient revenue per admission from the hospitals in our Hospital Operations segment was approximately 67% higher than our aggregate yield on a per‑admission basis from government payers, including Medicare and Medicaid managed care programs.
The ongoing trend toward consolidation among non‑government payers tends to increase their bargaining power over contract terms. Generally, we compete for these contracts on the basis of price, market reputation, geographic location, quality and range of services, caliber of the medical staff and convenience. Our contracts with managed care payers require us to comply with a number of terms related to the provision of and billing for services. If we are unable to negotiate increased reimbursement rates, maintain existing rates or other favorable contract terms, effectively respond to managed care payer cost controls and reimbursement policies, or comply with the terms of our contracts, the payments we receive for our services may be reduced. Also, we are increasingly experiencing payment denials from and other administrative challenges with managed care payers, both prospectively and retroactively.
We currently have thousands of managed care contracts with various HMOs and PPOs; however, our top 10 managed care payers generated 71% of our managed care net patient service revenues for the year ended December 31, 2024. Because of this concentration, we may experience a short‑ or long‑term adverse effect on our net operating revenues if we cannot renew, replace or otherwise mitigate the impact of expired contracts with significant payers. Furthermore, material payment delays and disputes between us and significant managed care payers could have a material adverse effect on our financial condition, results of operations or cash flows. At December 31, 2024, 68% of our Hospital Operations segment’s net accounts receivable was due from managed care payers.
In addition, managed care payers continue to seek to control healthcare costs by encouraging patients to use certain facilities in exchange for discounts from the facilities’ established charges, and through increased utilization reviews and greater enrollment in HMOs and PPOs. Any negotiated discount programs we agree to generally limit our ability to increase reimbursement rates to offset increasing costs. In addition, enrollment of individuals in high-deductible health plans has increased over the last decade. In comparison to traditional health plans, these plans have higher co-pays and deductibles due from patients, which subjects us to increased collection risk.
Our relationships with payers, and reimbursement for the care we provide, may be further impacted by clinical and price transparency initiatives and out‑of‑network billing restrictions, including those in the No Surprises Act. In general, any material reductions in the contracted or out-of-network rates we receive for our services or any significant difficulties in collecting receivables from managed care payers could have a material adverse effect on our financial condition, results of operations or cash flows.
Changes in healthcare laws, regulations and policies could have an adverse effect on our business.
Over the past several years, various laws and regulations lengthened the enrollment period, expanded income eligibility, and reduced premium caps for subsidies for individuals purchasing Affordable Care Act coverage through state and federal marketplaces. Certain of these provisions are set to expire at the end of 2025; if they are not extended, it could result in significant increases in premiums, potentially leading to decreased enrollment and a corresponding rise in the uninsured or a shift of individuals from commercial coverage to government program coverage beginning in 2026. In such a case, we could experience decreased patient volumes, reduced revenues and an increase in uncompensated care, which would adversely affect our results of operations and cash flows. We cannot predict whether or how the new Congress may extend or modify provisions of or relating to the Affordable Care Act or other laws affecting the healthcare industry generally, nor can we predict how the new administration will influence, promulgate or implement rules, regulations or executive orders that affect the healthcare industry directly or indirectly. We may also experience potential impacts on our business, in ways we cannot anticipate, from healthcare-related policy changes at the state level. Some federal and state changes, initiatives and requirements could, among other things, negatively impact our patient volumes, case mix and revenue mix, increase our operating costs, adversely affect the reimbursement we receive for our services, impact our competitive position or require us to expend resources to modify
certain aspects of our operations, any of which could have an adverse effect on our financial condition, results of operations or cash flows. Furthermore, we cannot predict the impact healthcare policy risks and uncertainties may have on the trading price of our common stock.
Changes to the Medicare and Medicaid programs or other government healthcare programs, including reductions in scale and scope, could have a material adverse effect on our business.
We are unable to predict the effect of future government healthcare funding policy changes on our business. If the rates paid by governmental payers are reduced, if the scope of services covered by governmental payers is limited, if eligibility or enrollment is further restricted, if there are changes to align payment rates for certain procedures across various care settings, or if we or one or more of our hospitals are excluded from participation in the Medicare or Medicaid program or any other government healthcare program, there could be a material adverse effect on our business, financial condition, results of operations or cash flows.
For the year ended December 31, 2024, approximately 15% and 10% of our net patient service revenues for the hospitals and related outpatient facilities in our Hospital Operations segment were from the Medicare program and various state Medicaid programs, respectively, in each case excluding Medicare and Medicaid managed care programs. The Medicare and Medicaid programs are subject to:
•statutory and regulatory changes, administrative and judicial rulings, executive orders, interpretations and determinations concerning eligibility requirements, funding levels and the method of calculating reimbursements, among other things;
•requirements for utilization review; and
•federal and state funding restrictions.
Any of these factors could materially increase or decrease payments from these government programs in the future, as well as affect the cost of providing services to our patients and the timing of payments to our facilities, which could in turn adversely affect our overall business, financial condition, results of operations or cash flows.
Several states in which we operate continue to face budgetary challenges that have resulted in reduced Medicaid funding levels to hospitals and other providers. Because most states must operate with balanced budgets, and the Medicaid program is generally a significant portion of a state’s budget, states can be expected to adopt or consider adopting future legislation designed to reduce or not increase their Medicaid expenditures. In addition, some states delay issuing Medicaid payments to providers to manage state expenditures. As an alternative means of funding provider payments, many of the states where we operate have adopted supplemental payment programs authorized under the Social Security Act. Continuing pressure on state budgets and other factors, including legislative and regulatory changes, could result in future reductions to Medicaid payments, payment delays or changes to Medicaid supplemental payment programs that could negatively impact our financial condition, results of operations or cash flows. Federal government denials or delayed approvals of waiver applications or extension requests by the states where we operate could also materially impact our Medicaid funding levels.
Because we cannot predict what actions the federal government or the states may take under existing or future legislation and/or regulatory changes to address budget gaps, deficits, Medicaid expansion, Medicaid eligibility redeterminations, provider fee programs, state‑directed payment programs or Medicaid Section 1115 waivers, we are unable to assess the effect that any such legislation or regulatory action might have on our business; however, the overall adverse impact on our future financial position, results of operations or cash flows could be material.
It is essential to our ongoing business that we attract an appropriate number of quality physicians in the specialties required to support our services and that we maintain good relations with those physicians.
The success of our business and clinical program development depends in large part on the number, quality, specialties, and admitting and scheduling practices of the licensed physicians who are members of the medical staffs of our hospitals and other facilities, as well as physicians who affiliate with us and use our facilities as an extension of their practices. Physicians are often not employees of the hospitals or surgery centers at which they practice. Members of the medical staffs of our facilities also often serve on the medical staffs of facilities we do not operate, and they are free to terminate their association with our facilities or admit their patients to competing facilities at any time. In addition, although physicians who own interests in our facilities are generally subject to agreements restricting them from owning an interest in competing facilities, we may not learn of, or may be unsuccessful in preventing, our physician partners from acquiring interests in such facilities.
We compete with system‑affiliated hospitals and healthcare companies, as well as health insurers and private equity companies, in recruiting physicians, acquiring physician practices and, where permitted by law, employing physicians. In 2024,
we continued to experience challenges in recruiting and retaining physicians. In some of the regions where we operate, physician recruitment and retention are affected by a shortage of qualified physicians in certain higher-demand clinical service lines and specialties. Furthermore, our ability to recruit and employ physicians is closely regulated. For example, the types, amount and duration of compensation and assistance we can provide to recruited physicians are limited by the federal Anti‑kickback Statute and Stark law, as well as other applicable antifraud and abuse laws and regulations. All arrangements with physicians must also be fair market value and commercially reasonable. If we are unable to attract and retain sufficient numbers of quality physicians by providing adequate support personnel, technologically advanced equipment, and facilities that meet the needs of those physicians and their patients, physicians may choose not to refer patients to our facilities, admissions and outpatient visits may decrease, and our operating performance may decline.
Our labor costs have been, and may continue to be, adversely affected by competition for staffing, the shortage of experienced nurses and other healthcare professionals, and labor union activity.
Our operations are dependent on the availability, efforts, abilities and experience of management and medical support personnel, including nurses, therapists, pharmacists and lab technicians, among others. We compete with other healthcare providers in recruiting and retaining qualified personnel responsible for the operation of our facilities. There is limited availability of experienced medical support personnel nationwide, which drives up the wages and benefits required to recruit and retain employees. In particular, like others in the healthcare industry, we continue to experience shortages of advanced practice providers and critical‑care nurses in certain disciplines and geographic areas. At times, we have to pay premiums above standard compensation for essential workers and rely on higher-cost contract labor, which we compete with other healthcare providers to secure.
We also depend on the general labor pool of available workers in the areas where we operate. In some of our communities, employers across various industries have increased their minimum wage, which has created more competition and, in some cases, higher labor costs for this sector of employees. Furthermore, state-mandated minimum wage increases in California became effective for healthcare workers in October 2024, with further annual increases anticipated through 2028. The current and expected future increases will result in higher compensation costs for certain of our employees and vendors.
As a result of the aforementioned challenges, we have been, and we may continue to be, required to enhance wages and benefits to recruit and retain experienced employees, pay premiums above standard compensation for essential workers, make greater investments in education and training for newly licensed medical support personnel, or hire more expensive temporary or contract employees, which we also compete with other healthcare providers to secure. In addition, inflationary pressures, which we are unable to predict or control, may continue to impact our salaries, wages, benefits and other costs.
Increased labor union activity is another factor that can adversely affect our labor costs. At December 31, 2024, approximately 21% of the employees in our Hospital Operations segment were represented by labor unions. Unionized employees – primarily registered nurses and service, technical and maintenance workers – are located at 27 of our hospitals, the majority of which are in California, Florida and Michigan. Organizing activities by labor unions could increase our level of union representation in future periods. When we are negotiating collective bargaining agreements with unions (whether such agreements are renewals or first contracts), work stoppages and strikes may be threatened or occur. Extended strikes have had, and could in the future have, an adverse effect on our patient volumes, net operating revenues and labor costs at individual hospitals or in local markets.
For the reasons stated above, our failure to successfully recruit qualified employees, manage attrition, avoid labor disruptions, control costs and plan for future labor needs could have a material adverse effect on our ability to treat patients and our overall business, financial condition, results of operations or cash flows.
Our hospitals, outpatient centers and other healthcare businesses operate in competitive environments, and this competition can adversely affect their performance.
We believe our hospitals and outpatient facilities compete within local areas and regions on the basis of many factors, including: quality of care; location and ease of access; the scope and breadth of services offered; reputation; and the caliber of the facilities, equipment and employees. Furthermore, healthcare consumers are able to access performance data on quality measures and patient satisfaction, as well as pricing information for services, to compare competing providers. In addition, the No Surprises Act requires providers to send to health plans of insured patients and to uninsured patients good faith estimates of the expected charges and diagnostic codes prior to the scheduled dates of services. If any of our facilities achieve poor results (or results that are lower than our competitors) on quality measures or patient satisfaction surveys, or if our pricing is or is perceived to be higher than our competitors, we may attract fewer patients. In addition, the competitive positions of hospitals and outpatient facilities depend in part on the number, quality, specialties, and admitting and scheduling practices of the licensed physicians who are members of the medical staffs of those facilities, as well as physicians who affiliate with and use
outpatient centers as an extension of their practices. We compete with system‑affiliated hospitals and healthcare companies, as well as health insurers and private equity companies, in recruiting physicians, acquiring physician practices and, where permitted by law, employing physicians.
Some competing healthcare facilities are owned by tax‑supported government agencies, and many others are owned by not‑for‑profit organizations that may have financial advantages not available to our facilities, including (1) support through endowments, charitable contributions and tax revenues, (2) access to tax‑exempt financing, (3) exemptions from sales, property and income taxes, (4) discounted prescription drug pricing. In addition, in certain areas where we operate, large teaching hospitals provide highly specialized facilities, equipment and services that may not be available at most of our hospitals. The existence or absence of state laws that require findings of need for construction and expansion of healthcare facilities or services may also impact competition. In recent years, the number of freestanding specialty hospitals, surgery centers, EDs, imaging centers and UCCs in the geographic areas where we operate has increased significantly. Some of these facilities are physician‑owned.
Another factor in the competitive position of a hospital or outpatient facility is the scope and terms of its relationships with managed care plans given that HMOs, PPOs, third‑party administrators and other third‑party payers use managed care contracts to encourage patients to use certain facilities in exchange for discounts from the facilities’ established charges. Generally, we compete for managed care contracts on the basis of price, market reputation, geographic location, quality and range of services, caliber of the medical staff and convenience. Other healthcare providers may affect our ability to enter into acceptable managed care contractual arrangements or negotiate commercial rate increases. For example, some of our competitors may negotiate exclusivity provisions with managed care plans or otherwise restrict the ability of managed care companies to contract with us through the formation of narrow networks or other similar structures. Vertical integration efforts involving third‑party payers and healthcare providers, among other factors, may increase competitive challenges.
If our healthcare competitors are better able to attract patients, recruit physicians, expand services or obtain favorable managed care contracts at their facilities than we are, we may experience an overall decline in patient volumes, which could have an adverse impact on our net operating revenues.
The market for our revenue cycle management services is also competitive. To be successful, we must respond more quickly and effectively than our competitors to new or changing opportunities, technologies, standards, regulations and client requirements. There can be no assurance that we will be successful in generating new client relationships or maintaining existing relationships on favorable terms.
We cannot predict the potential emergence and effects of a future pandemic, epidemic or outbreak of an infectious disease, on our operations, financial condition and liquidity.
New variants or future surges of COVID-19 or the emergence or outbreak of another infectious disease could adversely impact our patient volumes, service mix, revenue mix, operating expenses and net operating revenues in some markets or broadly across our enterprise, depending on how widespread the illness becomes. As with the COVID-19 pandemic, we could experience spikes in admissions at our hospitals, which may put a strain on our resources and personnel, and increased case cancellations in our Ambulatory Care segment. We have been required, and we may in the future be required, to temporarily reduce overall operating capacity or suspend certain services at individual facilities due to staffing constraints and other infectious disease-related factors.
Further, future pandemics, epidemics or outbreaks could exacerbate existing workforce shortages, result in significant price increases in medical supplies, particularly for personal protective equipment, and worsen supply shortages and delays, all of which may impact our ability to see, admit and treat patients.
In general, the future course and impacts of COVID-19 or the potential emergence and effects of a future pandemic, epidemic or outbreak of an infectious disease on our operational and financial performance is uncertain and will depend on many factors outside of our control, including, among others: the duration, severity and trajectory of the illness, including the possible spread of potentially more contagious and/or virulent forms of the infection; future economic conditions, as well as the impact of government actions and administrative regulations on the hospital industry and broader economy, including through stimulus efforts; the development, availability and widespread use of effective medical treatments and vaccines; the imposition of public safety measures; the volume of canceled or rescheduled procedures at our facilities; and the volume of affected patients across our care network.
Our business could be significantly and negatively impacted by security threats, catastrophic events and other disruptions affecting our information technology and related information systems and confidential business data.
Our information technology systems are critical to the day‑to‑day operation of our business. We rely on our information technology to process, transmit and store clinical, financial and operational data that includes PHI, PII, and proprietary and confidential business data. We utilize electronic health records (“EHRs”) and other information technology in connection with all of our operations, including our billing and other financial systems, supply chain and labor management tools. Our systems, in turn, interface with and rely on third‑party systems that store and transmit information integral to patient care and that we do not control, including medical devices and other processes supporting the interoperability of healthcare infrastructures. We rely on these third‑party providers to have appropriate controls to protect our systems, confidential information and other sensitive or regulated data. While we seek to obtain assurances that third parties will protect our information and business operations, there is a risk the security of data held by such third parties could be breached or that systems are rendered unavailable, causing direct impacts to our business operations.
The information technology and infrastructure we use, the third‑party systems we interact with and the suppliers we use, have been, and continue to be, subject to cyber-attacks, computer viruses or breaches due to malfeasance or employee error. In April 2022, we experienced a cybersecurity incident that disrupted a subset of our hospital operations and involved the exfiltration of certain confidential company and patient information. Threat actors continue to proliferate, adapt and devote significant effort to attacking the information systems and electronically transmitted and stored data of healthcare providers and related entities. The risk of cyber-attack (including ransomware attack), breach or other disruption to healthcare systems, including ours, remains elevated in the current environment.
Attacks on, or breaches or other disruptions to, our information technology assets or those of third parties that we rely upon could impact the integrity, security or availability of data we process, transmit or store and could impact our operations, as well as PHI and PII, and result in potential harm to our patients and clients. The preventive actions we take to reduce the risk of such incidents and protect our information technology and data may not be sufficient. As cybersecurity threats continue to evolve, we may not be able to anticipate certain attack methods in order to implement effective protective measures. We continue to be required to expend significant additional resources to modify and strengthen our security measures, investigate and respond to cybersecurity incidents, remediate any vulnerabilities in our information systems and infrastructure, and invest in new technology designed to mitigate security risks. Our insurance against cybersecurity risks and cyber-attacks may not provide the coverage we anticipate or offset the financial impact of a material loss event. In addition, the occurrence of cybersecurity incidents and the continued and elevated risk of attacks (including ransomware), system and data breaches, and other disruptions to information technology systems in the current environment has caused increases in our cyber insurance premiums and lower coverage limits.
Third parties to whom we outsource certain of our functions, with whom we share data for interoperability purposes or from whom we obtain or to whom we provide products and related services, including those that are part of our revenue cycle processes or supply chain, or other third parties with whom our systems interface (such as clients and their vendors, among others), in some instances, store our sensitive and confidential data; these third parties are also subject to the risks outlined above and may not have or use controls effective to protect such information. An attack, breach or other system disruption affecting any of these third parties could similarly harm our business, impact payment of claims, and potentially harm our patients and clients. Further, successful cyber-attacks at other healthcare services companies, whether or not we are impacted, could lead to a general loss of consumer confidence in our industry that could negatively affect us, including harming the market perception of the effectiveness of our security measures or of the healthcare industry in general, which could result in reduced use of our services.
Our networks and technology systems have also experienced disruption due to planned events, such as system implementations, upgrades, and other maintenance and improvements, and they are subject to disruption in the future for similar events, as well as catastrophic events, including a major earthquake, fire, hurricane, telecommunications failure, terrorist attack or the like.
Any ransomware attack, breach, system interruption or unavailability of our information systems or of third-party systems with access to our data could result in: the unauthorized disclosure, misuse, loss or corruption of such data; interruptions and delays in our normal business operations (including the collection of revenues); patient or client harm; potential liability under privacy, security, consumer protection or other applicable laws; regulatory penalties; ransomware payments; and negative publicity and damage to our reputation. Any of these could have a material adverse effect on our business, financial condition, results of operations or cash flows.
We are subject to operational cybersecurity risks that could materially impact our business.
Because we operate an expansive, nationwide healthcare delivery network, changes to our information systems often take months or years to implement, are costly and, in some circumstances, are not compatible with other applications and devices in use. In addition, when we acquire facilities, physician practices and other operations, it takes time and resources to assess the security in place, and then implement and integrate our security practices at the acquired businesses. As a result, we operate these businesses for a period of time with their existing security programs, which may include deficiencies or vulnerabilities. We must prioritize changes and improvements to be made, and we may not be successful identifying gaps or developing alternative methods to secure our systems and data. If we are not successful, we may be more vulnerable to cybersecurity incidents that could impact patient and client information, result in patient harm or have a material adverse impact on our results of operations and financial condition. Moreover, not all standard cybersecurity tools and solutions we use are employed at all locations, as expansion of tool and solution use is based on numerous factors. There is no guarantee that we will employ the right tools and solutions at each location or that the expansion of certain tools and solutions will be successful.
There are risks associated with our current and potential future use of artificial intelligence.
Recent advancements in technology and applications in healthcare, including Generative AI, are enabling our operations to accelerate the adoption of artificial intelligence (“AI”) enabled tools in areas such as clinical care coordination, medical documentation, revenue cycle management and administrative services. When used responsibility, we believe AI has the potential to enhance our business processes and support efficient delivery of high-quality care. However, AI may not always operate as intended, and datasets may be insufficient or contain illegal, biased, harmful or offensive information, which could lead to inaccurate diagnoses and treatments. Moreover, Generative AI systems, which require the collection and processing of sensitive patient data, present potential security and privacy risks. If our current or future technologies or applications fail to operate as anticipated or do not perform as specified, including due to potential design defects and defects in the development of algorithms or other technologies, human error or otherwise, we may be subject to liability and reputational harm. Moreover, we could be subject to private claims and enforcement actions, even if AI systems we utilize operate as intended, relating to false advertising, unfair competition, privacy, anti-discrimination, intellectual property infringement or prohibitions on the corporate practice of medicine, among others. Conversely, if we are unable to successfully maintain, enhance or operate our information systems, including through the implementation of AI technologies or applications in our operations, we may be, among other things, unable to efficiently adapt to evolving laws and requirements, unable to remain competitive with others who successfully implement and advance this technology, and our patients’ safety may be adversely impacted, any of which could have a material adverse impact on our overall business, financial condition, results of operations or cash flows.
Alternative payment models and value-based purchasing initiatives may negatively impact our revenues.
Alternative payment models and value‑based purchasing initiatives of both governmental and private payers tying financial incentives to quality and efficiency of care can affect the results of operations of our hospitals and other healthcare facilities, and may negatively impact our revenues if we are unable to meet expected quality standards. Medicare requires providers to report certain quality measures in order to receive full reimbursement increases that were previously awarded automatically for inpatient and outpatient procedures; each year, CMS updates these measures through refinement or removal of existing measures and the addition of new measures. Hospitals that meet or exceed certain quality performance standards will receive increased reimbursement payments, and hospitals that have “excess readmissions” for specified conditions will receive reduced reimbursement. Furthermore, Medicare no longer pays hospitals additional amounts for the treatment of certain hospital‑acquired conditions (“HACs”), unless the conditions were present at admission. Hospitals that rank in the worst 25% of all hospitals nationally for HACs in the previous year receive reduced Medicare reimbursements. In addition, the Affordable Care Act prohibits the use of federal funds under the Medicaid program to reimburse providers for treating certain provider‑preventable conditions.
The Affordable Care Act also created the CMS Innovation Center to develop and test alternative payment models, including bundled payment models, designed to reduce certain government program expenditures while maintaining or improving quality of care. Bundled payment models hold hospitals financially accountable for the quality and cost of an entire episode of care for a specific diagnosis or procedure, from the date of the hospital admission or inpatient procedure through 90 days post‑discharge, and include services not provided by the hospital, such as physician services, inpatient rehabilitation, skilled nursing and home health care. Participation in certain bundled payment models is voluntary; however, other bundled payment models are mandatory for providers in randomly selected geographic areas. Under the mandatory models, hospitals are eligible to receive incentive payments or will be subject to payment reductions within certain corridors based on their performance against quality and spending criteria. It is difficult to predict what impact, if any, these demonstration programs will have on our inpatient volumes, net revenues or cash flows.
Over the years, private payers have also sought to move toward value‑based purchasing and alternative payment models for healthcare services. Some large commercial payers expect hospitals to report quality data, and several of these payers will not reimburse hospitals for certain preventable adverse events. Value‑based purchasing programs, including programs that condition reimbursement on patient outcome measures, may become more common and may involve a higher percentage of reimbursement amounts.
We are unable at this time to predict how future alternative payment models and value-based purchasing initiatives will affect our results of operations, but they could negatively impact our revenues, particularly if we are unable to meet the quality and cost standards established by both governmental and private payers.
Violations of existing regulations or failure to comply with new or changed regulations could harm our business and financial results.
Our hospitals, outpatient centers and related healthcare businesses are subject to an extensive and complex framework of government regulation at the federal, state and local levels. These legal and regulatory standards relate to, among other topics: ownership and operation of facilities and physician practices; licensure, certification and enrollment in government programs; the necessity and adequacy of medical care; quality of medical equipment and services; relationships with and qualifications of physicians and employees; operating conduct, policies and procedures; screening, stabilization and transfer of individuals who have emergency medical conditions; rate‑setting, billing and coding for services; the preparation and filing of cost reports; the handling of overpayments; contractual arrangements; relationships with referral sources and referral recipients; privacy and security; maintenance of adequate records; construction, acquisition, expansion and closure of healthcare facilities or services; environmental protection; compliance with fire prevention and building codes; debt collection; and communications with patients and consumers. In addition, various permits are required to dispense narcotics, operate pharmacies, handle radioactive materials and operate certain equipment. Our facilities are also subject to periodic inspection by governmental and other authorities to determine their compliance with applicable regulations, as well as the standards necessary for licensing and accreditation.
The policies and procedures we have in place to facilitate compliance with applicable laws, rules and regulations cannot ensure compliance in every case. Moreover, government regulations often change, and we may have to make adjustments to our facilities, equipment, personnel and services to remain in compliance. The potential consequences for failing to comply with applicable laws, rules and regulations include (1) required refunds of previously received government program payments, (2) the assessment of civil monetary penalties, including treble damages, (3) fines, which could be significant, (4) exclusion from participation in federal healthcare programs and (5) criminal sanctions, including sanctions against current or former employees. Our Medicare and Medicaid payments may be suspended pending even an investigation of what the government determines to be a credible allegation of fraud. Any of the aforementioned consequences could have a material adverse effect on our business, financial condition, results of operations or cash flows. Furthermore, even a public announcement that we are being investigated for possible violations of law could have a material adverse effect on the value of our common stock and our business reputation could suffer.
As noted, the healthcare industry continues to attract legislative interest and public attention. We are unable to predict the future course of federal, state and local healthcare legislation, regulation or enforcement efforts. Further changes in the regulatory framework negatively affecting healthcare providers could have a material adverse effect on our business, financial condition, results of operations or cash flows.
Violations of existing consumer protection regulations or failure to comply with new or changed regulations could harm our revenue cycle management services business.
Conifer is subject to numerous federal, state and local consumer protection and other laws governing such topics as privacy, financial services, and billing and collections activities. Regulations related to such laws are subject to changing interpretations that may be inconsistent among different jurisdictions. In addition, a regulatory determination made by, or a settlement or consent decree entered into with, one regulatory agency may not be binding upon, or preclude, investigations or regulatory actions by other agencies. Conifer’s failure to comply with applicable consumer protection and other laws could result in, among other things, the issuance of cease and desist orders (which can include orders for restitution or rescission of contracts, as well as other kinds of affirmative relief), the imposition of fines or refunds, and other civil and criminal penalties, some of which could be significant in the case of knowing or reckless violations. In addition, Conifer’s failure to comply with the statutes and regulations applicable to it could result in a reduced demand for services, invalidate all or portions of some services agreements with clients, give clients the right to terminate services agreements or give rise to contractual liabilities, among other things, any of which could have a material adverse effect on our business. Furthermore, if Conifer becomes subject to fines or other penalties, it could harm Conifer’s reputation, thereby making it more difficult to retain existing clients or attract new clients.
We could be subject to substantial uninsured liabilities or increased insurance costs as a result of significant legal actions.
We operate in a highly regulated and litigious industry; as such, we are regularly named in various legal actions in the ordinary course of our business. We have been and expect to continue to be subject to regulatory proceedings and private litigation (including class action lawsuits) related to, among other things, the care and treatment provided at our hospitals and outpatient facilities; the application of various federal and state labor and privacy laws, rules and regulations; antitrust claims; tax audits; contract disputes (including disagreements with joint venture partners); and other matters. Some of these actions involve large demands, as well as substantial defense costs. Even in states that have imposed caps on damages, litigants are seeking recoveries under theories of liability that might not be subject to such caps. Our commercial insurance does not cover all claims against us and may not offset the financial impact of a material loss event. Moreover, the healthcare industry has seen significant increases in the cost of professional and general liability insurance and required amounts of self-insured retention due to high numbers of claims and lawsuits and large verdicts in certain jurisdictions. As such, commercial insurance may not continue to be available at a reasonable cost for us to maintain at adequate levels. We cannot predict the outcome of current or future legal actions against us or the effect that judgments or settlements in such matters may have on us or on our insurance costs. Additionally, professional and general liability insurance we purchase is subject to per-claim and policy period aggregate limits. If the policy period aggregate limit of any of these policies is exhausted, in whole or in part, it could deplete or reduce the limits available to pay other material claims applicable to that policy period. Any losses not covered by or in excess of the amounts maintained under insurance policies will be funded from our working capital or other sources of liquidity. Furthermore, one or more of our insurance carriers could become insolvent and unable to fulfill its or their obligations to defend, pay or reimburse us when those obligations become due. In that case or if payments of claims exceed our estimates or are not covered by insurance, it could have a material adverse effect on our business, financial condition, results of operations or cash flows.
Economic conditions and other factors have had, and may in the future have, an adverse impact on our business.
Our business has been impacted by inflation and its effects on salaries, wages and benefits, as well as other costs. Additional economic factors, including unemployment rates and consumer spending, affect our patient volumes, service mix and revenue mix. Business closings and layoffs in the areas where we operate may lead to increases in the uninsured and underinsured populations and adversely affect demand for our services, as well as the ability of patients to pay for services. Any significant deterioration in the collectability of patient accounts receivable could adversely affect our cash flows, results of operations and liquidity.
Medical supply prices remain high due to current economic conditions and other factors. In addition, our Ambulatory Care segment continues to be impacted by shipment delays in specialty building systems with respect to its de novo facility development efforts, which are a key part of our portfolio expansion strategy. In fall 2024, a hurricane significantly damaged the North Carolina factory of the largest producer of sterile intravenous fluids in the country, resulting in a national shortage; similar supply shortages in the future could impact our ability to see and treat patients. In general, supply chain operational challenges and cost pressures across our various expense categories may continue or worsen in the future, whether due to geopolitical conflicts, trade tensions, export control rules, tariffs, macro-economic conditions, climate change, weather events or other issues yet to emerge.
Any future cost-reduction initiatives may not deliver the benefits we expect, and actions taken may adversely affect our business.
Our future financial performance and level of profitability may depend, in part, on various cost‑reduction initiatives, including the outsourcing of certain functions unrelated to direct patient care. We may encounter challenges in executing cost‑reduction initiatives and not achieve the intended cost savings. In addition, we may face wrongful termination, discrimination or other legal claims from employees affected by any workforce reductions, and we may incur substantial costs defending against such claims, regardless of their merits. The threat of such claims may also significantly increase our severance costs. Workforce reductions, whether as a result of internal restructuring or in connection with outsourcing efforts, may result in the loss of numerous long‑term employees, the loss of institutional knowledge and expertise, the reallocation of certain job responsibilities and the disruption of business continuity, all of which could negatively affect operational efficiencies and increase our operating expenses in the short term. Moreover, outsourcing and offshoring expose us to additional risks, such as reduced control over operational quality and timing, foreign political and economic instability, compliance and regulatory challenges, and natural disasters not typically experienced in the United States, such as volcanic activity and tsunamis.
Adverse financial trends affecting our actual or anticipated results may require us to record impairment and restructuring charges that may negatively impact our results of operations.
As a result of factors that have negatively affected our industry generally and our business specifically, we have been, and in the future expect to be, required to record various charges in our results of operations. During the year ended December 31, 2024, we recorded $7 million of impairment charges and $56 million of restructuring charges. Our impairment tests presume stable, improving or, in some cases, declining operating results in our facilities, which are based on programs and initiatives being implemented that are designed to achieve each facility’s most recent projections. If these projections are not met, or negative trends occur that impact our future outlook, future impairments of long‑lived assets and goodwill may occur, and we may incur additional restructuring charges, which could be material. We believe significant factors that contribute to adverse financial trends include reductions in volumes of insured patients, shifts in payer mix from commercial to governmental payers combined with reductions in reimbursement rates from governmental payers, and high levels of uninsured patients. Future restructuring of our operating structure that changes our goodwill reporting units could also result in future impairments of our goodwill. Any such charges could negatively impact our results of operations.
Risks Related to Acquisitions, Divestitures and Joint Ventures
When we acquire new assets or businesses, we become subject to various risks and uncertainties that could adversely affect our results of operations and financial condition.
We have completed a number of acquisitions in recent years, and we expect to pursue additional transactions in the future. A key business strategy for USPI, in particular, is the acquisition and development of facilities, primarily through the formation of joint ventures with physicians and/or health system partners. With respect to future transactions, we cannot provide any assurances that we will be able to identify suitable candidates, consummate transactions on terms that are favorable to us, or achieve synergies or other benefits in a timely manner or at all. Furthermore, companies or operations we acquire may not be profitable or may not achieve the profitability that justifies the investments made. Businesses we acquire may also have pre‑existing unknown or contingent liabilities, including liabilities for failure to comply with applicable healthcare regulations. These liabilities could be significant, and, if we are unable to exclude them from the acquisition transaction or successfully obtain and pursue indemnification from a third party or insurance proceeds, they could harm our business and financial condition. In addition, we may be unable to timely and effectively integrate ASCs, physician practices and other businesses that we acquire with our ongoing operations, or we may experience delays implementing operating procedures, personnel and systems, which could impact the financial performance of the acquired business. Significant acquisitions have required, and may in the future require, a substantial investment of time and resources across our enterprise; these efforts may affect management focus and impact our ability to properly prioritize and successfully execute on our other strategic initiatives. Moreover, future acquisitions could result in the incurrence of additional debt and contingent liabilities, potentially dilutive issuances of equity securities, and increased operating expenses, any of which could adversely affect our results of operations and financial condition.
We cannot provide any assurances that we will be successful in divesting assets we wish to sell.
From time to time, we pursue opportunities to refine our portfolio of hospitals and other healthcare facilities when we believe such refinements will help us improve profitability, allocate capital more effectively in areas where we have a stronger presence, deploy proceeds toward higher-return investments across our business, enhance cash flow generation or reduce our debt, among other things. We also periodically exit service lines and businesses that are no longer a core part of our long‑term growth and synergy strategies. In addition, in certain transactions, we may acquire underperforming facilities located in areas where we do not operate, which may cause us to seek to close or sell such facilities – potentially at a price lower than what we effectively paid to acquire them. We cannot provide any assurances that we will be successful in divesting assets we wish to sell or that divestitures or other strategic transactions will achieve their business goals or the benefits we expect.
We have in the past, and may in the future, fail to obtain applicable regulatory approvals, including state approvals or FTC clearances, with respect to potential divestitures of assets or businesses. Even in cases where such approvals are obtained, the process of obtaining them could delay the anticipated closing timeline and result in significant out‑of‑pocket expenses. Moreover, we may encounter difficulties in finding acquirers or alternative exit strategies on terms that are favorable to us, which could delay the receipt of anticipated proceeds necessary for us to complete our planned strategic objectives. In addition, our divestiture activities have required, and may in the future require, us to retain significant pre‑closing liabilities, recognize impairment charges (as discussed above) or agree to contractual restrictions that limit our ability to reenter a particular market, which may be material. Many of our hospital divestitures also necessitate us entering into a transition services agreement with the buyer for information technology and other related services. As a consequence, we may be exposed to the financial status of the buyer for any payments under such transition services agreements or for transferred contractual liabilities, which could be significant. Our divestitures also include the assignment of contracts, such as leases, to the buyers; in many cases, we continue to be exposed to liabilities under such arrangements if the buyers do not timely pay the obligations.
Furthermore, our divestiture and other corporate development activities may present financial and operational risks, including (1) the diversion of management attention from existing core businesses, (2) adverse effects (including a deterioration in the related asset or business) from the announcement of the planned or potential transaction, and (3) the challenges associated with separating personnel and financial and other systems.
USPI and our hospital-based joint ventures depend on existing relationships with key health system partners. If we are unable to maintain synergistic relationships with these systems, or enter into new relationships, we may be unable to implement our business strategies successfully.
USPI and our hospital‑based joint ventures depend in part on the efforts, reputations and success of health system partners and the strength of our relationships with those systems. Our joint ventures could be adversely affected by any damage to those health systems’ reputations or to our relationships with them. In addition, damage to our business reputation could negatively impact the willingness of health systems to enter into relationships with us or USPI. If we are unable to maintain existing arrangements on favorable terms or enter into relationships with additional health system partners, we may be unable to implement our business strategies for our joint ventures successfully.
Our joint venture arrangements are subject to a number of operational risks that could have a material adverse effect on our business, results of operations and financial condition.
We have invested in a number of joint ventures with other entities when circumstances warranted the use of these structures, and we may form additional joint ventures in the future. These joint ventures may not be profitable or may not achieve the profitability that justifies the investments made. Furthermore, the nature of a joint venture requires us to consult with and share certain decision‑making powers with unaffiliated third parties, some of which may be not‑for‑profit health systems. If our joint venture partners do not fulfill their obligations, the affected joint venture may not be able to operate according to its business or strategic plans. In that case, our results of operations could be adversely affected, or we may be required to increase our level of financial commitment to the joint venture. Moreover, differences in economic or business interests or goals among joint venture participants could result in delayed decisions, failures to agree on major issues and even litigation, including claims for breach and attempts to terminate underlying contracts. If these differences cause the joint ventures to deviate from their business or strategic plans, or if our joint venture partners take actions contrary to our policies, objectives or the best interests of the joint venture, our results of operations could be adversely affected. In addition, our relationships with not‑for‑profit health systems and the joint venture agreements that govern these relationships are intended to be structured to comply with current revenue rulings published by the Internal Revenue Service, as well as case law relevant to joint ventures between for‑profit and not‑for‑profit healthcare entities. Material changes in these authorities could adversely affect our relationships with not‑for‑profit health systems and related joint venture arrangements.
Our participation in joint ventures is also subject to the risks that:
•We could experience an impasse on certain decisions because we do not have sole decision‑making authority, which could require us to expend additional resources on resolving such impasses or potential disputes.
•We may not be able to maintain good relationships with our joint venture partners (including health systems), which could limit our future growth potential and could have an adverse effect on our business strategies.
•Our joint venture partners could have investment or operational goals that are not consistent with our corporate‑wide objectives (including the timing, terms and strategies for investments or future growth opportunities) or their relevant contractual obligations.
•Our joint venture partners might become bankrupt, fail to fund their share of required capital contributions or fail to fulfill their other obligations as joint venture partners, which may require us to infuse our own capital into any such venture on behalf of the related joint venture partner or partners despite other competing uses for such capital.
•The requirements in some of our existing joint ventures that one of our wholly owned subsidiaries provide a working capital line of credit to the joint venture could necessitate the allocation of substantial financial resources to the joint venture, potentially impacting our ability to fund our other short‑term obligations.
•Provisions in some of our existing joint venture arrangements requiring mandatory capital expenditures for the benefit of the applicable joint venture could limit our ability to expend funds on other corporate opportunities.
•Our joint venture partners may have competing interests in our markets that could create conflict of interest issues, which could impact the sustainability of our relationships.
•Any sale or other disposition of our interest in a joint venture or underlying assets of the joint venture may require consents from our joint venture partners, which we may not be able to obtain.
•Certain corporate‑wide or strategic transactions may also trigger other contractual rights held by a joint venture partner (including termination or liquidation rights) depending on how the transaction is structured, which could impact our ability to complete such transactions.
•Put/call arrangements and other joint venture exit rights could require us to utilize our cash flow or incur additional indebtedness to satisfy the payment obligations in respect of such arrangements.
•Our joint venture arrangements that involve financial and ownership relationships with physicians and others who either refer or influence the referral of patients to our hospitals or other healthcare facilities are subject to greater regulatory scrutiny from government enforcement agencies. While we endeavor to comply with the applicable safe harbors under the Anti‑kickback Statute, certain of our current arrangements, including joint venture arrangements, do not qualify for safe harbor protection.
Risks Related to Our Indebtedness
Our level of indebtedness could, among other things, adversely affect our ability to raise additional capital to fund our operations, limit our ability to react to changes in the economy or our industry, and prevent us from meeting our obligations under the agreements relating to our indebtedness.
At December 31, 2024, we had approximately $13.173 billion of total long‑term debt, as well as $106 million in standby letters of credit outstanding in the aggregate under our senior secured revolving credit facility (as amended, “Credit Agreement”) and our letter of credit facility agreement (as amended, “LC Facility”). During 2024, our interest expense was $826 million and represented 14% of our $5.956 billion of operating income. Our Credit Agreement is collateralized by eligible inventory and patient accounts receivable, including receivables for Medicaid supplemental payments, of substantially all of our wholly owned acute care and specialty hospitals, and our LC Facility is guaranteed and secured by a first priority pledge of the capital stock and other ownership interests of certain of our hospital subsidiaries on an equal‑ranking basis with our existing senior secured notes. From time to time, we expect to engage in additional capital market, bank credit and other financing activities, depending on our needs and financing alternatives available at that time.
Our indebtedness could have important consequences, including the following:
•Our indebtedness may limit our ability to adjust to changing market conditions and place us at a competitive disadvantage compared to our competitors that have less debt.
•We may be more vulnerable in the event of a deterioration in our business, in the healthcare industry or in the economy generally, or if federal or state governments substantially limit or reduce reimbursement under the Medicare or Medicaid programs.
•Our debt service obligations reduce the amount of funds available for our operations, capital expenditures and corporate development activities, and may make it more difficult for us to satisfy our financial obligations.
•Our operations are capital intensive and require significant investment to maintain buildings, equipment, software and other assets. Our indebtedness could limit our ability to obtain additional financing, if needed, to fund future capital expenditures, as well as working capital, acquisitions or other needs.
•Our indebtedness may result in the market value of our stock being more volatile, potentially resulting in larger investment gains or losses for our shareholders, than the market value of the common stock of other companies that have a relatively smaller amount of indebtedness.
•A significant portion of our outstanding debt is subject to early call price or make‑whole premiums; as a result, it may be costly to pursue debt repayment as a deleveraging strategy depending on when we decide to retire the debt.
Furthermore, our Credit Agreement, our LC Facility and the indentures governing our outstanding notes contain, and any future debt obligations may contain, covenants that, among other things, restrict our ability to pay dividends, incur additional debt and sell assets.
We may not be able to generate sufficient cash to service all of our indebtedness, and we may not be able to refinance our indebtedness on favorable terms, if needed. If we are forced to take other actions to satisfy our obligations under our indebtedness, these actions may not be successful.
Our ability to make scheduled payments on or to refinance our indebtedness depends on our cash on hand and our financial and operating performance, which is subject to prevailing economic and competitive conditions and to financial, business and other factors that may be beyond our control. There can be no assurance that we will be able to maintain a level of
cash flows from operating activities sufficient to permit us to pay the principal, premium, if any, and interest on our indebtedness.
In addition, our ability to meet our debt service obligations is primarily dependent upon the operating results of our subsidiaries and their ability to pay dividends or make other payments or advances to us. We hold most of our assets at, and conduct substantially all of our operations through, direct and indirect subsidiaries. Moreover, we principally rely on dividends or other intercompany transfers of funds from our subsidiaries to meet our debt service and other obligations, including payment on our outstanding debt. The ability of our subsidiaries to pay dividends or make other payments or advances to us will depend on their operating results and will be subject to applicable laws and restrictions contained in agreements governing the debt of such subsidiaries. Subsidiaries that are not wholly owned may also be subject to restrictions on their ability to distribute cash to us in their financing or other agreements and, as a result, we may not be able to access their cash flows to service their respective debt obligations.
In years past, we regularly issued new notes to refinance our outstanding notes prior to their maturity, and we may continue this practice in the future. Current capital market and macro-economic conditions have increased borrowing rates and can be expected to increase our cost of capital as compared to prior periods should we seek additional funding. Moreover, global capital markets have experienced significant volatility and uncertainty in the past, and there can be no assurance that such financing alternatives will be available to us on favorable terms, or at all, should we determine it necessary or advisable to seek additional capital. In addition, our ability to incur secured indebtedness (which would generally enable us to achieve better pricing than the incurrence of unsecured indebtedness) depends in part on the value of our assets, which depends, in turn, on the strength of our cash flows and results of operations, as well as on economic and market conditions and other factors.
If our cash flows and capital resources are insufficient to fund our debt service obligations and we are unable to refinance our indebtedness on acceptable terms, we may be forced to reduce or delay investments and capital expenditures, including those required for physical plant maintenance or operation of our existing facilities, for integrating our historical acquisitions or for future corporate development activities, and such reduction or delay could continue for years. We also may be forced to sell assets or operations, seek additional capital, or restructure our indebtedness. We cannot assure you that we would be able to take any of these actions, that these actions would be successful and permit us to meet our scheduled debt service obligations, or that these actions would be permitted under the terms of our existing or future debt agreements, including our Credit Agreement, our LC Facility and the indentures governing our outstanding notes.
Restrictive covenants in the agreements governing our indebtedness may adversely affect us.
Our Credit Agreement, our LC Facility and the indentures governing our outstanding notes contain various covenants that, among other things, limit our ability and the ability of our subsidiaries to:
•incur, assume or guarantee additional indebtedness;
•incur liens;
•make certain investments;
•provide subsidiary guarantees;
•consummate asset sales;
•redeem debt that is subordinated in right of payment to outstanding indebtedness;
•enter into sale and lease‑back transactions;
•enter into transactions with affiliates; and
•consolidate, merge or sell all or substantially all of our assets.
These restrictions are subject to a number of important exceptions and qualifications. In addition, under certain circumstances, the terms of our Credit Agreement require us to maintain a financial ratio relating to our ability to satisfy certain fixed expenses, including interest payments. Our ability to meet this financial ratio and the aforementioned restrictive covenants may be affected by events beyond our control, and there can be no assurance that we will meet those tests. These restrictions could limit our ability to obtain future financing, make acquisitions or needed capital expenditures, withstand economic downturns in our business or the economy in general, conduct operations or otherwise take advantage of business opportunities that may arise. In addition, a breach of any of these covenants could cause an event of default, which, if not cured or waived, could require us to repay the indebtedness immediately. Under these conditions, we are not certain whether we would have, or be able to obtain, sufficient funds to make accelerated payments.
Despite current indebtedness levels, we have the ability and may decide to incur substantially more debt or otherwise increase our leverage. This could further intensify the risks described above.
We have the ability to incur additional indebtedness in the future, subject to the restrictions contained in our Credit Agreement, our LC Facility and the indentures governing our outstanding notes. We may decide to incur additional secured or unsecured debt in the future to finance our operations and any judgments or settlements or for other business purposes.
Our Credit Agreement provides for revolving loans in an aggregate principal amount of up to $1.500 billion (subject to a borrowing base calculation), with a $200 million subfacility for standby letters of credit. Our LC Facility provides for the issuance of standby and documentary letters of credit in an aggregate principal amount of up to $200 million. At December 31, 2024, we had no cash borrowings outstanding under the Credit Agreement, and we had $106 million of standby letters of credit outstanding in the aggregate under the Credit Agreement and the LC Facility. If new indebtedness is added or our leverage increases, the related risks could intensify.
ITEM 1B. UNRESOLVED STAFF COMMENTS
None.
ITEM 1C. CYBERSECURITY
RISK MANAGEMENT AND STRATEGY
We identify and assess areas of risk for our company on an ongoing basis, and we have developed, and regularly refine, comprehensive practices to manage and mitigate existing and potential risks to our business. Our board of directors oversees enterprise risk management as an integral and continuous part of its oversight role. Integrated into our overall enterprise risk management framework are processes dedicated to the identification, assessment and management of material risks from cybersecurity threats. Our approach to cybersecurity risk management is both proactive and defensive, and includes the following elements:
•a team dedicated solely to cybersecurity and managed by our chief information security officer (“CISO”), who reports directly to our chief information officer (“CIO”);
•an information technology request review process that includes cybersecurity assessments of third-party products and systems proposed to connect to our information systems environment or access our data; and
•a cybersecurity incident response plan.
Cybersecurity Team and Strategy—Our cybersecurity team, which includes both our employees and those of our managed services provider, is comprised of subgroups focused on distinct functional areas of responsibility. The team maintains a Security Operations Center, staffed 24 hours a day, that delivers day-to-day execution support for our cybersecurity risk management program.
We leverage a multi-layered strategy that is designed to assess, identify, manage and mitigate risks to our systems and data from cybersecurity threats. Proactively, we have implemented numerous threat‑management tools and processes. In addition, we have disaster recovery and business continuity plans that are tested and updated periodically. We strive to stay abreast of cybersecurity threats through integrated threat intelligence feeds, industry and federal threat notices, and participation in healthcare industry intelligence sharing. Our program leverages best practices and is guided by industry frameworks, including the National Institute of Standards and Technology Cyber Security Framework. We also conduct table-top exercises, which serve to simulate cybersecurity incidents to practice response and identify gaps, on a regular basis. Our internal audit team performs random sampling audits of security practices at our facilities, and we routinely perform security risk assessments.
We also require all employees to participate in cybersecurity awareness training annually, and we circulate cybersecurity awareness alerts, safety tips and newsletters to employees across the enterprise regularly. In addition, we routinely run phishing campaigns and perform other tests to increase awareness of cybersecurity threats.
Third-Party Review Processes—Our business requires interaction of our systems and the sharing of data with third parties, including our service providers and vendors, as well as other healthcare providers and their vendors, that present risks to our systems and data from third-party systems and practices. Incidents and cybersecurity attacks at third parties can impact our operations and our obligations to patients, payers and others. We manage this risk through an information technology review and approval process that considers the anticipated use and implementation of proposed technologies, and includes cybersecurity team assessments of third-party products and systems proposed to connect to our information systems
environment or access our data. A subgroup of our cybersecurity team is dedicated to risk-assessment analyses of vendor security practices and protections. In certain circumstances, we enter into information security agreements with service providers to secure their commitment to maintain certain security protections.
Cybersecurity Incident Response Plan—In addition to protecting our assets proactively, our cybersecurity team is tasked with detecting and defending against cybersecurity threats to our systems and data. We maintain a response plan that outlines actions to be taken with respect to cyber incidents and includes procedures, notification processes, and protocols for escalation to senior management and our board of directors. The cybersecurity incident response team is composed of a smaller, core group of our cybersecurity team, as well as a larger, extended group that includes personnel from our operations, legal, compliance, privacy, risk management, communications, incident command center, security, human resources, finance, audit and government relations teams. We also engage third parties, such as forensics consultants, external legal counsel and law enforcement, as needed and as appropriate based on the circumstances. Incidents are escalated to senior management in accordance with our plan and as otherwise appropriate based on the nature of the incident.
EXISTING AND POTENTIAL RISKS
As previously disclosed, in April 2022, we experienced a cybersecurity incident that disrupted a subset of our hospital operations and involved the exfiltration of certain confidential company and patient information. We incurred significant costs to remediate the issues, sustained lost revenues from the associated business interruption and incurred other related expenses. Following this incident, we implemented certain changes to our information systems and processes meant to provide additional protections to our environment, including enhancements to our Security Operations Center, system backups, training practices, detection tools and capabilities, and implementation of new tools and processes, among others. However, we continue to face a heightened risk of cybersecurity threats targeting healthcare providers, including ransomware attacks, which may materially impact our business, financial condition or results of operations. Additional information on cybersecurity‑related risks is included in Item 1A, Risk Factors, of Part I of this report.
GOVERNANCE
Board Oversight—Our board of directors has identified the oversight of cybersecurity risks to be one of its priorities, and it receives regular reports from management, including the CIO and the CISO, on various cybersecurity matters, including the security of the company’s information systems, anticipated sources of future material cyber risks and how management is addressing any significant potential vulnerability. The board’s audit committee reviews the company’s cybersecurity program at least annually and receives regular updates on cybersecurity threats and other matters. Cecil D. Haney, a member of the audit committee, brings to the board valuable insights into cybersecurity, systems planning, and crisis and risk management.
In addition to regular updates to the audit committee, we have protocols by which certain cybersecurity incidents are escalated within the company and, where appropriate, reported in a timely manner to the board and the audit committee.
Management Oversight—Our CISO, who reports directly to our CIO, oversees and manages our cybersecurity strategy and related programs. As the head of our cybersecurity team, both internal and outsourced, our CISO is primarily responsible for assessing and managing risks from cybersecurity threats. The processes by which he is informed about and monitors the prevention, detection, mitigation and remediation of cybersecurity incidents are described above. He reports information about such risks to the CIO and other members of senior management, who, in turn, report them to our board and audit committee, as appropriate. Our CISO joined the company in August 2022 with over 20 years of risk management, national security and cybersecurity experience garnered at both public and private companies, as well as governmental agencies.
ITEM 2. PROPERTIES
The disclosure required under this Item is included in Item 1, Business, of Part I of this report.
ITEM 3. LEGAL PROCEEDINGS
Because we provide healthcare services in a highly regulated industry, we have been and expect to continue to be party to various lawsuits, claims and regulatory investigations from time to time. For information regarding material pending legal proceedings in which we are involved, see Note 17 to our Consolidated Financial Statements, which is incorporated by reference.
ITEM 4. MINE SAFETY DISCLOSURES
Not applicable.
PART II.
ITEM 5. MARKET FOR REGISTRANT’S COMMON EQUITY, RELATED STOCKHOLDER MATTERS AND ISSUER PURCHASES OF EQUITY SECURITIES
Common Stock—Our common stock is listed on the New York Stock Exchange under the symbol “THC.” As of February 7, 2025, there were 3,053 holders of record of our common stock. Our transfer agent and registrar is Computershare. Shareholders with questions regarding their stock certificates, including inquiries related to exchanging or replacing certificates or changing an address, should contact the transfer agent at (866) 229‑8416.
Equity Compensation—Refer to Item 12, Security Ownership of Certain Beneficial Owners and Management and Related Stockholder Matters, of Part III of this report, as well as Note 10 to our Consolidated Financial Statements, for information regarding securities authorized for issuance under our equity compensation plans.
Stock Performance Graph—The following graph shows the cumulative, five‑year total return for our common stock compared to the following indices:
•The S&P 500, a stock market index that measures the equity performance of 500 large companies listed on the stock exchanges in the United States (in which we are not included);
•The S&P 500 Health Care, a stock market index comprised of those companies included in the S&P 500 that are classified as part of the healthcare sector (in which we are not included); and
•A group made up of us and our healthcare provider peers (namely, Community Health Systems, Inc. (CYH), HCA Healthcare, Inc. (HCA), Tenet Healthcare Corporation (THC) and Universal Health Services, Inc. (UHS)), which we refer to as our “Peer Group” herein.
Performance data assumes that $100.00 was invested on December 31, 2019 in our common stock and each of the indices. The data assumes the reinvestment of all cash dividends and the cash value of other distributions, if any. Moreover, in accordance with U.S. Securities and Exchange Commission (“SEC”) regulations, the returns of each company in our Peer Group have been weighted according to the respective company’s stock market capitalization at the beginning of each period for which a return is indicated. The stock price performance shown in the graph is not necessarily indicative of future stock price performance. The performance graph shall not be deemed “filed” for purposes of Section 18 of the Securities Exchange Act of 1934, as amended (the “Exchange Act”), or incorporated by reference into any of our filings under the Securities Act of 1933, as amended, or the Exchange Act, except as shall be expressly set forth by specific reference in such filing.
| | | | | | | | | | | | | | | | | | | | | | | | | | | | | | | | | | | |
| At December 31, |
| | 2019 | | 2020 | | 2021 | | 2022 | | 2023 | | 2024 |
| Tenet Healthcare Corporation | $ | 100.00 | | | $ | 105.00 | | | $ | 214.80 | | | $ | 128.29 | | | $ | 198.71 | | | $ | 331.92 | |
| S&P 500 | $ | 100.00 | | | $ | 118.40 | | | $ | 152.39 | | | $ | 124.79 | | | $ | 157.59 | | | $ | 197.02 | |
| S&P Health Care | $ | 100.00 | | | $ | 113.45 | | | $ | 143.09 | | | $ | 140.29 | | | $ | 143.18 | | | $ | 146.87 | |
| Peer Group | $ | 100.00 | | | $ | 109.05 | | | $ | 164.16 | | | $ | 150.73 | | | $ | 174.12 | | | $ | 203.85 | |
Repurchases of Common Stock—In July 2024, our board of directors authorized the repurchase of up to $1.500 billion of our common stock through a share repurchase program that has no expiration date. Repurchases under the program may be made in open‑market or privately negotiated transactions, at management’s discretion subject to market conditions and other factors, and in a manner consistent with applicable securities laws and regulations. The share repurchase program does not obligate us to acquire any particular amount of common stock, and it may be suspended for periods or discontinued at any time. We had no share repurchase transactions during the three months ended December 31, 2024 (not including shares tendered to satisfy the exercise price in connection with cashless exercises of employee stock options or shares tendered to satisfy tax withholding obligations in connection with employee or director equity awards). The maximum dollar value of shares that may yet be purchased under the program is $1.376 billion.
ITEM 6. RESERVED
ITEM 7. MANAGEMENT’S DISCUSSION AND ANALYSIS OF FINANCIAL CONDITION AND RESULTS OF OPERATIONS
INTRODUCTION TO MANAGEMENT’S DISCUSSION AND ANALYSIS
The purpose of this section, Management’s Discussion and Analysis of Financial Condition and Results of Operations (“MD&A”), is to provide a narrative explanation of our financial statements that enables investors to better understand our business, to enhance our overall financial disclosures, to give context to the analysis of our financial information, and to provide information about the quality of, and potential variability of, our financial condition, results of operations and cash flows. MD&A, which should be read in conjunction with the accompanying Consolidated Financial Statements, includes the following sections:
•Management Overview
•Sources of Revenue for Our Hospital Operations and Services Segment
•Results of Operations
•Liquidity and Capital Resources
•Recently Issued Accounting Standards
•Critical Accounting Estimates
Our business consists of our Hospital Operations and Services (“Hospital Operations”) segment and our Ambulatory Care segment. Our Hospital Operations segment is comprised of our acute care and specialty hospitals, a network of employed physicians and ancillary outpatient facilities. At December 31, 2024, our subsidiaries operated 49 hospitals serving primarily urban and suburban communities in eight states. Our Hospital Operations segment also included 135 outpatient facilities at December 31, 2024, including urgent care centers (each, a “UCC”), imaging centers, off-campus hospital emergency departments and micro‑hospitals. In addition, our Hospital Operations segment provides revenue cycle management and value‑based care services to hospitals, health systems, physician practices, employers and other clients through our Conifer Health Solutions, LLC joint venture.
Our Ambulatory Care segment, through our USPI Holding Company, Inc. subsidiary (“USPI”), held ownership interests in 518 ambulatory surgery centers (each, an “ASC”), 375 of which are consolidated, and 25 surgical hospitals, seven of which are consolidated, in 37 states at December 31, 2024. USPI’s facilities offer a range of procedures and service lines, including, among other specialties: orthopedics, total joint replacement, and spinal and other musculoskeletal procedures; gastroenterology; pain management; otolaryngology (ear, nose and throat); ophthalmology; and urology.
Unless otherwise indicated, all financial and statistical information included in MD&A relates to our continuing operations, with dollar amounts expressed in millions (except per adjusted admission and per adjusted patient day amounts). Continuing operations information includes the results of all facilities operated during any portion of the periods presented, and it reflects the performance of those facilities only for the time periods in which we operated them. Continuing operations information excludes the results of our hospitals and other businesses classified as discontinued operations for accounting purposes. We believe this presentation is useful to investors because continuing operations information reflects the impact of the addition or disposition of individual hospitals and other operations on our volumes, revenues and expenses.
In certain cases, information presented in MD&A for our Hospital Operations segment is described as presented on a same‑hospital basis, which includes facilities we operated for the entirety of the periods presented. For the years ended December 31, 2024 and 2023, information presented on a same-hospital basis includes the results of our same 47 hospitals and those outpatient centers we operated throughout 2024 and 2023, and excludes the results of: (1) our Westover Hills Baptist Hospital, the new acute care hospital we opened in Texas in July 2024; (2) three hospitals located in South Carolina and certain related operations (the “SC Hospitals”) we sold in January 2024; (3) four hospitals and certain related operations located in Orange County and Los Angeles County, California (the “OCLA CA Hospitals”) we sold in March 2024; (4) two hospitals and certain related operations located in San Luis Obispo County, California (the “Central CA Hospitals”), which we also sold in March 2024; (5) the five hospitals and certain related operations located in Alabama we divested in September 2024 (the “AL Hospitals”); (6) a rehabilitation hospital in El Paso, Texas, in which we acquired a majority ownership interest in September 2024; (7) 56 UCCs we acquired ownership interests in through the formation of a joint venture with NextCare, Inc. in December 2023; and (8) businesses classified as discontinued operations for accounting purposes during those periods, along with other ancillary facilities acquired or divested during the reporting periods that have a limited financial or operational impact. We present same‑hospital data because we believe it provides investors with useful information regarding the performance of our current portfolio of hospitals and other operations that are comparable for the periods presented.
Furthermore, same‑hospital data may more clearly reflect recent trends we are experiencing with respect to volumes, revenues and expenses exclusive of variations caused by the addition or disposition of individual hospitals and other operations.
We present certain metrics as a percentage of net operating revenues because a significant portion of our operating expenses are variable, and we present certain metrics on a per adjusted admission and per adjusted patient day basis to show trends other than volume.
Our Ambulatory Care segment reports growth data on a same-facility systemwide basis, which includes both consolidated and unconsolidated facilities held at the end of the period, as well as facilities acquired during the period on a pro forma basis as if owned for the full period. Divested facilities are generally excluded; however, management may include facilities sold near the end of the period when, in its judgment, their inclusion provides financial statement users with a better understanding of the segment's performance. This approach offers insights into the performance of our current portfolio by excluding variations from facility acquisitions or dispositions. Although we do not record the revenues of unconsolidated facilities, this information is important for understanding the financial performance of our Ambulatory Care segment, as these revenues form the basis for calculating management services revenues and equity in earnings of unconsolidated affiliates. Additionally, this presentation enhances comparability across periods.
The financial information provided throughout this report, including our Consolidated Financial Statements and the notes thereto, has been prepared in conformity with accounting principles generally accepted in the United States of America (“GAAP”). However, we use certain non‑GAAP financial measures, including Adjusted EBITDA (as defined below), in this report and in communications with investors, analysts, rating agencies, banks and others to assist such parties in understanding the impact of various items on our financial statements. We use this information in our analysis of the performance of our business, excluding items we do not consider relevant to the performance of our operations. In addition, we use these measures to define certain performance targets under our compensation programs.
“Adjusted EBITDA” is a non‑GAAP measure we define as net income available (loss attributable) to Tenet Healthcare Corporation common shareholders before (1) the cumulative effect of changes in accounting principle, (2) net loss attributable (income available) to noncontrolling interests, (3) income (loss) from discontinued operations, net of tax, (4) income tax benefit (expense), (5) gain (loss) from early extinguishment of debt, (6) other non‑operating income (expense), net, (7) interest expense, (8) litigation and investigation (costs) benefit, net of insurance recoveries, (9) net gains (losses) on sales, consolidation and deconsolidation of facilities, (10) impairment and restructuring charges and acquisition‑related costs, (11) depreciation and amortization, and (12) income (loss) from divested and closed businesses (i.e., health plan businesses). Litigation and investigation costs do not include ordinary course of business malpractice and other litigation and related expense.
We also present certain operational metrics and statistics in order to provide additional insight into our operational performance efficiency and to help investors better understand management’s view and strategic focus. We define these operational metrics and statistics as follows:
Adjusted admissions—represents actual admissions in the period adjusted to include outpatient services provided by facilities in our Hospital Operations segment by multiplying actual admissions by the sum of gross inpatient revenues and outpatient revenues and dividing the result by gross inpatient revenues;
Adjusted patient days—represents actual patient days in the period adjusted to include outpatient services provided by facilities in our Hospital Operations segment by multiplying actual patient days by the sum of gross inpatient revenues and outpatient revenues and dividing the result by gross inpatient revenues; and
Utilization of licensed beds—represents patient days divided by the number of days in the period divided by average licensed beds.
MANAGEMENT OVERVIEW
OPERATING ENVIRONMENT AND TRENDS
Industry Trends and Healthcare Policy Changes—We believe that several key trends are continuing to shape the demand for healthcare services: (1) consumers, employers and insurers are actively seeking lower‑cost solutions and better value with respect to healthcare spending; (2) patient volumes are shifting from inpatient to outpatient settings due to technological advances and demand for care that is more convenient, affordable and accessible; (3) the growing aging population requires greater chronic disease management and higher‑acuity treatment; and (4) consolidation continues across the entire healthcare sector. Furthermore, the healthcare industry, in general, and the acute care hospital business, in particular, continue to be subject to significant legislative and regulatory uncertainty. Changes in federal or state healthcare laws,
regulations, funding policies or reimbursement practices, especially those involving reductions to government payment rates or access to insurance coverage, could have a significant impact on our future revenues and expenses.
Staffing and Labor Trends—We compete with other healthcare providers in recruiting and retaining qualified personnel responsible for the operation of our facilities. There is limited availability of experienced medical support personnel nationwide, which drives up the wages and benefits required to recruit and retain employees. In particular, like others in the healthcare industry, we continue to experience shortages of advanced practice providers and critical‑care nurses in certain disciplines and geographic areas. Over the past several years, we have had to rely on higher-cost contract labor, which we compete with other healthcare providers to secure, and pay premiums above standard compensation for essential workers. Our recruitment and retention efforts drove a reduction in contract labor expense during the year ended December 31, 2024 as compared to 2023, such that our contract labor costs are now in line with historical levels.
We also depend on the general labor pool of available workers in the areas where we operate. In some of our communities, employers across various industries have increased their minimum wage, which has created more competition and, in some cases, higher labor costs for this sector of employees. Furthermore, state‑mandated minimum wage increases in California became effective for healthcare workers in October 2024, with further annual increases anticipated through 2028. The current and expected future increases will result in higher compensation costs for certain of our employees and vendors.
Economic Conditions and Other Impacts—Our business has been impacted by inflation and its effects on salaries, wages and benefits, as well as other costs. Medical supply prices remain high due to current economic conditions and other factors. In addition, our Ambulatory Care segment continues to be impacted by shipment delays in specialty building systems with respect to its de novo facility development efforts, which are a key part of our portfolio expansion strategy. In general, supply chain operational challenges and cost pressures across our various expense categories may continue or worsen in the future, whether due to geopolitical conflicts, trade tensions, export control rules, tariffs, macro-economic conditions, climate change, weather events or other issues yet to emerge.
STRATEGIES
Expanding Our Ambulatory Care Segment—We continue to focus on opportunities to expand our Ambulatory Care segment through acquisitions, organic growth in our physician relationships and service lines, construction of new outpatient centers and strategic partnerships. We believe USPI’s ASCs and surgical hospitals offer many advantages to patients and physicians, including greater affordability, predictability, flexibility and convenience. Moreover, due in part to advancements in surgical techniques, medical technology and anesthesia, as well as the lower cost structure and greater efficiencies that are attainable at a specialized outpatient site, we believe the volume and complexity of surgical cases performed in an outpatient setting will continue to increase over time. Historically, our outpatient services have generated significantly higher margins for us than inpatient services. During the year ended December 31, 2024, we acquired ownership interests in 54 ASCs and one surgical hospital in which we did not have a previous investment, increased our ownership interest in seven ASCs sufficient to consolidate them and opened 14 de novo ASCs.
Driving Growth in Our Hospital Operations Segment—We remain committed to better positioning our hospitals and competing more effectively in the ever‑evolving healthcare environment by focusing on driving performance through operational effectiveness, investing in our physician enterprise, particularly our specialist network, enhancing patient and physician satisfaction, growing our higher‑demand and higher‑acuity clinical service lines (including outpatient lines), expanding patient and physician access, and optimizing our portfolio of assets. We believe our efforts in these areas improve the quality of care we deliver and enhance growth.
In 2024, we continued to pursue advantageous opportunities to grow our portfolio of hospitals and other healthcare facilities. In July, we opened the newly constructed, 92-bed Westover Hills Baptist Hospital in San Antonio, and, in September, we acquired a majority ownership interest in a 36-bed rehabilitation hospital in El Paso. In addition, we continued construction in 2024 on a new medical campus located in Port St. Lucie, which will include the 54‑bed Florida Coast Surgical Hospital, as well as medical office space. We expect to complete construction of the Port St. Lucie medical campus in late 2025.
From time to time, we also capitalize on opportunities to refine our portfolio of hospitals and other healthcare facilities when we believe such refinements will help us improve profitability, allocate capital more effectively in areas where we have a stronger presence, deploy proceeds toward higher-return investments across our business, enhance cash flow generation or reduce our debt, among other things. To that end, we divested the SC Hospitals, OCLA CA Hospitals, Central CA Hospitals and AL Hospitals (collectively, the “Divested Hospitals”) in 2024.
Improving the Customer Care Experience—As consumers continue to become more engaged in managing their health, we recognize that understanding what matters most to them and earning their loyalty is imperative to our success. As such, we have enhanced our focus on treating our patients as traditional customers by: (1) establishing networks of physicians and facilities that provide convenient access to services across the care continuum; (2) expanding service lines with growing community demand, including a focus on aging and chronic disease patients; (3) offering greater affordability and predictability, including simplified registration and discharge procedures, particularly in our outpatient centers; (4) improving our culture of service; and (5) creating health and benefit programs, patient education and health literacy materials that are customized to the needs of the communities we serve.
Recent advancements in technology and applications in healthcare, including Generative AI, are enabling our operations to accelerate the adoption of artificial intelligence (“AI”) enabled tools in areas such as clinical care coordination, medical documentation, revenue cycle management and administrative services. When used responsibility, we believe AI has the potential to enhance our business processes and support efficient delivery of high‑quality care.
Improving Profitability—We continue to focus on growing patient volumes and effective cost management as a means to improve profitability. We believe that emphasis on higher‑demand clinical service lines (including outpatient services), focus on expanding our ambulatory care business, cultivation of our culture of service, participation in Medicare Advantage health plans that have been experiencing higher growth rates than traditional Medicare, and contracting strategies that create shared value with payers should help us grow our patient volumes over time. We are also continuing to pursue new opportunities to enhance efficiency, including further integration of enterprise‑wide centralized support functions, outsourcing additional functions unrelated to direct patient care, supply chain management, and reducing clinical and vendor contract variation.
Managing Our Capital Structure—All of our long‑term debt has a fixed rate of interest, except for outstanding borrowings under our senior secured revolving credit facility (as amended to date, the “Credit Agreement”), of which we had none at December 31, 2024. In addition, the maturity dates of our notes are staggered from 2027 through 2031. We believe that our capital structure helps to minimize the near‑term impact of increased interest rates, and the staggered maturities of our debt allow us to retire or refinance our debt over time. During the three months ended March 31, 2024, we redeemed all $2.100 billion aggregate principal amount outstanding of our 4.875% senior secured first lien notes due 2026 (the “2026 Senior Secured First Lien Notes”) in advance of their maturity date.
In July 2024, our board of directors authorized the repurchase of up to $1.500 billion of our common stock through a new share repurchase program that has no expiration date. Repurchases will be made in accordance with applicable securities laws and may be made at management’s discretion from time to time in open-market or privately negotiated transactions, subject to market conditions and other factors. This program does not obligate us to acquire any particular amount of common stock, and it may be suspended for periods or discontinued at any time. At December 31, 2024, there was $1.376 billion available under this program for future repurchases.
Our ability to execute on our strategies and respond to the aforementioned trends in the current operating environment is subject to numerous risks and uncertainties, all of which may cause actual results to be materially different from expectations. For information about risks and uncertainties that could affect our results of operations, see the Forward‑Looking Statements and Risk Factors sections in Part I of this report.
RECENT RESULTS OF OPERATIONS
The following table presents selected operating statistics for our Hospital Operations and Ambulatory Care segments on a continuing operations basis:
| | | | | | | | | | | | | | | | | | | | | | | |
| | | Three Months Ended December 31, | | Increase
(Decrease) |
| | 2024 | | 2023 | |
| Hospital Operations – hospitals and related outpatient facilities: | | | | | | | |
| Number of hospitals (at end of period) | | 49 | | | 61 | | | (12) | | (1) |
| Total admissions | | 117,984 | | | 136,856 | | | (13.8) | % | |
| Adjusted admissions | | 212,777 | | | 250,344 | | | (15.0) | % | |
| Paying admissions (excludes charity and uninsured) | | 112,466 | | | 130,573 | | | (13.9) | % | |
| Charity and uninsured admissions | | 5,518 | | | 6,283 | | | (12.2) | % | |
| Admissions through emergency department | | 87,994 | | | 102,041 | | | (13.8) | % | |
| Emergency department visits, outpatient | | 460,542 | | | 562,929 | | | (18.2) | % | |
| Total emergency department visits | | 548,536 | | | 664,970 | | | (17.5) | % | |
| Total surgeries | | 68,893 | | | 86,908 | | | (20.7) | % | |
| Patient days — total | | 577,904 | | | 692,961 | | | (16.6) | % | |
| Adjusted patient days | | 1,006,377 | | | 1,217,073 | | | (17.3) | % | |
| Average length of stay (days) | | 4.90 | | | 5.06 | | | (3.2) | % | |
| Average licensed beds | | 12,435 | | | 15,476 | | | (19.6) | % | |
| Utilization of licensed beds | | 50.5 | % | | 48.7 | % | | 1.8 | % | (1) |
| Total visits | | 1,366,394 | | | 1,384,105 | | | (1.3) | % | |
| Paying visits (excludes charity and uninsured) | | 1,267,881 | | | 1,297,846 | | | (2.3) | % | |
| Charity and uninsured visits | | 98,513 | | | 86,259 | | | 14.2 | % | |
| Ambulatory Care: | | | | | | | |
| Total consolidated facilities (at end of period) | | 382 | | | 330 | | | 52 | | (1) |
| Total consolidated cases | | 475,900 | | | 416,250 | | | 14.3 | % | |
| | | | | | | | |
| | |
| (1) | The change is the difference between the 2024 and 2023 amounts or percentages presented. |
| |
| |
Total admissions decreased by 18,872, or 13.8%, total surgeries decreased by 18,015, or 20.7%, and total emergency department visits decreased by 116,434, or 17.5%, in the three months ended December 31, 2024 compared to the three months ended December 31, 2023. The decreases in our volumes were primarily related to the sales of the Divested Hospitals. Excluding the impact of these divestitures, total admissions increased by 6,415, or 5.7%, total surgeries increased by 432, or 0.6%, and total emergency department visits decreased by 12,082, or 2.6%, during the three months ended December 31, 2024 compared to the same period in 2023.
The increase in our Ambulatory Care segment’s total consolidated cases of 14.3% in the three months ended December 31, 2024, as compared to the same period in 2023, was primarily attributable to incremental case volume from our newly acquired ASCs, net of the impact of the closure and deconsolidation of certain facilities, as well as same‑facility case growth.
The following table presents net operating revenues by segment on a continuing operations basis:
| | | | | | | | | | | | | | | | | | | | | |
| | | Three Months Ended December 31, | | Increase
(Decrease) | |
| | 2024 | | 2023 | | |
| | | | | | | |
| Hospital Operations | | $ | 3,813 | | | $ | 4,302 | | | (11.4) | % | |
| Ambulatory Care | | 1,259 | | | 1,077 | | | 16.9 | % | |
| | | | | | | |
| | | | | | | |
| Total | | $ | 5,072 | | | $ | 5,379 | | | (5.7) | % | |
Consolidated net operating revenues decreased by $307 million, or 5.7%, in the three months ended December 31, 2024 compared to the same period in 2023. The decrease of $489 million, or 11.4%, in our Hospital Operations segment’s net operating revenues for the three‑month period in 2024 compared to the same period in 2023 was primarily due to the sales of the Divested Hospitals. Excluding the effect of these sales, net operating revenues during the three months ended December 31, 2024 increased by $232 million, or 6.5%, compared to the three months ended December 31, 2023. This increase was attributable to the positive impact of a more favorable payer mix, higher patient admissions and acuity, growth in our Medicaid supplemental revenue, and negotiated commercial rate increases.
Net operating revenues in our Ambulatory Care segment increased by $182 million, or 16.9%, in the three months ended December 31, 2024 compared to the same period in 2023. This change was primarily driven by our newly acquired ASCs, net of the impact of the closure and deconsolidation of certain facilities, as well as an increase in case volume and higher net revenue per case in the 2024 period.
The following table provides information about selected operating expenses by segment on a continuing operations basis:
| | | | | | | | | | | | | | | | | | | | |
| | | Three Months Ended December 31, | | Increase
(Decrease) |
| | 2024 | | 2023 | |
| Hospital Operations: | | | | | | |
| Salaries, wages and benefits | | $ | 1,788 | | | $ | 2,060 | | | (13.2) | % |
| Supplies | | 600 | | | 648 | | | (7.4) | % |
| Other operating expenses | | 911 | | | 1,052 | | | (13.4) | % |
| Total | | $ | 3,299 | | | $ | 3,760 | | | (12.3) | % |
| Ambulatory Care: | | | | | | |
| Salaries, wages and benefits | | $ | 306 | | | $ | 255 | | | 20.0 | % |
| Supplies | | 330 | | | 283 | | | 16.6 | % |
| Other operating expenses | | 168 | | | 144 | | | 16.7 | % |
| Total | | $ | 804 | | | $ | 682 | | | 17.9 | % |
| | | | | | |
| | | | | | |
| | | | | | |
| | | | | | |
| | | | | | |
| Total: | | | | | | |
| Salaries, wages and benefits | | $ | 2,094 | | | $ | 2,315 | | | (9.5) | % |
| Supplies | | 930 | | | 931 | | | (0.1) | % |
| Other operating expenses | | 1,079 | | | 1,196 | | | (9.8) | % |
| Total | | $ | 4,103 | | | $ | 4,442 | | | (7.6) | % |
Rent/lease expense(1): | | | | | | |
| Hospital Operations | | $ | 56 | | | $ | 70 | | | (20.0) | % |
| Ambulatory Care | | 42 | | | 35 | | | 20.0 | % |
| | | | | | |
| Total | | $ | 98 | | | $ | 105 | | | (6.7) | % |
| | | | | | | | |
| | |
| (1) | Included in other operating expenses. |
The following table provides information about our Hospital Operations segment’s selected operating expenses per adjusted admission on a continuing operations basis:
| | | | | | | | | | | | | | | | | | | | |
| | | Three Months Ended December 31, | | Increase
(Decrease) |
| | 2024 | | 2023 | |
| | | | | | |
| Salaries, wages and benefits per adjusted admission | | $ | 8,401 | | | $ | 8,234 | | | 2.0 | % |
| Supplies per adjusted admission | | 2,821 | | | 2,586 | | | 9.1 | % |
| Other operating expenses per adjusted admission | | 4,289 | | | 4,197 | | | 2.2 | % |
| Total per adjusted admission | | $ | 15,511 | | | $ | 15,017 | | | 3.3 | % |
Salaries, wages and benefits expense for our Hospital Operations segment decreased by $272 million, or 13.2%, in the three months ended December 31, 2024 compared to the same period in 2023. This change was primarily attributable to the sales of the Divested Hospitals. After excluding the effects of these divestitures, salaries, wages and benefits expense for our Hospital Operations segment increased by $64 million, or 3.7%, during the three-month period in 2024 as compared to the same period in 2023. This increase was the result of annual merit increases for certain of our employees and increased employee benefits costs, partially offset by decreases in contract labor and premium pay and lower incentive compensation.
On a per adjusted admission basis, salaries, wages and benefits expense in our Hospital Operations segment increased by 2.0% in the three months ended December 31, 2024 compared to the three months ended December 31, 2023. Excluding the impact of the sales of the Divested Hospitals, salaries, wages and benefits expense per adjusted admission during the three months ended December 31, 2024 did not change significantly from the same period in 2023.
Supplies expense for our Hospital Operations segment decreased by $48 million, or 7.4%, during the three months ended December 31, 2024 compared to the three months ended December 31, 2023, primarily due to the sales of the Divested Hospitals. Excluding the impact of these sales, supplies expense increased by $64 million, or 11.9%, during the three months ended December 31, 2024 as compared to the same period in 2023. This increase was primarily due to higher patient
admissions and acuity, partially offset by our cost‑efficiency measures, which include product standardization, contract management, improved utilization, bulk purchases, focused spending and operational improvements, among others.
On a per adjusted admission basis, supplies expense increased by 9.1% in the three months ended December 31, 2024 compared to the three months ended December 31, 2023. Excluding the impact of the sales of the Divested Hospitals, supplies expense per adjusted admission increased 8.1% during the three‑month period in 2024 as compared to the same period in 2023. This increase was primarily attributable to the factors discussed above.
Other operating expenses for our Hospital Operations segment decreased by $141 million, or 13.4%, in the three months ended December 31, 2024 compared to the same period in 2023, primarily due to the sales of the Divested Hospitals. Excluding the effect of these divestitures, other operating expenses increased by $48 million, or 5.5%, during the three‑month period in 2024. The changes in other operating expenses during the three months ended December 31, 2024 included:
•a $25 million increase in medical fees;
•indigent care expense that was $8 million higher;
•a $6 million increase in legal and consulting fees; and
•a decrease of $27 million in malpractice expense.
On a per adjusted admission basis, other operating expenses during the three months ended December 31, 2024 increased by 2.2% compared to the same period in 2023. Excluding the impact of the sales of the Divested Hospitals, other operating expenses per adjusted admission increased by 1.9%.
LIQUIDITY AND CAPITAL RESOURCES OVERVIEW
Cash and cash equivalents were $3.019 billion at December 31, 2024 compared to $4.094 billion at September 30, 2024.
Significant cash flow items in the three months ended December 31, 2024 included:
•Net cash provided by operating activities before interest, taxes, discontinued operations, impairment and restructuring charges, and acquisition‑related costs, and litigation costs and settlements of $962 million;
•Income tax payments totaling $963 million;
•Capital expenditures of $330 million;
•Interest payments of $296 million;
•$185 million of distributions paid to noncontrolling interests; and
•Repayments of advances received from managed care payers totaling $150 million.
Net cash provided by operating activities was $2.047 billion in the year ended December 31, 2024 compared to $2.374 billion in the year ended December 31, 2023. Key factors contributing to the change between 2024 and 2023 included the following:
•An increase in net income before interest, taxes, depreciation and amortization, impairment and restructuring charges, acquisition‑related costs, litigation costs and settlements, loss from early extinguishment of debt, other non-operating income or expense, and net gains on sales, consolidation and deconsolidation of facilities of $454 million;
•Income tax payments that were $1.028 billion higher in 2024 than in 2023;
•Lower interest payments of $31 million; and
•The timing of other working capital items.
SOURCES OF REVENUE FOR OUR HOSPITAL OPERATIONS SEGMENT
We earn revenues for patient services from a variety of sources, primarily managed care payers and the federal Medicare program, as well as state Medicaid programs, indemnity‑based health insurance companies and uninsured patients (that is, patients who do not have health insurance and are not covered by some other form of third‑party arrangement).
The following table presents the sources of net patient service revenues for our hospitals and related outpatient facilities, expressed as percentages of net patient service revenues from all sources on a continuing operations basis:
| | | | | | | | | | | | | | | | | | | | |
| | | Years Ended December 31, |
| | 2024 | | 2023 | | 2022 |
| Medicare | | 15.3 | % | | 16.4 | % | | 17.1 | % |
| Medicaid | | 10.3 | % | | 8.5 | % | | 7.7 | % |
Managed care(1) | | 70.2 | % | | 70.4 | % | | 69.4 | % |
| Uninsured | | 0.5 | % | | 0.6 | % | | 1.0 | % |
| Indemnity and other | | 3.7 | % | | 4.1 | % | | 4.8 | % |
| | | | | | | | |
| | |
| (1) | Includes Medicare and Medicaid managed care programs. |
Our payer mix on an admissions basis for our hospitals, expressed as a percentage of total admissions from all sources on a continuing operations basis, is presented below:
| | | | | | | | | | | | | | | | | | | | |
| | | Years Ended December 31, |
| | 2024 | | 2023 | | 2022 |
| Medicare | | 18.4 | % | | 19.9 | % | | 20.7 | % |
| Medicaid | | 4.6 | % | | 5.0 | % | | 5.4 | % |
Managed care(1) | | 68.9 | % | | 67.3 | % | | 65.8 | % |
| Charity and uninsured | | 4.5 | % | | 4.5 | % | | 4.9 | % |
| Indemnity and other | | 3.6 | % | | 3.3 | % | | 3.2 | % |
| | | | | | | | |
| | |
| (1) | Includes Medicare and Medicaid managed care programs. |
Our hospitals and outpatient facilities are subject to various factors that affect our service mix, revenue mix and patient volumes and, thereby, impact our net patient service revenues and results of operations. These factors include, among others: changes in federal and state statutes, regulations and executive orders that effect the healthcare industry directly or indirectly, particularly those impacting government healthcare funding; changes in general economic conditions, including inflation, whether due to geopolitical conflicts, trade tensions, export control rules, tariffs or other factors; the number of uninsured and underinsured individuals in local communities treated at our hospitals; cybersecurity incidents, including those targeting our vendors, and other unanticipated information technology outages; disease hotspots and seasonal cycles of illness; climate and weather conditions; physician recruitment, satisfaction, retention and attrition; advances in technology and treatments that reduce length of stay or permit procedures to be performed in an outpatient rather than an inpatient setting; local healthcare competitors; utilization pressure by managed care organizations, as well as managed care contract negotiations or terminations; performance data on quality measures and patient satisfaction, as well as pricing for services; any unfavorable publicity about us, or our joint venture partners, that impacts our relationships with physicians and patients; and changing consumer behavior, including with respect to the timing of elective procedures.
GOVERNMENT PROGRAMS
The Centers for Medicare & Medicaid Services (“CMS”) is an agency of the U.S. Department of Health and Human Services (“HHS”) that administers a number of government programs authorized by federal law; it is the single largest payer of healthcare services in the United States. Medicare is a federally funded health insurance program primarily for individuals 65 years of age and older, as well as some younger people with certain disabilities and conditions, and is provided without regard to income or assets. Medicaid is co‑administered by the states and is jointly funded by the federal and state governments. Medicaid is the nation’s main public health insurance program for people with low incomes and is the largest source of health coverage in the United States. The Children’s Health Insurance Program (“CHIP”), which is also co‑administered by the states and jointly funded, provides health coverage to children in families with incomes too high to qualify for Medicaid, but too low to afford private coverage. Unlike Medicaid, the CHIP is limited in duration and requires the enactment of reauthorizing legislation. Funding for the CHIP has been reauthorized through federal fiscal year (“FFY”) 2029.
Potential Changes in Healthcare Policy
The Patient Protection and Affordable Care Act, as amended by the Health Care and Education Reconciliation Act of 2010 (the “Affordable Care Act”), extended health coverage to millions of uninsured legal U.S. residents through a combination of private sector health insurance reforms and public program expansion. The expansion of Medicaid in 40 states (including four of the eight states in which we operate acute care hospitals) and the District of Columbia is currently financed through:
•negative “productivity adjustments” to the annual market basket updates, which began in 2011 and do not expire under current law; and
•reductions to Medicare and Medicaid disproportionate share hospital (“DSH”) payments, which began for Medicare payments in FFY 2014 and, under current law, are scheduled to commence for Medicaid payments on April 1, 2025.
The expansion of health insurance coverage under the Affordable Care Act resulted in an increase in the number of patients using our facilities with either private or public program coverage and a decrease in uninsured and charity care admissions. Although a substantial portion of our patient volumes and, as a result, our revenues has historically been derived from government healthcare programs, reductions to our reimbursement under the Medicare and Medicaid programs as a result of the Affordable Care Act have been partially offset by increased revenues from providing care to previously uninsured individuals.
Over the past several years, various laws and regulations lengthened the enrollment period, expanded income eligibility, and reduced premium caps for subsidies for individuals purchasing Affordable Care Act coverage through state and federal marketplaces – all of which led to increased enrollment numbers, particularly in states that have not expanded Medicaid. Certain of these provisions are set to expire at the end of 2025; if they are not extended, it could result in significant increases in premiums, potentially leading to decreased enrollment and a corresponding rise in the uninsured or a shift of individuals from commercial coverage to government program coverage beginning in 2026. In such a case, we could experience decreased patient volumes, reduced revenues and an increase in uncompensated care, which would adversely affect our results of operations and cash flows. We cannot predict whether or how the new Congress may extend or modify provisions of or relating to the Affordable Care Act or other laws affecting the healthcare industry generally, nor can we predict how the new administration will influence, promulgate or implement rules, regulations or executive orders that affect the healthcare industry directly or indirectly. We may also experience potential impacts on our business, in ways we cannot anticipate, from healthcare‑related policy changes at the state level. Some federal and state changes, initiatives and requirements could, among other things, negatively impact our patient volumes, case mix and revenue mix, increase our operating costs, adversely affect the reimbursement we receive for our services, impact our competitive position or require us to expend resources to modify certain aspects of our operations.
More specifically, we are also unable to predict the effect of future government healthcare funding policy changes on our business. The Medicare and Medicaid programs are subject to:
•statutory and regulatory changes, administrative and judicial rulings, executive orders, interpretations and determinations concerning eligibility requirements, funding levels and the method of calculating reimbursements, among other things;
•requirements for utilization review; and
•federal and state funding restrictions.
Any of these factors could materially increase or decrease payments from these government programs in the future, as well as affect the cost of providing services to our patients and the timing of payments to our facilities. If the rates paid by governmental payers are reduced, if the scope of services covered by governmental payers is limited, if eligibility or enrollment is further restricted, if there are changes to align payment rates for certain procedures across various care settings, or if we or one or more of our hospitals are excluded from participation in the Medicare or Medicaid program or any other government healthcare program, there could be a material adverse effect on our business, financial condition, results of operations or cash flows.
Medicare
Medicare offers its beneficiaries different ways to obtain their medical benefits. One option, the Original Medicare Plan (which includes “Part A” and “Part B”), is a fee‑for‑service (“FFS”) payment system. The other option, called Medicare Advantage (sometimes called “Part C” or “MA Plans”), includes health maintenance organizations (“HMOs”), preferred provider organizations (“PPOs”), private FFS Medicare special needs plans and Medicare medical savings account plans. Our total net patient service revenues from operation of the hospitals and related outpatient facilities in our Hospital Operations
segment for services provided to patients enrolled in the Original Medicare Plan were $2.132 billion, $2.383 billion and $2.369 billion for the years ended December 31, 2024, 2023 and 2022, respectively.
A general description of the types of payments we receive for services provided to patients enrolled in the Original Medicare Plan is provided below. Recent regulatory and legislative updates to the terms of these payment systems and their estimated effect on our revenues can be found under “Recent Regulatory and Legislative Updates” below.
Acute Care Hospital Inpatient Prospective Payment System
Medicare Severity-Adjusted Diagnosis-Related Group Payments—Sections 1886(d) and 1886(g) of the Social Security Act set forth a system of payments for the operating and capital costs of inpatient acute care hospital admissions based on a prospective payment system (“PPS”). Under the inpatient prospective payment systems (“IPPS”), Medicare payments for hospital inpatient operating services are made at predetermined rates for each hospital discharge. Discharges are classified according to a system of Medicare severity‑adjusted diagnosis‑related groups (“MS‑DRGs”), which categorize patients with similar clinical characteristics that are expected to require similar amounts of hospital resources. CMS assigns to each MS‑DRG a relative weight that represents the average resources required to treat cases in that particular MS‑DRG, relative to the average resources used to treat cases in all MS‑DRGs.
The base payment amount for the operating component of the MS‑DRG payment is comprised of an average standardized amount that is divided into a labor‑related share and a nonlabor-related share. Both the labor‑related share of operating base payments and the base payment amount for capital costs are adjusted for geographic variations in labor and capital costs, respectively. Using diagnosis and procedure information submitted by the hospital, CMS assigns to each discharge an MS‑DRG, and the base payments are multiplied by the relative weight of the MS‑DRG assigned. The MS‑DRG operating and capital base rates, relative weights and geographic adjustment factors are updated annually, with consideration given to: the increased cost of goods and services purchased by hospitals; the relative costs associated with each MS‑DRG; changes in labor data by geographic area; and other policies. Although these payments are adjusted for area labor and capital cost differentials, the adjustments do not take into consideration an individual hospital’s operating and capital costs.
Outlier Payments—Outlier payments are additional payments made to hospitals on individual claims for treating Medicare patients whose medical conditions are more costly to treat than those of the average patient in the same MS‑DRG. To qualify for a cost outlier payment, a hospital’s billed charges, adjusted to cost, must exceed the payment rate for the MS‑DRG by a fixed threshold updated annually by CMS. A Medicare Administrative Contractor (“MAC”) calculates the cost of a claim by multiplying the billed charges by an average cost‑to‑charge ratio that is typically based on the hospital’s most recently filed cost report. Generally, if the computed cost exceeds the sum of the MS‑DRG payment plus the fixed threshold, the hospital receives 80% of the difference as an outlier payment.
Under the Social Security Act, CMS must project aggregate annual outlier payments to all PPS hospitals to be not less than 5% or more than 6% of total MS‑DRG payments (“Outlier Percentage”). The Outlier Percentage is determined by dividing total outlier payments by the sum of MS‑DRG and outlier payments. CMS annually adjusts the fixed threshold to bring projected outlier payments within the mandated limit. A change to the fixed threshold affects total outlier payments by changing: (1) the number of cases that qualify for outlier payments; and (2) the dollar amount hospitals receive for those cases that qualify for outlier payments. Under certain conditions, outlier payments are subject to reconciliation based on more recent data.
Disproportionate Share Hospital Payments—In addition to making payments for services provided directly to beneficiaries, Medicare makes additional payments to hospitals that treat a disproportionately high share of low‑income patients. Prior to October 1, 2013, DSH payments were based on each hospital’s low income utilization for each payment year (the “Pre‑ACA DSH Formula”). The Affordable Care Act revised the Medicare DSH adjustment effective for discharges occurring on or after October 1, 2013. Under the revised methodology, hospitals receive 25% of the amount they previously would have received under the Pre‑ACA DSH Formula. This amount is referred to as the “Empirically Justified Amount.”
Hospitals qualifying for the Empirically Justified Amount of DSH payments are also eligible to receive an additional payment for uncompensated care (the “UC‑DSH Amount”). The UC‑DSH Amount is a hospital’s share of a pool of funds that the CMS Office of the Actuary estimates would equal 75% of Medicare DSH that otherwise would have been paid under the Pre‑ACA DSH Formula, adjusted for changes in the percentage of individuals that are uninsured. Generally, the factors used to calculate and distribute UC‑DSH Amounts are set forth in the Affordable Care Act and are not subject to administrative or judicial review. The statute requires that each hospital’s cost of uncompensated care (i.e., charity and bad debt) as a percentage of the total uncompensated care cost of all DSH hospitals be used to allocate the pool. As of December 31, 2024, 40 of our hospitals qualified for Medicare DSH payments.
The statutes and regulations that govern Medicare DSH payments have been the subject of various administrative appeals and lawsuits, and our hospitals have been participating in such appeals, including challenges to the inclusion of the Medicare Advantage (Part C) days used in the DSH calculation as set forth in the Changes to the Hospital Inpatient Prospective Payment Systems and Fiscal Year 2005 Rates. In June 2023, CMS issued a Final Action on the Treatment of Medicare Part C Days in the Calculation of a Hospital’s Medicare Disproportionate Patient Percentage, which finalized CMS’ August 2020 proposed rule to include Medicare Advantage days in the Medicare fraction for all discharges prior to October 1, 2013. CMS expects no associated effect on payments given that prior payments were made in accordance with this policy. We are not able to predict whether CMS’s final action will be the subject of further or new legal challenges nor are we able to predict the outcome of those challenges, if any, or of pending appeals; however, a favorable outcome of our DSH appeals could have a material impact on our future revenues and cash flows.
Direct Graduate and Indirect Medical Education Payments—The Medicare program provides additional reimbursement to approved teaching hospitals for the increased expenses incurred by such institutions. This additional reimbursement, which is subject to certain limits, including intern and resident full-time equivalent (“FTE”) limits, is made in the form of Direct Graduate Medical Education (“DGME”) and Indirect Medical Education (“IME”) payments. As of December 31, 2024, 29 of our hospitals were affiliated with academic institutions and were eligible to receive such payments.
IPPS Quality Adjustments—The Affordable Care Act also authorizes quality adjustments to Medicare IPPS payments under the following programs:
•Value‑Based Purchasing (“VBP”) Program – Under the VBP program, IPPS operating payments to hospitals are reduced by 2% to fund value‑based incentive payments to eligible hospitals based on their overall performance on a set of quality measures;
•Hospital Readmission Reduction Program – Under this program, IPPS operating payments to hospitals with excess readmissions are reduced up to a maximum of 3% of base MS‑DRG payments; and
•Hospital‑Acquired Conditions (“HAC”) Reduction Program – Under this program, overall inpatient payments are reduced by 1% for hospitals in the worst performing quartile of risk‑adjusted quality measures for reasonable preventable hospital‑acquired conditions.
These adjustments, which CMS updates annually and are generally based on a hospital’s performance from prior periods, can have an adverse impact on our IPPS operating payments.
Hospital Outpatient Prospective Payment System
Under the outpatient prospective payment system (“OPPS”), hospital outpatient services, except for certain services that are reimbursed on a separate fee schedule, are classified into groups called ambulatory payment classifications (“APCs”). Services in each APC are similar clinically and in terms of the resources they require, and a payment rate is established for each APC. Depending on the services provided, hospitals may be paid for more than one APC for an encounter. CMS annually updates the APCs and the rates paid for each APC.
Inpatient Psychiatric Facility Prospective Payment System
The inpatient psychiatric facility (“IPF”) prospective payment system (“IPF-PPS”) applies to psychiatric hospitals and psychiatric units located within acute care hospitals that have been designated as exempt from the hospital inpatient prospective payment system. The IPF-PPS is based on prospectively determined per‑diem rates and includes an outlier policy that authorizes additional payments for extraordinarily costly cases.
Inpatient Rehabilitation Prospective Payment System
Rehabilitation hospitals and rehabilitation units in acute care hospitals meeting certain criteria established by CMS are eligible to be paid as an inpatient rehabilitation facility (“IRF”) under the IRF prospective payment system (“IRF‑PPS”). Payments under the IRF‑PPS are made on a per-discharge basis. The IRF‑PPS uses federal prospective payment rates across distinct case‑mix groups established by a patient classification system.
Physician and Other Health Professional Services Payment System
Medicare uses a fee schedule to pay for physician and other health professional services based on a list of services and their payment rates referred to as the Medicare Physician Fee Schedule (“MPFS”). In determining payment rates for each service, CMS considers the amount of clinician work required to provide a service, expenses related to maintaining a practice and professional liability insurance costs. These three factors are adjusted for variation in the input prices in different markets,
and the sum is multiplied by the fee schedule’s conversion factor (average payment amount) to produce a total payment amount.
Cost Reports
The final determination of certain Medicare payments to our hospitals, such as DSH, DGME, IME and bad debt expense, are retrospectively determined based on our hospitals’ cost reports. The final determination of these payments often takes many years to resolve because of audits by the MACs, providers’ rights of appeal, and the application of numerous technical reimbursement provisions.
For filed cost reports, we adjust the accrual for estimated cost report settlements based on those cost reports and subsequent activity, and we consider the necessity of recording a valuation allowance based on historical settlement results. The accrual for estimated cost report settlements for periods for which a cost report is yet to be filed is recorded based on estimates of what we expect to report on the filed cost reports and a corresponding valuation allowance is recorded, if necessary, based on the method previously described. Cost reports must generally be filed within five months after the end of the annual cost report reporting period. After the cost report is filed, the accrual and corresponding valuation allowance may need to be adjusted.
Medicare Claims Reviews
HHS estimates that the overall 2024 Medicare FFS improper payment rate for the program is approximately 7.66%. The 2024 error rate for Hospital IPPS payments is approximately 3.90%. CMS has identified the FFS program as a program at risk for significant erroneous payments, and one of the agency’s stated key goals is to pay claims properly the first time. This means paying the right amount, to legitimate providers, for covered, reasonable and necessary services provided to eligible beneficiaries. According to CMS, paying correctly the first time saves resources required to recover improper payments and ensures the proper expenditure of Medicare Trust Fund dollars. CMS has established several initiatives to prevent or identify improper payments before a claim is paid, and to identify and recover improper payments after paying a claim. The overall goal is to reduce improper payments by identifying and addressing coverage and coding billing errors for all provider types. Under the authority of the Social Security Act, CMS employs a variety of contractors (e.g., MACs, Recovery Audit Contractors and Unified Program Integrity Contractors) to process and review claims according to Medicare rules and regulations.
Claims selected for prepayment review are not subject to the normal Medicare FFS payment timeframe. Furthermore, prepayment and post‑payment claims denials are subject to administrative and judicial review, and we pursue the reversal of adverse determinations where appropriate. We have established robust protocols to respond to claims reviews and payment denials. In addition to overpayments that are not reversed on appeal, we incur additional costs to respond to requests for records and pursue the reversal of payment denials. The degree to which our Medicare FFS claims are subjected to prepayment reviews, the extent to which payments are denied, and our success in overturning denials could have an adverse effect on our cash flows and results of operations.
Meaningful Use of Health Information Technology
The Health Information Technology for Economic and Clinical Health (“HITECH”) Act, which is part of the American Recovery and Reinvestment Act of 2009, promotes the use of healthcare information technology by, among other things, providing financial incentives to hospitals and physicians to become “meaningful users” of electronic health record (“EHR”) systems and imposing penalties on those who do not. Under the HITECH Act and other laws and regulations, eligible hospitals that fail to demonstrate and maintain meaningful use of certified EHR technology and/or submit quality data every year (and have not applied and qualified for a hardship exception) are subject to a reduction of the Medicare market basket update. Eligible healthcare professionals are also subject to positive or negative payment adjustments based, in part, on their use of EHR technology. We continue to invest in the maintenance and utilization of certified EHR systems for our hospitals and employed physicians. Failure to do so could subject us to penalties that may have an adverse effect on our net revenues and results of operations.
Medicaid
Medicaid programs and the corresponding reimbursement methodologies vary from state‑to‑state and from year‑to‑year. Estimated revenues under various state Medicaid programs, including state‑funded Medicaid managed care programs, constituted approximately 20.4%, 19.1% and 19.4% of the total net patient service revenues of our hospitals and related outpatient facilities for the years ended December 31, 2024, 2023 and 2022, respectively. We also receive DSH and other supplemental revenues under various state Medicaid programs. For the years ended December 31, 2024, 2023 and 2022, our total Medicaid revenues attributable to DSH and other supplemental revenues were approximately $1.161 billion, $929 million and $767 million, respectively.
Several states in which we operate continue to face budgetary challenges that have resulted in reduced Medicaid funding levels to hospitals and other providers. Because most states must operate with balanced budgets, and the Medicaid program is generally a significant portion of a state’s budget, states can be expected to adopt or consider adopting future legislation designed to reduce or not increase their Medicaid expenditures. In addition, some states delay issuing Medicaid payments to providers to manage state expenditures. As an alternative means of funding provider payments, many of the states where we operate have adopted supplemental payment programs authorized under the Social Security Act. Continuing pressure on state budgets and other factors, including legislative and regulatory changes, could result in future reductions to Medicaid payments, payment delays or changes to Medicaid supplemental payment programs. Federal government denials or delayed approvals of waiver applications or extension requests by the states where we operate could also materially impact our Medicaid funding levels.
Total Medicaid and Medicaid managed care net patient service revenues recognized by the hospitals and related outpatient facilities in our Hospital Operations segment for the years ended December 31, 2024, 2023 and 2022 were $2.845 billion, $2.776 billion and $2.692 billion, respectively. During the year ended December 31, 2024, Medicaid and Medicaid managed care revenues comprised 50.6% and 49.4%, respectively, of our Medicaid‑related net patient service revenues recognized by the hospitals and related outpatient facilities in our Hospital Operations segment. All Medicaid and Medicaid managed care patient service revenues are presented net of provider taxes or assessments paid by our hospitals.
Because we cannot predict what actions the federal government or the states may take under existing or future legislation and/or regulatory changes to address budget gaps, deficits, Medicaid expansion, Medicaid eligibility redeterminations, provider fee programs, state‑directed payment programs or Medicaid Section 1115 waivers, we are unable to assess the effect that any such legislation or regulatory action might have on our business; however, the impact on our future financial position, results of operations or cash flows could be material.
Recent Regulatory and Legislative Updates
Recent regulatory and legislative updates to the Medicare and Medicaid payment systems, as well as other government programs impacting our business, are provided below.
Payment and Policy Changes to the Medicare Inpatient Prospective Payment Systems—Section 1886(d) of the Social Security Act requires CMS to update Medicare inpatient FFS payment rates for hospitals reimbursed under the IPPS annually. The updates generally become effective October 1, the beginning of the FFY. In August 2024, CMS issued final changes to the Hospital Inpatient Prospective Payment Systems for Acute Care Hospitals and Fiscal Year 2025 Rates (“Final IPPS Rule”). In the Final IPPS Rule, CMS deferred taking immediate action on its low wage index hospital policy in light of the U.S. Court of Appeals for the DC Circuit’s decision in Bridgeport Hospital v. Becerra. In September 2024, CMS issued an interim final action with comment period (“IFC”) to implement revisions to the FFY 2025 Medicare wage index values, establish a transitional payment exception for low wage hospitals, and make conforming changes to the FFY 2025 IPPS payment rates following the court decision. The Final IPPS Rule and IFC include the following payment and policy changes, among others:
•A market basket increase of 3.4% for MS‑DRG operating payments for hospitals reporting specified quality measure data and that are meaningful users of EHR technology; CMS also finalized a 0.5% multifactor productivity reduction required by the Affordable Care Act that results in a net operating payment update of 2.9% before budget neutrality adjustments;
•An increase in the cost outlier threshold from $42,750 to $46,217;
•A 1.65% net increase in the capital federal MS‑DRG rate;
•Updates to the three factors used to determine the amount and distribution of Medicare UC‑DSH Amounts;
•An increase to the performance-based scoring threshold for eligible hospitals and critical access hospitals reporting under the Medicare Promoting Interoperability Program from 60 points to 70 points beginning with the EHR reporting period in calendar year (“CY”) 2025;
•An update to the hospital labor market area delineation based on the Office of Management and Budget Bulletin No. 23-01; and
•Implementation of the Transforming Episode Accountability Model (“TEAM”), which will begin January 1, 2026 and end December 31, 2030 for certain episodic categories. TEAM will be mandatory, with limited exceptions, for all hospitals located within the CMS selected Core-Based Statistical Areas (“CBSAs”). Nine of our acute care hospitals and one surgical hospital are included in the CBSAs.
According to CMS, the combined impact of the payment and policy changes in the Final IPPS Rule and IFC for operating costs will yield an average 2.9% increase in Medicare operating MS‑DRG FFS payments for hospitals in urban areas and an average 3.3% increase in such payments for proprietary hospitals in FFY 2025. We estimate that all of the final payment and policy changes affecting operating MS‑DRG and UC‑DSH Amounts will result in a 2.8% increase in our annual Medicare FFS IPPS payments, which would yield an estimated increase of approximately $36 million in 2025. Because of the uncertainty associated with various factors that may influence our future IPPS payments by individual hospital, including legislative, regulatory or legal actions, admission volumes, length of stay and case mix, we cannot provide any assurances regarding our estimates of the final impact of the payment and policy changes.
Payment and Policy Changes to the Medicare Outpatient Prospective Payment and Ambulatory Surgery Center Payment Systems—In November 2024, CMS released the final policy changes and payment rates for the Hospital Outpatient Prospective Payment System and Ambulatory Surgical Center Payment System for CY 2025 (“Final OPPS/ASC Rule”). The Final OPPS/ASC Rule includes the following payment and policy changes, among others:
•An estimated net increase of 2.9% for the OPPS rates based on a market basket increase of 3.4%, reduced by a multifactor productivity adjustment required by the Affordable Care Act of 0.5%; and
•A 2.9% increase to the Ambulatory Surgical Center payment rates.
CMS projects that the combined impact of the payment and policy changes in the Final OPPS/ASC Rule will yield an average 3.2% increase in Medicare FFS OPPS payments for hospitals in urban areas and an average 4.9% increase in Medicare FFS OPPS payments for proprietary hospitals. The projected CY 2025 impact of the payment and policy changes in the Final OPPS/ASC Rule is an increase to Medicare FFS hospital outpatient revenues of approximately $21 million, or 4.32%, for the facilities in our Hospital Operations segment and $20 million, or 2.87%, for USPI’s ASCs and surgical hospitals. Because of the uncertainty associated with various factors that may influence our future OPPS payments, including legislative or legal actions, volumes and case mix, we cannot provide any assurances regarding our estimates of the impact of the final payment and policy changes.
Final Rule on the Remedy for the 340B-Acquired Drug Payment Policy for Calendar Years 2018-2022—CMS’ 340B program allows certain hospitals (i.e., only nonprofit organizations with specific federal designations and/or funding) (“340B Hospitals”) to purchase drugs at discounted rates from drug manufacturers (“340B Drugs”). In the CY 2018 final rule regarding OPPS payment and policy changes, CMS reduced the payment for 340B Drugs from the average sales price (“ASP”) plus 6% to the ASP minus 22.5% and made a corresponding budget-neutral increase to payments to all hospitals for other drugs and services reimbursed under the OPPS (the “340B Payment Adjustment”). CMS retained the same 340B Payment Adjustment in the final rules regarding OPPS payment and policy changes for CYs 2019 through 2022. Certain hospital associations and hospitals commenced litigation challenging CMS’ authority to impose the 340B Payment Adjustment for CYs 2018, 2019 and 2020. Following the initial court decisions and a series of appeals, the U.S. Supreme Court (the “Supreme Court”) unanimously ruled in June 2022 that the decision to impose the 340B Payment Adjustment in CYs 2018 and 2019 was unlawful, and the case was remanded to the lower courts to determine the appropriate remedy. In response to the Supreme Court’s decision, the final rules regarding OPPS payment and policy changes for CY 2023 affirmed that CMS was now applying the default rate, generally ASP plus 6%, to 340B Drugs and biologicals, and it had removed the 340B Payment Adjustment made in 2018. To address the remediation for the prior years’ underpayments, CMS released the Hospital Outpatient Prospective Payment System: Remedy for 340B-Acquired Drugs Payment Policy for Calendar Years 2018-2022 Final Rule in November 2023. The final rule provides for a one-time lump sum remedy payment to each 340B Hospital that received a cut in 340B Drug payments from 2018 through 2022 (to which CMS will not apply interest). Due to budget neutrality requirements, CMS also implemented a reduction to future non‑drug item and service payments through an adjustment to the OPPS conversion factor by minus 0.5% starting in CY 2026 until the full amount is offset (which CMS estimates will take 16 years). We estimate this adjustment will result in a reduction of less than $10 million annually to our acute care and surgical hospital revenue.
Payment and Policy Changes to the MPFS—In November 2024, CMS released the CY 2025 Medicare Physician Fee Schedule Final Rule (“MPFS Final Rule”). The MPFS Final Rule includes updates to payment policies, payment rates and other provisions for services reimbursed under the MPFS from January 1 through December 31, 2025. Under the MPFS Final Rule, the CY 2025 conversion factor, which is the base rate that is used to convert relative units into payment rates, was reduced from $33.29 to $32.35, a decrease of 2.82%. We estimate the impact of the MPFS Final Rule will result in a reduction of approximately $5 million to our 2025 FFS MPFS revenues. Because of the uncertainty associated with various factors that may influence our future MPFS payments, including legislative, regulatory or legal actions, volumes and case mix, we cannot provide any assurances regarding our estimate of the impact of the final payment and policy changes.
PRIVATE INSURANCE
Managed Care
We currently have thousands of managed care contracts with various HMOs and PPOs. HMOs generally maintain a full‑service healthcare delivery network comprised of physician, hospital, pharmacy and ancillary service providers that HMO members must access through an assigned “primary care” physician. The member’s care is then managed by his or her primary care physician and other network providers in accordance with the HMO’s quality assurance and utilization review guidelines so that appropriate healthcare can be efficiently delivered in the most cost‑effective manner. HMOs typically provide reduced benefits or reimbursement (or none at all) to their members who use non‑contracted healthcare providers for non‑emergency care.
PPOs generally offer limited benefits to members who use non‑contracted healthcare providers. PPO members who use contracted healthcare providers receive a preferred benefit, typically in the form of lower co‑pays, co‑insurance or deductibles. As employers and employees have demanded more choice, managed care plans have developed hybrid products that combine elements of both HMO and PPO plans, including high‑deductible healthcare plans that may have limited benefits, but cost the employee less in premiums.
The amount of our managed care net patient service revenues, including Medicare and Medicaid managed care programs, from our hospitals and related outpatient facilities during the years ended December 31, 2024, 2023 and 2022 was $9.809 billion, $10.248 billion and $9.607 billion, respectively. Our top 10 managed care payers generated 71% of our managed care net patient service revenues for the year ended December 31, 2024. During the same period, national payers generated 48% of our managed care net patient service revenues; the remainder came from regional or local payers. At both December 31, 2024 and 2023, 68% of our Hospital Operations segment’s net accounts receivable were due from managed care payers.
Revenues under managed care plans are based primarily on payment terms involving predetermined rates per diagnosis, per‑diem rates, discounted FFS rates and/or other similar contractual arrangements. These revenues are also subject to review and possible audit by the payers, which can take several years before they are completely resolved. The payers are billed for patient services on an individual patient basis. An individual patient’s bill is subject to adjustment on a patient‑by‑patient basis in the ordinary course of business by the payers following their review and adjudication of each particular bill. We estimate the discounts for contractual allowances at the individual hospital level utilizing billing data on an individual patient basis. At the end of each month, on an individual hospital basis, we estimate our expected reimbursement for patients of managed care plans based on the applicable contract terms. We believe it is reasonably likely for there to be an approximately 3% increase or decrease in the estimated contractual allowances related to managed care plans. Based on reserves at December 31, 2024, a 3% increase or decrease in the estimated contractual allowance would impact the estimated reserves by approximately $29 million. Some of the factors that can contribute to changes in the contractual allowance estimates include: (1) changes in reimbursement levels for procedures, supplies and drugs when threshold levels are triggered; (2) changes in reimbursement levels when stop‑loss or outlier limits are reached; (3) changes in the admission status of a patient due to physician orders subsequent to initial diagnosis or testing; (4) final coding of in‑house and discharged‑not‑final‑billed patients that change reimbursement levels; (5) secondary benefits determined after primary insurance payments; and (6) reclassification of patients among insurance plans with different coverage and payment levels. Contractual allowance estimates are periodically reviewed for accuracy by taking into consideration known contract terms, as well as payment history. We believe our estimation and review process enables us to identify instances on a timely basis where such estimates need to be revised. We do not believe there were any adjustments to estimates of patient bills that were material to our revenues during the years ended December 31, 2024, 2023 or 2022. In addition, on a corporate‑wide basis, we do not record any general provision for adjustments to estimated contractual allowances for managed care plans. Managed care accounts, net of contractual allowances recorded, are further reduced to their net realizable value through implicit price concessions based on historical collection trends for these payers and other factors that affect the estimation process.
In recent years, managed care governmental admissions have increased as a percentage of total managed care admissions. However, in year ended December 31, 2024, admissions growth from commercial managed care plans was greater than the growth in admissions from Medicare and Medicaid managed care programs. Commercial managed care plans typically generate higher yields than managed care governmental insurance plans. In the year ended December 31, 2024, our commercial managed care net inpatient revenue per admission from the hospitals in our Hospital Operations segment was approximately 67% higher than our aggregate yield on a per-admission basis from government payers, including Medicare and Medicaid managed care programs. Although we have benefited from year-over-year aggregate managed care pricing improvements for some time, we have seen these improvements moderate in recent years, and we believe this moderation could continue into the future, subject to incremental pricing improvements to address inflationary pressures.
Indemnity
An indemnity‑based agreement generally requires the insurer to reimburse an insured patient for healthcare expenses after those expenses have been incurred by the patient, subject to policy conditions and exclusions. Unlike an HMO member, a patient with indemnity insurance is free to control his or her utilization of healthcare and selection of healthcare providers.
The No Surprises Act
The No Surprises Act (“NSA”) established federal protections, which became effective on January 1, 2022, against balance billing for patients who obtain medical services from physicians and other providers not chosen by the patient and outside of the patient’s health insurance network. Providers that violate these surprise billing prohibitions may be subject to state enforcement action or federal civil monetary penalties. Among other things, the NSA limits the amount an insured patient will pay for (1) out-of-network emergency care (provided in hospital emergency departments and freestanding emergency facilities), and (2) scheduled out-of-network services (such as radiology, pathology and anesthesiology) at an in-network facility when the patient hasn’t been notified or provided consent. The NSA also prohibits insurers from assigning higher deductibles (and other cost-sharing charges) to patients for out-of-network care than they do for in-network care without patient notification and consent.
Under the NSA, insurers and providers are given the opportunity to resolve disputed out‑of‑network reimbursement through negotiation and an independent dispute resolution (“IDR”) process, unless state law specifies a different approach. The IDR process has been utilized far more than anticipated, and there is currently a backlog of claims pending determination. Moreover, provider groups have been successful in challenging certain IDR-related provisions of the regulations promulgated under the NSA, claiming the regulations unfairly favor insurers in the determination of appropriate reimbursement amounts. We cannot predict the ultimate impact of this or any future litigation nor can we predict any future regulatory changes. In addition, we are unable to fully assess the ultimate impact of the NSA on our business at this time; however, based on our experience to this point, we believe that compliance with the provisions of the NSA will not have a material adverse effect on our financial condition, results of operations or cash flows.
UNINSURED PATIENTS
Uninsured patients are patients who do not qualify for government programs payments, such as Medicare and Medicaid, do not have some form of private insurance and, therefore, are responsible for their own medical bills. A significant number of our uninsured patients are admitted through our hospitals’ emergency departments and often require high‑acuity treatment that is more costly to provide and, therefore, results in higher billings, which are the least collectible of all accounts.
Self‑pay accounts receivable, which include amounts due from uninsured patients, as well as co‑pays, co‑insurance amounts and deductibles owed to us by patients with insurance, pose significant collectability problems. At December 31, 2024 and 2023, 5% and 4%, respectively, of our Hospital Operations segment’s accounts receivable was self‑pay. Further, a significant portion of our implicit price concessions relates to self‑pay amounts. The revenue cycle management services we provide are subject to various statutes and regulations regarding consumer protection in areas including finance, debt collection and credit reporting activities.
We perform systematic analyses to focus our attention on the drivers of implicit price concessions for each hospital. While emergency department use is the primary contributor to our implicit price concessions in the aggregate, this is not the case at all hospitals. As a result, we have increased our focus on targeted initiatives that concentrate on non‑emergency department patients as well. These initiatives are intended to promote process efficiencies in collecting self‑pay accounts, as well as co‑pay, co‑insurance and deductible amounts owed to us by patients with insurance, that we deem highly collectible. We leverage a statistical‑based collections model that aligns our operational capacity to maximize our collections performance. We are dedicated to modifying and refining our processes as needed, enhancing our technology and improving staff training throughout the revenue cycle process in an effort to increase collections and reduce accounts receivable.
Over the longer term, several other initiatives we have previously announced should also help address the challenges associated with serving uninsured patients. For example, our Compact with Uninsured Patients (“Compact”) is designed to offer discounts to certain uninsured patients, which enables us to offer lower rates to those patients who historically had been charged standard gross charges. Under the Compact, the discount offered to uninsured patients is recognized as a contractual allowance, which reduces net operating revenues at the time the self‑pay accounts are recorded. The uninsured patient accounts, net of contractual allowances recorded, are further reduced to their net realizable value through implicit price concessions based on historical collection trends for self‑pay accounts and other factors that affect the estimation process.
We also provide financial assistance through our charity and uninsured discount programs to uninsured patients who are unable to pay for the healthcare services they receive. Our policy is not to pursue collection of amounts determined to qualify for financial assistance; therefore, we do not report these amounts in net operating revenues. Most states include an estimate of the cost of charity care in the determination of a hospital’s eligibility for Medicaid DSH payments. These payments are intended to mitigate our cost of uncompensated care. Some states have also developed provider fee or other supplemental payment programs to mitigate the shortfall of Medicaid reimbursement compared to the cost of caring for Medicaid patients.
The expansion of health insurance coverage under the Affordable Care Act resulted in an increase in the number of patients using our facilities with either private or public program coverage and a decrease in uninsured and charity care admissions, along with reductions in Medicare and Medicaid reimbursement to healthcare providers, including us. However, we continue to provide uninsured discounts and charity care due to the failure of certain states to expand Medicaid coverage and for persons living in the country who are not permitted to enroll in a health insurance exchange or government healthcare insurance program.
The following table presents our estimated costs (based on selected operating expenses, which include salaries, wages and benefits, supplies and other operating expenses) of caring for our uninsured and charity patients:
| | | | | | | | | | | | | | | | | | | | |
| | | Years Ended December 31, |
| | | 2024 | | 2023 | | 2022 |
| Estimated costs for: | | | | | | |
| Uninsured patients | | $ | 535 | | | $ | 499 | | | $ | 537 | |
| Charity care patients | | 82 | | | 110 | | | 83 | |
| Total | | $ | 617 | | | $ | 609 | | | $ | 620 | |
RESULTS OF OPERATIONS FOR THE YEAR ENDED DECEMBER 31, 2024 COMPARED TO THE YEAR ENDED DECEMBER 31, 2023
The following table presents our consolidated net operating revenues, operating expenses and operating income, both in dollar amounts and as percentages of net operating revenues, on a continuing operations basis:
| | | | | | | | | | | | | | | | | |
| | Years Ended December 31, | | Increase
(Decrease) |
| | 2024 | | 2023 | |
| Net operating revenues: | | | | | |
| Hospital Operations | $ | 16,131 | | | $ | 16,683 | | | $ | (552) | |
| Ambulatory Care | 4,534 | | | 3,865 | | | 669 | |
| | | | | |
| | | | | |
| Net operating revenues | 20,665 | | | 20,548 | | | 117 | |
| Grant income | 10 | | | 16 | | | (6) | |
| Equity in earnings of unconsolidated affiliates | 260 | | | 228 | | | 32 | |
| Operating expenses: | | | | | |
| Salaries, wages and benefits | 8,801 | | | 9,146 | | | (345) | |
| Supplies | 3,647 | | | 3,590 | | | 57 | |
| Other operating expenses, net | 4,492 | | | 4,515 | | | (23) | |
| Depreciation and amortization | 818 | | | 870 | | | (52) | |
| Impairment and restructuring charges, and acquisition-related costs | 102 | | | 137 | | | (35) | |
| Litigation and investigation costs | 35 | | | 47 | | | (12) | |
| Net gains on sales, consolidation and deconsolidation of facilities | (2,916) | | | (23) | | | (2,893) | |
| Operating income | $ | 5,956 | | | $ | 2,510 | | | $ | 3,446 | |
| | | | | |
| Net operating revenues | 100.0 | % | | 100.0 | % | | — | % |
| Grant income | — | % | | 0.1 | % | | (0.1) | % |
| Equity in earnings of unconsolidated affiliates | 1.3 | % | | 1.1 | % | | 0.2 | % |
| Operating expenses: | | | | | |
| Salaries, wages and benefits | 42.6 | % | | 44.5 | % | | (1.9) | % |
| Supplies | 17.6 | % | | 17.5 | % | | 0.1 | % |
| Other operating expenses, net | 21.7 | % | | 22.0 | % | | (0.3) | % |
| Depreciation and amortization | 4.0 | % | | 4.2 | % | | (0.2) | % |
| Impairment and restructuring charges, and acquisition-related costs | 0.5 | % | | 0.7 | % | | (0.2) | % |
| Litigation and investigation costs | 0.2 | % | | 0.2 | % | | — | % |
| Net gains on sales, consolidation and deconsolidation of facilities | (14.1) | % | | (0.1) | % | | (14.0) | % |
| Operating income | 28.8 | % | | 12.2 | % | | 16.6 | % |
The following table presents our net operating revenues, operating expenses and operating income, both in dollar amounts and as percentages of net operating revenues, by segment on a continuing operations basis:
| | | | | | | | | | | | | | | | | | | | | | | | | | | |
| Year Ended December 31, 2024 | | Year Ended December 31, 2023 |
| | Hospital Operations | | Ambulatory Care | | | | Hospital Operations | | Ambulatory Care | | |
| Net operating revenues | $ | 16,131 | | | $ | 4,534 | | | | | $ | 16,683 | | | $ | 3,865 | | | |
| Grant income | 10 | | | — | | | | | 15 | | | 1 | | | |
| Equity in earnings of unconsolidated affiliates | 10 | | | 250 | | | | | 10 | | | 218 | | | |
| Operating expenses: | | | | | | | | | | | |
| Salaries, wages and benefits | 7,664 | | | 1,137 | | | | | 8,182 | | | 964 | | | |
| Supplies | 2,460 | | | 1,187 | | | | | 2,545 | | | 1,045 | | | |
| Other operating expenses, net | 3,842 | | | 650 | | | | | 3,984 | | | 531 | | | |
| Depreciation and amortization | 684 | | | 134 | | | | | 750 | | | 120 | | | |
| Impairment and restructuring charges, and acquisition-related costs | 51 | | | 51 | | | | | 78 | | | 59 | | | |
| Litigation and investigation costs | 30 | | | 5 | | | | | 34 | | | 13 | | | |
| Net gains on sales, consolidation and deconsolidation of facilities | (2,803) | | | (113) | | | | | — | | | (23) | | | |
| Operating income | $ | 4,223 | | | $ | 1,733 | | | | | $ | 1,135 | | | $ | 1,375 | | | |
| | | | | | | | | | | |
| Net operating revenues | 100.0 | % | | 100.0 | % | | | | 100.0 | % | | 100.0 | % | | |
| Grant income | 0.1 | % | | — | % | | | | 0.1 | % | | — | % | | |
| Equity in earnings of unconsolidated affiliates | 0.1 | % | | 5.5 | % | | | | 0.1 | % | | 5.6 | % | | |
| Operating expenses: | | | | | | | | | | | |
| Salaries, wages and benefits | 47.5 | % | | 25.1 | % | | | | 49.0 | % | | 25.0 | % | | |
| Supplies | 15.3 | % | | 26.2 | % | | | | 15.3 | % | | 27.0 | % | | |
| Other operating expenses, net | 23.9 | % | | 14.3 | % | | | | 23.9 | % | | 13.7 | % | | |
| Depreciation and amortization | 4.2 | % | | 3.0 | % | | | | 4.5 | % | | 3.1 | % | | |
| Impairment and restructuring charges, and acquisition-related costs | 0.3 | % | | 1.1 | % | | | | 0.5 | % | | 1.5 | % | | |
| Litigation and investigation costs | 0.2 | % | | 0.1 | % | | | | 0.2 | % | | 0.3 | % | | |
| Net gains on sales, consolidation and deconsolidation of facilities | (17.4) | % | | (2.5) | % | | | | — | % | | (0.6) | % | | |
| Operating income | 26.2 | % | | 38.2 | % | | | | 6.8 | % | | 35.6 | % | | |
Consolidated net operating revenues increased by $117 million, or 0.6%, for the year ended December 31, 2024 compared to the year ended December 31, 2023. Our Hospital Operations segment’s net operating revenues decreased by $552 million, or 3.3%, for the year ended December 31, 2024 as compared to 2023. Excluding the impact of the sales of the Divested Hospitals, net operating revenues in our Hospital Operations segment increased $1.127 billion, or 8.1%, during the year ended December 31, 2024 compared to the year ended December 31, 2023. This increase was driven by a more favorable payer mix, higher patient volumes and acuity, growth in our Medicaid supplemental revenue and negotiated commercial rate increases.
During the year ended December 31, 2024, net operating revenues in our Ambulatory Care segment increased by $669 million, or 17.3%, as compared to 2023. This growth was primarily attributable to incremental revenues from newly acquired ASCs, net of the impact of the closure and deconsolidation of certain facilities, increases in net revenue per case and higher patient acuity.
RESULTS OF OPERATIONS BY SEGMENT
Our operations are reported in two segments:
•Hospital Operations, which is comprised of our acute care and specialty hospitals, a network of employed physicians and ancillary outpatient facilities, as well as the revenue cycle management and value-based care services that we provide to hospitals, health systems, physician practices, employers and other clients; and
•Ambulatory Care, which is comprised of USPI’s ASCs and surgical hospitals.
Hospital Operations Segment
The following tables present operating statistics, revenues and expenses of our hospitals and related outpatient facilities on a same‑hospital basis, unless otherwise indicated:
| | | | | | | | | | | | | | | | | | | | | | | |
| | Same-Hospital
Years Ended December 31, | | Increase
(Decrease) |
| Admissions, Patient Days and Surgeries | | 2024 | | 2023 | |
| Number of hospitals | | 47 | | | 47 | | | — | | (1) |
| Total admissions | | 460,541 | | | 439,776 | | | 4.7 | % | |
| Adjusted admissions | | 833,221 | | | 813,060 | | | 2.5 | % | |
| Paying admissions (excludes charity and uninsured) | | 439,671 | | | 419,929 | | | 4.7 | % | |
| Charity and uninsured admissions | | 20,870 | | | 19,847 | | | 5.2 | % | |
| Admissions through emergency department | | 344,300 | | | 330,489 | | | 4.2 | % | |
| Paying admissions as a percentage of total admissions | | 95.5 | % | | 95.5 | % | | — | % | (1) |
| Charity and uninsured admissions as a percentage of total admissions | | 4.5 | % | | 4.5 | % | | — | % | (1) |
| Emergency department admissions as a percentage of total admissions | | 74.8 | % | | 75.1 | % | | (0.3) | % | (1) |
| Surgeries — inpatient | | 118,174 | | | 114,346 | | | 3.3 | % | |
| Surgeries — outpatient | | 154,431 | | | 156,747 | | | (1.5) | % | |
| Total surgeries | | 272,605 | | | 271,093 | | | 0.6 | % | |
| Patient days — total | | 2,297,285 | | | 2,236,682 | | | 2.7 | % | |
| Adjusted patient days | | 4,000,871 | | | 3,967,259 | | | 0.8 | % | |
| Average length of stay (days) | | 4.99 | | | 5.09 | | | (2.0) | % | |
| Licensed beds (at end of period) | | 12,307 | | | 12,324 | | | (0.1) | % | |
| Average licensed beds | | 12,326 | | | 12,313 | | | 0.1 | % | |
| Utilization of licensed beds | | 50.9 | % | | 49.8 | % | | 1.1 | % | (1) |
| | | | | | | | |
| | |
| (1) | The change is the difference between the 2024 and 2023 amounts or percentages presented. |
| |
| |
| | | | | | | | | | | | | | | | | | | | | | | |
| | | Same-Hospital
Years Ended December 31, | | Increase
(Decrease) |
| Outpatient Visits | | 2024 | | 2023 | |
| Total visits | | 4,651,003 | | | 4,637,951 | | | 0.3 | % | |
| Paying visits (excludes charity and uninsured) | | 4,374,736 | | | 4,379,684 | | | (0.1) | % | |
| Charity and uninsured visits | | 276,267 | | | 258,267 | | | 7.0 | % | |
| Emergency department visits | | 1,832,042 | | | 1,826,373 | | | 0.3 | % | |
| Surgery visits | | 154,431 | | | 156,747 | | | (1.5) | % | |
| Paying visits as a percentage of total visits | | 94.1 | % | | 94.4 | % | | (0.3) | % | (1) |
| Charity and uninsured visits as a percentage of total visits | | 5.9 | % | | 5.6 | % | | 0.3 | % | (1) |
| | | | | | | | |
| | |
| (1) | The change is the difference between the 2024 and 2023 percentages presented. |
| | | | | | | | | | | | | | | | | | | | |
| | | Same-Hospital
Years Ended December 31, | | Increase
(Decrease) |
| Revenues | | 2024 | | 2023 | |
| Total segment net operating revenues | | $ | 14,913 | | | $ | 13,926 | | | 7.1 | % |
| Selected revenue data – hospitals and related outpatient facilities: | | | | | | |
| Net patient service revenues | | $ | 12,829 | | | $ | 11,968 | | | 7.2 | % |
| Net patient service revenue per adjusted admission | | $ | 15,397 | | | $ | 14,720 | | | 4.6 | % |
| Net patient service revenue per adjusted patient day | | $ | 3,207 | | | $ | 3,017 | | | 6.3 | % |
| | | | | | | | | | | | | | | | | | | | | |
| | | Same-Hospital
Years Ended December 31, | | Increase
(Decrease) |
| Selected Operating Expenses | | 2024 | | 2023 | |
| Salaries, wages and benefits | | $ | 7,086 | | | $ | 6,885 | | | 2.9 | % | |
| Supplies | | 2,260 | | | 2,101 | | | 7.6 | % | |
| Other operating expenses | | 3,487 | | | 3,277 | | | 6.4 | % | |
| | $ | 12,833 | | | $ | 12,263 | | | 4.6 | % | |
| | | | | | | | | | | | | | | | | | | | | | | |
| | | Same-Hospital
Years Ended December 31, | | Increase (Decrease) (1) |
| Selected Operating Expenses as a Percentage of Net Operating Revenues | | 2024 | | 2023 | |
| Salaries, wages and benefits | | 47.5 | % | | 49.4 | % | | (1.9) | % |
| Supplies | | 15.2 | % | | 15.1 | % | | 0.1 | % |
| Other operating expenses | | 23.4 | % | | 23.5 | % | | (0.1) | % |
| | | | | | | | |
| | |
| (1) | The change is the difference between the 2024 and 2023 percentages presented. |
Revenues
Same‑hospital net operating revenues increased by $987 million, or 7.1%, during the year ended December 31, 2024 compared to the previous year. This increase was attributable to the positive impact of a more favorable payer mix, higher patient volume and acuity, growth in our Medicaid supplemental revenue, and negotiated commercial rate increases.
The following table presents our consolidated net accounts receivable by payer:
| | | | | | | | | | | | | | |
| | December 31, |
| | | 2024 | | 2023 |
| Medicare | | $ | 113 | | | $ | 151 | |
| Medicaid | | 65 | | | 61 | |
| Net cost report settlements receivable and valuation allowances | | 6 | | | 47 | |
| Managed care | | 1,390 | | | 1,667 | |
| Self-pay uninsured | | 29 | | | 35 | |
| Self-pay balance after insurance | | 69 | | | 71 | |
| Estimated future recoveries | | 144 | | | 148 | |
| Other payers | | 235 | | | 281 | |
| Total Hospital Operations | | 2,051 | | | 2,461 | |
| Ambulatory Care | | 485 | | | 453 | |
| | | | |
| Accounts receivable, net | | $ | 2,536 | | | $ | 2,914 | |
Our accounts receivable days outstanding (“AR Days”) were 49.4 days and 55.4 days at December 31, 2024 and 2023, respectively. AR Days are calculated as our accounts receivable on the last date in the quarter divided by our net operating revenues for the quarter ended on that date divided by the number of days in the quarter. This calculation includes our Hospital Operations segment’s contract assets and excludes our California provider fee revenues and activity related to our divested facilities.
The collection of accounts receivable is a key area of focus for our business. At December 31, 2024 and 2023, our Hospital Operations segment collection rate on self‑pay accounts was approximately 28% and 30%, respectively. Our self‑pay collection rate includes payments made by patients, including co‑pays, co‑insurance amounts and deductibles paid by patients with insurance. Based on our accounts receivable from uninsured patients and co‑pays, co‑insurance amounts and deductibles owed to us by patients with insurance at December 31, 2024, a 10% decrease or increase in our self‑pay collection rate, equivalent to a fluctuation of approximately 3 percentage points in the collection rate, which we believe could be a reasonably likely change, would result in an unfavorable or favorable adjustment to patient accounts receivable of approximately $10 million.
We also typically experience ongoing managed care payment delays and disputes; however, we continue to work with these payers to obtain adequate and timely reimbursement for our services. Our estimated Hospital Operations segment collection rate from managed care payers was approximately 96% and 97% at December 31, 2024 and 2023, respectively.
Various factors can influence collection trends, including changes in the economy and inflation, which in turn impact unemployment rates and the number of uninsured and underinsured patients. Additional variables include the volume of patients through our emergency departments, the increased burden of co-pays and deductibles to be made by patients with insurance, successful cyberattacks against us or the third-party systems we interact with, and business practices related to collection efforts. These factors are dynamic and can affect collection trends and our estimation processes.
We manage our implicit price concessions using hospital‑specific goals and benchmarks such as (1) total cash collections, (2) point‑of‑service cash collections, (3) AR Days and (4) accounts receivable by aging category. The following table presents the approximate aging by payer of our net accounts receivable of our Hospital Operations segment of $2.045 billion and $2.414 billion at December 31, 2024 and 2023, respectively. Cost report settlements receivable, net of payables and related valuation allowances, of $6 million and $47 million at December 31, 2024 and 2023, respectively, are excluded from the table.
| | | | | | | | | | | | | | | | | | | | | | | | | | | | | |
| |
| Medicare | | Medicaid | | Managed
Care | | Indemnity,
Self-Pay
and Other | | Total |
| At December 31, 2024: | | | | | | | | | |
| 0-60 days | 93 | % | | 51 | % | | 62 | % | | 22 | % | | 55 | % |
| 61-120 days | 4 | % | | 22 | % | | 18 | % | | 15 | % | | 17 | % |
| 121-180 days | 1 | % | | 11 | % | | 9 | % | | 8 | % | | 9 | % |
| Over 180 days | 2 | % | | 16 | % | | 11 | % | | 55 | % | | 19 | % |
Total | 100 | % | | 100 | % | | 100 | % | | 100 | % | | 100 | % |
| | | | | | | | | |
| At December 31, 2023: | | | | | | | | | |
| 0-60 days | 93 | % | | 46 | % | | 58 | % | | 23 | % | | 54 | % |
| 61-120 days | 5 | % | | 23 | % | | 16 | % | | 14 | % | | 15 | % |
| 121-180 days | 1 | % | | 13 | % | | 9 | % | | 7 | % | | 8 | % |
| Over 180 days | 1 | % | | 18 | % | | 17 | % | | 56 | % | | 23 | % |
Total | 100 | % | | 100 | % | | 100 | % | | 100 | % | | 100 | % |
We continue to implement revenue cycle initiatives intended to improve our cash flow. These initiatives are focused on standardizing and improving patient access processes, including pre‑registration, registration, verification of eligibility and benefits, liability identification and collections at point‑of‑service, and financial counseling. These initiatives are intended to reduce denials, improve service levels to patients and increase the quality of accounts that end up in accounts receivable. Although we continue to focus on improving our methodology for evaluating the collectability of our accounts receivable, we may incur future charges if there are unfavorable changes in the trends affecting the net realizable value of our accounts receivable.
Patient advocates from our Eligibility and Enrollment Services program (“EES”) screen patients in the hospital to determine whether those patients meet eligibility requirements for financial assistance programs. They also expedite the process of applying for these government programs. Receivables from patients who are potentially eligible for Medicaid are classified as Medicaid pending, under the EES, net of appropriate implicit price concessions. Based on recent trends, approximately 97% of all accounts in the EES are ultimately approved for benefits under a government program, such as Medicaid.
The following table presents the approximate amount of accounts receivable in the EES still awaiting determination of eligibility under a government program by aging category:
| | | | | | | | | | | |
| December 31, |
| | 2024 | | 2023 |
| 0-60 days | $ | 104 | | | $ | 103 | |
| 61-120 days | 41 | | | 33 | |
| 121-180 days | 25 | | | 9 | |
| Over 180 days | 40 | | | 16 | |
Total | $ | 210 | | | $ | 161 | |
Salaries, Wages and Benefits
Same‑hospital salaries, wages and benefits expense increased by $201 million, or 2.9%, in the year ended December 31, 2024 compared to the same period in 2023. This change was primarily attributable to annual merit increases for certain of our employees, as well as increases in employee benefits costs, incentive compensation expense, and recruiting and retention costs. These impacts were partially offset by lower contract labor and premium pay. As a percentage of net operating revenues, same‑hospital salaries, wages and benefits decreased by 190 basis points to 47.5% in the year ended December 31, 2024 compared to the year ended December 31, 2023. Salaries, wages and benefits expense for the years ended December 31, 2024 and 2023 included stock‑based compensation expense of $61 million and $46 million, respectively.
Supplies
Same‑hospital supplies expense increased by $159 million, or 7.6%, in the year ended December 31, 2024 compared to 2023. This increase was driven by higher patient volumes and acuity, as well as the impact of general market conditions on the cost of medical supplies during 2024, partially offset by the cost‑efficiency measures discussed below. Same‑hospital supplies expense as a percentage of net operating revenues increased by 10 basis points to 15.2% in the year ended December 31, 2024 compared to the year ended December 31, 2023.
We strive to control supplies expense through product standardization, consistent contract terms and end‑to‑end contract management, improved utilization, bulk purchases, focused spending with a smaller number of vendors and operational improvements. The items of current cost‑reduction focus include surgical devices, cardiovascular and orthopedic implants, and high‑cost pharmaceuticals.
Other Operating Expenses, Net
Same‑hospital other operating expenses increased by $210 million, or 6.4%, in the year ended December 31, 2024 compared to 2023. The changes in other operating expenses during the year ended December 31, 2024 included:
•an $86 million increase in medical fees;
•repair and maintenance costs that were $21 million higher;
•gains recognized during the 2023 period that were $19 million higher than in the 2024 period;
•a $19 million increase in indigent care costs; and
•$45 million less in malpractice expense.
Same‑hospital other operating expenses as a percentage of net operating revenues decreased by 10 basis points to 23.4% for the year December 31, 2024 compared to 23.5% for the year ended December 31, 2023. Same‑hospital other operating expenses for our Hospital Operations segment included $214 million and $220 million of lease expense for the years ended December 31, 2024 and 2023, respectively.
Ambulatory Care Segment
Our Ambulatory Care segment is comprised of USPI’s ASCs and surgical hospitals. USPI operates its surgical facilities in partnership with local physicians and, in many of these facilities, a health system partner. In most cases, we hold ownership interests in the facilities and operate them through separate legal entities. USPI operates facilities on a day‑to‑day basis through management services contracts. Our sources of earnings from each facility consist of:
•management and administrative services revenues from the facilities USPI operates through management services contracts, usually computed as a percentage of each facility’s net revenues; and
•our share of each facility’s net income (loss), which is computed by multiplying the facility’s net income (loss) times the percentage of each facility’s equity interests owned by USPI.
Our role as an owner and day‑to‑day manager provides us with significant influence over the operations of each facility. For many of the facilities our Ambulatory Care segment holds an ownership interest in (161 of 543 facilities at December 31, 2024), this influence does not represent control of the facility, so we account for our investment in each of these facilities under the equity method for an unconsolidated affiliate. USPI controls 382 of the facilities our Ambulatory Care segment operates, and we account for these investments as consolidated subsidiaries. Our net earnings from a facility are the same whether it is consolidated or unconsolidated, but the classification of those earnings differs. For consolidated subsidiaries, our financial statements reflect 100% of the revenues and expenses of the subsidiaries. The net profit attributable to owners other than USPI is classified within net income available (loss attributable) to noncontrolling interests.
For unconsolidated affiliates, our statements of operations reflect our earnings in two line items:
•equity in earnings of unconsolidated affiliates—our share of the net income (loss) of each facility, which is based on the facility’s net income (loss) and the percentage of the facility’s outstanding equity interests owned by USPI; and
•management and administrative services revenues, which is included in our net operating revenues—income we earn in exchange for managing the day‑to‑day operations of each facility, usually computed as a percentage of each facility’s net revenues.
The following table presents selected revenue and expense information for our Ambulatory Care segment:
| | | | | | | | | | | | | | | | | | | | |
| | | Years Ended December 31, | | Increase
(Decrease) |
| | 2024 | | 2023 | |
| Net operating revenues | | $ | 4,534 | | | $ | 3,865 | | | 17.3 | % |
| Grant income | | $ | — | | | $ | 1 | | | (100.0) | % |
| Equity in earnings of unconsolidated affiliates | | $ | 250 | | | $ | 218 | | | 14.7 | % |
| Salaries, wages and benefits | | $ | 1,137 | | | $ | 964 | | | 17.9 | % |
| Supplies | | $ | 1,187 | | | $ | 1,045 | | | 13.6 | % |
| Other operating expenses, net | | $ | 650 | | | $ | 531 | | | 22.4 | % |
Revenues
Our Ambulatory Care net operating revenues increased by $669 million, or 17.3%, during the year ended December 31, 2024 compared to 2023. The change was driven by (1) a $447 million increase from 2023 and 2024 acquisitions and purchases of controlling interests, partially offset by the impact of the sale or closure of certain facilities, and (2) a $222 million increase in same‑facility net operating revenues, which was attributable to improved case volume, incremental revenue from new service lines and negotiated commercial rate increases.
Salaries, Wages and Benefits
Salaries, wages and benefits expense increased by $173 million, or 17.9%, during the year ended December 31, 2024 compared to 2023. This change was driven by a $140 million increase from 2023 and 2024 acquisitions and purchases of controlling interests, partially offset by the impact of the sale or closure of certain facilities. A $33 million increase in same‑facility salaries, wages and benefits expense, due primarily to higher surgical case volumes, also contributed to the increase. Salaries, wages and benefits expense as a percentage of net operating revenues increased by 10 basis points from 25.0% in the year ended December 31, 2023 to 25.1% in the year ended December 31, 2024. Salaries, wages and benefits expense included stock‑based compensation expense of $6 million and $20 million in 2024 and 2023, respectively.
Supplies
Supplies expense increased by $142 million, or 13.6%, during the year ended December 31, 2024 compared to 2023. The change was driven by $78 million increase from 2023 and 2024 acquisitions and purchases of controlling interests, partially offset by the impact of the sale or closure of certain facilities. An increase of $64 million in same‑facility supplies expense, due primarily to an increase in surgical cases at our consolidated centers and higher pricing of certain supplies as a result of the impact of general market conditions and inflation, also contributed to this change. Supplies expense as a percentage of net operating revenues decreased by 80 basis points from 27.0% in the year ended December 31, 2023 to 26.2% in the year ended December 31, 2024.
Other Operating Expenses, Net
Other operating expenses increased by $119 million, or 22.4%, during the year ended December 31, 2024 compared to 2023. The change was primarily driven by (1) an $82 million increase from 2023 and 2024 acquisitions and purchases of controlling interests, partially offset by the impact of the sale or closure of certain facilities, and (2) a $37 million increase in same-facility other operating costs. Other operating expenses as a percentage of net operating revenues increased from 13.7% for the year ended December 31, 2023 to 14.3% for 2024. Other operating expenses for our Ambulatory Care segment included $159 million and $130 million of lease expense for the years ended December 31, 2024 and 2023, respectively.
Facility Growth
The following table presents the year-over-year changes in our revenue and cases on a same‑facility systemwide basis:
| | | | | | | | | | | |
| | | Year Ended December 31, 2024 |
| Net revenues | | | 7.8 | % |
| Cases | | | 0.3 | % |
| Net revenue per case | | | 7.4 | % |
Facility Acquisitions and Investment
The table below presents the aggregate amounts we paid to acquire various ownership interests in ambulatory care facilities:
| | | | | | | | | | | | | | | | |
| | | Years Ended December 31, | | |
| | 2024 | | 2023 | |
| Purchases of controlling interests | | $ | 553 | | | $ | 149 | | | |
| Purchases of noncontrolling interests | | 1 | | | 2 | | | |
| Equity investment in unconsolidated affiliates and consolidated facilities that did not result in a change of control | | 25 | | | 21 | | | |
| | $ | 579 | | | $ | 172 | | | |
The table below reflects the change in the number of facilities operated by our Ambulatory Care segment since December 31, 2023:
| | | | | | | | | | | |
| | | Year Ended December 31, 2024 |
| | | |
| | | |
| | | |
| | | |
| | | |
| Acquisitions | | | 55 | |
| De novo | | | 14 | |
| Dispositions/Mergers | | | (22) |
| Net increase in number of facilities operated | | 47 | |
During the year ended December 31, 2024, we acquired controlling ownership interests in 52 ASCs, as well as noncontrolling ownership interests in two ASCs and one surgical hospital. Prior to these transactions, we did not have a prior investment in these facilities. In addition, we acquired controlling ownership interests in seven previously unconsolidated ASCs. We paid an aggregate of $554 million to acquire all of the aforementioned ownership interests during the year ended December 31, 2024.
We also regularly engage in the purchase of equity interests with respect to our investments in unconsolidated affiliates and consolidated facilities that do not result in a change in control. These transactions are primarily the acquisitions of equity interests in ASCs and the investment of additional cash in facilities that need capital for new acquisitions, new construction or other business growth opportunities. During the year ended December 31, 2024, we invested approximately $25 million in such transactions.
Consolidated
Impairment and Restructuring Charges, and Acquisition-Related Costs
The following table presents information about our impairment and restructuring charges, and acquisition‑related costs:
| | | | | | | | | | | | | | |
| | Years Ended December 31, |
| | 2024 | | 2023 |
| Consolidated: | | | | |
| Impairment charges | | $ | 7 | | | $ | 43 | |
| Restructuring charges | | 56 | | | 79 | |
| Acquisition-related costs | | 39 | | | 15 | |
| Total impairment and restructuring charges, and acquisition-related costs | | $ | 102 | | | $ | 137 | |
| | | | |
| By segment: | | | | |
| Hospital Operations | | $ | 51 | | | $ | 78 | |
| Ambulatory Care | | 51 | | | 59 | |
| | | | |
| Total impairment and restructuring charges, and acquisition-related costs | | $ | 102 | | | $ | 137 | |
During the year ended December 31, 2024, restructuring charges consisted of $17 million of legal costs related to the sale of certain businesses, $12 million of contract and lease termination fees, $11 million of employee severance costs, $9 million related to the transition of various administrative functions to our Global Business Center (“GBC”) in the Philippines and $7 million of other restructuring costs. Impairment charges for the year ended December 31, 2024 primarily related to the write-down of certain intangible assets held by our Ambulatory Care segment to their estimated fair value.
Restructuring charges for the year ended December 31, 2023 consisted of $36 million of legal costs related to the sale of certain businesses, $15 million of employee severance costs, $12 million related to the transition of various administrative functions to our GBC, $10 million of contract and lease termination fees, and $6 million of other restructuring costs. Impairment charges for the year ended December 31, 2023 were comprised of $42 million from our Ambulatory Care segment, primarily associated with the write‑down of certain equity method investments held by that segment, and $1 million from our Hospital Operations segment.
Acquisition‑related costs during both 2024 and 2023 consisted entirely of transaction costs.
Our impairment tests presume stable, improving or, in some cases, declining operating results in our facilities, which are based on programs and initiatives being implemented that are designed to achieve each facility’s most recent projections. If these projections are not met, or negative trends occur that impact our future outlook, future impairments of long-lived assets and goodwill may occur, and we may incur additional restructuring charges, which could be material.
Litigation and Investigation Costs
Litigation and investigation costs for the years ended December 31, 2024 and 2023 were $35 million and $47 million, respectively. See Note 17 to the accompanying Consolidated Financial Statements for additional information.
Net Gains on Sales, Consolidation and Deconsolidation of Facilities
We recorded gains from the sale, consolidation and deconsolidation of facilities totaling $2.916 billion during the year ended December 31, 2024. Activity during 2024 primarily consisted of aggregate gains recognized from the sales of the Divested Hospitals, as well as facilities sold, consolidated and deconsolidated by our Ambulatory Care segment.
We recognized a net gain of $23 million from the sale, consolidation and deconsolidation of facilities during the year ended December 31, 2023, which primarily arose from the consolidation of facilities by our Ambulatory Care segment.
Interest Expense
Interest expense declined from $901 million in the year ended December 31, 2023 to $826 million in the year ended December 31, 2024. This decrease was primarily driven by the debt extinguishments described below.
Loss from Early Extinguishment of Debt
During the year ended December 31, 2024, we recorded losses of $8 million related to the redemption of our 2026 Senior Secured First Lien Notes in advance of the notes’ maturity date. This loss derived from the write-off of unamortized issuance costs associated with these notes.
We recorded losses from the early extinguishment of debt totaling $11 million during the year ended December 31, 2023. These losses related to the redemption of all of the outstanding principal of our 4.625% senior secured first lien notes due July 2024 and our 4.625% senior secured first lien notes due September 2024, in each case in advance of the notes’ maturity dates, and derived from differences between the redemption price and the par value of the respective notes, as well as the write‑off of associated unamortized issuance costs.
Income Tax Expense
During the year ended December 31, 2024, we recorded income tax expense of $1.184 billion on pre‑tax income of $5.248 billion compared to income tax expense of $306 million on pre‑tax income of $1.617 billion during the year ended December 31, 2023.
A reconciliation between the amount of reported income tax expense and the amount computed by multiplying income before income taxes by the statutory federal tax rate is presented below:
| | | | | | | | | | | |
| | Years Ended December 31, |
| | 2024 | | 2023 |
| Tax expense at statutory federal rate of 21% | $ | 1,102 | | | $ | 340 | |
| State income taxes, net of federal income tax benefit | 288 | | | 70 | |
| | | |
| Tax benefit attributable to noncontrolling interests | (181) | | | (147) | |
| Nondeductible goodwill | 161 | | | — | |
| Nondeductible executive compensation | 7 | | | 6 | |
| Impact of change in state filing method, net of change in unrecognized tax benefit | — | | | (20) | |
| | | |
| | | |
| | | |
| | | |
| Stock-based compensation tax benefit | (9) | | | (2) | |
| Changes in valuation allowance | (182) | | | 71 | |
| Prior-year provision to return adjustments and other changes in deferred taxes | (1) | | | (9) | |
| Other items | (1) | | | (3) | |
| Income tax expense | $ | 1,184 | | | $ | 306 | |
During the year ended December 31, 2024, the valuation allowance decreased by $90 million, including a decrease of $180 million primarily for utilization of interest expense carryforwards due to gains from sales of facilities, an increase of $92 million due to an acquisition, and a decrease of $2 million due to changes in the expected realizability of deferred tax assets. The balance in the valuation allowance as of December 31, 2024 was $158 million. During the year ended December 31, 2023, the valuation allowance increased by $71 million, including an increase of $73 million due to limitations on the tax deductibility of interest expense, and a decrease of $2 million due to changes in the expected realizability of deferred tax assets. The balance in the valuation allowance as of December 31, 2023 was $248 million.
Net Income Available to Noncontrolling Interests
Net income available to noncontrolling interests consisted of the following during the periods indicated:
| | | | | | | | | | | | | | |
| | Years Ended December 31, |
| | 2024 | | 2023 |
| Hospital Operations | | $ | 150 | | | $ | 114 | |
| Ambulatory Care | | 714 | | | 586 | |
| Total net income available to noncontrolling interests | | $ | 864 | | | $ | 700 | |
ADDITIONAL SUPPLEMENTAL NON-GAAP DISCLOSURES
As noted in the introduction to MD&A, we use certain non‑GAAP financial measures, including Adjusted EBITDA, in this report and in communications with investors, analysts, rating agencies, banks and others to assist such parties in understanding the impact of various items on our financial statements. We believe Adjusted EBITDA is useful to investors and analysts because it presents additional information about our financial performance. Investors, analysts, company management and our board of directors utilize this non‑GAAP measure, in addition to GAAP measures, to track our financial and operating performance and compare that performance to peer companies, which utilize similar non‑GAAP measures in their presentations. The human resources committee of our board of directors also uses certain non‑GAAP measures to evaluate management’s performance for the purpose of determining incentive compensation. We believe that Adjusted EBITDA is a useful measure, in part, because certain investors and analysts use both historical and projected Adjusted EBITDA, in addition to GAAP and other non‑GAAP measures, as factors in determining the estimated fair value of shares of our common stock. Company management also regularly reviews the Adjusted EBITDA performance for each reporting segment. We do not use Adjusted EBITDA to measure liquidity, but instead to measure operating performance. The non‑GAAP Adjusted EBITDA measure we utilize may not be comparable to similarly titled measures reported by other companies. Because this measure excludes many items that are included in our financial statements, it does not provide a complete measure of our operating performance. Accordingly, investors are encouraged to use GAAP measures when evaluating our financial performance.
The following table presents the reconciliation of Adjusted EBITDA to net income available to Tenet Healthcare Corporation common shareholders (the most comparable GAAP term):
| | | | | | | | | | | | | | | | |
| | Years Ended December 31, |
| | 2024 | | 2023 | | |
| Net income available to Tenet Healthcare Corporation common shareholders | | $ | 3,200 | | | $ | 611 | | | |
| Less: | | | | | | |
| Net income available to noncontrolling interests | | (864) | | | (700) | | | |
| | | | | | |
| Net income | | 4,064 | | | 1,311 | | | |
| Income tax expense | | (1,184) | | | (306) | | | |
| Loss from early extinguishment of debt | | (8) | | | (11) | | | |
| Other non-operating income, net | | 126 | | | 19 | | | |
| Interest expense | | (826) | | | (901) | | | |
| Operating income | | 5,956 | | | 2,510 | | | |
| Litigation and investigation costs | | (35) | | | (47) | | | |
| Net gains on sales, consolidation and deconsolidation of facilities | | 2,916 | | | 23 | | | |
| Impairment and restructuring charges, and acquisition-related costs | | (102) | | | (137) | | | |
| Depreciation and amortization | | (818) | | | (870) | | | |
| | | | | | |
| Adjusted EBITDA | | $ | 3,995 | | | $ | 3,541 | | | |
| | | | | | |
| Net operating revenues | | $ | 20,665 | | | $ | 20,548 | | | |
| | | | | | |
| | | | | | |
| | | | | | |
| Net income available to Tenet Healthcare Corporation common shareholders as a % of net operating revenues | | 15.5 | % | | 3.0 | % | | |
| | | | | | |
| Adjusted EBITDA as a % of net operating revenues (Adjusted EBITDA margin) | | 19.3 | % | | 17.2 | % | | |
RESULTS OF OPERATIONS FOR THE YEAR ENDED DECEMBER 31, 2023 COMPARED TO THE YEAR ENDED DECEMBER 31, 2022
A discussion of our results of operations for the year ended December 31, 2023 compared to the year ended December 31, 2022 can be found in our Annual Report on Form 10-K for the year ended December 31, 2023.
LIQUIDITY AND CAPITAL RESOURCES
CASH REQUIREMENTS
Scheduled Contractual Obligations
Our obligations to make future cash payments under scheduled contractual obligations are summarized in the table below, all as of December 31, 2024. Other than with respect to the repayment of long-term debt, we expect to use net cash generated from operating activities or cash on hand to satisfy the below obligations. We also have the ability to use borrowings under our Credit Agreement. Long‑term debt maturities may be refinanced or repaid using net cash generated from operating activities or from the proceeds from sales of facilities.
| | | | | | | | | | | | | | | | | | | | | | | | | | | | | | | | | | | | | | | | | |
| | Total | | Years Ended December 31, | | Thereafter |
| | | 2025 | | 2026 | | 2027 | | 2028 | | 2029 | |
| | (In Millions) |
Long-term debt(1) | $ | 16,066 | | | $ | 756 | | | $ | 754 | | | $ | 3,701 | | | $ | 3,659 | | | $ | 1,744 | | | $ | 5,452 | |
Finance lease obligations(1) | 815 | | | 63 | | | 38 | | | 116 | | | 26 | | | 25 | | | 547 | |
| Long-term non-cancelable operating lease obligations | 1,392 | | | 261 | | | 230 | | | 203 | | | 168 | | | 133 | | | 397 | |
| | | | | | | | | | | | | |
| | | | | | | | | | | | | |
| | | | | | | | | | | | | |
| Academic teaching services | 420 | | | 70 | | | 70 | | | 70 | | | 70 | | | 70 | | | 70 | |
| | | | | | | | | | | | | |
| Defined benefit plan obligations | 435 | | | 24 | | | 24 | | | 23 | | | 23 | | | 22 | | | 319 | |
| Information technology services contracts | 918 | | | 232 | | | 216 | | | 154 | | | 120 | | | 118 | | | 78 | |
| Purchase orders | 404 | | | 404 | | | — | | | — | | | — | | | — | | | — | |
| Total | $ | 20,450 | | | $ | 1,810 | | | $ | 1,332 | | | $ | 4,267 | | | $ | 4,066 | | | $ | 2,112 | | | $ | 6,863 | |
| | | | | | | | |
| | |
| (1) | Amounts include both principal and interest. |
Long-term Debt—Our Credit Agreement, which has a scheduled maturity date of March 16, 2027, provides for revolving loans in an aggregate principal amount of up to $1.500 billion with a $200 million subfacility for standby letters of credit. Our borrowing availability is based on a specified percentage of eligible inventory and accounts receivable. At December 31, 2024, we had no cash borrowings outstanding under the Credit Agreement, and we had less than $1 million of standby letters of credit outstanding.
At December 31, 2024, we had outstanding senior unsecured notes and senior secured notes with an aggregate principal balance of $12.662 billion, the maturity dates of which are staggered from 2027 through 2031. In March 2024, we redeemed all $2.100 billion aggregate principal amount outstanding of our 2026 Senior Secured First Lien Notes in advance of their maturity date. We paid $2.100 billion using cash on hand to redeem the notes. In connection with the redemption, we recorded a loss from early extinguishment of debt of $8 million in the three months ended March 31, 2024, primarily related to the write-off of associated unamortized issuance costs.
At December 31, 2024, using the last 12 months of Adjusted EBITDA, our ratio of total long‑term debt, net of cash and cash equivalent balances, to Adjusted EBITDA was 2.54x. We anticipate this ratio will fluctuate from quarter to quarter based on earnings performance, the timing of tax payments and other factors, which could include the potential use of our Credit Agreement as a source of liquidity or the entry into acquisitions that involve the assumption of long‑term debt. We seek to manage this ratio and increase the efficiency of our balance sheet by effectively managing our cost and capital structures. To that end, we continue to evaluate opportunities to retire, purchase, redeem and refinance outstanding debt subject to prevailing market conditions, our liquidity requirements, operating results, contractual restrictions and other factors. Our ability to manage our leverage and capital structure is subject to numerous risks and uncertainties, many of which are described in the Forward‑Looking Statements and Risk Factors sections in Part I of this report.
Interest payments, net of capitalized interest, were $851 million, $882 million and $848 million in the years ended December 31, 2024, 2023 and 2022, respectively. For the year ending December 31, 2025, we expect annual interest payments to be approximately $770 million to $780 million.
Future maturities of our long-term debt obligations are summarized in the table above. See Note 8 to the accompanying Consolidated Financial Statements for additional information about our long‑term debt obligations.
Lease Obligations—We have operating lease agreements primarily for real estate, including off‑campus outpatient facilities, medical office buildings, and corporate and other administrative offices, as well as for medical office equipment. Our finance leases are primarily for medical equipment and information technology and telecommunications assets. As of December 31, 2024, we had fixed payment obligations of $1.598 billion under non‑cancellable lease agreements. Future payments due in connection with our operating and finance leases, including imputed interest, are summarized in the table above. Additional information about our lease commitments is provided in Note 7 to the accompanying Consolidated Financial Statements.
Academic Teaching Services—We enter into contracts for academic teaching services with university and physician groups to support graduate medical education. These agreements contain various rights and termination provisions.
Defined Benefit Plan Obligations—We maintain three frozen, non‑qualified defined benefit plans that provide supplemental retirement benefits to certain of our current and former executives. These plans are unfunded, and plan obligations are paid from our working capital. We also maintain a frozen, qualified defined benefit plan for certain of our current and former employees in Detroit. See Note 10 to the accompanying Consolidated Financial Statements for additional information about our defined benefit plans.
Information Technology Services Contracts—We enter into various non‑cancellable contracts for information technology services and licenses as a normal part of our business. These contracts generally relate to information technology infrastructure support and services, software licenses for certain operational and administrative systems, and cybersecurity‑related software and services.
Purchase Orders—We had outstanding short‑term purchase commitments of $404 million at December 31, 2024, which we expect to pay within 12 months.
Other Contractual Obligations
Asset Retirement Obligations—Asset retirement obligations represent the estimated costs to perform environmental remediation work, which we are legally obligated to complete, at certain of our facilities upon their retirement. This work could include asbestos abatement, the removal of underground storage tanks and other similar activities. At December 31, 2024, the
undiscounted aggregate future estimated payments related to these obligations was $206 million. We are unable to predict the timing of these payments due to the uncertainty and long timeframes inherent in these obligations.
Standby Letters of Credit—Standby letters of credit are required principally by our insurers and various states to collateralize our workers’ compensation programs pursuant to statutory requirements and as security to collateralize the deductible and self‑insured retentions under certain of our professional and general liability insurance programs. The amount of collateral required is primarily dependent upon the level of claims activity and our creditworthiness. The insurers require the collateral in case we are unable to meet our obligations to claimants within the deductible or self‑insured retention layers.
We have a letter of credit facility (as amended to date, the “LC Facility”) that provides for the issuance, from time to time, of standby and documentary letters of credit in an aggregate principal amount of up to $200 million. Drawings under any letter of credit issued under the LC Facility accrue interest if not reimbursed within three business days. At December 31, 2024, we had $106 million of standby letters of credit outstanding under the LC Facility. The timing of reimbursement payments is uncertain, as we cannot foresee when, or if, a standby letter of credit will be drawn upon.
Guarantees—Our guarantees include minimum revenue guarantees, primarily related to physicians under relocation agreements and physician groups that provide services at our hospitals, as well as operating lease guarantees. At December 31, 2024, the maximum potential amount of future payments under these guarantees was $303 million, of which $213 million were recorded in the accompanying Consolidated Balance Sheet at December 31, 2024. The timing and amount of future payments under these guarantees is uncertain.
Professional and General Liability Obligations—At December 31, 2024, the current and long‑term professional and general liability reserves included in our Consolidated Balance Sheet were $238 million and $900 million, respectively, and the current and long‑term workers’ compensation reserves included in our Consolidated Balance Sheet were $28 million and $96 million, respectively. The timing of professional and general liability payments is uncertain as such payments depend on several factors, including the nature of claims and when they are received.
Baylor Note Payable—We entered into an agreement in June 2022 to purchase the 5% voting ownership interest in USPI that Baylor University Medical Center (“Baylor”) held at that time. Under the share purchase agreement, we are obligated to make non-interest-bearing monthly payments of approximately $11 million through June 2025. At December 31, 2024, we had a liability of $68 million recorded in other current liabilities in the accompanying Consolidated Balance Sheet for the remaining obligation.
Other than the obligations described above, we had no off‑balance sheet arrangements that may have a current or future material effect on our financial condition, revenues or expenses, results of operations, liquidity, capital expenditures or capital resources at December 31, 2024.
Other Cash Requirements
Capital Expenditures—Our capital expenditures primarily relate to the expansion and renovation of existing facilities (including amounts to comply with applicable laws and regulations), surgical hospital expansion focused on higher acuity services, equipment and information systems additions and replacements, introduction of new medical technologies (including robotics), design and construction of new facilities, and various other capital improvements. We continue to implement our portfolio diversification strategy into ambulatory surgery and have a baseline intention to invest at least $250 million annually in ambulatory business acquisitions and de novo facilities. Capital expenditures were $931 million, $751 million and $762 million in the years ended December 31, 2024, 2023 and 2022, respectively. We anticipate that our capital expenditures for the year ending December 31, 2025 will total approximately $700 million to $800 million, including $127 million that was accrued as a liability at December 31, 2024.
In July 2024, we opened the newly constructed, 92‑bed Westover Hills Baptist Hospital in San Antonio. In addition, we continued construction in 2024 on a new medical campus located in Port St. Lucie, which will include the 54‑bed Florida Coast Surgical Hospital, as well as medical office space. We expect to complete construction in late 2025, and we estimate total costs will amount to $191 million over the project period.
By the beginning of 2030, all hospitals in California providing acute care services must meet standards that are intended to ensure that they remain intact and capable of continued operation following an earthquake. We began analyzing the nonstructural performance category (“NPC”) seismic requirements for our hospitals in California in 2022 and completed the analysis in 2023. This analysis, which identified the NPC work required to be completed in future years to bring our hospitals in
compliance with the building requirements by the 2030 deadline, was submitted to the State for review at the end of 2023. Since that time, we have sold six California hospitals.
We have initiated the design phase for the structural performance category improvements required by the 2030 deadline. These efforts will be specific to each facility and will involve material testing activities. The results of this engineering and architectural work, in combination with the previously identified NPC requirements, will inform our budgeting and planning processes. At this time, we are unable to estimate the cost of this work.
Income Taxes—Income tax payments, net of tax refunds, were $1.271 billion and $243 million in the years ended December 31, 2024 and 2023, respectively. Of the income tax payments made during the year ended December 31, 2024, $855 million was attributable to income tax obligations arising from our sales of the Divested Hospitals. At December 31, 2024, our carryforwards available to offset future taxable income consisted of: (1) federal net operating loss (“NOL”) carryforwards of approximately $260 million pre‑tax, $139 million of which expires in 2026 to 2037 and $121 million of which has no expiration date, for which the associated deferred tax benefit net of valuation allowance is $2 million; (2) capital loss carryforwards of $8 million, which have no deferred tax benefit net of valuation allowance; and (3) state NOL carryforwards of approximately $3.299 billion expiring in 2025 through 2044 for which the associated deferred tax benefit, net of valuation allowance and federal tax impact, is $23 million.
Most of the federal net operating loss carryforwards and capital loss carryforwards are subject to separate return limitation year restrictions under the Internal Revenue Code and may be utilized only to offset taxable income of certain entities. Our ability to utilize NOL carryforwards to reduce future taxable income may be limited under Section 382 of the Internal Revenue Code if certain ownership changes in our company occur during a rolling three‑year period. These ownership changes include purchases of common stock under share repurchase programs, the offering of stock by us, the purchase or sale of our stock by 5% shareholders, as defined in the Treasury regulations, or the issuance or exercise of rights to acquire our stock. If such ownership changes by 5% shareholders result in aggregate increases that exceed 50 percentage points during the three‑year period, then Section 382 imposes an annual limitation on the amount of our taxable income that may be offset by the NOL carryforwards or tax credit carryforwards at the time of ownership change.
Periodic examinations of our tax returns by the IRS or other taxing authorities could result in the payment of additional taxes. The IRS has completed audits of our tax returns for all tax years ended on or before December 31, 2007. All disputed issues with respect to these audits have been resolved and all related tax assessments (including interest) have been paid. Our tax returns for years ended after December 31, 2007 and USPI’s tax returns for years ended after December 31, 2020 remain subject to audit by the IRS.
The Inflation Reduction Act of 2022 (the “Tax Act”) was enacted in August 2022. Among other things, the Tax Act implemented a corporate alternative minimum tax (“CAMT”) of 15% on book income of certain large corporations, a 1% excise tax on net stock repurchases and several tax incentives to promote clean energy. The provision pertaining to an excise tax on corporate stock repurchases imposes a nondeductible 1% excise tax on publicly traded corporations for the net value of certain stock that any such corporation repurchases. The value of the repurchases subject to the tax is reduced by the value of any stock the corporation issued during the tax year, including stock issued or provided to employees. The CAMT imposes a minimum tax on net income adjusted for certain items prescribed by the Tax Act. Both the CAMT and the excise tax provisions of the Tax Act are effective for tax years beginning after December 31, 2022. We expect to be subject to the CAMT; however, we currently do not expect any material impact.
SOURCES AND USES OF CASH
Our liquidity for the year ended December 31, 2024 was primarily derived from net cash provided by operating activities, cash on hand and proceeds received from the sales of the Divested Hospitals. Our primary source of operating cash is the collection of accounts receivable. As such, our operating cash flow is impacted by levels of cash collections, as well as levels of implicit price concessions, due to shifts in payer mix and other factors. Our Credit Agreement provides additional liquidity to manage fluctuations in operating cash caused by these factors. We had $3.019 billion of cash and cash equivalents on hand at December 31, 2024 to fund our operations and capital expenditures, as well as funds available under our Credit Agreement.
Net cash provided by operating activities was $2.047 billion in the year ended December 31, 2024 compared to $2.374 billion in the year ended December 31, 2023. Key factors contributing to the change between 2024 and 2023 included the following:
•An increase in net income before interest, taxes, depreciation and amortization, impairment and restructuring charges, acquisition‑related costs, litigation costs and settlements, loss from early extinguishment of debt, other non-operating income or expense, and net gains on sales, consolidation and deconsolidation of facilities of $454 million;
•Income tax payments that were $1.028 billion higher in 2024 than in 2023;
•Lower interest payments of $31 million; and
•The timing of other working capital items.
Net cash provided by investing activities was $3.429 billion for the year ended December 31, 2024 as compared to net cash used of $969 million for the year ended December 31, 2023. Cash received from the sales of facilities and other assets was $4.910 billion higher during the 2024 period, primarily consisting of proceeds from the sales of the Divested Hospitals. These cash receipts were partially offset by increased payments of $347 million for purchases of businesses or joint venture interests, primarily due to our Ambulatory Care segment’s acquisition activity, and increased capital expenditures of $180 million during the year ended December 31, 2024.
Net cash used in financing activities was $3.685 billion and $1.035 billion in the years ended December 31, 2024 and 2023, respectively. The primary factors contributing to the change between the 2024 and 2023 periods were: (1) the 2023 period included proceeds from the issuance of $1.350 billion aggregate principal amount of our 6.750% senior secured first lien notes due May 2031; (2) higher long-term debt payments of $701 million during the year ended December 31, 2024, including the redemption of all $2.100 billion aggregate principal amount then outstanding of our 2026 Senior Secured First Lien Notes; (3) payments totaling $672 million to repurchase 5,595 thousand shares of our common stock under our share repurchase programs during the 2024 period; and (4) the receipt of advances, net of repayments, totaling $32 million from managed care payers during the year ended December 31, 2024.
We record our equity securities and our debt securities classified as available‑for‑sale at fair market value. The majority of our investments are valued based on quoted market prices or other observable inputs. We have no investments that we expect will be negatively affected by the current economic conditions and materially impact our financial condition, results of operations or cash flows.
DEBT INSTRUMENTS, GUARANTEES AND RELATED COVENANTS
Credit Agreement—At December 31, 2024, our Credit Agreement provided for revolving loans in an aggregate principal amount of up to $1.500 billion with a $200 million subfacility for standby letters of credit. At December 31, 2024, we had no cash borrowings outstanding under the Credit Agreement, and we had less than $1 million of standby letters of credit outstanding. Based on our eligible receivables and inventory, $1.327 billion was available for borrowing under the Credit Agreement at December 31, 2024. The difference between the maximum available revolving loans under the Credit Agreement and the actual borrowing capacity as of December 31, 2024 is due to a reduction in eligible receivables and inventory following the sales of the SC Hospitals, OCLA CA Hospitals and Central CA Hospitals. We were in compliance with all covenants and conditions in our Credit Agreement at December 31, 2024.
Letter of Credit Facility—Our LC Facility provides for the issuance, from time to time, of standby and documentary letters of credit in an aggregate principal amount of up to $200 million. At December 31, 2024, we were in compliance with all covenants and conditions in the LC Facility, and we had $106 million of standby letters of credit outstanding thereunder.
Senior Unsecured Notes and Senior Secured Notes—A detailed discussion of our debt transactions during the year ended December 31, 2024 is provided under the Cash Requirements subsection above. In aggregate, we recognized a loss from the early extinguishment of debt of $8 million in the year ended December 31, 2024 related to the redemption of our 2026 Senior Secured First Lien Notes in advance of their maturity date. This loss derived from the write-off of unamortized issuance costs associated with these notes.
LIQUIDITY
From time to time, we expect to engage in additional capital markets, bank credit and other financing activities depending on our needs and financing alternatives available at that time. We believe our existing debt agreements provide flexibility for future secured or unsecured borrowings.
Our cash on hand fluctuates day‑to‑day throughout the year based on the timing and levels of routine cash receipts and disbursements, including our book overdrafts, and required cash disbursements, such as interest payments and income tax payments. These fluctuations can result in material intra-quarter net operating and investing uses of cash that have caused, and in the future may cause, us to use our Credit Agreement as a source of liquidity. We believe that existing cash and cash equivalents on hand, borrowing availability under our Credit Agreement and anticipated future cash provided by our operating activities are adequate to meet our current cash needs. These sources of liquidity, in combination with any potential future debt incurrence, are adequate to finance planned capital expenditures, payments on the current portion of our long-term debt, payments to current and former joint venture partners, including those related to our share purchase agreement with Baylor, and other presently known operating needs.
Long-term liquidity for debt service and other purposes will be dependent on the amount of cash provided by operating activities and, subject to favorable market and other conditions, the successful completion of future borrowings and potential refinancings. However, our cash requirements could be materially affected by the use of cash in acquisitions of businesses, repurchases of securities, the exercise of put rights or other exit options by our joint venture partners, and contractual or regulatory commitments to fund capital expenditures in, or intercompany borrowings to, businesses we own. In addition, liquidity could be adversely affected should there be a deterioration in our results of operations, including our ability to generate sufficient cash from operations, as well as by the various risks and uncertainties discussed in this section and the Risk Factors section in Part I of this report, including changes in federal and state statutes, regulations and executive orders that effect the healthcare industry directly or indirectly, particularly those impacting government healthcare funding, and significant costs associated with legal proceedings and government investigations.
We have not relied on commercial paper or other short-term financing arrangements or entered into repurchase agreements or other short-term financing arrangements not otherwise reported in our balance sheet. In addition, we do not have significant exposure to floating interest rates given that all of our current long-term indebtedness has fixed rates of interest except for borrowings, if any, under our Credit Agreement.
RECENTLY ISSUED ACCOUNTING STANDARDS
See Note 24 to the accompanying Consolidated Financial Statements for a discussion of recently issued and recently adopted accounting standards.
CRITICAL ACCOUNTING ESTIMATES
In preparing our Consolidated Financial Statements in conformity with GAAP, we must use estimates and assumptions that affect the amounts reported in our Consolidated Financial Statements and accompanying notes. We regularly evaluate the accounting policies and estimates we use. In general, we base the estimates on historical experience and on assumptions that we believe to be reasonable, given the particular circumstances in which we operate. Actual results may vary from those estimates.
We consider our critical accounting estimates to be those that (1) involve significant judgments and uncertainties, (2) require estimates that are more difficult for management to determine, and (3) may produce materially different outcomes under different conditions or when using different assumptions.
Our critical accounting estimates cover the following areas:
•Recognition of net operating revenues, including contractual allowances and implicit price concessions;
•Accruals for general and professional liability risks;
•Impairment of long‑lived assets;
•Impairment of goodwill; and
•Accounting for income taxes.
REVENUE RECOGNITION
We report net patient service revenues at the amounts that reflect the consideration we expect to be entitled to in exchange for providing patient care. These amounts are due from patients, third‑party payers (including managed care payers and government programs) and others, and they include variable consideration for retroactive revenue adjustments due to settlement of audits, reviews and investigations. Generally, we bill our patients and third‑party payers several days after the services are performed or shortly after discharge. Revenues are recognized as performance obligations are satisfied.
We determine performance obligations based on the nature of the services we provide. We recognize revenues for performance obligations satisfied over time based on actual charges incurred in relation to total expected charges. We believe that this method provides a faithful depiction of the transfer of services over the term of performance obligations based on the inputs needed to satisfy the obligations. Generally, performance obligations satisfied over time relate to patients in our hospitals receiving inpatient acute care services. We measure performance obligations from admission to the point when there are no further services required for the patient, which is generally the time of discharge. We recognize revenues for performance obligations satisfied at a point in time, which generally relate to patients receiving outpatient services, when (1) services are provided, and (2) we do not believe the patient requires additional services.
We determine the transaction price based on gross charges for services provided, reduced by contractual adjustments recognized for third‑party payers, discounts provided to uninsured patients in accordance with our Compact, and estimated implicit price concessions related primarily to uninsured patients. We determine our estimates of contractual adjustments and discounts based on contractual agreements, our discount policies and historical experience. We determine our estimate of implicit price concessions based on our historical collection experience using a portfolio approach as a practical expedient to account for patient contracts as collective groups rather than individually. The financial statement effects of using this practical expedient are not materially different from an individual contract approach.
The final determination of certain FFS Medicare and Medicaid program payments to our hospitals, such as DSH, DGME, IME and bad debt expense reimbursement, are retrospectively determined based on our hospitals’ cost reports. The final determination of these payments often takes many years to resolve because of audits by the program representatives, providers’ rights of appeal, and the application of numerous technical reimbursement provisions. We therefore record accruals to reflect the expected final settlements on our cost reports. For filed cost reports, we adjust the accrual for estimated cost report settlements based on those cost reports and subsequent activity, and we consider the necessity of recording a valuation allowance based on historical settlement results. The accrual for estimated cost report settlements for periods for which a cost report is yet to be filed is recorded based on estimates of what we expect to report on the filed cost reports, and a corresponding valuation allowance is recorded, if necessary, based on the method previously described. Cost reports must generally be filed within five months after the end of the annual cost report reporting period. After the cost report is filed, the accrual and corresponding valuation allowance may need to be adjusted. In addition, because the laws, regulations, instructions and rule interpretations governing Medicare and Medicaid reimbursement are complex and change frequently, the estimates we record could change by material amounts.
Revenues under managed care plans are based primarily on payment terms involving predetermined rates per diagnosis, per‑diem rates, discounted FFS rates and/or other similar contractual arrangements. These revenues are also subject to review and possible audit by the payers, which can take several years before they are completely resolved. The payers are billed for patient services on an individual patient basis. An individual patient’s bill is subject to adjustment on a patient‑by‑patient basis in the ordinary course of business by the payers following their review and adjudication of each particular bill. We estimate the discounts for contractual allowances at the individual hospital level utilizing billing data on an individual patient basis. At the end of each month, on an individual hospital basis, we estimate our expected reimbursement for patients of managed care plans based on the applicable contract terms. We believe it is reasonably likely for there to be an approximately 3% increase or decrease in the estimated contractual allowances related to managed care plans. Based on reserves at December 31, 2024, a 3% increase or decrease in the estimated contractual allowance would impact the estimated reserves by approximately $29 million. Some of the factors that can contribute to changes in the contractual allowance estimates include: (1) changes in reimbursement levels for procedures, supplies and drugs when threshold levels are triggered; (2) changes in reimbursement levels when stop‑loss or outlier limits are reached; (3) changes in the admission status of a patient due to physician orders subsequent to initial diagnosis or testing; (4) final coding of in‑house and discharged‑not‑final‑billed patients that change reimbursement levels; (5) secondary benefits determined after primary insurance payments; and (6) reclassification of patients among insurance plans with different coverage and payment levels. Contractual allowance estimates are periodically reviewed for accuracy by taking into consideration known contract terms, as well as payment history. We believe our estimation and review process enables us to identify instances on a timely basis where such estimates need to be revised. We do not believe there were any adjustments to estimates of patient bills that were material to our revenues during the year ended December 31, 2024. In addition, on a corporate‑wide basis, we do not record any general provision for adjustments to estimated contractual allowances for managed care plans. Managed care accounts, net of contractual allowances recorded, are further reduced to their net realizable value through implicit price concessions based on historical collection trends for these payers and other factors that affect the estimation process.
Generally, patients who are covered by third‑party payers are responsible for related co‑pays, co‑insurance and deductibles, which vary in amount. We also provide services to uninsured patients and offer uninsured patients a discount from standard charges. We estimate the transaction price for patients with co‑pays, co‑insurance and deductibles and for those who are uninsured based on historical collection experience and current market conditions. Under our Compact and other uninsured
discount programs, the discount offered to certain uninsured patients is recognized as a contractual allowance, which reduces net operating revenues at the time the self‑pay accounts are recorded. The uninsured patient accounts, net of contractual allowances recorded, are further reduced to their net realizable value at the time they are recorded through implicit price concessions based on historical collection trends for self‑pay accounts and other factors that affect the estimation process.
We record implicit price concessions, primarily related to uninsured patients and patients with co‑pays, co‑insurance and deductibles. The implicit price concessions included in estimating the transaction price represent the difference between amounts billed to patients and the amounts we expect to collect based on our collection history with similar patients. Although outcomes vary, our policy is to attempt to collect amounts due from patients, including co‑pays, co‑insurance and deductibles due from patients with insurance, at the time of service while complying with all federal and state statutes and regulations, including, but not limited to, the Emergency Medical Treatment and Active Labor Act (“EMTALA”). Generally, as required by EMTALA, patients may not be denied emergency treatment due to inability to pay. Therefore, services, including the legally required medical screening examination and stabilization of the patient, are performed without delaying to obtain insurance information. In non‑emergency circumstances or for elective procedures and services, it is our policy to verify insurance prior to a patient being treated; however, there are various exceptions that can occur. Such exceptions can include, for example, instances where (1) we are unable to obtain verification because the patient’s insurance company was unable to be reached or contacted, (2) a determination is made that a patient may be eligible for benefits under various government programs, such as Medicaid or Victims of Crime, and it takes several days or weeks before qualification for such benefits is confirmed or denied, and (3) under physician orders we provide services to patients that require immediate treatment.
Based on our accounts receivable from uninsured patients and co-pays, co-insurance amounts and deductibles owed to us by patients with insurance at December 31, 2024, a 10% increase or decrease in our self‑pay collection rate, equivalent to a fluctuation of approximately 3 percentage points in the collection rate, which we believe could be a reasonably likely change, would result in a favorable or unfavorable adjustment to patient accounts receivable of approximately $10 million.
ACCRUALS FOR GENERAL AND PROFESSIONAL LIABILITY RISKS
We accrue for estimated professional and general liability claims, to the extent not covered by insurance, when they are probable and can be reasonably estimated. We maintain reserves, which are based on modeled estimates for the portion of our professional liability risks, including incurred but not reported claims, to the extent we do not have insurance coverage. Our liability consists of estimates established based upon calculations using several factors, including the number of expected claims, estimates of losses for these claims based on recent and historical settlement amounts, estimates of incurred but not reported claims based on historical experience and the timing of historical payments. We consider the number of expected claims and average cost per claim to be the most significant assumptions in estimating accruals for general and professional liabilities. Our liabilities are adjusted for new claims information in the period such information becomes known. Malpractice expense is recorded within other operating expenses in our consolidated statements of operations.
Our estimated reserves for professional and general liability claims will change significantly if future trends differ from projected trends. We believe it is reasonably likely for there to be a 500‑basis point increase or decrease in our frequency or severity trend. Based on our reserves and other information at December 31, 2024, a 500‑basis point increase in our frequency trend would increase the estimated reserves by $58 million, and a 500‑basis point decrease in our frequency trend would decrease the estimated reserves by $45 million. A 500‑basis point increase in our severity trend would increase the estimated reserves by $190 million, and a 500‑basis point decrease in our severity trend would decrease the estimated reserves by $144 million. In addition, because of the complexity of the claims, the extended period of time to settle the claims and the wide range of potential outcomes, our ultimate liability for professional and general liability claims could change materially from our current estimates.
The table below shows the case reserves and incurred but not reported and loss development reserves:
| | | | | | | | | | | | | |
| December 31, |
| 2024 | | 2023 | | |
| Case reserves | $ | 319 | | | $ | 270 | | | |
| Incurred but not reported and loss development reserves | 819 | | | 776 | | | |
| Total reserves | $ | 1,138 | | | $ | 1,046 | | | |
Several actuarial methods, including the incurred, paid loss development and Bornhuetter‑Ferguson methods, are applied to our historical loss data to produce estimates of ultimate expected losses and the resulting incurred but not reported and loss development reserves. These methods use our specific historical claims data related to paid losses and loss adjustment expenses, historical and current case reserves, reported and closed claim counts, and a variety of hospital census information.
These analyses are considered in our determination of our estimate of the professional liability claims, including the incurred but not reported and loss development reserve estimates. The determination of our estimates involves subjective judgment and could result in material changes to our estimates in future periods if our actual experience is materially different than our assumptions.
Malpractice claims generally take up to five years to settle from the time of the initial reporting of the occurrence to the settlement payment. Accordingly, the percentage of reserves at December 31, 2024 and 2023 representing unsettled claims was approximately 98% and 99%, respectively.
The following table presents the amount of our accruals for professional and general liability claims and the corresponding activity therein:
| | | | | | | | | | | | | |
| Years Ended December 31, |
| 2024 | | 2023 | | |
| Accrual for professional and general liability claims, beginning of the year | $ | 1,046 | | | $ | 1,045 | | | |
| Less losses recoverable from re-insurance and excess insurance carriers | (24) | | | (47) | | | |
Expense related to(1): | | | | | |
| Current year | 271 | | | 232 | | | |
| Prior years | 24 | | | 116 | | | |
| Total incurred loss and loss expense | 295 | | | 348 | | | |
| Paid claims and expenses related to: | | | | | |
| Current year | (8) | | | (6) | | | |
| Prior years | (195) | | | (318) | | | |
| Total paid claims and expenses | (203) | | | (324) | | | |
| Plus losses recoverable from re-insurance and excess insurance carriers | 24 | | | 24 | | | |
| Accrual for professional and general liability claims, end of year | $ | 1,138 | | | $ | 1,046 | | | |
(1)Total malpractice expense, including premiums for insured coverage and recoveries from third parties, was $309 million and $369 million in the years ended December 31, 2024 and 2023, respectively.
IMPAIRMENT OF LONG-LIVED ASSETS
We evaluate our long‑lived assets for possible impairment annually or whenever events or changes in circumstances indicate that the carrying amount of an asset group may not be recoverable from estimated future undiscounted cash flows (“UDCF”). If the estimated future UDCF are less than the carrying value of the asset group, we calculate the amount of an impairment charge only if the carrying value of the asset group exceeds the fair value. For purposes of impairment testing, all asset groups are evaluated at a level below that of the reporting unit, and their carrying values do not include any allocations of goodwill. The fair values of assets are estimated based on third‑party appraisals, established market values of comparable assets or internally developed estimates of future net cash flows expected to result from the use and ultimate disposition of those assets. The estimates of these future net cash flows are based on assumptions and projections we believe to be reasonable and supportable. Estimates require our subjective judgments and take into account assumptions about revenue and expense growth rates, operating margins and recoverable disposition values, based on industry and operating factors. These assumptions may vary by type of asset group and presume stable, improving or, in some cases, declining results, depending on their circumstances. If the presumed level of performance does not occur as expected, impairment may result.
We report long‑lived assets to be disposed of at the lower of their carrying amounts or fair values less costs to sell. In such circumstances, our estimates of fair value are based on third‑party appraisals, established market prices for comparable assets or internally developed estimates of future net cash flows.
Fair value estimates can change by material amounts in subsequent periods. Many factors and assumptions can impact the estimates, including the following risks:
•future financial results, which can be impacted by: volumes of insured patients and declines in commercial managed care patients; terms of managed care payer arrangements; healthcare policy changes; our ability to collect amounts due from uninsured and managed care payers; loss of volumes as a result of competition; physician recruitment and retention; and our ability to manage costs, such as labor costs, which can be adversely impacted by labor shortages, inflationary pressure on wages, minimum wage increases and labor union activity;
•changes in payments from governmental healthcare programs and in government regulations, such as reductions to Medicare and Medicaid payment rates resulting from government legislation or rule‑making or from budgetary challenges of states where we operate;
•how the facilities are operated in the future;
•the impact of future technological advancements on our business;
•the nature of the ultimate disposition of the assets; and
•macro-economic conditions, such as inflation and gross domestic product (GDP) growth.
During the years ended December 31, 2024, 2023 and 2022, we recorded impairment charges totaling $7 million, $43 million and $94 million, respectively. We recognized impairment charges related to our Hospital Operations segment of $1 million in both of the years ended December 31, 2024 and 2023, and $88 million in the year ended December 31, 2022. During the years ended December 31, 2024, 2023 and 2022, impairment charges totaling $6 million, $42 million and $6 million, respectively, related to our Ambulatory Care segment. Impairment charges during the year ended December 31, 2024 primarily related to the write-down of certain intangible assets held by our Ambulatory Care segment to their estimated fair value. Impairment charges during the year ended December 31, 2023 were primarily related to the write‑down of our investment in certain equity method investments held by our Ambulatory Care segment. During the year ended December 31, 2022, $82 million of the total charges were related to the impairment of certain buildings and medical equipment located in one of our markets.
IMPAIRMENT OF GOODWILL
Goodwill represents the excess of purchase price over the net estimated fair value of identifiable assets acquired and liabilities assumed in a business combination. Goodwill is determined to have an indefinite useful life and is not amortized, but is instead subject to impairment tests performed at least annually, or when events occur that would more likely than not reduce the fair value of the reporting unit below its carrying amount. For goodwill, we assess qualitative factors to determine whether it is more likely than not that the fair value of a reporting unit is less than its carrying amount. Further testing is required only if we determine, based on the qualitative assessment, that it is more likely than not that a reporting unit’s fair value is less than its carrying value. Otherwise, no further impairment testing is required. If we determine the carrying value of goodwill is impaired, or if the carrying value of a business that is to be sold or otherwise disposed of exceeds its fair value, we reduce the carrying value, including any allocated goodwill, to fair value, with any impairment not to exceed the carrying amount of goodwill. Any impairment would be recognized as a charge to income from operations and a reduction in the carrying value of goodwill.
At December 31, 2024, our business included two reportable segments – Hospital Operations and Ambulatory Care. Our reportable segments are reporting units used to perform our goodwill impairment analysis, and goodwill is accordingly assigned to these reporting segments. We completed our annual goodwill impairment analysis as of October 1, 2024.
At December 31, 2024 and 2023, the allocated goodwill balances related to our Hospital Operations segment were $2.697 billion and $3.119 billion, respectively, and $7.994 billion and $7.188 billion, respectively, related to our Ambulatory Care segment. We performed a separate qualitative analysis for our reporting units and, in each case, determined it was more likely than not that the fair value of each reporting unit exceeded its respective carrying value. We therefore concluded that the segments’ goodwill was not impaired at either December 31, 2024 or 2023. Factors considered in these analyses included recent and estimated future operating trends derived from macro‑economic conditions, industry conditions and other factors specific to each reporting segment.
ACCOUNTING FOR INCOME TAXES
We account for income taxes using the asset and liability method. This approach requires the recognition of deferred tax assets and liabilities for the expected future tax consequences of temporary differences between the carrying amounts and the tax bases of assets and liabilities. Income tax receivables and liabilities and deferred tax assets and liabilities are recognized based on the amounts that more likely than not will be sustained upon ultimate settlement with taxing authorities.
Developing our provision for income taxes and analysis of uncertain tax positions requires significant judgment and knowledge of federal and state income tax laws, regulations and strategies, including the determination of deferred tax assets and liabilities and, if necessary, any valuation allowances that may be required for deferred tax assets.
We assess the realization of our deferred tax assets to determine whether an income tax valuation allowance is required. Based on all available evidence, both positive and negative, and the weight of that evidence to the extent such evidence can be objectively verified, we determine whether it is more likely than not that all or a portion of the deferred tax assets will be realized. The main factors that we consider include:
•Cumulative profits/losses in recent years, adjusted for certain nonrecurring items;
•Income/losses expected in future years;
•Unsettled circumstances that, if unfavorably resolved, would adversely affect future operations and profit levels;
•The availability, or lack thereof, of taxable income in prior carryback periods that would limit realization of tax benefits; and
•The carryforward period associated with the deferred tax assets and liabilities.
During the year ended December 31, 2024, the valuation allowance decreased by $90 million, including a decrease of $180 million primarily for utilization of interest expense carryforwards due to gains from sales of facilities, an increase of $92 million due to an acquisition, and a decrease of $2 million due to changes in the expected realizability of deferred tax assets. The balance in the valuation allowance as of December 31, 2024 was $158 million.
During the year ended December 31, 2023, the valuation allowance increased by $71 million, including an increase of $73 million due to limitations on the tax deductibility of interest expense, and a decrease of $2 million due to changes in the expected realizability of deferred tax assets. The balance in the valuation allowance as of December 31, 2023 was $248 million.
Deferred tax assets relating to interest expense limitations under Internal Revenue Code Section 163(j) have a full valuation allowance because the interest expense carryovers are not expected to be utilized in the foreseeable future.
We consider many factors when evaluating our uncertain tax positions, and such judgments are subject to periodic review. Tax benefits associated with uncertain tax positions are recognized in the period in which one of the following conditions is satisfied: (1) the more likely than not recognition threshold is satisfied; (2) the position is ultimately settled through negotiation or litigation; or (3) the statute of limitations for the taxing authority to examine and challenge the position has expired. Tax benefits associated with an uncertain tax position are derecognized in the period in which the more likely than not recognition threshold is no longer satisfied.
While we believe we have adequately provided for our income tax receivables or liabilities and our deferred tax assets or liabilities, adverse determinations by taxing authorities or changes in tax laws and regulations could have a material adverse effect on our consolidated financial position, results of operations or cash flows.
ITEM 7A. QUANTITATIVE AND QUALITATIVE DISCLOSURES ABOUT MARKET RISK
The following table presents information about certain of our market‑sensitive financial instruments at December 31, 2024. The fair values were determined based on quoted market prices for the same or similar instruments. The average effective interest rates presented are based on the rate in effect at the end of the reporting period. The effects of unamortized discounts and issue costs are excluded from the table.
| | | | | | | | | | | | | | | | | | | | | | | | | | | | | | | | | | | | | | | | | | | | | | | |
| | Maturity Date, Years Ending December 31, | | | | | | |
| | 2025 | | 2026 | | 2027 | | 2028 | | 2029 | | Thereafter | | Total | | Fair Value |
| | (Dollars in Millions) |
| Fixed-rate long-term debt | $ | 92 | | | $ | 69 | | | $ | 3,096 | | | $ | 3,135 | | | $ | 1,418 | | | $ | 5,457 | | | $ | 13,267 | | | $ | 12,882 | |
| Average effective interest rates | 7.8 | % | | 8.4 | % | | 5.8 | % | | 5.9 | % | | 4.3 | % | | 6.0 | % | | 5.8 | % | | |
We have no affiliation with partnerships, trusts or other entities (sometimes referred to as “special‑purpose” or “variable‑interest” entities) whose purpose is to facilitate off‑balance sheet financial transactions or similar arrangements by us. As a result, we have no exposure to the financing, liquidity, market or credit risks associated with such entities. We do not hold or issue derivative instruments for trading purposes and are not a party to any instruments with leverage or prepayment features.
ITEM 8. FINANCIAL STATEMENTS AND SUPPLEMENTARY DATA
MANAGEMENT REPORT ON INTERNAL CONTROL OVER FINANCIAL REPORTING
To Our Shareholders:
Management is responsible for establishing and maintaining adequate internal control over financial reporting, as such term is defined in Rule 13a-15(f) under the Securities Exchange Act of 1934, as amended. Management assessed the effectiveness of Tenet’s internal control over financial reporting as of December 31, 2024. This assessment was performed under the supervision of and with the participation of management, including the chief executive officer and chief financial officer.
In making this assessment, management used criteria based on the framework in Internal Control — Integrated Framework (2013) issued by the Committee of Sponsoring Organizations of the Treadway Commission (“COSO”). Based on the assessment using the COSO framework, management concluded that Tenet’s internal control over financial reporting was effective as of December 31, 2024.
As more fully described in Note 22 to the Consolidated Financial Statements, in March 2024, subsidiaries of USPI Holding Company, Inc., our wholly-owned subsidiary, acquired interests in 41 ambulatory surgery centers (“March 2024 ASCs”). We have excluded all of the March 2024 ASCs’ operations from our assessment of and conclusion on the effectiveness of our internal control over financial reporting. The March 2024 ASCs represent approximately 3% of total assets and 1% of net operating revenues of our consolidated financial statement amounts as of and for the year ended December 31, 2024. We expect that our internal control system will be fully implemented at our March 2024 ASCs during 2025 and correspondingly evaluated by us for effectiveness.
Tenet’s internal control over financial reporting as of December 31, 2024 has been audited by Deloitte & Touche LLP, an independent registered public accounting firm, as stated in their report, which is included herein. Deloitte & Touche LLP has also audited Tenet’s Consolidated Financial Statements as of and for the year ended December 31, 2024, and that firm’s audit report on such Consolidated Financial Statements is also included herein.
Internal control over financial reporting cannot provide absolute assurance of achieving financial reporting objectives because of its inherent limitations. Internal control over financial reporting is a process that involves human diligence and compliance and is subject to lapses in judgment and breakdowns resulting from human failures. Internal control over financial reporting also can be circumvented by collusion or improper management override. Because of such limitations, there is a risk that material misstatements may not be prevented or detected on a timely basis by internal control over financial reporting. However, these inherent limitations are known features of the financial reporting process. Therefore, it is possible to design into the process safeguards to reduce, though not eliminate, this risk.
| | | | | |
| /s/ SAUMYA SUTARIA | /s/ SUN PARK |
| Saumya Sutaria, M.D. | Sun Park |
| Chief Executive Officer | Executive Vice President and Chief Financial Officer |
| February 18, 2025 | February 18, 2025 |
REPORT OF INDEPENDENT REGISTERED PUBLIC ACCOUNTING FIRM
To the Shareholders and the Board of Directors of Tenet Healthcare Corporation
Opinion on Internal Control over Financial Reporting
We have audited the internal control over financial reporting of Tenet Healthcare Corporation and subsidiaries (the “Company”) as of December 31, 2024, based on criteria established in Internal Control — Integrated Framework (2013) issued by the Committee of Sponsoring Organizations of the Treadway Commission (COSO). In our opinion, the Company maintained, in all material respects, effective internal control over financial reporting as of December 31, 2024, based on criteria established in Internal Control — Integrated Framework (2013) issued by COSO.
We have also audited, in accordance with the standards of the Public Company Accounting Oversight Board (United States) (PCAOB), the consolidated financial statements and financial statement schedule as of and for the year ended December 31, 2024, of the Company and our report dated February 18, 2025, expressed an unqualified opinion on those financial statements.
As described in Item 8, Management Report on Internal Control over Financial Reporting, management excluded from its assessment the internal control over financial reporting at 41 ambulatory surgery centers, which were acquired in March 2024 (together, the “March 2024 ASCs”), and whose financial statements constitute approximately 3% of total assets and 1% of net operating revenues of the consolidated financial statement amounts as of and for the year ended December 31, 2024. Accordingly, our audit did not include the internal control over financial reporting at the March 2024 ASCs.
Basis for Opinion
The Company’s management is responsible for maintaining effective internal control over financial reporting and for its assessment of the effectiveness of internal control over financial reporting, included in the accompanying Management’s Report on Internal Control over Financial Reporting. Our responsibility is to express an opinion on the Company’s internal control over financial reporting based on our audit. We are a public accounting firm registered with the PCAOB and are required to be independent with respect to the Company in accordance with the U.S. federal securities laws and the applicable rules and regulations of the Securities and Exchange Commission and the PCAOB.
We conducted our audit in accordance with the standards of the PCAOB. Those standards require that we plan and perform the audit to obtain reasonable assurance about whether effective internal control over financial reporting was maintained in all material respects. Our audit included obtaining an understanding of internal control over financial reporting, assessing the risk that a material weakness exists, testing and evaluating the design and operating effectiveness of internal control based on the assessed risk, and performing such other procedures as we considered necessary in the circumstances. We believe that our audit provides a reasonable basis for our opinion.
Definition and Limitations of Internal Control over Financial Reporting
A company’s internal control over financial reporting is a process designed to provide reasonable assurance regarding the reliability of financial reporting and the preparation of financial statements for external purposes in accordance with generally accepted accounting principles. A company’s internal control over financial reporting includes those policies and procedures that (1) pertain to the maintenance of records that, in reasonable detail, accurately and fairly reflect the transactions and dispositions of the assets of the company; (2) provide reasonable assurance that transactions are recorded as necessary to permit preparation of financial statements in accordance with generally accepted accounting principles, and that receipts and expenditures of the company are being made only in accordance with authorizations of management and directors of the company; and (3) provide reasonable assurance regarding prevention or timely detection of unauthorized acquisition, use, or disposition of the company’s assets that could have a material effect on the financial statements.
Because of its inherent limitations, internal control over financial reporting may not prevent or detect misstatements. Also, projections of any evaluation of effectiveness to future periods are subject to the risk that controls may become inadequate because of changes in conditions, or that the degree of compliance with the policies or procedures may deteriorate.
/s/ DELOITTE & TOUCHE LLP
Dallas, Texas
February 18, 2025
REPORT OF INDEPENDENT REGISTERED PUBLIC ACCOUNTING FIRM
To the Shareholders and the Board of Directors of Tenet Healthcare Corporation
Opinion on the Financial Statements
We have audited the accompanying consolidated balance sheets of Tenet Healthcare Corporation and subsidiaries (the “Company”) as of December 31, 2024 and 2023, the related consolidated statements of operations, other comprehensive income, changes in equity, and cash flows for each of the three years in the period ended December 31, 2024, and the related notes and the consolidated financial statement schedule listed in the Index at Item 15 (collectively referred to as the “financial statements”). In our opinion, the financial statements present fairly, in all material respects, the financial position of the Company as of December 31, 2024 and 2023, and the results of its operations and its cash flows for each of the three years in the period ended December 31, 2024, in conformity with accounting principles generally accepted in the United States of America.
We have also audited, in accordance with the standards of the Public Company Accounting Oversight Board (United States) (PCAOB), the Company's internal control over financial reporting as of December 31, 2024, based on criteria established in Internal Control — Integrated Framework (2013) issued by the Committee of Sponsoring Organizations of the Treadway Commission and our report dated February 18, 2025, expressed an unqualified opinion on the Company's internal control over financial reporting.
Basis for Opinion
These financial statements are the responsibility of the Company's management. Our responsibility is to express an opinion on the Company's financial statements based on our audits. We are a public accounting firm registered with the PCAOB and are required to be independent with respect to the Company in accordance with the U.S. federal securities laws and the applicable rules and regulations of the Securities and Exchange Commission and the PCAOB.
We conducted our audits in accordance with the standards of the PCAOB. Those standards require that we plan and perform the audit to obtain reasonable assurance about whether the financial statements are free of material misstatement, whether due to error or fraud. Our audits included performing procedures to assess the risks of material misstatement of the financial statements, whether due to error or fraud, and performing procedures that respond to those risks. Such procedures included examining, on a test basis, evidence regarding the amounts and disclosures in the financial statements. Our audits also included evaluating the accounting principles used and significant estimates made by management, as well as evaluating the overall presentation of the financial statements. We believe that our audits provide a reasonable basis for our opinion.
Critical Audit Matters
The critical audit matters communicated below are matters arising from the current-period audit of the financial statements that were communicated or required to be communicated to the audit committee and that (1) relate to accounts or disclosures that are material to the financial statements and (2) involved our especially challenging, subjective, or complex judgments. The communication of critical audit matters does not alter in any way our opinion on the financial statements, taken as a whole, and we are not, by communicating the critical audit matters below, providing separate opinions on the critical audit matters or on the accounts or disclosures to which they relate.
Net Operating Revenues and Accounts Receivable — Implicit Price Concessions — Refer to Notes 1, 3, and 15 to the consolidated financial statements
Critical Audit Matter Description
Management reports net patient service revenues and accounts receivable at the amounts that reflect the consideration to which they expect to be entitled for providing patient care. The transaction price is based on gross charges for services provided, reduced by contractual adjustments recognized for third-party payers, discounts provided to uninsured patients in accordance with the Company’s Compact with Uninsured Patients, and estimated implicit price concessions related primarily to uninsured patients and patients with co-pays, co-insurance and deductibles. The implicit price concessions are estimates developed by management based on their historical collection experience for payer classes using a portfolio approach.
We identified the estimate of implicit price concessions for certain hospital markets in the Hospital Operations and Services segment as a critical audit matter because of the significant judgments made by management to reduce net patient service revenues and accounts receivable for these hospital markets to their net realizable value through implicit price concessions. Performing audit procedures to evaluate management’s estimate of implicit price concessions involved especially subjective
auditor judgment given the inherent subjectivity in collection trends from changes in the economy, patient volumes, amounts to be paid by patients with insurance, and other factors considered by management.
How the Critical Audit Matter Was Addressed in the Audit
Our audit procedures related to management’s estimates of the implicit price concessions used to reduce net patient service revenues and accounts receivable to their net realizable value for certain hospital markets in the Hospital Operations and Services segment included the following, among others:
•We tested the effectiveness of controls related to net patient service revenues and the valuation of accounts receivable, including the historical collection data for payer classes.
•We evaluated the methods and assumptions used by management to estimate the implicit price concessions by:
◦Testing the underlying data that served as the basis for the implicit price concessions developed by management, including the historical collections data for payer classes, to evaluate whether the inputs to management’s estimate were reasonable.
◦Performing a retrospective analysis on management’s reserve estimates for prior years by (1) calculating the reserves based on actual collection results and comparing to management’s recorded balances and (2) comparing actual write-offs in the current year to the prior year estimated losses.
•We independently recalculated reserve rates using historical collection data for each payer class. We then compared the result to the implicit price concession estimate developed by management to evaluate the reasonableness of accounts receivable and net patient service revenues.
Professional and General Liability Reserves – Refer to Notes 1 and 16 to the consolidated financial statements
Critical Audit Matter Description
Management records accruals for the portion of their professional and general liability risks, including incurred but not reported claims, for which they are self-insured and that are probable and can be reasonably estimated. These accruals are estimated based on modeled estimates of projected payments using case-specific facts and circumstances and the Company’s historical claim loss reporting, claim development and settlement patterns, reported and closed claim counts, and a variety of hospital census information.
We identified the professional and general liability reserves for hospitals in the Hospital Operations and Services segment as a critical audit matter because auditing management’s estimate for these reserves involved especially subjective auditor judgment and required the involvement of our actuarial specialists given the subjectivity of estimating the projected liability of reported and unreported claims.
How the Critical Audit Matter Was Addressed in the Audit
Our audit procedures related to the professional and general liability reserves for hospitals in the Hospital Operations and Services segment included the following, among others:
•We tested the effectiveness of controls related to the professional and general liability reserves, including those over the estimation of the projected liability of reported and unreported claims.
•We evaluated the data used by management to estimate the professional and general liability reserves by:
◦Testing the underlying data that served as the basis for the actuarial analyses, including historical claims, to evaluate whether the inputs to the actuarial estimates were reasonable.
◦Comparing management’s prior year expected emergence of losses to actual losses incurred during the current year.
•With the assistance of our actuarial specialists, we developed an independent range of estimates of the professional and general liability reserves, using loss data, historical and industry claim development factors, among other factors, and compared our estimates to the recorded balance.
/s/ DELOITTE & TOUCHE LLP
Dallas, Texas
February 18, 2025
We have served as the Company's auditor since 2007.
CONSOLIDATED BALANCE SHEETS
Dollars in Millions, Share Amounts in Thousands
| | | | | | | | | | | | | | |
| | | December 31, | | December 31, |
| | 2024 | | 2023 |
| ASSETS | | | | |
| Current assets: | | | | |
| Cash and cash equivalents | | $ | 3,019 | | | $ | 1,228 | |
| Accounts receivable | | 2,536 | | | 2,914 | |
| Inventories of supplies, at cost | | 346 | | | 411 | |
| | | | |
| Assets held for sale | | 21 | | | 775 | |
| Other current assets | | 1,760 | | | 1,839 | |
| Total current assets | | 7,682 | | | 7,167 | |
| Investments and other assets | | 3,037 | | | 3,157 | |
| Deferred income taxes | | 80 | | | 77 | |
Property and equipment, at cost, less accumulated depreciation and amortization ($5,809 at December 31, 2024 and $6,478 at December 31, 2023) | | 6,049 | | | 6,236 | |
| Goodwill | | 10,691 | | | 10,307 | |
Other intangible assets, at cost, less accumulated amortization ($1,288 at December 31, 2024 and $1,447 at December 31, 2023) | | 1,397 | | | 1,368 | |
| Total assets | | $ | 28,936 | | | $ | 28,312 | |
| LIABILITIES AND EQUITY | | | | |
| Current liabilities: | | | | |
| Current portion of long-term debt | | $ | 92 | | | $ | 120 | |
| Accounts payable | | 1,294 | | | 1,408 | |
| Accrued compensation and benefits | | 899 | | | 930 | |
| Professional and general liability reserves | | 238 | | | 254 | |
| Accrued interest payable | | 149 | | | 200 | |
| Liabilities held for sale | | 13 | | | 69 | |
| | | | |
| Income tax payable | | 18 | | | 23 | |
| Other current liabilities | | 1,607 | | | 1,756 | |
| Total current liabilities | | 4,310 | | | 4,760 | |
| Long-term debt, net of current portion | | 13,081 | | | 14,882 | |
| Professional and general liability reserves | | 900 | | | 792 | |
| Defined benefit plan obligations | | 298 | | | 335 | |
| Deferred income taxes | | 227 | | | 326 | |
| | | | |
| Other long-term liabilities | | 1,573 | | | 1,709 | |
| Total liabilities | | 20,389 | | | 22,804 | |
| Commitments and contingencies | | | | |
| Redeemable noncontrolling interests in equity of consolidated subsidiaries | | 2,727 | | | 2,391 | |
| Equity: | | | | |
| Shareholders’ equity: | | | | |
Common stock, $0.05 par value; authorized 262,500 shares; 158,001 shares issued at December 31, 2024 and 157,271 shares issued at December 31, 2023 | | 8 | | | 8 | |
| Additional paid-in capital | | 4,873 | | | 4,834 | |
| Accumulated other comprehensive loss | | (180) | | | (181) | |
| Retained earnings (accumulated deficit) | | 3,008 | | | (192) | |
Common stock in treasury, at cost, 62,892 shares at December 31, 2024 and 57,321 shares at December 31, 2023 | | (3,538) | | | (2,861) | |
| Total shareholders’ equity | | 4,171 | | | 1,608 | |
| Noncontrolling interests | | 1,649 | | | 1,509 | |
| Total equity | | 5,820 | | | 3,117 | |
| Total liabilities and equity | | $ | 28,936 | | | $ | 28,312 | |
See accompanying Notes to Consolidated Financial Statements.
CONSOLIDATED STATEMENTS OF OPERATIONS
Dollars in Millions, Except Per-Share Amounts
| | | | | | | | | | | | | | | | | |
| | Years Ended December 31, |
| | 2024 | | 2023 | | 2022 |
| Net operating revenues | $ | 20,665 | | | $ | 20,548 | | | $ | 19,174 | |
| Grant income | 10 | | | 16 | | | 194 | |
| Equity in earnings of unconsolidated affiliates | 260 | | | 228 | | | 216 | |
| Operating expenses: | | | | | |
| Salaries, wages and benefits | 8,801 | | | 9,146 | | | 8,844 | |
| Supplies | 3,647 | | | 3,590 | | | 3,273 | |
| Other operating expenses, net | 4,492 | | | 4,515 | | | 3,998 | |
| Depreciation and amortization | 818 | | | 870 | | | 841 | |
| Impairment and restructuring charges, and acquisition-related costs | 102 | | | 137 | | | 226 | |
| Litigation and investigation costs | 35 | | | 47 | | | 70 | |
| Net gains on sales, consolidation and deconsolidation of facilities | (2,916) | | | (23) | | | (1) | |
| Operating income | 5,956 | | | 2,510 | | | 2,333 | |
| Interest expense | (826) | | | (901) | | | (890) | |
| Other non-operating income, net | 126 | | | 19 | | | 11 | |
| Loss from early extinguishment of debt | (8) | | | (11) | | | (109) | |
| Income before income taxes | 5,248 | | | 1,617 | | | 1,345 | |
| Income tax expense | (1,184) | | | (306) | | | (344) | |
| Net income | 4,064 | | | 1,311 | | | 1,001 | |
| | | | | |
| | | | | |
| | | | | |
| | | | | |
| | | | | |
| Less: Net income available to noncontrolling interests | 864 | | | 700 | | | 590 | |
| Net income available to Tenet Healthcare Corporation common shareholders | $ | 3,200 | | | $ | 611 | | | $ | 411 | |
| | | | | |
| | | | | |
| | | | | |
| | | | | |
| | | | | |
| Earnings available to Tenet Healthcare Corporation common shareholders: | | | | | |
| | | | | |
| | | | | |
| | | | | |
| Basic earnings per share | $ | 33.02 | | | $ | 6.01 | | | $ | 3.84 | |
| | | | | |
| | | | | |
| | | | | |
| Diluted earnings per share | $ | 32.70 | | | $ | 5.71 | | | $ | 3.79 | |
| | | | | |
| Weighted average shares and dilutive securities outstanding (in thousands): | | | | | |
| Basic | 96,904 | | | 101,639 | | | 106,929 | |
| Diluted | 97,881 | | | 104,800 | | | 110,516 | |
See accompanying Notes to Consolidated Financial Statements.
CONSOLIDATED STATEMENTS OF OTHER COMPREHENSIVE INCOME
Dollars in Millions
| | | | | | | | | | | | | | | | | |
| | Years Ended December 31, |
| | 2024 | | 2023 | | 2022 |
| Net income | $ | 4,064 | | | $ | 1,311 | | | $ | 1,001 | |
| Other comprehensive income: | | | | | |
| Adjustments for defined benefit plans | (9) | | | (9) | | | 63 | |
| Amortization of net actuarial loss included in other non-operating income, net | 8 | | | 7 | | | 9 | |
| Unrealized gain (loss) on debt securities held as available-for-sale | 1 | | | 2 | | | (4) | |
| | | | | |
| Foreign currency translation adjustments and other | 1 | | | — | | | 1 | |
| Other comprehensive income before income taxes | 1 | | | — | | | 69 | |
| Income tax expense related to items of other comprehensive income | — | | | — | | | (17) | |
| Total other comprehensive income, net of tax | 1 | | | — | | | 52 | |
| Comprehensive net income | 4,065 | | | 1,311 | | | 1,053 | |
| Less: Comprehensive income available to noncontrolling interests | 864 | | | 700 | | | 590 | |
| Comprehensive income available to Tenet Healthcare Corporation common shareholders | $ | 3,201 | | | $ | 611 | | | $ | 463 | |
See accompanying Notes to Consolidated Financial Statements.
CONSOLIDATED STATEMENTS OF CHANGES IN EQUITY
Dollars in Millions, Share Amounts in Thousands
| | | | | | | | | | | | | | | | | | | | | | | | | | | | | | | | | | | | | | | | | | | | | | | |
| | Tenet Healthcare Corporation Shareholders’ Equity | | | | |
| | Common Stock | | Additional
Paid-in
Capital | | Accumulated
Other
Comprehensive
Loss | | Retained Earnings (Accumulated Deficit) | | Treasury
Stock | | Noncontrolling
Interests | | Total Equity |
| | Shares
Outstanding | | Issued Par
Amount | | | | | | |
| Balances at December 31, 2021 | 107,189 | | | $ | 8 | | | $ | 4,877 | | | $ | (233) | | | $ | (1,214) | | | $ | (2,410) | | | $ | 1,026 | | | $ | 2,054 | |
| Net income | — | | | — | | | — | | | — | | | 411 | | | — | | | 242 | | | 653 | |
| Distributions paid to noncontrolling interests | — | | | — | | | — | | | — | | | — | | | — | | | (229) | | | (229) | |
| Other comprehensive income | — | | | — | | | — | | | 52 | | | — | | | — | | | — | | | 52 | |
| Accretion of redeemable noncontrolling interests | — | | | — | | | (104) | | | — | | | — | | | — | | | — | | | (104) | |
| Purchases (sales) of businesses and noncontrolling interests, net | — | | | — | | | (34) | | | — | | | — | | | — | | | 278 | | | 244 | |
| | | | | | | | | | | | | | | |
| Repurchases of common stock | (5,889) | | | — | | | — | | | — | | | — | | | (250) | | | — | | | (250) | |
| Stock-based compensation expense, tax benefit and issuance of common stock | 947 | | | — | | | 39 | | | — | | | — | | | — | | | — | | | 39 | |
| Balances at December 31, 2022 | 102,247 | | | 8 | | | 4,778 | | | (181) | | | (803) | | | (2,660) | | | 1,317 | | | 2,459 | |
| Net income | — | | | — | | | — | | | — | | | 611 | | | — | | | 334 | | | 945 | |
| Distributions paid to noncontrolling interests | — | | | — | | | — | | | — | | | — | | | — | | | (289) | | | (289) | |
| | | | | | | | | | | | | | | |
| | | | | | | | | | | | | | | |
| Purchases of businesses and noncontrolling interests, net | — | | | — | | | 5 | | | — | | | — | | | — | | | 147 | | | 152 | |
| Repurchases of common stock | (3,112) | | | — | | | — | | | — | | | — | | | (201) | | | — | | | (201) | |
| | | | | | | | | | | | | | | |
| Stock-based compensation expense, tax benefit and issuance of common stock | 815 | | | — | | | 51 | | | — | | | — | | | — | | | — | | | 51 | |
| Balances at December 31, 2023 | 99,950 | | | 8 | | | 4,834 | | | (181) | | | (192) | | | (2,861) | | | 1,509 | | | 3,117 | |
| Net income | — | | | — | | | — | | | — | | | 3,200 | | | — | | | 391 | | | 3,591 | |
| Distributions paid to noncontrolling interests | — | | | — | | | — | | | — | | | — | | | — | | | (312) | | | (312) | |
| Other comprehensive income | — | | | — | | | — | | | 1 | | | — | | | — | | | — | | | 1 | |
| Accretion of redeemable noncontrolling interests | — | | | — | | | (5) | | | — | | | — | | | — | | | — | | | (5) | |
| Purchases (sales) of businesses and noncontrolling interests, net | — | | | — | | | 12 | | | — | | | — | | | — | | | 61 | | | 73 | |
| Repurchases of common stock | (5,596) | | | — | | | — | | | — | | | — | | | (677) | | | — | | | (677) | |
| Stock-based compensation expense, tax benefit and issuance of common stock | 755 | | | — | | | 32 | | | — | | | — | | | — | | | — | | | 32 | |
| Balances at December 31, 2024 | 95,109 | | | $ | 8 | | | $ | 4,873 | | | $ | (180) | | | $ | 3,008 | | | $ | (3,538) | | | $ | 1,649 | | | $ | 5,820 | |
See accompanying Notes to Consolidated Financial Statements.
CONSOLIDATED STATEMENTS OF CASH FLOWS
Dollars in Millions
| | | | | | | | | | | | | | | | | |
| | Years Ended December 31, |
| | 2024 | | 2023 | | 2022 |
| Net income | $ | 4,064 | | | $ | 1,311 | | | $ | 1,001 | |
| Adjustments to reconcile net income to net cash provided by operating activities: | | | | | |
| Depreciation and amortization | 818 | | | 870 | | | 841 | |
| Deferred income tax expense (benefit) | (103) | | | 52 | | | 209 | |
| Stock-based compensation expense | 67 | | | 66 | | | 56 | |
| Impairment and restructuring charges, and acquisition-related costs | 102 | | | 137 | | | 226 | |
| Litigation and investigation costs | 35 | | | 47 | | | 70 | |
| Net gains on sales, consolidation and deconsolidation of facilities | (2,916) | | | (23) | | | (1) | |
| Loss from early extinguishment of debt | 8 | | | 11 | | | 109 | |
| Equity in earnings of unconsolidated affiliates, net of distributions received | (29) | | | (13) | | | 2 | |
| Amortization of debt discount and debt issuance costs | 26 | | | 32 | | | 33 | |
| | | | | |
| Net gains from the sale of investments and long-lived assets | (4) | | | (29) | | | (117) | |
| Other items, net | (4) | | | (4) | | | 11 | |
| Changes in cash from operating assets and liabilities: | | | | | |
| Accounts receivable | 245 | | | (29) | | | (140) | |
| Inventories and other current assets | (86) | | | (139) | | | (64) | |
| Income taxes | 16 | | | 10 | | | (26) | |
| Accounts payable, accrued expenses and other current liabilities | (30) | | | 215 | | | (898) | |
| Other long-term liabilities | (9) | | | 14 | | | (15) | |
| Payments for restructuring charges, acquisition-related costs, and litigation costs and settlements | (153) | | | (154) | | | (214) | |
| | | | | |
| Net cash provided by operating activities | 2,047 | | | 2,374 | | | 1,083 | |
| Cash flows from investing activities: | | | | | |
| Purchases of property and equipment | (931) | | | (751) | | | (762) | |
| Purchases of businesses or joint venture interests, net of cash acquired | (571) | | | (224) | | | (234) | |
| Proceeds from sales of facilities and other assets | 4,981 | | | 71 | | | 210 | |
| | | | | |
| Proceeds from sales of marketable securities and long-term investments | 63 | | | 50 | | | 76 | |
| Purchases of marketable securities and long-term investments | (94) | | | (104) | | | (92) | |
| Other items, net | (19) | | | (11) | | | (6) | |
| Net cash provided by (used in) investing activities | 3,429 | | | (969) | | | (808) | |
| Cash flows from financing activities: | | | | | |
| | | | | |
| | | | | |
| Repayments of borrowings | (2,243) | | | (1,542) | | | (2,851) | |
| Proceeds from borrowings | 23 | | | 1,370 | | | 2,023 | |
| Repurchases of common stock | (672) | | | (200) | | | (250) | |
| Debt issuance costs | — | | | (16) | | | (24) | |
| Distributions paid to noncontrolling interests | (681) | | | (594) | | | (560) | |
| Proceeds from the sale of noncontrolling interests | 23 | | | 43 | | | 27 | |
| Purchases of noncontrolling interests | (200) | | | (167) | | | (100) | |
| | | | | |
| Advances from managed care payers | 342 | | | — | | | — | |
| Repayments of advances from managed care payers | (310) | | | — | | | — | |
| Other items, net | 33 | | | 71 | | | (46) | |
| Net cash used in financing activities | (3,685) | | | (1,035) | | | (1,781) | |
| Net increase (decrease) in cash and cash equivalents | 1,791 | | | 370 | | | (1,506) | |
| Cash and cash equivalents at beginning of period | 1,228 | | | 858 | | | 2,364 | |
| Cash and cash equivalents at end of period | $ | 3,019 | | | $ | 1,228 | | | $ | 858 | |
| Supplemental disclosures: | | | | | |
| Interest paid, net of capitalized interest | $ | (851) | | | $ | (882) | | | $ | (848) | |
| Income tax payments, net | $ | (1,271) | | | $ | (243) | | | $ | (161) | |
See accompanying Notes to Consolidated Financial Statements.
NOTES TO CONSOLIDATED FINANCIAL STATEMENTS
NOTE 1. SIGNIFICANT ACCOUNTING POLICIES
Description of Business
Tenet Healthcare Corporation (together with our subsidiaries, referred to herein as “Tenet,” “we” or “us”) is a diversified healthcare services company headquartered in Dallas, Texas. Our expansive, nationwide care delivery network consists of our Hospital Operations and Ambulatory Care segments. As of December 31, 2024, our Hospital Operations segment was comprised of 49 acute care and specialty hospitals, a network of employed physicians and 135 outpatient facilities, including urgent care centers (each, a “UCC”), imaging centers, off-campus hospital emergency departments and micro‑hospitals. Our Ambulatory Care segment is comprised of the operations of our subsidiary USPI Holding Company, Inc. (“USPI”), which held indirect ownership interests in 518 ambulatory surgery centers and 25 surgical hospitals at December 31, 2024. USPI held noncontrolling interests in 161 of these facilities, which are recorded using the equity method of accounting. In addition, we operate a Global Business Center (“GBC”) in the Philippines.
Basis of Presentation
Our Consolidated Financial Statements include the accounts of Tenet and its wholly owned and majority‑owned subsidiaries. We eliminate intercompany accounts and transactions in consolidation, and we include the results of operations of businesses that are newly acquired in purchase transactions from their dates of acquisition. We account for significant investments in other affiliated companies using the equity method. We also utilize the equity method when we have the ability to exercise significant influence over the affiliated company, despite not holding a significant percentage of its ownership interest. Unless otherwise indicated, dollar amounts presented in our Consolidated Financial Statements and these accompanying notes are expressed in millions (except per-share amounts), and all share amounts are expressed in thousands.
Changes to prior-year presentation—Due to its decreased significance, income from discontinued operations is now presented in other non-operating income in our consolidated statements of operations. In addition, income from discontinued operations and cash used in operating activities from discontinued operations, excluding income taxes are now included in other items, net within the cash flows from operating activities section of our consolidated statements of cash flows.
Use of Estimates
The preparation of financial statements in conformity with accounting principles generally accepted in the United States of America (“GAAP”) requires us to make estimates and assumptions that affect the amounts reported in our Consolidated Financial Statements and these accompanying notes. We regularly evaluate the accounting policies and estimates we use. In general, we base the estimates on historical experience and on assumptions that we believe to be reasonable given the particular circumstances in which we operate. Although we believe all adjustments considered necessary for a fair presentation have been included, actual results may vary from those estimates. The financial and statistical information we report to other regulatory agencies may be prepared on a basis other than GAAP or using different assumptions or reporting periods and, therefore, may vary from the amounts presented herein. Although we make every effort to ensure that the information we report to those agencies is accurate, complete and consistent with applicable reporting guidelines, we cannot be responsible for the accuracy of the information they make available to the public.
COVID-19 Pandemic
During the COVID‑19 pandemic, federal, state and local authorities undertook several actions designed to assist healthcare providers in delivering care to COVID‑19 and other patients and to mitigate the adverse economic impact of the pandemic. Among other things, federal legislation (collectively, the “COVID Acts”) authorized grant payments to be distributed through the Public Health and Social Services Emergency Fund to healthcare providers who experienced lost revenues and increased expenses as a result of the pandemic. The COVID Acts also revised the Medicare accelerated payment program (“MAPP”) and permitted employers to defer payroll Social Security tax payments in 2020. Our participation in these programs and the related accounting policies are summarized below. The Secretary of the U.S. Department of Health and Human Services ended the COVID‑19 Public Health Emergency in May 2023.
Grant Income—We did not receive any cash payments from the COVID-19 relief grant programs during the year ended December 31, 2024. However, during the years ended December 31, 2023 and 2022, we received cash payments totaling $10 million and $196 million, respectively. Grant funds we received are included in cash flows from operating activities in our consolidated statements of cash flows. We had no deferred grant payments remaining at either December 31, 2024 or 2023. We recognize grant payments as income when there is reasonable assurance that we have complied with the conditions associated with the grant. During the years ended December 31, 2024, 2023 and 2022, we recognized grant income totaling $10 million,
$16 million and $194 million, respectively. Grant income recognized is presented in grant income in our consolidated statements of operations.
Medicare Accelerated Payment Program (MAPP)—In certain circumstances, when a healthcare facility is experiencing financial difficulty due to delays in receiving payment for the Medicare services it provided, it may be eligible for an accelerated or advance payment pursuant to the MAPP. The COVID Acts temporarily revised the program, allowing healthcare providers to retain advance payments for one year from the date of receipt. We received advances under MAPP in 2020; however, no further advances were received in subsequent years. During the year ended December 31, 2022, MAPP advances totaling $880 million were either recouped through offsets to our Medicare claims payments or directly repaid by us, completing the full remittance of advances previously received. There was no outstanding liability related to advances received by us under MAPP at either December 31, 2024 or 2023.
Deferral of Employment Tax Payments—The COVID Acts permitted employers to defer payment of the 6.2% employer Social Security tax beginning March 27, 2020 through December 31, 2020. Deferred tax amounts were required to be paid in equal amounts over two years beginning in December 2021. We remitted all remaining employer’s Social Security tax payments deferred during 2020 totaling $128 million in December 2022.
Translation of Foreign Currencies
Our GBC, which is located in the Philippines, performs certain administrative functions and other support tasks. The GBC’s accounts are measured in its local currency (the Philippine peso) and then translated into U.S. dollars. All assets and liabilities denominated in foreign currency are translated using the current rate of exchange at the balance sheet date. Results of operations denominated in foreign currency are translated using the average rates prevailing throughout the period of operations. Translation gains or losses resulting from changes in exchange rates are accumulated in shareholders’ equity.
Net Operating Revenues
We recognize net operating revenues in the period in which we satisfy our performance obligations under contracts by transferring services to our customers. Net operating revenues are recognized in the amounts we expect to be entitled to, which are the transaction prices allocated for the distinct services. Net operating revenues for our Hospital Operations and Ambulatory Care segments primarily consist of net patient service revenues, principally for patients covered by Medicare, Medicaid, managed care and other health plans, as well as certain uninsured patients under our Compact with Uninsured Patients (“Compact”) and other uninsured discount and charity programs.
Net Patient Service Revenues
We report net patient service revenues at the amounts that reflect the consideration we expect to be entitled to in exchange for providing patient care. These amounts are due from patients, third‑party payers (including managed care payers and government programs) and others, and they include variable consideration for retroactive revenue adjustments due to settlement of audits, reviews and investigations. Generally, we bill our patients and third‑party payers several days after the services are performed or shortly after discharge. Revenues are recognized as performance obligations are satisfied.
We determine performance obligations based on the nature of the services we provide. We recognize revenues for performance obligations satisfied over time based on actual charges incurred in relation to total expected charges. We believe that this method provides a faithful depiction of the transfer of services over the term of performance obligations based on the inputs needed to satisfy the obligations. Generally, performance obligations satisfied over time relate to patients in our hospitals receiving inpatient acute care services. We measure performance obligations from admission to the point when there are no further services required for the patient, which is generally the time of discharge. We recognize revenues for performance obligations satisfied at a point in time, which generally relate to patients receiving outpatient services, when (1) services are provided, and (2) we do not believe the patient requires additional services.
Because our patient service performance obligations relate to contracts with a duration of less than one year, we have elected to apply the optional exemption provided in the Financial Accounting Standards Board’s (“FASB”) Accounting Standards Codification (“ASC”) 606‑10‑50‑14(a) and, therefore, we are not required to disclose the aggregate amount of the transaction price allocated to performance obligations that are unsatisfied or partially unsatisfied at the end of the reporting period. The unsatisfied or partially unsatisfied performance obligations referred to above are primarily related to inpatient acute care services at the end of the reporting period. The performance obligations for these contracts are generally completed when the patients are discharged, which generally occurs within days or weeks of the end of the reporting period.
We determine the transaction price based on gross charges for services provided, reduced by contractual adjustments recognized for third‑party payers, discounts provided to uninsured patients in accordance with our Compact, and estimated implicit price concessions related primarily to uninsured patients. We determine our estimates of contractual adjustments and discounts based on contractual agreements, our discount policies and historical experience. We determine our estimate of implicit price concessions based on our historical collection experience using a portfolio approach as a practical expedient to account for patient contracts as collective groups rather than individually. The financial statement effects of using this practical expedient are not materially different from an individual contract approach.
Gross charges are retail charges. They are not the same as actual pricing, and they generally do not reflect what a hospital is ultimately paid and, therefore, are not displayed in our consolidated statements of operations. Hospitals are typically paid amounts that are negotiated with insurance companies or are set by the government. Gross charges are used to calculate Medicare outlier payments and to determine certain elements of payment under managed care contracts (such as stop‑loss payments). Because Medicare requires that a hospital’s gross charges be the same for all patients (regardless of payer category), gross charges are what hospitals charge all patients prior to the application of discounts and allowances.
Government Programs—The final determination of certain fee‑for‑service (“FFS”) Medicare and Medicaid program payments to our hospitals, such as Indirect Medical Education, Direct Graduate Medical Education, disproportionate share hospital and bad debt expense reimbursement, are retrospectively determined based on our hospitals’ cost reports. The final determination of these payments often takes many years to resolve because of audits by the program representatives, providers’ rights of appeal, and the application of numerous technical reimbursement provisions. We therefore record accruals to reflect the expected final settlements on our cost reports. For filed cost reports, we adjust the accrual for estimated cost report settlements based on those cost reports and subsequent activity, and we consider the necessity of recording a valuation allowance based on historical settlement results. The accrual for estimated cost report settlements for periods for which a cost report is yet to be filed is recorded based on estimates of what we expect to report on the filed cost reports, and a corresponding valuation allowance is recorded, if necessary, based on the method previously described. Cost reports must generally be filed within five months after the end of the annual cost report reporting period. After the cost report is filed, the accrual and corresponding valuation allowance may need to be adjusted.
Settlements with third‑party payers for retroactive revenue adjustments due to audits, reviews or investigations are considered variable consideration and are included in the determination of the estimated transaction price for providing patient care using the most likely outcome method. These settlements are estimated based on the terms of the payment agreement with the payer, correspondence from the payer and our historical settlement activity, including an assessment to ensure that it is probable that a significant reversal in the amount of cumulative revenue recognized will not occur when the uncertainty associated with the retroactive adjustment is subsequently resolved. Estimated settlements are adjusted in future periods as adjustments become known (that is, new information becomes available), or as years are settled or are no longer subject to such audits, reviews and investigations. Because the laws, regulations, instructions and rule interpretations governing Medicare and Medicaid reimbursement are complex and change frequently, the estimates we record could change by material amounts.
Private Insurance—Revenues under managed care plans are based primarily on payment terms involving predetermined rates per diagnosis, per‑diem rates, discounted FFS rates and/or other similar contractual arrangements. These revenues are also subject to review and possible audit by the payers, which can take several years before they are completely resolved. The payers are billed for patient services on an individual patient basis. An individual patient’s bill is subject to adjustment on a patient‑by‑patient basis in the ordinary course of business by the payers following their review and adjudication of each particular bill. We estimate the discounts for contractual allowances at the individual hospital level utilizing billing data on an individual patient basis. At the end of each month, on an individual hospital basis, we estimate our expected reimbursement for patients of managed care plans based on the applicable contract terms. Contractual allowance estimates are periodically reviewed for accuracy by taking into consideration known contract terms, as well as payment history. We believe our estimation and review process enables us to identify instances on a timely basis where such estimates need to be revised. We do not believe there were any adjustments to estimates of patient bills that were material to our revenues during the years ended December 31, 2024, 2023 or 2022. In addition, on a corporate‑wide basis, we do not record any general provision for adjustments to estimated contractual allowances for managed care plans. Managed care accounts, net of contractual allowances recorded, are further reduced to their net realizable value through implicit price concessions based on historical collection trends for these payers and other factors that affect the estimation process.
We know of no claims, disputes or unsettled matters with any payer that would materially affect our revenues for which we have not adequately provided in the accompanying Consolidated Financial Statements.
Uninsured Patients—Generally, patients who are covered by third‑party payers are responsible for related co‑pays, co‑insurance and deductibles, which vary in amount. We also provide services to uninsured patients and offer uninsured
patients a discount from standard charges. We estimate the transaction price for patients with co‑pays, co‑insurance and deductibles and for those who are uninsured based on historical collection experience and current market conditions. Under our Compact and other uninsured discount programs, the discount offered to certain uninsured patients is recognized as a contractual allowance, which reduces net operating revenues at the time the self‑pay accounts are recorded. The uninsured patient accounts, net of contractual allowances recorded, are further reduced to their net realizable value at the time they are recorded through implicit price concessions based on historical collection trends for self‑pay accounts and other factors that affect the estimation process.
Implicit Price Concessions—We record implicit price concessions, primarily related to uninsured patients and patients with co‑pays, co‑insurance and deductibles. The implicit price concessions included in estimating the transaction price represent the difference between amounts billed to patients and the amounts we expect to collect based on our collection history with similar patients. Although outcomes vary, our policy is to attempt to collect amounts due from patients, including co‑pays, co‑insurance and deductibles due from patients with insurance, at the time of service while complying with all federal and state statutes and regulations, including, but not limited to, the Emergency Medical Treatment and Active Labor Act (“EMTALA”). Generally, as required by EMTALA, patients may not be denied emergency treatment due to inability to pay. Therefore, services, including the legally required medical screening examination and stabilization of the patient, are performed without delaying to obtain insurance information. In non‑emergency circumstances or for elective procedures and services, it is our policy to verify insurance prior to a patient being treated; however, there are various exceptions that can occur. Such exceptions can include, for example, instances where (1) we are unable to obtain verification because the patient’s insurance company was unable to be reached or contacted, (2) a determination is made that a patient may be eligible for benefits under various government programs, such as Medicaid or Victims of Crime, and it takes several days or weeks before qualification for such benefits is confirmed or denied, and (3) under physician orders we provide services to patients that require immediate treatment.
There are various factors that can impact collection trends, such as: changes in the economy, which in turn have an impact on unemployment rates and the number of uninsured and underinsured patients; the volume of patients through our emergency departments; the increased burden of co‑pays, co‑insurance amounts and deductibles to be made by patients with insurance; and business practices related to collection efforts. These factors continuously change and can have an impact on collection trends and our estimation process. Subsequent changes to the estimate of the transaction price are generally recorded as adjustments to net patient service revenues in the period of the change.
We also provide charity care to patients who are financially unable to pay for the healthcare services they receive. Most patients who qualify for charity care are charged a per‑diem amount for services received, subject to a cap. Except for the per‑diem amounts, our policy is not to pursue collection of amounts determined to qualify as charity care; therefore, we do not report these amounts in net operating revenues. Patient advocates from our Eligibility and Enrollment Services program screen patients in the hospital to determine whether those patients meet eligibility requirements for financial assistance programs. They also expedite the process of applying for these government programs.
Amounts related to services provided to patients for which we have not billed and that do not meet the conditions of unconditional right to payment at the end of the reporting period are contract assets. Approximately 90% of our Hospital Operations segment’s contract assets meet the conditions for unconditional right to payment and are reclassified to patient receivables within 90 days.
Revenue Cycle Management and Other Services
Our Hospital Operations segment also provides revenue cycle management and other services to health systems, individual hospitals and physician practices. We recognize revenue from our contracts when the underlying performance obligations are satisfied, which is generally as services are rendered. Revenue is recognized in an amount that reflects the consideration to which we expect to be entitled.
At contract inception, we assess the services specified in our contracts with customers and identify a performance obligation for each distinct contracted service. We generally consider the following distinct services as separate performance obligations:
•revenue cycle management services;
•value‑based care services;
•patient communication and engagement services;
•consulting services; and
•other client‑defined projects.
Our contracts generally consist of fixed‑price, volume‑based or contingency‑based fees. Long‑term contracts typically provide for the delivery of recurring monthly services over a multi‑year period. The contracts are typically priced such that our monthly fee to our customer represents the value obtained by the customer in the month for those services. Such multi‑year service contracts may have upfront fees related to transition or integration work performed by us to set up the delivery for the ongoing services. Such transition or integration work typically does not result in a separately identifiable obligation; thus, the fees and expenses related to such work are deferred and recognized over the life of the related contractual service period. For contracts in which the amortization period of the asset is one year or less, we have elected to apply the practical expedient provided by FASB ASC 340‑40‑25‑4 and expense these costs as incurred.
Revenue for fixed‑priced contracts is typically recognized at the time of billing unless evidence suggests that the revenue is earned or our obligations are fulfilled in a different pattern. Revenue for volume‑based contracts is typically recognized as the services are being performed at the contractually billable rate, which is generally a percentage of collections or a percentage of client net patient revenue.
Contract Assets and Liabilities—Our client contract terms, including payment conditions, are diverse. For non‑fixed‑price arrangements, we may invoice clients before we perform the contracted services, with subsequent adjustments (true‑up) to align with actual fees. In contrast, some contracts require payment after we have performed the contracted services (in arrears). Contracts may also feature performance‑based incentives or penalties, along with other variable consideration. Revenue recognition occurs when services are rendered and the client gains control or benefit of the services, regardless of the invoicing schedule, leading to the recognition of a contract asset for unbilled revenue. Unbilled revenue is recognized as receivables in the month the services are performed. Conversely, advance payments from clients result in the recognition of a contract liability for deferred revenue until the revenue recognition requirements are met.
Cash and Cash Equivalents
We treat highly liquid investments with original maturities of three months or less as cash equivalents. Cash and cash equivalents were $3.019 billion and $1.228 billion at December 31, 2024 and 2023, respectively. At December 31, 2024 and 2023, our book overdrafts were $143 million and $187 million, respectively, which were classified as accounts payable. At December 31, 2024 and 2023, $110 million and $100 million, respectively, of total cash and cash equivalents in the accompanying Consolidated Balance Sheets were intended for the operations of our insurance‑related subsidiaries.
At December 31, 2024, 2023 and 2022, we had $127 million, $154 million and $196 million, respectively, of property and equipment purchases accrued for items received but not yet paid. Of these amounts, $109 million, $141 million and $191 million, respectively, were included in accounts payable.
In June 2022, we acquired all of Baylor University Medical Center’s (“Baylor”) 5% voting ownership interest in USPI. We paid $11 million from cash on hand and recognized a liability of $377 million, the present value of the liability on the acquisition date, for the remainder of the purchase price. We recorded reductions in redeemable noncontrolling interest of $365 million for the carrying value of Baylor’s ownership interest and $23 million to additional paid-in capital for the difference between the carrying value and present value of the purchase price for the shares on the acquisition date. This has been reflected as noncash financing activity in the accompanying Consolidated Statement of Cash Flows for the year ended December 31, 2022. Payments made subsequent to the transaction’s close are reflected as cash activity within the financing section of our consolidated statements of cash flows in the respective periods. See Note 18 for additional information about this transaction.
Investments in Debt and Equity Securities
We classify investments in debt securities as either available‑for‑sale, held‑to‑maturity or as part of a trading portfolio. Our policy is to classify investments in debt securities that may be needed for cash requirements as “available‑for‑sale.” At December 31, 2024 and 2023, we had no significant investments in debt securities classified as either held‑to‑maturity or trading. We carry debt securities classified as available‑for‑sale at fair value. We report their unrealized gains and losses, net of taxes, as accumulated other comprehensive income (loss). We periodically evaluate available-for-sale securities in unrealized loss positions for credit impairment, using both qualitative and quantitative criteria. In the event a security is deemed to be impaired as the result of a credit loss, we record a loss in our consolidated statements of operations.
We carry equity securities at fair value, and we report their unrealized gains and losses in other non-operating income, net, in our consolidated statements of operations. If the equity security does not have a readily determinable fair value, the carrying value of the security is adjusted only when there is a price change that is observable from a transaction of an identical or similar investment. We include realized gains or losses in our consolidated statements of operations based on the specific identification method.
Investments in Unconsolidated Affiliates
As of December 31, 2024, we controlled 382 of the facilities in our Ambulatory Care segment and, therefore, consolidated their results. We account for many of the facilities in which our Ambulatory Care segment holds ownership interests (161 of 543 at December 31, 2024), as well as additional companies in which our Hospital Operations segment holds ownership interests, under the equity method as investments in unconsolidated affiliates and report only our share of net income as equity in earnings of unconsolidated affiliates in the accompanying Consolidated Statements of Operations. Summarized financial information for equity method investees is presented in the following table. For investments acquired during the reported periods, amounts below include 100% of the investee’s results beginning on the date of our acquisition of the investment.
| | | | | | | | | | | | | | | | | |
| December 31, |
| | 2024 | | 2023 | | 2022 |
| Current assets | $ | 1,255 | | | $ | 1,223 | | | $ | 1,142 | |
| Noncurrent assets | $ | 1,358 | | | $ | 1,355 | | | $ | 1,356 | |
| Current liabilities | $ | (435) | | | $ | (456) | | | $ | (479) | |
| Noncurrent liabilities | $ | (928) | | | $ | (917) | | | $ | (878) | |
| Noncontrolling interests | $ | (699) | | | $ | (670) | | | $ | (644) | |
| | | | | |
| | Years Ended December 31, |
| | 2024 | | 2023 | | 2022 |
| Net operating revenues | $ | 3,709 | | | $ | 3,510 | | | $ | 3,360 | |
| Net income | $ | 978 | | | $ | 860 | | | $ | 805 | |
| Net income attributable to the investees | $ | 483 | | | $ | 484 | | | $ | 453 | |
The equity method investment that contributed the most to our equity in earnings of unconsolidated affiliates during the years ended December 31, 2024, 2023 and 2022 was Texas Health Ventures Group, LLC (“THVG”), which is operated by USPI. THVG represented $130 million, $104 million and $89 million of total equity in earnings of unconsolidated affiliates of $260 million, $228 million and $216 million in the years ended December 31, 2024, 2023 and 2022, respectively.
Property and Equipment
Additions and improvements to property and equipment exceeding established minimum amounts with a useful life greater than one year are capitalized at cost. Expenditures for maintenance and repairs are charged to expense as incurred. We use the straight‑line method of depreciation for buildings, building improvements and equipment. The estimated useful life for buildings and improvements is primarily 15 to 40 years, and for equipment three to 15 years. Newly constructed hospitals are usually depreciated over 50 years. Interest costs related to construction projects are capitalized. In the years ended December 31, 2024, 2023 and 2022, capitalized interest was $8 million, $9 million and $8 million, respectively.
We evaluate our long‑lived assets for possible impairment annually or whenever events or changes in circumstances indicate that the carrying amount of the asset, or related group of assets, may not be recoverable from estimated future undiscounted cash flows. If the estimated future undiscounted cash flows are less than the carrying value of the assets, we calculate the amount of an impairment charge only if the carrying value of the long‑lived assets exceeds their fair value. The fair value of the asset is estimated based on third‑party appraisals, established market values of comparable assets or internally developed estimates of future net cash flows expected to result from the use and ultimate disposition of the asset. The estimates of these future cash flows are based on assumptions and projections we believe to be reasonable and supportable. Estimates require our subjective judgments and take into account assumptions about revenue and expense growth rates, operating margins and recoverable disposition values, based on industry and operating factors. These assumptions may vary by type of asset and presume stable, improving or, in some cases, declining results, depending on their circumstances. If the presumed level of performance does not occur as expected, impairment may result.
We report long‑lived assets to be disposed of at the lower of their carrying amounts or fair values less costs to sell. In such circumstances, our estimates of fair value are based on third‑party appraisals, established market prices for comparable assets or internally developed estimates of future net cash flows.
Leases
We determine if an arrangement is a lease at inception of the contract. Our right‑of‑use assets represent our right to use the underlying assets for the lease term and our lease liabilities represent our obligation to make lease payments arising from the leases. Right‑of‑use assets and lease liabilities are recognized at the commencement date based on the present value of lease payments over the lease term. We use our estimated incremental borrowing rate, which is derived from information available at
the lease commencement date, in determining the present value of lease payments. For our Hospital Operations segment, we estimate our incremental borrowing rates for our portfolio of leases using documented rates included in our recent equipment finance leases or, if applicable, recent secured debt issuances that correspond to various lease terms. We also give consideration to information obtained from our bankers, our secured debt fair value and publicly available data for instruments with similar characteristics. For our Ambulatory Care segment, we estimate an incremental borrowing rate for each center by utilizing historical and projected financial data, estimating a hypothetical credit rating using publicly available market data and adjusting the market data to reflect the effects of collateralization.
Our operating leases are primarily for real estate, including off‑campus outpatient facilities, medical office buildings, and corporate and other administrative offices, as well as medical and office equipment. Our finance leases primarily relate to medical equipment, information technology equipment, telecommunications assets and real estate. Our real estate lease agreements typically have initial terms of five to 10 years, and our equipment lease agreements typically have initial terms of three years. We do not record leases with an initial term of 12 months or less (short‑term leases) in our consolidated balance sheets.
Our real estate leases may include one or more options to renew, with renewals that can extend the lease term from five to 10 years. The exercise of lease renewal options is at our sole discretion. In general, we do not consider renewal options to be reasonably likely to be exercised, therefore, renewal options are generally not recognized as part of our right‑of‑use assets and lease liabilities. Certain leases also include options to purchase the leased property. The useful life of assets and leasehold improvements are limited by the expected lease term, unless there is a transfer of title or purchase option reasonably certain of exercise. The majority of our medical equipment leases have terms of three years with a bargain purchase option that is reasonably certain of exercise, so these assets are depreciated over their useful life, typically ranging from five to seven years. Similarly, some of our leases of information technology and telecommunications assets include a transfer of title and, therefore, have useful lives of 15 years.
Certain of our lease agreements for real estate include payments based on actual common area maintenance expenses and others include rental payments adjusted periodically for inflation. These variable lease payments are recognized in other operating expenses, but are not included in the right‑of‑use asset or liability balances. Our lease agreements do not contain any material residual value guarantees, restrictions or covenants.
We have elected the practical expedient that allows lessees to choose to not separate lease and non‑lease components by class of underlying asset and are applying this expedient to all relevant asset classes. We have also elected the practical expedient package to not reassess at adoption (1) expired or existing contracts for whether they are or contain a lease, (2) the lease classification of any existing leases or (3) initial indirect costs for existing leases.
Goodwill and Other Intangible Assets
Goodwill represents the excess of costs over the fair value of assets of businesses acquired. Goodwill and other intangible assets acquired in purchase business combinations and determined to have indefinite useful lives are not amortized, but instead are subject to impairment tests performed at least annually. Our reporting segments are the reporting units used to perform our goodwill analysis. If we determine the carrying value of goodwill is impaired, or if the carrying value of a business that is to be sold or otherwise disposed of exceeds its fair value, we reduce the carrying value, including any allocated goodwill, to fair value. Estimates of fair value are based on third‑party appraisals, established market prices for comparable assets or internally developed estimates of future net cash flows and presume stable, improving or, in some cases, declining results at our hospitals, depending on their circumstances.
Other intangible assets consist of capitalized software costs, which are amortized on a straight‑line basis over the estimated useful life of the software, which ranges from three to 15 years, costs of acquired management and other contract service rights, most of which have indefinite lives, and miscellaneous intangible assets.
Accruals for General and Professional Liability Risks
We accrue for estimated professional and general liability claims, to the extent not covered by insurance, when they are probable and can be reasonably estimated. We maintain reserves, which are based on modeled estimates for the portion of our professional liability risks, including incurred but not reported claims, to the extent we do not have insurance coverage. Our liability consists of estimates established based upon calculations using several factors, including the number of expected claims, estimates of losses for these claims based on recent and historical settlement amounts, estimates of incurred but not reported claims based on historical experience and the timing of historical payments. Our liabilities are adjusted for new claims information in the period such information becomes known. Malpractice expense is recorded within other operating expenses in our consolidated statements of operations.
Income Taxes
We account for income taxes using the asset and liability method. This approach requires the recognition of deferred tax assets and liabilities for the expected future tax consequences of temporary differences between the carrying amounts and the tax bases of assets and liabilities. Income tax receivables and liabilities and deferred tax assets and liabilities are recognized based on the amounts that more likely than not will be sustained upon ultimate settlement with taxing authorities.
Developing our provision for income taxes and analysis of uncertain tax positions requires significant judgment and knowledge of federal and state income tax laws, regulations and strategies, including the determination of deferred tax assets and liabilities and, if necessary, any valuation allowances that may be required for deferred tax assets.
We assess the realization of our deferred tax assets to determine whether an income tax valuation allowance is required. Based on all available evidence, both positive and negative, and the weight of that evidence to the extent such evidence can be objectively verified, we determine whether it is more likely than not that all or a portion of the deferred tax assets will be realized. The main factors that we consider include:
•Cumulative profits/losses in recent years, adjusted for certain nonrecurring items;
•Income/losses expected in future years;
•Unsettled circumstances that, if unfavorably resolved, would adversely affect future operations and profit levels;
•The availability, or lack thereof, of taxable income in prior carryback periods that would limit realization of tax benefits; and
•The carryforward period associated with the deferred tax assets and liabilities.
We consider many factors when evaluating our uncertain tax positions, and such judgments are subject to periodic review. Tax benefits associated with uncertain tax positions are recognized in the period in which one of the following conditions is satisfied: (1) the more likely than not recognition threshold is satisfied; (2) the position is ultimately settled through negotiation or litigation; or (3) the statute of limitations for the taxing authority to examine and challenge the position has expired. Tax benefits associated with an uncertain tax position are derecognized in the period in which the more likely than not recognition threshold is no longer satisfied.
Costs Associated with Exit or Disposal Activities
We recognize costs associated with exit (including restructuring) or disposal activities when they are incurred and can be measured at fair value, rather than at the date of a commitment to an exit or disposal plan. Our restructuring plans typically focus on the alignment of our operations in the most strategic and cost‑effective structure, such as the establishment of support operations at our GBC, among other things. Certain restructuring and acquisition‑related costs are based on estimates. Changes in estimates are recognized as they occur.
NOTE 2. EQUITY
Nonredeemable Noncontrolling Interests
The table below presents our nonredeemable noncontrolling interests balances by segment:
| | | | | | | | | | | | | | | | | | |
| | | | December 31, |
| | | | | | 2024 | | 2023 |
| Hospital Operations | | | | | | $ | 205 | | | $ | 185 | |
| Ambulatory Care | | | | | | 1,444 | | | 1,324 | |
| Total nonredeemable noncontrolling interests | | | | | | $ | 1,649 | | | $ | 1,509 | |
Our net income attributable to nonredeemable noncontrolling interests by segment are presented in the table below:
| | | | | | | | | | | | | | | | | | | | |
| | Years Ended December 31, |
| | 2024 | | 2023 | | 2022 |
| Hospital Operations | | $ | 50 | | | $ | 30 | | | $ | 21 | |
| Ambulatory Care | | 341 | | | 304 | | | 221 | |
| Total net income available to noncontrolling interests | | $ | 391 | | | $ | 334 | | | $ | 242 | |
2022 Share Repurchase Program
In October 2022, our board of directors authorized the repurchase of up to $1.000 billion of our common stock through a share repurchase program (the “2022 share repurchase program”). This program allowed for share repurchases to be made in open‑market or privately negotiated transactions, at management’s discretion subject to market conditions and other factors, and in a manner consistent with applicable securities laws and regulations. The program did not require us to acquire any particular amount of common stock and could be suspended for periods or discontinued at any time. We did not make further repurchases under the 2022 share repurchase program following our board of directors’ approval of a new share repurchase program (discussed below), and it expired on December 31, 2024.
The following table presents transactions completed under the 2022 share repurchase program during the periods shown:
| | | | | | | | | | | | | | | | | | | | | | | | | | |
| Period | | Total Number of Shares Purchased | | Average Price Paid per Share | | Total Number of Shares Purchased as Part of Publicly Announced Program | | Maximum Dollar Value of Shares That May Yet be Purchased Under the Program |
| | | (In Thousands) | | | | (In Thousands) | | (In Millions) |
| Inception through October 31, 2022 | | 1,800 | | $ | 41.81 | | | 1,800 | | $ | 925 | |
| November 1 through November 30, 2022 | | 4,089 | | $ | 42.74 | | | 4,089 | | $ | 750 | |
| December 1 through December 31, 2022 | | — | | $ | — | | | — | | $ | 750 | |
| Inception through December 31, 2022 | | 5,889 | | $ | 42.45 | | | 5,889 | | |
| | | | | | | | |
| January 1 through January 31, 2023 | | — | | $ | — | | | — | | $ | 750 | |
| February 1 through February 28, 2023 | | — | | $ | — | | | — | | $ | 750 | |
| March 1 through March 31, 2023 | | 906 | | $ | 55.03 | | | 906 | | $ | 700 | |
| April 1 through April 30, 2023 | | — | | $ | — | | | — | | $ | 700 | |
| May 1 through May 31, 2023 | | 580 | | $ | 69.17 | | | 580 | | $ | 660 | |
| June 1 through June 30, 2023 | | — | | $ | — | | | — | | $ | 660 | |
| July 1 through July 31, 2023 | | — | | $ | — | | | — | | $ | 660 | |
| August 1 through August 31, 2023 | | — | | $ | — | | | — | | $ | 660 | |
| September 1 through September 30, 2023 | | — | | $ | — | | | — | | $ | 660 | |
| October 1 through October 31, 2023 | | — | | $ | — | | | — | | $ | 660 | |
| November 1 through November 30, 2023 | | 982 | | $ | 67.12 | | | 982 | | $ | 594 | |
| December 1 through December 31, 2023 | | 644 | | $ | 68.53 | | | 644 | | $ | 550 | |
| Year ended December 31, 2023 | | 3,112 | | $ | 64.27 | | | 3,112 | | |
| | | | | | | | |
| January 1 through January 31, 2024 | | — | | $ | — | | | — | | $ | 550 | |
| February 1 through February 29, 2024 | | — | | $ | — | | | — | | $ | 550 | |
| March 1 through March 31, 2024 | | 2,811 | | $ | 98.86 | | | 2,811 | | $ | 272 | |
| April 1 through April 30, 2024 | | — | | $ | — | | | — | | $ | 272 | |
| May 1 through May 31, 2024 | | — | | $ | — | | | — | | $ | 272 | |
| June 1 through June 30, 2024 | | 1,990 | | $ | 135.85 | | | 1,990 | | $ | 2 | |
| July 1 through July 31, 2024 | | — | | $ | — | | | — | | $ | 2 | |
| August 1 through August 31, 2024 | | — | | $ | — | | | — | | $ | 2 | |
| September 1 through September 30, 2024 | | — | | $ | — | | | — | | $ | 2 | |
| October 1 through October 31, 2024 | | — | | $ | — | | | — | | $ | 2 | |
| November 1 through November 30, 2024 | | — | | $ | — | | | — | | $ | 2 | |
| December 1 through December 31, 2024 | | — | | $ | — | | | — | | $ | 2 | |
| Year ended December 31, 2024 | | 4,801 | | $ | 114.19 | | | 4,801 | | |
2024 Share Repurchase Program
In July 2024, our board of directors authorized the repurchase of up to $1.500 billion of our common stock through a share repurchase program that has no expiration date (the “2024 share repurchase program”). Similar to the 2022 share repurchase program, repurchases under the 2024 program may be made in open‑market or privately negotiated transactions, at management’s discretion subject to market conditions and other factors, and in a manner consistent with applicable securities
laws and regulations. The 2024 share repurchase program does not obligate us to acquire any particular amount of common stock, and it may be suspended for periods or discontinued at any time.
The following table presents transactions completed under the 2024 share repurchase program during the periods shown:
| | | | | | | | | | | | | | | | | | | | | | | | | | | | |
| Period | | | | Total Number of Shares Purchased | | Average Price Paid per Share | | Total Number of Shares Purchased as Part of Publicly Announced Program | | Maximum Dollar Value of Shares That May Yet be Purchased Under the Program |
| | | | | (In Thousands) | | | | (In Thousands) | | (In Millions) |
| Inception through July 31, 2024 | | | | — | | $ | — | | | — | | $ | 1,500 | |
| August 1 through August 31, 2024 | | | | — | | $ | — | | | — | | $ | 1,500 | |
| September 1 through September 30, 2024 | | | | 795 | | $ | 155.95 | | | 795 | | $ | 1,376 | |
| October 1 through October 31, 2024 | | | | — | | $ | — | | | — | | $ | 1,376 | |
| November 1 through November 30, 2024 | | | | — | | $ | — | | | — | | $ | 1,376 | |
| December 1 through December 31, 2024 | | | | — | | $ | — | | | — | | $ | 1,376 | |
| Inception through December 31, 2024 | | | | 795 | | $ | 155.95 | | | 795 | | |
NOTE 3. ACCOUNTS RECEIVABLE
The principal components of accounts receivable are presented in the table below:
| | | | | | | | | | | |
| December 31, |
| | 2024 | | 2023 |
| | | |
| Patient accounts receivable | $ | 2,386 | | | $ | 2,719 | |
| Estimated future recoveries | 144 | | | 148 | |
| Net cost reports and settlements receivable and valuation allowances | 6 | | | 47 | |
| | | |
| | | |
Accounts receivable, net | $ | 2,536 | | | $ | 2,914 | |
Patient accounts receivable, including billed accounts and certain unbilled accounts, as well as estimated amounts due from third‑party payers for retroactive adjustments, are receivables if our right to consideration is unconditional and only the passage of time is required before payment of that consideration is due. Estimated uncollectable amounts are generally considered implicit price concessions that are a direct reduction to patient accounts receivable rather than allowance for doubtful accounts.
We also provide financial assistance through our charity and uninsured discount programs to uninsured patients who are unable to pay for the healthcare services they receive. Our policy is not to pursue collection of amounts determined to qualify for financial assistance; therefore, we do not report these amounts in net operating revenues. Most states include an estimate of the cost of charity care in the determination of a hospital’s eligibility for Medicaid disproportionate share hospital payments. These payments are intended to mitigate our cost of uncompensated care.
Some states have also developed provider fee or other supplemental payment programs to mitigate the shortfall of Medicaid reimbursement compared to the cost of caring for Medicaid patients. We participate in various provider fee programs, which help reduce the amount of uncompensated care for indigent patients and those covered by Medicaid.
The following table presents the amount and classification of assets and liabilities in the accompanying Consolidated Balance Sheets related to California’s provider fee program:
| | | | | | | | | | | |
| December 31, |
| | 2024 | | 2023 |
| Assets: | | | |
| Other current assets | $ | 334 | | | $ | 329 | |
| Investments and other assets | $ | 274 | | | $ | 334 | |
| | | |
| Liabilities: | | | |
| Other current liabilities | $ | 126 | | | $ | 172 | |
| Other long-term liabilities | $ | 102 | | | $ | 135 | |
Uninsured and Charity Patient Costs
The following table presents our estimated costs (based on selected operating expenses, which include salaries, wages and benefits, supplies and other operating expenses) of caring for our uninsured and charity patients:
| | | | | | | | | | | | | | | | | |
| | Years Ended December 31, |
| | 2024 | | 2023 | | 2022 |
| Estimated costs for: | | | | | |
| Uninsured patients | $ | 535 | | | $ | 499 | | | $ | 537 | |
| Charity care patients | 82 | | | 110 | | | 83 | |
| Total | $ | 617 | | | $ | 609 | | | $ | 620 | |
NOTE 4. CONTRACT BALANCES
Hospital Operations Segment
Our Hospital Operations segment’s contract assets and liabilities primarily derive from: (1) patients receiving ongoing inpatient care from one of our facilities at the end of the reporting period; and (2) timing differences between our performance of revenue cycle management and other contract-based services and the invoicing or receipt of payment for these services. Our Hospital Operations segment’s contract assets were included in other current assets, and its contract liabilities were included in other current liabilities or other long‑term liabilities, depending upon when we expect to recognize the underlying revenue, in the accompanying Consolidated Balance Sheets at December 31, 2024 and 2023.
The opening and closing balances of our Hospital Operations segment’s receivables, contract assets, and current and long‑term contract liabilities were as follows:
| | | | | | | | | | | | | | | | | | | | | | | | | | |
| | Receivables | | Contract Assets –
Unbilled Revenue | | Contract Liabilities –
Current
Deferred Revenue | | Contract Liabilities –
Long-Term
Deferred Revenue |
| December 31, 2023 | | $ | 21 | | | $ | 208 | | | $ | 59 | | | $ | 12 | |
| December 31, 2024 | | 28 | | | 190 | | | 80 | | | 13 | |
| Increase (decrease) | | $ | 7 | | | $ | (18) | | | $ | 21 | | | $ | 1 | |
| | | | | | | | |
| December 31, 2022 | | $ | 37 | | | $ | 200 | | | $ | 110 | | | $ | 13 | |
| December 31, 2023 | | 21 | | | 208 | | | 59 | | | 12 | |
| Increase (decrease) | | $ | (16) | | | $ | 8 | | | $ | (51) | | | $ | (1) | |
The differences between the balances of our contract assets at December 31, 2024 and 2023 and the differences between December 31, 2023 and 2022 were both primarily related to patients who were receiving inpatient acute care and specialty hospital services as of each year‑end date, but who were discharged during the following year. In the years ended December 31, 2024 and 2023, we recognized revenue totaling $58 million and $71 million, respectively, from our revenue cycle management services that was included in the opening current deferred revenue liability. This revenue consists primarily of prepayments for those contract clients who were billed in advance, changes in estimates related to metric‑based services and up‑front integration services that are recognized over the service period.
Contract Costs—We recognized amortization expense related to deferred contract setup costs of $3 million, $5 million and $4 million during the years ended December 31, 2024, 2023 and 2022, respectively. At December 31, 2024 and 2023, unamortized client contract setup costs were $19 million and $22 million, respectively, and were presented as part of investments and other assets in the accompanying Consolidated Balance Sheets.
NOTE 5. DISPOSITION OF ASSETS AND LIABILITIES
In November 2023, we entered into a definitive agreement for the sale of three hospitals located in South Carolina and certain related operations (together, the “SC Hospitals”), all of which were held by our Hospital Operations segment. The assets and liabilities related to the SC Hospitals were included in assets held for sale and liabilities held for sale, respectively, in the accompanying Consolidated Balance Sheet at December 31, 2023. We completed the sale of the SC Hospitals in January 2024, resulting in the recognition of a pre-tax gain on sale of $1.677 billion in the year ended December 31, 2024.
In January 2024, we entered into a definitive agreement for the sale of four hospitals and certain related operations located in Orange County and Los Angeles County, California (the “OCLA CA Hospitals”), including facilities from both our
Hospital Operations and Ambulatory Care segments. We completed the sale of the OCLA CA Hospitals in March 2024, resulting in the recognition of a pre-tax gain on sale of $527 million in the year ended December 31, 2024.
In February 2024, we entered into a definitive agreement for the sale of two hospitals and certain related operations located in San Luis Obispo County, California (the “Central CA Hospitals”), all of which were held by our Hospital Operations segment. We completed the sale of the Central CA Hospitals in March 2024, resulting in the recognition of a pre-tax gain on sale of $275 million in the year ended December 31, 2024.
In August 2024, we entered into a definitive agreement for the sale of our majority ownership interests in several entities that owned or leased five hospitals and certain related operations, all located in Alabama (collectively, the “AL Hospitals”), including facilities from both our Hospital Operations and Ambulatory Care segments. We recognized a net pre-tax gain on sale of $353 million when this transaction closed in September 2024.
We completed the sale of six additional ambulatory surgery centers held by our Ambulatory Care segment during the year ended December 31, 2024, resulting in the recognition of a total pre-tax gain on the sales of $46 million.
In January 2023, we entered into a definitive agreement to sell our 51% ownership interest in San Ramon Regional Medical Center and certain related operations (“San Ramon RMC”), which is held by our Hospital Operations segment, to John Muir Health (“John Muir”). We reclassified the assets and liabilities related to San Ramon RMC to assets held for sale and liabilities held for sale, respectively, in our consolidated balance sheet following our decision to sell our ownership interest. During the three months ended December 31, 2023, John Muir announced it no longer intended to pursue the acquisition after the U.S. Federal Trade Commission took action to challenge the transaction, following which we removed the assets and liabilities from held for sale and reclassified them as held and used in our consolidated balance sheet.
Gains recognized from the disposition of the assets described above were included in net gains on sales, consolidation and deconsolidation of facilities in the accompanying Consolidated Statement of Operations for the year ended December 31, 2024.
Assets and liabilities classified as held for sale at December 31, 2024 were comprised of the following:
| | | | | | | | | | | | |
| | | | | | |
| | | | | | |
| Current assets | | | | $ | 5 | | | |
| | | | | | |
| | | | | | |
| Other intangible assets | | | | 16 | | | |
| | | | | | |
| Current liabilities | | | | (13) | | | |
| | | | | | |
| | | | | | |
| Net assets held for sale | | | | $ | 8 | | | |
The following table presents amounts included in income before income taxes related to a significant component of our business that was recently disposed of:
| | | | | | | | | | | | | | | | | |
| | Years Ended December 31, |
| | 2024 | | 2023 | | 2022 |
| | | | | |
| | | | | |
| SC Hospitals (includes a $1.677 billion gain on sale in 2024) | $ | 1,687 | | | $ | 130 | | | $ | 127 | |
| | | | | |
| | | | | |
| | | | | |
| | | | | |
| | | | | |
| | | | | |
NOTE 6. IMPAIRMENT AND RESTRUCTURING CHARGES, AND ACQUISITION-RELATED COSTS
We recognized impairment charges on certain assets in 2024, 2023 and 2022 because the fair values of those assets or groups of assets indicated that the carrying amount was not recoverable. The fair value estimates were derived from third‑party appraisals, established market values of comparable assets, or internally developed estimates of future net cash flows. These fair value estimates can change by material amounts in subsequent periods. Many factors and assumptions can impact the estimates, including the future financial results of the facilities, how the facilities are operated in the future, changes in healthcare industry trends and regulations, and the nature of the ultimate disposition of the assets. In certain cases, these fair value estimates assume the highest and best use of facility assets in the future to a marketplace participant is other than as a medical facility. In these cases, the estimates are based on the fair value of the real property and equipment if utilized other than as a medical facility. The impairment recognized does not include the costs of closing the facilities or other future operating costs, which could be substantial. Accordingly, the ultimate net cash realized from the facilities, should we choose to sell them, could be significantly less than their impaired value.
Our impairment tests presume stable, improving or, in some cases, declining operating results in our facilities, which are based on programs and initiatives being implemented that are designed to achieve each facility’s most recent projections. If
these projections are not met, or negative trends occur that impact our future outlook, future impairments of long-lived assets and goodwill may occur, and we may incur additional restructuring charges, which could be material.
Our reporting segments are the reporting units used to perform our goodwill analysis. At December 31, 2024, our business was organized into two reporting segments: Hospital Operations and Services and Ambulatory Care. We performed our annual goodwill impairment analysis as of October 1, 2024, which did not result in the recognition of an impairment.
We periodically incur costs to implement restructuring efforts for specific operations, which are recorded in our statement of operations as they are incurred. Our restructuring plans focus on various aspects of operations, including aligning our operations in the most strategic and cost‑effective structure, such as the establishment of support operations at our GBC. Certain restructuring and acquisition‑related costs are based on estimates. Changes in estimates are recognized as they occur.
Year Ended December 31, 2024
During the year ended December 31, 2024, we recorded impairment and restructuring charges and acquisition‑related costs of $102 million, consisting of $56 million of restructuring charges, $39 million of acquisition‑related transaction costs and $7 million of impairment charges. Restructuring charges consisted of $17 million of legal costs related to the sale of certain businesses, $12 million of contract and lease termination fees, $11 million of employee severance costs, $9 million related to the transition of various administrative functions to our GBC and $7 million of other restructuring costs. During the year ended December 31, 2024, our Hospital Operations and Ambulatory Care segments recognized impairment charges totaling $1 million and $6 million, respectively. Impairment charges recognized during 2024 primarily related to the write-down of certain intangible assets held by our Ambulatory Care segment to their estimated fair value.
Year Ended December 31, 2023
During the year ended December 31, 2023, we recorded impairment and restructuring charges and acquisition-related costs of $137 million, consisting of $79 million of restructuring charges, $43 million of impairment charges and $15 million of acquisition‑related transaction costs. Restructuring charges consisted of $36 million of legal costs related to the sale of certain businesses, $15 million of employee severance costs, $12 million related to the transition of various administrative functions to our GBC, $10 million of contract and lease termination fees, and $6 million of other restructuring costs. Impairment charges for the year ended December 31, 2023 primarily arose from the write‑down of our investment in certain equity method investments held by our Ambulatory Care segment.
Year Ended December 31, 2022
During the year ended December 31, 2022, we recorded impairment and restructuring charges and acquisition‑related costs of $226 million, consisting of $118 million of restructuring charges, $94 million of impairment charges and $14 million of acquisition‑related transaction costs. Restructuring charges consisted of $27 million of employee severance costs, $16 million related to the transition of various administrative functions to our GBC, $32 million of contract and lease termination fees, and $43 million of other restructuring costs.
Impairment charges included $82 million for the write‑down of certain buildings and medical equipment located in one of our markets to their estimated fair values, which assets are part of our Hospital Operations segment. Material adverse trends in our estimates of future undiscounted cash flows of the hospitals indicated the aggregate carrying value of the hospitals’ long‑lived assets was not recoverable from their estimated future cash flows. We believe the most significant factors contributing to the adverse financial trends included decreased revenues and lower patient volumes due to the then ongoing COVID-19 pandemic and competition, as well as higher labor costs because of the pandemic. As a result, we updated the estimate of the fair value of the hospitals’ long‑lived assets and compared it to the aggregate carrying value of those assets. Because the fair value estimates were lower than the aggregate carrying value of the long‑lived assets, an impairment charge was recorded for the difference in the amounts. The aggregate carrying value of the hospitals’ assets held and used for which impairment charges were recorded was $167 million at December 31, 2022. Impairment charges for the year ended December 31, 2022 were comprised of $88 million from our Hospital Operations segment and $6 million from our Ambulatory Care segment.
NOTE 7. LEASES
The following table presents the components of our right‑of‑use assets and liabilities related to leases and their classification in our Consolidated Balance Sheets:
| | | | | | | | | | | | | | | | | | | | |
| | | | December 31, |
| Component of Lease Balances | | Classification in Consolidated Balance Sheets | | 2024 | | 2023 |
| Assets: | | | | | | |
| Operating lease assets | | Investments and other assets | | $ | 1,037 | | | $ | 1,083 | |
| Finance lease assets | | Property and equipment, at cost, less accumulated depreciation and amortization | | 454 | | | 253 | |
| Total leased assets | | | | $ | 1,491 | | | $ | 1,336 | |
| | | | | | |
| Liabilities: | | | | | | |
| Operating lease liabilities: | | | | | | |
| Current | | Other current liabilities | | $ | 204 | | | $ | 204 | |
| Long-term | | Other long-term liabilities | | 950 | | | 1,007 | |
| Total operating lease liabilities | | | | 1,154 | | | 1,211 | |
| Finance lease liabilities: | | | | | | |
| Current | | Current portion of long-term debt | | 54 | | | 84 | |
| Long-term | | Long-term debt, net of current portion | | 390 | | | 120 | |
| Total finance lease liabilities | | | | 444 | | | 204 | |
| Total lease liabilities | | | | $ | 1,598 | | | $ | 1,415 | |
The following table presents the components of our lease expense and their classification in our consolidated statements of operations:
| | | | | | | | | | | | | | | | | | | | | | | | | | | | |
| Component of Lease Expense | | Classification in Consolidated Statements of Operations | | | | Years Ended December 31, |
| | | | 2024 | | 2023 | | 2022 |
| Operating lease expense | | Other operating expenses, net | | | | $ | 257 | | | $ | 259 | | | $ | 262 | |
| Finance lease expense: | | | | | | | | | | |
| Amortization of leased assets | | Depreciation and amortization | | | | 49 | | | 55 | | | 58 | |
| Interest on lease liabilities | | Interest expense | | | | 7 | | | 8 | | | 8 | |
| Total finance lease expense | | | | | | 56 | | | 63 | | | 66 | |
| Variable and short term-lease expense | | Other operating expenses, net | | | | 160 | | | 159 | | | 150 | |
| Total lease expense | | | | | | $ | 473 | | | $ | 481 | | | $ | 478 | |
The weighted‑average lease terms and discount rates for operating and finance leases are presented in the following table:
| | | | | | | | | | | | | | | | | | | | |
| | Years Ended December 31, |
| | 2024 | | 2023 | | 2022 |
| Weighted-average remaining lease term (years): | | | | | | |
| Operating leases | | 6.8 | | 7.6 | | 8.0 |
| Finance leases | | 24.6 | | 6.0 | | 5.5 |
| | | | | | |
| Weighted-average discount rate: | | | | | | |
| Operating leases | | 5.2 | % | | 5.0 | % | | 4.8 | % |
| Finance leases | | 6.5 | % | | 6.5 | % | | 5.9 | % |
Cash flow and other information related to leases is included in the following table:
| | | | | | | | | | | | | | | | | | | | |
| | Years Ended December 31, |
| | 2024 | | 2023 | | 2022 |
| Cash paid for amounts included in the measurement of lease liabilities: | | | | | | |
| Operating cash outflows from operating leases | | $ | 252 | | | $ | 258 | | | $ | 250 | |
| Operating cash outflows from finance leases | | $ | 10 | | | $ | 13 | | | $ | 14 | |
| Financing cash outflows from finance leases | | $ | 87 | | | $ | 107 | | | $ | 118 | |
| | | | | | |
| Right-of-use assets obtained in exchange for lease obligations: | | | | | | |
| Operating leases | | $ | 292 | | | $ | 168 | | | $ | 341 | |
| Finance leases | | $ | 363 | | | $ | 55 | | | $ | 97 | |
Future maturities of lease liabilities at December 31, 2024 are presented in the following table:
| | | | | | | | | | | | | | | | | | | | |
| | Operating Leases | | Finance Leases | | Total |
| 2025 | | $ | 261 | | | $ | 63 | | | $ | 324 | |
| 2026 | | 230 | | | 38 | | | 268 | |
| 2027 | | 203 | | | 116 | | | 319 | |
| 2028 | | 168 | | | 26 | | | 194 | |
| 2029 | | 133 | | | 25 | | | 158 | |
| Later years | | 397 | | | 547 | | | 944 | |
| Total lease payments | | 1,392 | | | 815 | | | 2,207 | |
| Less: Imputed interest | | 238 | | | 371 | | | 609 | |
| Total lease obligations | | 1,154 | | | 444 | | | 1,598 | |
| Less: Current obligations | | 204 | | | 54 | | | 258 | |
| Long-term lease obligations | | $ | 950 | | | $ | 390 | | | $ | 1,340 | |
In May 1997, we entered into a 30‑year lease agreement for a medical campus located in Palm Springs, California. In December 2024, we executed a lease-purchase agreement to establish a new 30‑year lease beginning upon the expiration of the original lease in May 2027. This agreement includes an initial payment of $100 million at the start of the new lease term, followed by 19 annual escalating lease payments. Following our remittance of a final payment of $100 million in May 2057, ownership of certain of the leased facilities and land will transfer to us. We recognized a $303 million right‑of‑use asset and a long-term finance lease liability in the same amount in connection with the lease-purchase agreement.
NOTE 8. LONG-TERM DEBT
The table below presents our long‑term debt included in the accompanying Consolidated Balance Sheets:
| | | | | | | | | | | |
| December 31, |
| | 2024 | | 2023 |
| Senior unsecured notes: | | | |
| 6.125% due 2028 | $ | 2,500 | | | $ | 2,500 | |
| 6.875% due 2031 | 362 | | | 362 | |
| Senior secured first lien notes: | | | |
| | | |
| | | |
| 4.875% due 2026 | — | | | 2,100 | |
| 5.125% due 2027 | 1,500 | | | 1,500 | |
| 4.625% due 2028 | 600 | | | 600 | |
| 4.250% due 2029 | 1,400 | | | 1,400 | |
| 4.375% due 2030 | 1,450 | | | 1,450 | |
| 6.125% due 2030 | 2,000 | | | 2,000 | |
| 6.750% due 2031 | 1,350 | | | 1,350 | |
| Senior secured second lien notes: | | | |
| 6.250% due 2027 | 1,500 | | | 1,500 | |
| Finance leases, mortgages and other notes | 605 | | | 361 | |
| Unamortized issue costs and note discounts | (94) | | | (121) | |
| Total long-term debt | 13,173 | | | 15,002 | |
| Less: Current portion | 92 | | | 120 | |
| Long-term debt, net of current portion | $ | 13,081 | | | $ | 14,882 | |
Senior Unsecured Notes and Senior Secured Notes
At December 31, 2024, we had senior unsecured notes and senior secured notes with aggregate principal amounts outstanding of $12.662 billion. These notes have fixed interest rates ranging from 4.250% to 6.875% and require semi‑annual interest payments in arrears. A payment of the principal and any accrued but unpaid interest is due upon the maturity date of the respective notes, which dates are staggered from February 2027 through November 2031.
In March 2024, we redeemed all $2.100 billion aggregate principal amount outstanding of our 4.875% senior secured first lien notes due 2026 in advance of their maturity date. We paid $2.100 billion using cash on hand to redeem the notes. In connection with the redemption, we recorded a loss from early extinguishment of debt of $8 million in the three months ended March 31, 2024, primarily related to the write-off of associated unamortized issuance costs.
We completed the following transactions during the year ended December 31, 2023:
•In May 2023, we issued $1.350 billion aggregate principal amount of 6.750% senior secured first lien notes, which will mature on May 15, 2031 (the “2031 Senior Secured First Lien Notes”). We pay interest on the 2031 Senior Secured First Lien Notes semi-annually in arrears on May 15 and November 15 of each year. We used the issuance proceeds, together with cash on hand, to finance the redemption of our 4.625% senior secured first lien notes due September 2024 (the “September 2024 Senior Secured First Lien Notes”) and our 4.625% senior secured first lien notes due July 2024 (the “July 2024 Senior Secured First Lien Notes”), as described below.
•Also in May 2023, we paid $596 million using a portion of the proceeds from the issuance of our 2031 Senior Secured First Lien Notes to redeem all $589 million aggregate principal amount outstanding of our September 2024 Senior Secured First Lien Notes in advance of their maturity date.
•In June 2023, we used the remaining proceeds from the issuance of our 2031 Senior Secured First Lien Notes along with cash on hand to redeem all $756 million aggregate principal amount outstanding of our July 2024 Senior Secured First Lien Notes in advance of their maturity date.
We recorded net losses from the early extinguishment of debt of $11 million in connection with the aforementioned redemptions during the year ended December 31, 2023. These losses primarily derived from differences between the redemption prices and the par values of the notes, as well as the write‑off of associated unamortized issuance costs.
All of our senior secured notes are guaranteed by certain of our wholly owned domestic hospital company subsidiaries and secured by a pledge of the capital stock and other ownership interests of those subsidiaries on either a first lien or second
lien basis, as indicated in the table above. All of our senior secured notes and the related subsidiary guarantees are our and the subsidiary guarantors’ senior secured obligations. All of our senior secured notes rank equally in right of payment with all of our other senior secured indebtedness. Our senior secured notes rank senior to any subordinated indebtedness that we or such subsidiary guarantors may incur; they are effectively senior to our and such subsidiary guarantors’ existing and future unsecured indebtedness and other liabilities to the extent of the value of the collateral securing the notes and the subsidiary guarantees; they are effectively subordinated to our and such subsidiary guarantors’ obligations under our senior secured revolving credit facility (as amended to date, the “Credit Agreement”) to the extent of the value of the collateral securing borrowings thereunder; and they are structurally subordinated to all obligations of our non‑guarantor subsidiaries.
The indentures setting forth the terms of our senior secured notes contain provisions governing our ability to redeem the notes and the terms by which we may do so. On or after the call dates specified in the indentures and at our option, we may redeem our senior secured notes, in whole or in part, at the specified redemption prices set forth in the applicable indenture, together with accrued and unpaid interest. In addition, we may be required to purchase for cash all or any part of each series of our senior secured notes upon the occurrence of a change of control (as defined in the applicable indentures) for a cash purchase price of 101% of the aggregate principal amount of the notes, plus accrued and unpaid interest.
All of our senior unsecured notes are general unsecured senior debt obligations that rank equally in right of payment with all of our other unsecured senior indebtedness, but are effectively subordinated to our senior secured notes described above, the obligations of our subsidiaries and any obligations under our Credit Agreement to the extent of the value of the collateral. We may redeem either series of our senior unsecured notes, in whole or in part, at any time at the specified redemption prices (plus, in the case of one series of notes, a make-whole premium) set forth in the applicable indenture, together with accrued and unpaid interest.
Credit Agreement
Our Credit Agreement provides for revolving loans in an aggregate principal amount of up to $1.500 billion with a $200 million subfacility for standby letters of credit and has a scheduled maturity date of March 16, 2027. Outstanding revolving loans accrue interest depending on the type of loan at either (1) a base rate plus an applicable margin ranging from 0.25% to 0.75% per annum or (2) Term Secured Overnight Financing Rate (“SOFR”), Daily Simple SOFR or the Euro Interbank Offered Rate (EURIBOR) (each, as defined in the Credit Agreement) plus an applicable margin ranging from 1.25% to 1.75% per annum and (in the case of Term SOFR and Daily Simple SOFR only) a credit spread adjustment of 0.10%, in each case based on available credit. An unused commitment fee payable on the undrawn portion of the revolving loans ranges from 0.25% to 0.375% per annum based on available credit. Obligations under the Credit Agreement are guaranteed by substantially all of our domestic wholly owned hospital subsidiaries and secured by a first‑priority lien on eligible inventory and accounts receivable, including receivables for Medicaid supplemental payments.
Our borrowing availability, which is based on a specified percentage of this eligible inventory and accounts receivable, was $1.327 billion at December 31, 2024. On that date, we had no cash borrowings outstanding under the Credit Agreement, and we had less than $1 million of standby letters of credit outstanding.
Letter of Credit Facility
We have a letter of credit facility (as amended to date, the “LC Facility”) that provides for the issuance, from time to time, of standby and documentary letters of credit in an aggregate principal amount of up to $200 million. We amended the LC Facility in September 2023 to, among other things, (1) extend the scheduled maturity date from September 12, 2024 to March 16, 2027, and (2) replace the London Interbank Offered Rate (LIBOR) with Term SOFR as the reference interest rate. Drawings under any letter of credit issued under the LC Facility that we have not reimbursed within three business days after notice thereof accrue interest at a base rate, as defined in the LC Facility, plus a margin of 0.50% per annum. An unused commitment fee is payable at an initial rate of 0.25% per annum with a step up to 0.375% per annum should our secured‑debt‑to‑EBITDA ratio equal or exceed 3.00 to 1.00 at the end of any fiscal quarter. A fee on the aggregate outstanding amount of issued but undrawn letters of credit accrues at a rate of 1.50% per annum. An issuance fee equal to 0.125% per annum of the aggregate face amount of each outstanding letter of credit is payable to the account of the issuer of the related letter of credit. The LC Facility is subject to an effective maximum secured debt covenant of 4.25 to 1.00. Obligations under the LC Facility are guaranteed and secured by a first‑priority pledge of the capital stock and other ownership interests of certain of our wholly owned domestic hospital subsidiaries on an equal‑ranking basis with our senior secured first lien notes. At December 31, 2024, we had $106 million of standby letters of credit outstanding under the LC Facility.
Covenants
Senior Secured Notes—The indentures governing our senior secured notes contain covenants that, among other things, restrict our ability and the ability of our subsidiaries to incur liens, consummate asset sales, enter into sale and lease‑back transactions or consolidate, merge or sell all or substantially all of our or their assets, other than in certain transactions between one or more of our wholly owned subsidiaries. These restrictions, however, are subject to a number of exceptions and qualifications. In particular, there are no restrictions on our ability or the ability of our subsidiaries to incur additional indebtedness, make restricted payments, pay dividends or make distributions in respect of capital stock, purchase or redeem capital stock, enter into transactions with affiliates or make advances to, or invest in, other entities (including unaffiliated entities). In addition, the indentures governing our senior secured notes contain a covenant that neither we nor any of our subsidiaries will incur secured debt, unless at the time of and after giving effect to the incurrence of such debt, the aggregate amount of all such secured debt (including the aggregate principal amount of senior secured notes outstanding and any outstanding borrowings under our Credit Agreement at such time) does not exceed the amount that would cause the secured debt ratio (as defined in the indentures) to exceed 4.00 to 1.00.
Senior Unsecured Notes—The indentures governing our senior unsecured notes contain covenants and conditions that have, among other requirements, limitations on (1) liens on “principal properties” and (2) sale and lease‑back transactions with respect to principal properties. A principal property is defined in the senior unsecured notes indentures as a hospital that has an asset value on our books in excess of 5% of our consolidated net tangible assets, as defined in such indentures. The above limitations do not apply, however, to (1) debt that is not secured by principal properties or (2) debt that is secured by principal properties if the aggregate of such secured debt does not exceed 15% of our consolidated net tangible assets, as further described in the indentures. The senior unsecured notes indentures also prohibit the consolidation, merger or sale of all or substantially all assets unless no event of default would result after giving effect to such transaction.
Credit Agreement—Our Credit Agreement contains customary covenants for an asset‑backed facility, including a minimum fixed charge coverage ratio to be met if the designated excess availability under the revolving credit facility falls below $150 million, as well as limits on debt, asset sales and prepayments of certain other debt. The Credit Agreement also includes a provision, which we believe is customary in receivables‑backed credit facilities, that gives our lenders the right to require that proceeds of collections of substantially all of our consolidated accounts receivable be applied directly to repay outstanding loans and other amounts that are due and payable under the Credit Agreement at any time that unused borrowing availability under the revolving credit facility is less than $150 million for three consecutive business days or if an event of default has occurred and is continuing thereunder. In that event, we would seek to re‑borrow under the Credit Agreement to satisfy our operating cash requirements. Our ability to borrow under the Credit Agreement is subject to conditions that we believe are customary in revolving credit facilities, including that no events of default then exist.
At December 31, 2024, we were in compliance with all applicable covenants and conditions.
Future Maturities
Future long‑term debt maturities, including finance lease obligations were as follows as of December 31, 2024:
| | | | | | | | | | | | | | | | | | | | | | | | | | | | | | | | | | | | | | | | | |
| | | | Years Ending December 31, | | Later Years |
| | Total | | 2025 | | 2026 | | 2027 | | 2028 | | 2029 | |
| Long-term debt, including finance lease obligations | $ | 13,267 | | | $ | 92 | | | $ | 69 | | | $ | 3,096 | | | $ | 3,135 | | | $ | 1,418 | | | $ | 5,457 | |
NOTE 9. GUARANTEES
Consistent with our policy on physician relocation and recruitment, we provide income guarantee agreements to certain physicians who agree to relocate to fill a community need in the service area of one of our hospitals and commit to remain in practice in the area for a specified period of time. Under such agreements, we are required to make payments to the physicians in excess of the amounts they earn in their practices up to the amount of the income guarantee. The income guarantee periods are typically 12 months. If a physician does not fulfill his or her commitment period to the community, which is typically three years subsequent to the guarantee period, we seek recovery of the income guarantee payments from the physician on a prorated basis. We also provide revenue collection guarantees to hospital‑based physician groups providing certain services at our hospitals with terms generally ranging from one to three years.
At December 31, 2024, the maximum potential amount of future payments under our income guarantees to certain physicians who agree to relocate and revenue collection guarantees to hospital‑based physician groups providing certain services at our hospitals was $211 million. We had a total liability of $194 million recorded for these guarantees included in other current liabilities in the accompanying Consolidated Balance Sheet at December 31, 2024.
At December 31, 2024, we also had issued guarantees of the indebtedness and other obligations of our investees to third parties, the maximum potential amount of future payments under which was approximately $92 million. Of the total, $19 million relates to the obligations of consolidated subsidiaries, which obligations were recorded in other current liabilities in the accompanying Consolidated Balance Sheet at December 31, 2024.
NOTE 10. EMPLOYEE BENEFIT PLANS
Share-Based Compensation Plans
We have granted stock options and restricted stock units (“RSUs”) to certain of our employees and directors pursuant to our stock incentive plans. Stock options have an exercise price equal to the fair market value of our shares on the date of grant and generally expire 10 years from the date of grant. An RSU is a contractual right to receive one share of our common stock in the future, and the fair value of the RSU is based on our share price on the grant date. Typically, stock options and time‑based RSUs vest one‑third on each of the first three anniversary dates of the grant; however, certain special retention awards may have different vesting terms. Shares underlying vested RSUs are generally distributed to participants (settled) immediately after the vesting date. We also grant RSUs to our non‑employee directors as part of their annual compensation. Previously, these grants vested immediately and were settled on the third anniversary of the date of grant. Beginning in 2024, annual compensation grants to our non-employee directors vest on the first anniversary of the date of grant. Compensation cost is measured by the fair value of the awards on their grant dates and is recognized over the requisite service period of the awards, whether or not the awards had any intrinsic value during the period.
We also grant performance‑based RSUs that vest subject to the achievement of specified performance goals within a pre‑established time frame. The performance‑based RSUs may contain provisions that increase or decrease the number of RSUs that ultimately vest, depending upon the level of achievement. For certain of our performance‑based awards, the number of RSUs that ultimately vest is also subject to adjustment based on the achievement of a market‑based condition. In aggregate, these adjustments range from 0% to a maximum of 250% of the number of RSUs initially granted for awards made in 2024, from 0% to 225% for awards made in 2023 and from 0% to 200% for awards granted prior to 2023. The fair value of awards that contain a market‑based condition is estimated using a discrete model to analyze the fair value of the subject shares. The discrete model utilizes multiple stock paths, through the use of a Monte Carlo simulation, which paths are then analyzed to determine the fair value of the subject shares.
Pursuant to the terms of our stock‑based compensation plans, awards granted under the plan vest and may be exercised as determined by the human resources committee of our board of directors. In the event of a change in control, the human resources committee of our board of directors may, at its sole discretion without obtaining shareholder approval, accelerate the vesting or performance periods of the awards.
At December 31, 2024, assuming outstanding performance‑based RSUs for which performance has not yet been determined will achieve target performance, approximately 8,419 thousand shares of common stock were available under our 2019 Stock Incentive Plan for future stock option grants and other equity incentive awards, including RSUs. The accompanying Consolidated Statements of Operations include pre-tax compensation costs related to our stock‑based compensation arrangements of $67 million, $66 million and $56 million for the years ended December 31, 2024, 2023 and 2022, respectively. At December 31, 2024, there were $57 million of total unrecognized compensation costs related to our share-based compensation awards. These costs are expected to be recognized over a weighted average (“Wtd. Avg.”) period of 1.8 years.
Stock Options
The following table presents information about our stock option activity during the years ended December 31, 2024, 2023 and 2022:
| | | | | | | | | | | | | | | | | | | | | | | | | | |
| | | Number of Options | | Wtd. Avg.
Exercise Price
Per Share | | Aggregate
Intrinsic Value | | Wtd. Avg.
Remaining
Contractual Life |
| | | | | | | (In Millions) | | |
| Outstanding at December 31, 2021 | | 520,998 | | | $ | 23.90 | | | | | |
| Exercised | | (60,051) | | | $ | 28.26 | | | | | |
| | | | | | | | |
| Outstanding at December 31, 2022 | | 460,947 | | | $ | 23.33 | | | | | |
| Exercised | | (76,507) | | | $ | 26.07 | | | | | |
| Outstanding at December 31, 2023 | | 384,440 | | | $ | 22.79 | | | | | |
| | | | | | | | |
| Exercised | | (197,943) | | | $ | 21.86 | | | | | |
| | | | | | | | |
| Outstanding at December 31, 2024 | | 186,497 | | | $ | 23.76 | | | $ | 19 | | | 3.4 years |
| | | | | | | | |
| | | | | | | | |
The stock options exercised during the year ended December 31, 2024 had an aggregate intrinsic value of $19 million, and the stock options exercised during both of the years ended December 31, 2023 and 2022 had aggregate intrinsic values of $4 million. We did not grant any stock options during the years ended December 31, 2024, 2023 or 2022, and all outstanding options were vested and exercisable at December 31, 2024.
The following table presents additional information about our outstanding stock options at December 31, 2024:
| | | | | | | | | | | | | | | | | | | | | | | | |
| | | Options Outstanding and Exercisable | | |
| Range of Exercise Prices | | Number of
Options | | Wtd. Avg.
Remaining
Contractual Life | | Wtd. Avg.
Exercise Price
Per Share | | | | |
| $18.99 to $20.609 | | 119,285 | | | 3.0 years | | $ | 20.35 | | | | | |
| $20.61 to $35.430 | | 67,212 | | | 4.0 years | | $ | 29.82 | | | | | |
| | | 186,497 | | | 3.4 years | | $ | 23.76 | | | | | |
As of December 31, 2024, 20.1% of all our outstanding options were held by current employees and 79.9% were held by former employees. All of our outstanding options were in‑the‑money, that is, they had exercise price less than the $126.23 market price of our common stock on December 31, 2024.
Restricted Stock Units
The following table presents information about our RSU activity during the years ended December 31, 2024, 2023 and 2022:
| | | | | | | | | | | | | | |
| | | Number of RSUs | | Wtd. Avg. Grant Date Fair
Value Per RSU |
| Unvested at December 31, 2021 | | 2,171,202 | | | $ | 40.51 | |
| Granted | | 641,205 | | | $ | 80.79 | |
| Vested | | (1,187,384) | | | $ | 37.18 | |
| Forfeited | | (104,605) | | | $ | 53.58 | |
| Unvested at December 31, 2022 | | 1,520,418 | | | $ | 66.36 | |
| Granted | | 759,590 | | | $ | 60.88 | |
| Performance-based adjustment | | 185,901 | | | $ | 48.97 | |
| Vested | | (954,401) | | | $ | 48.75 | |
| Forfeited | | (90,445) | | | $ | 64.61 | |
| Unvested at December 31, 2023 | | 1,421,063 | | | $ | 66.46 | |
| Granted | | 573,033 | | | $ | 94.70 | |
| Performance-based adjustment | | 205,075 | | | $ | 66.51 | |
| Vested | | (684,268) | | | $ | 65.64 | |
| Forfeited | | (32,904) | | | $ | 80.91 | |
| Unvested at December 31, 2024 | | 1,481,999 | | | $ | 83.84 | |
The table below presents information about the time-based RSUs granted during the periods indicated:
| | | | | | | | |
No. of RSUs Granted | | Vesting Terms |
| Granted during the year ended December 31, 2024: |
| 263,714 | | RSUs will vest ratably over a three‑year period from the grant date |
| 11,980 | | RSUs granted to our non-employee directors for the 2024-25 board service year, which will vest on the first anniversary of the grant date |
| | |
| Granted during the year ended December 31, 2023: |
| 309,282 | | RSUs will vest ratably over a three‑year period from the grant date |
| 42,626 | | RSUs will vest on the fifth anniversary of the grant date |
| 42,100 | | RSUs granted to our non-employee directors for the 2023-24 board service year, which vested immediately |
| 33,586 | | RSUs that were scheduled to vest, and did vest, in December 2023 |
| 20,707 | | RSUs will vest upon the relocation of one of our executive officers |
| 2,007 | | RSUs will vest on the third anniversary of the grant date |
| | |
| | | | | | | | |
| Granted during the year ended December 31, 2022: |
| 237,381 | | RSUs will vest ratably over a three‑year period from the grant date |
| 53,716 | | RSUs were scheduled to vest ratably over 11 quarterly periods |
| 35,482 | | RSUs granted to our non-employee directors for the 2022-23 board service year, which vested immediately |
| 9,215 | | RSUs will vest ratably over a four-year period from the grant date |
| 7,325 | | RSUs granted to a non-executive member of the board of directors for his service as chairman of the board; award vested in December 2023 |
| 6,170 | | RSUs will vest evenly on the third and fourth anniversaries of the grant date |
| 4,608 | | RSUs that vested on the second anniversary of the grant date in June 2024 |
The table below presents information about the performance-based RSUs granted during the periods indicated:
| | | | | | | | | | | | | | | | | | | | | | | | | | |
No. of RSUs Granted | | | | Performance Period | | Potential Vesting Range |
| Vesting Terms | | | Minimum | | Maximum |
| Granted during the year ended December 31, 2024: | | | | | | |
| 291,734 | | RSUs will vest on the third anniversary of the grant date | | 2024 to 2026 | | — | % | | 250 | % |
| 5,605 | | RSUs will vest on the third anniversary of the grant date | | 2024 to 2026 | | — | % | | 150 | % |
| | | | | | | | |
| Granted during the year ended December 31, 2023: | | | | | | |
| 301,562 | | RSUs will vest on the third anniversary of the grant date | | 2023 to 2025 | | — | % | | 225 | % |
| | | | | | | | |
| 7,720 | | RSUs will vest on the third anniversary of the grant date | | 2023 to 2025 | | — | % | | 150 | % |
| | | | | | | | |
| Granted during the year ended December 31, 2022: | | | | | | |
| 273,599 | | RSUs will vest on the third anniversary of the grant date | | 2022 to 2024 | | — | % | | 200 | % |
| 13,709 | | RSUs will vest on the third anniversary of the grant date | | 2022 to 2024 | | — | % | | 150 | % |
During the years ended December 31, 2024 and 2023, we issued 205,075 and 185,901 RSUs, respectively, as a result of our level of achievement with respect to previously awarded performance‑based RSUs. A similar issuance was not made during the year ended December 31, 2022.
Included in the 2022 grants were 53,716 time-based RSUs and 53,716 performance-based RSUs granted to our former Executive Chairman. These RSUs vested and settled in October 2022, ahead of their scheduled vesting dates, in accordance with the disability provisions of our stock incentive plan. The performance-based awards vested at 100%.
Compensation costs related to our stock-based compensation arrangements for the years ended December 31, 2024, 2023 and 2022 included $61 million, $46 million and $45 million of pre-tax compensation costs related to our RSUs, respectively.
For certain of the performance-based RSU grants, the number of units that will ultimately vest is subject to adjustment based on the achievement of a market-based condition. The fair value of these RSUs is estimated through the use of a Monte Carlo simulation. Significant inputs used in our valuation of these RSUs included the following:
| | | | | | | | | | | | | | | | | | | | |
| | Years Ended December 31, |
| | 2024 | | 2023 | | 2022 |
| Expected volatility | | 34.9% - 52.1% | | 53.6% - 65.6% | | 39.6% - 68.1% |
| | | | | | |
| Risk-free interest rate | | 4.4% - 4.9% | | 4.2% - 4.8% | | 1.0% - 1.7% |
USPI Management Equity Plan
USPI maintains a separate restricted stock plan (the “USPI Management Equity Plan”) under which it grants RSUs representing a contractual right to receive one share of USPI’s non‑voting common stock in the future. The vesting of RSUs granted under the plan varies based on the terms of the underlying award agreement. Once the RSUs have vested and the subsequent requisite holding period is met, during specified times, the participant can sell the underlying shares to USPI at their estimated fair market value. At our sole discretion, the purchase of any non‑voting common shares can be made in cash or in shares of Tenet’s common stock.
The following table presents information about RSU activity under the USPI Management Equity Plan during the years ended December 31, 2024, 2023 and 2022:
| | | | | | | | | | | | | | |
| | Number of RSUs | | Wtd. Avg. Grant Date Fair
Value Per RSU |
| Unvested at December 31, 2021 | | 1,494,882 | | | $ | 34.13 | |
| | | | |
| Vested | | (369,691) | | | $ | 34.13 | |
| Forfeited | | (202,351) | | | $ | 34.13 | |
| Unvested at December 31, 2022 | | 922,840 | | | $ | 34.13 | |
| | | | |
| Vested | | (303,171) | | | $ | 34.13 | |
| Forfeited | | (11,685) | | | $ | 34.13 | |
| Unvested at December 31, 2023 | | 607,984 | | | $ | 34.13 | |
| | | | |
| Vested | | (598,846) | | | $ | 34.13 | |
| Forfeited | | (1,997) | | | $ | 34.13 | |
| Cancelled | | (7,141) | | | $ | 34.13 | |
| Unvested at December 31, 2024 | | — | | | $ | 34.13 | |
The accompanying Consolidated Statements of Operations for the years ended December 31, 2024, 2023 and 2022 included $6 million, $20 million and $11 million, respectively, of pre-tax compensation costs related to USPI’s management equity plan. USPI did not make any grants under the USPI Management Equity Plan during the years ended December 31, 2024, 2023 or 2022. In October 2024, USPI repurchased all outstanding non-voting shares at their estimated fair value.
Other Employee Benefit and Retirement Plans
Employee Stock Purchase Plan
We have an employee stock purchase plan under which we are currently authorized to issue up to 4,070 thousand shares of common stock to our eligible employees. As of December 31, 2024, there were approximately 2,468 thousand shares available for issuance under our employee stock purchase plan. Under the terms of the plan, eligible employees may elect to have between 1% and 10% of their base earnings withheld each quarter to purchase shares of our common stock. Shares are purchased at a price equal to 95% of the closing price on the last day of the quarter. The plan requires a one‑year holding period for all shares issued. The holding period does not apply upon termination of employment. Under the plan, no individual may purchase, in any year, shares with a fair market value in excess of $25,000. The plan is currently not considered to be compensatory.
We issued the following numbers of shares under our employee stock purchase plan:
| | | | | | | | | | | | | | | | | | | | |
| | | Years Ended December 31, |
| | | 2024 | | 2023 | | 2022 |
| Number of shares (in thousands) | | 33 | | | 69 | | | 98 | |
| Weighted average price | | $ | 121.76 | | | $ | 65.62 | | | $ | 54.19 | |
Defined Contribution Retirement Plans
We maintain various other defined contribution plans for the benefit of our employees. During the years ended December 31, 2024, 2023 and 2022, we incurred total expenses from these plans of $128 million, $126 million and $86 million, respectively, primarily related to our contributions to the plans.
Substantially all of our employees, upon qualification, are eligible to participate in our defined contribution 401(k) plans. Under the plans, employees may contribute a portion of their eligible compensation, which we may match with employer contributions at our discretion. Employer matching contributions will vary depending on which of our subsidiaries employs the participant and whether the employee is covered under a collective bargaining agreement.
Defined Benefit Retirement Plans
We maintain three frozen non‑qualified defined benefit pension plans (“SERPs”) that provide supplemental retirement benefits to certain of our current and former executives. These plans are not funded, and plan obligations for these plans are paid from our working capital. Pension benefits are generally based on years of service and compensation. Upon completing the acquisition of Vanguard Health Systems, Inc. on October 1, 2013, we assumed a frozen qualified defined benefit plan (“DMC
Pension Plan”) covering substantially all of the employees of our Detroit market that were hired prior to June 1, 2003. The benefits paid under the DMC Pension Plan are primarily based on years of service and final average earnings. During the year ended December 31, 2021, the Society of Actuaries issued the MP‑2021 mortality improvement scale, which we incorporated into the estimates of our defined benefit plan obligations at December 31, 2024 and 2023.
The following tables summarize the balance sheet impact, as well as the benefit obligations, funded status and rate assumptions associated with the SERPs and the DMC Pension Plan based on actuarial valuations prepared:
| | | | | | | | | | | | | | |
| | | December 31, |
| | | 2024 | | 2023 |
| Reconciliation of funded status of plans and the amounts included in the Consolidated Balance Sheets: | | | | |
Projected benefit obligations(1) | | | | |
| Beginning obligations | | $ | (951) | | | $ | (1,002) | |
| | | | |
| Interest cost | | (49) | | | (53) | |
| Actuarial gain (loss) | | 22 | | | (15) | |
| Benefits paid | | 83 | | | 84 | |
| Annuity purchase | | — | | | 36 | |
| Special termination benefit costs | | — | | | (1) | |
| Ending obligations | | (895) | | | (951) | |
| Fair value of plans assets | | | | |
| Beginning plan assets | | 592 | | | 648 | |
| Gain (loss) on plan assets | | (3) | | | 41 | |
| Employer contribution | | 42 | | | — | |
| Benefits paid | | (58) | | | (61) | |
| Annuity purchase | | — | | | (36) | |
| Ending plan assets | | 573 | | | 592 | |
| Funded status of plans | | $ | (322) | | | $ | (359) | |
| | | | |
| Amounts recognized in the Consolidated Balance Sheets consist of: | | | | |
| Other current liability | | $ | (24) | | | $ | (24) | |
| Other long-term liability | | $ | (298) | | | $ | (335) | |
| Accumulated other comprehensive loss | | $ | 225 | | | $ | 224 | |
| | | | |
| SERP Assumptions: | | | | |
| Discount rate | | 5.75 | % | | 5.50 | % |
| Compensation increase rate | | 3.00 | % | | 3.00 | % |
| Measurement date | | December 31, 2024 | | December 31, 2023 |
| | | | |
| DMC Pension Plan Assumptions: | | | | |
| Discount rate | | 5.69 | % | | 5.25 | % |
| Compensation increase rate | | Frozen | | Frozen |
| Measurement date | | December 31, 2024 | | December 31, 2023 |
(1)The accumulated benefit obligation at December 31, 2024 and 2023 was approximately $895 million and $951 million, respectively.
The components of net periodic benefit costs and related assumptions are as follows:
| | | | | | | | | | | | | | | | | | | | |
| | | Years Ended December 31, |
| | | 2024 | | 2023 | | 2022 |
| | | | | | |
| Interest costs | | $ | 49 | | | $ | 53 | | | $ | 37 | |
| Expected return on plan assets | | (29) | | | (36) | | | (42) | |
| Amortization of net actuarial loss | | 8 | | | 7 | | | 9 | |
| Special termination benefit costs | | — | | | 1 | | | — | |
| Net periodic benefit cost | | $ | 28 | | | $ | 25 | | | $ | 4 | |
| | | | | | |
| SERP Assumptions: | | | | | | |
| Discount rate | | 5.50 | % | | 5.75 | % | | 3.00 | % |
| | | | | | |
| Compensation increase rate | | 3.00 | % | | 3.00 | % | | 3.00 | % |
| Measurement date | | January 1, 2024 | | January 1, 2023 | | January 1, 2022 |
| Census date | | January 1, 2024 | | January 1, 2023 | | January 1, 2022 |
| | | | | | |
| DMC Pension Plan Assumptions: | | | | | | |
| Discount rate | | 5.25 | % | | 5.51 | % | | 2.89 | % |
| Long-term rate of return on assets | | 5.00 | % | | 5.75 | % | | 5.00 | % |
| Compensation increase rate | | Frozen | | Frozen | | Frozen |
| Measurement date | | January 1, 2024 | | January 1, 2023 | | January 1, 2022 |
| Census date | | January 1, 2024 | | January 1, 2023 | | January 1, 2022 |
Net periodic benefit costs for the current year are based on assumptions determined at the valuation date of the prior year for the SERPs and the DMC Pension Plan.
We recorded gain (loss) adjustments of $(1) million, $(2) million and $72 million in other comprehensive income in the years ended December 31, 2024, 2023 and 2022, respectively, to recognize changes in the funded status of our SERPs and the DMC Pension Plan. Changes in the funded status are recorded as a direct increase or decrease to shareholders’ equity through accumulated other comprehensive loss. Net actuarial gains (losses) of $(9) million, $(9) million and $63 million were recognized during the years ended December 31, 2024, 2023 and 2022, respectively, and the amortization of net actuarial loss of $8 million, $7 million and $9 million for the years ended December 31, 2024, 2023 and 2022, respectively, were recognized in other comprehensive income. Actuarial gains (losses) affecting the benefit obligation during the year ended December 31, 2024 were primarily attributable to the return on plan assets for the DMC Pension Plan and changes in the discount rate utilized for the SERP and DMC Pension Plan. Actuarial gains (losses) affecting the benefit obligation during the years ended December 31, 2023 and 2022 were primarily attributable to changes in the discount rate utilized for the SERP and DMC Pension Plan. Cumulative net actuarial losses totaled $225 million, $224 million and $222 million as of December 31, 2024, 2023 and 2022, respectively. There were no unrecognized prior service costs at December 31, 2024, 2023 and 2022 that had not yet been recognized as components of net periodic benefit cost.
To develop the expected long‑term rate of return on plan assets assumption, the DMC Pension Plan considers the current level of expected returns on risk‑free investments (primarily government bonds), the historical level of risk premium associated with the other asset classes in which the portfolio is invested and the expectations for future returns on each asset class. The expected return for each asset class is then weighted based on the target asset allocation to develop the expected long‑term rate of return on assets assumption for the portfolio.
The weighted‑average asset allocations by asset category as of December 31, 2024, were as follows:
| | | | | | | | | | | | | | |
| | Target | | Actual |
| Cash and cash equivalents | | — | % | | 4 | % |
| | | | |
| Equity securities | | 15 | % | | 12 | % |
| Debt securities | | 70 | % | | 66 | % |
| Alternative investments | | 15 | % | | 19 | % |
The DMC Pension Plan assets are invested in public commingled vehicles, segregated separately managed accounts, and private commingled vehicles, all of which are managed by professional investment management firms. The objective for all asset categories is to maximize total return without assuming undue risk exposure. The DMC Pension Plan maintains a well‑diversified asset allocation that meets these objectives. The DMC Pension Plan assets are largely comprised of cash and
cash equivalents, including but not limited to money market funds and repurchase agreements secured by U.S. Treasury or federal agency obligations, equity securities, including but not limited to the publicly traded shares of U.S. companies with various market capitalizations in addition to international and convertible securities, debt securities including, but not limited to, domestic and foreign government obligations, corporate bonds, and mortgage‑backed securities, and alternative investments. Alternative investments is a broadly defined asset category with the objective of diversifying the overall portfolio, complementing traditional equity and fixed‑income securities and improving the overall performance consistency of the portfolio. Alternative investments may include, but are not limited to, diversified hedge funds in the form of professionally managed pooled limited partnership investments and investments in private markets via professionally managed pooled limited partnership interests.
In each investment account, the DMC Pension Plan investment managers are responsible for monitoring and reacting to economic indicators, such as gross domestic product, consumer price index and U.S. monetary policy that may affect the performance of their account. The performance of all managers and the aggregate asset allocation are formally reviewed on a quarterly basis. The current asset allocation objective is to maintain a certain percentage within each asset class allowing for deviation within the established range for each asset class. The portfolio is rebalanced on an as‑needed basis to keep these allocations within the accepted ranges.
In general, fair values determined by Level 1 inputs utilize quoted prices (unadjusted) in active markets for identical assets or liabilities. We consider a security that trades at least weekly to have an active market. Fair values determined by Level 2 inputs utilize data points that are observable, such as quoted prices for similar assets, interest rates and yield curves. Fair values determined by Level 3 inputs utilize unobservable data points for the asset or liability, and include situations where there is little, if any, market activity for the asset or liability.
The following tables present the DMC Pension Plan assets measured at fair value on a recurring basis as of December 31, 2024 and 2023, aggregated by the level in the fair value hierarchy within which those measurements are determined: | | | | | | | | | | | | | | | | | | | | | | | | | | |
| | Total | | Level 1 | | Level 2 | | Level 3 |
| | | | | | | | |
| As of December 31, 2024: | | | | | | | | |
| Cash and cash equivalents | | $ | 22 | | | $ | 22 | | | $ | — | | | $ | — | |
| Equity securities | | 66 | | | 66 | | | — | | | — | |
| Fixed income funds | | 376 | | | 376 | | | — | | | — | |
| Alternative investments: | | | | | | | | |
| Private equity securities | | 106 | | | — | | | — | | | 106 | |
| Hedge funds | | 3 | | | — | | | — | | | 3 | |
| | | $ | 573 | | | $ | 464 | | | $ | — | | | $ | 109 | |
| | | | | | | | |
| As of December 31, 2023: | | | | | | | | |
| Cash and cash equivalents | | $ | 6 | | | $ | 6 | | | $ | — | | | $ | — | |
| Equity securities | | 39 | | | 39 | | | — | | | — | |
| Fixed income funds | | 442 | | | 442 | | | — | | | — | |
| Alternative investments: | | | | | | | | |
| Private equity securities | | 97 | | | — | | | — | | | 97 | |
| | | | | | | | |
| Hedge funds | | 8 | | | — | | | — | | | 8 | |
| | $ | 592 | | | $ | 487 | | | $ | — | | | $ | 105 | |
The following table presents the estimated future benefit payments to be made from the SERPs and the DMC Pension Plan, a portion of which will be funded from plan assets, for the next five years and in the aggregate for the five years thereafter:
| | | | | | | | | | | | | | | | | | | | | | | | | | | | | | | | | | | | | | | | | | | | |
| | | | | Years Ending December 31, | | Five Years Thereafter |
| | | Total | | 2025 | | 2026 | | 2027 | | 2028 | | 2029 | |
| Estimated benefit payments | | $ | 775 | | | $ | 84 | | | $ | 83 | | | $ | 83 | | | $ | 81 | | | $ | 80 | | | $ | 364 | |
The SERP and DMC Pension Plan obligations of $322 million at December 31, 2024 are classified in the accompanying Consolidated Balance Sheet as an other current liability of $24 million and defined benefit plan obligations of $298 million based on an estimate of the expected payment patterns. We expect to make total contributions to the plans of approximately $24 million for the year ending December 31, 2025.
NOTE 11. PROPERTY AND EQUIPMENT
The principal components of property and equipment are shown in the table below:
| | | | | | | | | | | |
| | December 31, |
| | 2024 | | 2023 |
| Land | $ | 539 | | | $ | 625 | |
| Buildings and improvements | 6,130 | | | 6,692 | |
| Construction in progress | 238 | | | 269 | |
| Equipment | 4,399 | | | 4,750 | |
| Finance lease assets | 552 | | | 378 | |
| | 11,858 | | | 12,714 | |
| Accumulated depreciation and amortization | (5,809) | | | (6,478) | |
| Net property and equipment | $ | 6,049 | | | $ | 6,236 | |
Property and equipment is stated at cost, less accumulated depreciation and amortization and impairment write‑downs related to assets held and used. We recognized depreciation expense of $646 million, $696 million and $669 million in the accompanying Consolidated Statements of Operations for the years ended December 31, 2024, 2023 and 2022, respectively.
NOTE 12. GOODWILL AND OTHER INTANGIBLE ASSETS
The following table presents information on changes in the carrying amount of goodwill for each of our segments:
| | | | | | | | | | | |
| December 31, |
| | 2024 | | 2023 |
| Hospital Operations | | | |
| Goodwill at beginning of period, net of accumulated impairment losses | $ | 3,119 | | | $ | 3,411 | |
| | | |
| | | |
| | | |
| Goodwill acquired during the year, including purchase price allocation adjustments | 42 | | | 133 | |
| | | |
| Goodwill related to assets held for sale and disposed | (464) | | | (425) | |
| Goodwill at end of period, net of accumulated impairment losses | $ | 2,697 | | | $ | 3,119 | |
| | | |
| Ambulatory Care | | | |
| Goodwill at beginning of period | $ | 7,188 | | | $ | 6,712 | |
| Goodwill acquired during the year, including purchase price allocation adjustments | 927 | | | 493 | |
| | | |
| Goodwill related to assets held for sale and disposed or deconsolidated facilities | (121) | | | (17) | |
| Goodwill at end of period | $ | 7,994 | | | $ | 7,188 | |
There were $2.430 billion of accumulated impairment losses related to the goodwill of our Hospital Operations segment at both December 31, 2024 and 2023. There were no accumulated goodwill impairment losses related to our Ambulatory Care segment in either period.
The following table presents information regarding other intangible assets, which were included in the accompanying Consolidated Balance Sheets:
| | | | | | | | | | | | | | | | | |
| | Gross
Carrying
Amount | | Accumulated
Amortization | | Net Book
Value |
| At December 31, 2024: | | | | | |
| Other intangible assets with finite useful lives: | | | | | |
| Capitalized software costs | $ | 1,469 | | | $ | (1,075) | | | $ | 394 | |
| Contracts | 241 | | | (135) | | | 106 | |
| Other | 96 | | | (78) | | | 18 | |
| Other intangible assets with finite lives | 1,806 | | | (1,288) | | | 518 | |
| | | | | |
| Other intangible assets with indefinite useful lives: | | | | | |
| Trade names | 105 | | | — | | | 105 | |
| Contracts | 769 | | | — | | | 769 | |
| Other | 5 | | | — | | | 5 | |
| Other intangible assets with indefinite lives | 879 | | | — | | | 879 | |
| Total other intangible assets, net | $ | 2,685 | | | $ | (1,288) | | | $ | 1,397 | |
| | | | | |
| | | | | |
| At December 31, 2023: | | | | | |
| Other intangible assets with finite useful lives: | | | | | |
| Capitalized software costs | $ | 1,712 | | | $ | (1,205) | | | $ | 507 | |
| Contracts | 294 | | | (164) | | | 130 | |
| Other | 91 | | | (78) | | | 13 | |
| Other intangible assets with finite lives | 2,097 | | | (1,447) | | | 650 | |
| | | | | |
| Other intangible assets with indefinite useful lives: | | | | | |
| Trade names | 105 | | | — | | | 105 | |
| Contracts | 609 | | | — | | | 609 | |
| Other | 4 | | | — | | | 4 | |
| Other intangible assets with indefinite lives | 718 | | | — | | | 718 | |
| Total other intangible assets, net | $ | 2,815 | | | $ | (1,447) | | | $ | 1,368 | |
Estimated future amortization of intangible assets with finite useful lives at December 31, 2024 was as follows:
| | | | | | | | | | | | | | | | | | | | | | | | | | | | | | | | | | | | | | | | | |
| | Total | | Years Ending December 31, | | Later Years |
| | | 2025 | | 2026 | | 2027 | | 2028 | | 2029 | |
| Amortization of intangible assets | $ | 518 | | | $ | 116 | | | $ | 99 | | | $ | 86 | | | $ | 78 | | | $ | 45 | | | $ | 94 | |
We recognized amortization expense of $172 million in each of the years ended December 31, 2024 and 2022, and recognized $174 million of amortization expense in the year ended December 31, 2023.
NOTE 13. OTHER ASSETS
The principal components of other current assets in the accompanying Consolidated Balance Sheets were as follows:
| | | | | | | | | | | | | | |
| | December 31, |
| | | 2024 | | 2023 |
| Prepaid expenses | | $ | 368 | | | $ | 391 | |
| Contract assets | | 190 | | | 208 | |
| California provider fee program receivables | | 334 | | | 329 | |
| Receivables from other government programs | | 326 | | | 282 | |
| Guarantees | | 194 | | | 274 | |
| Non-patient receivables | | 229 | | | 260 | |
| Other | | 119 | | | 95 | |
| Total other current assets | | $ | 1,760 | | | $ | 1,839 | |
The principal components of investments and other assets in the accompanying Consolidated Balance Sheets were as follows:
| | | | | | | | | | | |
| | December 31, |
| | 2024 | | 2023 |
| Marketable securities | $ | 50 | | | $ | 48 | |
| Equity investments in unconsolidated healthcare entities | 1,482 | | | 1,512 | |
| Total investments | 1,532 | | | 1,560 | |
| Cash surrender value of life insurance policies | 48 | | | 43 | |
| Long-term deposits | 51 | | | 50 | |
| California provider fee program receivables | 274 | | | 334 | |
| Operating lease assets | 1,037 | | | 1,083 | |
| Other long-term receivables and other assets | 95 | | | 87 | |
| Total investments and other assets | $ | 3,037 | | | $ | 3,157 | |
NOTE 14. ACCUMULATED OTHER COMPREHENSIVE LOSS
The table below presents our accumulated other comprehensive loss by component:
| | | | | | | | | | | |
| | December 31, |
| | 2024 | | 2023 |
| Adjustments for defined benefit plans | $ | (181) | | | $ | (180) | |
| Unrealized gains on investments | — | | | (1) | |
| Foreign currency translation adjustments and other | 1 | | | — | |
| Accumulated other comprehensive loss | $ | (180) | | | $ | (181) | |
NOTE 15. NET OPERATING REVENUES
Net operating revenues for our Hospital Operations and Ambulatory Care segments primarily consist of net patient service revenues, principally for patients covered by Medicare, Medicaid, and managed care and other health plans, as well as certain uninsured patients under our Compact and other uninsured discount and charity programs. Net operating revenues for our Hospital Operations segment also include revenues from providing revenue cycle management and value‑based care services to hospitals, health systems, physician practices, employers and other clients.
The table below presents our sources of net operating revenues:
| | | | | | | | | | | | | | | | | | | | |
| | Years Ended December 31, |
| | 2024 | | 2023 | | 2022 |
| Hospital Operations: | | | | | | |
| Net patient service revenues from hospitals and related outpatient facilities: | | | | | | |
| Medicare | | $ | 2,132 | | | $ | 2,383 | | | $ | 2,369 | |
| Medicaid | | 1,439 | | | 1,233 | | | 1,069 | |
| Managed care | | 9,809 | | | 10,248 | | | 9,607 | |
| Uninsured | | 64 | | | 96 | | | 141 | |
| Indemnity and other | | 522 | | | 590 | | | 661 | |
| Total | | 13,966 | | | 14,550 | | | 13,847 | |
Other revenues(1) | | 2,165 | | | 2,133 | | | 2,079 | |
| Total Hospital Operations | | 16,131 | | | 16,683 | | | 15,926 | |
| Ambulatory Care | | 4,534 | | | 3,865 | | | 3,248 | |
| | | | | | |
| | | | | | |
| Net operating revenues | | $ | 20,665 | | | $ | 20,548 | | | $ | 19,174 | |
| | | | | | | | |
| | |
| (1) | Primarily revenue from physician practices and revenue cycle management. |
Net adjustments for prior‑year cost reports and related valuation allowances, principally related to Medicare and Medicaid, increased (decreased) revenues in the years ended December 31, 2024, 2023 and 2022 by $(4) million, $24 million and $10 million, respectively. Estimated cost report settlements receivable, net of payables and valuation allowances, were included in accounts receivable in the accompanying Consolidated Balance Sheets (see Note 3). We believe that we have made
adequate provision for any adjustments that may result from the final determination of amounts earned under all the above arrangements with Medicare and Medicaid.
The following table presents the composition of net operating revenues for our Ambulatory Care segment:
| | | | | | | | | | | | | | | | | | | | |
| | Years Ended December 31, |
| | 2024 | | 2023 | | 2022 |
| | | | | | |
| Net patient service revenues | | $ | 4,356 | | | $ | 3,713 | | | $ | 3,115 | |
| Management fees | | 148 | | | 123 | | | 110 | |
| Revenue from other sources | | 30 | | | 29 | | | 23 | |
| Net operating revenues | | $ | 4,534 | | | $ | 3,865 | | | $ | 3,248 | |
Performance Obligations
The following table includes revenue from revenue cycle management services that is expected to be recognized in the future related to performance obligations that are unsatisfied, or partially unsatisfied, at the end of the reporting period:
| | | | | | | | | | | | | | | | | | | | | | | | | | | | | | | | | | | | | | | | | | | | |
| | | | | Years Ending December 31, | | Later Years |
| | | Total | | 2025 | | 2026 | | 2027 | | 2028 | | 2029 | |
| Performance obligations | | $ | 5,644 | | | $ | 720 | | | $ | 717 | | | $ | 716 | | | $ | 715 | | | $ | 715 | | | $ | 2,061 | |
The amounts in the table primarily consist of revenue cycle management fixed fees, which are typically recognized ratably as the performance obligation is satisfied. The estimated revenue does not include volume‑ or contingency‑based contracts, variable‑based escalators, performance incentives, penalties or other variable consideration that is considered constrained. Our contract with Catholic Health Initiatives (“CHI”), a predecessor to CommonSpirit Health and the minority interest holder in our Conifer Health Solutions, LLC joint venture, represents the majority of the fixed‑fee revenue related to remaining performance obligations. Conifer’s contract term with CHI is scheduled to end on December 31, 2032.
NOTE 16. INSURANCE
Property Insurance
We have property, business interruption and related insurance coverage to mitigate the financial impact of catastrophic events or perils that is subject to deductible provisions based on the terms of the policies. These policies are issued on an occurrence basis. For both of the policy periods of April 1, 2023 through March 31, 2024 and April 1, 2024 through March 31, 2025, we have coverage totaling $850 million per occurrence, after deductibles and exclusions, with annual aggregate sub‑limits of $100 million for floods, $200 million for earthquakes in California, $200 million for all other earthquakes and a per‑occurrence sub‑limit of $200 million per named windstorm with no annual aggregate. With respect to fires and other perils, excluding floods, earthquakes and named windstorms, the total $850 million limit of coverage per occurrence applies. Deductibles are 5% of insured values for earthquakes in California and named windstorms, and 2% of insured values for earthquakes in the New Madrid fault zone, each with a maximum deductible per claim of $25 million. All other covered losses are subject to a minimum deductible of $5 million per occurrence.
We also purchase cyber liability insurance from third parties. During the year ended December 31, 2024, we received $3 million of insurance recoveries related to a cybersecurity incident that occurred in 2022, none of which was included in net operating revenues during that period. We received $41 million and $14 million of insurance recoveries related to this cybersecurity incident during the years ended December 31, 2023 and 2022, respectively. Of the amounts received, we recorded $34 million and $6 million as net operating revenues during 2023 and 2022, respectively.
Professional and General Liability Reserves
We are self‑insured for the majority of our professional and general liability claims, and we purchase insurance from third parties to cover catastrophic claims. At December 31, 2024 and 2023, the aggregate current and long‑term professional and general liability reserves in the accompanying Consolidated Balance Sheets were $1.138 billion and $1.046 billion, respectively. These accruals include the reserves recorded by our captive insurance subsidiaries and our self‑insured retention reserves recorded based on modeled estimates for the portion of our professional and general liability risks, including incurred but not reported claims, for which we do not have insurance coverage.
Commercial insurance we purchase is subject to per‑claim and policy period aggregate limits. If the policy period aggregate limit of any of our policies is exhausted, in whole or in part, it could deplete or reduce the limits available to pay other material claims applicable to that policy period.
Malpractice expense of $309 million, $369 million and $276 million was included in other operating expenses in the accompanying Consolidated Statements of Operations for the years ended December 31, 2024, 2023 and 2022, respectively, of which $24 million, $116 million and $74 million, respectively, related to adverse claims development for prior years.
NOTE 17. CLAIMS AND LAWSUITS
We operate in a highly regulated and litigious industry; as such, we are regularly named in various legal actions in the ordinary course of our business. Healthcare companies are subject to numerous investigations by various governmental agencies. Further, private parties have the right to bring qui tam or “whistleblower” lawsuits against companies that allegedly submit false claims for payments to, or improperly retain overpayments from, the government and, in some states, private payers. We and our subsidiaries have received inquiries in recent years from government agencies, and we may receive similar inquiries in future periods. We are also subject to private litigation (including class action lawsuits) related to, among other things, the care and treatment provided at our hospitals and outpatient facilities; the application of various federal and state labor and privacy laws, rules and regulations; antitrust claims; tax audits; contract disputes (including disagreements with joint venture partners); and other matters. Some of these actions may involve large demands, as well as substantial defense costs. We cannot predict the outcome of current or future legal actions against us or the effect that judgments or settlements in such matters may have on us; however, we believe that the ultimate resolution of our existing ordinary‑course claims and lawsuits will not have a material effect on our business or financial condition.
New claims or inquiries may be initiated against us from time to time. These matters could (1) require us to pay substantial damages or amounts in judgments or settlements, which, individually or in the aggregate, could exceed amounts, if any, that may be recovered under our insurance policies where coverage applies and is available, (2) cause us to incur substantial expenses, (3) require significant time and attention from our management, and (4) cause us to close or sell hospitals or otherwise modify the way we conduct business.
We record accruals for estimated losses relating to claims and lawsuits when available information indicates that a loss is probable and we can reasonably estimate the amount of the loss or a range of loss. Significant judgment is required in both the determination of the probability of a loss and the determination as to whether a loss is reasonably estimable. These determinations are updated at least quarterly and are adjusted to reflect the effects of negotiations, settlements, rulings, advice of legal counsel and technical experts, and other information and events pertaining to a particular matter, but are subject to significant uncertainty regarding numerous factors that could affect the ultimate loss levels. If a loss on a material matter is reasonably possible and estimable, we disclose an estimate of the loss or a range of loss. We do not disclose an estimate when we have concluded that a loss is either not reasonably possible or a loss, or a range of loss, is not reasonably estimable, based on available information. Given the inherent uncertainties associated with material legal matters, especially those involving governmental agencies, and the indeterminate damages sought in some cases, we are unable to predict the ultimate liability we may incur from such matters, and an adverse outcome in one or more of these matters could be material to our results of operations or cash flows for any particular reporting period.
The following table presents reconciliations of the beginning and ending liability balances in connection with legal settlements and related costs:
| | | | | | | | | | | | | | | | | | | | | | | | | | | | | |
| | Balances at
Beginning
of Period | | Litigation and
Investigation
Costs | | Cash
Payments | | Other | | Balances at
End of
Period |
| Year Ended December 31, 2024 | $ | 40 | | | $ | 35 | | | $ | (56) | | | $ | 1 | | | $ | 20 | |
| Year Ended December 31, 2023 | $ | 51 | | | $ | 47 | | | $ | (59) | | | $ | 1 | | | $ | 40 | |
| Year Ended December 31, 2022 | $ | 78 | | | $ | 70 | | | $ | (100) | | | $ | 3 | | | $ | 51 | |
NOTE 18. REDEEMABLE NONCONTROLLING INTERESTS IN EQUITY OF CONSOLIDATED SUBSIDIARIES
Certain of our investees’ partnership and operating agreements contain terms that, upon the occurrence of specified events, could obligate us to purchase some or all of the noncontrolling interests related to our consolidated subsidiaries. The noncontrolling interests subject to these provisions, and the income attributable to those interests, are not included as part of our equity and are presented as redeemable noncontrolling interests in the accompanying Consolidated Balance Sheets at December 31, 2024 and December 31, 2023.
The following table presents the changes in redeemable noncontrolling interests in equity of consolidated subsidiaries:
| | | | | | | | | | | |
| | Years Ended December 31, |
| | 2024 | | 2023 |
Balances at beginning of period | $ | 2,391 | | | $ | 2,149 | |
| Net income | 473 | | | 366 | |
| Distributions paid to noncontrolling interests | (369) | | | (305) | |
| Accretion of redeemable noncontrolling interests | 5 | | | — | |
| Purchases and sales of businesses and noncontrolling interests, net | 227 | | | 181 | |
Balances at end of period | $ | 2,727 | | | $ | 2,391 | |
The divestiture of the AL Hospitals during the year ended December 31, 2024 resulted in a decrease of $175 million in our redeemable noncontrolling interest balance during the same period.
The following tables present the composition by segment of our redeemable noncontrolling interests balances, as well as our net income available to redeemable noncontrolling interests:
| | | | | | | | | | | | | | |
| | December 31, |
| | | 2024 | | 2023 |
| Hospital Operations | | $ | 800 | | | $ | 860 | |
| Ambulatory Care | | 1,927 | | | 1,531 | |
| | | | |
| Redeemable noncontrolling interests | | $ | 2,727 | | | $ | 2,391 | |
| | | | | | | | | | | | | | | | | | | | |
| | | Years Ended December 31, |
| | | 2024 | | 2023 | | 2022 |
| Hospital Operations | | $ | 100 | | | $ | 84 | | | $ | 100 | |
| Ambulatory Care | | 373 | | | 282 | | | 248 | |
| | | | | | |
| Net income available to redeemable noncontrolling interests | | $ | 473 | | | $ | 366 | | | $ | 348 | |
We had a put/call agreement (“Baylor Put/Call Agreement”) with Baylor University Medical Center (“Baylor”) that contained put and call options with respect to the 5% voting ownership interest Baylor previously held in USPI. In June 2022, we entered into a share purchase agreement to acquire Baylor’s 5% ownership interest in USPI for $406 million. Under the share purchase agreement, we are obligated to make non-interest-bearing monthly payments of approximately $11 million through June 2025. At December 31, 2024, the remaining obligation under the share purchase agreement of $68 million was classified as a current liability and included in other current liabilities in the accompanying Consolidated Balance Sheet. At December 31, 2023, we had a liability of $135 million recorded in other current liabilities for the purchase of Baylor’s ownership interest and $63 million recorded in other long‑term liabilities in the accompanying Consolidated Balance Sheet.
NOTE 19. INCOME TAXES
The provision for income taxes for the years ended December 31, 2024, 2023 and 2022 consisted of the following:
| | | | | | | | | | | | | | | | | |
| | Years Ended December 31, |
| | 2024 | | 2023 | | 2022 |
| Current tax expense: | | | | | |
| Federal | $ | 926 | | | $ | 208 | | | $ | 78 | |
| State | 361 | | | 46 | | | 57 | |
| | 1,287 | | | 254 | | | 135 | |
| Deferred tax expense (benefit): | | | | | |
| Federal | (92) | | | 55 | | | 174 | |
| State | (11) | | | (3) | | | 35 | |
| | (103) | | | 52 | | | 209 | |
| | $ | 1,184 | | | $ | 306 | | | $ | 344 | |
A reconciliation between the amount of reported income tax expense and the amount computed by multiplying income before income taxes by the statutory federal tax rate is presented below. Foreign pre-tax loss was $3 million for both of the years ended December 31, 2024 and 2023, and $8 million for the year ended December 31, 2022.
| | | | | | | | | | | | | | | | | |
| | Years Ended December 31, |
| | 2024 | | 2023 | | 2022 |
| Tax expense at statutory federal rate of 21% | $ | 1,102 | | | $ | 340 | | | $ | 282 | |
| State income taxes, net of federal income tax benefit | 288 | | | 70 | | | 64 | |
| | | | | |
| Tax benefit attributable to noncontrolling interests | (181) | | | (147) | | | (122) | |
| Nondeductible goodwill | 161 | | | — | | | 1 | |
| Nondeductible executive compensation | 7 | | | 6 | | | 10 | |
| Impact of change in state filing method, net of change in unrecognized tax benefit | — | | | (20) | | | — | |
| | | | | |
| | | | | |
| | | | | |
| Stock-based compensation tax benefit | (9) | | | (2) | | | (6) | |
| Changes in valuation allowance | (182) | | | 71 | | | 120 | |
| Prior-year provision to return adjustments and other changes in deferred taxes | (1) | | | (9) | | | (12) | |
| Other items | (1) | | | (3) | | | 7 | |
| Income tax expense | $ | 1,184 | | | $ | 306 | | | $ | 344 | |
Deferred income taxes reflect the tax effects of temporary differences between the carrying amount of assets and liabilities for financial reporting purposes and the amount used for income tax purposes. The following table presents those significant components of our deferred tax assets and liabilities, including any valuation allowance:
| | | | | | | | | | | | | | | | | | | | | | | |
| | December 31, 2024 | | December 31, 2023 |
| | Assets | | Liabilities | | Assets | | Liabilities |
| Depreciation and fixed-asset differences | $ | — | | | $ | 373 | | | $ | — | | | $ | 430 | |
| Reserves related to restructuring charges | 4 | | | — | | | 6 | | | — | |
| Receivables (doubtful accounts and adjustments) | 245 | | | — | | | 222 | | | — | |
| | | | | | | |
| Accruals for retained insurance risks | 253 | | | — | | | 232 | | | — | |
| Intangible assets | — | | | 504 | | | — | | | 429 | |
| Other long-term liabilities | 34 | | | — | | | 32 | | | — | |
| Benefit plans | 235 | | | — | | | 233 | | | — | |
| Other accrued liabilities | 50 | | | — | | | 20 | | | — | |
| Investments and other assets | — | | | 160 | | | — | | | 119 | |
| Interest expense limitation | 57 | | | — | | | 206 | | | — | |
| Net operating loss carryforwards | 122 | | | — | | | 71 | | | — | |
| Stock-based compensation | 13 | | | — | | | 13 | | | — | |
| Right-of-use lease assets and obligations | 123 | | | 107 | | | 129 | | | 111 | |
| Other items | 19 | | | — | | | 4 | | | 80 | |
| | 1,155 | | | 1,144 | | | 1,168 | | | 1,169 | |
| Valuation allowance | (158) | | | | | (248) | | | — | |
| | $ | 997 | | | $ | 1,144 | | | $ | 920 | | | $ | 1,169 | |
Below is a reconciliation of the deferred tax assets and liabilities and the corresponding amounts reported in the accompanying Consolidated Balance Sheets:
| | | | | | | | | | | |
| | December 31, |
| | 2024 | | 2023 |
| Deferred income tax assets | $ | 80 | | | $ | 77 | |
| Deferred tax liabilities | (227) | | | (326) | |
| Net deferred tax liability | $ | (147) | | | $ | (249) | |
During the year ended December 31, 2024, the valuation allowance decreased by $90 million, including a decrease of $180 million primarily for utilization of interest expense carryforwards due to gains from sales of facilities, an increase of $92 million due to an acquisition, and a decrease of $2 million due to changes in the expected realizability of deferred tax assets. The balance in the valuation allowance as of December 31, 2024 was $158 million. During the year ended December 31, 2023, the valuation allowance increased by $71 million, including an increase of $73 million due to limitations
on the tax deductibility of interest expense, and a decrease of $2 million due to changes in the expected realizability of deferred tax assets. The balance in the valuation allowance as of December 31, 2023 was $248 million. During the year ended December 31, 2022, the valuation allowance increased by $120 million, including an increase of $123 million due to limitations on the tax deductibility of interest expense, a decrease of $1 million due to the expiration or worthlessness of unutilized state net operating loss carryovers, and a decrease of $2 million due to changes in the expected realizability of deferred tax assets. The remaining balance in the valuation allowance at December 31, 2022 was $177 million.
We account for uncertain tax positions in accordance with FASB ASC 740-10-25, which prescribes a comprehensive model for the financial statement recognition, measurement, presentation and disclosure of uncertain tax positions taken or expected to be taken in income tax returns. The additions and reductions for tax positions include the impact of items for which the ultimate deductibility is highly certain, but for which there is uncertainty about the timing of such deductions. Such amounts include unrecognized tax benefits that have impacted deferred tax assets and liabilities at December 31, 2024, 2023 and 2022.
The following table presents the total changes in unrecognized tax benefits during the years ended December 31, 2024, 2023 and 2022:
| | | | | |
| |
| Balance at December 31, 2021 | $ | 34 | |
| Reductions due to a lapse of statute of limitations | — | |
| Balance at December 31, 2022 | 34 | |
| Increases due to tax positions taken in prior periods | 31 | |
| Reductions due to a lapse of statute of limitations | (1) | |
| Balance at December 31, 2023 | 64 | |
| Increases due to tax positions taken in prior periods | 10 | |
| Reductions due to settlements with taxing authorities | (3) | |
| |
| Balance at December 31, 2024 | $ | 71 | |
The total amount of unrecognized tax benefits as of December 31, 2024 was $71 million, of which $69 million, if recognized, would affect our effective tax rate and income tax benefit. Income tax expense in the year ended December 31, 2024 included expense of $9 million attributable to an increase in our estimated liabilities for uncertain tax positions, net of related deferred tax effects. The total amount of unrecognized tax benefits as of December 31, 2023 was $64 million, of which $63 million, if recognized, would affect our effective tax rate and income tax benefit. Income tax expense in the year ended December 31, 2023 included expense of $24 million attributable to an increase in our estimated liabilities for uncertain tax positions, net of related deferred tax effects. The total amount of unrecognized tax benefits as of December 31, 2022 was $34 million, of which $32 million, if recognized, would affect our effective tax rate and income tax benefit. In the year ended December 31, 2022, there was no change in our estimated liabilities for uncertain tax positions, net of related deferred tax effects.
Our practice is to recognize interest and penalties related to income tax matters in income tax expense in our consolidated statements of operations. Approximately $6 million of interest and penalties related to accrued liabilities for uncertain tax positions are included in the accompanying Consolidated Statement of Operations for the year ended December 31, 2024. Total accrued interest and penalties on unrecognized tax benefits as of December 31, 2024 was $8 million.
The IRS has completed audits of our tax returns for all tax years ended on or before December 31, 2007. All disputed issues with respect to these audits have been resolved and all related tax assessments (including interest) have been paid. Our tax returns for years ended after December 31, 2007 and USPI’s tax returns for years ended after December 31, 2020 remain subject to audit by the IRS.
As of December 31, 2024, no significant changes in unrecognized federal and state tax benefits are expected in the next 12 months as a result of the settlement of audits, the filing of amended tax returns or the expiration of statutes of limitations.
At December 31, 2024, our carryforwards available to offset future taxable income consisted of: (1) federal net operating loss (“NOL”) carryforwards of approximately $260 million pre‑tax, $139 million of which expires in 2026 to 2037 and $121 million of which has no expiration date, for which the associated deferred tax benefit net of valuation allowance is $2 million; (2) capital loss carryforwards of $8 million, which have no deferred tax benefit net of valuation allowance; and (3) state NOL carryforwards of approximately $3.299 billion expiring in 2025 through 2044 for which the associated deferred tax benefit, net of valuation allowance and federal tax impact, is approximately $23 million. Most of the federal net operating loss carryforwards and capital loss carryforwards are subject to separate return limitation year restrictions under the Internal
Revenue Code and may be utilized only to offset taxable income of certain entities. Our ability to utilize NOL carryforwards to reduce future taxable income may be limited under Section 382 of the Internal Revenue Code if certain ownership changes in our company occur during a rolling three‑year period. These ownership changes include purchases of common stock under share repurchase programs, the offering of stock by us, the purchase or sale of our stock by 5% shareholders, as defined in the Treasury regulations, or the issuance or exercise of rights to acquire our stock. If such ownership changes by 5% shareholders result in aggregate increases that exceed 50 percentage points during the three‑year period, then Section 382 imposes an annual limitation on the amount of our taxable income that may be offset by the NOL carryforwards or tax credit carryforwards at the time of ownership change.
NOTE 20. EARNINGS PER COMMON SHARE
The following table reconciles the numerators and denominators of our basic and diluted earnings per common share calculations. Net income available to our common shareholders is expressed in millions and weighted average shares are expressed in thousands.
| | | | | | | | | | | | | | | | | |
| | Net Income Available to Common Shareholders (Numerator) | | Wtd. Avg. Shares
(Denominator) | | Per-Share
Amount |
| Year Ended December 31, 2024 | | | | | |
| Net income available to Tenet Healthcare Corporation common shareholders for basic earnings per share | $ | 3,200 | | | 96,904 | | | $ | 33.02 | |
| Effect of dilutive instruments | 1 | | | 977 | | | (0.32) | |
| Net income available to Tenet Healthcare Corporation common shareholders for diluted earnings per share | $ | 3,201 | | | 97,881 | | | $ | 32.70 | |
| Year Ended December 31, 2023 | | | | | |
| Net income available to Tenet Healthcare Corporation common shareholders for basic earnings per share | $ | 611 | | | 101,639 | | | $ | 6.01 | |
| Effect of dilutive instruments | (13) | | | 3,161 | | | (0.30) | |
| Net income available to Tenet Healthcare Corporation common shareholders for diluted earnings per share | $ | 598 | | | 104,800 | | | $ | 5.71 | |
| Year Ended December 31, 2022 | | | | | |
| Net income available to Tenet Healthcare Corporation common shareholders for basic earnings per share | $ | 410 | | | 106,929 | | | $ | 3.84 | |
| Effect of dilutive instruments | 8 | | | 3,587 | | | (0.05) | |
| Net income available to Tenet Healthcare Corporation common shareholders for diluted earnings per share | $ | 418 | | | 110,516 | | | $ | 3.79 | |
Dilutive instruments during the years ended December 31, 2024, 2023 and 2022 consisted of stock options, RSUs, deferred compensation units and dividends on subsidiary preferred stock. For portions of these years, our dilutive instruments also included certain convertible instruments, including: RSUs issued under the USPI Management Equity Plan until they were repurchased in October 2024, an agreement related to the ownership interest in a Hospital Operations segment joint venture during 2023 and 2022, and the Baylor Put/Call Agreement during the first six months of 2022.
NOTE 21. FAIR VALUE MEASUREMENTS
We are required to provide additional disclosures about fair value measurements as part of our financial statements for each major category of assets and liabilities measured at fair value. In general, fair values determined by Level 1 inputs utilize quoted prices (unadjusted) in active markets for identical assets or liabilities, which generally are not applicable to non‑financial assets and liabilities. Fair values determined by Level 2 inputs utilize data points that are observable, such as definitive sales agreements, appraisals or established market values of comparable assets. Fair values determined by Level 3 inputs utilize unobservable data points for the asset or liability and include situations where there is little, if any, market activity for the asset or liability, such as internal estimates of future cash flows.
Non-Recurring Fair Value Measurements
Our non‑financial assets and liabilities not permitted or required to be measured at fair value on a recurring basis typically relate to long-lived assets held and used, long-lived assets held for sale and goodwill. The following table presents information about assets measured at fair value on a non-recurring basis and indicates the fair value hierarchy of the valuation techniques we utilized to determine such fair values: | | | | | | | | | | | | | | | | | | | | | | | | | | |
| | | Total | | Quoted Prices
in Active
Markets for
Identical Assets
(Level 1) | | Significant Other
Observable Inputs
(Level 2) | | Significant
Unobservable
Inputs
(Level 3) |
| December 31, 2024 | | | | | | | | |
| Long-lived assets held for sale | | $ | 21 | | | $ | — | | | $ | 21 | | | $ | — | |
| | | | | | | | |
| | | | | | | | |
| | | | | | | | |
| | | | | | | | |
| December 31, 2023 | | | | | | | | |
| | | | | | | | |
| Long-lived assets held for sale | | $ | 775 | | | $ | — | | | $ | 775 | | | $ | — | |
| | | | | | | | |
| | | | | | | | |
| | | | | | | | |
| | | | | | | | |
| | | | | | | | |
Financial Instruments
The fair value of our long‑term debt (except for any borrowings under the Credit Agreement) is based on quoted market prices (Level 1). The inputs used to establish the fair value of borrowings outstanding under the Credit Agreement are considered to be Level 2 inputs. At December 31, 2024 and 2023, the estimated fair value of our long‑term debt was approximately 97.8% and 96.9%, respectively, of the carrying value of the debt.
NOTE 22. ACQUISITIONS
We acquired controlling ownership interests in 52 ambulatory surgery centers and The Hospitals of Providence Rehabilitation Hospital East, located in El Paso, Texas, through a series of transactions during the year ended December 31, 2024. In addition, we acquired controlling ownership interests in seven previously unconsolidated ambulatory surgery centers and 15 previously unconsolidated UCCs, which allowed us to consolidate their financial results. We paid a total of $571 million to acquire all of these ownership interests during the year ended December 31, 2024.
In December 2023, we purchased 55% of the ownership interest held by NextCare, Inc. and certain of its affiliates (“NextCare”) in NextCare Arizona I JV, LLC (“NextCare JV I”), a joint venture established to own and operate 41 UCCs and a telehealth center in Arizona. We paid $75 million from cash on hand on the acquisition date in 2023 and retained an additional $10 million in escrow pending NextCare’s compliance with certain conditions. We subsequently released the funds held in escrow during the year ended December 31, 2024. We recognized goodwill of $133 million from our acquisition of NextCare JV I. This transaction allowed us to expand our existing network in Arizona with UCCs that were already established and operational. NextCare JV I is included in our Hospital Operations segment.
During the year ended December 31, 2023, we acquired controlling ownership interests in 20 ambulatory surgery centers through a series of transactions. In addition, we acquired controlling ownership interests in 11 previously unconsolidated ambulatory surgery centers. We paid an aggregate of $149 million to acquire all of these ownership interests during 2023.
In July 2022, we acquired controlling ownership interests in 19 fully operational ambulatory surgery centers and three centers then in development from United Urology Group. We paid $104 million, net of cash acquired, for our ownership interests in these facilities and recognized goodwill of $316 million. The aggregate acquisition date fair value of the non‑controlling interests in the facilities we acquired was $223 million. The acquisition of these facilities provided us with access to new markets and further diversified our ambulatory care services portfolio.
We acquired controlling interests in an additional 11 ambulatory surgery centers through a series of transactions during the year ended December 31, 2022. We paid an aggregate purchase price of $65 million, net of cash acquired, for these facilities. During 2022, we also acquired controlling interests in 23 ambulatory surgery centers in which we previously owned a noncontrolling interest for an aggregate purchase price of $65 million.
We are required to allocate the purchase prices of acquired businesses to assets acquired or liabilities assumed and, if applicable, noncontrolling interests based on their fair values. The excess of the purchase prices allocated over those fair values is recorded as goodwill. The purchase price allocations for certain acquisitions completed in 2024 are preliminary. We are in process of assessing working capital balances and lease and other agreements assumed, as well as obtaining and evaluating valuations of the acquired property and equipment, management contracts and other intangible assets, and noncontrolling
interests. Therefore, those purchase price allocations, including goodwill, recorded in the accompanying consolidated financial statements are subject to adjustment once the assessments and valuation work are completed and evaluated. Such adjustments will be recorded as soon as practical and within the measurement period as defined by the accounting literature. During the year ended December 31, 2024, we adjusted the preliminary purchase allocations of certain acquisitions completed in 2023 based on the results of completed valuations. These adjustments resulted in a net increase in goodwill of $18 million, which was comprised of a net increase in goodwill for our Hospital Operations segment of $31 million and a net decrease of $13 million for our Ambulatory Care segment.
The table below presents the preliminary or final purchase price allocations for acquisitions made during the years ended December 31, 2024, 2023 and 2022. Due to their increased significance, long‑term lease operating assets, current portion of long‑term lease liabilities and long-term operating lease liabilities are presented separately in the table below. During the years ended December 31, 2023 and 2022, these items were presented in other long-term assets, current liabilities and other long-term liabilities, respectively.
| | | | | | | | | | | | | | | | | |
| Years Ended December 31, |
| | 2024 | | 2023 | | 2022 |
| Current assets | $ | 47 | | | $ | 34 | | | $ | 36 | |
| Property and equipment | 62 | | | 28 | | | 54 | |
| Other intangible assets | 162 | | | 5 | | | 2 | |
| Goodwill | 951 | | | 644 | | | 860 | |
| Long-term operating lease assets | 108 | | | 18 | | | 101 | |
| Other long-term assets | 2 | | | 14 | | | — | |
| Previously held investments in unconsolidated affiliates | (25) | | | (99) | | | (207) | |
| Current liabilities | (24) | | | (33) | | | (29) | |
| Current portion of long-term lease liabilities | (17) | | | (3) | | | (12) | |
| Long-term operating lease liabilities | (96) | | | (10) | | | (89) | |
| Other long-term liabilities | (55) | | | (27) | | | (29) | |
| Redeemable noncontrolling interests in equity of consolidated subsidiaries | (458) | | | (229) | | | (180) | |
| Noncontrolling interests | (69) | | | (102) | | | (273) | |
| | | | | |
| Cash paid, net of cash acquired | (561) | | | (224) | | | (234) | |
| Gains on consolidations | $ | 27 | | | $ | 16 | | | $ | — | |
With the exception of The Hospitals of Providence Rehabilitation Hospital East and NextCare JV I, which are included in our Hospital Operations segment, all of the facilities described above are included in our Ambulatory Care segment. The majority of the goodwill generated from our 2024 and 2022 acquisitions will not be deductible for income tax purposes; however, the majority of the goodwill generated from our 2023 transactions will be. The goodwill generated from these transactions can be attributed to the benefits that we expect to realize from operating efficiencies and growth strategies. Approximately $39 million, $15 million and $14 million in transaction costs related to prospective and closed acquisitions were expensed during the years ended December 31, 2024, 2023 and 2022, respectively, and are included in impairment and restructuring charges, and acquisition‑related costs in the accompanying Consolidated Statements of Operations.
During the year ended December 31, 2024 and 2023, we recognized gains totaling $27 million and $16 million, respectively, associated with stepping up our ownership interests in previously held equity investments, which we began consolidating after we acquired controlling interests. No such gain or loss was recognized in the year ended December 31, 2022.
NOTE 23. SEGMENT INFORMATION
Our business consists of our Hospital Operations segment and our Ambulatory Care segment. Our approach to segment identification aligns with how management structures the business to make operational decisions, allocates resources and evaluates performance. Central to this approach is the information routinely reviewed by our Chief Operating Decision Maker (“CODM”) group. For both segments, the CODM group focuses primarily on Adjusted EBITDA as the key metric for performance evaluation and resource allocation. The CODM group’s evaluation of Adjusted EBITDA includes budget‑to‑actual analyses and comparisons across current and historical periods. At December 31, 2024, our CODM group included our Chief Executive Officer and our Chief Financial Officer.
Our Hospital Operations segment is comprised of our acute care and specialty hospitals, physician practices and outpatient facilities. At December 31, 2024, our subsidiaries operated 49 hospitals, serving primarily urban and suburban
communities in eight states, as well as 135 outpatient facilities, primarily UCCs, imaging centers, off-campus hospital emergency departments and micro-hospitals. Our Hospital Operations segment also provides revenue cycle management and value‑based care services to hospitals, health systems, physician practices, employers and other clients. Our Hospital Operations segment generated 78%, 81% and 83% of our net operating revenues in the years ended December 31, 2024, 2023 and 2022, respectively.
Our Ambulatory Care segment is comprised of the operations of USPI. At December 31, 2024, USPI had ownership interests in 518 ambulatory surgery centers (375 consolidated) and 25 surgical hospitals (seven consolidated) in 37 states. Effective June 30, 2022, we purchased all of the shares in USPI that Baylor held on that date for $406 million, which increased our ownership interest in USPI’s voting shares from 95% to 100% (see Note 18 for additional information about this transaction).
The following tables present amounts for each of our reportable segments and the reconciling items necessary to agree to amounts reported in the accompanying Consolidated Balance Sheets and Consolidated Statements of Operations, as applicable. Grant income recognized from COVID-19 relief programs during the years ended December 31, 2024, 2023 and 2022 was included in net operating revenues in the respective tables below.
| | | | | | | | | | | | | | | | | |
| December 31, |
| | 2024 | | 2023 | | 2022 |
| Assets: | | | | | |
| Hospital Operations | $ | 16,722 | | | $ | 17,268 | | | $ | 16,599 | |
| Ambulatory Care | 12,214 | | | 11,044 | | | 10,557 | |
| | | | | |
Total | $ | 28,936 | | | $ | 28,312 | | | $ | 27,156 | |
| | | | | | | | | | | | | | | | | |
| | Years Ended December 31, |
| | 2024 | | 2023 | | 2022 |
| Capital expenditures: | | | | | |
| Hospital Operations | $ | 845 | | | $ | 671 | | | $ | 687 | |
| Ambulatory Care | 86 | | | 80 | | | 75 | |
Total | $ | 931 | | | $ | 751 | | | $ | 762 | |
| | | | | |
| | | | | |
| | | | | |
| | | | | |
| | | | | |
| | | | | |
| | | | | |
| | | | | |
| | | | | |
| | | | | |
| | | | | |
| | | | | |
| | | | | |
| | | | | |
| | | | | |
| | | | | |
| | | | | |
| | | | | |
| | | | | |
| | | | | |
| | | | | |
| | | | | |
| Depreciation and amortization: | | | | | |
| Hospital Operations | $ | 684 | | | $ | 750 | | | $ | 729 | |
| Ambulatory Care | 134 | | | 120 | | | 112 | |
Total | $ | 818 | | | $ | 870 | | | $ | 841 | |
| | | | | |
| | | | | |
| | | | | |
| | | | | |
| | | | | |
| | | | | |
| | | | | |
| | | | | |
| | | | | |
| | | | | |
| | | | | |
| | | | | | | | | | | | | | | | | | | | | | |
| Year Ended December 31, 2024 |
| | Hospital Operations | | Ambulatory Care | | | | Total | | | |
| Net operating revenues and grant income | $ | 16,141 | | | $ | 4,534 | | | | | $ | 20,675 | | | | |
| | | | | | | | | | |
| | | | | | | | | | |
| | | | | | | | | | |
| | | | | | | | | | |
| | | | | | | | | | |
| | | | | | | | | | |
| Equity in earnings of unconsolidated affiliates | 10 | | | 250 | | | | | 260 | | | | |
| | | | | | | | | | |
| Less: | | | | | | | | | | |
| Salaries, wages and benefits | 7,664 | | | 1,137 | | | | | 8,801 | | | | |
| Supplies | 2,460 | | | 1,187 | | | | | 3,647 | | | | |
| Other operating expenses, net | 3,842 | | | 650 | | | | | 4,492 | | | | |
| | | | | | | | | | |
| | | | | | | | | | |
| Adjusted EBITDA | $ | 2,185 | | | $ | 1,810 | | | | | 3,995 | | | | |
| | | | | | | | | | |
| | | | | | | | | | |
| | | | | | | | | | |
| | | | | | | | | | |
| Reconciliation of Adjusted EBITDA: | | | | | | | | | | |
| | | | | | | | | | |
| Depreciation and amortization | | | | | | | (818) | | | | |
| Impairment and restructuring charges, and acquisition-related costs | | | | | | | (102) | | | | |
| Litigation and investigation costs | | | | | | | (35) | | | | |
| Interest expense | | | | | | | (826) | | | | |
| Loss from early extinguishment of debt | | | | | | | (8) | | | | |
| Other non-operating income, net | | | | | | | 126 | | | | |
| Gains on sales, consolidation and deconsolidation of facilities | | | | | | | 2,916 | | | | |
| Income before income taxes | | | | | | | $ | 5,248 | | | | |
| | | | | | | | | | | | | | | | | | | | | | |
| Year Ended December 31, 2023 |
| | Hospital Operations | | Ambulatory Care | | | | Total | | | |
| Net operating revenues and grant income | $ | 16,698 | | | $ | 3,866 | | | | | $ | 20,564 | | | | |
| | | | | | | | | | |
| | | | | | | | | | |
| | | | | | | | | | |
| | | | | | | | | | |
| | | | | | | | | | |
| | | | | | | | | | |
| Equity in earnings of unconsolidated affiliates | 10 | | | 218 | | | | | 228 | | | | |
| | | | | | | | | | |
| Less: | | | | | | | | | | |
| Salaries, wages and benefits | 8,182 | | | 964 | | | | | 9,146 | | | | |
| Supplies | 2,545 | | | 1,045 | | | | | 3,590 | | | | |
| Other operating expenses, net | 3,984 | | | 531 | | | | | 4,515 | | | | |
| | | | | | | | | | |
| Adjusted EBITDA | $ | 1,997 | | | $ | 1,544 | | | | | 3,541 | | | | |
| | | | | | | | | | |
| | | | | | | | | | |
| | | | | | | | | | |
| | | | | | | | | | |
| Reconciliation of Adjusted EBITDA: | | | | | | | | | | |
| | | | | | | | | | |
| Depreciation and amortization | | | | | | | (870) | | | | |
| Impairment and restructuring charges, and acquisition-related costs | | | | | | | (137) | | | | |
| Litigation and investigation costs | | | | | | | (47) | | | | |
| Interest expense | | | | | | | (901) | | | | |
| Loss from early extinguishment of debt | | | | | | | (11) | | | | |
| Other non-operating income, net | | | | | | | 19 | | | | |
| Gains on sales, consolidation and deconsolidation of facilities | | | | | | | 23 | | | | |
| Income before income taxes | | | | | | | $ | 1,617 | | | | |
| | | | | | | | | | | | | | | | | | | | | | |
| Year Ended December 31, 2022 |
| | Hospital Operations | | Ambulatory Care | | | | Total | | | |
| Net operating revenues and grant income | $ | 16,116 | | | $ | 3,252 | | | | | $ | 19,368 | | | | |
| | | | | | | | | | |
| Equity in earnings of unconsolidated affiliates | 10 | | | 206 | | | | | 216 | | | | |
| | | | | | | | | | |
| Less: | | | | | | | | | | |
| Salaries, wages and benefits | 8,022 | | | 822 | | | | | 8,844 | | | | |
| Supplies | 2,402 | | | 871 | | | | | 3,273 | | | | |
| Other operating expenses, net | 3,560 | | | 438 | | | | | 3,998 | | | | |
| | | | | | | | | | |
| Adjusted EBITDA | $ | 2,142 | | | $ | 1,327 | | | | | 3,469 | | | | |
| | | | | | | | | | |
| | | | | | | | | | |
| | | | | | | | | | |
| | | | | | | | | | |
| Reconciliation of Adjusted EBITDA: | | | | | | | | | | |
| | | | | | | | | | |
| Depreciation and amortization | | | | | | | (841) | | | | |
| Impairment and restructuring charges, and acquisition-related costs | | | | | | | (226) | | | | |
| Litigation and investigation costs | | | | | | | (70) | | | | |
| Interest expense | | | | | | | (890) | | | | |
| Loss from early extinguishment of debt | | | | | | | (109) | | | | |
| Other non-operating income, net | | | | | | | 11 | | | | |
| Gains on sales, consolidation and deconsolidation of facilities | | | | | | | 1 | | | | |
| Income before income taxes | | | | | | | $ | 1,345 | | | | |
Other operating expenses, net consists of various general and administrative expenses that are integral to supporting our operations. These expenses include, but are not limited to, medical fees, malpractice expense, information technology and software expenses, as well as gains or losses incurred from the disposition of long-lived assets.
NOTE 24. RECENT ACCOUNTING STANDARDS
Recently Issued Accounting Standards
In August 2023, the FASB issued Accounting Standard Update (“ASU”) 2023-05, “Business Combinations – Joint Venture Formations (Subtopic 805-60): Recognition and Initial Measurement” (“ASU 2023-05”), which clarifies the business combination accounting for joint venture formations. The amendments in the ASU seek to reduce diversity in practice that has resulted from a lack of authoritative guidance regarding the accounting for the formation of joint ventures in separate financial statements. The amendments also seek to clarify the initial measurement of joint venture net assets, including businesses contributed to a joint venture. The guidance is applicable to all entities involved in the formation of a joint venture. ASU 2023-05 is effective prospectively for all joint venture formations with a formation date on or after January 1, 2025. We will
adopt ASU 2023-05 effective January 1, 2025 and do not expect it to have a material impact on our consolidated financial statements and disclosures.
The FASB issued ASU 2024-03, “Income Statement – Reporting Comprehensive Income – Expense Disaggregation Disclosures (Subtopic 22-40): Disaggregation of Income Statement Expenses” (“ASU 2024-03”) in November 2024. This ASU requires entities to provide enhanced disclosures related to certain expense categories included in income statement captions. The ASU aims to increase transparency and provide investors with more detailed information about the nature of expenses reported on the face of the income statement. The new standard does not change the requirements for the presentation of expenses on the face of the income statement. ASU 2024-03 is effective for annual reporting periods beginning after December 15, 2026 and interim reporting periods beginning after December 15, 2027. Early adoption is permitted. While the adoption is not expected to have an impact on our financial statements, it is expected to result in incremental disclosures within the footnotes to our consolidated financial statements.
Recently Adopted Accounting Standards
We adopted both ASU 2022‑03, “Fair Value Measurement (Topic 820) – Fair Value Measurement of Equity Securities Subject to Contractual Sale Restrictions” (“ASU 2022‑03”) and ASU 2023-07, “Improvements to Reportable Segment Disclosures” (“ASU 2023-07”) effective December 31, 2024. ASU 2022‑03 aligned the fair value measurement methodology for equity securities with contractual sale restrictions with the methodology for identical unrestricted securities and introduced enhanced disclosure requirements. ASU 2023-07 enhanced segment reporting by requiring detailed disclosure of significant expenses, adding disclosures related to the CODM and expanding disclosure requirements for interim periods. The adoption of these ASUs did not result in a material impact to our consolidated financial statements.
ITEM 9. CHANGES IN AND DISAGREEMENTS WITH ACCOUNTANTS ON ACCOUNTING AND FINANCIAL DISCLOSURE
None.
ITEM 9A. CONTROLS AND PROCEDURES
In March 2024, subsidiaries of our wholly owned USPI Holding Company, Inc. subsidiary, acquired controlling interests in 41 ambulatory surgery centers (together, the “March 2024 ASCs”). We have excluded the March 2024 ASCs’ operations from our assessment of and conclusion on the effectiveness of our internal control over financial reporting. The March 2024 ASCs represent 3% of our consolidated total assets and 1% of our consolidated net operating revenues as of and for the year ended December 31, 2024. SEC rules require us to include acquired entities in our assessment of the effectiveness of internal control over financial reporting no later than the annual management report following the first anniversary of the acquisition. We will complete the evaluation and integration of the March 2024 ASCs’ operations within the required timeframe and report management’s assessment of our internal control over financial reporting in our first annual report in which such assessment is required. Other than this transaction, there were no changes in our internal control over financial reporting during the quarter ended December 31, 2024 that have materially affected, or are reasonably likely to materially affect, our internal control over financial reporting.
We carried out an evaluation of the effectiveness of the design and operation of our disclosure controls and procedures as defined by Rules 13a‑15(e) and 15d‑15(e) under the Exchange Act as of the end of the period covered by this report. The evaluation was performed under the supervision and with the participation of management, including our chief executive officer and chief financial officer. Based upon that evaluation, our chief executive officer and chief financial officer concluded that our disclosure controls and procedures are effective as of December 31, 2024 to ensure that material information is recorded, processed, summarized and reported by management on a timely basis in order to comply with our disclosure obligations under the Exchange Act and the SEC rules thereunder.
Management’s report on internal control over financial reporting is set forth on page 70 and is incorporated herein by reference. The independent registered public accounting firm that audited the financial statements included in this report has issued an attestation report on our internal control over financial reporting as set forth on page 71 herein. ITEM 9B. OTHER INFORMATION
During the three months ended December 31, 2024, none of our directors or Section 16 officers adopted or terminated a “Rule 10b5‑1 trading arrangement” or “non‑Rule 10b5‑1 trading arrangement,” as each term is defined in Item 408 of the SEC’s Regulation S‑K.
ITEM 9C. DISCLOSURE REGARDING FOREIGN JURISDICTIONS THAT PREVENT INSPECTIONS
Not applicable.
PART III.
ITEM 10. DIRECTORS, EXECUTIVE OFFICERS AND CORPORATE GOVERNANCE
The information required by this Item regarding the identity and business experience of our directors is set forth under the subsections “Nominees for Election to the Board of Directors,” “Director Nomination and Qualifications” and “Director Nominees’ Qualifications and Experience” under the heading “Proposal 1 – Election of Directors,” and the information required by this Item regarding the identity and business experience of our executive officers is set forth under the heading “Executive Officers,” in each case in the definitive proxy materials we will file in connection with our 2025 Annual Meeting of Shareholders. All such information is incorporated herein by reference in accordance with General Instruction G(3) to Form 10‑K.
Information on our Audit Committee and Audit Committee Financial Experts as required by this Item is set forth under the caption “Corporate Governance and Board Practices – Committees” in the definitive proxy materials we will file in connection with our 2025 Annual Meeting of Shareholders and is incorporated herein by reference in accordance with General Instruction G(3) to Form 10‑K.
Information concerning our Code of Conduct, by which all of our employees and officers, including our chief executive officer, chief financial officer and principal accounting officer, are required to abide appears under Item 1, Business – Compliance and Ethics, of Part I of this report, and is incorporated herein by reference.
Information concerning our policies and procedures governing the purchase and sale or other disposition of Tenet securities by directors, officers and employees, as required by this Item, is set forth under the caption “Insider Trading Policies and Procedures” in the definitive proxy materials we will file in connection with our 2025 Annual Meeting of Shareholders and is incorporated by reference in accordance with General Instruction G(3) to Form 10-K. Our insider trading policies and procedures are filed as Exhibit 19 to this report.
ITEM 11. EXECUTIVE COMPENSATION
The information required by this Item is set forth under the headings “Executive Compensation Tables,” “Corporate Governance and Board Practices – Committees – HR Committee Interlocks and Insider Participation” and “Human Resources Committee Report” in the definitive proxy materials we will file in connection with our 2025 Annual Meeting of Shareholders and is incorporated herein by reference in accordance with General Instruction G(3) to Form 10‑K.
ITEM 12. SECURITY OWNERSHIP OF CERTAIN BENEFICIAL OWNERS AND MANAGEMENT AND RELATED STOCKHOLDER MATTERS
Information about security ownership of certain beneficial owners required by this Item is set forth under the headings “Securities Ownership” and “Securities Authorized for Issuance Under Equity Compensation Plans” in the definitive proxy materials we will file in connection with our 2025 Annual Meeting of Shareholders and is incorporated herein by reference in accordance with General Instruction G(3) to Form 10‑K.
ITEM 13. CERTAIN RELATIONSHIPS AND RELATED TRANSACTIONS, AND DIRECTOR INDEPENDENCE
The information required by this Item is set forth under the headings “Corporate Governance and Board Practices – Certain Relationships and Related Person Transactions” and “Proposal 1 – Election of Directors – Director Nominees’ Qualifications and Experience – Director Independence” in the definitive proxy materials we will file in connection with our 2025 Annual Meeting of Shareholders and is incorporated herein by reference in accordance with General Instruction G(3) to Form 10‑K.
ITEM 14. PRINCIPAL ACCOUNTING FEES AND SERVICES
The information required by this Item is set forth under the heading “Proposal 3 – Ratification of the Selection of Independent Registered Public Accountants” in the definitive proxy materials we will file in connection with our 2025 Annual Meeting of Shareholders and is incorporated herein by reference in accordance with General Instruction G(3) to Form 10‑K.
PART IV.
ITEM 15. EXHIBITS AND FINANCIAL STATEMENT SCHEDULES
FINANCIAL STATEMENTS
The Consolidated Financial Statements and notes thereto can be found on pages 74 through 117. FINANCIAL STATEMENT SCHEDULES
Schedule II—Valuation and Qualifying Accounts (included on page 128). All other schedules and financial statements of the Registrant are omitted because they are not applicable or not required or because the required information is included in the Consolidated Financial Statements or notes thereto.
EXHIBITS
Unless otherwise indicated, the following exhibits are filed with this report:
| | | | | | | | | | | |
| (3) | | Articles of Incorporation and Bylaws |
| | | |
| | (a) | |
| | | |
| | (b) | |
| | | |
| | (c) | |
| | | |
| | | | | | | | | | | |
| (4) | | Instruments Defining the Rights of Security Holders, Including Indentures |
| | | |
| | (a) | |
| | | |
| | (b) | |
| | | |
| | (c) | |
| | | |
| | (d) | |
| | | |
| | (e) | |
| | | |
| | (f) | |
| | | |
| | (g) | |
| | | |
| | (h) | |
| | | |
| | (i) | |
| | | |
| | (j) | |
| | | | | | | | | | | |
| (10) | | Material Contracts |
| | | |
| | (a) | Amendment No. 7, dated as of March 16, 2022, to that certain Amended and Restated Credit Agreement, dated as of October 19, 2010, among the Registrant, the lenders and issuers party thereto and Citicorp USA, Inc., as administrative agent, including as Exhibit A thereto a copy of the Amended and Restated Credit Agreement reflecting all amendments and restatements through March 16, 2022 (Incorporated by reference to Exhibit 10.1 to Registrant’s Current Report on Form 8-K filed March 17, 2022) |
| | | |
| | (b) | Amendment No. 6, dated as of September 7, 2023, to the Letter of Credit Facility Agreement, dated as of March 7, 2014, by and among the Registrant, the LC participants and issuers party thereto, and Barclays Bank PLC, as administrative agent, including as Exhibit A thereto a copy of the Letter of Credit Facility Agreement reflecting all amendments through September 7, 2023 (Incorporated by reference to Exhibit 10.1 to Registrant’s Current Report on Form 8-K filed September 8, 2023) |
| | | |
| | (c) | |
| | | |
| | (d) | |
| | | |
| | (e) | First Amendment to Stock Pledge Agreement, dated as of May 8, 2009, by and among the Registrant, as pledgor, The Bank of New York Mellon Trust Company, N.A., as collateral trustee, and the other pledgors party thereto (Incorporated by reference to Exhibit 10(h) to Registrant’s Annual Report on Form 10-K for the year ended December 31, 2015, filed February 22, 2016) |
| | | |
| | (f) | |
| | | |
| | (g) | Third Amendment to Stock Pledge Agreement, dated as of March 7, 2014, by and among the Registrant, as pledgor, The Bank of New York Mellon Trust Company, N.A., as collateral trustee, and the other pledgors party thereto (Incorporated by reference to Exhibit 10(j) to Registrant’s Annual Report on Form 10-K for the year ended December 31, 2015, filed February 22, 2016) |
| | | |
| | (h) | Fourth Amendment to Stock Pledge Agreement, dated as of March 23, 2015, by and among the Registrant, as pledgor, The Bank of New York Mellon Trust Company, N.A., as collateral trustee, and the other pledgors party thereto (Incorporated by reference to Exhibit 10(k) to Registrant’s Annual Report on Form 10-K for the year ended December 31, 2015, filed February 22, 2016) |
| | | |
| | (i) | Fifth Amendment to Stock Pledge Agreement, dated as of December 1, 2016, by and among the Registrant, as pledgor, The Bank of New York Mellon Trust Company, N.A., as collateral trustee, and the other pledgors party thereto (Incorporated by reference to Exhibit 10(m) to Registrant’s Annual Report on Form 10-K for the year ended December 31, 2018, filed February 25, 2019) |
| | | |
| | (j) | Sixth Amendment to Stock Pledge Agreement, dated as of July 14, 2017, by and among the Registrant, as pledgor, The Bank of New York Mellon Trust Company, N.A., as collateral trustee, and the other pledgors party thereto (Incorporated by reference to Exhibit 10(n) to Registrant’s Annual Report on Form 10-K for the year ended December 31, 2018, filed February 25, 2019) |
| | | |
| | (k) | Seventh Amendment to Stock Pledge Agreement, dated as of February 5, 2019, by and among the Registrant, as pledgor, The Bank of New York Mellon Trust Company, N.A., as collateral trustee, and the other pledgors party thereto (Incorporated by reference to Exhibit 10(o) to Registrant’s Annual Report on Form 10-K for the year December 31, 2018, filed February 25, 2019) |
| | | |
| | | | | | | | | | | |
| | (l) | Eighth Amendment to Stock Pledge Agreement, dated as of August 26, 2019, Ninth Amendment to Stock Pledge Agreement, dated as of April 7, 2020, Tenth Amendment to Stock Pledge Agreement, dated as of June 16, 2020, Eleventh Amendment to Stock Pledge Agreement, dated as of June 2, 2021, Twelfth Amendment to Stock Pledge Agreement, dated as of December 1, 2021, Thirteenth Amendment to Stock Pledge Agreement, dated as of June 15, 2022, and Fourteenth Amendment to Stock Pledge Agreement, dated as of May 16, 2023, all by and among the Registrant, as pledgor, The Bank of New York Mellon Trust Company, N.A., as collateral trustee, and the other pledgors party thereto (Incorporated by reference to Exhibit 10(l) to Registrant’s Annual Report on Form 10-K for the year December 31, 2023, filed February 16, 2024) |
| | | |
| | (m) | |
| | | |
| | (n) | |
| | | |
| | (o) | |
| | | |
| | (p) | |
| | | |
| | (q) | |
| | | |
| | (r) | |
| | | |
| | (s) | |
| | | |
| | (t) | |
| | | |
| | (u) | |
| | | |
| | (v) | |
| | | |
| | (w) | |
| | | |
| | (x) | |
| | | |
| | | | | | | | | | | |
| | (y) | |
| | | |
| | (z) | |
| | | |
| | (aa) | |
| | | |
| | (bb) | |
| | | |
| | (cc) | |
| | | |
| | (dd) | |
| | | |
| | (ee) | |
| | | |
| | (ff) | |
| | | |
| | (gg) | |
| | | |
| | (hh) | |
| | | |
| | (ii) | |
| | | |
| | (jj) | |
| | | |
| | (kk) | |
| | | |
| | | | | | | | | | | |
| | (ll) | |
| | | |
| | (mm) | |
| | | |
| | (nn) | |
| | | |
| | (oo) | |
| | | |
| | (pp) | |
| | | |
| | (qq) | |
| | | |
| | (rr) | |
| | | |
| (19) | | |
| | | |
| (21) | | |
| | | |
| (23) | | |
| | | |
| | |
| | | |
| (31) | | Rule 13a-14(a)/15d-14(a) Certifications |
| | | |
| | (a) | |
| | | |
| | (b) | |
| | | |
| (32) | | |
| | | |
| (97) | | |
| | | |
| (101 SCH) | | Inline XBRL Taxonomy Extension Schema Document |
| | | |
| (101 CAL) | | Inline XBRL Taxonomy Extension Calculation Linkbase Document |
| | | |
| (101 DEF) | | Inline XBRL Taxonomy Extension Definition Linkbase Document |
| | |
| (101 LAB) | | Inline XBRL Taxonomy Extension Label Linkbase Document |
| | |
| (101 PRE) | | Inline XBRL Taxonomy Extension Presentation Linkbase Document |
| | | |
| (101 INS) | | Inline XBRL Taxonomy Extension Instance Document – the instance document does not appear in the interactive data file because its XBRL tags are embedded within the inline XBRL document |
| | | |
| (104) | | | Cover page from the Registrant’s Annual Report on Form 10-K for the year ended December 31, 2024 formatted in Inline XBRL (included in Exhibit 101) |
| | | |
| * Management contract or compensatory plan or arrangement |
ITEM 16. FORM 10-K SUMMARY
None.
SIGNATURES
Pursuant to the requirements of Section 13 or 15(d) of the Securities Exchange Act of 1934, the Registrant has duly caused this report to be signed on its behalf by the undersigned, thereunto duly authorized.
| | | | | | | | |
| | | TENET HEALTHCARE CORPORATION
(Registrant) |
| Date: February 18, 2025 | By: | /s/ R. SCOTT RAMSEY |
| | | R. Scott Ramsey Senior Vice President, Controller (Principal Accounting Officer) |
Pursuant to the requirements of the Securities Exchange Act of 1934, this report has been signed below by the following persons on behalf of the Registrant and in the capacities and on the dates indicated.
| | | | | | | | |
| Date: February 18, 2025 | By: | /s/ SAUMYA SUTARIA |
| | Saumya Sutaria, M.D. Chairman of the Board and Chief Executive Officer (Principal Executive Officer) |
| Date: February 18, 2025 | By: | /s/ SUN PARK |
| | | Sun Park Executive Vice President and Chief Financial Officer (Principal Financial Officer) |
| Date: February 18, 2025 | By: | /s/ R. SCOTT RAMSEY |
| | | R. Scott Ramsey Senior Vice President, Controller (Principal Accounting Officer) |
| | |
| | |
| Date: February 18, 2025 | By: | /s/ VINEETA AGARWALA |
| | Vineeta Agarwala, M.D., PhD
Director |
| Date: February 18, 2025 | By: | /s/ JAMES L. BIERMAN |
| | | James L. Bierman
Director |
| Date: February 18, 2025 | By: | /s/ ROY D. BLUNT |
| | Roy D. Blunt
Director |
| Date: February 18, 2025 | By: | /s/ RICHARD FISHER |
| | | Richard Fisher
Director |
| Date: February 18, 2025 | By: | /s/ MEGHAN M. FITZGERALD |
| | | Meghan M. FitzGerald, DrPH
Director |
| Date: February 18, 2025 | By: | /s/ CECIL D. HANEY |
| | Cecil D. Haney
Director |
| Date: February 18, 2025 | By: | /s/ J. ROBERT KERREY |
| | | J. Robert Kerrey
Director |
| Date: February 18, 2025 | By: | /s/ CHRIS LYNCH |
| | | Chris Lynch
Director |
| Date: February 18, 2025 | By: | /s/ RICHARD MARK |
| | | Richard Mark
Director |
| | | | | | | | |
| Date: February 18, 2025 | By: | /s/ TAMMY ROMO |
| | Tammy Romo
Director |
| Date: February 18, 2025 | By: | /s/ STEPHEN H. RUSCKOWSKI |
| | Stephen H. Rusckowski
Director |
| Date: February 18, 2025 | By: | /s/ NADJA WEST |
| | | Nadja West, M.D.
Director |
SCHEDULE II—VALUATION AND QUALIFYING ACCOUNTS
(In Millions)
| | | | | | | | | | | | | | | | | | | | | | | | | | | | | |
| | Balance at
Beginning
of Period | |
Costs and Expenses(1) | | Deductions | | Other
Items | | Balance at
End of
Period |
| | | | | | | | | |
| | | | | | | | | |
| | | | | | | | | |
| | | | | | | | | |
| Valuation allowance for deferred tax assets: | | | | | | | | | |
| Year ended December 31, 2024 | $ | 248 | | | $ | (182) | | | $ | — | | | $ | 92 | | | $ | 158 | |
| Year ended December 31, 2023 | $ | 177 | | | $ | 71 | | | $ | — | | | $ | — | | | $ | 248 | |
| Year ended December 31, 2022 | $ | 57 | | | $ | 120 | | | $ | — | | | $ | — | | | $ | 177 | |
| | | | | | | | |
| | |
| (1) | Includes amounts recorded in discontinued operations. |