QuickLinks -- Click here to rapidly navigate through this document
EXHIBIT 99.2
New York and Boston
Tenet
Forward-Looking Statements
Certain statements contained in this presentation constitute forward-looking statements. Such forward-looking statements are based on management's current expectations and involve known and unknown risks, uncertainties and other factors that may cause the Company's actual results to be materially different from those expressed or implied by such forward-looking statements. Such factors include, among others, the following: general economic and business conditions, both nationally and regionally; industry capacity; demographic changes; changes in, or the failure to comply with, laws and governmental regulations; the ability to enter into managed care provider arrangements on acceptable terms; changes in Medicare and Medicaid payments or reimbursement, including those resulting from a shift from traditional reimbursement to managed care plans; liability and other claims asserted against the Company; competition, including the Company's failure to attract patients to its hospitals; the loss of any significant customers; technological and pharmaceutical improvements that increase the cost of providing, or reduce the demand for, health care; a shortage of raw materials, a breakdown in the distribution process or other factors that may increase the Company's cost of supplies; changes in business strategy or development plans; the ability to attract and retain qualified personnel, including physicians, nurses and other health care professionals, including the impact on the Company's labor expenses resulting from a shortage of nurses or other health care professionals; the significant indebtedness of the Company; the availability of suitable acquisition opportunities and the length of time it takes to accomplish acquisitions; the Company's ability to integrate new businesses with its existing operations; and the availability and terms of capital to fund the expansion of the Company's business, including the acquisition of additional facilities. Certain additional risks and uncertainties are discussed in the Company's filings with the Securities and Exchange Commission, including the Company's annual report on Form 10-K and quarterly reports on Form 10-Q. Do not rely on any forward-looking statement, as we cannot predict or control many of the factors that ultimately may affect our ability to achieve the results estimated. We make no promise to update any forward-looking statement, whether as a result of changes in underlying factors, new information, future events or otherwise.
Investment Highlights
- •
- Leading hospital company
- •
- Strong top-line growth
- •
- All measures of profitability at new highs; expect further improvement
- •
- Record cash flow, expect continued strength
- •
- Expect long period of accelerating demand due to Baby Boomer effect
Key Questions
- •
- What are the growth drivers?
- •
- How long can it last?
Future Expectations
- •
- Over next several years, expect diluted EPS from operations growth:
- •
- Mid- to high-teens each year
- •
- Potentially higher in some years
- •
- Expect fiscal 2003 EPS growth to exceed 25%
- •
- Even after increasing FY02 by $0.17 for SFAS 142
EXPECT EXTENDED PERIOD OF OUTSTANDING GROWTH
Growth Drivers: Long-Term vs. Short-Term
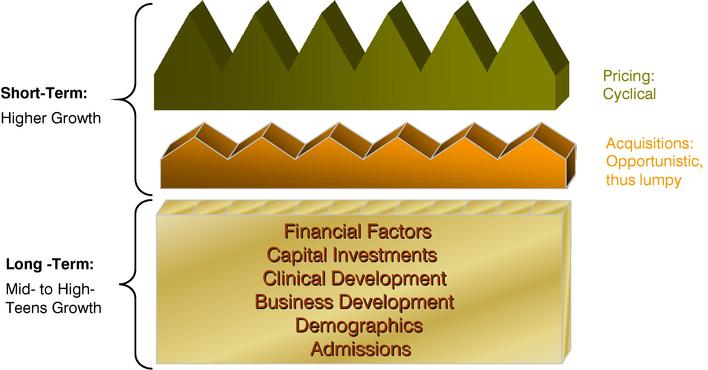
Top-line Growth Drivers: MANAGED CARE
- •
- 44% of THC net revenue
- •
- Base rates rising 6-8%
- •
- Improvements in terms
- •
- Stop-loss payments
Top-line Growth Drivers: GOVERNMENT PROGRAMS
- •
- Medicare: 32% of THC net revenue
- •
- Modest rate increases legislated, after cuts in 1997
- •
- Medicare admissions rising as Medicare HMO patients return to traditional Medicare
- •
- Rate outlook is benign to positive
- •
- Outliers have grown; threshold rising
- •
- Medicaid: 8% of THC net revenue
- •
- State budgets being squeezed
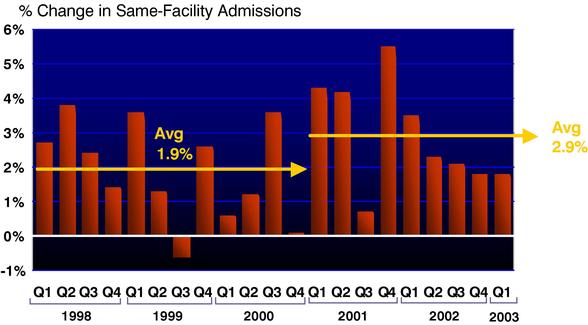
Core Growth Drivers: ADMISSIONS
- •
- Gaining market share
- •
- In-market population growth
- •
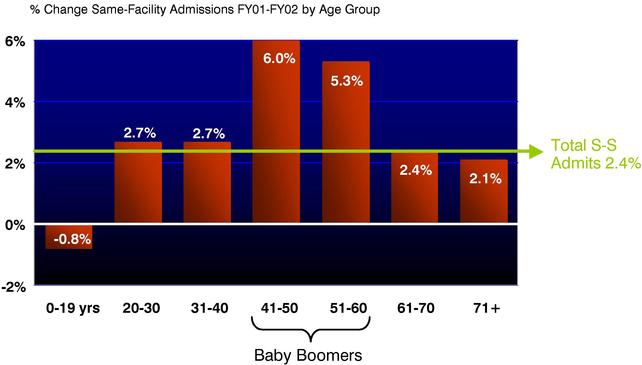
- Demographics: Baby boomers need more care
Core Growth Drivers: DEMOGRAPHICS
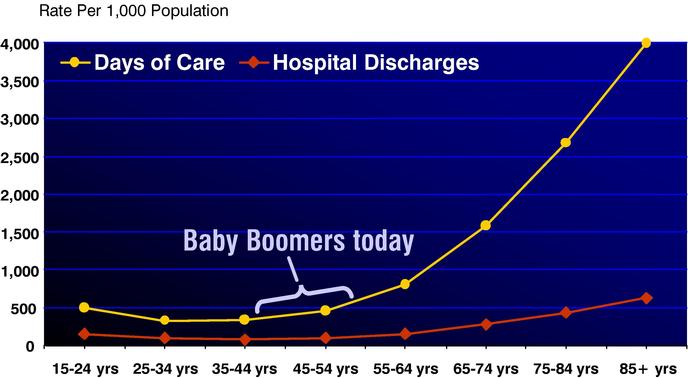
Source: National Hospital Discharge Survey, Center for Disease Control and Prevention, 1999
Core Growth Drivers: DEMOGRAPHICS
Core Growth Drivers: BUSINESS DEVELOPMENT
- •
- Cap ex
- •
- Program development
- •
- Capacity expansion
- •
- New managed care contracts
- •
- Physician recruitment
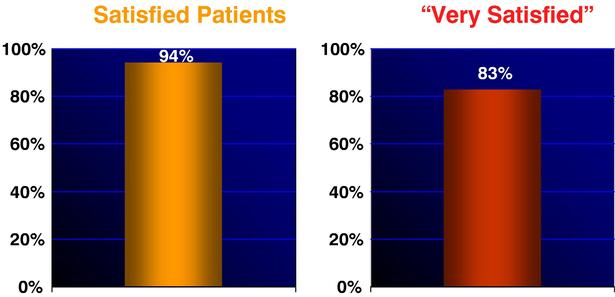
- •
- Rising patient, physician satisfaction
Core Growth Drivers: BUSINESS DEVELOPMENT
Target 100: Raising the Bar
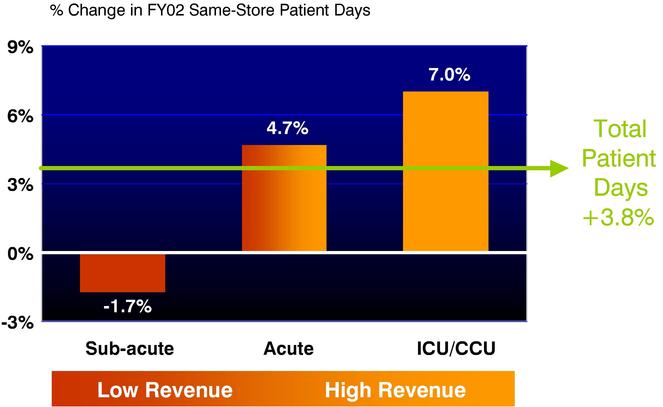
Core Growth Drivers: CLINICAL
- •
- De-emphasizing sub-acute services
- •
- Developing, enhancing high acuity services
- •
- Effect of Partnership for Change
Core Growth Drivers: CLINICAL
- •
- Growing high intensity core services
- •
- Cardiology
- •
- Orthopedics
- •
- Neurology
- •
- Oncology
- •
- Focused physician recruitment, program development, capital investment
- •
- Drives volumes and unit revenues
Core Growth Drivers: CLINICAL
Highest Growth in High Acuity Services
Core Growth Drivers: CLINICAL
AMI Protocols: Tenet Exceeds Benchmark
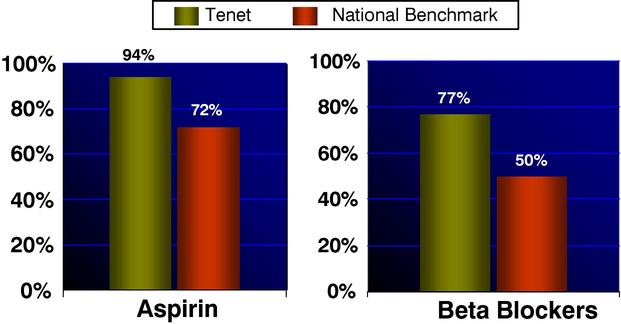
National Benchmark represents best-available national comparison, which tracks administration within 48 hours. (JAMA 2002 March 13; 287 (10): 1277-1287).
Core Growth Drivers: CLINICAL
Better Care = Lower Costs
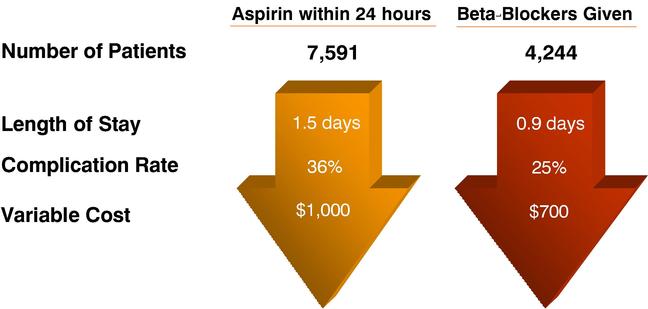
Source: Tenet data from participating Partnership for Change hospitals.
Core Growth Drivers: FINANCIAL FACTORS
- •
- Operating leverage from strong top-line growth
- •
- Reduced interest costs
- •
- FY02 interest down $129mm from FY01
- •
- Share repurchase
- •
- Operating leverage from rising capacity utilization
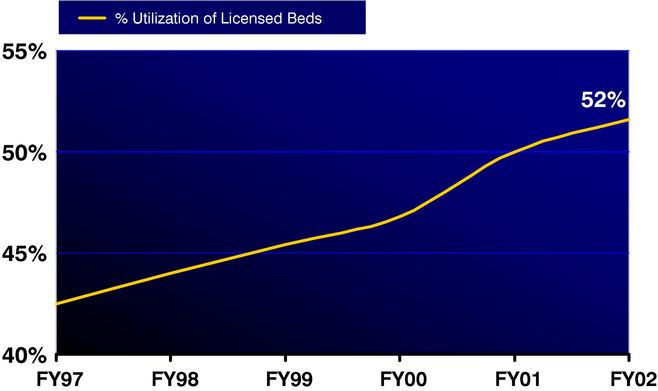
Core Growth Drivers: OPERATING LEVERAGE
Occupancy Rising in Tenet Hospitals
Core Growth Drivers: CHANGING SUPPLY/DEMAND
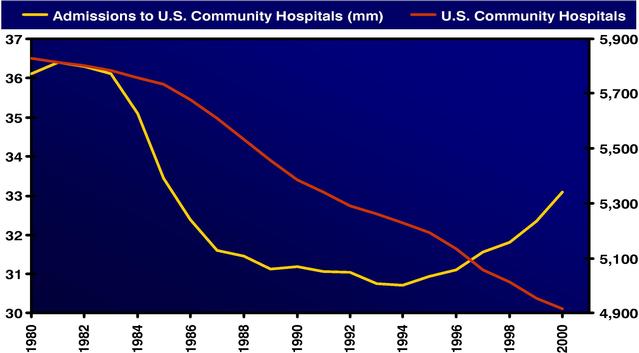
Source: 2002 Hospital Statistics, American Hospital Association
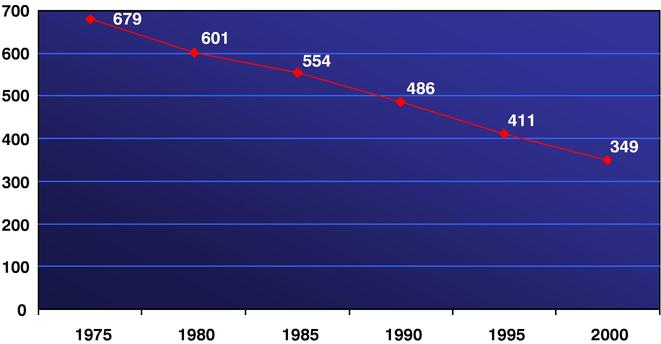
Core Growth Drivers: CHANGING SUPPLY/DEMAND
Hospital beds per 100,000 population, 1975-2000
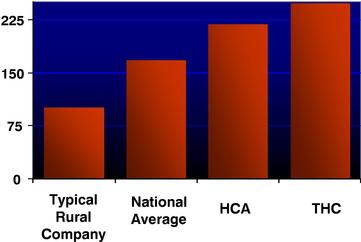
Larger, More Sophisticated Hospitals
Average beds per facility
 | | 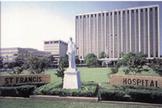
Saint Francis Hospital
Memphis, TN
651 Beds
Florida Medical Center
Ft. Lauderdale, FL
459 Beds |
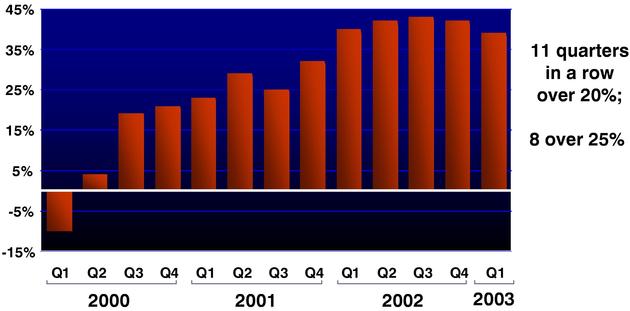
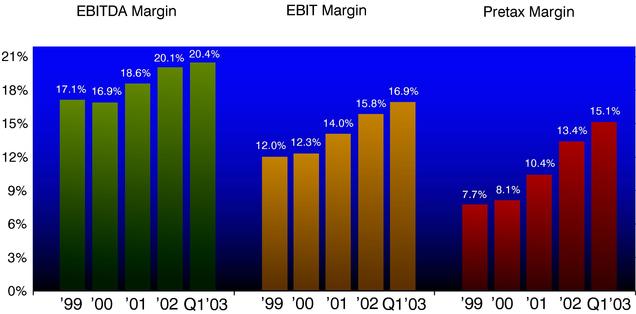
EPS Growth
Profitability Increasing
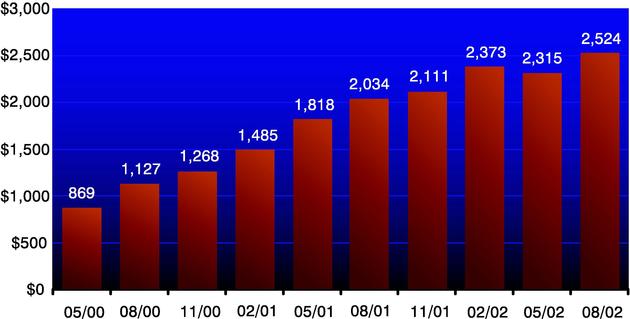
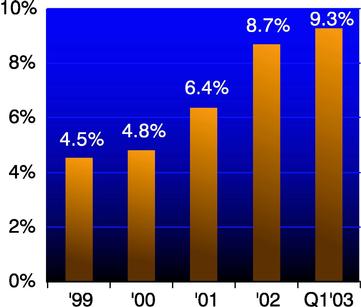
Cash Flow
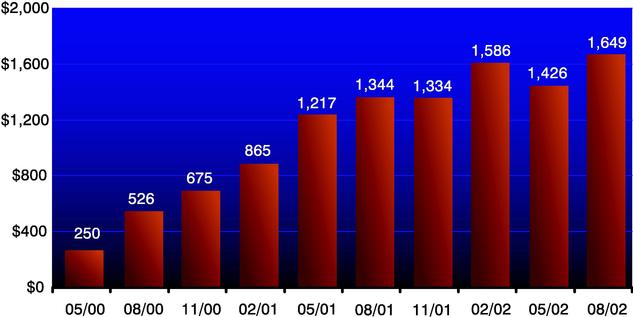
Free Cash Flow
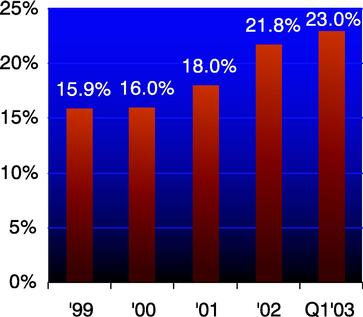
Returns Improving: The Payoff for Investors
Return on Assets—LTM
Excludes goodwill amortization in all periods | | Return on Equity—LTM
 |
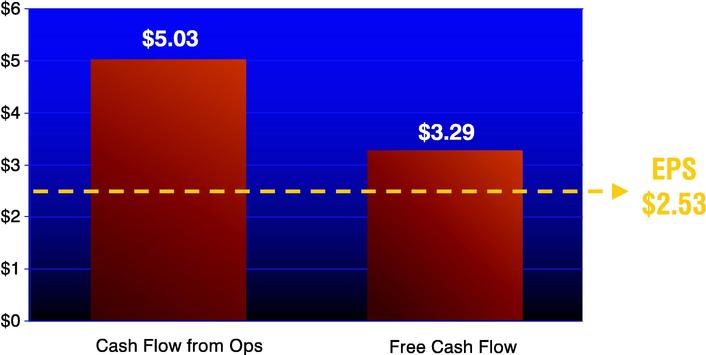
High Quality Earnings
Future Expectations
- •
- Over next several years, expect diluted EPS from operations growth:
- •
- Mid- to high-teens each year
- •
- Potentially higher in some years
- •
- Expect fiscal 2003 EPS growth to exceed 25%
- •
- Even after increasing FY02 by $0.17 for SFAS 142
EXPECT EXTENDED PERIOD OF OUTSTANDING GROWTH
Tenet
service, quality
QuickLinks