![]() Trevor Fetter President and Chief Executive Officer January 11, 2011 Tenet Healthcare Corporation Presentation To Investors Exhibit 99.1 |
![]() 2 Forward-looking statements Forward-looking statements Certain statements contained in this presentation constitute “forward-looking statements” within the meaning of Section 27A of the Securities Act of 1933 and Section 21E of the Securities Exchange Act of 1934. Such forward-looking statements are based on management's current expectations and involve known and unknown risks, uncertainties and other factors that may cause the Company’s actual results to be materially different from those expressed or implied by such forward-looking statements. Such factors include, among others, the following: the passage of heath care reform legislation and the enactment of additional federal and state health care reform; other changes in federal, state, or local laws and regulations affecting the health care industry; general economic and business conditions, both nationally and regionally; demographic changes; changes in, or the failure to comply with, laws and governmental regulations; the ability to enter into managed care provider arrangements on acceptable terms; changes in Medicare and Medicaid payments or reimbursement; liability and other claims asserted against the Company; competition, including the Company’s ability to attract patients to its hospitals; technological and pharmaceutical improvements that increase the cost of providing, or reduce the demand for, health care; changes in business strategy or development plans; the ability to attract and retain qualified personnel, including physicians, nurses and other health care professionals, and the impact on the Company’s labor expenses resulting from a shortage of nurses or other health care professionals; the significant indebtedness of the Company; the Company's ability to integrate new businesses with its existing operations; the availability and terms of capital to fund the expansion of the Company's business, including the acquisition of additional facilities; the creditworthiness of counterparties to the Company’s business transactions; adverse fluctuations in interest rates and other risks related to interest rate swaps or any other hedging activities the Company undertakes; the ability to continue to expand and realize earnings contributions from the Company’s Conifer revenue cycle management and patient communication businesses; and its ability to identify and execute on measures designed to save or control costs or streamline operations. Such factors also include the positive and negative effects of health reform legislation on reimbursement and utilization and the future designs of provider networks and insurance plans, including pricing, provider participation, coverage and co-pays and deductibles, all of which contain significant uncertainty, and for which multiple models exist which may differ materially from the Company's expectations. Certain additional risks and uncertainties are discussed in the Company’s filings with the Securities and Exchange Commission, including the Company’s annual report on Form 10-K and quarterly reports on Form 10-Q. The Company specifically disclaims any obligation to update any forward-looking statement, whether as a result of changes in underlying factors, new information, future events or otherwise. Non-GAAP Information This document includes certain financial measures such as Adjusted EBITDA, which are not calculated in accordancewith generally accepted accounting principles (GAAP). Management recommends that you focus on the GAAP numbers as the best indicator of financial performance. These alternative measures are provided only as a supplement to aid in analysis of the Company. Reconciliation between non-GAAP measures and related GAAP measures can be found in Appendix D. Additional Information Tenet Healthcare Corporation ("Tenet") will file with the Securities and Exchange Commission ("SEC") a proxy statement in connection with its 2011 annual meeting of stockholders. Any definitive proxy statement will be mailed to stockholders of Tenet. INVESTORS AND SECURITYHOLDERS OF TENET ARE URGED TO READ THESE AND OTHER DOCUMENTS FILED WITH THE SEC CAREFULLY IN THEIR ENTIRETY WHEN THEY BECOME AVAILABLE BECAUSE THEY WILL CONTAIN IMPORTANT INFORMATION. Investors and securityholders will be able to obtain free copies of these documents (when available) and other documents filed with the SEC by Tenet through the website maintained by the SEC at http://www.sec.gov. Certain Information Regarding Participants Tenet and certain of its respective directors and executive officers are deemed to be participants under the rules of the SEC. Information regarding these participants is contained in a filing under Rule 14a-12 filed by Tenet with the SEC on January 7, 2011. This filing and other documents can be obtained free of charge from the sources indicated above. Additional information regarding the interests of these participants in any proxy solicitation and a description of their direct and indirect interests, by security holdings or otherwise, will also be included in any proxy statement and other relevant materials to be filed with the SEC if and when they become available. |
![]() 3 The hospital industry: a compelling investment The hospital industry: a compelling investment Strong demographic changes driving growth The growth rate of the over 65 population will more than double to over 3.0% between 2010 and 2012 Per capita spending on healthcare nearly doubles between age 50 and age 65 Affordable Care Act Expands insurance coverage to 32 million uninsured Americans (2014) Insurance “reforms” increase interim coverage (2010) Newly covered population likely to utilize hospital services at increased rate Recession has suppressed volume growth and increased bad debt expense Returning to pre-recession levels expected to expand margins and growth rates |
![]() 4 Tenet at a glance Tenet at a glance Acute Care Hospitals (1) Beds (1) Employees US Coverage (1) Inpatient Admissions (2) Outpatient Visits (2) November 2010 EBITDA Outlook: - Including CA Provider Fee - Excluding CA Provider Fee Current 2010 EBITDA Estimate (5) (Excluding CA Provider Fee) 2011 EBITDA Outlook Range (5) - Represents an increase of $100mm - $200m over the 2010 estimate ___________________________ 1. Continuing operations as of December 31, 2010. 2. LTM continuing operations as of December 31, 2010. 3. Based on THC share price of $6.69 as of December 31, 2010. 4. $3.7 billion equity value (includes mandatory convertible) plus $4.1 billion in debt less $0.4 billion in cash, as of September 30, 2010. 5. Assumes California Provider Fee is recognized in 2011 as opposed to 2010. Actual 2010 EBITDA results may vary when 2010 results are released in February. 2010E Revenue (2) Equity Market Value (3) Enterprise Value (4) Net Debt $9.2 bn $3.7 bn $7.4 bn $3.7 bn Corporate Governance Independent Chairman of the Board 9 out of 10 board members are independent Diversified experience in public sector, healthcare, accounting and finance, technology and manufacturing Substantial experience with major corporate actions $1,050 - $1,100 mm $986 - $1,036 mm $1,050 mm $1,150 - $1,250 mm 49 13,430 57,000 11 states 513,000 3.9mm |
![]() Q4 2010 preliminary performance highlights and EBITDA outlook (1) Q4 2010 preliminary performance highlights and EBITDA outlook (1) Inpatient and outpatient year-over-year volume trends both improved relative to Q3 Inpatient admissions declined by 2.0% (compares to a 3.5% decline in Q3) Outpatient visits increased by 2.9% (compares to a 2.0% decline in Q3) Commercial volume trends improved compared to Q3 2010’s results, but statistic will no longer be Preliminary EBITDA (excluding California Provider Fee) of $1.050 billion exceeds previous outlook Excluding $64 million California Provider Fee, previous outlook was for $986 million to $1.036 billion Q4 Preliminary EBITDA is $281 million, previous outlook, excluding the California Provider Fee, was $217 million to $267 million Requirements for California Provider Fee to be recognized in 2010 were not met by year end Recognition is now expected in 2011 Expected amount remains $64 million New EBITDA Outlook for 2011 established from $1.150 billion to $1.250 billion (including California Provider Fee) 5 Solid results in 2010 and poised for further growth and value creation in 2011 ___________________________ 1. Actual Q4 2010 volume trends and 2010 EBITDA may vary when 2010 results are released in February. |
![]() 6 Our national hospital and outpatient center footprint Our national hospital and outpatient center footprint Acute Care Hospitals Diagnostic Imaging Centers (DICs) Ambulatory Surgery Centers (ASCs) DIC in development 49 acute care hospitals 81 free-standing OP centers $9.2 billion in revenues Focus on high growth markets Well-positioned in attractive growth markets |
![]() 7 Tenet Healthcare: A compelling investment Tenet Healthcare: A compelling investment Continued Strong Organic Growth Continued Strong Organic Growth in Earnings in Earnings Operating Integrity, Growth and Operating Integrity, Growth and Infrastructure Investments Reduce Future Risks Infrastructure Investments Reduce Future Risks Consistent Strategy Driven by Innovative, Consistent Strategy Driven by Innovative, High Margin, Capital Efficient Initiatives High Margin, Capital Efficient Initiatives |
![]() 8 Significant positive momentum – multiple value drivers Significant positive momentum – multiple value drivers ___________________________ 1. Data reflects the results of our existing 49 hospitals. 2. Actual 2010 results may vary when 2010 results are released in February. 3. Return on capital is defined as income from continuing operations excluding impairments and debt gains/losses, net of tax, plus after-tax interest expense net of investment income, and 1/3 of rent expense after-tax divided by invested capital, which is defined as total debt including our former government settlement obligation less cash plus average equity over the most recent five quarters excluding impairments in the period recorded plus 8 times rent expense. The reversal of our deferred tax asset valuation allowance in 2010 has been excluded from the 2010 computation. Return on Invested Capital (1)(3) De-levered Balance Sheet Superior EBITDA Growth and Margin Expansion (1) ($ millions) Estimate (2) ($ millions) Estimate (2) Estimate (2) Strong Net Revenue Growth (1) ($ millions) Estimate (2) $7,669 $7,557 $7,676 $8,083 $8,585 $9,014 $9,200 2004 2005 2006 2007 2008 2009 2010 6.9% 9.2% 12.1% 12.0% (3.3%) 2006 2007 2008 2009 2010 Return on Invested Capital $422 $543 $631 $658 $739 $982 $1,050 2004 2005 2006 2007 2008 2009 2010 0% 2% 4% 6% 8% 10% 12% 14% EBITDA EBITDA Margin $4,436 $4,803 $5,088 $5,039 $5,088 $4,950 $4,059 2004 2005 2006 2007 2008 2009 2010 Debt DOJ Liability |
![]() 1 6 8 8 3 4 6 6 3 9 Tenet has led same-hospital admissions growth over the last 15 quarters Tenet has led same-hospital admissions growth over the last 15 quarters Same-Hospital Admissions Growth (1) Ranking (2) Over Last 15 Quarters ___________________________ 1. Data for Tenet reflects the results of our existing 49 hospitals. 2. Metric records number of quarters in which the Company ranked #1, #2 or #3 among the three companies in the 15 quarters from Q1’07 to Q3’10. Ranked 1 st Ranked 2 nd Ranked 3 rd |
![]() 10 Strong organic net revenue growth (1) Strong organic net revenue growth (1) ($ millions) Estimate (2) ___________________________ 1. Data reflects the results of our existing 49 hospitals. 2. Actual 2010 results may vary when they are released in February. $7,669 $7,557 $7,676 $8,083 $8,585 $9,014 $9,200 2004 2005 2006 2007 2008 2009 2010 |
![]() 11 Consistent improvement of operating metrics has driven solid organic EBITDA growth Tenet’s same-hospital EBITDA growth has outpaced its largest peers in eight out of the last 15 quarters Tenet’s same-hospital EBITDA growth has outpaced its largest peers in eight out of the last 15 quarters EBITDA Growth (1) Ranking (2) Over Last 15 Quarters ___________________________ 1. Data for Tenet reflects the results of our existing 49 hospitals. Community’s same-store year-over-year EBITDA growth calculated using reported same-store income from operations, same-store depreciation and amortization, and same-store minority interest in earnings for each quarter. HCA year-over-year EBITDA growth based on reported consolidated EBITDA. 2. Metric records number of quarters in which the Company ranked #1, #2 or #3 among the three companies in the 15 quarters from Q1’07 to Q3’10. Ranked 1 st Ranked 2 nd Ranked 3 rd 4 5 6 3 7 5 8 3 4 |
![]() 12 Tenet’s EBITDA margins have expanded 590 basis points since 2004 (1) Tenet’s EBITDA margins have expanded 590 basis points since 2004 (1) ($ millions) Estimate (2) Cost control initiatives coupled with improved pricing has yielded significant margin expansion ___________________________ 1. Data reflects the results of our existing 49 hospitals. 2. Actual 2010 EBITDA may vary when results are released in February. $739 $982 $1,050 $658 $631 $543 $422 11.4% 10.9% 8.6% 8.1% 8.2% 7.2% 5.5% 2004 2005 2006 2007 2008 2009 2010 EBITDA EBITDA Margin |
![]() 13 Tenet’s consistent EBITDA improvement relative to peers has narrowed the margin gap Tenet’s consistent EBITDA improvement relative to peers has narrowed the margin gap Tenet is on track to exceed current industry average margins ___________________________ 1. Peer Average EBITDA margin of Community Health Systems, Hospital Corporation of America, Health Management Associates, LifePoint, Universal Health Services and Vanguard Health Systems. Vanguard 2010 EBITDA margin reflects last twelve months financials as of September 30, 2010 and the remaining peers reflect 2010E Wall Street research estimates. Peer Avg: (230bps) Tenet: 590bps 2004–2010E Change 10.8% 2.6% THC EBITDA Margin Peer Average Margin (1) 0% 5% 10% 15% 20% 2004 2005 2006 2007 2008 2009 2010E |
![]() 14 Tenet has one of the lowest leverage ratios and longest maturity profiles in the industry Tenet has one of the lowest leverage ratios and longest maturity profiles in the industry Active management of capital structure has significantly improved Tenet’s debt profile ___________________________ 1. As of September 30, 2010. Total Debt less Cash and Cash Equivalents/LTM EBITDA. 2. Includes $1.525 billion issuance announced on November 9, 2010. 3. Pro forma for Detroit Medical Center acquisition. Assumes $120 million of EBITDA at Detroit Medical Center as per Wall Street research. 4. Pro forma for announced acquisition of Psychiatric Solutions. 5. $216 million due February 1, 2013. 6. Borrowing availability under our revolving credit facility was $460 million at September 30, 2010. Becomes $500 million under the new agreement, as of September 30, 2010. No significant debt maturities prior to 2015 (5) No significant maintenance covenants Ample liquidity with $398 million of cash as of 9/30/2010; $800 million undrawn credit line (6) provides flexibility Weighted Average Debt Maturity (years) Leverage Ratio (1) Leverage Ratio Years (2) (3) (4) 4.0 4.0 5.0 5.0 6.0 6.0 8.0 HMA Community UHS LifePoint Vanguard HCA Tenet 4.8x 4.7x 4.3x 3.9x 3.8x 3.7x 2.7x HCA CommunityVanguard UHS HMA Tenet LifePoint |
![]() 15 Well-defined growth strategy Well-defined growth strategy High margin businesses Growth in EBITDA, cash flow, ROIC Organic growth Outpatient Capacity utilization & operating leverage through physician alignment Revenue cycle business Financial Objectives Growth Drivers Integrated clinical systems driving the capture of incentives, improved clinical quality, provider integration and cost efficiencies Greater than average benefit from new federal law Operating Foundation |
![]() Current HIT investments necessary to achieve government’s “meaningful use” will capture government incentives and contribute positive benefit to earnings beginning in 2012, while also improving clinical outcomes and operational efficiency 16 Improve outpatient/inpatient mix High growth/high margin revenue cycle management business focused on acute care providers Significant cost savings extracted from productivity and other efficiency initiatives Outpatient Conifer MPI (1) Health IT Significant reductions in uncompensated care and increased paying volumes due to Affordable Care Act Available capacity and increasing volumes position Company for substantial margin expansion Economic recovery and reduced unemployment expected to decrease bad debt expense and drive margin expansion Affordable Care Act Operating Leverage Bad Debt Seven key drivers of a 16 –18% EBITDA margin Seven key drivers of a 16 –18% EBITDA margin Tenet-specific Macroeconomic Industry ___________________________ 1. MPI = Medicare Performance Initiative. 1 2 3 4 6 5 7 |
![]() 17 Targeted acquisitions and organic growth will drive meaningful EBITDA margin expansion Targeted acquisitions and organic growth will drive meaningful EBITDA margin expansion ___________________________ 1. Acquisitions closed in 2010. Full year impact reflected in 2011 metrics. 2. Acquisitions expected to be negotiated and closed in 2011. Metrics represent partial year impacts (except for purchase price). 3. Percentage growth based on 2010 Outlook of 3.9mm OP visits, which includes OP visits associated with newly acquired centers. ($ millions) EBITDA Impact Outpatient 1 Tenet physician alignment and targeted growth initiatives expected to drive further outpatient growth Outpatient Acquisition Strategy 2010 Acquisitions (1) 2011 Acquisitions (2) Total 2011 Impact Centers Acquired 24 15–25 40–50 Purchase Price ($mm) $65 $100 $165 2011 Outpatient Visits (000s) 215 50–60 265–275 Impact on 2011 Visits (3) (% increase) 5% 1%–2% 6%–7% 2011 2012 2013 Run-Rate 2013 $65 $65 $55 $35 Total 20 20 10 -- 2012 20 20 20 10 2011 $25 $25 $25 $25 2010 EBITDA contribution from acquisitions completed in: $10 $10 $10 $25 $10 $65 2010 Acquisitions 2011 Acquisitions 2012 Acquisitions 2013 Run-Rate |
![]() 18 Conifer ranks among revenue cycle industry leaders Conifer ranks among revenue cycle industry leaders ___________________________ Source: Tenet and Accretive Health as of September 30, 2010 10-Q filing. Wall Street research. Note: Market data as of December 31, 2010. Conifer 2 Strong momentum with meaningful provider penetration and a substantial pipeline for continued growth Conifer Accretive # Client Hospitals 79 64 Client Net Patient Revenue $13.4bn $14.0bn # Employees 2,600 2,100 Solution Spans Entire Revenue Cycle Value Proposition = Increasing Client Yield Margin Expansion Inherent in Business Model Provides Long-Term Contracts 2011E EBITDA Multiple N/A 16.8x Enterprise Value N/A $1.5bn 2011 Revenue N/A $885 2011 EBITDA N/A $88 Substantial embedded value within Tenet |
![]() 19 Medicare Performance Initiative will continue to deliver significant cost savings Medicare Performance Initiative will continue to deliver significant cost savings MPI 3 MPI’s Goal: Cost reduction captured through physician adoption of best practices $30 million in 2010 cost savings achieved $50 million incremental savings in 2011 and subsequent years as MPI is rolled out to more hospitals and more DRGs; augmented by other supply and productivity initiatives MPI cost savings are cumulative 2011 2012 2013 2014 2015 Run-Rate Savings Incremental Savings $100 $150 $200 $250 $50 $50 $50 $100 $50 $150 $50 $200 $50 ($ millions) |
![]() 2009 2010 (1) 2011 2012 2013 2014 2015 2016 Healthcare IT (HIT) Program Expense (2) $12 $21 $50 $60 $40 $15 – – Federal HIT Incentives – – $15 $70 $97 $81 $44 $13 EBITDA Impact ($12) ($21) ($35) $10 $57 $66 $44 $13 HIT Capital Expenditures $49 $69 $106 $115 $69 $14 – – Foundation Systems (# Go-Live) – 8 12 20 9 – – – CPOE Systems (# Go-Live) – – 9 17 14 9 – – 20 HIT investments improve clinical outcomes and operational efficiencies HIT investments improve clinical outcomes and operational efficiencies ___________________________ 1. Estimate pending final close. Actual results may vary when results are released in February. 2. Excludes recurring clinical support operating expenses and HIT benefits to operating performance. Health IT 4 Federal HIT incentives contribute positive benefit to earnings starting in 2012 Clinical systems are critical to physician alignment and integration, reduction of medication errors, standardization of clinical practice and reduction of cost ($ in millions) Penalties avoided by achieving “Meaningful Use” (Net present value of $315mm) |
![]() 21 Reduced bad debt expense expected to contribute to EBITDA growth Reduced bad debt expense expected to contribute to EBITDA growth ___________________________ 1. Data reflects the results of our existing 49 hospitals. 2. Collection rates from self-pay accounts. The increase in bad debt expense includes factors in addition to the decline in collection rates. Key Takeaways Recession Has Driven Increase in Bad Debt Expense Bad Debt 5 Economic recovery expected to moderate bad debt expense and drive EBITDA margin expansion Prior to the recession, Conifer drove self- pay collections from 32% to 36% Tenet has executed its plan throughout the recession AR days declined from 54 days in Q1’08 to 46 days in Q3’10 Point of service collections increased from 34.5% in 2008 to 39.4% YTD 2010 Billing cycle times reduced by 19% from Q1’08 Right Care, Right Place initiative 53% increase in Medicaid qualifications in 2010 compared to 2008 Expense reductions expected from improved collections in the future 2007 collection rate of 36% declined to 29% in 2010 (2) Economic recovery alone expected to improve collections back to 36% Conifer expected to drive improved collections beyond 36% (1) Pre-Recession Recession 7.2% 6.3% 6.9% 7.3% 7.7% 8.0% 2005 2006 2007 2008 2009 2010 YTD Sept Bad Debt as % of Net Revenue |
![]() 22 Increase in capacity utilization provides significant upside opportunity Increase in capacity utilization provides significant upside opportunity ___________________________ 1. Utilization defined as daily census divided by number of licensed beds. 2. Actual 2010 utilization may vary when results are released in February. Utilization of Licensed Beds (1) Operating Leverage 6 Adjusted fixed expenses to right-size cost structure during economic downturn while also maintaining capacity to increase volumes in near term $40 million incremental EBITDA for every one percent increase in total volumes, assuming current mix $80 million incremental EBITDA from a one percent increase in capacity utilization No significant near-term capacity constraints (2) 54% 50% 52% Tenet 5-Yr High Utilization Tenet 2010E Utilization Tenet Projected 2015 Utilization |
![]() 23 Affordable Care Act expected to increase volumes Affordable Care Act expected to increase volumes ___________________________ Assumptions: Conversions of uninsured to Medicaid and exchanges use Congressional Budget Office assumptions (57% conversion) evenly split between Medicaid and exchanges. Existing volumes convert at existing case mix. Exchange pricing is slightly lower than projected commercial pricing. Note: Volume growth estimate assumes the same market share of newly insured as Tenet presently has of Medicaid and commercial patients and that utilization of hospital services are consistent with current Medicaid and commercial populations. Ultimate outcomes of the new law will vary, potentially significantly, depending on actual pricing of the exchanges, migration of lives (including to Medicaid and exchanges from commercial coverage), case mix and utilization of hospital and outpatient services by the newly insured, exchange copays and deductibles and other variables. Affordable Care Act 7 The Affordable Care Act is expected to be negative to earnings through 2013 due to Market Basket reductions (reducing positive annual market basket adjustments) However, expected to be positive in 2014 and 2015 due to: Migration of existing charity care to an insured status (revenue, bad debt and income increase) Migration of uninsured volumes to an insured status (revenue and bad debt decrease, income increases) Increased utilization of healthcare by the newly insured (revenue, bad debt and income increase) Expected to result in 7.5% inpatient and 5.0% outpatient volume growth Our 2015 estimated EBITDA range provides for substantial variation Tenet is positioned to benefit more from coverage of the newly insured due to our concentration in areas of high uninsured populations |
![]() 24 EBITDA outlook for 2010 and 2011 EBITDA outlook for 2010 and 2011 EBITDA Guidance Range Commentary 2010 Estimate (1) $1,050mm $64 million California provider fee extracted from 2010 and moved to 2011 Cash balance at December 31, 2010 is approximately $400 million with favorable EBITDA performance offset by higher capital spending (approximately $460 million), the deferral of the California Provider Fee, and working capital and other liability changes 2011 $1,150mm– $1,250mm Conservative macroeconomic assumptions Admissions decline of 1% to flat Adverse payer mix shift of $25 million Bad debt remains an elevated 7.4% to 8.4% HIT expense, net of incentives, expected to increase $14 million to $35 million $50 million in MPI and other cost savings Outpatient acquisitions adding $30 to $40 million Follow-on provider fees of $40 million expected, guidance range allows for variability ___________________________ 1. Actual 2010 EBITDA results may vary when 2010 results are released in February. |
![]() 25 Tenet has exceeded initial annual outlook in 2009 and 2010 Tenet has exceeded initial annual outlook in 2009 and 2010 1. Actual 2010 EBITDA may vary when results are released in February. |
![]() 26 Long-term outlook: 2010–2015 Long-term outlook: 2010–2015 Guidance Range Drivers Revenue Growth 4%–6% CAGR Continued pricing improvement balanced by modest volume growth (1) Government pricing pressure as measures from the “Affordable Care Act” are implemented Improving outpatient mix 36% of net patient revenue Flat to positive admissions growth Strong growth from Conifer and outpatient acquisitions EBITDA Growth 11%–16% CAGR Reduction in bad debt expense Economic recovery Affordable Care Act Growth in high margin business Conifer Outpatient services Increased operating leverage MPI Health IT incentives EBITDA Target Margin 16%–18% by end of 2015 Capital Expenditures $450mm–$550mm per annum Seismic requirements met as of Q4 2010 EPS Growth 37%–50% CAGR Continued trend of deleveraging and improving the capital structure NOL $2 billion NOL (December 2010) Expected to be fully realized by 2014 or 2015 NPV of $550mm–$600mm ___________________________ 1. Commercial pricing negotiated; 90% of 2011, 60% of 2012, at contractual price increases consistent with 2010. |
![]() Tenet’s EBITDA growth Tenet’s EBITDA growth ($ millions) Projected EBITDA growth is more modest than historical growth rates $1,250 $1,535 $2,250 27 ___________________________ 1. 2010 – 2015 CAGR based on mid-point of projected range. 2. Actual 2010 EBITDA may vary when results are released in February. Estimate (2) $422 $1,050 $1,150 $1,335 $1,750 $0 $500 $1,000 $1,500 $2,000 $2,500 2004 2010 2011 2013 2015 Lower End of EBITDA Range Upper End of EBITDA Range |
![]() EBITDA walk forward (2010–2013) EBITDA walk forward (2010–2013) Key Drivers Initial benefits from Medicare Performance Initiative Run-rate impact of near-term outpatient acquisitions Return on Health IT investments through incentives Moderate reduction in bad debt expense as a result of economic recovery $1,535 $1,050 ___________________________ 1. Operating Leverage is driven by the combination of assumptions on volumes, pricing and cost drivers. $100mm cushion $100mm upside opportunity (1) 28 2013 EBITDA 2013 EBITDA Margin $1,535 14-15% $1,435 13-14% $1,335 12-13% $65 $35 $150 $80 $40 $80 $25 ($90) 2010 Outpatient Conifer MPI Health IT Medicaid Funding Bad Debt Expense Operating Leverage Affordable Care Act 2013 $1,335 |
![]() EBITDA walk forward (2013–2015) EBITDA walk forward (2013–2015) Key Drivers $1,535 $2,250 Improvement in capacity utilization from new federal law, demographics and other factors drive operating leverage Full impact of Medicare Performance Initiative Additional third party revenues and benefits from utilization of Conifer’s capabilities Affordable Care Act Recovery of Losses Through ‘13 Gains During ’14-’15 29 (1) ___________________________ 1. Operating Leverage is driven by the combination of assumptions on volumes, pricing and cost drivers. $250mm cushion $250mm upside opportunity 2015 EBITDA 2015 EBITDA Margin $2,250 18-19% $2,000 16-18% $1,750 15-16% $50 $100 $5 $190 $90 ($10) $140 $1,750 $1,335 2013 Conifer MPI Health IT Bad Debt Expense Operating Leverage 2015 $1,435 |
![]() 30 Tenet Healthcare: a compelling investment Tenet Healthcare: a compelling investment Positive Industry Trends Strong demographic changes driving growth Growth rate of Americans over 65 will more than double from 2010 to 2012 Recession has suppressed volume growth and increased bad debt expense New federal law expands insurance coverage to 32 million uninsured Americans (2014) Delivering Consistent Performance Superior EBITDA growth and margin expansion Accelerated Adjusted Free Cash Flow De-levered balance sheet Same-hospital admission and EBITDA growth has outpaced peer group Positioned to Outperform Continued strong organic growth in earnings and cash flow Consistent strategy driven by innovative, high margin, capital efficient initiatives Operating integrity, past growth and infrastructure investments reduce future risks |
![]() Appendix A: Selected Q4’10 Disclosures 31 |
![]() 32 Selected Q4’10 Disclosures Selected Q4’10 Disclosures 0.1 99,513 99,645 Uninsured + Charity OP Visits 0.0 8,392 8,394 Uninsured + Charity Admissions (3.1) 628,438 608,890 Patient days 3.2 872,228 900,182 Paying OP Visits 2.9 971,741 999,827 OP Visits (2.2) 121,239 118,583 Paying Admissions 129,631 Q4’09 Q4’10E (1) Change (%) Admissions 126,977 (2.0) ___________________________ 1. Actual Q4’10 results may vary when Q4’10 results are released in February. |
![]() Appendix B: Medicare Performance Initiative 33 |
![]() 34 Medicare Performance Initiative (MPI) Overview What is MPI? MPI is a program with the goal of creating a sustained, standardized approach following nationally recognized best practices to improve clinical outcomes and reduce variable costs This program is built on a unique foundation of information system capabilities and allows us to improve the way we treat disease and perform procedures on Medicare patients Any benefits of the initiative should also have a “halo” effect on other payers This is critical given the direction of health care reform to a more “value based purchasing model” involving the delivery of higher quality at lower pricing near Medicare payment levels MPI encompasses many different initiatives: 1) Physician behavior change 2) Labor management 3) Supply chain initiatives 4) Case management program MPI initiatives are identified, tracked, measured and shared |
![]() 35 1. Physician Behavior Change How are savings achieved through different methods of treating disease and performing procedures? An analysis is performed on 5 MS-DRG groups at each hospital where total costs exceed revenues to identify variable costs that can be reduced Physician champions are enlisted to support the changes in behavior that will reduce the variability of how different physicians treat the same disease Customized prescriptive work plans are developed to reduce the variable costs using local, national, and acceptable best practices for standards of care Repeatable process is hardwired to address more MS-DRGs in the future What’s in it for the physician? High cost/ low quality physicians are already being excluded by health plans in certain markets Hospital and physician incentives will be more aligned, creating greater opportunity for success under health reform based payment models Improving profitability and quality enhances the hospital’s ability to attract the best employees and fund investments in capital equipment and facilities |
![]() 36 Physicians championing behavior change have led to reduced ALOS and variable cost 5% 2% 1% 1% Average Length of Stay 3% 9% Variable Cost per Case (unadjusted for inflation) 5% 7% 4% 6% ___________________________ Note: Data includes first 16 Wave 1 MPI hospitals, and each hospital’s unique base period represents the six months proceeding the formal launch of Wave 1 of MPI. Source: Internal company data. Pre-MPI Post-MPI Pre-MPI Post-MPI 9% 0 2 4 6 8 All Payer - Combined Medicare - Combined All Payer - Procedural Medicare - Procedural All Payer - Medical Medicare - Medical $0 $5,000 $10,000 $15,000 All Payer - Combined Medicare - Combined All Payer - Procedural Medicare - Procedural All Payer - Medical Medicare - Medical |
![]() 37 2. Labor Management Labor Management Specialists are assigned to each Region Each hospital is provided an array of labor productivity tools – Position Control, Staffing Grids, Visionware Labor Management Specialists make site visits to work with hospital teams to improve use of tools and understanding of program New Labor Management Reporting System (LMRS) has been developed Replaces previous bi-weekly labor reports Reflects both paid and productive FTEs and dollars Departmental drill downs available Future enhancements to include more meaningful department-level drill down |
![]() 38 Better labor management has resulted in lower labor expense Paid FTEs per AADC Contract Labor per APD ___________________________ Source: Internal company data. 1. 2010E based on November YTD results plus December forecast. Core hospitals only. Estimate (1) Estimate (1) $41 $44 $37 $20 $16 2006 2007 2008 2009 2010 4.31 4.32 4.26 4.18 4.12 2006 2007 2008 2009 2010 |
![]() 39 CMI-adjusted Supply Cost per Adjusted Patient Day (1) 3. Supply Chain Initiatives 3. Supply Chain Initiatives Numerous supply chain initiatives have been identified and implemented These require significant work with physicians and staff to change behavior, but can result in significant savings Supply chain initiatives that have been most effective include: High cost drugs – medication utilization management Cardiac Rhythm Management (CRM) devices Drug eluting stents Ortho and spine implants High cost supplies – custom procedure tray utilization Purchased services – Food and Nutritional Services and Environmental Services Blood product sourcing and improved utilization ___________________________ 1. Core hospital supply cost only. 2.8% 2.6% 3.5% 3.5% 3.2% 2.4% 1.2% 3.2% 1.6% (0.1%) (1%) 0% 1% 2% 3% 4% 5% Q3 2009 Q4 2009 Q1 2010 Q2 2010 Q3 2010 Percent Change - MedSurg PPI Percent Change - Supply Expense per CMI-Adjusted Patient Day |
![]() Cumulative Cardiac Rhythm Management Contracting Savings: 2009 – 2011 (2) 40 Many supply chain initiatives have controlled or decreased supply expense Many supply chain initiatives have controlled or decreased supply expense Pharmacy Spend Per Adjusted Patient Admission (1) Estimate ___________________________ 1. Source: Internal company data. 2. Source: Internal company data. Savings for 2009 through 2011 on this initiative projected to be in excess of $20 million. Region Impact % California (28.8%) Central (28.3%) Florida (24.7%) Philadelphia (24.1%) Southern States (19.6%) Total (25.2%) $397 $397 $401 $411 2007 2008 2009 2010 |
![]() 41 4. Case Management Program 4. Case Management Program Case Management Specialists are assigned to each Region and perform on-site visits to hospitals Medical Necessity screening is performed using Interqual guidelines prior to, or as soon as possible after, bed placement Clinical rationale for decision is clearly documented Goals of an effective case management program are: Correct use of observation status Ensure length of stay is appropriate Reduce managed care denials Tactics used to reach these goals are: All clinical departments, nursing departments, and the Utilization Management (UM) committee share in ownership Implement multidisciplinary patient care conferences Adequate & effective Physician Advisor coverage with UM knowledge Physician education and support |
![]() 42 Hospitals have direct access to MPI-level variable cost analytics, updated on a monthly basis MPI analytics and reporting now on intranet Best Practices are shared regularly throughout the company It is expected that every hospital management team is implementing those applicable Quick Wins |
![]() 43 MPI Summary MPI is a program that delivers higher quality at lower costs and positions Tenet well for the country’s move to value based purchasing MPI is sustainable: $30mm in savings were captured in 2010 and $50mm in savings are targeted for 2011 and beyond 2011 2012 2013 2014 2015 Run-Rate Savings Incremental Savings $100 $150 $200 $250 $50 $50 $50 $100 $50 $150 $50 $200 $50 ($ millions) |
![]() Appendix C: Tenet Board of Directors 44 |
![]() 45 Tenet’s Board of Directors is aligned with shareholder interests Tenet’s Board of Directors is aligned with shareholder interests Substantial Wealth of Directorship Knowledge Executive Leadership Experience Independent Board of Directors Independent Chairman of the Board Separation of Chairman and CEO roles 9 out of 10 independent board members No two directors can serve on another public company board together (prevents interlocking directorates) Each of the directors has served in a leadership role within a large, complex organization Diversified experience with leaders in public sector, healthcare, accounting and finance, technology and manufacturing 1 former Chairman and CEO of an S&P 500 corporation 2 former CEOs and/or Presidents of a major business unit of S&P 500 corporations 1 former Chairman and CEO of an international public accounting firm 2 former Governors of U.S. States, of which one was a former member of the U.S. Senate and former President of a major university Healthcare: Allscripts, Athersys, CorMatrix Cardiovascular, Eclipsys*, EndoGastric Solutions, IMS Health*, Intuitive Surgical, MAKO Surgical Selected Corporations: Deloitte*, Electronic Data Systems*, GreenPoint Financial*, Hovnanian, Intuit, North Fork Bancorp*, Office Depot, Prudential Financial, Qwest Communications, Unisys*, United Technologies Other: Allina Hospitals and Clinics*, The Cleveland Clinic Foundation* Board members have experience with major corporate actions: Eclipsys*, Electronic Data Systems*, IMS Health*, North Fork Bancorp* * - Indicates prior Directorship affiliation |
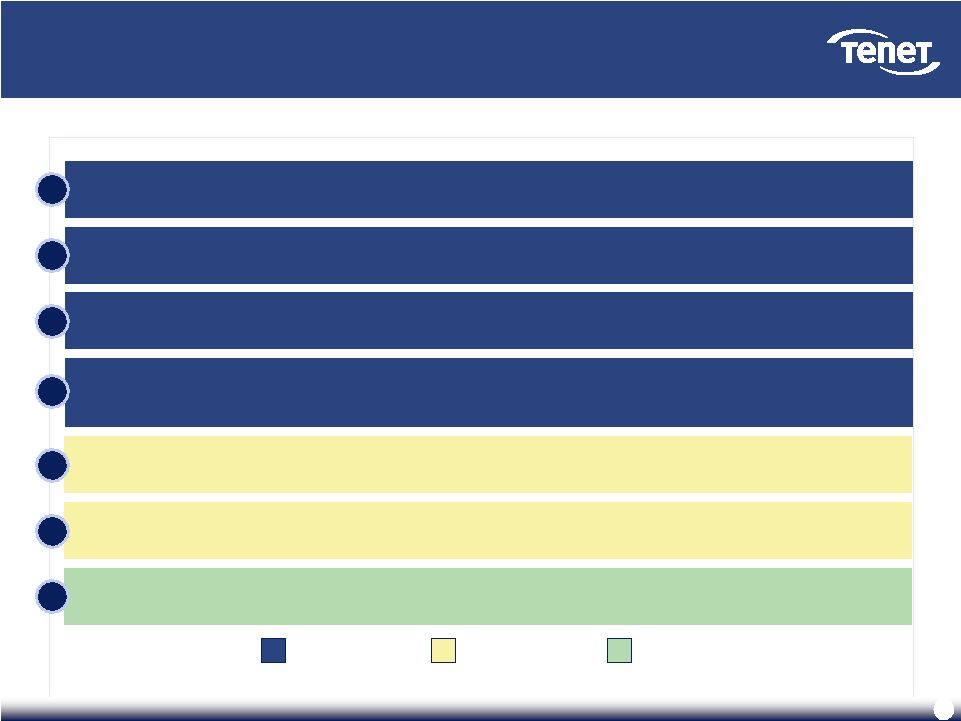
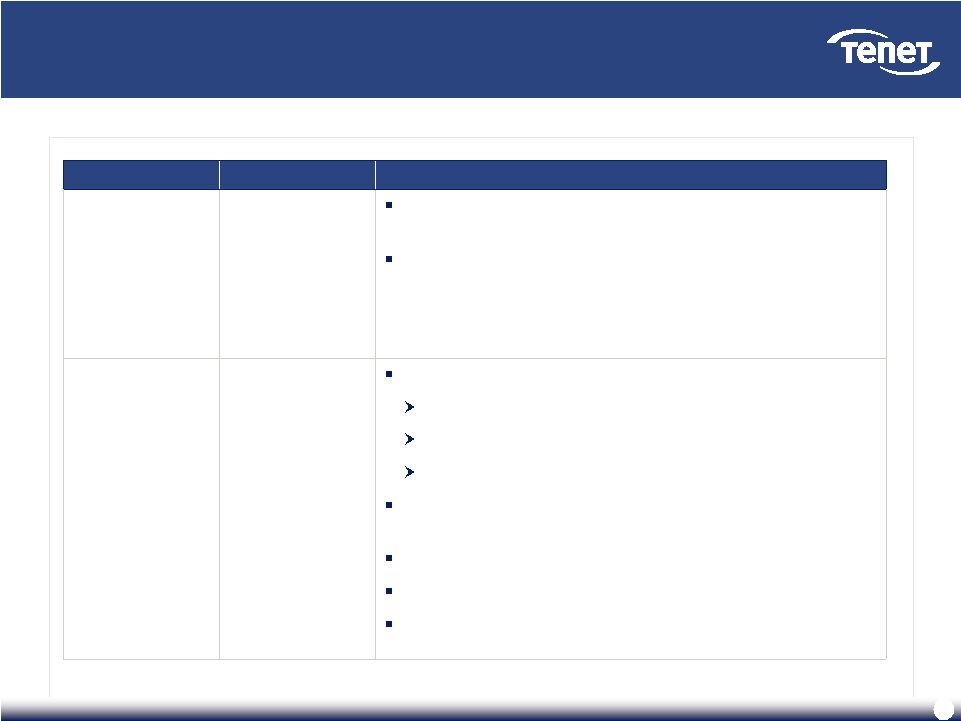
![]() 46 Tenet’s Board of Directors is aligned with shareholder interests (cont’d) Tenet’s Board of Directors is aligned with shareholder interests (cont’d) Government Experience Provider Experience Operating and Financial Expertise Edward A. Kangas, Non-Executive Chairman Global Chairman and CEO, Deloitte Touche (1989-2000) Member of Tenet Board since 2003 Other Directorships: Allscripts Healthcare Solutions, Hovnanian Enterprises, Intuit, United Technologies, Eclipsys*, EDS* Governor Jeb Bush Governor of Florida (1999-2007) Member of Tenet Board since 2007 Other Directorships: Rayonier, Swisher International, Angelica Trevor Fetter, President and CEO (Since 2003) President, Tenet (2002-2003) CEO, Broadlane (2000-2002) CFO, Tenet (1995-1999) Other Directorships: Hartford Financial Services Group Karen Garrison President, Pitney Bowes Business Services (1999-2004) Member of Tenet Board since 2005 Other Directorships: Kaman Corporation, Standard Parking, North Fork Bancorp* Floyd D. Loop, M.D. Chairman and CEO, The Cleveland Clinic Foundation (1989- 2004) Member of Tenet Board since 1999 Other Directorships: Athersys, Intuitive Surgical Ronald A. Rittenmeyer Chairman, President and CEO, Electronic Data Systems Corporation (2005-2008) Member of Tenet Board since 2010 Other Directorships: AIG, Electronic Data Systems*, R.H. Donnelley*, Safety-Kleen Systems*, RailTex* Brenda Gaines President and CEO, Diners Club North America (2002-2004) Member of Tenet Board since 2005 Other Directorships: Fannie Mae, NICOR, Office Depot, CNA Financial Corp* Senator J. Robert Kerrey President, New School University (2001-2010) Former U.S. Senator (1989-2000) Former Governor (1982-1987) Member of Tenet Board since 2001 Other Directorships: Genworth Financial, Jones Apparel Group, Scientific Games Corporation Richard R. Pettingill President and CEO, Allina Hospitals and Clinics (2002-2009) VP and COO, Kaiser Foundation Health Plans and Hospitals (1996-2002) Member of Tenet Board since 2004 Other Directorships: Mako Surgical James A. Unruh Chairman and CEO, Unisys (1990-1997) Member of Tenet Board since 2004 Other Directorships: Prudential Financial, Qwest Communications, CSG Systems International * - Indicates prior Directorship affiliation |
![]() Appendix D: Adjusted EBITDA Reconciliation 47 |
![]() Reconciliation of EBITDA Reconciliation of EBITDA Adjusted EBITDA, a non-GAAP term, is defined by the Company as net income (loss) attributable to Tenet Healthcare Corporation common shareholders before (1) cumulative effect of changes in accounting principle, net of tax, (2) net income attributable to noncontrolling interests, (3) preferred stock dividends, (4) income (loss) from discontinued operations, net of tax, (5) income tax (expense) benefit, (6) investment earnings (loss), (7) gain (loss) from early extinguishment of debt, (8) net gain (loss) on sales of investments, (9) interest expense, (10) litigation and investigation (costs) benefit, net of insurance recoveries, (11) hurricane insurance recoveries, net of costs, (12) impairment of long-lived assets and goodwill and restructuring charges, net of insurance recoveries, and (13) depreciation and amortization. The Company’s Adjusted EBITDA may not be comparable to EBITDA reported by other companies. The Company provides this information as a supplement to GAAP information to assist itself and investors in understanding the impact of various items on its financial statements, some of which are recurring or involve cash payments. The Company uses this information in its analysis of the performance of its business excluding items that it does not consider as relevant in the performance of its hospitals in continuing operations. Adjusted EBITDA is not a measure of liquidity, but is a measure of operating performance that management uses in its business as an alternative to net income (loss) attributable to Tenet Healthcare Corporation common shareholders. Because Adjusted EBITDA excludes many items that are included in our financial statements, it does not provide a complete measure of our operating performance. Accordingly, investors are encouraged to use GAAP measures when evaluating the Company’s financial performance. Future period high range estimates assume excess cash is used to early retire debt. Actual use of cash may vary and therefore interest expense and other elements of earnings may vary significantly. The reconciliation of net income (loss) attributable to Tenet Healthcare Corporation common shareholders, the most comparable GAAP term, to Adjusted EBITDA, is set forth below. 48 |