Exhibit 13.1
2007 REPORT TO SHAREHOLDERS |
| |
Chairman’s Message | 2 |
| |
2007 in Review | 3 |
| |
Officers | 18 |
| |
F&M Office Directory | 19 |
| |
President’s Message | 20 |
| |
2007 Financial Reports | 21 |
FIRST FARMERS AND MERCHANTS CORPORATION
Condensed Statements, December 31, 2007 and December 31, 2006 (In Thousands of Dollars)
| | 2007 | | 2006 | | % change | |
ASSETS | | | | | | | |
Cash and due from banks | | $ | 35,873 | | $ | 74,981 | | -52.2 | % |
United States government securities
(including agencies & mortgaged backed securities) | | 131,859 | | 126,332 | | 4.4 | % |
Municipal and other securities | | 107,617 | | 101,916 | | 5.6 | % |
Loans, less unearned income and allowance for possible loan losses | | 492,762 | | 466,091 | | 5.7 | % |
Bank premises and equipment, at cost less allowance for depreciation and amortization | | 14,306 | | 10,428 | | 37.2 | % |
Other assets | | 40,629 | | 40,336 | | 0.7 | % |
| | | | | | | |
TOTAL ASSETS | | $ | 823,046 | | $ | 820,084 | | 0.4 | % |
| | | | | | | |
LIABILITIES | | | | | | | |
Deposits | | $ | 698,959 | | $ | 698,962 | | 0.0 | % |
Federal funds purchased and securities sold under repurchase agreements | | 2,507 | | 2,654 | | -5.5 | % |
Other liabilities | | 15,336 | | 14,661 | | 4.6 | % |
| | | | | | | |
TOTAL LIABILITIES | | 716,802 | | 716,277 | | 0.1 | % |
| | | | | | | |
SHAREHOLDERS’ EQUITY | | | | | | | |
Common stock | | 56,800 | | 57,600 | | -1.4 | % |
Additional paid in capital | | — | | 1,120 | | -100.0 | % |
Retained Earnings | | 48,916 | | 46,342 | | 5.6 | % |
Accumulated other comprehensive income | | 528 | | (1,255 | ) | -142.1 | % |
| | | | | | | |
TOTAL EQUITY | | 106,244 | | 103,807 | | 2.3 | % |
| | | | | | | |
TOTAL LIABILITIES & SHAREHOLDERS’ EQUITY | | $ | 823,046 | | $ | 820,084 | | 0.4 | % |
FIRST FARMERS AND MERCHANTS CORPORATION
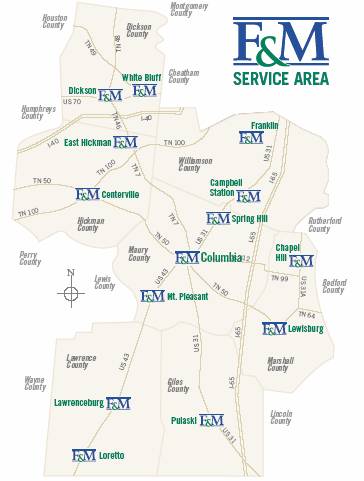
is a bank holding company headquartered in Columbia, Tennessee. Its sole subsidiary is First Farmers & Merchants Bank. F&M operates more than 20 banking locations in Maury, Lawrence, Marshall, Hickman, Dickson, Giles and Williamson counties of Middle Tennessee. The bank stresses traditional, personal banking relationships while incorporating state-of-the-art technology to provide optimum performance. Since the bank’s establishment in 1909, F&M has worked to uphold the motto, “Dedicated to Community Service.”
FOR MORE INFORMATION: FIRST FARMERS AND MERCHANTS CORP., 816 SOUTH GARDEN STREET, COLUMBIA, TN 38401.
(931) 388-3145 | 800-882-8378 | WWW.FANDMBANK.COM | MEMBER FDIC
FIRST FARMERS & MERCHANTS BANK
1
TO OUR
SHAREHOLDERS:

T. Randy Stevens
First Farmers and Merchants Corporation and its shareholders were blessed in 2007. Income rose significantly, and thanks to our continuing, company-wide focus on efficiency, more profits went to the bottom line. The results speak for themselves:
· Total interest income is up 2.95% over the previous year.
· Total noninterest income is up 4.15%.
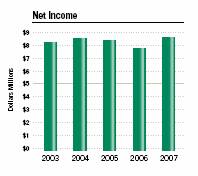
· Net income is up 11.60%.
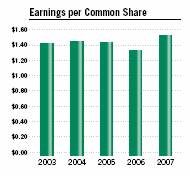
· Basic earnings per share are up 13.53%.
Thanks to an excellent management team, I believe that your bank is well positioned to build on this outstanding performance in the years ahead. Elsewhere in this annual report, you will find a letter from President Tim Pettus that outlines our hopes for the bank and the beliefs that underlie our vision for an even greater First Farmers & Merchants Bank.
Tim and I work with a superior group of banking professionals, including the other members of the executive team: John Tomlinson, who was promoted to Chief Administrative Officer in 2007, and Houston Parks, our Chief Operating Officer. It is because we have great people like John and Houston throughout the bank, at all levels, that we were blessed with such strong results in 2007.
Of course, success is the result of action, and your bank undertook several projects in 2007 that made us an even stronger company. Among these were the formation of a Private Banking Department, led by Harvey Church, and the opening of a new office on Carothers Parkway to serve the dynamic Cool Springs market in Williamson County. Craig Holland, who also joined the bank in 2007, is leading the bank’s expansion into Williamson County, one of the most affluent counties in the nation, where there is a huge demand for quality banking services.
And this just scratches the surface of the many good things happening at your bank. To learn more, I hope you will take a few minutes to read this annual report. By looking back on all we accomplished in 2007, I believe you will understand why we see even greater things ahead. Indeed, you will know why the theme of this report is, “We Believe.”

|
T. Randy Stevens |
Chairman and CEO |
2007 ANNUAL REPORT/WEBELIEVE
2
WE BELIEVE…
INTEGRITY AT
ALL TIMES

|
Brad Barrett, TBA President; Waymon L. Hickman, F&M Senior Chairman; Steve White, TBA Chairman. | |

| |
Brad Barrett, TBA President; Virgil H. Moore, Jr., F&M Senior Chairman; Steve White, TBA Chairman. | |
Honors from Tennessee Bankers Association… The Tennessee Bankers Association named Waymon L. Hickman and Virgil H. Moore, Jr. as Leaders in Banking Excellence. The two F&M Senior Chairmen are part of an elite group representing Tennessee bankers who have excelled not only in the areas of banking, but also in community service and civic involvement.
“Waymon Hickman’s name is synonymous with Maury County banking. It is right that he be commended, not only for his banking abilities, but for his significant contributions to the community and to the state of Tennessee,” said Brad Barrett, TBA President.
“Virgil Moore has contributed to the banking industry both statewide and nationally. His devotion to health care and education is evident through his work in the community.”

|
F&M Board of Directors – standing, from left: Tom Napier Gordon, Attorney and Managing Partner, Gordon Brothers Properties; W. Donald Wright, Pharmacist; William R. Walter, Retired CEO, Maury Regional Healthcare System; Lacy Upchurch, President, Tennessee Farm Bureau; James L. Bailey, Jr., Maury County Mayor; H. Terry Cook, Jr., President, Cook Properties Inc.; Kenneth A. Abercrombie, Retired President, Loretto Casket Company; James E. York, Associate Broker and Principal, Stanfield York Company; Dan C. Wheeler, Director, UT Center for Profitable Agriculture; Dr. David S. Williams, Orthodontist; seated, from left: Dr. Joseph W. Remke, III, Optometrist; Dr. O. Rebecca Hawkins, President, CSCC, Columbia State Community College; T. Randy Stevens, Chairman and CEO, F&M; John P. Tomlinson, III, Chief Administrative Officer, F&M; Darlene Baxter, Vice President, Affiliate Services MRH, Executive Director, Maury Regional Healthcare Foundation; Hulet M. Chaney, CEO Emeritus, Tennessee Farmers Insurance Companies. |
3

| |
Virgil H. Moore, Jr., F&M Senior Chairman, and Nancy Moore at ground-breaking for the Virgil and Nancy Moore Family Chapel in Baptist Hospital. | |
Honors from Tennessee Hospital Association… Mr. Hickman was awarded the 2007 Meritorious Service Award for Governance at the Tennessee Hospital Association’s annual meeting. Mr. Hickman’s service to the Maury Regional Hospital Board of Trustees began in 1984.
Baptist Hospital chapel named for Senior Chairman and his wife… Baptist Hospital in Nashville named its new chapel after Virgil and Nancy Moore. The hospital held a groundbreaking ceremony in May to acknowledge the Moores and officially launch construction.
Business ethics symposium presentation… Mr. Hickman served as a panelist at Martin Methodist College’s inaugural Business Ethics Symposium in February. The event topic was “Ethics in Everyday Management.” 

|
F&M Honorary Board of Directors - standing, from left: O’Neill D. Moore; Tillman W. Knox; Sam D. Kennedy; Waymon L. Hickman; Edwin (Wick) Halliday; Joe E. Lancaster; Harlan D. Bowsher; seated, from left: James S. Putman; Flavius A. Barker; Virgil H. Moore, Jr.; David I. Wise; Dr. Harold S. Pryor. |
4
WE BELIEVE…
CUSTOMER-CENTERED
BUSINESS

F&M’s new Carothers Parkway office.
Saturday banking at Spring Hill office… Beginning in April, F&M’s Spring Hill office began offering new Saturday hours, from 9 a.m. until 1 p.m.
“This is a prime example of how F&M listens to its customers and acts to ensure they receive the highest level of convenience and customer service possible,” said F&M Chairman and CEO T. Randy Stevens.

| |
Executive Team - from left: John P. Tomlinson, III, Chief Administrative Officer; T. Randy Stevens, Chairman and CEO; Timothy E. Pettus, President; N. Houston Parks, Chief Operating Officer. | |
Carothers Parkway office opens in Williamson County… In December, F&M opened a new location on Carothers Parkway in Franklin. R. Craig Holland, F&M Williamson County President, is leading F&M’s expansion into this new market.
“We are excited about opening a new, full-service office in Franklin,” said Mr. Holland. “F&M offers a rich banking heritage backed by a terrific combination of personal service, value and banking convenience. Our customers benefit from a real community banking experience while also enjoying the latest technological advances that make banking convenient.”

| MARY COLVETT Loan Closing Supervisor Loan Processing Dept. | “WE BELIEVE that our customers are the key to our success. We would not be where we are today without them.” |
5

Chairman’s Club at Taos Pueblo, N.M.
The new office, which offers a full line of personal and commercial products and services, will serve as a temporary location until construction of a new financial center on Cool Springs Boulevard is complete. The office is staffed by a team of experienced professionals including Dick Sevier, First Vice President; Lucy Quillin, Mortgage Lender; and Melissa Goodman, Assistant Branch Manager.
Chairman’s Club tours the Southwest… Members of F&M’s Chairman’s Club visited the Southwest region by train in May. Members rode vintage trains through the northern New Mexico countryside and San Juan Region. They experienced a panoramic view of New Mexico while riding the world’s longest tramway, visited historic locations throughout the region and took in the natural wonders of the Southwest.

Dickson County Advisory Board of Directors - from left: Dr. Dan B. Drinnen, Randal J. Cagle, Freddy N. Pendergrass, R. Neill Milam, Cordia W. Harrington, David B. Brogdon, William D. Joyce, Jr., Carroll W. Ford.
6

| MATT PATTERSON
Senior Credit Analyst Credit Administration Dept. | “WE BELIEVE in going the extra mile. By putting forth extra effort, we can reach
our short–term goals, which in turn will produce the desired long–term results.” |

| |
(From left) Emma Shows; Sylvia Owens; Leesa Stevens; Monica Witherspoon; Sheilah Griggs; Suzanne Estes; Martha Puckette; Tiby Ferguson, F&M Vice President and Director of Marketing, at “Ladies Who Launch” luncheon. | |
Customer appreciation luncheons…F&M held customer appreciation luncheons at several offices during the spring.
Luncheon and seminar series for women business leaders and entrepreneurs… F&M hosted a luncheon for women business leaders and entrepreneurs in October. The luncheon, which was attended by more than 50 women, officially introduced a series of “Ladies Who Launch”seminars presented throughout the fall by F&M and featured guest speaker Sheilah Griggs, Nashville leader of Ladies Who Launch.
“Today’s business culture, more than ever before, realizes the value of women as strong and capable leaders,” said Mr. Stevens. “We hope that the luncheon and seminar series encouraged more women to pursue their entrepreneurial goals or positions of greater responsibility in their current careers.” 
WE BELIEVE…
TEAMWORK
FOR EVERYDAY
SUCCESS
F&M University teaches leadership, bank history… In November, 15 employees graduated from F&M University as its first class. An employee education program established in 2007, F&M University is designed to teach participants about the banking
7

| LINDA PEARSON
Vice President East Hickman Office | “WE BELIEVE in aiming for excellence, maintaining integrity and finding courage to change while helping others reach their potential.” |
industry, pass on F&M history, build closer relationships among employees and educate the bank’s future leaders.

F&M University’s first graduating class.
“The first class of F&M University is a very diverse group of employees – some with two years experience, others with 15,” said Timothy E. Pettus, F&M President. “This allows for a well-rounded class where students can learn from each other and grow as bankers.”
The F&M University class met for six months. Sessions were taught by F&M officers and employees on a variety of subjects, including sales, bank operations, trust services, credit administration, banking etiquette, the history of F&M and the future of banking.

Giles County Advisory Board of Directors – from left: Paul Donald Massey; Marcus F. Houston, Giles County Senior Banking Executive; Joseph F. Fowlkes, Jr.; Vicki J. Barnette; W. Preston Murrey, III; Bobby D. Powell; Jim R. Ferrell; Dr. Hugh T. Herrington.
8
In addition to lectures, the F&M University class also completed a final project as a team.

Timothy E. Pettus
Key management team members promoted… F&M named Timothy Pettus President of the bank and its holding company,First Farmers and Merchants Corporation, and John P. Tomlinson, III Chief Administrative Officer.
“Because F&M has long been a leader in our market area, we attract and retain excellent people,” Mr. Stevens said. “Our Executive Leadership Team puts our best and brightest people in the best places to ensure this bank’s continued success.”
Mr. Pettus’ new responsibilities include the promotion of F&M products across the bank’s seven-county franchise.
“This is a very exciting time in F&M’s history,” said Mr.Pettus. “There are unprecedented opportunities thanks to a growing economy and new challenges thanks to increased competition. Both situations are good for our bank because it keeps us passionate about what we do and it keeps us energized and focused on delivering outstanding service.”
Mr. Pettus has 35 years of banking experience. He received a bachelor’s degree from Middle Tennessee State University and is a graduate of the Graduate School of Banking at Louisiana State University.

| |
| |
Management Team - standing, from left: Kim A. Boone, Vice President and Senior Trust Officer; Jason N. Bledsoe, Credit Officer; Leslie R. Brooks, III, Executive Vice President/Commercial Sales Manager; Michael L. Ayer, Senior Relationship Manager/ Commercial Banking; John T. Cotham, Executive Vice President/Human Resources; Paul T. Butts, Jr., First Vice President and Branch Administrator; Brian K. Williams, Chief Credit Officer; Linda L. Hicks, First Vice President and Director of Operations; William F. White, Jr., Williamson County Senior Banking Executive; Patricia P. Bearden, Chief Financial Officer; seated, front left: John P. Tomlinson, III, Chief Administrative Officer; T. Randy Stevens, Chairman and CEO; Timothy E. Pettus, President; N. Houston Parks, Chief Operating Officer. | |

| LARRY LOVE
Vice President & Cheif Appraiser Loan Processing Dept. | “WE BELIEVE honesty, integrity and public trust to be basic concepts inherent to the bank’s philosophy and are demonstrated through its dedication to the community and to the customer.” |
9

| CHRISTY MCBRIDE Financial Analyst Accounting Dept. | “WE BELIEVE that each customer at First Farmers & Merchants Bank is first, foremost and matters.” |
“Teamwork is essential to our success,” said Mr. Tomlinson. “By pooling our talents and insights, F&M has become and remains the leading bank in our market area.”
Mr. Tomlinson has spent his entire 35-year banking career with F&M. He is a graduate of the University of Tennessee, Tennessee Young Bankers School at Vanderbilt University, the Graduate School of Banking and Executive Banking Institute at LSU and Southern Methodist University/Commercial Lending School.

R. Craig Holland
New Williamson County President named… Craig Holland joined F&M as President of Williamson County in 2007. The leader of F&M’s expansion in Williamson County, Mr. Holland has 27 years of banking experience and is a graduate of Western Kentucky University, the Kentucky School of Banking at the University

|
Hickman County Advisory Board of Directors – from left: Louise N. Green, T. Melvin Mays, Malcolm W. Buchanan, Dennis W. Bass, W. Danny Rochelle, Robert L. Haviland, Johnnie Ruth Elrod. |
10
of Kentucky and the Graduate School of Banking at Louisiana State University. He is also a retired major in the United States Army Reserve.
“Craig’s experience, leadership skills and expertise are invaluable,” said Mr. Stevens. “Under Craig’s management, F&M will play an integral role in the commercial and residential growth of Williamson County.”
Other key additions and promotions… Linda Pearson joined F&M as Vice President of the Dickson Business Financial Center and Robert M. “Mickey” Crews, Jr. joined F&M as Vice President in the bank’s Lawrenceburg office. F&M promoted Carol C. Thompson to Vice President in the White Bluff office and William F. White, Jr. to Williamson County Senior Banking Executive.
Also promoted were Richard J. “Rick” Mullen to First Vice President and Trust Officer, Glynis D. Smith to Audit Officer/Security Officer, Robert C. “Bob” Matthews to Controller, Larry D. Brown to Lawrence County Senior Banking Executive, Tiby C. Ferguson to Vice President/Director of Marketing, Nicole Hall to Marketing Coordinator, Sissy Sewell to Operations Officer, April Bobb to Assistant Trust Officer and Judy Musgrave to Banking Officer. 

| |
Markets Team - from left: Marcus F. Houston, Giles County Senior Banking Executive; Larry D. Brown, Lawrence County Senior Banking Executive; Carla F. Hinson, Branch Manager II (Hickman County); R. Craig Holland, Williamson County President; Timothy E. Pettus, President; M. Harvey Church, Maury County Senior Banking Executive/Private Banking; Barry B. White, Marshall County President. Not pictured: C. Glenn Kane, Dickson County Senior Banking Executive. | |

| SANDY WILLIAMS
Loan Processor Loretto Office | “WE BELIEVE in taking care of our customers by providing exceptional customer service.” |
11

| DIANNE GORDON
Main Office Supervisor Main Office | “WE BELIEVE in putting every person that walks in the door of our bank first.” |
WE BELIEVE…
COMMITMENT
TO STRONG
COMMUNITIES

|
Stacey Shedd, F&M Vice President and Private Banker, presents gas cards to Dan Garland, coach of the Babe Ruth team. | |
F&M Supports Lawrenceburg Babe Ruth team…F&M donated 15 gasoline cards totaling $375 to the Lawrenceburg Babe Ruth 14-year-old all-star baseball team to help cover transportation expenses for the 2007 Babe Ruth 14-Year-Old Southeast Regional Tournament.

|
Lawrence County Advisory Board of Directors – back row, from left: Stan Threet; Ben Boston; David Weathers; Jonathan M. Edwards; D. Blake Lay; front row, from left: Timothy E. Pettus, F&M President; Larry D. Brown, F&M Lawrence County Senior Banking Executive; Sheila H. Frisbie; Jim White; Ronnie J. McMasters. |
12
F&M plays integral role in Columbia State capital campaign… The Columbia State Community College Foundation reached its goal of $5 million for its Nurturing for Growth gifts campaign thanks to generous contributions by members of the community, including F&M, which pledged $50,000 to be paid over five years.
In addition to a monetary donation, F&M provided campaign leadership. Mr. Hickman served as a co-chair of the campaign, Mr. Pettus led the Lawrence County campaign and Barry B. White, F&M Marshall County President, led the Marshall County campaign.
Williamson President wins Impact Award… Mr. Holland received a 2007 Williamson County Impact Award in the category of “Community Supporter” for his service on the United Way of Williamson County Board of Directors. Mr. Holland currently serves as campaign chairman and board chair elect for 2008. The award recipients were selected and featured by the Nashville Business Journal.
Bank Director and Senior Executive join hospital board… The Maury Regional Hospital Board of Trustees appointed O. Rebecca Hawkins, Columbia State Community College President and member of the F&M Board of Directors, and M. Harvey Church, F&M Maury County Senior Banking Executive/Private Banking, to its advisory board.

| |
La Societe des 40 Hommes et 8 Chevaux, a fraternal organization, presents a $60,000 donation to the CSCC Nurturing for Growth campaign. Pictured: (from left) Robert McAdams; George Jones; Elaine Kelsey, Executive Director of the CSCC Foundation; Joe Foster; Waymon L. Hickman, Nurturing for Growth Co-chair. | |

| LYNN ROSS Administrative Assistant Credit Administration Dept. | “WE BELIEVE in the leadership and their commitment to be the number one community bank in Middle Tennessee. |
13
F&M’s donations in 2007 to non-profit organizations included…
· $2,500 to the Martin Methodist College Fund in memory of longtime Giles County civic leader Henry Sims. Mr. Sims was a member of the F&M Board of Directors from 2002 until 2006.
· $2,500 to CASA of Maury County, a local chapter of the National Court Appointed Special Advocate (CASA) Association. CASA of Maury County supports and promotes court-appointed volunteer advocacy for abused and neglected children.
· $2,000 to God’s Storehouse, a charitable organization providing free food, clothing and medicine and helping pay rent and utility bills for those in need in Lawrence County.
· $2,000 to Kid’s Place: a Child’s Advocacy Center, which provides advocacy services and therapy to child victims of sexual and severe physical abuse in Lawrence, Giles, Maury and Wayne counties.
· $1,000 to the Horace O. Porter Scholarship Association, which provides college scholarships to Maury County high school graduates.
· $1,000 to Women Are Safe, which works to end domestic violence and aid victims of the crime.
· $8,000 to Swing for Kids celebrity golf tournament. Organized by David Weathers, F&M Lawrence County Advisory Board member, the event’s proceeds benefited children in Lawrence County.

| |
T. Randy Stevens, F&M Chairman and Joseph E. Reeves, Jr., F&M First Vice President, present F&M’s Swing for Kids donation to David Weathers, event organizer and F&M Lawrence County Advisory Board Member. | |

Marshall County Advisory Board of Directors - standing, from left: Nanette P. Todd; Herbert R. Bivens; Terry W. Jackson; Wista M. Crawford; seated from left: Robert M. Beech; Barry B. White, F&M Marshall County President; Elizabeth T. McDow.
14

| KATHY RICHARDSON Deposit Compliance Specialist Compliance Dept. | “WE BELIEVE in providing high quality services and products that meet the financial needs of our customers, because F&M customers really are the bank.” |
F&M participates in community activities… F&M retained its role as presenting sponsor of the 5th Annual First Farmers & Merchants Train Stop Storytelling Festival. Held in May, more than 3,000 people attended the event, which encourages lifelong reading and the preservation of storytelling.
F&M participated in the 2007 Mule Day Parade, in Columbia. Mr. Pettus led the way as his son, Jed Pettus, drove a tractor down the parade route pulling an F&M wagon. Employees riding in the wagon and walking along side the wagon greeted parade spectators. 

| |
Trust & Financial Management Department - from left: April Bobb, Assistant Trust Officer; Stephen K. Hughes, Assistant Vice President and Trust Officer; Kim A. Boone, Vice President and Senior Trust Officer; William L. Massey, Vice President and Trust Investment Officer; Amy B. Vaught, Assistant Vice President and Trust Officer; Rick J. Mullen, First Vice President and Trust Officer; Roseann G. Williams, Vice President and Trust Officer. | |
WE BELIEVE…
EXCELLENCE THROUGH
INNOVATION

M. Harvey Church
Private Banking Department established… The department’s mission is to provide exceptional and unique access to all of the bank’s resources in order to generate, sustain and administer wealth for clients. Private Bankers are charged with developing an exclusive strategy for clients to meet their financial goals and objectives.
The new department is led by Harvey Church, who has 20 years of local banking experience. Mr. Church earned a bachelor’s degree from
15
Union University and is a graduate of Darden School of Business at the University of Virginia and the Owen Graduate School of Management at Vanderbilt University.
“This new line of business utilizes the many strengths of F&M,” said Mr. Church. “F&M Private Banking coordinates a variety of product offerings, such as trust, lending and financial management, all under one roof.”

Stacey Shedd
Joining Church is Stacey Shedd, who provides services from the Locust Avenue office in Lawrenceburg. Mr. Shedd has more than 10 years banking experience and earned degrees at Columbia State Community College, Middle Tennessee State University and the University of North Alabama.
Chief Administrative Officer Receives Bank Innovation Award… F&M recognized Mr. Tomlinson as being responsible for significant advances in the bank’s delivery of financial services to customers. As the award winner, Mr. Tomlinson selected the Maury County Library as the recipient of $1,000 to help promote its

Maury County Advisory Board of Directors – from left: M. Harvey Church, F&M Maury County Senior Banking Executive/Private Banking; Dr. Bill Thrasher; Dr. A. Lee Hunter; Emily McKnight; Jimmy Langsdon; H. Thomas Lucas; Russ Parks.
16

| JANICE ERWIN
Teller Martin House Office | “WE BELIEVE everybody is somebody and by listening and offering quality service we can form relationships that last a lifetime.” |
NetLibrary service. NetLibrary allows residents to download audiobooks, PDF versions of books and music from their home computers.

| |
John P. Tomlinson, III, F&M Chief Administrative Officer, presents F&M’s donation to the Maury County Library. Also pictured: Elizabeth Potts, Director of the Maury County Library; Adam Southern, Reference Librarian; T. Randy Stevens, F&M Chairman and CEO. | |
Daily Herald readers elect F&M… Readers of The Daily Herald once again selected F&M as having the best bank service in Maury County.
Advisory Board Member named Manufacturing Executive of the Year… Nashville Business Journal named Cordia Harrington, Founder and Chief Manager of The Bun Companies and a member of F&M’s Dickson County Advisory Board, Manufacturing Executive of the Year.

| |
Cordia Harrington, Nashville Business Journal Manufacturing Executive of the Year. | |
“Cordia exemplifies the determination, hard work and business acumen that is at the foundation of Dickson’s current success as a business and industrial center,” said Mr. Stevens. “She is a valuable member of our Dickson County Advisory Board.”
F&M employees pursue professional development… Mr. Church completed his first year at the Graduate School of Banking at Louisiana State University. Larissa H. Thomas, Retail Processing Supervisor, and Aftan G. Faulkner, Personal Banker, graduated from the Southeastern School of Consumer Credit conducted by the Tennessee Bankers Association. F&M Chief Operating Officer N. Houston Parks was awarded a professional master of banking degree from the Executive Banking Institute in Scottsdale, Ariz. Gail Tindall, F&M Chief Compliance Officer, earned a Certified Regulatory Compliance Manager certification. Only 30 people in Tennessee hold this title.
17
2007
OFFICERS
Virgil H. Moore, Jr., Senior Chairman of the Board
Waymon L. Hickman, Senior Chairman of the Board
T. Randy Stevens, Chairman of the Board and Chief Executive Officer
Timothy E. Pettus, President
N. Houston Parks, Chief Operating Officer
John P. Tomlinson, III, Chief Administrative Officer
Patricia P. Bearden, Chief Financial Officer
Brian K. Williams, Chief Credit Officer
Leslie R. Brooks, III, Executive Vice President / Commercial Sales Manager
John T. Cotham, Executive Vice President / Human Resources
Larry D. Brown, Lawrence County Senior Banking Executive
Shela D. Chessor, Hickman County Senior Banking Executive
M. Harvey Church, Maury County Senior Banking Executive / Private Banking
R. Craig Holland, Williamson County President
Marcus F. Houston, Giles County Senior Banking Executive
C. Glenn Kane, Dickson County Senior Banking Executive
Barry B. White, Marshall County President
William F. White, Jr., Williamson County Senior Banking Executive
Martha M. McKennon, Vice President and Executive Assistant
Michael L. Ayer, Senior Relationship Manager / Commercial Banking
Norma L. Aldridge, First Vice President
Jason N. Bledsoe, Credit Officer
Paul T. Butts, Jr., First Vice President and Branch Administrator
David M. Edwards, First Vice President
Linda L. Hicks, First Vice President and Director of Operations
Richard J. Mullen, First Vice President and Trust Officer
Joseph E. Reeves, Jr., First Vice President
Richard S. Sevier, First Vice President
Kim A. Boone, Vice President and Senior Trust Officer
Gail E. Tindall, Chief Compliance Officer
Richard R. Benson, Vice President
April Bobb, Assistant Trust Officer
W. Gail Cathey, Vice President
Joanna L. Chandler, Bank Manager
Robert M. Crews, Jr., Vice President
Kathleen A. Crick, Training Officer
Suzanne A. Estes, Commercial Banking Officer
Tiby C. Ferguson, Vice President / Director of Marketing
Donna C. Gandee, Vice President
Miriam T. Green, Administrative Assistant
Billy R. Harvel, Vice President
Judy M. Hickman, Assistant Branch Administrator
Stephen K. Hughes, Assistant Vice President and Trust Officer
S. Evelyn Leonard, Internal Controls Officer
R. Larry Love, Vice President and Chief Appraiser
William L. Massey, Jr., Vice President and Trust Investment Officer
Robert C. Matthews, Controller
Marie E. McGrew, Assistant Internal Controls Officer
Carol D. Messer, Branch Manager / Retail Lending
Judy M. Musgrave, Banking Officer
Linda Pearson, Vice President
Lana C. Preston, Vice President / Mortgage Underwriter
Brenda S. Risner, Assistant Vice President
Sissy Sewell, Operations Officer
Stacey C. Shedd, Vice President
Anita G. Simmons, Loan Insurance Officer
Terry D. Skillington, Assistant Vice President
Glynis D. Smith, Audit Officer / Security Officer
Carol C. Thompson, Vice President
Amy B. Vaught, Assistant Vice President and Trust Officer
Teresa L. Walker, Bank Manager
Pamela D. White, Accounting Officer
Roseann G. Williams, Vice President and Trust Officer
Julia R. Wolaver, Vice President and Office Manager
McCoy C. Zachry, Credit Officer and Manager of Special Assets

| DENIECE McCROSKEY CRS/Loan Processor Locust Avenue Office | “WE BELIEVE in building relationships that will last a lifetime.” |
18
OFFICE
DIRECTORY
Columbia |
Main Office (ATM) |
816 South Garden Street |
P.O. Box 1148 |
Columbia, TN 38402-1148 |
(931) 388-3145 |
FAX (931) 380-8359 |
Toll Free 800-882-8378 |
|
Operations Center |
201 West Eighth Street |
Columbia, TN 38401 |
(931) 388-3145 |
FAX (931) 380-8362 |
|
Campbell Plaza Off. (Kroger) (ATM) |
1202 South James Campbell Blvd. |
Columbia, TN 38401 |
(931) 380-8278 |
FAX (931) 380-8351 |
|
Hatcher Lane Office (ATM) |
1501 South James Campbell Blvd. |
Columbia, TN 38401 |
(931) 380-8260 |
FAX (931) 380-8353 |
|
High Street Drive-Through |
515 North High Street |
Columbia, TN 38401 |
(931) 380-8291 |
FAX (931) 380-8355 |
|
Northside Bank Ct. (Kroger) (ATM) |
845 Nashville Highway |
Columbia, TN 38401 |
(931) 380-8280 |
FAX (931) 380-8366 |
Drive-Through (ATM) |
857 Nashville Highway |
(931) 380-8340 |
FAX (931) 380-8363 |
|
Centerville (ATM) |
116 Church Street |
Centerville, TN 37033 |
(931) 729-3522 |
FAX (931) 729-3152 |
|
Chapel Hill (ATM) |
214 Horton Parkway North |
Chapel Hill, TN 37034 |
(931) 364-2062 |
FAX (931) 364-2082 |
Dickson |
Business Financial Center |
A branch of F&M Bank |
106 Highway 70 East, Unit #3 |
Dickson, TN 37055 |
(615) 446-6302 |
FAX (615) 446-6309 |
|
East Hickman (ATM) |
9512 Highway 46 |
Bon Aqua, TN 37025 |
(931) 670-0090 |
FAX (931) 670-3556 |
|
Franklin (ATM) |
Cool Springs Office |
9040 Carothers Parkway |
Franklin, TN 37067 |
(615) 771-6484 |
FAX (615) 771-5059 |
|
Lawrenceburg |
Locust Avenue Office (ATM) |
1501 North Locust Avenue |
Lawrenceburg, TN 38464 |
(931) 762-6490 |
FAX (931) 762-1654 |
|
Crockett Office (ATM) |
116 West Gaines Street |
Lawrenceburg, TN 38464 |
(931) 766-5650 |
FAX (931) 766-5655 |
|
Lewisburg (ATM) |
260 North Ellington |
Lewisburg, TN 37091 |
(931) 359-6222 |
FAX (931) 359-9872 |
|
Loretto (ATM) |
201 Highway 43 South |
Loretto, TN 38469 |
(931) 853-4358 |
FAX (931) 853-4029 |
|
Mt. Pleasant (ATM) |
128 North Main Street |
Mt. Pleasant, TN 38474 |
(931) 379-3292 |
FAX (931) 379-0502 |
Pulaski (ATM) |
Martin House Office |
302 South Second Street |
Pulaski, TN 38478 |
(931) 363-3830 |
FAX (931) 363-3065 |
|
Spring Hill |
Spring Hill Office (ATM) |
5398 Main Street |
Spring Hill, TN 37174 |
(931) 486-2212 |
FAX (931) 486-1033 |
Toll Free 866-727-4455 |
|
Campbell Station Office |
2035 Wall Street |
Spring Hill, TN 37174 |
(615) 302-4940 |
FAX (615) 302-4944 |
Toll Free 866-212-3499 |
|
White Bluff (ATM) |
2011 Highway 47 North |
White Bluff, TN 37187 |
(615) 797-3153 |
FAX (615) 797-4621 |
Additional ATM’s are located at: |
Maury Regional Hospital, Columbia* |
Columbia State Community College* |
Columbia Quik Mart, 1120 Hampshire Pike* |
Lawrenceburg Quik Mart, 710 East Gaines Street* |
Lawrenceburg Super Stop, 1904 West Gaines Street* |
Lewisburg On the Run Market, 1550 Franklin Pike* |
Marshall Plaza, Lewisburg |
955 Higgs Road, Lewisburg |
121 Second Avenue South, Lewisburg |
1700 West College Street, Pulaski |
Saturn Plant, Spring Hill |
Tennessee Farm Bureau Offices, Columbia |
|
|
*Cash dispenser only |
19
“WE BELIEVE”

Timothy E. Pettus
As I write these comments, I am beginning my second year as President of your bank. Words cannot describe the honor, humility and challenge I feel in this role. I certainly thank you, the shareholders, for this wonderful opportunity in my life.
2007 was a great year for our bank in many ways. While we are delighted by the earnings, we are by no means satisfied. The improved earnings were a direct result of the continued support of our customers and the hard work, positive attitudes and expertise of our bank family, coupled with new, improved methods of operation.
You’ll notice that the theme of our 2007 annual report is, “We Believe.” Believing in oneself is a building block of success. Senior management challenged the bank’s employees in 2007 to reach goals and levels of performance that may once have seemed out of reach. Yet, almost every area of bank performance was much improved, thanks to employees believing in themselves and those around them.
In 2008, this is what “We Believe” regarding this year and beyond:
“We Believe” there is still a need for banks that practice community service, rather than just talking about it.
“We Believe” in investing in and maintaining our great staff and encouraging both new employees and veterans to continue to learn and to create new opportunities within our bank.
“We Believe” that F&M must move forward and improve each year. In banking there is no standing still. New markets, new ideas and new products present great opportunities for your bank, and we intend to take full advantage of them, thanks to an innovative staff and supportive shareholders.
“We Believe” that F&M offers the last best chance to do banking right. We are blessed with nearly a century of tradition and success and have a clear picture of where we are headed in this new century.
Finally, “We Believe” that F&M has the momentum, the shareholder value and the staff to ensure and continue its position as one of the largest and best managed independent community banks in Tennessee.
Again, thank you for letting me be a part of this great banking family.

Tim E. Pettus
President
20
COMPARATIVE PERFORMANCE
Set forth below is a graph comparing the yearly change in the cumulative total shareholder return on the common stock of First Famers and Merchants Corporation (FF&M in the graph) against the cumulative total return of the S&P 500 Index *** and the S&P major Regional Bank Index ** for the period of five years commencing December 31, 2002 and ending December 31, 2007.
VALUE OF $100 INVESTED ON DECEMBER 31, 2002
| | 2002 | | 2003 | | 2004 | | 2005 | | 2006 | | 2007 | |
FF&M* | | $ | 100.00 | | $ | 108.15 | | $ | 123.27 | | $ | 133.22 | | $ | 140.62 | | $ | 142.58 | |
S&P MAJOR REGIONAL BANK** | | $ | 100.00 | | $ | 135.51 | | $ | 153.12 | | $ | 154.89 | | $ | 178.27 | | $ | 138.18 | |
S&P 500 INDEX*** | | $ | 100.00 | | $ | 128.68 | | $ | 142.64 | | $ | 149.72 | | $ | 173.43 | | $ | 182.90 | |
* | Assumes that the value of the investment in FF&M was $100 on December 31, 2002, with all dividends reinvested. |
** | Assumes that the value of the investment in the index was $100 on December 31, 2002, with all dividends reinvested. |
*** | Assumes that the value of the investment in the index was $100 on December 31, 2002, with all dividends reinvested. |
21
MANAGEMENT’S DISCUSSION AND ANALYSIS OF FINANCIAL CONDITION AND
RESULTS OF OPERATIONS
FORWARD-LOOKING STATEMENTS
Certain statements contained in this report may not be based on historical facts and are “forward-looking statements” within the meaning of Section 27A of the Securities Act of 1933, as amended, and Section 21E of the Securities Exchange Act of 1934, as amended. These forward-looking statements may be identified by, among other things, the use of forward-looking terminology such as “believes,” “expects,” “forecasts,” “hopes,” “may,” “plans,” “will,” or “anticipates,” or the negatives of such terms. We caution you not to place undue reliance on such forward-looking statements in this report because results could differ materially from those anticipated as a result of a variety of factors. These forward-looking statements include, without limitation, those relating to the quality of service provided to customers, the economic conditions for loan growth, the effect of fluctuating interest rates on net interest income, changes in the balance sheet mix, the stability of market rates during 2008, capital expenditures, cash dividends, net recoveries, the adequacy of allowance for loans losses, the loan concentration, future realized assets, and expected maturity of investment securities . Factors that could affect our results include, but are not limited to, changes in economic conditions; fluctuations in prevailing interest rates and the effectiveness of our risk monitoring systems; our ability to maintain credit quality; our ability to provide market competitive products and services; laws and regulations affecting financial institutions in general; our ability to operate and integrate new technology; the effectiveness of our interest rate hedging strategies; government fiscal and monetary policies; changes in our operating or expansion strategy; changes in our assumptions or estimation methodologies; the availability of and costs associated with maintaining and/or obtaining adequate and timely sources of liquidity; limitations on our ability to pay dividends and to meet our cash obligations; assumption and judgments about the collectability of our loan portfolio; our ability to compete with other financial services companies and other factors generally understood to affect the financial results of financial services companies.
22
EXECUTIVE OVERVIEW
General
First Farmers and Merchants Corporation (the “Corporation”) was incorporated on March 31, 1982 as a Tennessee corporation. As of December 31, 2007, the only direct subsidiary of the Corporation was First Farmers and Merchants Bank (the “Bank”), which conducts the principal business of the consolidated company. The Bank was organized in 1954 as a successor to a state bank that was organized in 1909. Previously, the Bank was a national bank and on July 5, 2005, the Bank returned to being a state-chartered bank and its name changed from First Farmers and Merchants National Bank to First Farmers and Merchants Bank. The principal executive offices of the Corporation are located at 816 South Garden Street, Columbia, Maury County, Tennessee. Management of the Corporation evaluates the financial condition of the Corporation in terms of the Bank’s operations within its service area.
All dollar amounts in this report, other than per-share amounts, are in thousands unless otherwise noted.
Financial Condition
The Corporation’s assets consist primarily of its investment in the Bank and other smaller investments. Its primary activities are conducted through the Bank. The Bank is committed to providing quality services in diverse markets and a changing interest rate environment. Management hopes to provide Bank customers the quality service of a community bank and the safety and strength of a regional bank.
At December 31, 2007, the Corporation’s consolidated total assets were $823,046, its consolidated net loans were $492,762, its total deposits were $698,959 and its total shareholders’ equity was $106,244. The economic climate in the Corporation’s market area of Middle Tennessee showed stable conditions in 2007. This economic stabilization can be seen in the increase in loan volume and total deposits— net loans were up 5.7% at December 31, 2007 compared to December 31, 2006. Total deposits remained stable and total shareholders’ equity was up 2.4%. Retained earnings, capital stock and additional paid-in capital were up 0.6%.
Results of Operations
Consolidated net income in 2007 was up 11.6% compared to 2006. Net interest income was down 3.5% over the same periods. Net income was $8,621 for 2007 compared to $7,725 for 2006 and $8,452 for 2005. On a per common share basis, net income was $1.51 for 2007 versus $1.33 for 2006 and $1.45 for 2005.
The accompanying tables and the discussion and financial information are presented to aid in understanding the Corporation’s financial position and results of operations. The emphasis of this discussion is on the years 2007, 2006 and 2005; however, financial information for prior years will also be presented where appropriate. This discussion should be read in conjunction with the Consolidated Financial Statements and the Notes To Consolidated Financial Statements included elsewhere in this report.
The Corporation’s financial condition depends on the quality and nature of its assets, its liability and capital structure, the market and economic conditions and the quality of its personnel.
23
Net Interest Margin
Net interest margin is defined as the difference between the revenue from earning assets, primarily interest income, and interest expense related to interest-bearing liabilities. The maintenance of the net interest margin at a level that, when coupled with noninterest revenues, exceeds additions to the allowance for loan losses, noninterest expenses and income taxes, and yields an acceptable profit is critical for success in the banking industry. Net interest margin is a function of the average balances of earning assets and interest-bearing liabilities and the yields earned and rates paid on those balances.
Operations are planned to maintain a satisfactory spread between the yields on earning assets and the related cost of interest-bearing funds. The gross interest spread is determined by comparing the taxable equivalent gross interest margin to average earning assets before deducting the allowance for loan losses. This ratio reflects the overall profitability of earning assets, including both those funded by interest-bearing sources and those that do not generate interest (primarily noninterest-bearing demand deposits). This ratio is most often used when analyzing a banking institution’s overall gross margin profitability compared to that of other financial institutions. Management uses calculations and similar ratios to assist in pricing decisions for interest-related products. Table A presents the average daily balances, the components of the gross interest margin (on a taxable equivalent basis), the yield or rate, and the incremental and gross interest spread for each of the last three years by major categories of assets and liabilities.
Table A - - Distribution of Assets, Liabilities, Shareholders’ Equity, Interest Rates and Interest Differential
| | YEAR ENDED DECEMBER 31, | |
| | 2007 | | 2006 | | 2005 | |
| | Average | | Rate/ | | | | Average | | Rate/ | | | | Average | | Rate/ | | | |
| | Balance | | Yield | | Interest | | Balance | | Yield | | Interest | | Balance | | Yield | | Interest | |
| | (Dollars In Thousands) | |
ASSETS | | | | | | | | | | | | | | | | | | | |
Interest-earning assets | | | | | | | | | | | | | | | | | | | |
Loans, net | | $ | 484,308 | | 6.76 | % | $ | 32,759 | | $ | 467,545 | | 6.80 | % | $ | 31,771 | | $ | 440,781 | | 6.27 | % | $ | 27,626 | |
Bank deposits | | 1,805 | | 3.49 | | 63 | | 138 | | 3.62 | | 5 | | 48 | | 2.08 | | 1 | |
Taxable securities | | 127,967 | | 4.27 | | 5,459 | | 165,736 | | 3.99 | | 6,605 | | 224,688 | | 3.85 | | 8,651 | |
Tax-exempt securities | | 93,380 | | 7.39 | | 6,902 | | 96,281 | | 7.49 | | 7,211 | | 72,810 | | 6.59 | | 4,799 | |
Federal funds sold | | 18,568 | | 5.06 | | 940 | | 8,798 | | 5.00 | | 440 | | 7,185 | | 3.07 | | 221 | |
TOTAL EARNING ASSETS | | 726,028 | | 6.35 | | $ | 46,123 | | 738,498 | | 6.23 | | $ | 46,032 | | 745,512 | | 5.54 | | $ | 41,298 | |
Noninterest earning assets | | | | | | | | | | | | | | | | | | | |
Cash and due from banks | | 19,827 | | | | | | 22,638 | | | | | | 25,108 | | | | | |
Bank premises and equipment | | 11,849 | | | | | | 11,544 | | | | | | 12,264 | | | | | |
Other assets | | 39,535 | | | | | | 34,793 | | | | | | 36,681 | | | | | |
TOTAL ASSETS | | $ | 797,239 | | | | | | $ | 807,473 | | | | | | $ | 819,565 | | | | | |
LIABILITIES AND SHAREHOLDERS’ EQUITY | | | | | | | | | | | | | | | | | | | |
Interest-bearing liabilites | | | | | | | | | | | | | | | | | | | |
Time and savings deposits: | | | | | | | | | | | | | | | | | | | |
NOW and money market accounts | | $ | 197,168 | | 1.09 | % | $ | 2,143 | | $ | 209,814 | | 0.88 | % | $ | 1,848 | | $ | 235,524 | | 0.66 | % | $ | 1,551 | |
Savings | | 83,916 | | 1.06 | | 893 | | 93,854 | | 0.99 | | 933 | | 107,597 | | 0.95 | | 1,027 | |
Time | | 184,272 | | 4.65 | | 8,567 | | 166,868 | | 3.91 | | 6,519 | | 161,929 | | 2.80 | | 4,533 | |
Time over $100 | | 87,055 | | 4.90 | | 4,267 | | 92,521 | | 4.37 | | 4,039 | | 79,012 | | 3.32 | | 2,626 | |
TOTAL INTEREST BEARING DEPOSITS | | 552,411 | | 2.87 | | 15,870 | | 563,057 | | 2.37 | | 13,339 | | 584,062 | | 1.67 | | 9,737 | |
Federal funds purchased and securities sold under agreements to repurchase | | 3,264 | | 4.35 | | 142 | | 8,753 | | 4.99 | | 437 | | 5,403 | | 2.81 | | 152 | |
Other liabilities | | 230 | | 4.78 | | 11 | | 257 | | 4.67 | | 12 | | 322 | | 2.80 | | 9 | |
TOTAL INTEREST-BEARING LIABILITIES | | 555,905 | | 2.88 | | $ | 16,023 | | 572,067 | | 2.41 | | $ | 13,788 | | 589,787 | | 1.68 | | $ | 9,898 | |
Noninterest-bearing liabilities | | | | | | | | | | | | | | | | | | | |
Demand deposits | | 121,318 | | | | | | 117,242 | | | | | | 115,183 | | | | | |
Other liabilities | | 13,892 | | | | | | 12,831 | | | | | | 11,637 | | | | | |
TOTAL LIABILITIES | | 691,115 | | | | | | 702,140 | | | | | | 716,607 | | | | | |
Shareholders’ equity | | 106,124 | | | | | | 105,333 | | | | | | 102,958 | | | | | |
TOTAL LIABILITIES AND SHAREHOLDERS’ EQUITY | | $ | 797,239 | | | | | | $ | 807,473 | | | | | | $ | 819,565 | | | | | |
Spread between combined rate earned and combined rates paid* | | | | 3.47 | % | | | | | 3.82 | % | | | | | 3.86 | % | | |
Net yield on interest-earning assets* | | | | 4.15 | % | | | | | 4.37 | % | | | | | 4.21 | % | | |
24
| * Taxable equivalent basis |
| Notes: | |
| 1. | U.S. government, government agency and corporate debt securities plus equity securities in the available-for-sale and held-to-maturity categories are taxable securities. Most municipal debt securities are nontaxable and classified as held-to-maturity. | |
| | |
| 2. | The taxable equivalent adjustment has been computed based on a 34% federal income tax rate and has given effect to the disallowance of interest expense, for federal income tax purposes, related to certain tax-free assets. Loans include nonaccrual loans for all years presented. | |
| 3. | The average balances of the amortized cost of available-for-sale securities were used in the calculations in this table. | |
25
Table B sets forth, for the periods indicated, a summary of consolidated changes in interest earned and interest paid, reflected by the interest generated by volume changes and the interest generated by changes in the yield or rate. On a tax equivalent basis, net interest income decreased $2,144 for the year ending December 31, 2007, as financial products repriced in the fluctuating rate environment. Interest paid on interest-bearing deposits was up primarily because of the higher average interest rates.
TABLE B - Volume and Yield/Rate Variances
(Taxable Equivalent Basis - In Thousands)
| | 2007 Compared to 2006 | | 2006 Compared to 2005 |
| | | | | | Net | | | | | | Net | |
| | | | Yield | | Increase | | | | Yield | | Increase | |
| | Volume | | /Rate | | (Decrease) | | Volume | | /Rate | | (Decrease) | |
Revenue earned on | | | | | | | | | | | | | |
Loans, net | | $ | 1,140 | | $ | (152 | ) | $ | 988 | | $ | 1,678 | | $ | 2,467 | | $ | 4,145 | |
Bank deposits | | 60 | | (2 | ) | 58 | | 2 | | 2 | | 4 | |
Investment securities | | | | | | | | | | | | | |
Taxable securities | | (1,507 | ) | 361 | | (1,146 | ) | (2,270 | ) | 224 | | (2,046 | ) |
Tax-free securities | | (217 | ) | (92 | ) | (309 | ) | 1,547 | | 865 | | 2,412 | |
Federal funds Sold | | 489 | | 11 | | 500 | | 50 | | 169 | | 219 | |
Total interest earning assets | | (35 | ) | 126 | | 91 | | 1,007 | | 3,727 | | 4,734 | |
Interest paid on | | | | | | | | | | | | | |
NOW and money market accounts | | (111 | ) | 406 | | 295 | | (170 | ) | 467 | | 297 | |
Savings deposits | | (98 | ) | 58 | | (40 | ) | (131 | ) | 37 | | (94 | ) |
Time deposits | | 680 | | 1,368 | | 2,048 | | 138 | | 1,848 | | 1,986 | |
Time deposits over $100,000 | | (239 | ) | 467 | | 228 | | 448 | | 965 | | 1,413 | |
Federal funds purchased and securities sold under agreements to repurchase | | (274 | ) | (21 | ) | (295 | ) | 94 | | 191 | | 285 | |
Short term debt | | (1 | ) | — | | (1 | ) | (2 | ) | 5 | | 3 | |
Total interest-bearing funds | | (43 | ) | 2,278 | | 2,235 | | 377 | | 3,513 | | 3,890 | |
Net interest earnings | | $ | 8 | | $ | (2,152 | ) | $ | (2,144 | ) | $ | 630 | | $ | 214 | | $ | 844 | |
Notes:
1. The change in interest earned or paid resulting from both volume and rate or yield has been allocated accordingly in proportion to the relationship of the absolute dollar amounts of the change in each. Loans include nonaccrual loans for all years presented.
2. The computation of the taxable equivalent adjustment has given effect to the disallowance of interest expense, for federal income tax purposes, related to certain tax-free assets.
3. U.S. government, government agency and corporate debt securities plus equity securities in the available-for-sale and held-to-maturity categories are taxable securities. Most municipal debt securities are nontaxable and classified as held-to-maturity.
26
Assets and Liabilities
Average earning assets decreased 1.7% as of December 31, 2007 compared to December 31, 2006 and decreased 0.9% as of December 31, 2006 compared to December 31, 2005. Stable local economic conditions contributed to the nominal change in average earning assets during 2007. Management of the Corporation believes that similar conditions for loan growth will continue in 2008. As a financial institution, the Bank’s primary earning asset is loans. At December 31, 2007, average net loans represented 66.7% of average earning assets. Average net loans were up 3.6% as of December 31, 2007 compared to December 31, 2006 and increased 6.1% as of December 31, 2006 compared to December 31, 2005.
Average investments, which were 33.3% of average earning assets at December 31, 2007, decreased 10.8% from year end 2006 compared to a 11.1% decrease at the end of 2006 from year end 2005. Maturing securities and other available funds were invested in loans and provided a source of funds to offset the decrease in deposits. Average total assets declined 1.3% during 2007 compared to a decrease during 2006 of 1.5%.
The Bank’s average deposits declined 1.0% as of December 31, 2007 compared to December 31, 2006 because interest rate competition increased from existing banks and non banks, including the emergence of new banking organizations in our service area. The Bank’s average deposits declined 2.7% as of December 31, 2006 compared to December 31, 2005. Interest bearing transaction accounts at December 31, 2007, were down 1.9% from the average at December 31, 2006. Time deposits under $100 increased 10.4% as of December 31, 2007 compared to December 31, 2006 and time deposits over $100 decreased 5.9% primarily because the Bank decreased its reliance on short term large dollar certificates of deposit. Average savings deposits decreased 10.6% at December 31, 2007 compared to December 31, 2006. As reflected by these changes, the Bank experienced a shift of funds by its customers out of savings deposits and into time deposits. Savings deposits have historically been steady providers of a core, low cost, source of funding.
27
Customer relationship development helped maintain a stable base in noninterest-bearing deposits during 2007. The Bank’s noninterest-bearing deposits have remained strong and were 18.0% of average total deposits at December 31, 2007, 17.2% of average total deposits at December 31, 2006 and 16.5% of average total deposits at 12/31/05. This core of noninterest-bearing funds increased 3.5% for 2007.
The Corporation and the Bank do not have any long-term debt or other obligations with the exception of certain operating leases that are discussed in Note 7 of the Notes To Consolidated Financial Statements included elsewhere in this report.
LIQUIDITY AND CAPITAL RESOURCES
The Bank uses a formal asset and liability management process to ensure adequate liquidity and control interest rate risk. The Bank’s goal of liquidity management is to provide adequate funds to meet loan demand and any potential unexpected deposit withdrawals. The Bank accomplishes this goal by striving for consistent core deposit growth, holding adequate liquid assets and maintaining unused capacity to borrow funds. The Bank’s objective of interest rate risk management is to maintain reasonable stability in the gross interest margin despite changes in the level of interest rates and the spread among interest rates.
Liquidity
At December 31, 2007, available liquidity was $244,400, including $224,800 of available credit from various sources. This is compared to $129.0 million as of December 31, 2006. The Bank’s goal of liquidity management is to provide adequate funds to meet loan demand and any potential unexpected deposit withdrawals. The Bank accomplishes this goal by striving for consistent core deposit growth, holding adequate liquid assets and maintaining unused capacity to borrow funds. The Bank’s objective of interest rate risk management is to maintain reasonable stability in the gross interest margin despite changes in the level of interest rates and the spread among interest rates.
Interest Rate Risk
The Bank uses an earnings simulation model to evaluate the impact of different interest rate scenarios on the gross margin. Each quarter, the Bank’s Asset/Liability Committee monitors the relationship of rate sensitive earning assets to rate sensitive interest-bearing liabilities (interest rate sensitivity), which is the principal factor in determining the effect that fluctuating interest rates will have on future net interest income. Rate sensitive earning assets and interest-bearing liabilities are those that can be repriced to current market rates within a defined time period. The Asset/Liability Committee measures near-term risk (within the next 12 months) to net interest income resulting from changes in interest rates. The model incorporates the Bank’s assets and liabilities, together with forecasted changes in the balance sheet mix and assumptions that reflect the current interest rate environment, to simulate the effect of possible changes in interest rates on net interest income. As a policy, budgeted financial goals are monitored on a monthly basis by the Asset/Liability Committee where the actual dollar change in net interest income, given different interest rate movements, is reviewed. A negative dollar change in net interest income for a 12-month period of less than 4.5% of net interest income given a 300 basis point shift in interest rates is considered an acceptable rate risk position. At December 31, 2007, if interest rates were to rise 300 basis points (3.0%) over the next 12 months, net interest income would be $556 less than currently projected if rates were to remain stable. This would be a decline in net interest income of 1.8%, which is within policy guidelines established by the Bank’s Board of Directors.
��
28
Another tool used to monitor the Bank’s overall interest rate sensitivity is a gap analysis. Table C shows the Bank’s rate-sensitive position at December 31, 2007, as measured by a gap analysis (the difference between the earning asset and interest-bearing liability amounts scheduled to be re-priced to current market rates in subsequent periods). Non-maturing balances such as money market, savings and NOW accounts have no contractual or stated maturities. Management has attempted to use historical data (pricing history) on these categories to best determine the impact of these non-maturing balances on the net interest margin as the interest rates change. Management anticipates rates to decrease slightly in 2008 and has determined the Bank to be in an acceptable rate risk position. Table A provides additional information regarding the largest components of interest-bearing liabilities.
TABLE C - Rate Sensitivity of Earning Assets and Interest-Bearing Liabilities |
(Dollars in Thousands)
| | Three
Months | | Three to
Six | | Six to 12 | | Over
One | | | |
As of December 31, 2007 | | or Less | | Months | | Months | | Year | | Total | |
Earning assets | | | | | | | | | | | |
Bank time deposits | | $ | 176 | | $ | — | | $ | — | | $ | — | | $ | 176 | |
Taxable investment securities | | 10,494 | | 3,688 | | 12,255 | | 118,359 | | 144,796 | |
Tax-exempt investment securities | | 2,699 | | 1,958 | | 678 | | 89,345 | | 94,680 | |
Loans and leases, net of deferred fees | | 85,518 | | 31,210 | | 62,332 | | 321,083 | | 500,143 | |
Total earning assets | | 98,887 | | 36,856 | | 75,265 | | 528,787 | | 739,795 | |
Interest-bearing liabilities | | | | | | | | | | | |
NOW and money market accounts | | — | | — | | — | | 196,723 | | 196,723 | |
Savings | | — | | — | | — | | 81,852 | | 81,852 | |
Time | | 66,996 | | 61,102 | | 38,502 | | 15,341 | | 181,941 | |
Time over $100,000 | | 53,417 | | 26,506 | | 23,848 | | 3,629 | | 107,400 | |
Federal Funds purchased and repurchase agreements | | — | | — | | — | | — | | — | |
Other short-term debt | | 3,108 | | — | | — | | — | | 3,108 | |
Total interest bearing liabilities | | 123,521 | | 87,608 | | 62,350 | | 297,545 | | 571,024 | |
Period gap | | (24,634 | ) | (50,752 | ) | 12,915 | | 231,242 | | 168,771 | |
Cumulative gap | | $ | (24,634 | ) | $ | (75,386 | ) | $ | (62,471 | ) | $ | 168,771 | | | |
| | | | | | | | | | | | | | | | |
Capital
Historically, internal growth has financed the capital needs of the Bank. The Corporation and the Bank do not have any long-term debt. The Corporation and Bank have plans for capital expenditures in the next 12 months. The Bank plans to build two branches by the end of 2008: one in Maury County and one in Williamson County.
Cash dividends declared in 2007 were 46.0% of net income compared to 50.5% for 2006. The Corporation plans to continue an average annual payout ratio over 20% while continuing to maintain a capital to asset ratio reflecting financial strength and adherence to regulatory guidelines.
At December 31, 2007, the Corporation had a ratio of Tier I Capital to average assets of 12.2%. This compares to a ratio of Tier I capital to average assets of 12.0% at December 31, 2006. This ratio change slightly because retained earnings, capital stock and additional paid-in capital were stable and average total assets declined 1.3% during 2007.
The minimum guideline for the ratio of total capital to risk-weighted assets is 8%. Tier 1 Capital generally consists of common stock. Tier I Capital must equal at least 4% of risk-weighted assets. As of
29
December 31, 2007, the Corporation’s ratios of Tier I Capital to risk-weighted assets and total Capital to risk-weighted assets were 16.9% and 18.2%, respectively. At December 31, 2006, the comparable ratios were 18.6% and 19.8%, respectively. Please refer to Note 10 in the Notes to Consolidated Financial Statements included elsewhere in this report for more information on the capital strength of the Corporation and the Bank.
The following table summarized the Corporation’s contractual obligations as of December 31, 2007:
| | Payment due by period | |
Contractual Obligations | | Total | | Less than 1
year | | 1-3 years | | 3-5 years | | More than 5
years | |
Operating Lease Obligations | | $ | 1,615 | | $ | 357 | | $ | 537 | | $ | 487 | | $ | 234 | |
| | | | | | | | | | | | | | | | |
Loans and Loan Quality
As with most commercial banking institutions, the Bank’s loan portfolio is the largest component of earning assets and, therefore, provides the highest amount of revenue. The loan portfolio also contains, as a result of credit quality, the highest exposure to risk. When analyzing potential loans, management assesses both interest rate objectives and credit quality objectives in determining whether to make a given loan and the appropriate pricing for that loan. The Bank maintains a diversified portfolio in order to spread its risk and reduce its exposure to economic downturns that may occur in different segments of the economy or in particular industries. As of December 31, 2007, total loans maturing and repricing after one year that have predetermined interest rates and floating or adjustable interest rates are $294 million and $59 million, respectively. The composition of the loan portfolio is disclosed in detail in Note 3 in the Notes to Consolidated Financial Statements included elsewhere in this report.
The lending activities of the Bank are subject to written underwriting standards and policies established by the Bank’s Board of Directors and management that include loan review procedures and approvals. Applications for loans are taken by designated employees at 13 of the Bank’s offices. Depending primarily on the amount of the loan, there are various approval levels required, including an Executive Committee of the Bank’s Board of Directors that meets weekly.
The Bank has a credit administration function that is responsible for assisting loan officers in underwriting new loans, reviewing problem loans, monitoring the status of problem loans from period to period and assisting in their resolution. This review process also includes semi-annual reviews by an outside party to assess the quality of the loan portfolio independently. Management has concluded that this independent review has served to strengthen underwriting practices. The analysis and review by the Bank’s credit administration department also include a formal review that is prepared quarterly to assess the risk in the loan portfolio and to determine the adequacy of the allowance for loan losses. Loan reviews of all relationships aggregating $250 and greater are completed on an annual schedule. At December 31, 2007 loans totaling $8.2 million, or 1.7% of the portfolio, were classified as other assets especially mentioned. This compares to loans totaling $11.4 million so classified at December 31, 2006. There were no loans classified as doubtful at December 31, 2007 and December 31, 2006. The bank closed the year with $7.4 million in classified assets, which includes substandard loans, doubtful loans and Other Real Estate Owned (“OREO”). This represents a increase of $1.8 million or 32.1% from December 31, 2006. Classified assets represented 7.2% of Tier I Capital and ALLL, which was up from 5.3% at 12/31/06 and below the Bank’s objective of 12.0%. For most of 2007, delinquency levels remained below the year-end level of 1.2% and well below both the Bank’s target level of 12% and peer group average. Loans that are impaired and not accruing interest were more actively monitored to determine those for which more aggressive action plans should be taken. The Bank ended 2007 with a net recovery of $119, for a net recovery percentage of
30
0.02%. The Bank does not expect to sustain a prolonged period of net recoveries, although this marks the third consecutive year in which a net recovery has been recorded. The Bank’s charge-off levels continue to track below the Bank’s target level of 0.25% and its peer group average of 0.12%. Management believes that the allowance for loan losses was adequate at December 31, 2007.
Table D summarizes average loan balances and reconciles the allowance for loan losses at December 31, 2003, 2004, 2005, 2006 and 2007. Additions or reductions to the allowance, which have been included in operating expenses, are also included. First mortgage loans secured by one to four-family residential properties make up 37.1% of the total loan portfolio. The Bank continues to have a concentration in residential mortgage loans; however, management of the Bank remains comfortable with this concentration of loan type given the strong underwriting practices within this portfolio and the acceptable level of historical losses. The environment for commercial, industrial and commercial real estate lending remains largely unchanged in the seven counties within which the Bank operates. The Bank does not have any industry concentrations as measured by regulatory guidelines. However, the Bank does have heavy exposure among five broad industry categories– construction, manufacturing, real estate rental and leasing, other services, and public administration. Given the level of exposure in each of these categories, the particular industries are monitored closely to ensure that underwriting practices and policies, as well as allowance levels, match the level of risk posed. For more information about the Bank’s loan concentration, please refer to Note 1 in the Notes to Consolidated Financial Statements included elsewhere in this report.
Loans having recorded investments of $2.3 million and $2.0 million at December 31, 2007 and 2006, have been identified as impaired and are not accruing interest in accordance with the provision of Statement of Financial Accounting Standards No. 114 (“SFAS 114”), “Accounting by Creditors for Impairment of a Loan.” These types of loans are considered nonaccrual loans and represent 0.5% and 0.4% of gross loans as of December 31, 2007 and 2006, respectively. Interest received on these loans during 2007 was $135, during 2006 was $122, and during 2005 was $136. The gross interest income that would have been recorded if the loans had been current in accordance with their original terms and had been outstanding throughout the period or since origination, if held for part of the period, was $228, $200, and $251 for the years ended December 31, 2007, 2006, and 2005, respectively. The Bank has no loans that are past due 90 days or more and no “troubled debt restructurings” as defined in SFAS 15 that are not included in nonaccrual loans as of December 31, 2007 and 2006. Please refer to Note 1 and Note 3 in the Notes to Consolidated Financial Statements that are included elsewhere in this material for more information on the Bank’s policy regarding loan impairment.
31
TABLE D – The Loan Portfolio
(Dollars In Thousands) | | 2007 | | 2006 | | 2005 | | 2004 | | 2003 | |
| | | | | | | | | | | |
Average amount of gross loans outstanding | | $491,627 | | $475,226 | | $448,868 | | $428,671 | | $456,187 | |
| | | | | | | | | | | |
Balance of allowance for possible loan losses at beginning of year | | 7,262 | | 7,794 | | 8,509 | | 10,123 | | 11,375 | |
| | | | | | | | | | | |
Loans charged off | | | | | | | | | | | |
Loans secured by real estate | | 42 | | 207 | | 287 | | 364 | | 958 | |
Commercial and industrial loans | | — | | 94 | | 138 | | 1,017 | | 296 | |
Loans to individuals | | 115 | | 62 | | 126 | | 299 | | 712 | |
TOTAL LOANS CHARGED OFF | | 157 | | 363 | | 551 | | 1,680 | | 1,966 | |
Recoveries of loans previously charged off | | | | | | | | | | | |
Loans secured by real estate | | 51 | | 110 | | 555 | | 187 | | 22 | |
Commercial and industrial loans | | 155 | | 92 | | 73 | | 259 | | 67 | |
Loans to individuals | | 70 | | 265 | | 98 | | 297 | | 192 | |
TOTAL RECOVERIES | | 276 | | 467 | | 726 | | 743 | | 281 | |
| | | | | | | | | | | |
NET LOANS CHARGED OFF | | (119 | ) | (104 | ) | (175 | ) | 937 | | 1,685 | |
| | | | | | | | | | | |
Provision (reduction) charged (credited) to operating expenses | | — | | (636 | ) | (890 | ) | (677 | ) | 433 | |
| | | | | | | | | | | |
BALANCE AT END OF YEAR | | $7,381 | | $7,262 | | $7,794 | | $8,509 | | $10,123 | |
Ratio of net charge-offs during the period to average gross loans outstanding | | (0.02 | )% | (0.02 | )% | (0.04 | )% | 0.22 | % | 0.37 | % |
Interest Income
Total interest income increased 3.0% during 2007 due to the increased volume in loans. Interest and fees earned on loans was 76.1% of gross interest income during 2007 and increased 6.4% in 2007 compared to 2006 as a result of the financial products repricing and loan volume increasing throughout the year. Interest and fees earned on loans increased 6.4% during 2007 compared to 2006 as a result of higher yields and increasing loan volume. Interest earned on securities and other investments was 23.9% of gross interest income during 2007 and was down 6.6% from 2006 primarily because of the decrease in volume.
Interest Expense
Total interest expense increased 16.2% during 2007, compared to a 39.3% increase during 2006, and a 16.6% increase during 2005. Increases in the average interest rate paid on interest bearing liabilities contributed to the higher interest expense. The cost of interest-bearing deposits is monitored quarterly by the Bank’s Asset/Liability Committee. The net interest margin (tax equivalent net interest income divided by average earning assets) was 4.15%, 4.37% and 4.21% for years ending December 31, 2007, 2006, and 2005, respectively.
Net interest income on a fully taxable equivalent basis is influenced primarily by changes in: (i) the volume and mix of earning assets and sources of funding; (ii) market rates of interest; and (iii) income tax rates. The impact of some of these factors can be controlled by management policies and actions. External factors can also have a significant impact on changes in net interest income from one period to another. Some examples of such factors are: (i) the strength of credit demands by customers; (ii) Federal Reserve Board monetary policy; and (iii) fiscal and debt management policies of the federal government, including changes in tax laws.
32
Noninterest Income and Expenses
Noninterest income increased 4.2% during 2007. There was no gain on sale of available-for-sale securities in 2007, whereas 2006 reflected a $51 gain. Income from fiduciary services offered in the Bank’s Trust department was up 12.9%, representing 22.3% of total noninterest income. Noninterest income decreased 0.4% during 2006 and decreased 1.3% during 2005.
Noninterest expenses, excluding the provision for possible loan losses, decreased 6.7% during 2007. Decreases in salaries and employee benefits contributed to this decrease. Noninterest expenses, excluding the provision for possible loan losses, increased 2.2% during 2006. Noninterest expenses increased 1.8 % during 2005.
Net Income
Net income was 11.6% higher in 2007 than in 2006. The increase in loan volumes, decrease in salaries and employee benefits, and decrease in deposit rates were primary reasons for the increase. Net income was 8.6% lower in 2006 than in 2005. The increase in interest expense was a primary reason for the decline.
33
OFF-BALANCE SHEET ARRANGEMENTS
As of December 31, 2007, the Bank was a party to financial instruments with off-balance-sheet risk in the normal course of business to meet the financing needs of its customers. These financial instruments include commitments to extend credit and standby letters of credit. Please refer to Note 9 of the Notes to Consolidated Financial Statements included elsewhere in this report for more information on the Bank’s commitments and contingencies. Please refer to Table C under the heading “Liquidity and Capital Resources” for a summary of our earning assets and interest-bearing liabilities by maturities that are included in the Consolidated Balance Sheet.
IMPACT OF RECENTLY ISSUED ACCOUNTING STANDARDS ON THE FINANCIAL STATEMENTS
In September 2006, the Financial Accounting Standards Board (“FASB”) issued Statement of Financial Accounting Standards No. 157 (FAS-157), Fair Value Measurements. FAS-157 defines fair value, establishes a framework for measuring fair value in accordance with general accepted accounting principles, and expands disclosures about fair value measurements. The provisions of FAS-157 are effective for the Corporation for fiscal years beginning after November 15, 2007.
In February 2007, the Financial Accounting Standards Board (“FASB”) issued Statement of Financial Accounting Standards No. 159 (FAS-159), The Fair Value Option for Financial Assets and Financial Liabilities – Including an Amendment of FASB Statement No. 115. The fair value option established by FAS-159 permits all entities to choose to measure eligible items at fair value at the specified election dates. A business entity will report unrealized gain and losses on items for which the fair value option has been elected in earnings at each subsequent reporting date. FAS-159 is effective for the Company for fiscal years beginning after November 15, 2007. Management chose not to utilize this option for 2007.
In December 2007, the Financial Accounting Standards Board (“FASB”) issued Statement of Financial Accounting Standards No. 160 (FAS-160), Noncontrolling Interests in Consolidated Financial Statements – An amendment of ARB No. 51. FAS-160 establishes new accounting and reporting standards for a parent company’s noncontrolling interest in a subsidiary and for the deconsolidation of a subsidiary. Specifically, this statement requires the recognition of a noncontrolling interest (minority interest) as equity in the consolidated financial statements, which is reported separate from the parent’s equity. The amount of net income attributable to the noncontrolling interest will be included in consolidated net income on the face of the income statement. FAS-160 clarifies that changes in a parent’s ownership interest in a subsidiary, which do not result in deconsolidation, are equity transactions if the parent retains its controlling financial interest. In addition, this statement requires that a parent recognize a gain or loss in results of operations when a subsidiary is deconsolidated. Such gain or loss will be measured using the fair value of the noncontrolling equity investment at the deconsolidation date. FAS-160 is effective for fiscal years, and interim periods within those fiscal years, beginning on or after December 15, 2008. Management is currently evaluating the impact, if any, of the adoption of these pronouncements on the financial statements.
CRITICAL ACCOUNTING POLICIES
The accounting principles the Bank follows and the methods of applying these principles conform with accounting principles generally accepted in the United States of America and with general practices within the banking industry. In connection with the application of those principles, Bank management has made judgments and estimates that, in the case of the determination of the allowance for loan losses (“ALLL”), the recognition of deferred income tax assets has been critical to the determination of the Bank’s financial position, results of operations and cash flows.
34
Allowance for Loan Losses
Management of the Bank assesses the adequacy of the ALLL prior to the end of each month and prepares a more formal review quarterly to assess the risk in the Bank’s loan portfolio. This assessment includes procedures to estimate the allowance and test the adequacy and appropriateness of the resulting balance. The ALLL represents calculated amounts for specifically identified credit exposure and exposures readily predictable by historical or comparative experience. Even though this calculation considers specific credits, the entire allowance is available to absorb any credit losses.
These calculated amounts are determined by assessing loans identified as not in compliance with loan agreements. These loans are generally in two different risk groups. One group is unique loans (commercial loans, including those loans considered impaired). The second group is homogenous loans (generally retail and mortgage loans). The calculation for unique loans is based primarily on risk rating grades assigned to each of these loans as a result of our loan management and review processes. Each risk-rating grade is assigned a loss ratio, which is determined based on the experience of management, discussions with banking regulators and the independent loan review process. The amount allocated for impaired loans is based on estimated cash flows discounted at the loan’s original effective interest rate or the underlying collateral value. Historical data, including actual loss experience on specific types of homogenous loans, is used to allocate amounts for loans or groups of loans meeting the specified criteria.
Management is putting procedures in place so that more detailed historical data can be accumulated by category of retail and commercial credit and performance characteristics to broaden the analysis and improve monitoring of potential credit risk.
Criteria considered and processes utilized in evaluating the adequacy of the ALLL are:
· Portfolio quality trends;
· Changes in the nature and volume of the portfolio;
· Present and prospective economic and business conditions, locally and nationally;
· Management review systems and board oversight, including external loan review processes;
· Changes in credit policy, credit administration, portfolio management and procedures;
· Changes in personnel, management and staff; and
· Existence and effect of any concentrations of credit.
In assessing the adequacy of the ALLL, the risk characteristics of the entire loan portfolio are evaluated. This process includes the judgment of management, input from independent loan reviews and reviews that may have been conducted by bank regulators as part of their usual examination process.
The following table gives a breakdown of the allowance for loan losses per loan category:
| | 2007 | | 2006 | |
| | Amount | | Percent of
ALLL | | Amount | | Percent of
ALLL | |
Commercial Real Estate - Mortgage | | $ | 2,324 | | 31.00 | % | $ | 1,886 | | 26.00 | % |
Commercial Real Estate - Construction | | 633 | | 9.00 | % | 319 | | 4.00 | % |
Commercial - Other | | 1,398 | | 19.00 | % | 1,222 | | 17.00 | % |
Total Commercial | | 4,355 | | 59.00 | % | 3,427 | | 47.00 | % |
Consumer Real Estate - Mortgage | | 2,036 | | 28.00 | % | 1,510 | | 21.00 | % |
Consumer Real Estate - Construction | | 110 | | 1.00 | % | 140 | | 2.00 | % |
Consumer - Other | | 594 | | 8.00 | % | 904 | | 12.00 | % |
Total Consumer | | 2,741 | | 37.00 | % | 2,554 | | 35.00 | % |
Other | | 285 | | 4.00 | % | 1,281 | | 18.00 | % |
Total Allowance for Loan and Lease Losses | | $ | 7,381 | | 100.00 | % | $ | 7,262 | | 100.00 | % |
35
Deferred Income Tax Assets
Deferred income tax assets consist mainly of the tax effect of excess provisions for loan losses over actual losses incurred, the unrealized loss on available-for-sale securities, and deferred compensation. The Corporation and the Bank have paid taxes for many years. Management believes that it is more likely than not that these assets will be realized in future years.
Selected Financial Information
(Dollars in Thousands, Except Per Share Data)
| | 2007 | | 2006 | | 2005 | | 2004 | | 2003 | |
Interest Income | | | | | | | | | | | |
Interest and fees on loans | | $ | 33,238 | | $ | 31,246 | | $ | 27,038 | | $ | 24,426 | | $ | 28,388 | |
Income on investment securities | | | | | | | | | | | |
Taxable interest | | 5,327 | | 6,345 | | 8,443 | | 10,263 | | 11,045 | |
Exempt from federal income tax | | 3,913 | | 4,221 | | 3,266 | | 2,568 | | 2,738 | |
Dividends | | 206 | | 180 | | 137 | | 213 | | 130 | |
| | 9,446 | | 10,746 | | 11,846 | | 13,044 | | 13,913 | |
Other interest income | | 1,003 | | 445 | | 222 | | 94 | | 250 | |
Total interest income | | 43,687 | | 42,437 | | 39,106 | | 37,564 | | 42,551 | |
Interest expense | | | | | | | | | | | |
Interest on deposits | | 15,870 | | 13,339 | | 9,736 | | 8,429 | | 11,388 | |
Interest on other short term borrowings | | 153 | | 449 | | 162 | | 58 | | 21 | |
Total interest expense | | 16,023 | | 13,788 | | 9,898 | | 8,487 | | 11,409 | |
Net interest income | | 27,664 | | 28,649 | | 29,208 | | 29,077 | | 31,142 | |
Provision for possible loan losses | | — | | (636 | ) | (890 | ) | (677 | ) | 433 | |
Net interest income after provision for loan losses | | 27,664 | | 29,285 | | 30,098 | | 29,754 | | 30,709 | |
Noninterest Income | | | | | | | | | | | |
Trust department income | | 2,621 | | 2,322 | | 2,220 | | 2,088 | | 1,806 | |
Service fees on deposit accounts | | 7,640 | | 7,739 | | 7,208 | | 7,189 | | 7,217 | |
Other service fees, commissions, and fees | | 589 | | 424 | | 372 | | 408 | | 433 | |
Other operating income | | 905 | | 751 | | 1,018 | | 873 | | (15 | ) |
Securities gains | | — | | 51 | | 513 | | 917 | | 737 | |
Total noninterest income | | 11,755 | | 11,287 | | 11,331 | | 11,475 | | 10,178 | |
Noninterest expense | | | | | | | | | | | |
Salaries and employee benefits | | 15,192 | | 16,918 | | 16,447 | | 16,217 | | 15,645 | |
Net occupancy expense | | 2,374 | | 2,143 | | 2,353 | | 2,289 | | 2,184 | |
Furniture and equipment expense | | 1,089 | | 1,138 | | 1,220 | | 1,317 | | 1,422 | |
Other operating expenses | | 10,023 | | 10,547 | | 10,076 | | 9,724 | | 10,437 | |
Total noninterest expense | | 28,678 | | 30,746 | | 30,096 | | 29,547 | | 29,688 | |
Income before provision For income taxes | | 10,741 | | 9,826 | | 11,333 | | 11,682 | | 11,199 | |
Provision for income taxes | | 2,120 | | 2,101 | | 2,881 | | 3,088 | | 2,889 | |
Net income | | $ | 8,621 | | $ | 7,725 | | $ | 8,452 | | $ | 8,594 | | $ | 8,310 | |
Earnings per common share | | $ | 1.51 | | $ | 1.33 | | $ | 1.45 | | $ | 1.47 | | $ | 1.42 | |
Weighted average shares outstanding | | 5,727,158 | | 5,826,589 | | 5,840,000 | | 5,840,000 | | 5,840,000 | |
|
Share and per share data have been restated to give retroactive effect to the two-for-one stock split effected as a stock dividend declared on April 20, 2004.
(See Note 1 of Notes to Consolidated Financial Statements) |
36

REPORT OF INDEPENDENT REGISTERED PUBLIC ACCOUNTING FIRM
Board of Directors
First Farmers and Merchants Corporation
We have audited the consolidated balance sheets of First Farmers and Merchants Corporation and subsidiaries (collectively, the “Company”) as of December 31, 2007 and 2006, and the related consolidated statements of income, changes in shareholders’ equity and cash flows for each of the three years in the period ended December 31, 2007. These consolidated financial statements are the responsibility of the Company’s management. Our responsibility is to express an opinion on these consolidated financial statements based on our audits.
We conducted our audits in accordance with the standards of the Public Company Accounting Oversight Board (United States). Those standards require that we plan and perform the audit to obtain reasonable assurance about whether the financial statements are free of material misstatement. An audit includes examining, on a test basis, evidence supporting the amounts and disclosures in the financial statements. An audit also includes assessing the accounting principles used and significant estimates made by management, as well as evaluating the overall financial statement presentation. We believe that our audits provide a reasonable basis for our opinion.
In our opinion, the financial statements referred to above present fairly, in all material respects, the consolidated financial position of First Farmers and Merchants Corporation and subsidiaries as of December 31, 2007 and 2006, and the consolidated results of their operations and their cash flows for each of the three years in the period ended December 31, 2007, in conformity with accounting principles generally accepted in the United States of America.
We have also audited, in accordance with the standards of the Public Company Accounting Oversight Board (United States), First Farmers and Merchants Corporation and subsidiaries’ internal control over financial reporting as of December 31, 2007, based on criteria established in Internal Control—Integrated Framework issued by the Committee of Sponsoring Organizations of the Treadway Commission (COSO), and our report dated February 29, 2008, expressed an unqualified opinion on the effectiveness of First Farmers and Merchants Corporation and subsidiaries’ internal control over financial reporting.
/s/ KraftCPAs PLLC
Nashville, Tennessee
February 29, 2008
555 Great Circle Road, Suite 200 · Nashville, TN 37228 · Phone 615-242-7351 · Fax 615-256-1952 · www.kraftcpas.com
610 North Garden St. Suite 200, Columbia, Tennessee 38401 · Phone 931-388-3711
105 Bay Court, Lebanon, Tennessee 37087 · Phone 615-449-2334
An independently owned member of the RSM McGladrey Network
37

FIRST FARMERS AND MERCHANTS CORPORATION
COLUMBIA, TENNESSEE
Management Report on Internal Control Over Financial Reporting.
The management of First Farmers and Merchants Corporation is responsible for establishing and maintaining adequate internal control over financial reporting. The Corporation’s internal control system was designed to provide reasonable assurance to the Corporation’s management and board of directors regarding the preparation and fair presentation of published financial statement. All internal control systems, no matter how well designed, have inherent limitations. Therefore, even those systems determined to be effective can provide only reasonable assurance with respect to financial statement preparation and presentation.
The Corporation’s management assessed the effectiveness of the Corporation’s internal control over financial reporting as of December 31, 2007. In making this assessment, it used the criteria set forth by the Committee of Sponsoring Organizations of the Treadway Commission (COSO) in “Internal Control-Integrated Framework.” Based on our assessment we believe that, as of December 31, 2007, the Corporation’s internal control over financial reporting is effective based on those criteria.
The Corporation’s independent registered public accounting firm has issued an audit report on management’s assessment of the Corporation’s internal control over financial reporting. This report appears on page 40 of this annual report.
/s/ T. Randy Stevens | | /s/ Patricia P. Bearden | |
| | | |
T. Randy Stevens, Chief Executive Officer | | Patricia P. Bearden, Assistant Treasurer | |
| | | |
and Chairman | | (principal financial officer and | |
| | principal accounting officer) | |
38
REPORT OF INDEPENDENT REGISTERED PUBLIC ACCOUNTING FIRM
Board of Directors
First Farmers and Merchants Corporation
We have audited the internal control over financial reporting of First Farmers and Merchants Corporation and subsidiaries (collectively, the “Company”) as of December 31, 2007, based on criteria established in Internal Control—Integrated Framework issued by the Committee of Sponsoring Organizations of the Treadway Commission (COSO). The Company’s management is responsible for maintaining effective internal control over financial reporting and for its assessment of the effectiveness of internal control over financial reporting included in the accompanying Management Report on Internal Control Over Financial Reporting. Our responsibility is to express an opinion on the Company’s internal control over financial reporting based on our audit.
We conducted our audit in accordance with the standards of the Public Company Accounting Oversight Board (United States). Those standards require that we plan and perform the audit to obtain reasonable assurance about whether effective internal control over financial reporting was maintained in all material respects. Our audit included obtaining an understanding of internal control over financial reporting, assessing the risk that a material weakness exists, and testing and evaluating the design and operating effectiveness of internal control based on the assessed risk. Our audit also included performing such other procedures as we considered necessary in the circumstances. We believe that our audit provides a reasonable basis for our opinion.
A company’s internal control over financial reporting is a process designed to provide reasonable assurance regarding the reliability of financial reporting and the preparation of financial statements for external purposes in accordance with generally accepted accounting principles. A company’s internal control over financial reporting includes those policies and procedures that (1) pertain to the maintenance of records that, in reasonable detail, accurately and fairly reflect the transactions and dispositions of the assets of the company; (2) provide reasonable assurance that transactions are recorded as necessary to permit preparation of financial statements in accordance with generally accepted accounting principles, and that receipts and expenditures of the company are being made only in accordance with authorizations of management and directors of the company; and (3) provide reasonable assurance regarding prevention or timely detection of unauthorized acquisition, use, or disposition of the company’s assets that could have a material effect on the financial statements.
Because of its inherent limitations, internal control over financial reporting may not prevent or detect misstatements. Also, projections of any evaluation of effectiveness to future periods are subject to the risk that controls may become inadequate because of changes in conditions, or that the degree of compliance with the policies or procedures may deteriorate.
In our opinion, First Farmers and Merchants Corporation and subsidiaries maintained, in all material respects, effective internal control over financial reporting as of December 31, 2007, based on criteria established in Internal Control—Integrated Framework issued by the Committee of Sponsoring Organizations of the Treadway Commission (COSO).
We have also audited, in accordance with the standards of the Public Company Accounting Oversight Board (United States), the consolidated balance sheets of First Farmers and Merchants Corporation and subsidiaries as of December 31, 2007 and 2006, and the related consolidated statements of income, shareholders’ equity and cash flows for each of the three years in the period ended December 31, 2007, and our report dated February 29, 2008, expressed an unqualified opinion on those consolidated financial statements.
/s/ KraftCPAs PLLC
Nashville, Tennessee
February 29, 2008
555 Great Circle Road, Suite 200 · Nashville, TN 37228 · Phone 615-242-7351 · Fax 615-256-1952 · www.kraftcpas.com
610 North Garden St. Suite 200, Columbia, Tennessee 38401 · Phone 931-388-3711
105 Bay Court, Lebanon, Tennessee 37087 · Phone 615-449-2334
An independently owned member of the RSM McGladrey Network
39
FIRST FARMERS AND MERCHANTS CORPORATION AND SUBSIDIARIES |
|
CONSOLIDATED BALANCE SHEETS |
| | December 31,
2007 | | December 31,
2006 | |
(Dollars in Thousands, Except Per Share Data) | | | |
ASSETS | | | | | |
Cash and due from banks | | $ | 35,097 | | $ | 45,558 | |
Interest-bearing deposits in banks | | 176 | | 2,573 | |
Federal funds sold | | 600 | | 26,850 | |
Total cash and cash equivalents | | 35,873 | | 74,981 | |
Securities | | | | | |
Available-for-sale (amortized cost $163,050 and $149,040, respectively) | | 163,911 | | 147,001 | |
Held-to-maturity (fair market value $76,460 and $82,109, respectively) | | 75,565 | | 81,247 | |
Total securities | | 239,476 | | 228,248 | |
Loans, net of deferred fees | | 500,143 | | 473,353 | |
Allowance for loan losses | | (7,381 | ) | (7,262 | ) |
Net loans | | 492,762 | | 466,091 | |
Bank premises and equipment, at cost less allowance for depreciation | | 14,306 | | 10,428 | |
Core deposit and other intangibles | | 9,318 | | 9,874 | |
Other assets | | 31,311 | | 30,462 | |
TOTAL ASSETS | | $ | 823,046 | | $ | 820,084 | |
| | | | | | | |
LIABILITIES | | | | | |
Deposits | | | | | |
Noninterest-bearing | | $ | 131,043 | | $ | 142,933 | |
Interest-bearing (including certificates of deposits over $100: 2007 - $107,398; 2006 - $91,504) | | 567,916 | | 556,029 | |
Total deposits | | 698,959 | | 698,962 | |
Federal funds purchased and securities sold under agreements to repurchase | | 2,507 | | 2,654 | |
Dividends payable | | 1,991 | | 1,971 | |
Short-term borrowings | | 600 | | 385 | |
Accounts payable and accrued liabilities | | 12,650 | | 12,305 | |
Minority interest in consolidated subsidiary | | 95 | | — | |
TOTAL LIABILITIES | | 716,802 | | 716,277 | |
| | | | | |
SHAREHOLDERS’ EQUITY | | | | | |
Common stock - $10 par value per share, 8,000,000 shares authorized; 5,680,000 and 5,760,000 shares issued and outstanding as of December 31, 2007 and December 31, 2006, respectively | | 56,800 | | 57,600 | |
Additional paid-in capital | | — | | 1,120 | |
Retained earnings | | 48,916 | | 46,342 | |
Accumulated other comprehensive income (loss) | | 528 | | (1,255 | ) |
TOTAL SHAREHOLDERS’ EQUITY | | 106,244 | | 103,807 | |
TOTAL LIABILITIES AND SHAREHOLDERS’ EQUITY | | $ | 823,046 | | $ | 820,084 | |
The accompanying notes are an integral part of consolidated financial statements.
40
FIRST FARMERS AND MERCHANTS CORPORATION AND SUBSIDIARIES
CONSOLIDATED STATEMENTS OF INCOME
| | Years Ended December 31, | |
(Dollars in Thousands, Except Per Share Data) | | 2007 | | 2006 | | 2005 | |
| | | | | | | |
INTEREST & DIVIDEND INCOME | | | | | | | |
Interest and fees on loans | | $ | 33,238 | | $ | 31,246 | | $ | 27,038 | |
Income on investment securities | | | | | | | |
Taxable interest | | 5,327 | | 6,345 | | 8,443 | |
Exempt from federal income tax | | 3,913 | | 4,221 | | 3,266 | |
Dividends | | 206 | | 180 | | 137 | |
| | 9,446 | | 10,746 | | 11,846 | |
Other interest income | | 1,003 | | 445 | | 222 | |
TOTAL INTEREST INCOME | | 43,687 | | 42,437 | | 39,106 | |
| | | | | | | |
INTEREST EXPENSE | | | | | | | |
Interest on deposits | | 15,870 | | 13,339 | | 9,736 | |
Interest on other short term borrowings | | 153 | | 449 | | 162 | |
TOTAL INTEREST EXPENSE | | 16,023 | | 13,788 | | 9,898 | |
NET INTEREST INCOME | | 27,664 | | 28,649 | | 29,208 | |
| | | | | | | |
PROVISION FOR POSSIBLE LOAN LOSSES (RECOVERIES) NET | | — | | (636 | ) | (890 | ) |
NET INTEREST INCOME AFTER PROVISION FOR LOAN LOSSES (RECOVERIES) | | 27,664 | | 29,285 | | 30,098 | |
| | | | | | | |
NONINTEREST INCOME | | | | | | | |
Trust department income | | 2,621 | | 2,322 | | 2,220 | |
Service fees on deposit accounts | | 7,640 | | 7,739 | | 7,208 | |
Other fees and commissions | | 589 | | 424 | | 372 | |
Other operating income | | 905 | | 751 | | 1,018 | |
Securities gains | | — | | 51 | | 513 | |
TOTAL NONINTEREST INCOME | | 11,755 | | 11,287 | | 11,331 | |
| | | | | | | |
NONINTEREST EXPENSE | | | | | | | |
Salaries and employee benefits | | 15,192 | | 16,918 | | 16,447 | |
Net occupancy expense | | 2,374 | | 2,143 | | 2,353 | |
Furniture and equipment expense | | 1,089 | | 1,138 | | 1,220 | |
Other operating expenses | | 10,023 | | 10,547 | | 10,076 | |
TOTAL NONINTEREST EXPENSES | | 28,678 | | 30,746 | | 30,096 | |
INCOME BEFORE PROVISION FOR INCOME TAXES | | 10,741 | | 9,826 | | 11,333 | |
PROVISION FOR INCOME TAXES | | 2,120 | | 2,101 | | 2,881 | |
NET INCOME | | $ | 8,621 | | $ | 7,725 | | $ | 8,452 | |
BASIC EARNINGS PER SHARE | | $ | 1.51 | | $ | 1.33 | | $ | 1.45 | |
Weighted Average Shares Outstanding | | 5,727,158 | | 5,826,589 | | 5,840,000 | |
The accompanying notes are an integral part of the consolidated financial statements.
41
FIRST FARMERS AND MERCHANTS CORPORATION AND SUBSIDIARIES
CONSOLIDATED STATEMENTS OF CHANGES IN SHAREHOLDERS’ EQUITY
| | | | | | | | Accumulated | | | |
| | | | Additional | | | | Other | | | |
(Dollars In Thousands, Except Per Share Data) | | Common | | Paid-in | | Retained | | Comprehensive | | | |
Years Ended December 31, 2007, 2006, and 2005 | | Stock | | Capital | | Earnings | | Income (Loss) | | Total | |
| | | | | | | | | | | |
BALANCE AT JANUARY 1, 2005 | | $ | 58,400 | | $ | 4,320 | | $ | 37,742 | | $ | 560 | | $ | 101,022 | |
| | | | | | | | | | | |
Comprehensive income | | | | | | | | | | | |
Net income - Restated | | | | | | 8,452 | | | | 8,452 | |
Change in net unrealized loss on securities available-for-sale, net of reclassification adjustment and tax effects | | | | | | | | (2,723 | ) | (2,723 | ) |
Total comprehensive income | | | | | | | | | | 5,729 | |
Cash dividends declared, $0.63 per share | | | | | | (3,679 | ) | | | (3,679 | ) |
BALANCE AT DECEMBER 31, 2005 | | 58,400 | | 4,320 | | 42,515 | | (2,163 | ) | 103,072 | |
| | | | | | | | | | | |
Comprehensive income | | | | | | | | | | | |
Net income | | | | | | 7,725 | | | | 7,725 | |
Change in net unrealized loss on securities available-for-sale, net of reclassification adjustment and tax effects | | | | | | | | 908 | | 908 | |
Total comprehensive income | | | | | | | | | | 8,633 | |
Repurchase of common stock | | (800 | ) | (3,200 | ) | | | | | (4,000 | ) |
Cash dividends declared, $0.67 per share | | | | | | (3,898 | ) | | | (3,898 | ) |
BALANCE AT DECEMBER 31, 2006 | | 57,600 | | 1,120 | | 46,342 | | (1,255 | ) | 103,807 | |
Comprehensive income | | | | | | | | | | | |
Net income | | | | | | 8,621 | | | | 8,621 | |
Change in net unrealized gain on securities available-for-sale, net of reclassification adjustment and tax effects | | | | | | | | 1,783 | | 1,783 | |
Total comprehensive income | | | | | | | | | | 10,404 | |
Repurchase of common stock | | (800 | ) | (1,120 | ) | (2,080 | ) | | | (4,000 | ) |
Cash dividends declared, $0.695 per share | | | | | | (3,967 | ) | | | (3,967 | ) |
BALANCE AT DECEMBER 31, 2007 | | $ | 56,800 | | $ | — | | $ | 48,916 | | $ | 528 | | $ | 106,244 | |
The accompanying notes are an integral part of the consolidated financial statements.
42
FIRST FARM ERS AND MERCHANTS CORPORATION AND SUBSIDIARIES
CONSOLIDATED STATEMENTS OF CASH FLOWS
| | Years ended December 31, | |
(Dollars in Thousands) | | 2007 | | 2006 | | 2005 | |
| | | |
OPERATING ACTIVITIES | | | | | | | |
Net income | | $ | 8,621 | | $ | 7,725 | | $ | 8,452 | |
Adjustments to reconcile net income to net cash provided by operating activities | | | | | | | |
Excess (deficiency) of provision for possible loan losses over net charge-offs | | 119 | | (532 | ) | (715 | ) |
Provision for depreciation and amortization of premises and equipment | | 1,065 | | 1,119 | | 1,268 | |
Securities gains | | — | | (51 | ) | (513 | ) |
Loss from real estate contributed to government organization | | — | | 22 | | — | |
Amortization of deposit base intangibles | | 556 | | 1,056 | | 1,056 | |
Amortization of investment security premiums, net of accretion of discounts | | 589 | | 1,072 | | 2,119 | |
Increase in cash surrender value of life insurance contracts | | (427 | ) | (408 | ) | (566 | ) |
(Increase) decrease in Deferred income taxes | | 245 | | (262 | ) | (120 | ) |
Interest receivable | | 61 | | 575 | | 143 | |
Other assets | | (441 | ) | (5 | ) | 763 | |
Increase (decrease) in | | | | | | | |
Interest payable | | (80 | ) | 896 | | 699 | |
Other liabilities | | 445 | | 847 | | 200 | |
Total adjustments | | 2,132 | | 4,329 | | 4,334 | |
Net cash provided by operating activities | | 10,753 | | 12,054 | | 12,786 | |
| | | | | | | |
INVESTING ACTIVITIES | | | | | | | |
Proceeds from maturities, calls, and sales of available-for-sale securities | | 54,249 | | 65,854 | | 92,564 | |
Proceeds from maturities and calls of held-to-maturity securities | | 5,556 | | 8,483 | | 11,161 | |
Purchases of investment securities | | | | | | | |
Available-for-sale | | (68,737 | ) | (20,365 | ) | (63,632 | ) |
Held-to-maturity | | — | | — | | (24,832 | ) |
Net increase in loans | | (26,790 | ) | (13,456 | ) | (10,844 | ) |
Proceeds from sale of assets | | — | | 45 | | — | |
Cash paid for single premium universal life insurance policies | | (1,410 | ) | (2,757 | ) | (254 | ) |
Purchases of premises and equipment | | (4,943 | ) | (379 | ) | (759 | ) |
Net cash provided by (used in) investing activities | | (42,075 | ) | 37,425 | | 3,404 | |
| | | | | | | |
FINANCING ACTIVITIES | | | | | | | |
Net increase (decrease) in noninterest-bearing and interest-bearing deposits | | (3 | ) | 15,374 | | (10,267 | ) |
Net increase (decrease) in short term borrowings | | 68 | | (10,614 | ) | 3,926 | |
Proceeds from sale of minority interest in a consolidated subsidiary | | 95 | | — | | — | |
Repurchase of common stock | | (4,000 | ) | (4,000 | ) | — | |
Cash dividends | | (3,946 | ) | (3,796 | ) | (3,562 | ) |
Net cash used in financing activities | | (7,786 | ) | (3,036 | ) | (9,903 | ) |
Increase (decrease) in cash and cash equivalents | | (39,108 | ) | 46,443 | | 6,287 | |
Cash and cash equivalents at beginning of period | | 74,981 | | 28,538 | | 22,251 | |
Cash and cash equivalents at end of period | | $ | 35,873 | | $ | 74,981 | | $ | 28,538 | |
Suplemental disclosures of cash flow information | | | | | | | |
Cash paid during the period for expenses | | | | | | | |
Interest on deposits and borrowed funds | | $ | 16,103 | | $ | 12,891 | | $ | 9,199 | |
Income Taxes | | 2,015 | | 2,332 | | 2,759 | |
Land and building transferred from premises and equipment to other assets held for sale | | $ | — | | $ | 684 | | $ | — | |
The accompanying notes are an integral part of the consolidated financial statements.
43
FIRST FARMERS AND MERCHANTS CORPORATION AND SUBSIDIARIES
NOTES TO CONSOLIDATED FINANCIAL STATEMENTS
NOTE 1 - GENERAL AND SUMMARY OF SIGNIFICANT ACCOUNTING POLICIES
Accounting Policies
The accounting principles followed and the methods of applying those principles conform with accounting principles generally accepted in the United States (“GAAP”) and to general practices in the banking industry. The significant accounting policies applicable to First Farmers and Merchants Corporation (the “Corporation”) are summarized as follows.
Principles of Consolidation
The accompanying consolidated financial statements present the accounts of the Corporation and its wholly-owned subsidiary, First Farmers and Merchants Bank (the “Bank”). The Bank has direct and indirect subsidiaries through which it holds F & M West, Inc., Maury Tenn, Inc., and Maury Tenn Properties, Inc. Minority interest consists of preferred shares in Maury Tenn Properties, Inc. The preferred shares receive dividends, which are included in other operating expense. Material intercompany accounts and transactions have been eliminated in consolidation.
Subsidiary Charter
The Corporation’s subsidiary Bank received regulatory approval to convert its national charter to a state charter, effective as of July 5, 2005. On that date, the Bank converted to a Tennessee state-chartered bank and its name changed from First Farmers and Merchants National Bank to First Farmers and Merchants Bank.
Use of Estimates in the Preparation of Financial Statements
The preparation of financial statements in conformity with GAAP requires management of the Corporation and the Bank to make estimates and assumptions that affect the reported amounts of assets and liabilities. Those estimates and assumptions also affect disclosure of contingent assets and liabilities at the date of the financial statements and the reported amounts of revenues and expenses during the reporting period. Actual results could differ from those estimates. Material estimates that are particularly susceptible to significant change in the near-term relate to the determination of the allowance for loan losses, the valuation of foreclosed real estate, deferred tax assets and the liability related to post retirement benefits.
Significant Group Concentrations of Credit Risk
Most of the Bank’s activities are with customers located within its service area, which is comprised of Maury, Lawrence, Marshall, Hickman, Dickson, Giles, Williamson and adjacent counties in southern middle Tennessee. Approximately 80.8% of the Bank’s loans were made to customers in the Maury and Lawrence county markets as of December 31, 2007. Maury County is the source of 55.9% of the Bank’s loan portfolio, including most of the Bank’s participation and out-of-territory loans. Note 3 discusses the types of securities in which the Bank invests. Note 4 discusses the types of lending in which the Bank engages. First mortgage loans secured by one-to-four family residential properties make up 36.6% of the total loan portfolio. This represents the largest component of the real estate secured loans. Management of the Bank recognizes this concentration and believes the risk is acceptable given the quality of underwriting, current market conditions and historical loss experience.
44
FIRST FARMERS AND MERCHANTS CORPORATION AND SUBSIDIARIES
NOTES TO CONSOLIDATED FINANCIAL STATEMENTS
NOTE 1-GENERAL AND SUMMARY OF SIGNIFICANT ACCOUNTING POLICIES (Continued)
The loans secured by non-farm/non-residential real estate comprise 20.5% of the loan portfolio. The majority of the growth has been in the owner-occupied segment of this portfolio. The loan segment type is classified as “true” commercial real estate – loans whose repayment is dependent upon rental income or the sale, refinancing or permanent financing of the underlying property. The Bank’s risk is geographically dispersed and continues to be well diversified across several property types with no areas of excessive exposure.
Current commercial real estate loan stratification reports indicate that the commercial construction and development portfolio remains well diversified with an acceptable level of speculative exposure. Of the loans secured by commercial type real estate, 42.8% are in the owner-occupied category.
The Bank continues to monitor and manage its exposure to single borrowing entities and its exposure to groups of borrowers within the same industry. Within the commercial loan portfolio, the Bank continues to report heavy exposure in five broad industry categories: Construction, Manufacturing, Real Estate and Rental Leasing, Public Administration, and Other Services (except public administration).
Cash and Due From Banks
Included in cash and due from banks are reserve amounts that are legally required to be maintained on an average balance in the form of cash and balances due from the Federal Reserve Bank and other banks. At December 31, 2007, the Bank was required to maintain approximately $3.4 million at the Federal Reserve. Interest-bearing deposits in banks mature within one year and are carried at cost. From time to time throughout the year, the Bank’s balances due from other financial institutions exceeded Federal Deposit Insurance Corporation insurance limits. Management considers this to be a normal business risk.
Cash Equivalents
Cash equivalents include cash on hand, cash due from banks and federal funds sold. Federal funds are sold for one-day periods. Interest-bearing deposits in banks included in cash equivalents mature within 90 days.
Securities
Trading account securities that are bought and held principally for the purpose of selling them in the near term are carried at market value. Gains and losses, both realized and unrealized, are included in other operating income. There were no securities classified as trading in 2007 or 2006.
Debt securities that the Bank has the positive intent and ability to hold to maturity are classified as held-to-maturity and reported at amortized cost. Securities not classified as held-to-maturity or trading, including equity securities with readily determinable fair values, are classified as available-for-sale. These securities are reported at fair value, with unrealized gains and losses, net of deferred tax, excluded from earnings and are reported in other comprehensive income.
Purchase premiums and discounts are recognized in interest income using the interest method over the terms of the securities. Declines in the fair value of individual available-for-sale and held-to-maturity securities below their cost that are other than temporary are included in earnings as realized losses. In estimating other-than-temporary impairment losses, management considers (1) the length of time and the extent to which the fair value has been less than cost, (2) the financial condition and near-term prospects of the issuer, and (3) the intent and ability of the Bank to retain its investment in the issuer for a period of time sufficient to allow for any anticipated recovery in fair value. Gains and losses on the sales of securities are recorded on the trade date and are determined using the specific identification method.
45
FIRST FARMERS AND MERCHANTS CORPORATION AND SUBSIDIARIES
NOTES TO CONSOLIDATED FINANCIAL STATEMENTS
NOTE 1-GENERAL AND SUMMARY OF SIGNIFICANT ACCOUNTING POLICIES (Continued)
Loans
The Bank grants mortgage, commercial and consumer loans to customers. Loans that management has the intent and ability to hold for the foreseeable future or until maturity or payoff generally are stated at their outstanding unpaid principal balances, net of any deferred fees or costs on originated loans, or unamortized premiums or discounts on purchased loans.
Interest on loans is accrued daily. Loan origination fees and related direct costs are deferred and recognized ratably over the life of the loan as an adjustment of yield. Interest accruals are discontinued when loans are 90 days past due or when interest is not expected to be collected. Interest income previously accrued on such loans is reversed against current period interest income. Interest income on loans in nonaccrual status is recognized only to the extent of the excess of cash payments received over principal payments due.
Allowance for Possible Loan Losses
The allowance for possible loan losses is established through provisions for loan losses charged against income. Loan losses are charged against the allowance when management determines that the uncollectibility of a loan has been confirmed. Subsequent recoveries, if any, are credited to the allowance account in the period received.
The adequacy of the allowance for possible loan losses is evaluated quarterly in conjunction with loan review reports and evaluations that are discussed in meetings with loan officers, credit administration and the Bank’s Board of Directors. The Bank’s past loan loss experience, known and inherent risks in the portfolio, adverse situations that may affect a borrower’s ability to repay (including the timing of future payments), the estimated value of any underlying collateral, composition of the loan portfolio, current economic conditions and other relevant factors are considered in this evaluation. This process is inherently subjective as it requires material estimates that are susceptible to significant change, including the amounts and timing of future cash flows expected to be received on impaired loans. The allowance for possible loan losses is maintained at a level believed adequate by management to absorb estimated losses inherent in the loan portfolio.
A loan is considered impaired when it is probable that the Bank will be unable to collect all amounts due (principal and interest) according to the contractual terms of the loan agreement. Factors considered by management in determining impairment include payment status, collateral value and the probability of collecting scheduled principal and interest payments when due. Loans that experience insignificant payment delays and payment shortfalls generally are not classified as impaired. Management determines the significance of payment delays and payment shortfalls on a case-by-case basis, taking into consideration all of the circumstances surrounding the loan and the borrower, including the length of the delay, the reasons for the delay, the borrower’s prior payment record and the amount of the shortfall in relation to the principal and interest owed.
Impairment is measured on a loan-by-loan basis for commercial and construction loans by either the present value of expected future cash flows discounted at the loan’s effective interest rate, the loan’s obtainable market price, or the fair value of the collateral if the loan is collateral dependent. The Bank evaluates smaller-balance homogeneous loans collectively for impairment. Loans secured by one to four family residential properties, consumer installment loans and line of credit loans are considered smaller-balance homogeneous loans.
46
FIRST FARMERS AND MERCHANTS CORPORATION AND SUBSIDIARIES
NOTES TO CONSOLIDATED FINANCIAL STATEMENTS
NOTE 1-GENERAL AND SUMMARY OF SIGNIFICANT ACCOUNTING POLICIES (Continued)
Other Real Estate
Other real estate, which is included in other assets, represents real estate acquired through foreclosure and is stated at the lower of fair value, net of estimated selling costs, or cost, at the date of foreclosure. If, at the time of foreclosure, the fair value of the real estate is less than the Bank’s carrying value of the related loan, a write-down is recognized through a charge to the allowance for possible loan losses, and the fair value becomes the new cost for subsequent accounting. If the Bank later determines that the cost of the property cannot be recovered through sale or use, a write-down is recognized by a charge to operations.
When a property is not in a condition suitable for sale or use at the time of foreclosure, completion and holding costs, including such items as real estate taxes, maintenance and insurance, are capitalized up to the estimated net realizable value of the property. However, when a property is in a condition for sale or use at the time of foreclosure, or the property is already carried at its estimated net realizable value, any subsequent holding costs are expensed.
Legal fees and any other direct costs relating to foreclosures are charged to operations when incurred. The Bank had $22,000 in other real estate at December 31, 2007, and had none at December 31, 2006. Properties that were included in other real estate were sold at a gain of $3,000 during 2007, which is included in other operating income. Losses of $24,000 and $51,000 were realized on sales of other real estate during 2006 and 2005, respectively.
Premises and Equipment
Premises and equipment are stated at cost, less accumulated depreciation and amortization. The provision for depreciation is computed principally on an accelerated method over the estimated useful life of an asset, which ranges from 15 to 50 years for buildings and from three to 33 years for equipment. Costs of major additions and improvements are capitalized. Expenditures for maintenance and repairs are charged to operations as incurred. Gains or losses from the disposition of property are reflected in operations, and the asset accounts and related allowances for depreciation are reduced.
Servicing
Loans serviced for others are not included in the accompanying consolidated balance sheets. The unpaid principal balances of mortgage and other loans serviced for others were $12.5 million and $8.0 million at December 31, 2007 and 2006, respectively. The present value of servicing income is expected to approximate an adequate compensation cost for servicing these loans. Therefore, no servicing asset has been recorded.
Income Taxes
The Corporation and the Bank file a consolidated federal income tax return. Deferred income taxes are provided using the liability method whereby deferred tax assets are recognized for deductible temporary differences and operating loss and tax credit carry-forwards and deferred tax liabilities are recognized for taxable temporary differences. Temporary differences are the differences between the reported amounts of assets and liabilities and their tax bases. Deferred tax assets are reduced by a valuation allowance when, in the opinion of management, it is more likely than not that some portion or all of the deferred tax assets will not be realized. Deferred tax assets and liabilities are adjusted for the effects of the changes in tax laws and rates of the date of enactment.
47
FIRST FARMERS AND MERCHANTS CORPORATION AND SUBSIDIARIES
NOTES TO CONSOLIDATED FINANCIAL STATEMENTS
NOTE 1-GENERAL AND SUMMARY OF SIGNIFICANT ACCOUNTING POLICIES (Continued)
When tax returns are filed, it is highly certain that some positions taken would be sustained upon examination by the taxing authorities, while others are subject to uncertainty about the merits of the position taken or the amount of the position that would be ultimately sustained. The benefit of a tax position is recognized in the financial statements in the period during which, based on all available evidence, management believes it is more likely than not that the position will be sustained upon examination, including the resolution of appeals or litigation processes, if any. Tax positions taken are not offset or aggregated with other positions. Tax positions that meet the more-likely-than-not recognition threshold are measured as the largest amount of tax benefit that is more than 50 percent likely of being realized upon settlement with the applicable taxing authority. The portion of the benefits associated with tax positions taken that exceeds the amount measured as described above is reflected as a liability for unrecognized tax benefits in the accompanying balance sheet along with any associated interest and penalties that would be payable to the taxing authorities upon examination.
Interest and penalties associated with unrecognized tax benefits are classified as additional income taxes in the statement of income.
Trust Department Income
Trust department income is recognized on the accrual basis in the applicable period earned.
Earnings Per Share
Basic earnings per share represent income available to shareholders divided by the weighted average number of shares of common stock outstanding during the period. Diluted earnings per share reflect additional shares of common stock that would have been outstanding if potentially dilutive shares of common stock had been issued, as well as any adjustment to income that would result from the assumed conversion. For the years ended December 31, 2007, 2006 and 2005, there were no potentially dilutive shares of common stock issuable.
Comprehensive Income
Accounting principles generally require that recognized revenue, expenses, gains and losses be included in net income. Although certain changes in assets and liabilities, such as unrealized gains and losses on available-for-sale securities, are reported as a separate component of the equity section of the balance sheet, such items, along with net income, are components of comprehensive income. A schedule of other comprehensive income is shown in the following table (dollars in thousands):
| | Years Ended December 31, | |
| | 2007 | | 2006 | | 2005 | |
| | | | | | | |
Unrealized holding gains (losses) on available-for-sale securities | | $ | 2,898 | | $ | 1,528 | | $ | (3,916 | ) |
| | | | | | | |
Reclassification adjustment for gains realized in income | | — | | (51 | ) | (513 | ) |
| | | | | | | |
Tax effect - (expense) benefit | | (1,115 | ) | (569 | ) | 1,706 | |
| | | | | | | |
Other comprehensive income (loss) | | $ | 1,783 | | $ | 908 | | $ | (2,723 | ) |
48
FIRST FARMERS AND MERCHANTS CORPORATION AND SUBSIDIARIES
NOTES TO CONSOLIDATED FINANCIAL STATEMENTS
NOTE 1-GENERAL AND SUMMARY OF SIGNIFICANT ACCOUNTING POLICIES (Continued)
Intangible Assets
Goodwill is accounted for in accordance with Statement of Financial Accounting Standards No. 142, Goodwill and Other Intangible Assets (“SFAS 142”), which addresses the financial accounting and reporting for acquired goodwill and other intangible assets with indefinite lives. Pursuant to SFAS 142, intangible assets must be periodically tested for impairment. The Bank completed its impairment review during 2007, which indicated that there was no impairment. Deposit base intangibles are amortized using the straight-line method over their estimated useful lives of 72 to 180 months. Total amortization expense charged to operations amounted to $0.556 million, in 2007, $1.056 million in 2006 and $1.056 million in 2005.
Segment Reporting
Segments are strategic business units that offer different products and services and are managed separately. At December 31, 2007, the Corporation and the Bank did not have any identified segments.
Recent Accounting Pronouncements
In September 2006, the Financial Accounting Standards Board (“FASB”) issued Statement of Financial Accounting Standards No. 157 (FAS-157), Fair Value Measurements. FAS-157 defines fair value, establishes a framework for measuring fair value in accordance with general accepted accounting principles, and expands disclosures about fair value measurements. The provisions of FAS-157 are effective for the Corporation for fiscal years beginning after November 15, 2007.
In February 2007, the Financial Accounting Standards Board (“FASB”) issued Statement of Financial Accounting Standards No. 159 (FAS-159), The Fair Value Option for Financial Assets and Financial Liabilities – Including an Amendment of FASB Statement No. 115. The fair value option established by FAS-159 permits all entities to choose to measure eligible items at fair value at the specified election dates. A business entity will report unrealized gain and losses on items for which the fair value option has been elected in earnings at each subsequent reporting date. FAS-159 is effective for the Company for fiscal years beginning after November 15, 2007. Management chose not to utilize this option for 2007.
In December 2007, the Financial Accounting Standards Board (“FASB”) issued Statement of Financial Accounting Standards No. 160 (FAS-160), Noncontrolling Interests in Consolidated Financial Statements – An amendment of ARB No. 51. FAS-160 establishes new accounting and reporting standards for a parent company’s noncontrolling interest in a subsidiary and for the deconsolidation of a subsidiary. Specifically, this statement requires the recognition of a noncontrolling interest (minority interest) as equity in the consolidated financial statements, which is reported separate from the parent’s equity. The amount of net income attributable to the noncontrolling interest will be included in consolidated net income on the face of the income statement. FAS-160 clarifies that changes in a parent’s ownership interest in a subsidiary, which do not result in deconsolidation, are equity transactions if the parent retains its controlling financial interest. In addition, this statement requires that a parent recognize a gain or loss in results of operations when a subsidiary is deconsolidated. Such gain or loss will be measured using the fair value of the noncontrolling equity investment at the deconsolidation date. FAS-160 is effective for fiscal years, and interim periods within those fiscal years, beginning on or after December 15, 2008. Management is currently evaluating the impact, if any, of the adoption of these pronouncements on the financial statements.
49
FIRST FARMERS AND MERCHANTS CORPORATION AND SUBSIDIARIES
NOTES TO CONSOLIDATED FINANCIAL STATEMENTS
NOTE 2 – SECURITIES
Securities with an amortized cost of $73.918 million and $108.053 million at December 31, 2007 and 2006, respectively (fair value of $74.476 million at December 31, 2007 and $106.122 million at December 31, 2006), were pledged to secure deposits and for other purposes as required or permitted by law. The fair value is established by an independent pricing service as of the approximate dates indicated. The differences between the amortized cost and fair value reflect current interest rates and represent the potential gain (or loss) if the portfolio had been liquidated on that date. Security gains (or losses) are realized only in the event of dispositions prior to maturity.
The amortized cost and fair value of securities available-for-sale and held to maturity at December 31, 2007 and 2006 are summarized as follows (dollars in thousands):
| | Amortized | | Gross Unrealized | | Fair | |
| | Cost | | Gains | | Losses | | Value | |
December 31, 2007 | | | | | | | | | |
Available-for-sale securities | | | | | | | | | |
U.S. treasury | | $ | 3,117 | | $ | 19 | | $ | — | | $ | 3,136 | |
U.S. Government agencies | | 97,871 | | 901 | | 123 | | 98,649 | |
Mortgage backed securities | | 23,771 | | 82 | | — | | 23,853 | |
States and political subdivisions | | 31,056 | | 103 | | 175 | | 30,984 | |
Other securities | | 7,235 | | 63 | | 9 | | 7,289 | |
| | | | | | | | | |
| | $ | 163,050 | | $ | 1,168 | | $ | 307 | | $ | 163,911 | |
| | | | | | | | | |
Held-to-maturity securities | | | | | | | | | |
U.S. Government agencies | | $ | 6,221 | | $ | 22 | | $ | 3 | | $ | 6,240 | |
States and political subdivisions | | 65,392 | | 902 | | 89 | | 66,205 | |
Other securities | | 3,952 | | 63 | | — | | 4,015 | |
| | | | | | | | | |
| | $ | 75,565 | | $ | 987 | | $ | 92 | | $ | 76,460 | |
| | | | | | | | | |
December 31, 2006 | | | | | | | | | |
Available-for-sale securities | | | | | | | | | |
U.S. treasury | | $ | 4,185 | | $ | — | | $ | 86 | | $ | 4,099 | |
U.S. Government agencies | | 117,459 | | 7 | | 1,842 | | 115,624 | |
Mortgage backed securities | | 252 | | 1 | | — | | 253 | |
States and political subdivisions | | 24,101 | | 47 | | 166 | | 23,982 | |
Other securities | | 3,043 | | — | | — | | 3,043 | |
| | | | | | | | | |
| | $ | 149,040 | | $ | 55 | | $ | 2,094 | | $ | 147,001 | |
| | | | | | | | | |
Held-to-maturity securities | | | | | | | | | |
U.S. Government agencies | | $ | 6,356 | | $ | — | | $ | 119 | | $ | 6,237 | |
States and political subdivisions | | 70,960 | | 1,066 | | 209 | | 71,817 | |
Other securities | | 3,931 | | 124 | | — | | 4,055 | |
| | | | | | | | | |
| | $ | 81,247 | | $ | 1,190 | | $ | 328 | | $ | 82,109 | |
At December 31, 2007, the Bank did not hold investment securities of any single issuer, other than obligations of the U.S. Treasury and other U.S. government agencies, whose aggregate book value exceeded ten percent of shareholders’ equity.
50
FIRST FARMERS AND MERCHANTS CORPORATION AND SUBSIDIARIES
NOTES TO CONSOLIDATED FINANCIAL STATEMENTS
NOTE 2 – SECURITIES (Continued)
Proceeds from the maturity, call or sale of available-for-sale securities were $54,249,000, $65,854,000 and $92,564,000 during 2007, 2006 and 2005, respectively. Proceeds from the maturity or call of held-to-maturity securities were $5,556,000, $8,483,000 and $11,161,000 during 2007, 2006 and 2005, respectively.
The fair values of all securities at December 31, 2007 either equaled or exceeded the cost of those securities, or the decline in fair value is considered temporary. The information in the table below classifies the investments with unrealized losses at December 31, 2007 according to the term of the unrealized loss. Management evaluates securities for other-than-temporary impairment periodically, or more frequently when circumstances require an evaluation. An impairment judgment is based on (a) the amount of time and loss, (b) the financial condition of the issuer, and (c) the Bank’s intent and ability to hold the investment long enough for any anticipated recovery in value.
The following table presents the Bank’s investments with unrealized losses at December 31, 2007 and 2006 according to the term of the unrealized loss (dollars in thousands):
| | Less than 12 months | | 12 months or Greater | | Total | |
| | Fair | | Unrealized | | Fair | | Unrealized | | Fair | | Unrealized | |
2007 | | Value | | Losses | | Value | | Losses | | Value | | Losses | |
Type of Security | | | | | | | | | | | | | |
U.S. Treasury | | $ | — | | $ | — | | $ | — | | $ | — | | $ | — | | $ | — | |
U.S. government agencies | | 3,031 | | 3 | | 33,499 | | 123 | | 36,530 | | 126 | |
States and political subdivisions | | 3,040 | | 34 | | 22,197 | | 230 | | 25,237 | | 264 | |
Corporate Bonds | | 936 | | 9 | | — | | — | | 936 | | 9 | |
| | $ | 7,007 | | $ | 46 | | $ | 55,696 | | $ | 353 | | $ | 62,703 | | $ | 399 | |
| | Less than 12 months | | 12 months or Greater | | Total | |
| | Fair | | Unrealized | | Fair | | Unrealized | | Fair | | Unrealized | |
2006 | | Value | | Losses | | Value | | Losses | | Value | | Losses | |
Type of Security | | | | | | | | | | | | | |
U.S. Treasury | | $ | 998 | | $ | 1 | | $ | 3,101 | | $ | 85 | | $ | 4,099 | | $ | 86 | |
U.S. government agencies | | 112 | | — | | 113,865 | | 1,961 | | 113,977 | | 1,961 | |
States and political subdivisions | | 7,087 | | 66 | | 26,152 | | 309 | | 33,239 | | 375 | |
| | $ | 8,197 | | $ | 67 | | $ | 143,118 | | $ | 2,355 | | $ | 151,315 | | $ | 2,422 | |
At December 31, 2007, four of 33 U.S. government agency securities had recorded unrealized losses for a period longer than 12 months. The amortized cost of all U.S. government agency securities and mortgage backed securities was $127.9 million compared to a fair value of $128.7 million. As these securities declined in value when interest rates began to rise, and not because of the credit quality of the issuer, and because the Bank had both the intent and ability to hold the investments, the securities were not considered other-han-emporarily impaired.
51
FIRST FARMERS AND MERCHANTS CORPORATION AND SUBSIDIARIES
NOTES TO CONSOLIDATED FINANCIAL STATEMENTS
NOTE 2 – SECURITIES (Continued)
The table below shows the amortized cost, fair value and weighted yields (for tax-xempt obligations on a fully taxable basis assuming a 34% tax rate) of investment securities at December 31, 2007 by contractual or legal maturity. Expected maturities may differ from contractual maturities because issuers may have the right to call or prepay obligations.
| | Amortized | | Fair | | Yield | |
(Dollars in Thousands) | | Cost | | Value | | (Unaudited) | |
Available-for-sale securities | | | | | | | |
U.S. Treasury | | | | | | | |
After one but within five years | | $ | 3,117 | | $ | 3,136 | | 3.5 | % |
U.S. government agencies | | | | | | | |
Within one year | | 20,001 | | 19,930 | | 3.5 | % |
After one but within five years | | 52,651 | | 53,252 | | 4.4 | % |
After five but within ten years | | 25,219 | | 25,467 | | 5.1 | % |
Mortgage backed securities | | | | | | | |
Within one year | | 24 | | 24 | | 7.9 | % |
After one but within five years | | 5,699 | | 5,731 | | 5.5 | % |
After five but within ten years | | 13,048 | | 13,098 | | 5.4 | % |
After ten years | | 5,000 | | 5,000 | | 5.5 | % |
States and political subdivisions | | | | | | | |
After one but within five years | | 647 | | 673 | | 7.7 | % |
After five but within ten years | | 1,920 | | 1,954 | | 5.8 | % |
After ten years | | 28,489 | | 28,357 | | 6.1 | % |
Other securities | | | | | | | |
After one but within five years | | 2,722 | | 2,764 | | 5.2 | % |
After five but within ten years | | 1,427 | | 1,439 | | 5.4 | % |
After ten years | | 3,086 | | 3,086 | | 0.9 | % |
| | $ | 163,050 | | $ | 163,911 | | | |
Held-to-maturity securities | | | | | | | |
U.S. government agencies | | | | | | | |
Within one year | | $ | 3,034 | | $ | 3,031 | | 4.1 | % |
After one but within five years | | 3,187 | | 3,209 | | 4.0 | % |
States and political subdivisions | | | | | | | |
Within one year | | 5,334 | | 5,358 | | 7.0 | % |
After one but within five years | | 17,394 | | 17,749 | | 7.0 | % |
After five but within ten years | | 18,245 | | 18,523 | | 6.2 | % |
After ten years | | 24,419 | | 24,575 | | 6.2 | % |
Other securities | | | | | | | |
Within one year | | 3,444 | | 3,492 | | 7.3 | % |
After one but within five years | | 508 | | 523 | | 7.0 | % |
| | $ | 75,565 | | $ | 76,460 | | | |
52
FIRST FARMERS AND MERCHANTS CORPORATION AND SUBSIDIARIES
NOTES TO CONSOLIDATED FINANCIAL STATEMENTS
NOTE 3 - LOANS
The following table presents the Bank’s loans by category as of December 31, 2007 and 2006 (dollars in thousands):
| | 2007 | | 2006 | |
Commercial, financial and agricultural | | $ | 67,336 | | $ | 53,293 | |
Tax exempt municipal loans | | 20,589 | | 22,978 | |
Real estate | | | | | |
Construction | | 35,948 | | 22,135 | |
Commercial mortgages | | 103,325 | | 100,435 | |
Residential mortgages | | 217,991 | | 218,242 | |
Other | | 32,768 | | 32,124 | |
Retail loans | | 21,926 | | 23,737 | |
Lease financing receivables | | 574 | | 712 | |
| | 500,457 | | 473,655 | |
Less: | | | | | |
Net unamortized loan origination fees | | (314 | ) | (303 | ) |
Allowance for possible loan losses | | (7,381 | ) | (7,262 | ) |
Total net loans | | $ | 492,762 | | $ | 466,090 | |
The following table presents the maturities of the Bank’s loans by category as of December 31, 2007 (dollars in thousands):
| | Within | | One to | | After | | | |
| | One Year | | Five Years | | Five Years | | Total | |
Commercial, financial and agricultural | | $ | 30,137 | | $ | 27,016 | | $ | 10,183 | | $ | 67,336 | |
Tax exempt municipal loans | | 1,809 | | 4,921 | | 13,859 | | 20,589 | |
Real estate | | | | | | | | | |
Construction | | 22,569 | | 6,027 | | 7,352 | | 35,948 | |
Commercial mortgages | | 26,335 | | 36,293 | | 40,697 | | 103,325 | |
Residential mortgages | | 79,614 | | 71,951 | | 66,426 | | 217,991 | |
Other | | 6,256 | | 9,347 | | 17,165 | | 32,768 | |
Retail loans | | 12,563 | | 9,332 | | 31 | | 21,926 | |
Lease financing receivables | | 92 | | 481 | | — | | 574 | |
Total | | $ | 179,376 | | $ | 165,368 | | $ | 155,713 | | $ | 500,457 | |
Loans having recorded investments of $2.318 million at December 31, 2007, have been identified as impaired and are not accruing interest. The total allowance for possible loan losses related to these loans was approximately $348,000. Impaired loans had recorded investments of�� $1.954 million at December 31, 2006, with approximately $293,000 of the allowance for possible loan losses related to these loans. Interest received on impaired loans during 2007 was approximately $135,000, during 2006 was approximately $122,000 and during 2005 was approximately $136,000.
Certain related parties (primarily directors and senior officers of the Corporation or the Bank, including their affiliates, families and companies in which they hold ten percent or more ownership) were customers of, and had loans and other transactions with, the Bank in the ordinary course of business. An analysis of the activity with respect to such loans for the years ended December 31, 2007 and 2006 is shown in the table below (dollars in thousands). These totals exclude loans made in the ordinary course of business to other companies with which neither the Corporation nor the Bank had a relationship other than the association of one of its directors in the capacity of officer or director. These loan transactions were made on substantially the same terms as those prevailing at the time for comparable loans to other persons.
53
FIRST FARMERS AND MERCHANTS CORPORATION AND SUBSIDIARIES
NOTES TO CONSOLIDATED FINANCIAL STATEMENTS
NOTE 3 - LOANS (Continued)
They did not involve more than the normal risk of collectibility or present other unfavorable features. No related party loans were charged off in 2007 or 2006.
Aggregate of Certain Related Party Loans | |
| |
| | 2007 | | 2006 | |
Balance at Beginning of Year | | $ | 3,297 | | $ | 3,778 | |
Additions | | 1,152 | | 569 | |
Amount Collected | | (1,486 | ) | (1,050 | ) |
Balance at End of Year | | $ | 2,963 | | $ | 3,297 | |
NOTE 4 - ALLOWANCE FOR POSSIBLE LOAN LOSSES
The following table summarizes the changes in the allowance for possible loan losses for the years ended December 31, 2007, 2006, and 2005 (dollars in thousands):
| | 2007 | | 2006 | | 2005 | |
| | | | | | | |
Balance at beginning of year | | $ | 7,262 | | $ | 7,794 | | $ | 8,509 | |
Provision (reduction) charged (credited) to operating expenses | | — | | (636 | ) | (890 | ) |
Loan losses and recoveries: | | | | | | | |
Loans charged off | | (157 | ) | (363 | ) | (551 | ) |
Recoveries on loans previously | | | | | | | |
charged off | | 276 | | 467 | | 726 | |
| | | | | | | |
Balance at end of year | | $ | 7,381 | | $ | 7,262 | | $ | 7,794 | |
NOTE 5 - BANK PREMISES AND EQUIPMENT
The following table presents the Bank’s assets by category at December 31, 2007 and 2006 (dollars in thousands):
| | 2007 | | 2006 | |
| | | | | |
Land | | $ | 5,871 | | $ | 1,661 | |
Premises | | 13,534 | | 13,383 | |
Furniture and equipment | | 7,517 | | 7,126 | |
Leasehold improvements | | 1,660 | | 1,559 | |
| | 28,582 | | 23,729 | |
Less allowance for depreciation and amortization | | (14,276 | ) | (13,301 | ) |
| | $ | 14,306 | | $ | 10,428 | |
54
FIRST FARMERS AND MERCHANTS CORPORATION AND SUBSIDIARIES
NOTES TO CONSOLIDATED FINANCIAL STATEMENTS
NOTE 5 - BANK PREMISES AND EQUIPMENT (Continued)
Annual provisions for depreciation and amortization of Bank premises and equipment totaled $1.065 million for 2007, $1.119 million for 2006 and $1.268 million for 2005. Included in premises, furniture and equipment cost and allowance for depreciation and amortization are certain fully depreciated assets totaling approximately $6.050 million at December 31, 2007. During 2006, one building with a book value of approximately $684,000 was transferred from premises and equipment to long-lived assets held for sale, which is included in other assets.
NOTE 6 - LIMITATION ON SUBSIDIARY DIVIDENDS
The Corporation’s primary source of funds with which to pay its future obligations is the receipt of dividends from its subsidiary bank. Banking regulations provide that the Bank must maintain capital sufficient to enable it to operate as a viable institution and, as a result, may limit the amount of dividends the Bank may pay without prior approval. It is management’s intention to limit the amount of dividends paid in order to maintain compliance with capital guidelines and to maintain a strong capital position in the Bank.
NOTE 7 – LEASES
Real property for four of the Bank’s office locations and certain equipment are leased under noncancelable operating leases expiring at various times through 2012. In most cases, the leases provide for one or more renewal options of five to ten years under the same or similar terms. In addition, various items of office equipment are leased under cancelable operating leases. Total rental expense incurred under all operating leases, including short-term leases with terms of less than one month, amounted to approximately $33,000, $34,000 and $35,000 for equipment leases and approximately $370,000, $277,000 and $242,000 for building leases in 2007, 2006 and 2005, respectively. Future minimum lease commitments as of December 31, 2007 under all noncancelable operating leases with initial terms of one year or more are shown in the following table (dollars in thousands):
| | Lease | |
Year | | Payments | |
| | | |
2008 | | $ | 357 | |
2009 | | 284 | |
2010 | | 253 | |
2011 | | 252 | |
2012 | | 235 | |
Total | | $ | 1,381 | |
55
FIRST FARMERS AND MERCHANTS CORPORATION AND SUBSIDIARIES
NOTES TO CONSOLIDATED FINANCIAL STATEMENTS
NOTE 8 - FEDERAL AND STATE INCOME TAXES
The following table presents components of income tax expense attributable to continuing operations for the years ended December 31, 2007, 2006 and 2005 (dollars in thousands):
| | 2007 | | 2006 | | 2005 | |
Current: | | | | | | | |
Federal | | $ | 1,832 | | $ | 1,906 | | $ | 2,272 | |
State | | 43 | | 457 | | 729 | |
Total current | | 1,875 | | 2,363 | | 3,001 | |
| | | | | | | |
Deferred: | | | | | | | |
Federal | | 400 | | (217 | ) | (99 | ) |
State | | (155 | ) | (45 | ) | (21 | ) |
Total deferred | | 245 | | (262 | ) | (120 | ) |
Total provision for income | | $ | 2,120 | | $ | 2,101 | | $ | 2,881 | |
Deferred Tax Effects of Principal Temporary Differences | | | | | | | |
| | | | | | | |
| | 2007 | | 2006 | | 2005 | |
Allowance for possible loan losses | | $ | 2,819 | | $ | 2,773 | | $ | 2,978 | |
Deferred compensation | | 1,441 | | 1,252 | | 1,128 | |
Write down of other real estate | | — | | 14 | | 14 | |
Amortization of core deposit intangible | | 1,160 | | 1,126 | | 898 | |
Recognition of nonaccrual loan income | | (33 | ) | (67 | ) | (93 | ) |
Unrealized (gains) losses on available-for-sale securities | | (331 | ) | 785 | | 1,354 | |
Deferred post retirement benefit | | 2,115 | | 2,139 | | 1,959 | |
Lease financing depreciations, net of rent | | (219 | ) | (338 | ) | (327 | ) |
Accelerated depreciation | | 8 | | (150 | ) | (150 | ) |
Amortization of goodwill | | (1,291 | ) | (1,076 | ) | (861 | ) |
Alternative Minimum Tax | | — | | 198 | | — | |
REIT dividend | | (315 | ) | — | | — | |
State net operating loss | | 132 | | — | | — | |
Other | | (745 | ) | (555 | ) | (492 | ) |
Net deferred tax asset | | $ | 4,740 | | $ | 6,101 | | $ | 6,408 | |
| | | | | | | |
Reconciliation of Total Income Taxes Reported with the Amount of Income Taxes Computed at the Federal Statutory Rate(34%Each Year) |
| | 2007 | | 2006 | | 2005 | |
Tax expense at statutory rate | | $ | 3,652 | | $ | 3,341 | | $ | 3,853 | |
Increase (decrease) in taxes resulting from: | | | | | | | |
Tax exempt interest | | (1,672 | ) | (1,782 | ) | (1,430 | ) |
Nondeductible interest expense | | 192 | | 182 | | 108 | |
Employee benefits | | (144 | ) | (137 | ) | (190 | ) |
Other nondeductible expenses | | | | | | | |
(nontaxable income) - net | | 52 | | 18 | | 21 | |
State income taxes net of federal tax benefit | | (74 | ) | 273 | | 486 | |
Dividend income exclusion | | (43 | ) | (1 | ) | (1 | ) |
Charitable contribution of real estate | | — | | (59 | ) | — | |
Other | | 157 | | 266 | | 34 | |
Total provision for income taxes | | $ | 2,120 | | $ | 2,101 | | $ | 2,881 | |
Effective tax rate | | 19.7 | % | 21.4 | % | 25.4 | % |
56
The Corporation or one of its subsidiaries files income tax returns in the U.S. federal jurisdictions, and various states where the Corporation has operations. With few exceptions, the Corporation is no longer subject to U.S. federal state and local, or non-U.S. income tax examinations by tax authorities for years before 2004.
FIRST FARMERS AND MERCHANTS CORPORATION AND SUBSIDIARIES
NOTES TO CONSOLIDATED FINANCIAL STATEMENTS
NOTE 8 - FEDERAL AND STATE INCOME TAXES (continued)
The Corporation adopted the provisions of FASB Interpretation No. 48, Accounting for Uncertainty in Income Taxes, on January 1, 2007. As a result of the implementation of Interpretation 48, the Corporation did not have any liability for unrecognized tax benefits as of December 31, 2007.
NOTE 9 - COMMITMENTS AND CONTINGENCIES
The Bank is a party to financial instruments with off-balance sheet risk in the normal course of business to meet the financing needs of its customers. These financial instruments include commitments to extend credit and standby letters of credit. Those instruments involve, to varying degrees, elements of credit risk in excess of the amount recognized in the balance sheet. The contract or notional amounts of those instruments reflect the extent of involvement the Bank has in those particular financial instruments.
The total outstanding loan commitments and standby letters of credit in the normal course of business at December 31, 2007 were $122.4 million and $17.9 million, respectively. Loan commitments are agreements to lend to a customer, provided there is not a violation of any condition established in the contract. Commitments generally have fixed expiration dates or other termination clauses and may require payment of a fee. The commitments for equity lines of credit may expire without being used. Therefore, the total commitment amounts do not necessarily represent future cash requirements. Standby letters of credit are conditional commitments issued by the Bank to guarantee the performance of a customer to a third party. Those guarantees are primarily issued to support public and private borrowing arrangements, including commercial paper, bond financing and similar transactions. The credit risk involved in issuing letters of credit is essentially the same as that involved in making a loan.
The Bank’s loan portfolio is well-diversified with loans generally secured by tangible personal property, real property, bank deposit accounts or stock. The loans are expected to be repaid from cash flow or proceeds from the sale of selected assets of the borrowers. Collateral requirements for the loan portfolio are based on credit evaluation of each customer.
Various legal claims have arisen from time to time in the normal course of business which, in the opinion of management, should not have a material effect on the consolidated operating results and financial condition.
NOTE 10 - SHAREHOLDERS’ EQUITY
The Corporation and the Bank are subject to federal regulatory risk-adjusted capital adequacy standards. Failure to meet capital adequacy requirements can initiate certain mandatory, and possibly additional discretionary actions by regulators that could have a material adverse effect on the operating results and financial condition of the Corporation and the Bank. The applicable regulations require the Bank to meet specific capital adequacy guidelines that involve quantitative measures of assets, liabilities and certain off-balance-sheet items as calculated under regulatory accounting practices. The capital classification is also subject to qualitative judgments by the regulators about components, risk weightings and other factors.
Quantitative measures established by regulation to ensure capital adequacy require the Corporation and the Bank to maintain minimum amounts and ratios of Total Capital and Tier I Capital to risk-weighted assets and of Tier I Capital to average assets. Actual capital amounts and ratios are
57
presented in the table below. Management believes, as of December 31, 2007, that the Corporation and the Bank met all capital adequacy requirements to which they were subject.
58
FIRST FARMERS AND MERCHANTS CORPORATION AND SUBSIDIARIES
NOTES TO CONSOLIDATED FINANCIAL STATEMENTS
NOTE 10 - SHAREHOLDERS’ EQUITY (Continued)
(Dollars in Thousands)
| | | | For Minimum Capital | | For Minimum Regulatory | |
| | Actual | | Adequacy Purposes | | Compliance Purposes | |
As of December 31, 2007 | | Amount | | Ratio | | Amount | | Ratio > or = | | Amount | | Ratio > or = | |
Total Capital (to Risk Weighted | | | | | | | | | | | | | |
Assets) Consolidated | | $ | 103,579 | | 18.17 | % | $ | 45,594 | | 8.00 | % | $ | — | | — | |
Bank | | 101,170 | | 17.85 | % | 45,341 | | 8.00 | % | 56,676 | | 10.00 | % |
Tier I Capital (to Risk Weighted | | | | | | | | | | | | | |
Assets) Consolidated | | 96,491 | | 16.93 | % | 22,797 | | 4.00 | % | — | | — | |
Bank | | 94,082 | | 16.60 | % | 22,671 | | 4.00 | % | 34,006 | | 6.00 | % |
Tier I Capital (to Average | | | | | | | | | | | | | |
Assets) Consolidated | | 96,491 | | 12.22 | % | 31,594 | | 4.00 | % | — | | — | |
Bank | | 94,082 | | 11.91 | % | 31,594 | | 4.00 | % | 39,493 | | 5.00 | % |
| | | | | | | | | | | | | |
As of December 31, 2006 | | | | | | | | | | | | | |
Total Capital (to Risk Weighted | | | | | | | | | | | | | |
Assets) Consolidated | | $ | 101,920 | | 19.83 | % | $ | 41,117 | | 8.00 | % | $ | — | | — | |
Bank | | 99,677 | | 19.47 | % | 40,956 | | 8.00 | % | 51,195 | | 10.00 | % |
Tier I Capital (to Risk Weighted | | | | | | | | | | | | | |
Assets) Consolidated | | 95,509 | | 18.58 | % | 20,562 | | 4.00 | % | — | | — | |
Bank | | 93,267 | | 18.22 | % | 20,476 | | 4.00 | % | 30,714 | | 6.00 | % |
Tier I Capital (to Average | | | | | | | | | | | | | |
Assets) Consolidated | | 95,509 | | 12.01 | % | 31,810 | | 4.00 | % | — | | — | |
Bank | | 93,267 | | 11.73 | % | 31,805 | | 4.00 | % | 39,756 | | 5.00 | % |
NOTE 11 - FAIR VALUES OF FINANCIAL INSTRUMENTS
The following table presents the fair value of the Bank’s financial instruments as of December 31, 2007 and 2006 (dollars in thousands):
| | December 31, 2007 | | December 31, 2006 | |
| | Carrying | | Fair | | Carrying | | Fair | |
| | Amount | | Value | | Amount | | Value | |
Financial assets | | | | | | | | | |
Cash and due from banks | | $ | 35,097 | | $ | 35,097 | | $ | 45,558 | | $ | 45,558 | |
Interest-bearing deposits in banks | | 176 | | 176 | | 2,573 | | 2,573 | |
Federal funds sold | | 600 | | 600 | | 26,850 | | 26,850 | |
Securities available-for-sale | | 163,911 | | 163,911 | | 147,001 | | 147,001 | |
Securities held-to-maturity | | 75,565 | | 76,460 | | 81,247 | | 82,109 | |
Loans, net | | 492,762 | | 490,175 | | 466,091 | | 446,252 | |
Accrued interest receivable | | 4,817 | | 4,817 | | 4,878 | | 4,878 | |
Financial liabilities | | | | | | | | | |
Deposits | | 698,959 | | 698,484 | | 698,962 | | 697,910 | |
Federal funds purchased and | | | | | | | | | |
securities sold under agreements | | | | | | | | | |
to repurchase | | 2,507 | | 2,507 | | 2,654 | | 2,654 | |
Other short term liabilities | | 600 | | 600 | | 385 | | 385 | |
Accrued interest payable | | 2,972 | | 2,972 | | 3,052 | | 3,052 | |
Off-balance sheet credit related instruments: | | | | | | | | | |
Commitments to extend credit | | — | | 99 | | — | | 22 | |
| | | | | | | | | | | | | |
59
FIRST FARMERS AND MERCHANTS CORPORATION AND SUBSIDIARIES
NOTES TO CONSOLIDATED FINANCIAL STATEMENTS
NOTE 11 - FAIR VALUES OF FINANCIAL INSTRUMENTS (Continued)
Estimated fair values have been determined by the Bank using the best available data. Many of the Bank’s financial instruments, however, lack an available trading market as characterized by a willing buyer and willing seller engaging in an unforced, unforeclosed transaction. Therefore, significant estimations and present value calculations were used by the Bank for the purposes of this disclosure. Changes in assumptions or the estimation methodologies used could have a material effect on the estimated fair values included in this Note 11.
Financial assets
Cash and cash equivalents are considered to be carried at their fair value and have not been valued differently from historical cost accounting. Both securities available-for-sale and held-to-maturity are valued by an independent pricing service as discussed in Note 2. A present value discounted cash flow methodology was used to value the net loan portfolio. The discount rate used in these calculations was the current rate at which new loans in the same classification for regulatory reporting purposes would be made. This rate was adjusted for credit loss and assumed prepayment risk. For loans with floating interest rates, it is assumed that estimated fair values generally approximate the recorded book balances.
Financial liabilities
Deposits with stated maturities have been valued using a present value discounted cash flow with a discount rate approximating the current market for similar liabilities. Financial instrument liabilities with no stated maturities have an estimated fair value equal to both the amount payable on demand and the recorded book balance. For deposits with floating interest rates, it is assumed that estimated fair values generally approximate the recorded book balances. The carrying amount of other short-term borrowings is considered to approximate fair value.
Fair values for off-balance sheet, credit-related financial instruments are based on fees currently charged to enter into similar agreements, taking into account the remaining terms of the agreements and the counterparties’ credit standing.
The Bank’s remaining assets and liabilities that are not considered financial instruments have not been valued differently from historical cost accounting. Management believes that reasonable comparability between financial institutions may be distorted because of the wide range of permitted valuation techniques and numerous estimates that must be made given the absence of active secondary markets for many of the financial instruments. This lack of uniform valuation methodologies also introduces a greater degree of subjectivity to these estimated fair values.
At December 31, 2007, the Bank had outstanding standby letters of credit and commitments to extend credit. These off-balance sheet financial instruments are generally exercisable at the market rate prevailing at the date the underlying transaction will be completed. Please refer to Note 9 for more information about off-balance sheet financial instruments.
60
FIRST FARMERS AND MERCHANTS CORPORATION AND SUBSIDIARIES
NOTES TO CONSOLIDATED FINANCIAL STATEMENTS
NOTE 12 - QUARTERLY RESULTS OF OPERATIONS (Unaudited)
The following table presents unaudited quarterly interim financial information for the Corporation for the years ended December 31, 2007 and 2006 (dollars in thousands, except per share amount):
| | First | | Second | | Third | | Fourth | | | |
| | Quarter | | Quarter | | Quarter | | Quarter | | Total | |
2007 | | | | | | | | | | | |
Interest income | | $ | 10,630 | | $ | 10,917 | | $ | 11,008 | | $ | 11,132 | | $ | 43,687 | |
Interest expense | | 4,026 | | 4,011 | | 4,068 | | 3,918 | | 16,023 | |
Net interest income | | 6,604 | | 6,906 | | 6,940 | | 7,214 | | 27,664 | |
Provision for possible loan losses (recoveries), net | | — | | — | | — | | — | | — | |
Noninterest expenses, net of noninterest income | | 4,274 | | 4,160 | | 4,341 | | 4,148 | | 16,923 | |
Income before income taxes | | 2,330 | | 2,746 | | 2,599 | | 3,066 | | 10,741 | |
Income taxes | | 284 | | 699 | | 511 | | 626 | | 2,120 | |
Net income | | $ | 2,046 | | $ | 2,047 | | $ | 2,088 | | $ | 2,440 | | $ | 8,621 | |
Basic earnings per share | | $ | 0.36 | | $ | 0.36 | | $ | 0.37 | | $ | 0.42 | | $ | 1.51 | |
Weighted average shares outstanding per quarter | | 5,757,139 | | 5,736,645 | | 5,715,228 | | 5,696,245 | | 5,727,158 | |
| | First | | Second | | Third | | Fourth | | | |
| | Quarter | | Quarter | | Quarter | | Quarter | | Total | |
2006 | | | | | | | | | | | |
Interest income | | $ | 10,064 | | $ | 10,714 | | $ | 10,779 | | $ | 10,880 | | $ | 42,437 | |
Interest expense | | 3,065 | | 3,224 | | 3,590 | | 3,909 | | 13,788 | |
Net interest income | | 6,999 | | 7,490 | | 7,189 | | 6,971 | | 28,649 | |
Provision for possible loan losses (recoveries) net | | — | | — | | (421 | ) | (215 | ) | (636 | ) |
Noninterest expenses, net of noninterest income | | 5,079 | | 5,089 | | 4,443 | | 4,848 | | 19,459 | |
Income before income taxes | | 1,920 | | 2,401 | | 3,167 | | 2,338 | | 9,826 | |
Income taxes | | 276 | | 484 | | 950 | | 391 | | 2,101 | |
Net income | | $ | 1,644 | | $ | 1,917 | | $ | 2,217 | | $ | 1,947 | | $ | 7,725 | |
Basic earnings per share | | $ | 0.28 | | $ | 0.33 | | $ | 0.38 | | $ | 0.34 | | $ | 1.33 | |
Weighted average shares outstanding per quarter | | 5,840,000 | | 5,840,000 | | 5,819,716 | | 5,807,338 | | 5,826,589 | |
NOTE 13 - DEPOSITS
The Bank does not have any foreign offices and all deposits are serviced in its 19 domestic offices. Maturities of time deposits of $100,000 or more at December 31, 2007 and 2006 are presented in the following table (dollars in thousands):
| | 2007 | | 2006 | |
| | | | | |
Under 3 months | | $ | 53,416 | | $ | 36,828 | |
3 to 12 months | | 50,353 | | 49,026 | |
Over 12 months | | 3,629 | | 5,650 | |
| | | | | |
Total | | $ | 107,398 | | $ | 91,504 | |
61
FIRST FARMERS AND MERCHANTS CORPORATION AND SUBSIDIARIES
NOTES TO CONSOLIDATED FINANCIAL STATEMENTS
NOTE 13 - DEPOSITS (Continued)
The following table presents maturities of interest-bearing deposits as of December 31, 2007 (dollars in thousands):
Interest bearing transaction accounts | | $ | 278,577 | |
2008 | | 270,367 | |
2009 | | 12,518 | |
2010 | | 2,238 | |
2011 | | 1,313 | |
2012 | | 2,884 | |
Thereafter | | 19 | |
Total | | $ | 567,916 | |
NOTE 14 - SECURITIES SOLD UNDER AGREEMENTS TO REPURCHASE
Securities sold under agreements to repurchase, which are classified as secured borrowings, generally mature within one to four days from the transaction date. Securities sold under agreements to repurchase are reflected at the amount of cash received in connection with the transaction.
NOTE 15 - - CONDENSED FINANCIAL INFORMATION OF THE CORPORATION
The following tables present the condensed balance sheets, statements of income and cash flows of the Corporation as of December 31, 2007 and 2006 (dollars in thousands, except per share amounts):
CONDENSED BALANCE SHEETS
| | As of December 31, | |
| | 2007 | | 2006 | |
Cash | | $ | 97 | | $ | 23 | |
Investment in bank subsidiary - at equity | | 103,835 | | 101,565 | |
Investment in credit life insurance company - at cost | | 54 | | 54 | |
Investment in other securities | | 17 | | 17 | |
Dividends receivable from bank subsidiary | | 2,138 | | 3,000 | |
Cash surrender value - life insurance | | 3,092 | | 2,722 | |
Total assets | | $ | 109,233 | | $ | 107,381 | |
Liabilities | | | | | |
Payable to bank subsidiary | | $ | — | | $ | 719 | |
Payable to directors | | 906 | | 854 | |
Other payable | | 92 | | 31 | |
Dividends payable | | 1,991 | | 1,971 | |
Total liabilities | | 2,989 | | 3,575 | |
Shareholders’ equity | | | | | |
Common stock - $10 par value, 8,000,000 shares authorized; 5,680,000 and 5,760,000 shares issued and outstanding, as of 12/31/07 and 12/31/06, respectively | | 56,800 | | 57,600 | |
Additional paid-in capital | | — | | 1,120 | |
Retained earnings | | 48,916 | | 46,341 | |
Accumulated other comprehensive income | | 528 | | (1,255 | ) |
Total shareholders’ equity | | 106,244 | | 103,806 | |
Total liabilities and shareholders’ equity | | $ | 109,233 | | $ | 107,381 | |
62
FIRST FARMERS AND MERCHANTS CORPORATION AND SUBSIDIARIES
NOTES TO CONSOLIDATED FINANCIAL STATEMENTS
NOTE 15 - - CONDENSED FINANCIAL INFORMATION OF THE CORPORATION (Continued)
CONDENSED STATEMENTS OF INCOME
| | Years ended December 31, | |
| | 2007 | | 2006 | |
Operating income | | | | | |
Dividends from bank subsidiary | | $ | 8,264 | | $ | 7,852 | |
Other dividend income | | 3 | | 3 | |
Other | | 85 | | 65 | |
Operating expenses | | (218 | ) | (195 | ) |
Income before equity in undistributed net income of bank subsidiary | | 8,134 | | 7,725 | |
Equity in undistributed net income of bank subsidiary | | 487 | | — | |
Net income | | $ | 8,621 | | $ | 7,725 | |
CONDENSED STATEMENTS OF CASH FLOWS
| | Years Ended December 31, | |
| | 2007 | | 2006 | |
Operating activities | | | | | |
Net income for the year | | $ | 8,621 | | $ | 7,725 | |
Adjustments to reconcile net income to net cash provided by operating activities | | | | | |
Equity in undistributed net income of bank subsidiary | | (487 | ) | — | |
Increase in cash surrender value of life insurance contracts | | (63 | ) | (43 | ) |
Decrease in other assets | | 862 | | — | |
Increase in payables | | 113 | | 156 | |
Total adjustments | | 425 | | 113 | |
Net cash provided by operating activities | | 9,046 | | 7,838 | |
Investing activities | | | | | |
Return of equity | | — | | (56 | ) |
Purchase of single premium life insurance policy | | (307 | ) | (719 | ) |
Net cash used by investing activities | | (307 | ) | (775 | ) |
Financing activities | | | | | |
Payment to repurchase common stock | | (4,000 | ) | (4,000 | ) |
Advance/Payment to/ from subsidiary | | (719 | ) | 719 | |
Cash dividends paid | | (3,946 | ) | (3,796 | ) |
Net cash used in financing activities | | (8,665 | ) | (7,077 | ) |
Increase (decrease) in cash | | 74 | | (14 | ) |
Cash at beginning of year | | 23 | | 37 | |
Cash at end of year | | $ | 97 | | $ | 23 | |
63
FIRST FARMERS AND MERCHANTS CORPORATION AND SUBSIDIARIES
NOTES TO CONSOLIDATED FINANCIAL STATEMENTS
NOTE 16 - EMPLOYEE BENEFIT PLANS
The Bank contributes to a qualified profit-sharing plan covering employees who meet participation requirements. The amount of the contribution is discretionary as determined by the Bank’s Board of Directors up to the maximum deduction allowed for federal income tax purposes. Contributions to the plan, which amounted to $1.08 million, $1.507 million and $1.542 million in 2007, 2006 and 2005, respectively, are included in salaries and employee benefits expense.
In 1992, the Bank formalized a nonqualified salary continuation plan for certain key officers. In connection with this plan, the value of the single premium universal life insurance policies ($897,000 at December 31, 2007 and $876,000 at December 31, 2006) purchased in 1993 to fund the plan and the related liability ($228,000 at December 31, 2007 and $283,000 at December 31, 2006) were included in other assets and other liabilities, respectively. Net noncash income recognized on these policies of approximately $17,000 in 2007, $20,000 in 2006 and $18,000 in 2005 is included in the above asset values. The principal cost of the plan is accrued over the anticipated remaining period of active employment, based on the present value of the expected retirement benefit. Expense related to this plan was approximately $19,000 in 2007, $11,000 in 2006 and $30,000 in 2005.
In 1993, the Corporation and the Bank implemented a deferred compensation plan that permits directors to defer their director’s fees and earn interest on the deferred amount. Liability increases for current deferred fees, net of benefits paid, of approximately $547,000 for 2007, $203,000 for 2006 and $264,000 for 2005 have been recognized in the accompanying consolidated financial statements. In connection with this plan, a single premium universal life insurance policy was purchased on the life of each director who elected to participate. In 2007, the total life insurance purchased was approximately $786,000. Net noncash income recognized on these policies of approximately $193,000 in 2007, $181,000 in 2006 and $147,000 in 2005 is included in the cash surrender values of $10.112 million, $9.133 million and $6.199 million reported in other assets at December 31, 2007, 2006 and 2005, respectively.
In 1996, the Bank established an officer group term replacement/split-dollar plan to provide life insurance benefits that would continue after retirement. A single premium universal life insurance policy was purchased to fund the plan and a split-dollar agreement was made with an irrevocable trust that specified the portion of the insurance proceeds that would become part of the trust. The value of this policy ($1.169 million at December 31, 2007, and $1.140 million at December 31, 2006) is included in other assets, and net noncash income recognized on this policy of approximately $29,000 in 2007, $26,000 in 2006 and $11,000 in 2005 are included in the above asset values.
In 2002, the Bank implemented a Director Split-Dollar Life Insurance Plan and an Executive Split-Dollar Life Insurance Plan. The Bank purchased a single premium whole life insurance policy on the life of each participant and endorsed a portion of the policy death benefits to the insured’s estate, a trust, or another individual. The total life insurance purchased was $3.735 million in 2002, $190,000 in 2003 and $253,000 in 2004. Additional single premium universal life insurance policies, totaling approximately $154,000 in 2005 and $623,000 in 2007, were purchased for new participants. Net noncash income was recognized on these policies of approximately $184,000 in 2007 and $181,000 in 2006 and is included in the asset value of $6.013 million, which is a part of other assets.
The Bank is the beneficiary of the insurance policies that fund the salary continuation plan, the deferred compensation plan, the group term replacement/split-dollar plan and the split-dollar life insurance plans. These policies had an aggregate current death benefit of $35 million at December 31, 2007.
64
FIRST FARMERS AND MERCHANTS CORPORATION AND SUBSIDIARIES
NOTES TO CONSOLIDATED FINANCIAL STATEMENTS
NOTE 17 – POST RETIREMENT BENEFIT PLAN
The Corporation sponsors a defined benefit postretirement health care plan covering employees who were hired before March 27, 2007. Retirement may be requested at age 60 with 15 years of work experience with the Bank. In September 2006 the FASB issued FASB 158, Employer’s Accounting for Defined Benefit Pension and other Postretirement Plans, which amends FASB Statement No. 87, 88, 106, and 132R. FASB No. 158 requires employers to (a) recognize the overfunded or underfunded status of a single-employer defined benefit postretirement plan as an asset or liability in its statement of financial position and (b) recognize changes in that funded status in comprehensive income. FASB 106 requires companies to accrue the cost of postretirement health care and life insurance benefits within the employees’ active service periods. Eligibility requirements for employees hired prior to March 27, 2007 are as follows:
· 25 years of service at any age
· 15 years of service at attained age 60
· 15 years of service at attained age 55, with a qualifying disability
Premiums paid by retirees and spouses depend on date of retirement, age and coverage election. Employees retiring after June 2007, who are at least 60 with a minimum of 15 years of service, will pay half of the full monthly premium. Coverage will cease at 63.5 for persons who retire with less than 25 years of service. All persons hired after March 27, 2007 are not eligible for retiree health benefits.
The following tables provide further information about the plan (dollars in thousands):
Obligations and Funded Status
| | Post Retirement Benefits | |
| | 2007 | | 2006 | |
Change in benefit obligation | | | | | |
Benefit obligation at beginning of year | | $ | 5,557 | | $ | 5,088 | |
Service cost | | 56 | | 194 | |
Interest cost | | 207 | | 415 | |
Plan participants’ contributions | | 41 | | 50 | |
Actuarial (gain) loss | | (4,086 | ) | — | |
Benefits paid | | (161 | ) | (190 | ) |
Benefit obligation at end of year | | $ | 1,614 | | $ | 5,557 | |
| | | | | |
Change in plan assets | | | | | |
Fair value of plans assets at beginning of year | | $ | — | | $ | — | |
Actual return on plan assets | | — | | — | |
Employer contribution | | 120 | | 140 | |
Plan participants’ contributions | | 41 | | 50 | |
Benefits paid | | (161 | ) | (190 | ) |
Fair value of plan assets at end of year | | $ | — | | $ | — | |
| | | | | |
Funded status | | $ | (1,614 | ) | $ | (5,557 | ) |
Unrecognized net actuarial (gain) loss | | (3,880 | ) | — | |
Unrecognized net transition obligation | | — | | — | |
Unrecognized prior service cost | | — | | — | |
Prepaid (accrued) benefit cost | | $ | (5,494 | ) | $ | (5,557 | ) |
65
FIRST FARMERS AND MERCHANTS CORPORATION AND SUBSIDIARIES
NOTES TO CONSOLIDATED FINANCIAL STATEMENTS
NOTE 17 – POST RETIREMENT BENEFIT PLAN (Continued)
The following benefit payments, which reflect expected future service, as appropriate, are expected to be paid:
Year | | Gross Benefits | | Participant Contributions | | Company Benefits | |
2008 | | $ | 214 | | $ | 91 | | $ | 123 | |
2009 | | 231 | | 99 | | 131 | |
2010 | | 258 | | 112 | | 146 | |
2011 | | 274 | | 130 | | 145 | |
2012 | | 289 | | 142 | | 147 | |
2013 and later | | 1,795 | | 1,025 | | 770 | |
| | $ | 3,061 | | $ | 1,599 | | $ | 1,462 | |
The following table gives the Health Care Cost Trend (HCCTR), which is applied to gross charges, net claims and retiree paid premiums to reflect the Corporation’s past practice and stated ongoing intention to maintain relatively constant cost sharing between the Corporation and retirees.
| | 2007 | | 2006 | |
| | | | | |
Health care cost trend rate assumed for next year | | 10 | % | 10 | % |
| | | | | |
Rate to which the cost trend rate is assumed to decline (the ultimate trend rate) | | 5 | % | 5 | % |
| | | | | |
Year that the rate reaches the ultimate trend rate | | 2013 | | 2012 | |
Assumed health care cost trend rates have a significant effect on the amounts reported for the health care plans. A one-percentage-point change in assumed health care cost trend rates would have the following effects:
| | 1-Percentage-Point
Increase | | 1-Percentage-Point
Decrease | |
Effect on total of service and interest cost | | $ | 159 | | $ | (136 | ) |
Effect on postretirement benefit obligation | | 12 | | (12 | ) |
| | | | | | | |
66
FIRST FARMERS AND MERCHANTS CORPORATION AND SUBSIDIARIES
MANAGEMENT’S DISCUSSION AND ANALYSIS OF FINANCIAL CONDITION
SHAREHOLDER INFORMATION
The 5,680,000 shares of common stock of the Corporation outstanding at December 31, 2007 had an estimated market value of $284.0 million and were held by 2,622 shareholders, located primarily in the corporation’s market area. These identifiable individuals consist of 2,105 record holders, and 517 joint holders. A small number of shareholders are not identified individually because some bank nominees, including the Bank’s Trust Department, are listed as record owners when, in fact, these holdings represent more than one beneficial owner. No single shareholder’s ownership exceeded five percent at year end.
There is no established public trading market for shares of the Corporation’s common stock. The table below shows the high and low price of the Corporation’s common stock taken from reported prices by those buyers and sellers willing to disclose this information. This table also shows the semi-annual dividend paid per share of common stock, in each of the last three years. In 2007 and 2006, the Corporation repurchased 160,000 shares of its common stock in several privately negotiated transactions.
| | | | High | | Low | | Dividend | |
2007 | | First Quarter | | $ | 50.00 | | $ | 50.00 | | $ | — | |
| | Second Quarter | | 50.00 | | 50.00 | | 0.345 | |
| | Third Quarter | | 50.00 | | 50.00 | | — | |
| | Fourth Quarter | | 50.00 | | 50.00 | | 0.350 | |
| | | | | | | | | |
2006 | | First Quarter | | $ | 48.00 | | $ | 48.00 | | $ | — | |
| | Second Quarter | | 49.00 | | 48.00 | | 0.330 | |
| | Third Quarter | | 50.00 | | 49.00 | | — | |
| | Fourth Quarter | | 50.00 | | 50.00 | | 0.340 | |
| | | | | | | | | |
2005 | | First Quarter | | $ | 45.00 | | $ | 45.00 | | $ | — | |
| | Second Quarter | | 47.00 | | 45.00 | | 0.310 | |
| | Third Quarter | | 48.00 | | 48.00 | | — | |
| | Fourth Quarter | | 48.00 | | 48.00 | | 0.320 | |
ADDITIONAL FINANCIAL DATA
The following table presents consolidated comparative data for the Corporation for the years shown:
COMPARATIVE DATA
(Dollars In Thousands)
| | 2007 | | 2006 | | 2005 | | 2004 | | 2003 | |
| | | | | | | | | | | |
Average assets | | $ | 797,239 | | $ | 807,473 | | $ | 819,565 | | $ | 825,467 | | $ | 867,100 | |
| | | | | | | | | | | |
Average loans (net) | | $ | 484,308 | | $ | 467,545 | | $ | 440,781 | | $ | 419,627 | | $ | 444,942 | |
| | | | | | | | | | | |
Average deposits | | $ | 673,728 | | $ | 680,299 | | $ | 699,245 | | $ | 710,956 | | $ | 755,709 | |
Return on average assets | | 1.08 | % | 0.96 | % | 1.03 | % | 1.04 | % | 0.96 | % |
Return on average equity | | 8.36 | % | 7.33 | % | 8.21 | % | 8.28 | % | 8.09 | % |
Tier 1 capital to average assets | | 12.22 | % | 12.50 | % | 11.99 | % | 11.14 | % | 10.29 | % |
67