WASHINGTON, D. C. 20549
NY Tax Free Money Fund
Investment Class
Tax Free Money Fund Investment
Semiannual Report to
Shareholders
June 30, 2013
Contents
NY Tax Free Money Fund 9 Statement of Assets and Liabilities 10 Statement of Operations 11 Statement of Changes in Net Assets Tax Free Money Fund Investment 20 Statement of Assets and Liabilities 21 Statement of Operations 22 Statement of Changes in Net Assets 24 Notes to Financial Statements 30 Information About Each Fund's Expenses 33 Summary of Management Fee Evaluation by Independent Fee Consultant 37 Account Management Resources |
This report must be preceded or accompanied by a prospectus. To obtain a summary prospectus, if available, or prospectus for any of our funds, refer to the Account Management Resources information provided in the back of this booklet. We advise you to consider the funds' objectives, risks, charges and expenses carefully before investing. The summary prospectus and prospectus contain this and other important information about each fund. Please read the prospectus carefully before you invest.
An investment in these funds is not insured or guaranteed by the Federal Deposit Insurance Corporation (FDIC) or by any other government agency. Although the funds seek to preserve the value of your investment at $1.00 per share, it is possible to lose money by investing in the funds. The share price of money market funds can fall below the $1.00 share price. You should not rely on or expect the Advisor to enter into support agreements or take other actions to maintain the funds' $1.00 share price. The credit quality of the funds' holdings can change rapidly in certain markets, and the default of a single holding could have an adverse impact on the funds' share price. The funds' share price can also be negatively affected during periods of high redemption pressures and/or illiquid markets. The actions of a few large investors in one class of shares of the funds may have a significant adverse effect on the share prices of all classes of shares of the funds. See the prospectus for specific details regarding the funds' risk profile.
NOT FDIC/NCUA INSURED NO BANK GUARANTEE MAY LOSE VALUE NOT A DEPOSIT NOT INSURED BY ANY FEDERAL GOVERNMENT AGENCY
Portfolio Summary (Unaudited) Investment Portfolio as of June 30, 2013 (Unaudited)
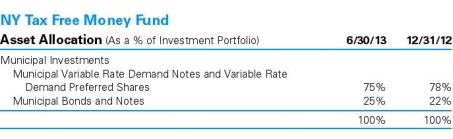
NY Tax Free Money Fund
| | | Principal Amount ($) | | | Value ($) | |
| | | | |
| Municipal Investments 99.8% | |
| New York 97.6% | |
| Albany, NY, Industrial Development Agency, Albany College of Pharmacy, Series A, 0.07%*, 7/1/2038, LOC: TD BankNorth NA | | | 1,230,000 | | | | 1,230,000 | |
| Bethlehem, NY, Industrial Development Agency Housing Revenue, 467 Delaware Avenue LLC Project, Series A, AMT, 0.08%*, 9/1/2033, LOC: Hudson River Bank & Trust Co. | | | 3,000,000 | | | | 3,000,000 | |
| BlackRock New York Municipal Income Quality Trust, Series W-7-40, 144A, AMT, 0.16%*, 10/1/2041, LIQ: Barclays Bank PLC | | | 2,200,000 | | | | 2,200,000 | |
| BlackRock New York Municipal Intermediate Duration Fund, Inc., Series W-7-296, 144A, AMT, 0.16%*, 10/1/2041, LIQ: Barclays Bank PLC | | | 1,600,000 | | | | 1,600,000 | |
| Monroe County, NY, Industrial Development Corp. Revenue, St. Ann's Home Aged Project, 0.08%*, 12/1/2040, LOC: HSBC Bank U.S.A. NA | | | 2,500,000 | | | | 2,500,000 | |
| Monroe County, NY, Industrial Development Corp. Revenue, St. Ann's Nursing Home, 0.08%*, 12/1/2040, LOC: HSBC Bank U.S.A. NA | | | 1,600,000 | | | | 1,600,000 | |
| Nassau, NY, Health Care Corp. Revenue, Series D-2, 0.19%*, 8/1/2029, LOC: JPMorgan Chase Bank NA | | | 1,800,000 | | | | 1,800,000 | |
| New York, Metropolitan Transportation Authority, Dedicated Tax Fund: | | | | | | | | |
| Series A-2, 0.05%*, 11/1/2031, LOC: Bank of Tokyo-Mitsubishi UFJ | | | 315,000 | | | | 315,000 | |
| Series A-1, 0.07%*, 11/1/2031, LOC: Morgan Stanley Bank | | | 1,000,000 | | | | 1,000,000 | |
| New York, RIB Floater Trust, Series 1WE, 144A, 0.13%*, 9/30/2013, LIQ: Barclays Bank PLC | | | 750,000 | | | | 750,000 | |
| New York, State Dormitory Authority Revenues, Memorial Sloan-Kettering Center, Series 1, Prerefunded 7/1/2013 @ 100, 5.0%, 7/1/2020, INS: NATL | | | 175,000 | | | | 175,000 | |
| New York, State Dormitory Authority Revenues, Non-State Supported Debt, St. John's University, Series B-2, 0.05%*, 7/1/2037, LOC: U.S. Bank NA | | | 1,400,000 | | | | 1,400,000 | |
| New York, State Dormitory Authority, State Personal Income Tax Revenue: | | | | | | | | |
| Series A, 4.0%, 2/15/2014 | | | 1,110,000 | | | | 1,135,623 | |
| Series A, 144A, 5.0%, 2/15/2014 | | | 200,000 | | | | 205,815 | |
| New York, State Energy Research & Development Authority, Consolidated Edison Co., Inc.: | | | | | | | | |
| Series A-2, 144A, 0.05%*, 5/1/2039, LOC: Mizuho Corporate Bank | | | 1,000,000 | | | | 1,000,000 | |
| Series A-3, AMT, 0.07%*, 6/1/2036, LOC: Scotiabank | | | 1,350,000 | | | | 1,350,000 | |
| New York, State Housing Finance Agency, 100 Maiden Lane Properties, Series A, 0.07%*, 5/15/2037, LIQ: Fannie Mae | | | 1,100,000 | | | | 1,100,000 | |
| New York, State Housing Finance Agency, Capitol Green Apartments, Series A, AMT, 0.08%*, 5/15/2036, LIQ: Fannie Mae | | | 2,000,000 | | | | 2,000,000 | |
| New York, State Mortgage Agency, Homeowner Mortgage Revenue, Series 153, AMT, 0.1%*, 4/1/2047, SPA: Barclays Bank PLC | | | 500,000 | | | | 500,000 | |
| New York, State Power Authority, 0.17%*, Mandatory Put 9/3/2013 @ 100, 3/1/2020, LIQ: Bank of Nova Scotia | | | 2,000,000 | | | | 2,000,000 | |
| New York, State Thruway Authority, Second General Highway & Bridge Trust Fund, Series A, 5.0%, 4/1/2014 | | | 340,000 | | | | 351,833 | |
| New York, State Urban Development Corp. Revenue, State Personal Income Tax, Series C, 3.0%, 12/15/2013 | | | 1,020,000 | | | | 1,032,370 | |
| New York City, NY, Health & Hospital Corp., Health Systems: | |
| Series C, 144A, 0.05%*, 2/15/2031, LOC: TD Bank NA | | | 1,000,000 | | | | 1,000,000 | |
| Series D, 144A, 0.1%*, 2/15/2026, LOC: JPMorgan Chase Bank NA | | | 550,000 | | | | 550,000 | |
| New York City, NY, Housing Development Corp., 1090 Franklin Avenue Associates LLC, Series A, AMT, 0.09%*, 12/1/2037, LOC: Citibank NA | | | 2,320,000 | | | | 2,320,000 | |
| New York City, NY, Housing Development Corp., Multi-Family Housing Revenue: | | | | | | | | |
| Series M-4, 0.2%, Mandatory Put 6/27/2014 @ 100, 11/1/2047 | | | 1,500,000 | | | | 1,500,000 | |
| Series C, 0.22%*, Mandatory Put 1/31/2014 @ 100, 5/1/2045 | | | 2,015,000 | | | | 2,015,000 | |
| New York City, NY, Housing Development Corp., Multi-Family Mortgage Revenue, Plaza Residences LP, Series A, AMT, 0.08%*, 7/1/2039, LOC: Citibank NA | | | 1,465,000 | | | | 1,465,000 | |
| New York City, NY, Industrial Development Agency, Civic Facility Revenue, New York Psychotherapy & Counseling Center, 0.12%*, 6/1/2038, LOC: JPMorgan Chase Bank NA | | | 2,730,000 | | | | 2,730,000 | |
| New York City, NY, Municipal Water Finance Authority, Water & Sewer Systems Revenue, Series A-1, 0.04%*, 6/15/2044, SPA: Mizuho Corporate Bank | | | 1,400,000 | | | | 1,400,000 | |
| New York City, NY, Transitional Finance Authority Revenue, Future Tax Secured: | | | | | | | | |
| Series A-1, 144A, 0.06%*, 11/15/2028, SPA: TD Bank NA | | | 1,900,000 | | | | 1,900,000 | |
| Series D-2, 5.0%, 11/1/2013 | | | 2,925,000 | | | | 2,972,051 | |
| Series I2, 5.0%, 11/1/2013 | | | 760,000 | | | | 772,191 | |
| New York, NY, General Obligation: | |
| Series J-10, 0.04%*, 8/1/2027, LOC: Bank of Tokyo-Mitsubishi UFJ | | | 1,700,000 | | | | 1,700,000 | |
| Series A-6, 144A, 0.06%*, 8/1/2031, LOC: Mizuho Corporate Bank | | | 1,800,000 | | | | 1,800,000 | |
| Series A-5, 0.07%*, 10/1/2042, LOC: Sumitomo Bank Ltd. | | | 2,000,000 | | | | 2,000,000 | |
| Series B2, 0.09%*, 8/15/2023, SPA: Landesbank Hessen-Thuringen | | | 2,900,000 | | | | 2,900,000 | |
| Series F-1, 5.0%, 9/1/2013 | | | 5,000 | | | | 5,041 | |
| Series F-1, ETM, 5.0%, 9/1/2013 | | | 995,000 | | | | 1,003,097 | |
| Port Authority of New York & New Jersey, 4.0%, 12/1/2013 | | | 1,840,000 | | | | 1,869,126 | |
| | | | | 58,147,147 | |
| Puerto Rico 2.2% | |
| Puerto Rico, RIB Floater Trust, Series 8WE, 144A, 0.11%*, 9/30/2014, LOC: Barclays Bank PLC | | | 1,310,000 | | | | 1,310,000 | |
| | | % of Net Assets | | | Value ($) | |
| | | | |
Total Investment Portfolio (Cost $59,457,147)† | | | 99.8 | | | | 59,457,147 | |
| Other Assets and Liabilities, Net | | | 0.2 | | | | 143,318 | |
| Net Assets | | | 100.0 | | | | 59,600,465 | |
* Variable rate demand notes and variable rate demand preferred shares are securities whose interest rates are reset periodically at market levels. These securities are payable on demand and shown at their current rates as of June 30, 2013.
† The cost for federal income tax purposes was $59,457,147.
144A: Security exempt from registration under Rule 144A of the Securities Act of 1933. These securities may be resold in transactions exempt from registration, normally to qualified institutional buyers.
AMT: Subject to alternative minimum tax.
ETM: Bonds bearing the description ETM (escrow to maturity) are collateralized usually by U.S. Treasury securities which are held in escrow and used to pay principal and interest on bonds so designated.
INS: Insured
LIQ: Liquidity Facility
LOC: Letter of Credit
NATL: National Public Finance Guarantee Corp.
Prerefunded: Bonds which are prerefunded are collateralized usually by U.S. Treasury securities which are held in escrow and used to pay principal and interest on tax-exempt issues and to retire the bonds in full at the earliest refunding date.
SPA: Standby Bond Purchase Agreement
Fair Value Measurements
Various inputs are used in determining the value of the Fund's investments. These inputs are summarized in three broad levels. Level 1 includes quoted prices in active markets for identical securities. Level 2 includes other significant observable inputs (including quoted prices for similar securities, interest rates, prepayment speeds and credit risk). Level 3 includes significant unobservable inputs (including the Fund's own assumptions in determining the fair value of investments). The inputs or methodology used for valuing securities are not necessarily an indication of the risk associated with investing in those securities. Securities held by the Fund are reflected as Level 2 because the securities are valued at amortized cost (which approximates fair value) and, accordingly, the inputs used to determine value are not quoted prices in an active market.
The following is a summary of the inputs used as of June 30, 2013 in valuing the Fund's investments. For information on the Fund's policy regarding the valuation of investments, please refer to the Security Valuation section of Note A in the accompanying Notes to Financial Statements.
| Assets | | Level 1 | | | Level 2 | | | Level 3 | | | Total | |
| | |
| Municipal Investments (a) | | $ | — | | | $ | 59,457,147 | | | $ | — | | | $ | 59,457,147 | |
| Total | | $ | — | | | $ | 59,457,147 | | | $ | — | | | $ | 59,457,147 | |
There have been no transfers between fair value measurement levels during the period ended June 30, 2013.
(a) See Investment Portfolio for additional detailed categorizations.
The accompanying notes are an integral part of the financial statements.
Statement of Assets and Liabilities | as of June 30, 2013 (Unaudited) | |
| Assets | | NY Tax Free Money Fund | |
| Investments in securities, valued at amortized cost | | $ | 59,457,147 | |
| Cash | | | 78,262 | |
| Interest receivable | | | 89,865 | |
| Due from Advisor | | | 12,822 | |
| Other assets | | | 14,514 | |
| Total assets | | | 59,652,610 | |
| Liabilities | |
| Distributions payable | | | 262 | |
| Accrued Trustees' fees | | | 419 | |
| Other accrued expenses and payables | | | 51,464 | |
| Total liabilities | | | 52,145 | |
| Net assets, at value | | $ | 59,600,465 | |
| Net Assets Consist of | |
| Undistributed net investment income | | | 4,679 | |
| Accumulated net realized gain (loss) | | | (6,128 | ) |
| Paid-in capital | | | 59,601,914 | |
| Net assets, at value | | $ | 59,600,465 | |
| Net Asset Value | |
Investment Class Net Asset Value, offering and redemption price per share ($48,600,712 ÷ 48,620,438 shares of capital stock outstanding, $.01 par value, unlimited number of shares authorized) | | $ | 1.00 | |
Tax-Exempt New York Money Market Fund Net Asset Value, offering and redemption price per share ($10,999,753 ÷ 11,004,218 shares of capital stock outstanding, $.01 par value, unlimited number of shares authorized) | | $ | 1.00 | |
The accompanying notes are an integral part of the financial statements.
| for the six months ended June 30, 2013 (Unaudited) | |
| Investment Income | | NY Tax Free Money Fund | |
Income: Interest | | $ | 52,223 | |
Expenses: Management fee | | | 34,751 | |
| Administration fee | | | 28,959 | |
| Services to shareholders | | | 62,334 | |
| Distribution and service fees | | | 74,078 | |
| Custodian fee | | | 3,079 | |
| Legal fees | | | 8,811 | |
| Audit fees | | | 25,340 | |
| Trustees' fees and expenses | | | 2,172 | |
| Reports to shareholders | | | 25,763 | |
| Registration fees | | | 20,346 | |
| Other | | | 3,450 | |
| Total expenses before expense reductions | | | 289,083 | |
| Expense reductions | | | (239,703 | ) |
| Total expenses after expense reductions | | | 49,380 | |
| Net investment income | | | 2,843 | |
| Net realized gain (loss) from investments | | | (3,572 | ) |
| Net increase (decrease) in net assets resulting from operations | | $ | (729 | ) |
The accompanying notes are an integral part of the financial statements.
Statement of Changes in Net Assets
| NY Tax Free Money Fund | |
| Increase (Decrease) in Net Assets | | Six Months Ended June 30, 2013 (Unaudited) | | | Year Ended December 31, 2012 | |
Operations: Net investment income | | $ | 2,843 | | | $ | 6,593 | |
| Net realized gain (loss) from investments | | | (3,572 | ) | | | (512 | ) |
| Net increase (decrease) in net assets resulting from operations | | | (729 | ) | | | 6,081 | |
Distributions to shareholders from: Net investment income: Investment Class | | | (2,292 | ) | | | (5,404 | ) |
| Tax-Exempt New York Money Market Fund | | | (604 | ) | | | (1,457 | ) |
| Total distributions | | | (2,896 | ) | | | (6,861 | ) |
Fund share transactions: Investment Class Proceeds from shares sold | | | 74,040,666 | | | | 205,119,062 | |
| Reinvestment of distributions | | | 746 | | | | 1,759 | |
| Payments of shares redeemed | | | (83,980,204 | ) | | | (198,810,068 | ) |
| Net increase (decrease) in net assets from Investment Class share transactions | | | (9,938,792 | ) | | | 6,310,753 | |
Tax-Exempt New York Money Market Fund Proceeds from shares sold | | | 6,976,441 | | | | 17,097,684 | |
| Reinvestment of distributions | | | 604 | | | | 1,457 | |
| Payments for shares redeemed | | | (9,313,607 | ) | | | (19,809,254 | ) |
| Net increase (decrease) in net assets from Tax-Exempt New York Money Market Fund share transactions | | | (2,336,562 | ) | | | (2,710,113 | ) |
| Increase (decrease) in net assets | | | (12,278,979 | ) | | | 3,599,860 | |
| Net assets at beginning of period | | | 71,879,444 | | | | 68,279,584 | |
| Net assets at end of period (including undistributed net investment income of $4,679 and $4,732, respectively) | | $ | 59,600,465 | | | $ | 71,879,444 | |
The accompanying notes are an integral part of the financial statements.
Statement of Changes in Net Assets — NY Tax Free Money Fund (continued) | |
| Other Information | | Six Months Ended June 30, 2013 (Unaudited) | | | Year Ended December 31, 2012 | |
| Investment Class | |
| Shares outstanding at beginning of period | | | 58,559,230 | | | | 52,248,477 | |
| Shares sold | | | 74,040,666 | | | | 205,119,062 | |
| Shares issued to shareholders in reinvestment of distributions | | | 746 | | | | 1,759 | |
| Shares redeemed | | | (83,980,204 | ) | | | (198,810,068 | ) |
| Net increase (decrease) in Fund shares from Investment Class share transactions | | | (9,938,792 | ) | | | 6,310,753 | |
| Shares outstanding at end of period | | | 48,620,438 | | | | 58,559,230 | |
| Tax-Exempt New York Money Market Fund | | | | | | | | |
| Shares outstanding at beginning of period | | | 13,340,780 | | | | 16,050,893 | |
| Shares sold | | | 6,976,441 | | | | 17,097,684 | |
| Shares issued to shareholders in reinvestment of distributions | | | 604 | | | | 1,457 | |
| Shares redeemed | | | (9,313,607 | ) | | | (19,809,254 | ) |
| Net increase (decrease) in Fund shares from Tax-Exempt New York Money Market Fund share transactions | | | (2,336,562 | ) | | | (2,710,113 | ) |
| Shares outstanding at end of period | | | 11,004,218 | | | | 13,340,780 | |
The accompanying notes are an integral part of the financial statements.
Financial HighlightsNY Tax Free Money Fund Investment Class | |
| | | | | | Years Ended December 31, | |
| | Six Months Ended 6/30/13 (Unaudited) | | | 2012 | | | 2011 | | | 2010 | | | 2009 | | | 2008 | |
| Selected Per Share Data | |
| Net asset value, beginning of period | | $ | 1.00 | | | $ | 1.00 | | | $ | 1.00 | | | $ | 1.00 | | | $ | 1.00 | | | $ | 1.00 | |
Income from investment operations: Net investment income | | | .000 | *** | | | .000 | *** | | | .000 | *** | | | .000 | *** | | | .002 | | | | .017 | |
| Net realized gain (loss) | | | (.000 | )*** | | | (.000 | )*** | | | (.000 | )*** | | | (.000 | )*** | | | .000 | *** | | | .000 | *** |
| Total from investment operations | | | .000 | *** | | | .000 | *** | | | .000 | *** | | | .000 | *** | | | .002 | | | | .017 | |
Less distributions from: Net investment income | | | (.000 | )*** | | | (.000 | )*** | | | (.000 | )*** | | | (.001 | ) | | | (.002 | ) | | | (.017 | ) |
| Net asset value, end of period | | $ | 1.00 | | | $ | 1.00 | | | $ | 1.00 | | | $ | 1.00 | | | $ | 1.00 | | | $ | 1.00 | |
| Total Return (%) | | | .00 | a,b** | | | .01 | a | | | .01 | a | | | .06 | a | | | .22 | a | | | 1.76 | |
| Ratios to Average Net Assets and Supplemental Data | |
| Net assets, end of period ($ millions) | | | 49 | | | | 59 | | | | 52 | | | | 52 | | | | 81 | | | | 117 | |
| Ratio of expenses before expense reductions (%) | | | .96 | * | | | .90 | | | | .84 | | | | .78 | | | | .84 | | | | .72 | |
| Ratio of expenses after expense reductions (%) | | | .17 | * | | | .20 | | | | .27 | | | | .32 | | | | .43 | | | | .72 | |
| Ratio of net investment income (%) | | | .01 | * | | | .01 | | | | .01 | | | | .01 | | | | .29 | | | | 1.68 | |
a Total return would have been lower had certain expenses not been reduced. b Amount is less than .005% * Annualized ** Not annualized *** Amount is less than $.0005 per share. | |
Portfolio Summary (Unaudited) Investment Portfolio as of June 30, 2013 (Unaudited)
Tax Free Money Fund Investment
| | | Principal Amount ($) | | | Value ($) | |
| | | | |
| Municipal Investments 103.5% | |
| Alabama 1.8% | |
| Alabama, Mobile Industrial Development Board, Dock & Wharf Revenue, Holnam, Inc. Project, Series A, 144A, 0.11%*, 6/1/2032, LOC: Bayerische Landesbank | | | 2,310,000 | | | | 2,310,000 | |
| Alaska 4.8% | |
| Alaska, Eclipse Funding Trust Various States, Solar Eclipse, State Industrial Development & Experiment, 144A, 0.06%*, 10/1/2014, LIQ: U.S. Bank NA, LOC: U.S. Bank NA | | | 5,625,000 | | | | 5,625,000 | |
| Anchorage, AK, General Obligation, Series C, 2.0%, 8/1/2013 | | | 615,000 | | | | 615,913 | |
| | | | | 6,240,913 | |
| Arizona 2.7% | |
| Arizona, Salt River Pima-Maricopa Indian Community, 0.3%*, 10/1/2025, LOC: Bank of America NA | | | 3,545,000 | | | | 3,545,000 | |
| California 12.5% | |
| California, State University Revenue, Series A, Prerefunded 5/1/2014 @ 100, 4.75%, 11/1/2024, INS: AGM | | | 2,200,000 | | | | 2,283,215 | |
| California, Statewide Communities Development Authority, Multi-Family Housing Revenue, Series R-13104CE, 144A, 0.56%*, 9/6/2035, GTY: Citibank NA, LIQ: Citibank NA | | | 4,100,000 | | | | 4,100,000 | |
| California, Wells Fargo Stage Trust, Series 31C, 144A, AMT, 0.25%*, Mandatory Put 8/15/2013 @ 100, 1/1/2022, GTY: Wells Fargo Bank NA, LIQ: Wells Fargo Bank NA | | | 2,000,000 | | | | 2,000,000 | |
| Los Angeles County, CA, General Obligation, Series A, 2.0%, 2/28/2014 (a) | | | 3,000,000 | | | | 3,036,300 | |
| San Jose, CA, Redevelopment Agency, 0.17%, 12/10/2013 | | | 5,000,000 | | | | 5,000,000 | |
| | | | | 16,419,515 | |
| Florida 1.8% | |
| Hillsborough County, FL, Housing Finance Authority, Multi-Family Revenue, Hunt Club Apartments, 0.08%*, 8/15/2041, LOC: SunTrust Bank | | | 2,380,000 | | | | 2,380,000 | |
| Georgia 2.1% | |
| Georgia, State General Obligation: | |
| Series E, 4.0%, 7/1/2013 | | | 2,500,000 | | | | 2,500,000 | |
| Series B, 5.0%, 7/1/2013 | | | 195,000 | | | | 195,000 | |
| | | | | 2,695,000 | |
| Idaho 1.6% | |
| Idaho, State Tax Anticipation Notes, 2.0%, 6/30/2014 (a) | | | 2,000,000 | | | | 2,036,020 | |
| Illinois 14.1% | |
| Channahon, IL, Morris Hospital Revenue, Series D, 0.06%*, 12/1/2032, LOC: U.S. Bank NA | | | 2,840,000 | | | | 2,840,000 | |
| Chicago, IL, Metropolitan Water Reclamation District, Greater Chicago Capital Improvement, Series C, 3.0%, 12/1/2013 | | | 1,575,000 | | | | 1,593,577 | |
| Illinois, State Educational Facilities Authority, State Xavier University Project, Series A, 144A, 0.09%*, 10/1/2032, LOC: LaSalle Bank NA | | | 3,200,000 | | | | 3,200,000 | |
| Illinois, State Finance Authority Industrial Development Revenue, Fitzpatrick Brothers, Inc., 0.08%*, 4/1/2033, LOC: Northern Trust Co. | | | 3,815,000 | | | | 3,815,000 | |
| Illinois, State Toll Highway Authority Revenue, Senior Priority, Series A-2C, 0.06%*, 7/1/2030, LOC: Northern Trust Co. | | | 2,000,000 | | | | 2,000,000 | |
| Illinois, Upper River Valley Development Authority, Industrial Development Revenue, Cathy Asta Enterprises LLC, Series A, 0.21%*, 8/1/2033, LOC: LaSalle Bank NA | | | 5,000,000 | | | | 5,000,000 | |
| | | | | 18,448,577 | |
| Indiana 6.1% | |
| Indiana, IPS Multi-School Building Corp., Series R-885WF, 144A, 0.13%*, 1/15/2025, INS: AGMC, GTY: Wells Fargo & Co., LIQ: Wells Fargo & Co. | | | 3,930,000 | | | | 3,930,000 | |
| Indiana, State Finance Authority, Industrial Revenue, Midwest Fertilizer Corp. Project, 0.2%, Mandatory Put 7/1/2013 @ 100, 7/1/2046 | | | 4,000,000 | | | | 4,000,000 | |
| | | | | 7,930,000 | |
| Kansas 1.9% | |
| Olathe, KS, Health Facilities Revenue, Olathe Medical Center, Inc., 144A, 0.11%*, 9/1/2032, LOC: Bank of America NA | | | 2,500,000 | | | | 2,500,000 | |
| Kentucky 1.7% | |
| Jeffersontown, KY, Lease Program Revenue, State League of Cities Funding Trust, 0.05%*, 3/1/2030, LOC: U.S. Bank NA | | | 2,210,000 | | | | 2,210,000 | |
| Michigan 3.1% | |
| Michigan, State Finance Authority Revenue, Unemployment Obligation Assessment, Series A, 2.0%, 7/1/2013 | | | 4,100,000 | | | | 4,100,000 | |
| Minnesota 0.1% | |
| Coon Rapids, MN, Industrial Development Revenue, Kurt Manufacturing Project, AMT, 0.28%*, 11/1/2017, LOC: U.S. Bank NA | | | 170,000 | | | | 170,000 | |
| Missouri 6.6% | |
| Missouri, Independence Industrial Development Authority Revenue, Series A, 0.23%*, 11/1/2027, LOC: Bank of America NA | | | 3,700,000 | | | | 3,700,000 | |
| Missouri, University of Curators, 0.15%, 7/3/2013 | | | 5,000,000 | | | | 5,000,000 | |
| | | | | 8,700,000 | |
| New Hampshire 2.6% | |
| New Hampshire, State Health & Education Facilities Authority Revenue, Bishop Guertin High School, 0.06%*, 9/1/2032, LOC: TD Bank NA | | | 1,040,000 | | | | 1,040,000 | |
| New Hampshire, State Health & Education Facilities Authority Revenue, Easter Seals Rehabilitation Center, Series A, 0.07%*, 12/1/2034, LOC: Citizens Bank of NH | | | 1,000,000 | | | | 1,000,000 | |
| New Hampshire, State Health & Education Facilities Authority Revenue, Frisbie Memorial Hospital, 0.11%*, 10/1/2013, LOC: TD Bank NA | | | 1,395,000 | | | | 1,395,000 | |
| | | | | 3,435,000 | |
| New Jersey 2.9% | |
| New Jersey, State Economic Development Authority, Cigarette Tax, Prerefunded 6/15/2014 @ 100, 5.75%, 6/15/2029 | | | 3,620,000 | | | | 3,811,595 | |
| New York 7.7% | |
| Monroe County, NY, Industrial Development Corp. Revenue, St. Ann's Home Aged Project, 0.08%*, 12/1/2040, LOC: HSBC Bank U.S.A. NA | | | 2,000,000 | | | | 2,000,000 | |
| New York, State Housing Finance Agency Revenue, Clinton Park Phase II, Series B, 0.18%*, 11/1/2049, LOC: Wells Fargo Bank NA | | | 3,000,000 | | | | 3,000,000 | |
| New York, State Power Authority, 0.17%*, Mandatory Put 9/3/2013 @ 100, 3/1/2020, LIQ: Bank of Nova Scotia | | | 1,500,000 | | | | 1,500,000 | |
| New York City, NY, Transitional Finance Authority Revenue, Future Tax Secured, Series I2, 5.0%, 11/1/2013 | | | 1,000,000 | | | | 1,016,041 | |
| Port Authority of New York & New Jersey, 4.0%, 12/1/2013 | | | 2,500,000 | | | | 2,539,573 | |
| | | | | 10,055,614 | |
| North Carolina 1.9% | |
| North Carolina, State Capital Facilities Finance Agency, Educational Facilities Revenue, Summit School, Inc. Project, 0.07%*, 6/1/2033, LOC: Branch Banking & Trust | | | 2,435,000 | | | | 2,435,000 | |
| Pennsylvania 1.5% | |
| Crawford County, PA, Industrial Development Authority Revenue, Allegheny College, Series B, 0.08%*, 11/1/2039, LOC: PNC Bank NA | | | 2,000,000 | | | | 2,000,000 | |
| Puerto Rico 3.8% | |
| Puerto Rico, RIB Floater Trust, Series 8WE, 144A, 0.11%*, 9/30/2014, LOC: Barclays Bank PLC | | | 4,985,000 | | | | 4,985,000 | |
| Tennessee 5.2% | |
| Metropolitan Government Nashville & Davidson County, TN, Health & Educational Facilities Board, Vanderbilt University, Series C, 4.0%, 10/1/2013 | | | 800,000 | | | | 807,388 | |
| Tennessee, Tennergy Corp., Gas Revenue, Stars Certificates, Series 2006-001, 144A, 0.11%*, 5/1/2016, LOC: BNP Paribas | | | 6,060,000 | | | | 6,060,000 | |
| | | | | 6,867,388 | |
| Texas 11.4% | |
| Angleton, TX, Independent School District, School Building, 3.75%, 2/15/2014 | | | 900,000 | | | | 919,680 | |
| Franklin, TX, Independent School District, 2.0%, 2/15/2014 | | | 500,000 | | | | 505,512 | |
| Harris County, TX, Cultural Education, TECP, 0.23%, 7/9/2013 | | | 5,000,000 | | | | 5,000,000 | |
| Houston, TX, 0.2%, 7/12/2013 | | | 3,500,000 | | | | 3,500,000 | |
| Houston, TX, Public Improvement, Series A, 2.0%, 3/1/2014 | | | 2,150,000 | | | | 2,175,481 | |
| Lubbock, TX, Independent School District Building, 0.13%*, 2/1/2030, SPA: Bank of America NA | | | 600,000 | | | | 600,000 | |
| Texas, State Transportation Revenue, 2.5%, 8/30/2013 | | | 2,150,000 | | | | 2,158,020 | |
| | | | | 14,858,693 | |
| Utah 2.3% | |
| Utah, State General Obligation: | |
| Series C, 4.0%, 7/1/2013 | | | 1,200,000 | | | | 1,200,000 | |
| 5.0%, 7/1/2013 | | | 1,000,000 | | | | 1,000,000 | |
| Series A, 5.0%, 7/1/2013 | | | 800,000 | | | | 800,000 | |
| | | | | 3,000,000 | |
| Washington 1.4% | |
| Seattle, WA, Water System Revenue, Prerefunded 9/1/2013 @ 100, 4.0%, 9/1/2014 | | | 800,000 | | | | 805,052 | |
| Washington, State General Obligation, Series 2010C, 5.0%, 8/1/2013 | | | 1,000,000 | | | | 1,004,151 | |
| | | | | 1,809,203 | |
| Wisconsin 1.9% | |
| Wisconsin, State Health & Educational Facilities Authority Revenue, Ascension Health Alliance Senor Credit Group, Series B, 0.12%**, 11/15/2043 | | | 2,500,000 | | | | 2,500,000 | |
| | | % of Net Assets | | | Value ($) | |
| | | | |
Total Investment Portfolio (Cost $135,442,518)† | | | 103.5 | | | | 135,442,518 | |
| Other Assets and Liabilities, Net | | | (3.5 | ) | | | (4,585,179 | ) |
| Net Assets | | | 100.0 | | | | 130,857,339 | |
* Variable rate demand notes are securities whose interest rates are reset periodically at market levels. These securities are often payable on demand and are shown at their current rates as of June 30, 2013.
** Floating rate securities' yields vary with a designated market index or market rate, such as the coupon-equivalent of the U.S. Treasury Bill rate. These securities are shown at their current rate as of June 30, 2013.
† The cost for federal income tax purposes was $135,442,518.
(a) When-issued security.
144A: Security exempt from registration under Rule 144A of the Securities Act of 1933. These securities may be resold in transactions exempt from registration, normally to qualified institutional buyers.
AGMC: Assured Guaranty Municipal Corp.
AMT: Subject to alternative minimum tax.
GTY: Guaranty Agreement
INS: Insured
LIQ: Liquidity Facility
LOC: Letter of Credit
Prerefunded: Bonds which are prerefunded are collateralized usually by U.S. Treasury securities which are held in escrow and used to pay principal and interest on tax-exempt issues and to retire the bonds in full at the earliest refunding date.
SPA: Standby Bond Purchase Agreement
TECP: Tax-Exempt Commercial Paper
Fair Value Measurements
Various inputs are used in determining the value of the Fund's investments. These inputs are summarized in three broad levels. Level 1 includes quoted prices in active markets for identical securities. Level 2 includes other significant observable inputs (including quoted prices for similar securities, interest rates, prepayment speeds, and credit risk). Level 3 includes significant unobservable inputs (including the Fund's own assumptions in determining the fair value of investments). The inputs or methodology used for valuing securities are not necessarily an indication of the risk associated with investing in those securities. Securities held by the Fund are reflected as Level 2 because the securities are valued at amortized cost (which approximates fair value) and, accordingly, the inputs used to determine value are not quoted prices in an active market.
The following is a summary of the inputs used as of June 30, 2013 in valuing the Fund's investments. For information on the Fund's policy regarding the valuation of investments, please refer to the Security Valuation section of Note A in the accompanying Notes to Financial Statements.
| Assets | | Level 1 | | | Level 2 | | | Level 3 | | | Total | |
| | |
| Municipal Investments (b) | | $ | — | | | $ | 135,442,518 | | | $ | — | | | $ | 135,442,518 | |
| Total | | $ | — | | | $ | 135,442,518 | | | $ | — | | | $ | 135,442,518 | |
There have been no transfers between fair value measurement levels during the period ended June 30, 2013.
(b) See Investment Portfolio for additional detailed categorizations.
The accompanying notes are an integral part of the financial statements.
Statement of Assets and Liabilities | as of June 30, 2013 (Unaudited) | |
| Assets | | Tax Free Money Fund Investment | |
| Investments in securities, valued at amortized cost | | $ | 135,442,518 | |
| Cash | | | 102,987 | |
| Receivable for investments sold | | | 70,000 | |
| Interest receivable | | | 354,135 | |
| Due from Advisor | | | 3,420 | |
| Other assets | | | 9,299 | |
| Total assets | | | 135,982,359 | |
| Liabilities | |
| Payable for investments purchased — when-issued securities | | | 5,072,320 | |
| Distributions payable | | | 1,076 | |
| Accrued Trustees' fees | | | 293 | |
| Other accrued expenses and payables | | | 51,331 | |
| Total liabilities | | | 5,125,020 | |
| Net assets, at value | | $ | 130,857,339 | |
| Net Assets Consist of | |
| Undistributed net investment income | | | 9,718 | |
| Accumulated net realized gain (loss) | | | 15 | |
| Paid-in capital | | | 130,847,606 | |
| Net assets, at value | | $ | 130,857,339 | |
| Net Asset Value | |
Premier Shares Net Asset Value, offering and redemption price per share ($130,857,339 ÷ 130,846,688 shares outstanding, $.01 par value, unlimited number of shares authorized) | | $ | 1.00 | |
The accompanying notes are an integral part of the financial statements.
| for the six months ended June 30, 2013 (Unaudited) | |
| Investment Income | | Tax Free Money Fund Investment | |
Income: Interest | | $ | 148,726 | |
Expenses: Management fee | | | 111,607 | |
| Administration fee | | | 74,405 | |
| Services to shareholders | | | 182,769 | |
| Service fee | | | 185,686 | |
| Custodian fee | | | 3,801 | |
| Professional fees | | | 28,288 | |
| Reports to shareholders | | | 16,170 | |
| Registration fees | | | 10,464 | |
| Trustees' fees and expenses | | | 4,051 | |
| Other | | | 4,059 | |
| Total expenses before expense reductions | | | 621,300 | |
| Expense reductions | | | (480,020 | ) |
| Total expenses after expense reductions | | | 141,280 | |
| Net investment income | | | 7,446 | |
| Net realized gain (loss) from investments | | | 15 | |
| Net increase (decrease) in net assets resulting from operations | | $ | 7,461 | |
The accompanying notes are an integral part of the financial statements.
Statement of Changes in Net Assets | Tax Free Money Fund Investment | |
| Increase (Decrease) in Net Assets | | Six Months Ended June 30, 2013 (Unaudited) | | | Year Ended December 31, 2012 | |
Operations: Net investment income | | $ | 7,446 | | | $ | 13,859 | |
| Net realized gain (loss) from investments | | | 15 | | | | 106 | |
| Net increase (decrease) in net assets resulting from operations | | | 7,461 | | | | 13,965 | |
Distributions to shareholders from: Net investment income: Premier Shares | | | (7,440 | ) | | | (13,766 | ) |
Fund share transactions: Premier Shares Proceeds from shares sold | | | 167,272,062 | | | | 357,014,947 | |
| Reinvestment of distributions | | | 123 | | | | 243 | |
| Payments for shares redeemed | | | (198,664,214 | ) | | | (340,216,839 | ) |
| Net increase (decrease) in net assets from Premier Shares transactions | | | (31,392,029 | ) | | | 16,798,351 | |
| Increase (decrease) in net assets | | | (31,392,008 | ) | | | 16,798,550 | |
| Net assets at beginning of period | | | 162,249,347 | | | | 145,450,797 | |
| Net assets at end of period (including undistributed net investment income of $9,718 and $9,712, respectively) | | $ | 130,857,339 | | | $ | 162,249,347 | |
| Other Information | |
Premier Shares Shares outstanding at beginning of period | | | 162,238,717 | | | | 145,440,366 | |
| Shares sold | | | 167,272,062 | | | | 357,014,947 | |
| Shares issued to shareholders in reinvestment of distributions | | | 123 | | | | 243 | |
| Shares redeemed | | | (198,664,214 | ) | | | (340,216,839 | ) |
| Net increase (decrease) in Fund shares from Premier Shares transactions | | | (31,392,029 | ) | | | 16,798,351 | |
| Shares outstanding at end of period | | | 130,846,688 | | | | 162,238,717 | |
The accompanying notes are an integral part of the financial statements.
Tax Free Money Fund Investment
Premier Shares
| | | | | | Years Ended December 31, | |
| | | Six Months Ended 6/30/13 (Unaudited) | | | 2012 | | | 2011 | | | 2010 | | | 2009 | | | 2008 | |
| Selected Per Share Data | |
| Net asset value, beginning of period | | $ | 1.00 | | | $ | 1.00 | | | $ | 1.00 | | | $ | 1.00 | | | $ | 1.00 | | | $ | 1.00 | |
Income from investment operations: Net investment income | | | .000 | *** | | | .000 | *** | | | .000 | *** | | | .000 | *** | | | .001 | | | | .016 | |
| Net realized gain (loss) | | | .000 | *** | | | .000 | *** | | | .000 | *** | | | .000 | *** | | | .000 | *** | | | .000 | *** |
| Total from investment operations | | | .000 | *** | | | .000 | *** | | | .000 | *** | | | .000 | *** | | | .001 | | | | .016 | |
Less distributions from: Net investment income | | | (.000 | )*** | | | (.000 | )*** | | | (.000 | )*** | | | (.000 | )*** | | | (.001 | ) | | | (.016 | ) |
| Net asset value, end of period | | $ | 1.00 | | | $ | 1.00 | | | $ | 1.00 | | | $ | 1.00 | | | $ | 1.00 | | | $ | 1.00 | |
Total Return (%)a | | | .00 | b** | | | .01 | | | | .01 | | | | .03 | | | | .15 | | | | 1.62 | |
| Ratios to Average Net Assets and Supplemental Data | |
| Net assets, end of period ($ millions) | | | 131 | | | | 162 | | | | 145 | | | | 164 | | | | 173 | | | | 136 | |
| Ratio of expenses before expense reductions (%) | | | .84 | * | | | .85 | | | | .86 | | | | .81 | | | | .82 | | | | .81 | |
| Ratio of expenses after expense reductions (%) | | | .19 | * | | | .26 | | | | .31 | | | | .42 | | | | .64 | | | | .76 | |
| Ratio of net investment income (%) | | | .01 | * | | | .01 | | | | .01 | | | | .01 | | | | .14 | | | | 1.64 | |
a Total return would have been lower had certain expenses not been reduced. b Amount is less than .005% * Annualized ** Not annualized *** Amount is less than $.0005 per share. | |
Notes to Financial Statements (Unaudited)
A. Organization and Significant Accounting Policies
NY Tax Free Money Fund and Tax Free Money Fund Investment (each a "Fund,'' and collectively, the "Funds'') are each a diversified series of DWS Money Market Trust (the "Trust''), which is registered under the Investment Company Act of 1940, as amended (the "1940 Act"), as an open-end management investment company organized as a Massachusetts business trust.
NY Tax Free Money Fund offers two classes of shares: Investment Class and Tax-Exempt New York Money Market Fund. The financial highlights for Tax-Exempt New York Money Market Fund are provided separately and are available upon request.
Tax Free Money Fund Investment offers one class of shares, Premier Shares.
Investment income, realized gains and losses, and certain fund-level expenses and expense reductions, if any, are borne pro rata on the basis of relative net assets by the holders of all classes of shares, except that each class bears certain expenses unique to that class such as distribution and service fees, services to shareholders and certain other class-specific expenses. Differences in class-level expenses may result in payment of different per share dividends by class. All shares of each Fund have equal rights with respect to voting subject to class-specific arrangements.
The Funds' financial statements are prepared in accordance with accounting principles generally accepted in the United States of America which require the use of management estimates. Actual results could differ from those estimates. The policies described below are followed consistently by the Funds in the preparation of their financial statements.
Security Valuation. Various inputs are used in determining the value of the Funds' investments. These inputs are summarized in three broad levels. Level 1 includes quoted prices in active markets for identical securities. Level 2 includes other significant observable inputs (including quoted prices for similar securities, interest rates, prepayment speeds, and credit risk). Level 3 includes significant unobservable inputs (including the Funds' own assumptions in determining the fair value of investments). The inputs or methodology used for valuing securities are not necessarily an indication of the risk associated with investing in those securities.
The Funds value all securities utilizing the amortized cost method permitted in accordance with Rule 2a-7 under the 1940 Act and certain conditions therein. Under this method, which does not take into account unrealized capital gains or losses on securities, an instrument is initially valued at its cost and thereafter assumes a constant accretion/amortization rate to maturity of any discount or premium. Securities held by the Funds are reflected as Level 2 because the securities are valued at amortized cost (which approximates fair value) and, accordingly, the inputs used to determine value are not quoted prices in an active market.
Disclosure about the classification of fair value measurements is included in a table following each Fund's Investment Portfolio.
When-Issued/Delayed Delivery Securities. Each Fund may purchase or sell securities with delivery or payment to occur at a later date beyond the normal settlement period. At the time the Fund enters into a commitment to purchase or sell a security, the transaction is recorded and the value of the transaction is reflected in the net asset value. The price of such security and the date when the security will be delivered and paid for are fixed at the time the transaction is negotiated. Due to fluctuations in the value of securities purchased or sold on a when-issued or delayed-delivery basis, the yields obtained on such securities may be higher or lower than the yield available in the market on the dates when the investments are actually delivered to the buyers. At the time the Fund enters into this type of transaction, it is required to segregate cash or other liquid assets at least equal to the amount of the commitment.
Certain risks may arise upon entering into when-issued or delayed delivery transactions from the potential inability of counterparties to meet the terms of their contracts or if the issuer does not issue the securities.
Federal Income Taxes. Each Fund's policy is to comply with the requirements of the Internal Revenue Code, as amended, which are applicable to regulated investment companies, and to distribute all of its taxable and tax-exempt income to its shareholders.
Under the Regulated Investment Company Modernization Act of 2010, net capital losses incurred post-enactment may be carried forward indefinitely, and their character is retained as short-term and/or long-term. Previously, net capital losses were carried forward for eight years and treated as short-term losses. As a transition rule, the Act requires that post-enactment net capital losses be used before pre-enactment net capital losses.
At December 31, 2012, NY Tax Free Money Fund had a net tax basis capital loss carryforward of approximately $2,000, including $1,000 of pre-enactment losses which may be applied against any realized net taxable capital gains of each succeeding year until fully utilized or until December 31, 2018, the expiration date, whichever occurs first, and $1,000 of post-enactment short-term losses which may be applied against realized net taxable capital gains indefinitely.
Each Fund has reviewed the tax positions for the open tax years as of December 31, 2012 and has determined that no provision for income tax is required in each Fund's financial statements. Each Fund's federal tax returns for the prior three fiscal years remains open subject to examination by the Internal Revenue Service.
Distributions of Income and Gains. Net investment income of each Fund is declared as a daily dividend and is distributed to shareholders monthly. Each Fund may take into account capital gains and losses in its daily dividend declarations. Each Fund may also make additional distributions for tax purposes if necessary.
Permanent book and tax differences relating to shareholder distributions will result in reclassifications to paid-in capital. Temporary book and tax differences will reverse in a subsequent period. There were no significant book to tax differences for the Funds.
The tax character of current year distributions will be determined at the end of the current fiscal year.
Expenses. Expenses of the Trust arising in connection with a specific fund are allocated to that fund. Other Trust expenses which cannot be directly attributed to a fund are apportioned among the funds in the Trust based upon the relative net assets or other appropriate measures.
Contingencies. In the normal course of business, the Funds may enter into contracts with service providers that contain general indemnification clauses. The Funds' maximum exposure under these arrangements is unknown as this would involve future claims that may be made against the Funds that have not yet been made. However, based on experience, the Funds expect the risk of loss to be remote.
Other. Investment transactions are accounted for on trade date. Interest income is recorded on the accrual basis. Realized gains and losses from investment transactions are recorded on an identified cost basis. All discounts and premiums are accreted/amortized for both tax and financial reporting purposes.
B. Related Parties
Management Agreement. Under an Investment Management Agreement with Deutsche Investment Management Americas Inc. ("DIMA" or the "Advisor"), an indirect, wholly owned subsidiary of Deutsche Bank AG, the Advisor directs the investments of each Fund in accordance with its investment objectives, policies and restrictions. The Advisor determines the securities, instruments and other contracts relating to investments to be purchased, sold or entered into by each Fund.
Under each Investment Management Agreement with the Advisor, NY Tax Free Money Fund and Tax Free Money Fund Investment pay an annual management fee of 0.12% and 0.15%, respectively, based on each Fund's average daily net assets, computed and accrued daily and payable monthly.
For the period from January 1, 2013 through April 30, 2014, the Advisor has contractually agreed to waive its fees and/or reimburse certain operating expenses of Tax Free Money Fund Investment — Premier Shares to the extent necessary to maintain the operating expenses (excluding certain expenses such as extraordinary expenses, taxes, brokerage and interest) at 0.80% of its average daily net assets.
The Advisor has voluntarily agreed to waive its fees and/or reimburse certain operating expenses of NY Tax Free Money Fund — Investment Class to the extent necessary to maintain the operating expenses (excluding certain expenses such as extraordinary expenses, taxes, brokerage and interest) at 0.80% of its average daily net assets.
In addition, the Advisor has agreed to voluntarily waive additional expenses. The waiver may be changed or terminated at any time without notice. Under these arrangements, the Advisor waived certain expenses for NY Tax Free Money Fund and Tax Free Money Fund Investment.
Accordingly, for the six months ended June 30, 2013, the amount charged to each Fund by the Advisor was as follows:
| | | Total Aggregated | | | Waived | | | Annualized Effective Rate | |
| NY Tax Free Money Fund | | $ | 34,751 | | | $ | 34,751 | | | | .00 | % |
| Tax Free Money Fund Investment | | $ | 111,607 | | | $ | 111,607 | | | | .00 | % |
Administration Fee. Pursuant to an Administrative Services Agreement, DIMA provides most administrative services to each Fund. For all services provided under the Administrative Services Agreement, each Fund pays the Advisor an annual fee ("Administration Fee") of 0.10% of each Fund's average daily net assets, computed and accrued daily and payable monthly. For the six months ended June 30, 2013, the Administration Fee was as follows:
| | | Total Aggregated | | | Waived | | | Unpaid at June 30, 2013 | |
| NY Tax Free Money Fund | | $ | 28,959 | | | $ | 28,959 | | | $ | — | |
| Tax Free Money Fund Investment | | $ | 74,405 | | | $ | 381 | | | $ | 10,512 | |
In addition, the Advisor waived $40,518 of other expenses for NY Tax Free Money Fund.
Service Provider Fees. DWS Investments Service Company ("DISC"), an affiliate of the Advisor, is the transfer agent, dividend-paying agent and shareholder service agent for each Fund. Pursuant to a sub-transfer agency agreement between DISC and DST Systems, Inc. ("DST"), DISC has delegated certain transfer agent, dividend-paying agent and shareholder service agent functions to DST. DISC compensates DST out of the shareholder servicing fee it receives from each Fund. For the six months ended June 30, 2013, the amounts charged to each Fund by DISC was as follows:
| Services to Shareholders | | Total Aggregated | | | Waived | | | Unpaid at June 30, 2013 | |
| NY Tax Free Money Fund: Investment Class | | $ | 54,300 | | | $ | 54,300 | | | $ | — | |
| NY Tax Free Money Fund: Tax-Exempt New York Money Fund | | $ | 7,129 | | | $ | 7,097 | | | $ | 32 | |
Tax Free Money Fund Investment: Premier Shares | | $ | 182,346 | | | $ | 182,346 | | | $ | — | |
Distribution and Service Fees. DWS Investments Distributors, Inc. ("DIDI") is each Fund's distributor. The Tax-Exempt New York Money Market Fund shares of NY Tax Free Money Fund pays DIDI an annual fee, pursuant to a Rule 12b-1 plan, based on an annual rate of 0.50% of the Tax-Exempt New York Money Market Fund shares' average daily net assets, which is calculated daily and payable monthly. For the six months ended June 30, 2013, the Distribution Fee was as follows:
| Distribution Fee | | Total Aggregated | | | Waived | |
NY Tax Free Money Fund: Tax-Exempt New York Money Market Fund | | $ | 30,237 | | | $ | 30,237 | |
In addition, DIDI provides information and administrative services for a fee ("Service Fee") at an annual rate of up to 0.25% of average daily net assets for NY Tax Free Money Fund — Investment Class and Tax Free Money Fund Investment — Premier Shares. DIDI in turn has various agreements with financial services firms that provide these services and pays these fees based upon the assets of the shareholder accounts the firms service. For the six months ended June 30, 2013, the Service Fee was as follows:
| Service Fee | | Total Aggregated | | | Waived | | | Annualized Effective Rate | |
| NY Tax Free Money Fund: Investment Class | | $ | 43,841 | | | $ | 43,841 | | | | .00 | % |
| Tax Free Money Fund Investment: Premier Shares | | $ | 185,686 | | | $ | 185,686 | | | | .00 | % |
Typesetting and Filing Service Fees. Under an agreement with DIMA, DIMA is compensated for providing typesetting and certain regulatory filing services to each Fund. For the six months ended June 30, 2013, the amount charged to each Fund by DIMA included in the Statement of Operations under "reports to shareholders" is as follows:
| | | Total Aggregated | | | Unpaid at June 30, 2013 | |
| NY Tax Free Money Fund | | $ | 10,681 | | | $ | 10,548 | |
| Tax Free Money Fund Investment | | $ | 5,310 | | | $ | 5,310 | |
Trustees' Fees and Expenses. Each Fund paid retainer fees to each Trustee not affiliated with the Advisor, plus specified amounts to the Board Chairperson and Vice Chairperson and to each committee Chairperson.
C. Line of Credit
The Funds and other affiliated funds (the "Participants") share in a $375 million revolving credit facility provided by a syndication of banks. The Funds may borrow for temporary or emergency purposes, including the meeting of redemption requests that otherwise might require the untimely disposition of securities. The Participants are charged an annual commitment fee which is allocated based on net assets, among each of the Participants. Interest is calculated at a rate per annum equal to the sum of the Federal Funds Rate plus 1.25 percent plus if LIBOR exceeds the Federal Funds Rate the amount of such excess. The Funds may borrow up to a maximum of 33 percent of their net assets under the agreement. The Funds had no outstanding loans at June 30, 2013.
D. Concentration of Ownership
From time to time, the Funds may have a concentration of several shareholder accounts holding a significant percentage of shares outstanding. Investment activities of these shareholder accounts could have a material impact on the Funds.
At June 30, 2013, two shareholder accounts held approximately 55% and 21% of the outstanding shares of the NY Tax Free Money Fund and one shareholder account held approximately 99% of the outstanding shares of Tax Free Money Fund Investment.
Information About Each Fund's Expenses
As an investor of a Fund, you incur two types of costs: ongoing expenses and transaction costs. Ongoing expenses include management fees, distribution and service (12b-1) fees, and other Fund expenses. Examples of transaction costs include account maintenance fees, which are not shown in this section. The following tables are intended to help you understand your ongoing expenses (in dollars) of investing in each Fund and to help you compare these expenses with the ongoing expenses of investing in other mutual funds. In the most recent six-month period, each Fund limited these expenses; had they not done so, expenses would have been higher. The example in the table is based on an investment of $1,000 invested at the beginning of the six-month period and held for the entire period (January 1, 2013 to June 30, 2013).
The tables illustrate your Fund's expenses in two ways:
•Actual Fund Return. This helps you estimate the actual dollar amount of ongoing expenses (but not transaction costs) paid on a $1,000 investment in the Fund using the Fund's actual return during the period. To estimate the expenses you paid over the period, simply divide your account value by $1,000 (for example, an $8,600 account value divided by $1,000 = 8.6), then multiply the result by the number in the "Expenses Paid per $1,000" line under the share class you hold.
•Hypothetical 5% Fund Return. This helps you to compare your Fund's ongoing expenses (but not transaction costs) with those of other mutual funds using the Fund's actual expense ratio and a hypothetical rate of return of 5% per year before expenses. Examples using a 5% hypothetical fund return may be found in the shareholder reports of other mutual funds. The hypothetical account values and expenses may not be used to estimate the actual ending account balance or expenses you paid for the period.
Please note that the expenses shown in these tables are meant to highlight your ongoing expenses only and do not reflect any transaction costs. The "Expenses Paid per $1,000" line of the tables is useful in comparing ongoing expenses only and will not help you determine the relative total expense of owning different funds. If these transaction costs had been included, your costs would have been higher.
NY Tax Free Money Fund
Expenses and Value of a $1,000 Investment for the six months ended June 30, 2013 (Unaudited) | |
| Actual Fund Return | | Investment Class | |
| Beginning Account Value 1/1/13 | | $ | 1,000.00 | |
| Ending Account Value 6/30/13 | | $ | 1,000.05 | |
| Expenses Paid per $1,000* | | $ | .84 | |
| Hypothetical 5% Fund Return | | Investment Class | |
| Beginning Account Value 1/1/13 | | $ | 1,000.00 | |
| Ending Account Value 6/30/13 | | $ | 1,023.95 | |
| Expenses Paid per $1,000* | | $ | .85 | |
* Expenses are equal to the Fund's annualized expense ratio for each share class, multiplied by the average account value over the period, multiplied by 181 (the number of days in the most recent six-month period), then divided by 365.
| Annualized Expense Ratio | Investment Class |
| NY Tax Free Money Fund | .17% |
For more information, please refer to the Fund's prospectus.
For an analysis of the fees associated with an investment in the Fund or similar funds, please refer to http://apps.finra.org/fundanalyzer/1/fa.aspx.
Tax Free Money Fund Investment
Expenses and Value of a $1,000 Investment for the six months ended June 30, 2013 (Unaudited) | | | |
| Actual Fund Return | | Premier Shares | |
| Beginning Account Value 1/1/13 | | $ | 1,000.00 | |
| Ending Account Value 6/30/13 | | $ | 1,000.05 | |
| Expenses Paid per $1,000* | | $ | .94 | |
| Hypothetical 5% Fund Return | | Premier Shares | |
| Beginning Account Value 1/1/3 | | $ | 1,000.00 | |
| Ending Account Value 6/30/13 | | $ | 1,023.85 | |
| Expenses Paid per $1,000* | | $ | .95 | |
* Expenses are equal to the Fund's annualized expense ratio, multiplied by the average account value over the period, multiplied by 181 (the number of days in the most recent six-month period), then divided by 365.
| Annualized Expense Ratios | Premier Shares |
| Tax Free Money Fund Investment | .19% |
For more information, please refer to the Fund's prospectus.
For an analysis of the fees associated with an investment in the Fund or similar funds, please refer to http://apps.finra.org/fundanalyzer/1/fa.aspx.
Money Market Fund Reform
In June 2013, the SEC proposed money market fund reform intended to address perceived systemic risks associated with money market funds and to improve transparency for money market fund investors. The Financial Stability Oversight Council (FSOC), a board of U.S. regulators established by the Dodd-Frank Act, had also previously proposed similar recommendations for money market fund reform. If one or more of the SEC or FSOC proposals for money market fund reform were to be adopted in the future, such regulatory action may affect the fund's operations and/or return potential.
Summary of Management Fee Evaluation by Independent Fee Consultant
September 17, 2012
Pursuant to an Order entered into by Deutsche Investment Management Americas and affiliates (collectively, "DeAM") with the Attorney General of New York, I, Thomas H. Mack, have been appointed the Independent Fee Consultant for the DWS Funds (formerly the DWS Scudder Funds). My duties include preparing an annual written evaluation of the management fees DeAM charges the Funds, considering among other factors the management fees charged by other mutual fund companies for like services, management fees DeAM charges other clients for like services, DeAM's costs of supplying services under the management agreements and related profit margins, possible economies of scale if a Fund grows larger, and the nature and quality of DeAM's services, including fund performance. This report summarizes my evaluation for 2012, including my qualifications, the evaluation process for each of the DWS Funds, consideration of certain complex-level factors, and my conclusions. I served in substantially the same capacity in 2007, 2008, 2009, 2010 and 2011.
Qualifications
For more than 35 years I have served in various professional capacities within the investment management business. I have held investment analysis and advisory positions, including securities analyst, portfolio strategist and director of investment policy with a large investment firm. I have also performed business management functions, including business development, financial management and marketing research and analysis.
Since 1991, I have been an independent consultant within the asset management industry. I have provided services to over 125 client organizations, including investment managers, mutual fund boards, product distributors and related organizations. Over the past ten years I have completed a number of assignments for mutual fund boards, specifically including assisting boards with management contract renewal.
I hold a Master of Business Administration degree, with highest honors, from Harvard University and Master of Science and Bachelor of Science (highest honors) degrees from the University of California at Berkeley. I am an independent director and audit committee financial expert for two closed-end mutual funds and have served in various leadership and financial oversight capacities with non-profit organizations.
Evaluation of Fees for each DWS Fund
My work focused primarily on evaluating, fund-by-fund, the fees charged to each of the 103 mutual fund portfolios in the DWS Fund family. For each Fund, I considered each of the key factors mentioned above, as well as any other relevant information. In doing so I worked closely with the Funds' Independent Directors in their annual contract renewal process, as well as in their approval of contracts for several new funds (documented separately).
In evaluating each Fund's fees, I reviewed comprehensive materials provided by or on behalf of DeAM, including expense information prepared by Lipper Analytical, comparative performance information, profitability data, manager histories, and other materials. I also accessed certain additional information from the Lipper and Morningstar databases and drew on my industry knowledge and experience.
To facilitate evaluating this considerable body of information, I prepared for each Fund a document summarizing the key data elements in each area as well as additional analytics discussed below. This made it possible to consider each key data element in the context of the others.
In the course of contract renewal, DeAM agreed to implement a number of fee and expense adjustments requested by the Independent Directors which will favorably impact future fees and expenses, and my evaluation includes the effects of these changes.
Fees and Expenses Compared with Other Funds
The competitive fee and expense evaluation for each fund focused on two primary comparisons:
The Fund's contractual management fee (the advisory fee plus the administration fee where applicable) compared with those of a group of typically 12-15 funds in the same Lipper investment category (e.g. Large Capitalization Growth) having similar distribution arrangements and being of similar size.
The Fund's total expenses compared with a broader universe of funds from the same Lipper investment category and having similar distribution arrangements.
These two comparisons provide a view of not only the level of the fee compared with funds of similar scale but also the total expense the Fund bears for all the services it receives, in comparison with the investment choices available in the Fund's investment category and distribution channel. The principal figure-of-merit used in these comparisons was the subject Fund's percentile ranking against peers.
DeAM's Fees for Similar Services to Others
DeAM provided management fee schedules for all of its US domiciled fund and non-fund investment management accounts in any of the investment categories where there is a DWS Fund. These similar products included the other DWS Funds, non-fund pooled accounts, institutional accounts and sub-advisory accounts. Using this information, I calculated for each Fund the fee that would be charged to each similar product, at the subject Fund's asset level.
Evaluating information regarding non-fund products is difficult because there are varying levels of services required for different types of accounts, with mutual funds generally requiring considerably more regulatory and administrative types of service as well as having more frequent cash flows than other types of accounts. Also, while mutual fund fees for similar fund products can be expected to be similar, there will be some differences due to different pricing conditions in different distribution channels (e.g. retail funds versus those used in variable insurance products), differences in underlying investment processes and other factors.
Costs and Profit Margins
DeAM provided a detailed profitability analysis for each Fund. After making some adjustments so that the presentation would be more comparable to the available industry figures, I reviewed profit margins from investment management alone, from investment management plus other fund services (excluding distribution) provided to the Funds by DeAM (principally shareholder services), and DeAM profits from all sources, including distribution. A later section comments on overall profitability.
Economies of Scale
Economies of scale — an expected decline in management cost per dollar of fund assets as fund assets grow — are very rarely quantified and documented because of inherent difficulties in collecting and analyzing relevant data. However, in virtually every investment category that I reviewed, larger funds tend to have lower fees and lower total expenses than smaller funds. To see how each DWS Fund compares with this industry observation, I reviewed:
The trend in Fund assets over the last five years and the accompanying trend in total expenses. This shows if the Fund has grown and, if so, whether total expense (management fees as well as other expenses) have declined as a percent of assets.
Whether the Fund has break-points in its management fee schedule, the extent of the fee reduction built into the schedule and the asset levels where the breaks take effect, and in the case of a sub-advised Fund how the Fund's break-points compare with those of the sub-advisory fee schedule.
How the Fund's contractual fee schedule compares with trends in the industry data. To accomplish this, I constructed a chart showing how actual latest-fiscal-year contractual fees of the Fund and of other similar funds relate to average fund assets, with the subject Fund's contractual fee schedule superimposed.
Quality of Service — Performance
The quality-of-service evaluation focused on investment performance, which is the principal result of the investment management service. Each Fund's performance was reviewed over the past 1, 3, 5 and 10 years, as applicable, and compared with that of other funds in the same investment category and with a suitable market index.
In addition, I calculated and reviewed risk-adjusted returns relative to an index of similar mutual funds' returns and a suitable market index. The risk-adjusted returns analysis provides a way of determining the extent to which the Fund's return comparisons are mainly the product of investment value-added (or lack thereof) or alternatively taking considerably more or less risk than is typical in its investment category.
I also received and considered the history of portfolio manager changes for each Fund, as this provided an important context for evaluating the performance results.
Complex-Level Considerations
While this evaluation was conducted mainly at the individual fund level, there are some issues relating to the reasonableness of fees that can alternatively be considered across the whole fund complex:
I reviewed DeAM's profitability analysis for all DWS Funds, with a view toward determining if the allocation procedures used were reasonable and how profit levels compared with public data for other investment managers.
I considered whether DeAM and affiliates receive any significant ancillary or "fallout" benefits that should be considered in interpreting the direct profitability results. These would be situations where serving as the investment manager of the Funds is beneficial to another part of the Deutsche Bank organization.
I considered how aggregated DWS Fund expenses had varied over the years, by asset class and in the context of trends in asset levels.
I considered how aggregated DWS Fund performance measures relative to appropriate peers had varied by asset class and over time.
I reviewed the structure of the DeAM organization, trends in staffing levels, and information on compensation of investment management and other professionals compared with industry data.
Findings
Based on the process and analysis discussed above, which included reviewing a wide range of information from management and external data sources and considering among other factors the fees DeAM charges other clients, the fees charged by other fund managers, DeAM's costs and profits associated with managing the Funds, economies of scale, possible fall-out benefits, and the nature and quality of services provided, in my opinion the management fees charged the DWS Funds are reasonable.
Thomas H. Mack
President, Thomas H. Mack & Co., Inc.
Account Management Resources | |
| Automated Information Line | | Institutional Investor Services (800) 703-1313 Personalized account information, information on other DeAM funds and services via touchtone telephone and the ability to exchange or redeem shares. |
| For More Information | | (800) 730-1313, option 1 To speak with a fund service representative. |
| Written Correspondence | | Deutsche Asset & Wealth Management PO Box 219210 Kansas City, MO 64121-9210 |
| Proxy Voting | | The fund's policies and procedures for voting proxies for portfolio securities and information about how the fund voted proxies related to its portfolio securities during the 12-month period ended June 30 are available on our Web site — www.dws-investments.com (click on "proxy voting"at the bottom of the page) — or on the SEC's Web site — www.sec.gov. To obtain a written copy of the fund's policies and procedures without charge, upon request, call us toll free at (800) 621-1048. |
| Portfolio Holdings | | Following the fund's fiscal first and third quarter-end, a complete portfolio holdings listing is filed with the SEC on Form N-Q. In addition, each month, information about the fund and its portfolio holdings is filed with the SEC on Form N-MFP. The SEC delays the public availability of the information filed on Form N-MFP for 60 days after the end of the reporting period included in the filing. These forms will be available on the SEC's Web site at www.sec.gov, and they may also be reviewed and copied at the SEC's Public Reference Room in Washington, D.C. Information on the operation of the SEC's Public Reference Room may be obtained by calling (800) SEC-0330. The fund's portfolio holdings are also posted on www.dws-investments.com from time to time. Please see the fund's current prospectus for more information. |
| Principal Underwriter | | If you have questions, comments or complaints, contact: DWS Investments Distributors, Inc. 222 South Riverside Plaza Chicago, IL 60606-5808 www.dws-investments.com (800) 621-1148 |
| | | NY Tax Free Money Fund — Investment Class | Tax Free Money Fund Investment — Premier Shares |
| Nasdaq Symbol | | BNYXX | BTXXX |
| CUSIP Number | | 23337T 805 | 23337T 888 |
| Fund Number | | 844 | 839 |
| FACTS | What Does Deutsche Asset & Wealth Management Do With Your Personal Information? |
| Why? | Financial companies choose how they share your personal information. Federal law gives consumers the right to limit some but not all sharing. Federal law also requires us to tell you how we collect, share and protect your personal information. Please read this notice carefully to understand what we do. |
| What? | The types of personal information we collect and share can include: • Social Security number • Account balances • Purchase and transaction history • Bank account information • Contact information such as mailing address, e-mail address and telephone number |
| How? | All financial companies need to share customers' personal information to run their everyday business. In the section below, we list the reasons financial companies can share their customers' personal information, the reasons Deutsche Asset & Wealth Management chooses to share and whether you can limit this sharing. |
| Reasons we can share your personal information | Does Deutsche Asset & Wealth Management share? | Can you limit this sharing? |
For our everyday business purposes — such as to process your transactions, maintain your account(s), respond to court orders or legal investigations | Yes | No |
For our marketing purposes — to offer our products and services to you | Yes | No |
| For joint marketing with other financial companies | No | We do not share |
For our affiliates' everyday business purposes — information about your transactions and experiences | No | We do not share |
For our affiliates' everyday business purposes — information about your creditworthiness | No | We do not share |
| For non-affiliates to market to you | No | We do not share |
| Questions? | Call (800) 728-3337 or e-mail us at dws-investments.info@dws.com |
| Who we are |
| Who is providing this notice? | DWS Investments Distributors, Inc.; Deutsche Investment Management Americas Inc.; DeAM Investor Services, Inc.; DWS Trust Company; the DWS Funds |
| What we do |
| How does Deutsche Asset & Wealth Management protect my personal information? | To protect your personal information from unauthorized access and use, we use security measures that comply with federal law. These measures include computer safeguards and secured files and buildings. |
| How does Deutsche Asset & Wealth Management collect my personal information? | We collect your personal information, for example. When you: • open an account • give us your contact information • provide bank account information for ACH or wire transactions • tell us where to send money • seek advice about your investments |
| Why can't I limit all sharing? | Federal law gives you the right to limit only • sharing for affiliates' everyday business purposes — information about your creditworthiness • affiliates from using your information to market to you • sharing for nonaffiliates to market to you State laws and individual companies may give you additional rights to limit sharing. |
| Definitions |
| Affiliates | Companies related by common ownership or control. They can be financial or non-financial companies. Our affiliates include financial companies with the DWS or Deutsche Bank ("DB") name, such as DB AG Frankfurt and DB Alex Brown. |
| Non-affiliates | Companies not related by common ownership or control. They can be financial and non-financial companies. Non-affiliates we share with include account service providers, service quality monitoring services, mailing service providers and verification services to help in the fight against money laundering and fraud. |
| Joint marketing | A formal agreement between non-affiliated financial companies that together market financial products or services to you. Deutsche Asset & Wealth Management does not jointly market. |
Pursuant to the requirements of the Securities Exchange Act of 1934 and the Investment Company Act of 1940, the registrant has duly caused this report to be signed on its behalf by the undersigned, thereunto duly authorized.
Pursuant to the requirements of the Securities Exchange Act of 1934 and the Investment Company Act of 1940, this report has been signed below by the following persons on behalf of the registrant and in the capacities and on the dates indicated.