WASHINGTON, D. C. 20549
June 30, 2014
Semiannual Report
to Shareholders
Cash Reserves Fund Institutional
Contents
Cash Reserves Fund Institutional 4 Statement of Assets and Liabilities 5 Statement of Operations 6 Statement of Changes in Net Assets 8 Notes to Financial Statements 12 Information About Your Fund's Expenses Cash Management Portfolio 37 Statement of Assets and Liabilities 38 Statement of Operations 39 Statement of Changes in Net Assets 41 Notes to Financial Statements 45 Advisory Agreement Board Considerations and Fee Evaluation 50 Account Management Resources |
This report must be preceded or accompanied by a prospectus. To obtain a summary prospectus, if available, or prospectus for any of our funds, refer to the Account Management Resources information provided in the back of this booklet. We advise you to consider the fund's objectives, risks, charges and expenses carefully before investing. The summary prospectus and prospectus contain this and other important information about the fund. Please read the prospectus carefully before you invest.
An investment in this fund is not insured or guaranteed by the Federal Deposit Insurance Corporation (FDIC) or by any other government agency. Although the fund seeks to preserve the value of your investment at $1.00 per share, it is possible to lose money by investing in the fund. The share price of money market funds can fall below the $1.00 share price. You should not rely on or expect the Advisor to enter into support agreements or take other actions to maintain the fund's $1.00 share price. The credit quality of the fund's holdings can change rapidly in certain markets, and the default of a single holding could have an adverse impact on the fund's share price. The fund's share price can also be negatively affected during periods of high redemption pressures and/or illiquid markets. The actions of a few large investors of the fund may have a significant adverse effect on the share price of the fund. See the prospectus for specific details regarding the fund's risk profile.
NOT FDIC/NCUA INSURED NO BANK GUARANTEE MAY LOSE VALUE NOT A DEPOSIT NOT INSURED BY ANY FEDERAL GOVERNMENT AGENCY
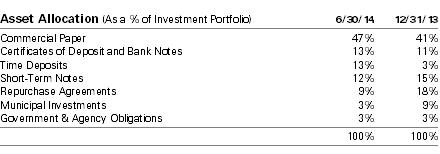
Portfolio Summary (Unaudited)
Statement of Assets and Liabilities | as of June 30, 2014 (Unaudited) | |
| Assets | |
| Investment in Cash Management Portfolio, at value | | $ | 967,709,592 | |
| Receivable for Fund shares sold | | | 72,856 | |
| Due from Advisor | | | 1,445 | |
| Other assets | | | 13,154 | |
| Total assets | | | 967,797,047 | |
| Liabilities | |
| Distributions payable | | | 1,133 | |
| Accrued Trustees' fees | | | 911 | |
| Other accrued expenses and payables | | | 96,173 | |
| Total liabilities | | | 98,217 | |
| Net assets, at value | | $ | 967,698,830 | |
| Net Assets Consist of | |
| Accumulated net realized gain (loss) | | | (239,012 | ) |
| Paid-in capital | | | 967,937,842 | |
| Net assets, at value | | $ | 967,698,830 | |
| Net Asset Value | |
Net Asset Value, offering and redemption price per share ($967,698,830 ÷ 968,147,616 outstanding shares of beneficial interest, $.01 par value, unlimited number of shares authorized) | | $ | 1.00 | |
The accompanying notes are an integral part of the financial statements.
| for the period ended June 30, 2014 (Unaudited) | |
| Investment Income | |
Income and expenses allocated from Cash Management Portfolio: Interest | | $ | 1,357,760 | |
| Expenses* | | | (1,016,795 | ) |
| Net investment income allocated from Cash Management Portfolio | | | 340,965 | |
Expenses: Administration fee | | | 730,478 | |
| Services to shareholders | | | 27,519 | |
| Service fees | | | 2,551 | |
| Professional fees | | | 17,301 | |
| Reports to shareholders | | | 17,010 | |
| Registration fees | | | 12,660 | |
| Trustees' fees and expenses | | | 2,896 | |
| Other | | | 17,053 | |
| Total expenses before expense reductions | | | 827,468 | |
| Expense reductions | | | (559,589 | ) |
| Total expenses after expense reductions | | | 267,879 | |
| Net investment income | | | 73,086 | |
| Net realized gain (loss) allocated from Cash Management Portfolio | | | (108 | ) |
| Net increase (decrease) in net assets resulting from operations | | $ | 72,978 | |
* Net of $207,788 Advisor reimbursement allocated from Cash Management Portfolio for the six months ended June 30, 2014.
The accompanying notes are an integral part of the financial statements.
Statement of Changes in Net Assets | Increase (Decrease) in Net Assets | | Six Months Ended June 30, 2014 (Unaudited) | | | Year Ended December 31, 2013 | |
Operations: Net investment income | | $ | 73,086 | | | $ | 375,228 | |
Operations: Net investment income | | $ | 73,086 | | | $ | 375,228 | |
| Net realized gain (loss) | | | (108 | ) | | | 22,534 | |
| Net increase (decrease) in net assets resulting from operations | | | 72,978 | | | | 397,762 | |
Distributions to shareholders from: Net investment income | | | (73,086 | ) | | | (396,227 | ) |
Fund share transactions: Proceeds from shares sold | | | 7,782,043,797 | | | | 20,444,803,483 | |
| Reinvestment of distributions | | | 48,993 | | | | 270,851 | |
| Payments for shares redeemed | | | (8,181,041,317 | ) | | | (20,735,692,063 | ) |
| Net increase (decrease) in net assets from Fund share transactions | | | (398,948,527 | ) | | | (290,617,729 | ) |
| Increase (decrease) in net assets | | | (398,948,635 | ) | | | (290,616,194 | ) |
| Net assets at beginning of period | | | 1,366,647,465 | | | | 1,657,263,659 | |
| Net assets at end of period (including undistributed net investment income of $0 and $0, respectively) | | $ | 967,698,830 | | | $ | 1,366,647,465 | |
| Other Information | |
| Shares outstanding at beginning of period | | | 1,367,096,143 | | | | 1,657,713,872 | |
| Shares sold | | | 7,782,043,797 | | | | 20,444,803,483 | |
| Shares issued to shareholders in reinvestment of distributions | | | 48,993 | | | | 270,851 | |
| Shares redeemed | | | (8,181,041,317 | ) | | | (20,735,692,063 | ) |
| Net increase (decrease) in Fund shares | | | (398,948,527 | ) | | | (290,617,729 | ) |
| Shares outstanding at end of period | | | 968,147,616 | | | | 1,367,096,143 | |
The accompanying notes are an integral part of the financial statements.
| | | | | | Years Ended December 31, | |
| | | Six Months Ended 6/30/14 (Unaudited) | | | 2013 | | | 2012 | | | 2011 | | | 2010 | | | 2009 | |
| Selected Per Share Data | |
| Net asset value, beginning of period | | $ | 1.00 | | | $ | 1.00 | | | $ | 1.00 | | | $ | 1.00 | | | $ | 1.00 | | | $ | 1.00 | |
Income from investment operations: Net investment income | | | .000 | a | | | .000 | a | | | .001 | | | | .000 | a | | | .001 | | | | .004 | |
| Net realized gain (loss) | | | (.000 | )a | | | .000 | a | | | .000 | a | | | .000 | a | | | .000 | a | | | .000 | a |
| Total from investment operations | | | .000 | a | | | .000 | a | | | .001 | | | | .000 | a | | | .001 | | | | .004 | |
Less distributions from: Net investment income | | | (.000 | )a | | | (.000 | )a | | | (.001 | ) | | | (.000 | )a | | | (.001 | ) | | | (.004 | ) |
| Net asset value, end of period | | $ | 1.00 | | | $ | 1.00 | | | $ | 1.00 | | | $ | 1.00 | | | $ | 1.00 | | | $ | 1.00 | |
Total Return (%)b | | | .00 | **c | | | .02 | | | | .07 | | | | .05 | | | | .13 | | | | .41 | |
| Ratios to Average Net Assets and Supplemental Data | |
| Net assets, end of period ($ millions) | | | 968 | | | | 1,367 | | | | 1,657 | | | | 1,993 | | | | 4,040 | | | | 6,409 | |
| Ratio of expenses before expense reductions, including expenses allocated from Cash Management Portfolio (%) | | | .28 | * | | | .27 | | | | .28 | | | | .28 | | | | .28 | | | | .31 | |
| Ratio of expenses after expense reductions, including expenses allocated from Cash Management Portfolio (%) | | | .18 | * | | | .20 | | | | .21 | | | | .21 | | | | .20 | | | | .21 | |
| Ratio of net investment income (%) | | | .01 | * | | | .02 | | | | .07 | | | | .05 | | | | .12 | | | | .36 | |
a Amount is less than $.0005. b Total return would have been lower had certain expenses not been reduced. c Amount is less than .005%. * Annualized ** Not annualized | |
Notes to Financial Statements (Unaudited)
A. Organization and Significant Accounting Policies
Cash Reserves Fund Institutional (the "Fund'') is a diversified series of DWS Money Market Trust (the "Trust''), which is registered under the Investment Company Act of 1940, as amended (the "1940 Act''), as an open-end management investment company organized as a Massachusetts business trust.
The Fund is a feeder fund that seeks to achieve its investment objective by investing substantially all of its investable assets in a master portfolio, the Cash Management Portfolio (the "Portfolio''), an open-end management investment company registered under the 1940 Act and organized as a New York trust advised by Deutsche Investment Management Americas Inc. ("DIMA'' or the "Advisor''), an indirect, wholly owned subsidiary of Deutsche Bank AG. A master/feeder fund structure is one in which a fund (a "feeder fund"), instead of investing directly in a portfolio of securities, invests most or all of its investment assets in a separate registered investment company (the "master fund") with substantially the same investment objective and policies as the feeder fund. Such a structure permits the pooling of assets of two or more feeder funds, preserving separate identities or distribution channels at the feeder fund level. At June 30, 2014, the Fund owned approximately 5% of the Portfolio.
The Fund's financial statements are prepared in accordance with accounting principles generally accepted in the United States of America which require the use of management estimates. Actual results could differ from those estimates. The policies described below are followed consistently by the Fund in the preparation of its financial statements. The financial statements of the Portfolio, including the Investment Portfolio, are contained elsewhere in this report and should be read in conjunction with the Fund's financial statements.
Security Valuation. The Fund records its investment in the Portfolio at value, which reflects its proportionate interest in the net assets of the Portfolio. Valuation of the securities held by the Portfolio is discussed in the notes to the Portfolio's financial statements included elsewhere in this report.
Disclosure about the classification of fair value measurements is included in a table following the Portfolio's Investment Portfolio.
Federal Income Taxes. The Fund's policy is to comply with the requirements of the Internal Revenue Code, as amended, which are applicable to regulated investment companies, and to distribute all of its taxable income to its shareholders.
Under the Regulated Investment Company Modernization Act of 2010, net capital losses incurred post-enactment may be carried forward indefinitely, and their character is retained as short-term and/or long-term. Previously, net capital losses were carried forward for eight years and treated as short-term losses. As a transition rule, the Act requires that post-enactment net capital losses be used before pre-enactment net capital losses.
At December 31, 2013, the Fund had a net tax basis capital loss carryforward of approximately $239,000 of pre-enactment losses, which may be applied against any realized net taxable capital gains of each succeeding year until fully utilized or until December 31, 2016, the expiration date, whichever occurs first.
The Fund has reviewed the tax positions for the open tax years as of December 31, 2013, and has determined that no provision for income tax and/or uncertain tax provisions is required in the Fund's financial statements. The Fund's federal tax returns for the prior three fiscal years remain open subject to examination by the Internal Revenue Service.
Distribution of Income and Gains. Net investment income of the Fund is declared as a daily dividend and is distributed to shareholders monthly. The Fund may take into account capital gains and losses in its daily dividend declarations. The Fund may also make additional distributions for tax purposes if necessary.
Permanent book and tax differences relating to shareholder distributions will result in reclassifications to paid in capital. Temporary book and tax differences will reverse in a subsequent period. There were no significant book to tax differences for the Fund.
The tax character of current year distributions will be determined at the end of the current fiscal year.
Contingencies. In the normal course of business, the Fund may enter into contracts with service providers that contain general indemnification clauses. The Fund's maximum exposure under these arrangements is unknown as this would involve future claims that may be made against the Fund that have not yet been made. However, based on experience, the Fund expects the risk of loss to be remote.
Other. The Fund receives an allocation of the Portfolio's net investment income and net realized gains and losses in proportion to its investment in the Portfolio. Expenses directly attributed to a fund are charged to that fund, while expenses which are attributable to the Trust are allocated among the funds in the Trust on the basis of relative net assets.
B. Fees and Transactions with Affiliates
Management Agreement. Under the Investment Management Agreement with Deutsche Investment Management Americas Inc. ("DIMA" or the "Advisor"), an indirect, wholly owned subsidiary of Deutsche Bank AG, the Advisor serves as the investment manager to the Fund. The Advisor receives a management fee from the Portfolio pursuant to the master/feeder structure listed above in Note A.
Administration Fee. Pursuant to an Administrative Services Agreement, DIMA provides most administrative services to the Fund. For all services provided under the Administrative Services Agreement, the Fund pays the Advisor an annual fee ("Administration Fee") of 0.10% of the Fund's average daily net assets, computed and accrued daily and payable monthly.
For the period from January 1, 2014 through April 30, 2015, DIMA has contractually agreed to waive its fees and/or reimburse certain operating expenses of the Fund, including expenses of the Portfolio allocated to the Fund, to the extent necessary to maintain the operating expenses (excluding certain expenses such as extraordinary expenses, taxes, brokerage and interest) at 0.21% of the Fund's average daily net assets.
In addition, the Advisor has agreed to voluntarily waive additional expenses. The waiver may be changed or terminated at any time without notice. Under this arrangement, the Advisor waived certain expenses of the Fund.
For the six months ended June 30, 2014, the Administration Fee was $730,478, of which $535,122 was waived and $30,104 is unpaid.
Service Provider Fees. DeAWM Service Company ("DSC"), an affiliate of the Advisor, is the transfer agent, dividend-paying agent and shareholder service agent for the Fund. Pursuant to a sub-transfer agency agreement between DSC and DST Systems, Inc. ("DST"), DSC has delegated certain transfer agent, dividend-paying agent and shareholder service agent functions to DST. DSC compensates DST out of the shareholder servicing fee it receives from the Fund. For the six months ended June 30, 2014, the amount charged to the Fund by DSC aggregated $21,916, all of which was waived.
Shareholder Servicing Fee. DeAWM Distributors, Inc. ("DDI"), an affiliate of the Advisor, provides information and administrative services for a fee ("Service Fee") to shareholders at an annual rate of up to 0.25% of average daily net assets. DDI in turn has various agreements with financial services firms that provide these services and pays these fees based upon the assets of shareholder accounts the firm services. For the six months ended June 30, 2014, the Service Fee was as follows:
| | | Total Aggregated | | | Waived | | | Annualized Effective Rate | |
| Cash Reserves Fund Institutional | | $ | 2,551 | | | $ | 2,551 | | | | .00 | % |
Typesetting and Filing Service Fees. Under an agreement with DIMA, DIMA is compensated for providing typesetting and certain regulatory filing services to the Fund. For the six months ended June 30, 2014, the amount charged to the Fund by DIMA included in Statement of Operations under "reports to shareholders" aggregated $8,747, of which $5,377 is unpaid.
Trustees' Fees and Expenses. The Fund paid retainer fees to each Trustee not affiliated with the Advisor, plus specified amounts to the Board Chairperson and Vice Chairperson and to each committee Chairperson.
C. Concentration of Ownership
From time to time, the Fund may have a concentration of several shareholder accounts holding a significant percentage of shares outstanding. Investment activities of these shareholders could have a material impact on the Fund.
At June 30, 2014, there were two shareholder accounts that held approximately 12% and 11% of the outstanding shares of the Fund, respectively.
D. Money Market Fund Reform
In July 2014, the SEC adopted money market fund reform to address potential systemic risks associated with money market funds and to improve transparency for money market fund investors. The Fund is required to comply with money market reform over the next two years. As a result, the Fund may be required to take certain steps that will impact its structure and/or operations, which could impact the return potential of the Fund.
Information About Your Fund's Expenses
As an investor of the Fund, you incur two types of costs: ongoing expenses and transaction costs. Ongoing expenses include management fees and other Fund expenses. Examples of transaction costs include account maintenance fees, which are not shown in this section. The following tables are intended to help you understand your ongoing expenses (in dollars) of investing in the Fund and to help you compare these expenses with the ongoing expenses of investing in other mutual funds. In the most recent six-month period, the Fund limited these expenses; had it not done so, expenses would have been higher. The example in the table is based on an investment of $1,000 invested at the beginning of the six-month period and held for the entire period (January 1, 2014 to June 30, 2014).
The tables illustrate your Fund's expenses in two ways:
—Actual Fund Return. This helps you estimate the actual dollar amount of ongoing expenses (but not transaction costs) paid on a $1,000 investment in the Fund using the Fund's actual return during the period. To estimate the expenses you paid over the period, simply divide your account value by $1,000 (for example, an $8,600 account value divided by $1,000 = 8.6), then multiply the result by the number in the "Expenses Paid per $1,000" line under the share class you hold.
—Hypothetical 5% Fund Return. This helps you to compare your Fund's ongoing expenses (but not transaction costs) with those of other mutual funds using the Fund's actual expense ratio and a hypothetical rate of return of 5% per year before expenses. Examples using a 5% hypothetical fund return may be found in the shareholder reports of other mutual funds. The hypothetical account values and expenses may not be used to estimate the actual ending account balance or expenses you paid for the period.
Please note that the expenses shown in these tables are meant to highlight your ongoing expenses only and do not reflect any transaction costs. The "Expenses Paid per $1,000" line of the tables is useful in comparing ongoing expenses only and will not help you determine the relative total expense of owning different funds. If these transaction costs had been included, your costs would have been higher.
Expenses and Value of a $1,000 Investment for the six months ended June 30, 2014 (Unaudited) | |
| Actual Fund Return* | | | |
| Beginning Account Value 1/1/14 | | $ | 1,000.00 | |
| Ending Account Value 6/30/14 | | $ | 1,000.05 | |
| Expenses Paid per $1,000** | | $ | .89 | |
| Hypothetical 5% Fund Return* | | | | |
| Beginning Account Value 1/1/14 | | $ | 1,000.00 | |
| Ending Account Value 6/30/14 | | $ | 1,023.90 | |
| Expenses Paid per $1,000** | | $ | .90 | |
* Expenses include amounts allocated proportionally from the master portfolio.
** Expenses are equal to the Fund's annualized expense ratio, multiplied by the average account value over the period, multiplied by 181 (the number of days in the most recent six-month period), then divided by 365.
| Annualized Expense Ratio | |
| Cash Reserves Fund Institutional | .18% |
For more information, please refer to the Fund's prospectus.
For an analysis of the fees associated with an investment in the Fund or similar funds, please refer to http://apps.finra.org/fundanalyzer/1/fa.aspx.
(The following financial statements of the Cash Management Portfolio should be read in conjunction with the Fund's financial statements.)
Investment Portfolio as of June 30, 2014 (Unaudited) | | | Principal Amount ($) | | | Value ($) | |
| | | | |
| Certificates of Deposit and Bank Notes 12.0% | |
| Bank of America NA, 0.17%, 7/31/2014 | | | 200,000,000 | | | | 200,000,000 | |
| Bank of Montreal: | |
| 0.17%, 9/10/2014 | | | 79,000,000 | | | | 79,000,000 | |
| 0.2%, 12/5/2014 | | | 44,000,000 | | | | 43,999,999 | |
| Bank of Nova Scotia, 1.85%, 1/12/2015 | | | 27,060,000 | | | | 27,286,268 | |
| China Construction Bank Corp.: | |
| 0.37%, 7/14/2014 | | | 50,000,000 | | | | 50,000,000 | |
| 0.37%, 7/29/2014 | | | 50,000,000 | | | | 50,000,000 | |
| DNB Bank ASA: | |
| 0.22%, 7/7/2014 | | | 60,000,000 | | | | 60,000,000 | |
| 0.225%, 7/16/2014 | | | 114,000,000 | | | | 114,000,000 | |
| 0.23%, 10/1/2014 | | | 100,000,000 | | | | 100,000,000 | |
| 0.23%, 10/9/2014 | | | 23,000,000 | | | | 23,000,000 | |
| DZ Bank AG: | |
| 0.25%, 9/10/2014 | | | 120,500,000 | | | | 120,500,000 | |
| 0.25%, 10/3/2014 | | | 135,000,000 | | | | 135,000,000 | |
| 0.27%, 11/7/2014 | | | 112,750,000 | | | | 112,750,000 | |
| Fortis Bank SA: | |
| 0.18%, 7/2/2014 | | | 82,600,000 | | | | 82,600,011 | |
| 0.22%, 7/1/2014 | | | 182,500,000 | | | | 182,500,000 | |
| Industrial & Commercial Bank of China Ltd.: | |
| 0.35%, 7/11/2014 | | | 115,000,000 | | | | 115,000,000 | |
| 0.37%, 7/29/2014 | | | 75,750,000 | | | | 75,750,000 | |
| Mitsubishi UFJ Trust & Banking Corp., 0.17%, 7/3/2014 | | | 53,000,000 | | | | 53,000,000 | |
| National Australia Bank Ltd., 2.0%, 3/9/2015 | | | 20,000,000 | | | | 20,233,221 | |
| Natixis, 0.223%, 7/14/2014 | | | 150,000,000 | | | | 150,000,000 | |
| Nordea Bank Finland PLC, 0.21%, 7/7/2014 | | | 101,000,000 | | | | 101,000,000 | |
| Province of Ontario Canada, 2.95%, 2/5/2015 | | | 3,030,000 | | | | 3,078,457 | |
| Rabobank Nederland NV: | |
| 0.245%, 3/13/2015 | | | 140,000,000 | | | | 140,000,000 | |
| 0.27%, 10/3/2014 | | | 65,000,000 | | | | 65,000,000 | |
| Sumitomo Mitsui Banking Corp., 0.17%, 8/11/2014 | | | 29,000,000 | | | | 29,000,000 | |
| Svenska Handelsbanken AB, 0.22%, 9/30/2014 | | | 138,750,000 | | | | 138,749,999 | |
| Wal-Mart Stores, Inc., 5.319%, 6/1/2015 | | | 34,000,000 | | | | 35,599,715 | |
Total Certificates of Deposit and Bank Notes (Cost $2,307,047,670) | | | | 2,307,047,670 | |
| | |
| Commercial Paper 41.6% | |
| Issued at Discount** 29.1% | |
| Albion Capital Corp. SA: | |
| 0.13%, 7/7/2014 | | | 24,260,000 | | | | 24,259,474 | |
| 0.16%, 7/15/2014 | | | 52,960,000 | | | | 52,956,705 | |
| Alpine Securitzation, 144A, 0.02%, 7/1/2014 | | | 50,000,000 | | | | 50,000,000 | |
| Antalis U.S. Funding Corp., 144A, 0.1%, 7/2/2014 | | | 29,792,000 | | | | 29,791,917 | |
| Apple, Inc.: | |
| 0.07%, 7/7/2014 | | | 34,000,000 | | | | 33,999,603 | |
| 0.08%, 8/1/2014 | | | 20,000,000 | | | | 19,998,622 | |
| 0.15%, 11/10/2014 | | | 20,000,000 | | | | 19,989,000 | |
| 0.18%, 2/6/2015 | | | 20,000,000 | | | | 19,978,000 | |
| 0.18%, 2/10/2015 | | | 20,000,000 | | | | 19,977,600 | |
| Bank Nederlandse Gemeenten, 0.245%, 6/2/2015 | | | 30,000,000 | | | | 29,931,400 | |
| Bedford Row Funding Corp.: | |
| 144A, 0.26%, 7/25/2014 | | | 23,000,000 | | | | 22,996,013 | |
| 144A, 0.3%, 6/9/2015 | | | 50,000,000 | | | | 49,857,083 | |
| 144A, 0.31%, 10/27/2014 | | | 77,000,000 | | | | 76,921,759 | |
| 144A, 0.32%, 12/17/2014 | | | 35,500,000 | | | | 35,446,671 | |
| 144A, 0.32%, 4/1/2015 | | | 35,000,000 | | | | 34,914,756 | |
| BNZ International Funding Ltd., 144A, 0.2%, 12/12/2014 | | | 100,000,000 | | | | 99,908,889 | |
| Caisse Centrale Desjardins: | |
| 0.165%, 9/16/2014 | | | 38,500,000 | | | | 38,486,413 | |
| 0.17%, 10/1/2014 | | | 40,000,000 | | | | 39,982,622 | |
| Caisse des Depots et Consignations, 144A, 0.15%, 9/4/2014 | | | 137,800,000 | | | | 137,762,679 | |
| Catholic Health Initiatives, 0.2%, 12/10/2014 | | | 17,150,000 | | | | 17,134,565 | |
| Chevron Corp., 144A, 0.12%, 9/16/2014 | | | 54,750,000 | | | | 54,735,948 | |
| CNPC Finance HK Ltd.: | |
| 144A, 0.35%, 7/8/2014 | | | 95,000,000 | | | | 94,993,535 | |
| 144A, 0.38%, 8/21/2014 | | | 40,000,000 | | | | 39,978,467 | |
| 144A, 0.4%, 7/2/2014 | | | 45,060,000 | | | | 45,059,499 | |
| Coca-Cola Co.: | |
| 0.19%, 11/3/2014 | | | 3,000,000 | | | | 2,998,021 | |
| 0.19%, 12/2/2014 | | | 50,000,000 | | | | 49,959,361 | |
| Collateralized Commercial Paper Co., LLC, 0.21%, 9/25/2014 | | | 132,500,000 | | | | 132,433,529 | |
| Collateralized Commercial Paper II Co., LLC, 144A, 0.22%, 11/13/2014 | | | 112,000,000 | | | | 111,907,600 | |
| CPPIB Capital, Inc.: | |
| 0.3%, 2/11/2015 | | | 21,000,000 | | | | 20,960,625 | |
| 0.3%, 2/17/2015 | | | 10,000,000 | | | | 9,980,750 | |
| 0.3%, 2/27/2015 | | | 10,000,000 | | | | 9,979,917 | |
| DBS Bank Ltd., 144A, 0.235%, 9/10/2014 | | | 160,000,000 | | | | 159,925,844 | |
| Dexia Credit Local: | |
| 0.263%, 8/21/2014 | | | 65,000,000 | | | | 64,976,058 | |
| 0.27%, 8/25/2014 | | | 24,000,000 | | | | 23,990,100 | |
| 0.27%, 9/4/2014 | | | 24,750,000 | | | | 24,737,934 | |
| 0.325%, 8/18/2014 | | | 100,000,000 | | | | 99,956,667 | |
| 0.325%, 8/19/2014 | | | 50,000,000 | | | | 49,977,882 | |
| DNB Bank ASA: | |
| 0.15%, 8/25/2014 | | | 122,940,000 | | | | 122,911,826 | |
| 0.225%, 7/30/2014 | | | 100,000,000 | | | | 99,981,875 | |
| 0.235%, 9/8/2014 | | | 157,000,000 | | | | 156,929,285 | |
| 0.24%, 10/6/2014 | | | 34,000,000 | | | | 33,978,013 | |
| eBay, Inc., 144A, 0.09%, 8/19/2014 | | | 118,500,000 | | | | 118,485,484 | |
| Erste Abwicklungsanstalt: | |
| 144A, 0.11%, 7/7/2014 | | | 23,000,000 | | | | 22,999,578 | |
| 144A, 0.15%, 9/8/2014 | | | 23,500,000 | | | | 23,493,244 | |
| 144A, 0.16%, 9/22/2014 | | | 100,000,000 | | | | 99,963,111 | |
| Exxon Mobil Corp., 0.05%, 7/9/2014 | | | 4,498,000 | | | | 4,497,950 | |
| General Electric Capital Corp., 0.2%, 9/3/2014 | | | 52,000,000 | | | | 51,981,511 | |
| Gotham Funding Corp.: | |
| 144A, 0.14%, 7/16/2014 | | | 25,000,000 | | | | 24,998,542 | |
| 144A, 0.15%, 7/11/2014 | | | 47,649,000 | | | | 47,647,015 | |
| 144A, 0.16%, 7/25/2014 | | | 59,736,000 | | | | 59,729,628 | |
| 144A, 0.16%, 7/29/2014 | | | 125,054,000 | | | | 125,038,438 | |
| Hannover Funding Co., LLC: | |
| 0.179%, 8/5/2014 | | | 20,000,000 | | | | 19,996,500 | |
| 0.18%, 7/17/2014 | | | 15,000,000 | | | | 14,998,800 | |
| 0.18%, 8/18/2014 | | | 88,000,000 | | | | 87,978,880 | |
| Johnson & Johnson, 144A, 0.05%, 7/1/2014 | | | 33,109,000 | | | | 33,109,000 | |
| Kells Funding LLC: | |
| 144A, 0.2%, 7/11/2014 | | | 50,000,000 | | | | 49,997,222 | |
| 144A, 0.22%, 9/19/2014 | | | 85,000,000 | | | | 84,958,445 | |
| 144A, 0.25%, 8/12/2014 | | | 51,700,000 | | | | 51,684,921 | |
| Macquarie Bank Ltd., 144A, 0.2%, 9/18/2014 | | | 46,000,000 | | | | 45,979,811 | |
| Manhattan Asset Funding Co., LLC, 144A, 0.16%, 7/7/2014 | | | 3,000,000 | | | | 2,999,920 | |
| Matchpoint Master Trust: | |
| 0.1%, 7/2/2014 | | | 150,000,000 | | | | 149,999,583 | |
| 0.1%, 7/3/2014 | | | 50,000,000 | | | | 49,999,722 | |
| 0.12%, 7/1/2014 | | | 60,000,000 | | | | 60,000,000 | |
| MetLife Short Term Funding LLC: | |
| 144A, 0.2%, 8/6/2014 | | | 24,000,000 | | | | 23,995,200 | |
| 144A, 0.22%, 9/15/2014 | | | 21,472,000 | | | | 21,462,028 | |
| Microsoft Corp., 0.06%, 8/6/2014 | | | 18,906,000 | | | | 18,904,299 | |
| Nestle Capital Corp., 0.15%, 9/8/2014 | | | 50,000,000 | | | | 49,985,625 | |
| New York Life Capital Corp.: | |
| 144A, 0.07%, 7/31/2014 | | | 8,485,000 | | | | 8,484,505 | |
| 144A, 0.11%, 9/2/2014 | | | 3,590,000 | | | | 3,589,309 | |
| Nordea Bank AB: | |
| 0.165%, 7/28/2014 | | | 28,465,000 | | | | 28,461,478 | |
| 0.22%, 10/14/2014 | | | 200,000,000 | | | | 199,871,667 | |
| Old Line Funding LLC: | |
| 144A, 0.21%, 8/4/2014 | | | 50,000,000 | | | | 49,990,083 | |
| 144A, 0.22%, 9/10/2014 | | | 76,000,000 | | | | 75,967,024 | |
| PepsiCo, Inc., 0.07%, 7/22/2014 | | | 14,000,000 | | | | 13,999,428 | |
| Philip Morris International, Inc., 144A, 0.09%, 7/16/2014 | | | 2,271,000 | | | | 2,270,915 | |
| Procter & Gamble Co.: | |
| 0.08%, 7/21/2014 | | | 5,000,000 | | | | 4,999,778 | |
| 0.12%, 9/3/2014 | | | 8,500,000 | | | | 8,498,187 | |
| 0.15%, 10/29/2014 | | | 64,000,000 | | | | 63,968,000 | |
| Prudential Funding LLC, 0.06%, 7/1/2014 | | | 11,000,000 | | | | 11,000,000 | |
| PSP Capital, Inc., 0.14%, 9/10/2014 | | | 15,192,000 | | | | 15,187,805 | |
| Queensland Treasury Corp., 0.15%, 7/30/2014 | | | 4,000,000 | | | | 3,999,517 | |
| Roche Holding, Inc., 144A, 0.09%, 7/23/2014 | | | 30,000,000 | | | | 29,998,350 | |
| Siemens Capital Co., LLC, 144A, 0.13%, 9/19/2014 | | | 100,000,000 | | | | 99,971,111 | |
| Sinopec Century Bright Capital Investment Ltd.: | |
| 0.35%, 8/27/2014 | | | 50,000,000 | | | | 49,972,292 | |
| 0.37%, 7/17/2014 | | | 38,000,000 | | | | 37,993,751 | |
| Skandinaviska Enskilda Banken AB, 0.235%, 9/2/2014 | | | 45,600,000 | | | | 45,581,247 | |
| Standard Chartered Bank: | |
| 0.16%, 7/14/2014 | | | 4,615,000 | | | | 4,614,733 | |
| 0.27%, 8/4/2014 | | | 60,000,000 | | | | 59,984,700 | |
| 0.28%, 11/3/2014 | | | 183,500,000 | | | | 183,321,597 | |
| Starbird Funding Corp.: | |
| 144A, 0.1%, 7/2/2014 | | | 57,500,000 | | | | 57,499,840 | |
| 144A, 0.1%, 7/3/2014 | | | 50,219,000 | | | | 50,218,721 | |
| 144A, 0.12%, 7/1/2014 | | | 75,000,000 | | | | 75,000,000 | |
| Svenska Handelsbanken AB, 0.18%, 10/14/2014 | | | 61,750,000 | | | | 61,717,581 | |
| Swedbank AB: | |
| 0.245%, 9/8/2014 | | | 73,271,000 | | | | 73,236,593 | |
| 0.25%, 10/1/2014 | | | 200,000,000 | | | | 199,872,222 | |
| United Overseas Bank Ltd.: | |
| 0.24%, 10/14/2014 | | | 28,000,000 | | | | 27,980,400 | |
| 0.26%, 1/5/2015 | | | 19,000,000 | | | | 18,974,202 | |
| Victory Receivables Corp.: | |
| 144A, 0.15%, 7/16/2014 | | | 88,328,000 | | | | 88,322,480 | |
| 144A, 0.16%, 7/28/2014 | | | 75,000,000 | | | | 74,991,000 | |
| Wal-Mart Stores, Inc.: | |
| 0.07%, 7/7/2014 | | | 3,000,000 | | | | 2,999,965 | |
| 0.1%, 7/28/2014 | | | 183,100,000 | | | | 183,086,268 | |
| Walt Disney Co.: | |
| 0.1%, 7/11/2014 | | | 20,000,000 | | | | 19,999,445 | |
| 0.1%, 7/31/2014 | | | 35,300,000 | | | | 35,297,058 | |
| Working Capital Management Co.: | |
| 144A, 0.15%, 7/7/2014 | | | 4,000,000 | | | | 3,999,900 | |
| 144A, 0.16%, 7/8/2014 | | | 33,550,000 | | | | 33,548,956 | |
| | | | | 5,618,001,072 | |
| Issued at Par 12.5% | |
| ANZ New Zealand International Ltd., 144A, 0.213%*, 1/12/2015 | | | 100,000,000 | | | | 100,000,000 | |
| ASB Finance Ltd.: | |
| 144A, 0.244%*, 6/16/2015 | | | 100,000,000 | | | | 100,000,000 | |
| 144A, 0.264%*, 10/9/2014 | | | 1,000,000 | | | | 1,000,107 | |
| Atlantic Asset Securitization LLC, 144A, 0.181%*, 8/7/2014 | | | 100,000,000 | | | | 100,000,000 | |
| Australia & New Zealand Banking Group Ltd., 144A, 0.229%*, 4/30/2015 | | | 40,000,000 | | | | 39,998,307 | |
| Bank of Montreal: | |
| 0.181%*, 8/14/2014 | | | 150,000,000 | | | | 149,999,155 | |
| 0.22%*, 9/5/2014 | | | 49,000,000 | | | | 49,002,450 | |
| Bank of Nova Scotia, 0.28%*, 1/13/2015 | | | 102,000,000 | | | | 102,000,000 | |
| Barton Capital LLC, 144A, 0.184%*, 11/18/2014 | | | 26,037,000 | | | | 26,036,631 | |
| BNZ International Funding Ltd.: | |
| 144A, 0.242%*, 6/10/2015 | | | 20,000,000 | | | | 20,000,000 | |
| 144A, 0.243%*, 2/2/2015 | | | 50,000,000 | | | | 50,000,000 | |
| Caisse Centrale Desjardins, 144A, 0.227%*, 1/26/2015 | | | 100,000,000 | | | | 99,994,258 | |
| Canadian Imperial Bank of Commerce, 0.223%*, 5/8/2015 | | | 50,000,000 | | | | 50,000,000 | |
| DBS Bank Ltd., 144A, 0.238%*, 2/20/2015 | | | 35,000,000 | | | | 35,001,927 | |
| DNB Bank ASA, 0.192%*, 8/11/2014 | | | 36,000,000 | | | | 36,000,048 | |
| Kells Funding LLC: | |
| 144A, 0.228%*, 10/22/2014 | | | 198,500,000 | | | | 198,492,930 | |
| 144A, 0.23%*, 10/10/2014 | | | 75,000,000 | | | | 75,000,000 | |
| 144A, 0.23%*, 1/27/2015 | | | 110,000,000 | | | | 109,996,700 | |
| 144A, 0.232%*, 11/17/2014 | | | 48,800,000 | | | | 48,799,902 | |
| 144A, 0.233%*, 2/13/2015 | | | 26,000,000 | | | | 26,001,448 | |
| 144A, 0.243%*, 2/5/2015 | | | 65,000,000 | | | | 65,003,359 | |
| Kommunalbanken AS, 144A, 0.247%*, 1/26/2015 | | | 21,370,000 | | | | 21,377,608 | |
| Nederlandse Waterschapsbank NV: | |
| 144A, 0.201%*, 8/13/2014 | | | 150,000,000 | | | | 150,000,000 | |
| 144A, 0.231%*, 11/3/2014 | | | 100,000,000 | | | | 100,000,000 | |
| 144A, 0.265%*, 8/15/2014 | | | 67,200,000 | | | | 67,200,000 | |
| Old Line Funding LLC: | |
| 144A, 0.181%*, 2/2/2015 | | | 83,000,000 | | | | 83,000,000 | |
| 144A, 0.183%*, 10/10/2014 | | | 63,800,000 | | | | 63,800,000 | |
| 144A, 0.21%*, 12/5/2014 | | | 4,000,000 | | | | 4,000,000 | |
| PepsiCo, Inc., 0.08%*, 7/22/2014 | | | 10,000,000 | | | | 9,999,533 | |
| PNC Bank NA: | |
| 0.27%, 9/5/2014 | | | 35,000,000 | | | | 35,000,000 | |
| 0.28%, 10/8/2014 | | | 20,000,000 | | | | 20,000,000 | |
| Rabobank Nederland NV, 0.259%*, 8/28/2014 | | | 64,000,000 | | | | 64,009,834 | |
| Royal Bank of Canada: | |
| 0.232%*, 2/12/2015 | | | 100,000,000 | | | | 100,000,000 | |
| 0.27%*, 12/11/2014 | | | 83,000,000 | | | | 83,000,000 | |
| Versailles Commercial Paper LLC: | |
| 144A, 0.191%*, 10/3/2014 | | | 70,000,000 | | | | 70,000,000 | |
| 144A, 0.211%*, 7/16/2014 | | | 33,000,000 | | | | 33,000,000 | |
| Westpac Banking Corp., 0.228%*, 2/20/2015 | | | 14,500,000 | | | | 14,500,644 | |
| | | | | 2,401,214,841 | |
Total Commercial Paper (Cost $8,019,215,913) | | | | 8,019,215,913 | |
| | |
| Government & Agency Obligations 2.2% | |
| Other Government Related (a) 0.3% | |
| International Bank for Reconstruction & Development, 0.17%*, 7/23/2014 | | | 61,600,000 | | | | 61,600,321 | |
| U.S. Government Sponsored Agencies 1.5% | |
| Federal Farm Credit Bank, 0.131%*, 3/3/2016 | | | 35,000,000 | | | | 35,000,000 | |
| Federal Home Loan Mortgage Corp.: | |
| 0.065%**, 10/16/2014 | | | 75,000,000 | | | | 74,985,510 | |
| 0.068%**, 8/8/2014 | | | 50,000,000 | | | | 49,996,305 | |
| 0.08%**, 11/26/2014 | | | 50,000,000 | | | | 49,983,556 | |
| 0.094%**, 10/2/2014 | | | 29,000,000 | | | | 28,992,883 | |
| 0.099%**, 9/5/2014 | | | 25,000,000 | | | | 24,995,417 | |
| 0.099%**, 10/28/2014 | | | 15,000,000 | | | | 14,995,042 | |
| | | | | 278,948,713 | |
| U.S. Treasury Obligations 0.4% | |
| U.S. Treasury Bill, 0.07%**, 8/21/2014 | | | 7,000,000 | | | | 6,999,306 | |
| U.S. Treasury Notes: | |
| 0.25%, 9/15/2014 | | | 25,000,000 | | | | 25,008,246 | |
| 2.125%, 11/30/2014 | | | 15,000,000 | | | | 15,122,654 | |
| 2.375%, 10/31/2014 | | | 60,000 | | | | 60,462 | |
| 4.25%, 8/15/2014 | | | 35,000,000 | | | | 35,181,114 | |
| | | | | 82,371,782 | |
Total Government & Agency Obligations (Cost $422,920,816) | | | | 422,920,816 | |
| | |
| Short-Term Notes* 10.5% | |
| Australia & New Zealand Banking Group Ltd., 144A, 0.327%, 5/18/2015 | | | 120,700,000 | | | | 120,700,000 | |
| Bank of Nova Scotia: | |
| 0.28%, 9/3/2014 | | | 62,000,000 | | | | 62,000,000 | |
| 0.294%, 6/24/2015 | | | 85,000,000 | | | | 85,000,000 | |
| Canadian Imperial Bank of Commerce, 0.34%, 7/17/2015 | | | 176,750,000 | | | | 176,750,000 | |
| Commonwealth Bank of Australia: | |
| 144A, 0.241%, 7/10/2015 | | | 180,000,000 | | | | 180,000,000 | |
| 144A, 0.506%, 1/29/2015 | | | 29,450,000 | | | | 29,496,704 | |
| JPMorgan Chase Bank NA, 0.347%, 6/22/2015 | | | 164,250,000 | | | | 164,250,000 | |
| National Australia Bank Ltd., 144A, 1.177%, 7/25/2014 | | | 25,000,000 | | | | 25,017,121 | |
| Rabobank Nederland NV: | |
| 0.277%, 12/1/2014 | | | 190,500,000 | | | | 190,500,000 | |
| 0.277%, 4/10/2015 | | | 59,500,000 | | | | 59,500,000 | |
| 0.296%, 6/1/2015 | | | 70,000,000 | | | | 70,000,000 | |
| 0.307%, 7/6/2015 | | | 136,500,000 | | | | 136,500,000 | |
| Svenska Handelsbanken AB, 144A, 0.308%, 10/3/2014 | | | 168,000,000 | | | | 168,000,000 | |
| Toyota Motor Credit Corp., 0.308%, 8/22/2014 | | | 54,800,000 | | | | 54,814,102 | |
| Wells Fargo Bank NA: | |
| 0.25%, 11/24/2014 | | | 17,810,000 | | | | 17,810,000 | |
| 0.25%, 6/16/2015 | | | 125,000,000 | | | | 125,000,000 | |
| 0.27%, 12/10/2014 | | | 125,000,000 | | | | 125,000,000 | |
| Westpac Banking Corp.: | |
| 0.231%, 5/11/2015 | | | 110,000,000 | | | | 110,000,000 | |
| 0.24%, 5/4/2015 | | | 125,000,000 | | | | 125,000,000 | |
Total Short-Term Notes (Cost $2,025,337,927) | | | | 2,025,337,927 | |
| | |
| Time Deposits 11.0% | |
| Citibank NA, 0.08%, 7/2/2014 | | | 72,000,000 | | | | 72,000,000 | |
| Credit Agricole Corporate & Investment Bank, 0.07%, 7/1/2014 | | | 278,483,794 | | | | 278,483,794 | |
| Fortis Bank SA, 0.03%, 7/1/2014 | | | 73,000,000 | | | | 73,000,000 | |
| National Australia Bank Ltd., 0.06%, 7/1/2014 | | | 31,146,000 | | | | 31,146,000 | |
| Natixis, 0.09%, 7/3/2014 | | | 225,000,000 | | | | 225,000,000 | |
| Skandinaviska Enskilda Banken AB, 0.02%, 7/1/2014 | | | 200,000,000 | | | | 200,000,000 | |
| Sumitomo Mitsui Banking Corp., 0.08%, 7/1/2014 | | | 837,000,000 | | | | 837,000,000 | |
| Svenska Handelsbanken AB, 0.02%, 7/1/2014 | | | 400,000,000 | | | | 400,000,000 | |
Total Time Deposits (Cost $2,116,629,794) | | | | 2,116,629,794 | |
| | |
| Municipal Investments 2.4% | |
| Chicago, IL, TECP, 0.18%**, 7/29/2014 | | | 31,475,000 | | | | 31,470,594 | |
| Colorado, RBC Municipal Products, Inc. Trust, Series E-25, 144A, AMT, 0.08%***, 8/29/2014, LOC: Royal Bank of Canada | | | 22,000,000 | | | | 22,000,000 | |
| Cuyahoga County, OH, Health Care Facilities Revenue, AM McGregor Home Project, Series A, 0.06%***, 5/1/2049, LOC: Northern Trust Co. | | | 305,000 | | | | 305,000 | |
| Johnson City, TN, Health & Educational Facilities Board, Hospital Revenue, Mountain States Health Alliance, Series B, 0.12%***, 8/15/2043, LOC: U.S. Bank NA | | | 11,075,000 | | | | 11,075,000 | |
| Kentucky, State Housing Corp. Revenue, Series O, 0.12%***, 1/1/2036, SPA: State Street Bank & Trust Co. | | | 15,520,000 | | | | 15,520,000 | |
| Metropolitan Washington, DC, Airports Authority System Revenue, Series D-1, 0.07%***, 10/1/2039, LOC: TD Bank NA | | | 18,020,000 | | | | 18,020,000 | |
| Michigan, Finance Authority, School Loan: | |
| Series B, 0.11%***, 9/1/2050, LOC: PNC Bank NA | | | 25,000,000 | | | | 25,000,000 | |
| Series C, 0.12%***, 9/1/2050, LOC: Bank of Montreal | | | 21,000,000 | | | | 21,000,000 | |
| Michigan, RBC Municipal Products, Inc. Trust: | |
| Series L-27, 144A, AMT, 0.1%***, 3/1/2031, LOC: Royal Bank of Canada | | | 24,245,000 | | | | 24,245,000 | |
| Series L-25, 144A, AMT, 0.1%***, 9/1/2033, LOC: Royal Bank of Canada | | | 56,745,000 | | | | 56,745,000 | |
| Michigan, State Finance Authority Revenue, School Loan Revolving Fund, Series A, 144A, 0.1%***, 9/1/2053, LOC: JPMorgan Chase Bank NA | | | 25,000,000 | | | | 25,000,000 | |
| Minnesota, State Office of Higher Education Revenue, Supplementary Student, Series A, 0.11%***, 12/1/2043, LOC: U.S. Bank NA | | | 11,500,000 | | | | 11,500,000 | |
| Mississippi, State Business Finance Commission, Gulf Opportunity Zone, Chevron U.S.A., Inc.: | | | | | | | | |
| Series J, 0.03%***, 11/1/2035, GTY: Chevron Corp. | | | 3,450,000 | | | | 3,450,000 | |
| Series A, 0.05%***, 12/1/2030, GTY: Chevron Corp. | | | 14,950,000 | | | | 14,950,000 | |
| New Hampshire, State Health & Education Facilities Authority Revenue, Higher Education Loan Corp., Series A, 0.11%***, 12/1/2032, LOC: Royal Bank of Canada | | | 16,199,000 | | | | 16,199,000 | |
| New Jersey, State Housing & Mortgage Finance Agency, Multi-Family Housing Revenue, Series C, 0.11%***, 11/1/2039, LOC: Bank of America NA | | | 9,840,000 | | | | 9,840,000 | |
| New York, State Housing Finance Agency Revenue, 88 Leonard Street, Series A, 144A, 0.11%***, 11/1/2037, LOC: Landesbank Hessen-Thuringen | | | 11,750,000 | | | | 11,750,000 | |
| New York City, NY, Municipal Water Finance Authority, Water & Sewer Systems Revenue, Series TR-T30001-I, 144A, 0.13%***, 6/15/2044, LIQ: Citibank NA | | | 8,000,000 | | | | 8,000,000 | |
| Nuveen Select Quality Municipal Fund, Inc., Series 1-2525, AMT, 0.15%***, 5/1/2041, LIQ: Barclays Bank PLC | | | 40,000,000 | | | | 40,000,000 | |
| Ohio, State Housing Finance Agency, Residential Mortgage Revenue, Mortgage-Backed Securities Program, Series N, AMT, 0.09%***, 9/1/2036, SPA: State Street Bank & Trust Co. | | | 100,000 | | | | 100,000 | |
| Ohio, University Hospitals Health System, Inc., Hospital Revenue, Series C, 0.11%***, 1/15/2050, LOC: Barclays Bank PLC | | | 25,000,000 | | | | 25,000,000 | |
| Utah, State Housing Corp., Single Family Mortgage Revenue: | |
| "I", Series E-2, 144A, AMT, 0.09%***, 1/1/2034, SPA: JPMorgan Chase Bank NA | | | 4,065,000 | | | | 4,065,000 | |
| "I", Series G-2, 144A, AMT, 0.09%***, 1/1/2034, SPA: JPMorgan Chase Bank NA | | | 8,040,000 | | | | 8,040,000 | |
| "1", Series C, 144A, AMT, 0.09%***, 7/1/2034, SPA: JPMorgan Chase Bank NA | | | 5,390,000 | | | | 5,390,000 | |
| "I", Series B-2, 144A, AMT, 0.09%***, 7/1/2034, SPA: JPMorgan Chase Bank NA | | | 5,425,000 | | | | 5,425,000 | |
| "I", Series F, 144A, AMT, 0.09%***, 7/1/2034, SPA: JPMorgan Chase Bank NA | | | 4,380,000 | | | | 4,380,000 | |
| Vermont, Economic Development Authority, Series A, TECP, 0.2%, 8/7/2014, LOC: JPMorgan Chase Bank NA | | | 33,750,000 | | | | 33,750,000 | |
Total Municipal Investments (Cost $452,219,594) | | | | 452,219,594 | |
| | |
| Repurchase Agreements 7.8% | |
| BNP Paribas, 0.08%, dated 6/30/2014, to be repurchased at $55,003,122 on 7/1/2014 (c) | | | 55,003,000 | | | | 55,003,000 | |
| BNP Paribas, 0.23%, dated 1/9/2014, to be repurchased at $200,264,500 on 8/4/2014 (b) (d) | | | 200,000,000 | | | | 200,000,000 | |
| Citigroup Global Markets, Inc., 0.06%, dated 6/30/2014, to be repurchased at $61,000,102 on 7/1/2014 (e) | | | 61,000,000 | | | | 61,000,000 | |
| JPMorgan Securities, Inc., 0.36%, dated 3/18/2014, to be repurchased at $358,533,420 on 8/14/2014 (b) (f) | | | 358,000,000 | | | | 358,000,000 | |
| JPMorgan Securities, Inc., 0.39%, dated 2/13/2014, to be repurchased at $152,872,667 on 9/29/2014 (b) (g) | | | 152,500,000 | | | | 152,500,000 | |
| Merrill Lynch & Co., Inc., 0.06%, dated 6/30/2014, to be repurchased at $71,000,118 on 7/1/2014 (h) | | | 71,000,000 | | | | 71,000,000 | |
| The Goldman Sachs & Co., 0.1%, dated 6/30/2014, to be repurchased at $60,000,167 on 7/1/2014 (i) | | | 60,000,000 | | | | 60,000,000 | |
| The Toronto-Dominion Bank, 0.11%, dated 6/30/2014, to be repurchased at $115,000,351 on 7/1/2014 (j) | | | 115,000,000 | | | | 115,000,000 | |
| Wells Fargo Securities LLC, 0.27%, dated 6/26/2014, to be repurchased at $200,010,500 on 7/3/2014 (k) | | | 200,000,000 | | | | 200,000,000 | |
| Wells Fargo Securities LLC, 0.38%, dated 5/8/2014, to be repurchased at $238,726,575 on 8/6/2014 (l) | | | 238,500,000 | | | | 238,500,000 | |
Total Repurchase Agreements (Cost $1,511,003,000) | | | | 1,511,003,000 | |
| | | % of Net Assets | | | Value ($) | |
| | | | |
Total Investment Portfolio (Cost $16,854,374,714)† | | | 87.5 | | | | 16,854,374,714 | |
| Other Assets and Liabilities, Net | | | 12.5 | | | | 2,417,375,609 | |
| Net Assets | | | 100.0 | | | | 19,271,750,323 | |
* Floating rate securities' yields vary with a designated market index or market rate, such as the coupon-equivalent of the U.S. Treasury Bill rate. These securities are shown at their current rate as of June 30, 2014.
** Annualized yield at time of purchase; not a coupon rate.
*** Variable rate demand notes and variable rate demand preferred shares are securities whose interest rates are reset periodically at market levels. These securities are payable on demand and are shown at their current rates as of June 30, 2014.
† The cost for federal income tax purposes was $16,854,374,714.
(a) Government-backed debt issued by financial companies or government sponsored enterprises.
(b) Open maturity repurchase agreement whose interest rate resets periodically and is shown at the current rate as of June 30, 2014. The dated date is the original day the repurchase agreement was entered into, the maturity date represents the next repurchase date. Upon notice, both the Portfolio and counterparty have the right to terminate the repurchase agreement at any time.
(c) Collateralized by:
| Principal Amount ($) | | Security | | Rate (%) | | Maturity Date | | Collateral Value ($) | |
| | 22,859,866 | | Federal National Mortgage Association | | | 3.5–6.5 | | 12/1/2028–5/1/2044 | | | 24,370,459 | |
| | 5,095,911 | | Federal Home Loan Mortgage Corp. | | | 3.5–4.5 | | 4/1/2019–5/1/2044 | | | 5,420,385 | |
| | 24,320,379 | | Government National Mortgage Association | | | 4.0–5.0 | | 9/15/2024–5/20/2044 | | | 26,601,448 | |
| Total Collateral Value | | | 56,392,292 | |
(d) Collateralized by:
| Principal Amount ($) | | Security | | Rate (%) | | Maturity Date | | Collateral Value ($) | |
| | 3,791,392 | | Anheuser-Busch InBev Finance, Inc. | | | 3.7 | | 2/1/2024 | | | 3,882,954 | |
| | 3,675,000 | | Caterpillar, Inc. | | | 0.95 | | 6/26/2015 | | | 3,699,643 | |
| | 5,000,000 | | College Loan Corp Trust I | | Zero Coupon | | 3/1/2042 | | | 5,000,000 | |
| | 4,100,000 | | Credit Agricole SA | | | 3.875 | | 4/15/2024 | | | 4,187,260 | |
| | 4,950,000 | | Credit Suisse | | | 2.3 | | 5/28/2019 | | | 4,960,219 | |
| | 76,990,834 | | FHLMC Multifamily Structured Pass Through Certificates | | | 1.203–3.389 | | 3/15/2024 | | | 27,684,313 | |
| | 10,000,000 | | GoldenTree Loan Opportunities VII Ltd. | | | 1.379 | | 4/25/2025 | | | 9,940,994 | |
| | 4,300,000 | | Honeywell International, Inc. | | | 5.4 | | 3/15/2016 | | | 4,727,161 | |
| | 3,510,000 | | ING Bank NV | | | 3.75 | | 3/7/2017 | | | 3,773,744 | |
| | 3,000,000 | | International Business Machines Corp. | | | 0.75 | | 5/11/2015 | | | 3,016,503 | |
| | 3,796,805 | | Macquarie Bank Ltd. | | | 3.45 | | 7/27/2015 | | | 3,948,098 | |
| | 400,000 | | Mercedes Benz Auto Lease Trust | | | 0.9 | | 12/16/2019 | | | 401,040 | |
| | 30,000,000 | | Mountain Hawk II CLO Ltd. | | | 1.388 | | 7/22/2024 | | | 29,472,600 | |
| | 25,710,717 | | OZLM VII Ltd. | | | 1.675 | | 7/17/2026 | | | 26,431,186 | |
| | 80,923,153 | | SLM Student Loan Trust | | | 0.369 | | 10/27/2031 | | | 78,874,285 | |
| Total Collateral Value | | | 210,000,000 | |
(e) Collateralized by $58,691,300 U.S. Treasury Notes, with the various coupon rates from 0.125–2.75%, with various maturity dates of 2/28/2018–1/15/2022 with a value of $62,220,002.
(f) Collateralized by:
| Principal Amount ($) | | Security | | Rate (%) | | Maturity Date | | Collateral Value ($) | |
| | 690,791 | | Access Group, Inc. | | | 0.629–0.828 | | 7/25/2034–2/22/2044 | | | 643,178 | |
| | 45,000 | | ADT Corp | | | 2.25–4.125 | | 7/15/2017–6/15/2023 | | | 43,193 | |
| | 21,714,000 | | Alcoa, Inc. | | | 5.55–6.75 | | 2/1/2017–1/15/2028 | | | 25,029,240 | |
| | 11,313,000 | | Asset Backed Securities Corp Home Equity Loan Trust | | | 0.782 | | 5/25/2035 | | | 10,579,128 | |
| | 1,193,000 | | Aviation Capital Group Corp. | | | 3.875–7.125 | | 9/27/2016–4/6/2021 | | | 1,275,076 | |
| | 1,795,000 | | Barclays Bank PLC | | | 7.75 | | 4/10/2023 | | | 2,046,932 | |
| | 85,000 | | Brinker International, Inc. | | | 2.6 | | 5/15/2018 | | | 85,246 | |
| | 14,372 | | Chase Funding Trust | | | 0.732 | | 11/25/2034 | | | 13,432 | |
| | 79,000 | | Choice Hotels International, Inc. | | | 5.75 | | 7/1/2022 | | | 84,825 | |
| | 1,832,550 | | Citigroup Mortgage Loan Trust, Inc. | | | 0.797 | | 8/25/2035 | | | 1,805,109 | |
| | 1,000 | | Clearwire Communications LLC | | | 14.75 | | 12/1/2016 | | | 1,368 | |
| | 71,275,000 | | College Loan Corp Trust I | | Zero Coupon–
5.448 | | 3/1/2042–1/25/2047 | | | 44,979,194 | |
| | 269,355,694 | | Commercial Mortgage Trust | | | 0.146 | | 12/10/2049 | | | 2,511,978 | |
| | 2,430,000 | | Continental Airlines Pass Through Trust | | | 5.5 | | 10/29/2020 | | | 2,436,718 | |
| | 1,463,261 | | Countrywide Home Equity Loan Trust | | | 0.305 | | 11/15/2036 | | | 1,239,517 | |
| | 4,055,000 | | Credit Agricole SA | | | 6.637–8.375 | | 8/14/2014 | | | 4,518,413 | |
| | 3,675,000 | | Delta Air Lines Pass Through Trust | | | 6.75 | | 11/23/2015 | | | 3,962,339 | |
| | 170,000 | | Dresdner Bank AG | | | 7.25 | | 9/15/2015 | | | 184,035 | |
| | 68,000 | | Embarq Corp. | | | 7.082 | | 6/1/2016 | | | 76,235 | |
| | 269,000 | | Expedia, Inc. | | | 5.95–7.456 | | 8/15/2018–8/15/2020 | | | 322,375 | |
| | 3,000 | | First Horizon National Corp. | | | 5.375 | | 12/15/2015 | | | 3,178 | |
| | 24,267,000 | | FirstEnergy Corp. | | | 2.75–4.25 | | 3/15/2018–3/15/2023 | | | 24,469,670 | |
| | 3,299,000 | | FirstEnergy Transmission LLC | | | 4.35–5.45 | | 1/15/2025–7/15/2044 | | | 3,345,956 | |
| | 126,000 | | Flextronics International Ltd. | | | 4.625–5.0 | | 2/15/2020–2/15/2023 | | | 132,353 | |
| | 4,412,000 | | GLP Capital LP | | | 4.375–5.375 | | 11/1/2018–11/1/2023 | | | 4,580,358 | |
| | 2,886,936 | | Goal Capital Funding Trust | | | 0.633 | | 6/25/2042 | | | 3,247,658 | |
| | 7,797,662 | | Home Equity Mortgage Loan Asset-Backed Trust | | | 0.312 | | 7/25/2037 | | | 6,940,881 | |
| | 583,000 | | Hospira, Inc. | | | 5.2–6.05 | | 3/30/2017–9/15/2040 | | | 629,584 | |
| | 3,776,914 | | HSI Asset Securitization Corp Trust | | | 0.342 | | 1/25/2036 | | | 3,684,038 | |
| | 270,000 | | Icahn Enterprises LP | | | 4.875–6.0 | | 3/15/2019–8/1/2020 | | | 296,643 | |
| | 599,000 | | ING Capital Funding Trust III | | | 3.834 | | 12/29/2049 | | | 599,000 | |
| | 22,916,000 | | International Lease Finance Corp. | | | 6.5–7.125 | | 9/1/2014–9/1/2018 | | | 26,473,540 | |
| | 21,805,000 | | Intesa Sanpaolo SpA | | | 5.017 | | 6/26/2024 | | | 22,085,359 | |
| | 5,000 | | IPALCO Enterprises, Inc. | | | 7.25 | | 4/1/2016 | | | 5,526 | |
| | 3,013,000 | | Jabil Circuit, Inc. | | | 4.7–8.25 | | 7/15/2016–9/15/2022 | | | 3,327,388 | |
| | 9,787,000 | | JetBlue Airways Pass Through Trust | | | 0.674 | | 11/15/2016 | | | 9,526,101 | |
| | 462,518,006 | | JP Morgan Chase Commercial Mortgage Securities Trust | | | 0.184 | | 12/12/2044 | | | 653,094 | |
| | 320,000 | | Liberty Mutual Group, Inc. | | | 10.75 | | 6/15/2058 | | | 491,762 | |
| | 9,350,000 | | Masco Corp. | | | 4.8–7.125 | | 6/15/2015–8/15/2032 | | | 10,420,884 | |
| | 9,317,852 | | Mastr Asset Backed Securities Trust | | | 0.452 | | 5/25/2037 | | | 8,206,826 | |
| | 375,000 | | Midcontinent Express Pipeline LLC | | | 5.45 | | 9/15/2014 | | | 383,169 | |
| | 4,318,318 | | Morgan Stanley Capital I Trust | | | 1.376 | | 6/15/2044 | | | 181,162 | |
| | 10,950,000 | | Nelnet Education Loan Funding, Inc. | | | 1.2 | | 2/25/2039 | | | 10,557,344 | |
| | 1,014,000 | | Newfield Exploration Co. | | | 5.75 | | 1/30/2022 | | | 1,138,849 | |
| | 735,710 | | N-Star REL CDO IV Ltd. | | | 0.501 | | 7/27/2040 | | | 719,393 | |
| | 661,000 | | Omega Healthcare Investors, Inc. | | | 4.95–6.75 | | 10/15/2022–4/1/2024 | | | 691,868 | |
| | 71,000 | | ONEOK, Inc. | | | 6.0 | | 6/15/2035 | | | 72,153 | |
| | 567,000 | | Owens Corning | | | 4.2–9.0 | | 12/1/2016–12/15/2022 | | | 596,096 | |
| | 60,000 | | PVH Corp. | | | 7.75 | | 11/15/2023 | | | 74,666 | |
| | 1,955,000 | | QVC, Inc. | | | 5.125–7.375 | | 10/15/2020–7/2/2022 | | | 2,119,132 | |
| | 100,000 | | Regions Bank | | | 7.5 | | 5/15/2018 | | | 119,899 | |
| | 150,000 | | Regions Financial Corp. | | | 5.75–7.75 | | 11/10/2014–6/15/2015 | | | 158,194 | |
| | 24,686,000 | | Royal Bank of Scotland Group PLC | | | 6.0–6.1 | | 6/10/2023–12/19/2023 | | | 26,814,318 | |
| | 280,000 | | Seminole Tribe of Florida, Inc. | | | 7.804 | | 10/1/2020 | | | 320,584 | |
| | 19,895,000 | | Signet UK Finance PLC | | | 4.7 | | 6/15/2024 | | | 20,344,483 | |
| | 90,000 | | SL Green Realty Corp. | | | 5.0 | | 8/15/2018 | | | 99,738 | |
| | 24,177,947 | | SLM Private Credit Student Loan Trust | | | 0.501–0.631 | | 6/15/2039–12/15/2039 | | | 21,684,437 | |
| | 2,000,000 | | SLM Private Education Loan Trust | | | 3.0 | | 5/16/2044 | | | 1,941,022 | |
| | 300,000 | | Societe Generale SA | | | 5.922 | | 8/14/2014 | | | 325,195 | |
| | 873,000 | | Telecom Italia Capital SA | | | 4.95–5.25 | | 9/30/2014–10/1/2015 | | | 920,536 | |
| | 5,136,000 | | Telecom Italia SpA | | | 5.303 | | 5/30/2024 | | | 5,165,117 | |
| | 3,000 | | Toll Brothers Finance Corp. | | | 6.75 | | 11/1/2019 | | | 3,483 | |
| | 4,573,000 | | TRW Automotive, Inc. | | | 4.45–4.5 | | 3/1/2021–12/1/2023 | | | 4,890,130 | |
| | 50,000 | | United States Cellular Corp. | | | 6.7 | | 12/15/2033 | | | 50,655 | |
| | 13,840,467 | | US Education Loan Trust IV LLC | | | 0.08 | | 9/1/2047 | | | 17,627,642 | |
| | 3,601,000 | | VeriSign, Inc. | | | 4.625 | | 5/1/2023 | | | 3,577,768 | |
| | 8,365,000 | | Williams Companies, Inc. | | | 7.5 | | 1/15/2031 | | | 10,156,741 | |
| | 7,744,000 | | Wynn Las Vegas LLC | | | 5.375–7.875 | | 5/1/2020–3/15/2022 | | | 8,323,522 | |
| Total Collateral Value | | | 370,014,626 | |
(g) Collateralized by:
| Principal Amount ($) | | Security | | Rate (%) | | Maturity Date | | Collateral Value ($) | |
| | 4,578,303 | | BBVA US Senior SAU | | | 4.664 | | 10/9/2015 | | | 4,836,173 | |
| | 500,000 | | Best Buy Co., Inc. | | | 3.75–5.5 | | 3/15/2016–3/15/2021 | | | 520,783 | |
| | 3,200,000 | | BNP Paribas | | | 5.186 | | 9/29/2014 | | | 3,260,461 | |
| | 15,000 | | Boardwalk Pipelines LP | | | 5.5 | | 2/1/2017 | | | 16,677 | |
| | 7,765,000 | | Capital One Bank U.S.A. NA | | | 2.25 | | 2/13/2019 | | | 7,877,457 | |
| | 40,000 | | ComEd Financing III | | | 6.35 | | 3/15/2033 | | | 40,841 | |
| | 9,005,000 | | Delta Air Lines Pass Through Trust | | | 6.375–9.75 | | 1/2/2016–12/17/2016 | | | 8,508,665 | |
| | 3,000 | | Discover Bank | | | 8.7 | | 11/18/2019 | | | 3,843 | |
| | 34,000 | | Discover Financial Services | | | 3.85 | | 11/21/2022 | | | 34,944 | |
| | 18,513,000 | | El Paso Pipeline Partners Operating Co., LLC | | | 4.1–6.5 | | 11/15/2015–11/1/2042 | | | 21,254,214 | |
| | 450,000 | | EPR Properties | | | 5.75 | | 8/15/2022 | | | 498,618 | |
| | 474,000 | | Interpublic Group of Companies, Inc. | | | 4.2 | | 4/15/2024 | | | 492,898 | |
| | 30,743,500 | | JPMorgan Chase & Co. | | Zero Coupon–7.9 | | 7/2/2014–7/20/2014 | | | 32,132,348 | |
| | 79,000 | | Leucadia National Corp. | | | 8.125 | | 9/15/2015 | | | 86,915 | |
| | 3,907,616 | | Manufacturers & Traders Trust Co. | | | 6.625 | | 12/4/2017 | | | 4,564,152 | |
| | 68,000 | | Martin Marietta Materials, Inc. | | | 6.25 | | 5/1/2037 | | | 73,390 | |
| | 7,910,000 | | MBIA, Inc. | | | 6.625–7.0 | | 12/15/2025–10/1/2028 | | | 8,524,508 | |
| | 5,825,000 | | Midcontinent Express Pipeline LLC | | | 5.45–6.7 | | 9/15/2014–9/15/2019 | | | 6,546,807 | |
| | 12,795,000 | | Monsanto Co. | | | 0.423 | | 11/7/2016 | | | 12,806,316 | |
| | 1,825,000 | | MUFG Capital Finance 1 Ltd. | | | 6.346 | | 9/29/2014 | | | 2,029,989 | |
| | 2,791,134 | | NextEra Energy Capital Holdings, Inc. | | | 1.2 | | 6/1/2015 | | | 2,817,203 | |
| | 2,441,713 | | Ohio Edison Co. | | | 8.25 | | 10/15/2038 | | | 3,798,040 | |
| | 3,620,000 | | People's United Financial, Inc. | | | 3.65 | | 12/6/2022 | | | 3,633,370 | |
| | 1,210,000 | | Signet UK Finance PLC | | | 4.7 | | 6/15/2024 | | | 1,237,337 | |
| | 2,000,000 | | State Street Capital Trust I | | | 0.784 | | 5/15/2028 | | | 1,720,025 | |
| | 415,000 | | State Street Capital Trust IV | | | 1.231 | | 6/15/2037 | | | 352,937 | |
| | 11,000 | | State Street Corp. | | | 4.956 | | 3/15/2018 | | | 12,275 | |
| | 3,878,042 | | TransCanada PipeLines Ltd. | | | 0.875 | | 3/2/2015 | | | 3,903,087 | |
| | 25,000 | | Tyson Foods, Inc. | | | 7.0 | | 5/1/2018 | | | 29,288 | |
| | 65,000 | | UBS Preferred Funding Trust V | | | 6.243 | | 5/29/2049 | | | 69,813 | |
| | 100,000 | | UniCredit Luxembourg Finance SA | | | 6.0 | | 10/31/2017 | | | 111,381 | |
| | 24,404,000 | | Verizon Communications, Inc. | | | 1.002–4.15 | | 6/17/2019–
3/15/2024 | | | 25,283,556 | |
| Total Collateral Value | | | 157,078,311 | |
(h) Collateralized by $70,850,000 U.S. Treasury Notes, with the various coupon rates from 0.125–1.0%, with various maturity dates of 8/31/2016–4/15/2019 with a value of $72,420,083.
(i) Collateralized by $55,877,808 Government National Mortgage Association, with the various coupon rates from 4.0–6.0%, with various maturity dates of 7/20/2038–1/15/2044 with a value of $61,200,000.
(j) Collateralized by:
| Principal Amount ($) | | Security | | Rate (%) | | Maturity Date | | Collateral Value ($) | |
| | 78,000 | | Actavis, Inc. | | | 3.25 | | 10/1/2022 | | | 77,170 | |
| | 1,000,000 | | Aon PLC | | | 4.6 | | 6/14/2044 | | | 995,357 | |
| | 2,000,000 | | Apollo Management Holdings LP | | | 4.0 | | 5/30/2024 | | | 2,012,767 | |
| | 15,308,375 | | Apple, Inc. | | | 1.05–4.45 | | 5/5/2017–5/6/2044 | | | 15,431,109 | |
| | 1,037,000 | | Australia & New Zealand Banking Group Ltd. | | | 0.842–2.4 | | 10/6/2015–11/23/2016 | | | 1,046,634 | |
| | 5,000,000 | | Bank of Montreal | | | 1.95 | | 1/30/2017 | | | 5,168,025 | |
| | 12,513,051 | | Bank of Nova Scotia | | | 1.65–1.75 | | 10/29/2015–3/22/2017 | | | 12,787,682 | |
| | 1,000,000 | | Capital One Financial Corp. | | | 3.75 | | 4/24/2024 | | | 1,020,535 | |
| | 955,000 | | CareFusion Corp. | | | 3.875 | | 5/15/2024 | | | 963,633 | |
| | 734,903 | | Caterpillar, Inc. | | | 4.3 | | 5/15/2044 | | | 740,680 | |
| | 472,402 | | Cisco Systems, Inc. | | | 5.5 | | 2/22/2016 | | | 519,735 | |
| | 4,130,707 | | Citigroup, Inc. | | | 2.55–3.75 | | 4/8/2019–6/16/2024 | | | 4,156,969 | |
| | 1,165,000 | | Comcast Corp. | | | 4.75 | | 3/1/2044 | | | 1,242,287 | |
| | 600,000 | | Commonwealth Bank of Australia | | | 2.0–2.25 | | 3/16/2017–6/18/2019 | | | 618,558 | |
| | 707,049 | | Danaher Corp. | | | 5.4 | | 3/1/2019 | | | 823,832 | |
| | 622,871 | | DIRECTV Holdings LLC | | | 4.6 | | 2/15/2021 | | | 690,203 | |
| | 400,000 | | eBay, Inc. | | | 2.6 | | 7/15/2022 | | | 387,539 | |
| | 1,000,000 | | Express Scripts Holding Co. | | | 2.25 | | 6/15/2019 | | | 997,863 | |
| | 179,000 | | General Electric Capital Corp. | | | 2.95 | | 5/9/2016 | | | 187,350 | |
| | 5,016 | | Georgia Power Co. | | | 5.7 | | 6/1/2017 | | | 5,673 | |
| | 200,000 | | Hartford Financial Services Group, Inc. | | | 6.1 | | 10/1/2041 | | | 250,780 | |
| | 375,000 | | Honeywell International, Inc. | | | 4.25 | | 3/1/2021 | | | 420,378 | |
| | 1,250,000 | | Hospitality Properties Trust | | | 4.65 | | 3/15/2024 | | | 1,301,185 | |
| | 6,144,017 | | HSBC Bank PLC | | | 3.1 | | 5/24/2013 | | | 6,438,807 | |
| | 1,000,000 | | Icahn Enterprises LP | | | 4.875 | | 3/15/2019 | | | 1,034,526 | |
| | 287 | | International Business Machines Corp. | | | 3.625 | | 2/12/2024 | | | 298 | |
| | 950,000 | | Johnson Controls, Inc. | | | 3.625–4.625 | | 7/2/2024–7/2/2044 | | | 952,120 | |
| | 4,101,070 | | Legg Mason, Inc. | | | 2.7–5.625 | | 7/15/2019–1/15/2044 | | | 4,178,314 | |
| | 2,638,316 | | Manulife Financial Corp. | | | 4.9 | | 9/17/2020 | | | 2,947,868 | |
| | 5,174,664 | | MasterCard, Inc. | | | 3.375 | | 4/1/2024 | | | 5,235,829 | |
| | 468,000 | | Merck Sharp & Dohme Corp. | | | 4.75 | | 3/1/2015 | | | 489,229 | |
| | 49,186 | | National Australia Bank Ltd. | | | 2.0 | | 6/20/2017 | | | 50,332 | |
| | 1,635,000 | | National Bank of Canada | | | 2.2 | | 10/19/2016 | | | 1,692,321 | |
| | 2,442,879 | | Pfizer, Inc. | | | 5.35 | | 3/15/2015 | | | 2,564,911 | |
| | 725,787 | | Province of Nova Scotia Canada | | | 8.75 | | 4/1/2022 | | | 1,014,964 | |
| | 3,000,000 | | Prudential Financial, Inc. | | | 3.5–4.6 | | 5/15/2024–5/15/2044 | | | 3,014,750 | |
| | 15,123,410 | | Royal Bank of Canada | | | 1.125–3.125 | | 4/14/2015–10/1/2018 | | | 15,466,830 | |
| | 12,000 | | Statoil ASA | | | 2.9 | | 10/15/2014 | | | 12,163 | |
| | 163,000 | | Swedbank Hypotek AB | | | 1.375 | | 3/28/2018 | | | 162,794 | |
| | 1,221,000 | | Target Corp. | | | 2.3–3.5 | | 6/26/2019–7/1/2024 | | | 1,234,236 | |
| | 2,599,662 | | The Toronto-Dominion Bank | | | 1.5–1.625 | | 9/14/2016–3/13/2017 | | | 2,648,952 | |
| | 500,000 | | Time Warner, Inc. | | | 3.55 | | 6/1/2024 | | | 497,553 | |
| | 1,000,000 | | TJX Companies, Inc. | | | 2.75 | | 6/15/2021 | | | 1,003,820 | |
| | 3,303,424 | | Total Capital SA | | | 3.0 | | 6/24/2015 | | | 3,389,346 | |
| | 5,090,445 | | Verizon Communications, Inc. | | | 1.35–6.55 | | 6/9/2017–9/15/2043 | | | 6,041,010 | |
| | 2,870,032 | | Wells Fargo & Co. | | | 2.15–7.98 | | 1/15/2019 | | | 3,265,687 | |
| | 2,158,713 | | Westpac Banking Corp. | | | 1.375–2.0 | | 7/17/2015–5/21/2019 | | | 2,163,816 | |
| | 1,850,000 | | Xerox Corp. | | | 2.8–3.8 | | 5/15/2020–5/15/2024 | | | 1,850,692 | |
| Total Collateral Value | | | 119,197,112 | |
(k) Collateralized by:
| Principal Amount ($) | | Security | | Rate (%) | | Maturity Date | | Collateral Value ($) | |
| | 160,000 | | Ally Auto Receivables Trust | | | 1.21 | | 7/15/2016 | | | 161,080 | |
| | 1,500,000 | | American Express Credit Account Master Trust | | | 1.412 | | 9/15/2020 | | | 1,553,929 | |
| | 230,000 | | Atlantic City Electric Transition Funding LLC | | | 5.55 | | 10/20/2023 | | | 264,300 | |
| | 7,000,000 | | Cabela's Master Credit Card Trust | | | 0.702 | | 10/15/2019 | | | 7,050,293 | |
| | 1,000,000 | | CarMax Auto Owner Trust | | | 0.8 | | 7/16/2018 | | | 999,738 | |
| | 2,050,000 | | Entergy Texas Restoration Funding LLC | | | 4.38 | | 11/1/2023 | | | 2,285,531 | |
| | 208,015,264 | | FHLMC Multifamily Structured Pass Through Certificates | | | 0.502–3.882 | | 11/25/2017–6/25/2041 | | | 42,358,626 | |
| | 18,585,000 | | Freddie Mac Structured Agency Credit Risk Debt Notes | | | 4.402–4.652 | | 11/25/2023–2/25/2024 | | | 20,769,698 | |
| | 44,031,000 | | FREMF Mortgage Trust | | | 4.41–5.405 | | 9/25/2043–1/25/2045 | | | 48,299,367 | |
| | 1,490,397 | | GE Equipment Small Ticket LLC | | | 1.02 | | 2/24/2017 | | | 1,500,334 | |
| | 899,516 | | General Electric Capital Corp. | | | 1.0 | | 9/23/2015 | | | 906,464 | |
| | 36,520,000 | | Hertz Vehicle Financing LLC | | | 2.2 | | 3/25/2016 | | | 36,818,790 | |
| | 1,255,593 | | Honda Auto Receivables Owner Trust | | | 0.37 | | 10/16/2015 | | | 1,255,901 | |
| | 13,050,000 | | Hyundai Auto Receivables Trust | | | 2.1 | | 6/15/2017 | | | 13,377,855 | |
| | 9,711,867 | | Illinois Tool Works, Inc. | | | 3.9 | | 9/1/2042 | | | 9,243,965 | |
| | 769,909 | | Intel Corp. | | | 1.35 | | 12/15/2017 | | | 770,211 | |
| | 5,000,000 | | International Bank for Reconstruction & Development | | | 0.375 | | 8/24/2015 | | | 5,009,975 | |
| | 4,011,000 | | LSTAR Commercial Mortgage Trust | | | 2.767 | | 1/20/2041 | | | 4,058,176 | |
| | 4,250,000 | | MMAF Equipment Finance LLC | | | 2.1 | | 7/15/2017 | | | 4,321,536 | |
| | 1,898,707 | | Nissan Auto Receivables Owner Trust | | | 0.5 | | 5/15/2017 | | | 1,900,508 | |
| | 2,000,000 | | Nissan Master Owner Trust Receivables | | | 0.452 | | 2/15/2018 | | | 2,001,295 | |
| Total Collateral Value | | | 204,907,572 | |
(l) Collateralized by:
| Principal Amount ($) | | Security | | Rate (%) | | Maturity Date | | Collateral Value ($) | |
| | 900,000 | | Ally Auto Receivables Trust | | | 0.52 | | 10/20/2016 | | | 900,270 | |
| | 7,059 | | AmeriCredit Automobile Receivables Trust | | | 0.68–1.17 | | 5/9/2016–10/11/216 | | | 7,068 | |
| | 500,000 | | Australia & New Zealand Banking Group Ltd. | | | 0.477 | | 1/29/2015 | | | 501,175 | |
| | 250,000 | | Bank of China Ltd. | | | 0.38 | | 8/6/2014 | | | 249,965 | |
| | 1,500,000 | | Barclays Dryrock Issuance Trust | | | 0.64 | | 8/15/2018 | | | 1,500,448 | |
| | 35,000,000 | | BMW Floorplan Master Owner Trust | | | 0.552 | | 9/15/2017 | | | 35,115,140 | |
| | 1,740,000 | | BMW Vehicle Owner Trust | | | 0.67 | | 11/27/2017 | | | 1,741,985 | |
| | 2,459,653 | | Capital Auto Receivables Asset Trust | | | 0.62 | | 7/20/2016 | | | 2,461,075 | |
| | 770,000 | | Capital One Multi-Asset Execution Trust | | | 0.232–0.426 | | 11/15/2019–12/16/2019 | | | 768,097 | |
| | 8,605,572 | | CarMax Auto Owner Trust | | | 0.52–1.07 | | 6/15/2016–1/16/2018 | | | 8,615,874 | |
| | 825,000 | | Chase Issuance Trust | | | 0.202–0.252 | | 2/15/2017–4/15/2019 | | | 822,110 | |
| | 1 | | CIT Equipment Collateral | | | 1.1 | | 8/22/2016 | | | 1 | |
| | 6,563,000 | | Citibank Credit Card Issuance Trust | | | 0.254–4.85 | | 3/10/2017–12/17/2018 | | | 6,708,791 | |
| | 5,102,566 | | CNH Equipment Trust | | | 0.45–1.16 | | 4/15/2016–6/15/2020 | | | 5,108,334 | |
| | 4,334,439 | | Credit Suisse AG | | | 0.38 | | 8/6/2014 | | | 4,337,950 | |
| | 8,300,000 | | Discover Card Execution Note Trust | | | 0.582 | | 7/15/2021 | | | 8,328,317 | |
| | 21,665,000 | | FHLMC Multifamily Structured Pass Through Certificates | | | 2.307–2.573 | | 5/25/2022–9/25/2022 | | | 21,339,620 | |
| | 200,000 | | Fifth Third Auto Trust | | | 0.89 | | 11/15/2018 | | | 200,023 | |
| | 29,503 | | First Investors Auto Owner Trust | | | 1.96 | | 11/15/2017 | | | 29,584 | |
| | 2,060,000 | | Ford Credit Auto Lease Trust | | | 1.61 | | 10/15/2016 | | | 2,064,464 | |
| | 14,030,000 | | Ford Credit Auto Owner Trust | | | 0.57 | | 10/15/2017 | | | 14,049,396 | |
| | 15,600,000 | | Ford Credit Floorplan Master Owner Trust A | | | 0.3–0.85 | | 1/15/2018–6/15/2020 | | | 15,654,187 | |
| | 5,000,000 | | GE Capital Credit Card Master Note Trust | | | 1.36 | | 8/17/2020 | | | 4,978,153 | |
| | 1,635,000 | | GE Dealer Floorplan Master Note Trust | | | 0.753 | | 7/20/2016 | | | 1,635,647 | |
| | 505,971 | | GE Equipment Midticket LLC | | | 0.78–0.64 | | 3/22/2016–9/22/2020 | | | 506,240 | |
| | 2,779,603 | | GE Equipment Small Ticket LLC | | | 1.02 | | 2/24/2017 | | | 2,798,135 | |
| | 1,550,000 | | Golden Credit Card Trust | | | 0.402–0.602 | | 7/17/2017–2/15/2018 | | | 1,553,554 | |
| | 1,705,902 | | Honda Auto Receivables Owner Trust | | | 0.35–0.77 | | 6/22/2015–2/16/2017 | | | 1,707,813 | |
| | 500,000 | | Hyundai Auto Lease Securitization Trust | | | 0.52 | | 7/15/2016 | | | 500,414 | |
| | 2,900,000 | | Hyundai Auto Receivables Trust | | | 0.79–2.1 | | 6/15/2017–7/16/2018 | | | 2,970,918 | |
| | 1,450,000 | | ING U.S. Funding LLC | | | 0.38 | | 8/6/2014 | | | 1,449,694 | |
| | 1,332,118 | | Intel Corp. | | | 1.35 | | 12/15/2017 | | | 1,332,641 | |
| | 67,595 | | John Deere Owner Trust | | | 0.55 | | 1/15/2016 | | | 67,649 | |
| | 4,750,000 | | Kookmin Bank | | | 0.38 | | 8/6/2014 | | | 4,748,161 | |
| | 3,000,000 | | Lloyds Bank PLC NY Branch | | | 0.38 | | 8/6/2014 | | | 3,003,054 | |
| | 11,755,539 | | LSTAR Commercial Mortgage Trust | | | 1.519–2.767 | | 1/20/2041 | | | 11,874,823 | |
| | 3,348,923 | | M&T Bank Auto Receivables Trust | | | 0.66 | | 2/16/2016 | | | 3,352,217 | |
| | 500,000 | | Mercedes Benz Auto Lease Trust | | | 0.62 | | 7/15/2016 | | | 500,805 | |
| | 1,270,000 | | Mercedes-Benz Master Owner Trust | | | 0.422 | | 11/15/2016 | | | 1,270,430 | |
| | 120,000 | | Navistar Financial Dealer Note Master Trust | | | 0.822 | | 1/25/2018 | | | 120,028 | |
| | 2,000,000 | | Nissan Auto Lease Trust | | | 0.74 | | 9/17/2018 | | | 2,004,493 | |
| | 27,645,983 | | Nissan Auto Receivables Owner Trust | | | 0.5 | | 5/15/2017 | | | 27,672,201 | |
| | 5,100,000 | | Nissan Master Owner Trust Receivables | | | 0.452 | | 2/15/2018 | | | 5,103,302 | |
| | 5,190,000 | | PHEAA Student Loan Trust I | | | 1.653 | | 4/25/2044 | | | 5,099,294 | |
| | 5,000,000 | | Porsche Innovative Lease Owner Trust | | | 0.88 | | 10/22/2019 | | | 5,011,068 | |
| | 2,517,000 | | River Fuel Company No. 2 | | | 0.38 | | 8/6/2014 | | | 2,516,613 | |
| | 3,931,941 | | Santander Drive Auto Receivables Trust | | | 0.472–1.02 | | 9/15/2016–1/16/2018 | | | 3,939,514 | |
| | 5,700,000 | | SLM Student Loan Trust | | | 0.432 | | 9/25/2019 | | | 5,701,550 | |
| | 25,224 | | Toyota Auto Receivables Owner Trust | | | 0.48 | | 2/15/2016 | | | 25,239 | |
| | 1,700,000 | | Volkswagen Auto Lease Trust | | | 0.84 | | 7/20/2016 | | | 1,706,356 | |
| | 1,900,000 | | Volkswagen Credit Auto Master Owner Trust | | | 0.833 | | 9/20/2016 | | | 1,902,278 | |
| | 1,890,000 | | Volvo Financial Equipment LLC | | | 0.74 | | 3/15/2017 | | | 1,894,002 | |
| | 4,142,504 | | Wells Fargo Bank NA | | | 6.6 | | 1/15/2038 | | | 5,703,440 | |
| | 2,124,000 | | World Omni Auto Receivables Trust | | | 0.61 | | 6/15/2017 | | | 2,127,418 | |
| Total Collateral Value | | | 245,281,018 | |
144A: Security exempt from registration under Rule 144A of the Securities Act of 1933. These securities may be resold in transactions exempt from registration, normally to qualified institutional buyers.
AMT: Subject to alternative minimum tax.
GTY: Guaranty Agreement
LIQ: Liquidity Facility
LOC: Letter of Credit
SPA: Standby Bond Purchase Agreement
TECP: Tax Exempt Commercial Paper
Fair Value Measurements
Various inputs are used in determining the value of the Portfolio's investments. These inputs are summarized in three broad levels. Level 1 includes quoted prices in active markets for identical securities. Level 2 includes other significant observable inputs (including quoted prices for similar securities, interest rates, prepayment speeds and credit risk). Level 3 includes significant unobservable inputs (including the Portfolio's own assumptions in determining the fair value of investments). The level assigned to the securities valuations may not be an indication of the risk or liquidity associated with investing in those securities. Securities held by the Portfolio are reflected as Level 2 because the securities are valued at amortized cost (which approximates fair value) and, accordingly, the inputs used to determine value are not quoted prices in an active market.
The following is a summary of the inputs used as of June 30, 2014 in valuing the Portfolio's investments. For information on the Portfolio's policy regarding the valuation of investments, please refer to the Security Valuation section of Note A in the accompanying Notes to Financial Statements.
| Assets | | Level 1 | | | Level 2 | | | Level 3 | | | Total | |
| | |
| Investments in Securities (m) | | $ | — | | | $ | 15,343,371,714 | | | $ | — | | | $ | 15,343,371,714 | |
| Repurchase Agreements | | | — | | | | 1,511,003,000 | | | | — | | | | 1,511,003,000 | |
| Total | | $ | — | | | $ | 16,854,374,714 | | | $ | — | | | $ | 16,854,374,714 | |
There have been no transfers between fair value measurement levels during the period ended June 30, 2014.
(m) See Investment Portfolio for additional detailed categorizations.
The accompanying notes are an integral part of the financial statements.
Statement of Assets and Liabilities | as of June 30, 2014 (Unaudited) | |
| Assets | |
| Investments in non-affiliated securities, valued at amortized cost | | $ | 16,854,374,714 | |
| Cash | | | 2,413,957,491 | |
| Receivable for investments sold | | | 1,665,000 | |
| Interest receivable | | | 4,061,882 | |
| Other assets | | | 150,351 | |
| Total assets | | | 19,274,209,438 | |
| Liabilities | |
| Accrued management fee | | | 1,588,584 | |
| Accrued Trustees' fees | | | 196,831 | |
| Other accrued expenses and payables | | | 673,700 | |
| Total liabilities | | | 2,459,115 | |
| Net assets, at value | | $ | 19,271,750,323 | |
The accompanying notes are an integral part of the financial statements.
| for the six months ended June 30, 2014 (Unaudited) | |
| Investment Income | |
Income: Interest | | $ | 18,309,992 | |
Expenses: Management fee | | | 12,541,716 | |
| Administration fee | | | 2,954,118 | |
| Custodian fee | | | 128,809 | |
| Professional fees | | | 126,965 | |
| Reports to shareholders | | | 9,412 | |
| Trustees' fees and expenses | | | 462,862 | |
| Other | | | 268,405 | |
| Total expenses before expense reductions | | | 16,492,287 | |
| Expense reductions | | | (2,801,035 | ) |
| Total expenses after expense reductions | | | 13,691,252 | |
| Net investment income | | | 4,618,740 | |
| Net realized gain (loss) from investments | | | (560 | ) |
| Net increase (decrease) in net assets resulting from operations | | $ | 4,618,180 | |
The accompanying notes are an integral part of the financial statements.
Statement of Changes in Net Assets | Increase (Decrease) in Net Assets | | Six Months Ended June 30, 2014 (Unaudited) | | | Year Ended December 31, 2013 | |
Operations: Net investment income | | $ | 4,618,740 | | | $ | 18,689,800 | |
Operations: Net investment income | | $ | 4,618,740 | | | $ | 18,689,800 | |
| Net realized gain (loss) | | | (560 | ) | | | 269,542 | |
| Net increase (decrease) in net assets resulting from operations | | | 4,618,180 | | | | 18,959,342 | |
Capital transactions in shares of beneficial interest: Proceeds from capital invested | | | 99,340,972,068 | | | | 203,102,122,625 | |
| Value of capital withdrawn | | | (100,288,082,077 | ) | | | (207,716,596,936 | ) |
| Net increase (decrease) in net assets from capital transactions in shares of beneficial interest | | | (947,110,009 | ) | | | (4,614,474,311 | ) |
| Increase (decrease) in net assets | | | (942,491,829 | ) | | | (4,595,514,969 | ) |
| Net assets at beginning of period | | | 20,214,242,152 | | | | 24,809,757,121 | |
| Net assets at end of period | | $ | 19,271,750,323 | | | $ | 20,214,242,152 | |
The accompanying notes are an integral part of the financial statements.
| | | | | | Years Ended December 31, | |
| | | Six Months Ended 6/30/14 (Unaudited) | | | 2013 | | | 2012 | | | 2011 | | | 2010 | | | 2009 | |
| Ratios to Average Net Assets and Supplemental Data | |
| Net assets, end of period ($ millions) | | | 19,272 | | | | 20,214 | | | | 24,810 | | | | 20,784 | | | | 34,432 | | | | 42,466 | |
| Ratio of expenses before expense reductions (%) | | | .17 | * | | | .16 | | | | .17 | | | | .16 | | | | .17 | | | | .16 | |
| Ratio of expenses after expense reductions (%) | | | .14 | * | | | .14 | | | | .14 | | | | .15 | | | | .16 | | | | .14 | |
| Ratio of net investment income (%) | | | .05 | * | | | .08 | | | | .14 | | | | .10 | | | | .16 | | | | .43 | |
Total Return (%)a,b | | | .02 | ** | | | .08 | | | | .14 | | | | .11 | | | | .17 | | | | .48 | |
a Total return would have been lower had certain expenses not been reduced. b Total return for the Portfolio was derived from the performance of Cash Reserves Fund Institutional. * Annualized ** Not annualized | |
Notes to Financial Statements (Unaudited)
A. Organization and Significant Accounting Policies
Cash Management Portfolio (the "Portfolio") is registered under the Investment Company Act of 1940, as amended (the "1940 Act"), as an open-end management investment company organized as a New York trust.
The Portfolio is a master fund. A master/feeder fund structure is one in which a fund (a "feeder fund"), instead of investing directly in a portfolio of securities, invests most or all of its investment assets in a separate registered investment company (the "master fund") with substantially the same investment objective and policies as the feeder fund. Such a structure permits the pooling of assets of two or more feeder funds, preserving separate identities or distribution channels at the feeder fund level. The Portfolio may have several feeder funds, including affiliated Deutsche feeder funds and unaffiliated feeder funds; with a significant ownership percentage of the Portfolio's net assets. Investment activities of these feeder funds could have a material impact on the Portfolio. As of June 30, 2014, Cash Management Fund, Cash Reserves Fund Institutional, Cash Reserves Fund — Prime Series and Deutsche Money Market Series (formerly DWS Money Market Series) owned approximately 9%, 5%, 5% and 79%, respectively, of the Portfolio.
The Portfolio's financial statements are prepared in accordance with accounting principles generally accepted in the United States of America which require the use of management estimates. Actual results could differ from those estimates. The policies described below are followed consistently by the Portfolio in the preparation of its financial statements.
Security Valuation. Various inputs are used in determining the value of the Portfolio's investments. These inputs are summarized in three broad levels. Level 1 includes quoted prices in active markets for identical securities. Level 2 includes other significant observable inputs (including quoted prices for similar securities, interest rates, prepayment speeds and credit risk). Level 3 includes significant unobservable inputs (including the Portfolio's own assumptions in determining the fair value of investments). The level assigned to the securities valuations may not be an indication of the risk or liquidity associated with investing in those securities. Securities held by the Portfolio are reflected as Level 2 because the securities are valued at amortized cost (which approximates fair value) and, accordingly, the inputs used to determine value are not quoted prices in an active market.
The Portfolio values all securities utilizing the amortized cost method permitted in accordance with Rule 2a-7 under the 1940 Act and certain conditions therein. Under this method, which does not take into account unrealized capital gains or losses on securities, an instrument is initially valued at its cost and thereafter assumes a constant accretion/amortization rate to maturity of any discount or premium. Securities held by the Portfolio are reflected as Level 2 because the securities are valued at amortized cost (which approximates fair value) and, accordingly, the inputs used to determine value are not quoted prices in an active market.
Repurchase Agreements. The Portfolio may enter into repurchase agreements, under the terms of a Master Repurchase Agreement, with certain banks and broker/dealers whereby the Portfolio, through its custodian or a sub-custodian bank, receives delivery of the underlying securities, the amount of which at the time of purchase and each subsequent business day is required to be maintained at such a level that the value is equal to at least the principal amount of the repurchase price plus accrued interest. The custodian bank or another designated subcustodian holds the collateral in a separate account until the agreement matures. If the value of the securities falls below the principal amount of the repurchase agreement plus accrued interest, the financial institution deposits additional collateral by the following business day. If the financial institution either fails to deposit the required additional collateral or fails to repurchase the securities as agreed, the Portfolio has the right to sell the securities and recover any resulting loss from the financial institution. If the financial institution enters into bankruptcy, the Portfolio's claims on the collateral may be subject to legal proceedings.
As of June 30, 2014, the Portfolio held repurchase agreements with a gross value of $1,511,003,000. The value of the related collateral exceeded the value of the repurchase agreements at period end. The detail of the related collateral is included in the footnotes following the Portfolio's Investment Portfolio.
Federal Income Taxes. The Portfolio is considered a Partnership under the Internal Revenue Code, as amended. Therefore, no federal income tax provision is necessary.
It is intended that the Portfolio's assets, income and distributions will be managed in such a way that an investor in the Portfolio will be able to satisfy the requirements of Subchapter M of the Code, assuming that the investor invested all of its assets in the Portfolio.
The Portfolio has reviewed the tax positions for the open tax years as of December 31, 2013 and has determined that no provision for income tax and/or uncertain tax provisions is required in the Portfolio's financial statements. The Portfolio's federal tax returns for the prior three fiscal years remain open subject to examination by the Internal Revenue Service.
Contingencies. In the normal course of business, the Portfolio may enter into contracts with service providers that contain general indemnification clauses. The Portfolio's maximum exposure under these arrangements is unknown as this would involve future claims that may be made against the Portfolio that have not yet been made. However, based on experience, the Portfolio expects the risk of loss to be remote.
Other. Investment transactions are accounted for on trade date. Interest income is recorded on the accrual basis. Realized gains and losses from investment transactions are recorded on an identified cost basis. All discounts and premiums are accreted/amortized for both tax and financial reporting purposes.
The Portfolio makes an allocation of its net investment income and realized gains and losses from securities transactions to its investors in proportion to their investment in the Portfolio.
B. Fees and Transactions with Affiliates
Management Agreement. Under the Investment Management Agreement with Deutsche Investment Management Americas Inc. ("DIMA" or the "Advisor"), an indirect, wholly owned subsidiary of Deutsche Bank AG, the Advisor determines the securities, instruments and other contracts relating to investments to be purchased, sold or entered into by the Portfolio.
Under the Investment Management Agreement, the Portfolio pays the Advisor a monthly management fee based on its average daily net assets, computed and accrued daily and payable monthly, at the following annual rates:
| First $3.0 billion of the Portfolio's average daily net assets | | | .1500 | % |
| Next $4.5 billion of such net assets | | | .1325 | % |
| Over $7.5 billion of such net assets | | | .1200 | % |
For the period from January 1, 2014 through June 30, 2014, the Advisor has voluntarily agreed to waive its fees and/or reimburse certain operating expenses to the extent necessary to maintain the operating expenses (excluding certain expenses such as extraordinary expenses, taxes, brokerage and interest) at 0.14% of the Portfolio's average daily net assets. This voluntary waiver or reimbursement may be terminated at any time at the option of the Advisor.
For the six months ended June 30, 2014, the Advisor waived a portion of its management fee aggregating $2,801,035, and the amount charged aggregated $9,740,681, which was equivalent to an annualized effective rate of 0.10%.
Administration Fee. Pursuant to an Administrative Services Agreement, DIMA provides most administrative services to the Portfolio. For all services provided under the Administrative Services Agreement, the Portfolio pays the Advisor an annual fee ("Administration Fee") of 0.03% of the Portfolio's average daily net assets, computed and accrued daily and payable monthly. For the six months ended June 30, 2014, the Administration Fee was $2,954,118, of which $469,283 is unpaid.
Filing Service Fees. Under an agreement with DIMA, DIMA is compensated for providing certain regulatory filing services to the Portfolio. For the six months ended June 30, 2014, the amount charged to the Portfolio by DIMA included in the Statement of Operations under "reports to shareholders" aggregated $905, all of which is unpaid.
Trustees' Fees and Expenses. The Portfolio paid retainer fees to each Trustee not affiliated with the Advisor, plus specified amounts to the Board Chairperson and Vice Chairperson and to each committee Chairperson.
C. Line of Credit
The Portfolio and other affiliated funds (the "Participants") share in a $400 million revolving credit facility provided by a syndication of banks. The Portfolio may borrow for temporary or emergency purposes, including the meeting of redemption requests that otherwise might require the untimely disposition of securities. The Participants are charged an annual commitment fee which is allocated based on net assets, among each of the Participants. Interest is calculated at a rate per annum equal to the sum of the Federal Funds Rate plus 1.25 percent plus if LIBOR exceeds the Federal Funds Rate the amount of such excess. The Portfolio may borrow up to a maximum of 33 percent of its net assets under the agreement. The Portfolio had no outstanding loans at June 30, 2014.
D. Money Market Fund Reform
In July 2014, the SEC adopted money market fund reform to address potential systemic risks associated with money market funds and to improve transparency for money market fund investors. The Portfolio is required to comply with money market reform over the next two years. As a result, the Portfolio may be required to take certain steps that will impact its structure and/or operations, which could impact the return potential of the Portfolio.
Advisory Agreement Board Considerations and Fee Evaluation
Cash Reserves Fund Institutional (the "Fund"), a series of DWS Money Market Trust, invests all of its assets in Cash Management Portfolio (the "Portfolio") in order to achieve its investment objective. The Portfolio's Board of Trustees approved the renewal of the Portfolio's investment management agreement (the "Portfolio Agreement") with Deutsche Investment Management Americas Inc. ("DIMA") and the Fund's Board of Trustees (which consists of the same members as the Board of Trustees of the Portfolio) approved the renewal of the Fund's investment management agreement with DIMA (the "Fund Agreement," and together with the Portfolio Agreement, the "Agreements") in September 2013. The Portfolio's Board of Trustees and the Fund's Board of Trustees are collectively referred to as the "Board."
In terms of the process that the Board followed prior to approving the Agreements, shareholders should know that:
— In September 2013, all of the Portfolio's and Fund's Trustees were independent of DIMA and its affiliates.
— The Trustees met frequently during the past year to discuss fund matters and dedicated a substantial amount of time to contract review matters. Over the course of several months, the Board's Contract Committee, in coordination with the Board's Fixed Income and Asset Allocation Oversight Committee, reviewed comprehensive materials received from DIMA, independent third parties and independent counsel. These materials included an analysis of performance, fees and expenses, and profitability compiled by a fee consultant retained by the Portfolio's and the Fund's Independent Trustees (the "Fee Consultant"). The Board also received extensive information throughout the year regarding performance of the Portfolio and the Fund.
— The Independent Trustees regularly meet privately with their independent counsel to discuss contract review and other matters. In addition, the Independent Trustees were also advised by the Fee Consultant in the course of their review of the Portfolio's and the Fund's contractual arrangements and considered a comprehensive report prepared by the Fee Consultant in connection with their deliberations.
— In connection with reviewing the Agreements, the Board also reviewed the terms of the Fund's distribution agreement, administrative services agreement, transfer agency agreement and other material service agreements.
— Based on its evaluation of the information provided, the Contract Committee presented its findings and recommendations to the Board. The Board then reviewed the Contract Committee's findings and recommendations.
In connection with the contract review process, the Contract Committee and the Board considered the factors discussed below, among others. The Board also considered that DIMA and its predecessors have managed the Portfolio and the Fund since their inception, and the Board believes that a long-term relationship with a capable, conscientious advisor is in the best interests of the Portfolio and the Fund. The Board considered, generally, that shareholders chose to invest or remain invested in the Fund knowing that DIMA managed the Portfolio and the Fund, and that the Fund Agreement was approved by the Fund's shareholders. DIMA is part of Deutsche Bank AG, a major global banking institution that is engaged in a wide range of financial services. The Board believes that there are advantages to being part of a global asset management business that offers a wide range of investing expertise and resources, including hundreds of portfolio managers and analysts with research capabilities in many countries throughout the world.
As part of the contract review process, the Board carefully considered the fees and expenses of each DWS fund overseen by the Board in light of the fund's performance. In many cases, this led to a negotiation with DIMA of lower expense caps as part of the 2012 and 2013 contract review processes than had previously been in place. As part of these negotiations, the Board indicated that it would consider relaxing these new lower caps in future years following sustained improvements in performance, among other considerations.
In June 2012, Deutsche Bank AG ("DB"), DIMA's parent company, announced that DB would combine its Asset Management (of which DIMA was a part) and Wealth Management divisions. DB has advised the Independent Trustees that the U.S. asset management business is a critical and integral part of DB, and that it has, and will continue to, reinvest a significant portion of the substantial savings it expects to realize by combining its Asset Management and Wealth Management divisions into the new Asset and Wealth Management ("AWM") division, including ongoing enhancements to its investment capabilities. DB also has confirmed its commitment to maintaining strong legal and compliance groups within the AWM division.
While shareholders may focus primarily on fund performance and fees, the Board considers these and many other factors, including the quality and integrity of DIMA's personnel and such other issues as back-office operations, fund valuations, and compliance policies and procedures.
Nature, Quality and Extent of Services. The Board considered the terms of the Agreements, including the scope of advisory services provided under the Agreements. The Board noted that, under the Agreements, DIMA provides portfolio management services to the Portfolio and the Fund and that, pursuant to separate administrative services agreements, DIMA provides administrative services to the Portfolio and the Fund. The Board considered the experience and skills of senior management and investment personnel, the resources made available to such personnel, the ability of DIMA to attract and retain high-quality personnel, and the organizational depth and stability of DIMA. The Board reviewed the Portfolio's and the Fund's performance over short-term and long-term periods and compared those returns to various agreed-upon performance measures, including a peer universe compiled by the Fee Consultant using information supplied by iMoneyNet, an independent fund data service. The Board also noted that it has put into place a process of identifying "Focus Funds" (e.g., funds performing poorly relative to their benchmark or a peer universe compiled by an independent fund data service), and receives more frequent reporting and information from DIMA regarding such funds, along with DIMA's remedial plans to address underperformance. The Board believes this process is an effective manner of identifying and addressing underperforming funds. Based on the information provided, the Board noted that for the one- and three-year periods ended December 31, 2012, the Fund's gross performance (Institutional Class shares) was in the 3rd quartile of the applicable iMoneyNet universe (the 1st quartile being the best performers and the 4th quartile being the worst performers).
Fees and Expenses. The Board considered the Portfolio's and the Fund's investment management fee schedules and the Fund's operating expenses and total expense ratios, and comparative information provided by Lipper Inc. ("Lipper") and the Fee Consultant regarding investment management fee rates paid to other investment advisors by similar funds (1st quartile being the most favorable and 4th quartile being the least favorable). With respect to management fees paid to other investment advisors by similar funds, the Board noted that the contractual fee rates paid by the Portfolio and the Fund, which include 0.03% and 0.10% fees paid to DIMA under the respective administrative services agreements, were higher than the median (3rd quartile) of the applicable Lipper peer group (based on Lipper data provided as of December 31, 2012). The Board noted that, although shareholders of the Fund indirectly bear the Portfolio's management fee, the Fund does not charge an additional investment management fee. The Board noted that the Fund's total (net) operating expenses, which include Portfolio expenses allocated to the Fund, were lower than the median of the applicable Lipper expense universe for Institutional Class shares (2nd quartile) (based on Lipper data provided as of December 31, 2012). The Board considered the Portfolio's management fee rate as compared to fees charged by DIMA to comparable funds and considered differences between the Portfolio and the comparable funds. The Board also considered how the Fund's total (net) operating expenses compared to the total (net) operating expenses of a more customized peer group selected by Lipper (based on such factors as asset size). The Board noted the expense limitation agreed to by DIMA. The Board also noted the significant voluntary fee waivers implemented by DIMA to ensure the Fund maintained a positive yield.
The information considered by the Board as part of its review of management fees included information regarding fees charged by DIMA and its affiliates to similar institutional accounts and to similar funds offered primarily to European investors ("DWS Europe funds"), in each case as applicable. The Board observed that advisory fee rates for institutional accounts generally were lower than the management fees charged by similarly managed DWS U.S. mutual funds ("DWS Funds"), but also took note of the differences in services provided to DWS Funds as compared to institutional accounts. In the case of DWS Europe funds, the Board observed that fee rates for DWS Europe funds generally were higher than for similarly managed DWS Funds, but noted that differences in the types of services provided to DWS Funds relative to DWS Europe funds made it difficult to compare such fees.
On the basis of the information provided, the Board concluded that management fees were reasonable and appropriate in light of the nature, quality and extent of services provided by DIMA.
Profitability. The Board reviewed detailed information regarding revenues received by DIMA under the Agreements. The Board considered the estimated costs and pre-tax profits realized by DIMA from advising the DWS Funds, as well as estimates of the pre-tax profits attributable to managing the Fund in particular. The Board also received information regarding the estimated enterprise-wide profitability of DWS and its affiliates with respect to all fund services in totality and by fund. The Board and the Fee Consultant reviewed DIMA's methodology in allocating its costs to the management of the Fund. Based on the information provided, the Board concluded that the pre-tax profits realized by DIMA in connection with the management of the Fund were not unreasonable. The Board also reviewed information regarding the profitability of certain similar investment management firms. The Board noted that while information regarding the profitability of such firms is limited (and in some cases is not necessarily prepared on a comparable basis), DIMA and its affiliates' overall profitability with respect to the DWS fund complex (after taking into account distribution and other services provided to the funds by DIMA and its affiliates) was lower than the overall profitability levels of many comparable firms for which such data was available.
Economies of Scale. The Board considered whether there are economies of scale with respect to the management of the Portfolio and the Fund and whether the Portfolio and the Fund benefit from any economies of scale. The Board noted that the Portfolio's management fee schedule includes fee breakpoints. The Board concluded that the Portfolio's and the Fund's fee schedules represent an appropriate sharing between the Portfolio and the Fund, as the case may be, and DIMA of such economies of scale as may exist in the management of the Portfolio and the Fund at current asset levels.
Other Benefits to DIMA and Its Affiliates. The Board also considered the character and amount of other incidental benefits received by DIMA and its affiliates, including any fees received by DIMA for administrative services provided to the Portfolio and the Fund and any fees received by an affiliate of DIMA for distribution services. The Board also considered benefits to DIMA related to brokerage and soft-dollar allocations, including allocating brokerage to pay for research generated by parties other than the executing broker dealers, which pertain primarily to funds investing in equity securities, along with the incidental public relations benefits to DIMA related to DWS Funds advertising and cross-selling opportunities among DIMA products and services. The Board concluded that management fees were reasonable in light of these fallout benefits.
Compliance. The Board considered the significant attention and resources dedicated by DIMA to documenting and enhancing its compliance processes in recent years. The Board noted in particular (i) the experience and seniority of both DIMA's chief compliance officer and the Fund's chief compliance officer; (ii) the large number of DIMA compliance personnel; and (iii) the substantial commitment of resources by DIMA and its affiliates to compliance matters.
Based on all of the information considered and the conclusions reached, the Board unanimously determined that the continuation of the Agreements is in the best interests of the Portfolio and the Fund. In making this determination, the Board did not give particular weight to any single factor identified above. The Board considered these factors over the course of numerous meetings, certain of which were in executive session with only the Independent Trustees and their independent counsel present. It is possible that individual Trustees may have weighed these factors differently in reaching their individual decisions to approve the continuation of the Agreements.
Account Management Resources | |
| Automated Information Line | | Institutional Investor Services (800) 730-1313 Personalized account information, information on other Deutsche funds and services via touchtone telephone and the ability to exchange or redeem shares. |
| Web Site | | deutscheliquidity.com/US View your account transactions and balances, trade shares, monitor your asset allocation, subscribe to fund and account updates by e-mail, and change your address, 24 hours a day. Obtain prospectuses and applications, blank forms, interactive worksheets, news about the funds, retirement planning information, and more. |
| For More Information | | (800) 730-1313, option 1 To speak with a fund service representative. |
| Written Correspondence | | Deutsche Asset & Wealth Management PO Box 219210 Kansas City, MO 64121-9210 |
| Proxy Voting | | The fund's policies and procedures for voting proxies for portfolio securities and information about how the fund voted proxies related to its portfolio securities during the 12-month period ended June 30 are available on our Web site — deutschefunds.com (click on "proxy voting"at the bottom of the page) — or on the SEC's Web site — sec.gov. To obtain a written copy of the fund's policies and procedures without charge, upon request, call us toll free at 800) 728-3337. |
| Portfolio Holdings | | Following the fund's fiscal first and third quarter-end, a complete portfolio holdings listing is filed with the SEC on Form N-Q. In addition, each month, information about the fund and its portfolio holdings is filed with the SEC on Form N-MFP. The SEC delays the public availability of the information filed on Form N-MFP for 60 days after the end of the reporting period included in the filing. These forms will be available on the SEC's Web site at sec.gov, and they may also be reviewed and copied at the SEC's Public Reference Room in Washington, D.C. Information on the operation of the SEC's Public Reference Room may be obtained by calling (800) SEC-0330. The fund's portfolio holdings are also posted on deutschefunds.com from time to time. Please see the fund's current prospectus for more information. |
| Principal Underwriter | | If you have questions, comments or complaints, contact: DeAWM Distributors, Inc. 222 South Riverside Plaza Chicago, IL 60606-5808 (800) 621-1148 |
| Investment Management | | Deutsche Investment Management Americas Inc. ("DIMA" or the "Advisor"), which is part of Deutsche Asset & Wealth Management, is the investment advisor for the fund. DIMA and its predecessors have more than 80 years of experience managing mutual funds and DIMA provides a full range of investment advisory services to both institutional and retail clients. DIMA is an indirect, wholly owned subsidiary of Deutsche Bank AG. Deutsche Bank AG is a major global banking institution engaged in a wide variety of financial services, including investment management, retail, private and commercial banking, investment banking and insurance. Deutsche Asset & Wealth Management is the retail brand name in the U.S. for the wealth management and asset management activities of Deutsche Bank AG and DIMA. Deutsche Asset & Wealth Management is committed to delivering the investing expertise, insight and resources of this global investment platform to American investors. |
| Nasdaq Symbol | | BIRXX |
| CUSIP Number | | 23337T 128 |
| Fund Number | | 500 |
| FACTS | | What Does Deutsche Asset & Wealth Management Do With Your Personal Information? |
| Why? | | Financial companies choose how they share your personal information. Federal law gives consumers the right to limit some but not all sharing. Federal law also requires us to tell you how we collect, share and protect your personal information. Please read this notice carefully to understand what we do. |
| What? | | The types of personal information we collect and share can include: — Social Security number — Account balances — Purchase and transaction history — Bank account information — Contact information such as mailing address, e-mail address and telephone number |
| How? | | All financial companies need to share customers' personal information to run their everyday business. In the section below, we list the reasons financial companies can share their customers' personal information, the reasons Deutsche Asset & Wealth Management chooses to share and whether you can limit this sharing. |
| Reasons we can share your personal information | | Does Deutsche Asset & Wealth Management share? | Can you limit this sharing? |
For our everyday business purposes — such as to process your transactions, maintain your account(s), respond to court orders or legal investigations | | Yes | No |
For our marketing purposes — to offer our products and services to you | | Yes | No |
| For joint marketing with other financial companies | | No | We do not share |
For our affiliates' everyday business purposes — information about your transactions and experiences | | No | We do not share |
For our affiliates' everyday business purposes — information about your creditworthiness | | No | We do not share |
| For non-affiliates to market to you | | No | We do not share |
| Questions? | | Call (800) 728-3337 or e-mail us at service@db.com | |
| | | | | |
| Who we are |
| Who is providing this notice? | | DeAWM Distributors, Inc.; Deutsche Investment Management Americas Inc.; DeAWM Trust Company; the Deutsche Funds |
| What we do |
| How does Deutsche Asset & Wealth Management protect my personal information? | | To protect your personal information from unauthorized access and use, we use security measures that comply with federal law. These measures include computer safeguards and secured files and buildings. |
| How does Deutsche Asset & Wealth Management collect my personal information? | | We collect your personal information, for example. When you: — open an account — give us your contact information — provide bank account information for ACH or wire transactions — tell us where to send money — seek advice about your investments |
| Why can't I limit all sharing? | | Federal law gives you the right to limit only — sharing for affiliates' everyday business purposes — information about your creditworthiness — affiliates from using your information to market to you — sharing for non-affiliates to market to you State laws and individual companies may give you additional rights to limit sharing. |
| Definitions |
| Affiliates | | Companies related by common ownership or control. They can be financial or non-financial companies. Our affiliates include financial companies with the DWS or Deutsche Bank ("DB") name, such as DB AG Frankfurt and DB Alex Brown. |
| Non-affiliates | | Companies not related by common ownership or control. They can be financial and non-financial companies. Non-affiliates we share with include account service providers, service quality monitoring services, mailing service providers and verification services to help in the fight against money laundering and fraud. |
| Joint marketing | | A formal agreement between non-affiliated financial companies that together market financial products or services to you. Deutsche Asset & Wealth Management does not jointly market. |
| | | | Rev. 08/2014 |
Notes
Notes
Notes
Notes
Pursuant to the requirements of the Securities Exchange Act of 1934 and the Investment Company Act of 1940, the registrant has duly caused this report to be signed on its behalf by the undersigned, thereunto duly authorized.
Pursuant to the requirements of the Securities Exchange Act of 1934 and the Investment Company Act of 1940, this report has been signed below by the following persons on behalf of the registrant and in the capacities and on the dates indicated.