Exhibit (c)(4) to
Schedule 13E-3

| Board of Directors Presentation December 10, 2002 Steven Kent, Managing Director Daniel Floyd, Vice President Jeffrey Brand, Associate Lindsay Yedinak, Analyst PROJECT TRUST |

| Table of Contents This document contains confidential information which has been prepared by Keefe, Bruyette & Woods, Inc. solely for purposes of this presentation. This presentation and the information contained herein should not be copied, summarized or disseminated in any form to any other party without the prior written approval of Keefe, Bruyette & Woods, Inc. The improper dissemination of this presentation and related information may result in violations of Federal Securities Laws. Process & Transaction Overview INTRUST Financial Overview & Benchmarking Valuation Methodologies Valuation Analysis - Market Approach: Comparable Merger & Acquisition Analysis Comparable Public Company Analysis Comparable Share Redemption Analysis Valuation Analysis - Income Approach: Discounted Cash Flow Analysis Valuation Summary & Conclusions Financial Impact of Transaction to Remaining Shareholders Appendix Peer Group Detail Comparable Acquisitions Detail National vs. Great Plains Benchmarking Detail Scatter Graph for Market Approach Analyses Section 1 2 3 4 5 6 7 A B C D |
| Process and Transaction Overview |

| KBW's Role & Process Overview In conjunction with a proposed cash-out merger (the "Transaction") Keefe, Bruyette & Woods, Inc. ("KBW") has been retained by the Pricing Committee of the Board of Directors ("The Pricing Committee") of INTRUST Financial Corporation ("INTRUST") to assist the Pricing Committee and the Board of Directors in making an informed decision on two parameters of the Transaction: the price to be offered in the Transaction and the size of the Transaction dictated by the minimum number of shares a stockholder must own to be excluded from being cashed-out via the Transaction. KBW will determine a valuation range and analyze a minimum share ownership range for the Transaction and render an opinion (the "Opinion") to the INTRUST board of directors, based on all relevant and available information, whether the consideration to be paid in the Transaction is fair, from a financial point of view, to shareholders of INTRUST, including both those holders who will receive cash in the Transaction and those who will remain shareholders after the Transaction. KBW conducted due diligence with senior management which included, but was not limited to, a review of the following matters with respect to INTRUST: History Strategy and future goals and business opportunities Operations Financial performance history and future prospects Trading characteristics of INTRUST stock KBW reviewed historical and projected operating performance of INTRUST and completed various financial analyses related to the Transaction (see Valuation Methodologies section). |

| Key Assumptions Underlying KBW's Analysis Based on discussions with INTRUST's management and with management's consent, KBW made the following assumptions: All material assets and liabilities (contingent or otherwise, known or unknown) of INTRUST are as set forth in its financial statements with no material changes since the date of the last of such statements provided to KBW. The financial forecasts examined by or discussed with KBW were reasonably prepared and reflect the best available estimates and good faith judgments of senior management of INTRUST as to the future financial performance of INTRUST under various reasonable scenarios. KBW did not make nor obtain an independent appraisal of assets or liabilities of INTRUST. KBW did not directly examine the loan portfolio of INTRUST or of any of its subsidiaries. Direct examination would have been beyond the scope of this valuation assignment. KBW discussed the general condition of the loan portfolio and several larger credits with management, focusing on such aspects as delinquencies, nonaccrual loans, geographic concentrations, industry concentrations, credit to related parties, known problem loans and potential losses in the portfolio. Management represented that the allowance for loan and lease losses was adequate as of the most recent financial period. |

| Key Assumptions Underlying KBW's Analysis (continued) KBW relied on advice of counsel and independent accountants to INTRUST as to legal and financial matters concerning INTRUST and the Transaction, and assumed that the Transaction will be conducted in a manner that complies in all respects with applicable statutes, laws, rules and regulations. With respect to the financial impact to shareholders who will have an ongoing equity interest in INTRUST after completion of the Transaction, KBW considered only the Transaction's impact on the income statement items, balance sheet items, financial ratios and capital ratios discussed in this presentation, and did not attempt to ascribe any particular value to any other factors, including the impact of the termination of INTRUST's SEC reporting requirements. KBW relied on the accuracy and completeness of all information provided by the management of INTRUST, or obtained through publicly available sources. The Transaction will be consummated in accordance with the terms of the merger agreement without any amendment thereto. |

| PRICING COMMITTEE To provide non-binding advice and recommendations to the INTRUST Board of Directors with respect to certain issues arising in connection with the Transaction, including, among other things, the price at which the shares of common stock shall be redeemed pursuant to the Transaction. INTRUST: To achieve private company status via a "going private" transaction Resulting in: A reduction in the number of common shareholders of record to some level fewer than 300. Deregistration of INTRUST common stock under federal securities laws and resulting suspension of filing requirements. Likely cessation of NASDAQ OTCBB quotation of INTRUST's common stock. Redemption via optional call of the outstanding $57.5 million of trust preferred securities issued by INTRUST Capital Trust. Leading to: An enhancement of INTRUST's operational flexibility by permitting it to focus on long-term business strategies that are designed to fulfill the needs of its stakeholders (shareholders, customers, employees and communities). Objectives and Background of Proposed Transaction |
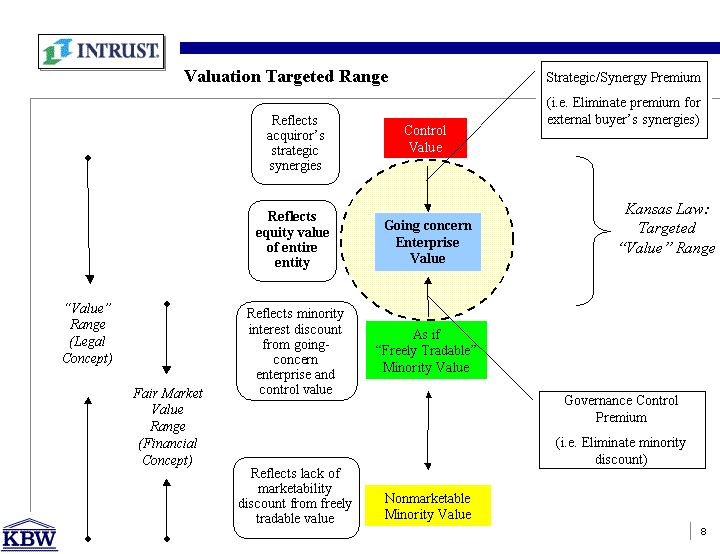
| Control Value As if "Freely Tradable" Minority Value Nonmarketable Minority Value Going concern Enterprise Value "Value" Range (Legal Concept) Fair Market Value Range (Financial Concept) Reflects minority interest discount from going- concern enterprise and control value Reflects equity value of entire entity Reflects acquiror's strategic synergies Reflects lack of marketability discount from freely tradable value Kansas Law: Targeted "Value" Range Valuation Targeted Range Strategic/Synergy Premium (i.e. Eliminate premium for external buyer's synergies) Governance Control Premium (i.e. Eliminate minority discount) |

| Comparable Share Redemptions (1) Great Plains implied values are given 75% weighting versus 25% weight for National implied values. Please refer to appendix for detail on National and Great Plains comparable acquisitions & peer groups. Comparable Acquisitions Discounted Cash Flow Comparable Public Company Analysis Going Concern Enterprise Value Implied INTRUST Per Share Value Ranges Range Weighting(1) 25% 50% $145 - $155 Summary of Methodologies and Derived Valuation Range 75% 25% 75% Range: $137 - $170 Range: $129 - $165 Range: $142 - $168 Range: $134 - $173 Wtd Value: $145 Wtd Value: $147 Wtd Value: $155 Wtd Value: $144 50% 50% 50% |

| "LTM" = Last 12 Months; "LQA" = Latest Quarter Annualized. Valuation Sensitivity Summary |

| Transaction Size & Scope Summary Transaction sensitivity analysis of targeted shareholding size Distribution of remaining "unknown" street name holders assumed to match "known" street name holder distribution. Assumes number of shareholders held under street name limited to the number of brokerage firms holding the stock (33 firms). Transaction value sensitivity analysis Non-Street Name Holders 399 399 Holders Under Street Name 216 33 (2) Total Beneficial Holders 615 432 |

| INTRUST Financial Overview & Benchmarking |
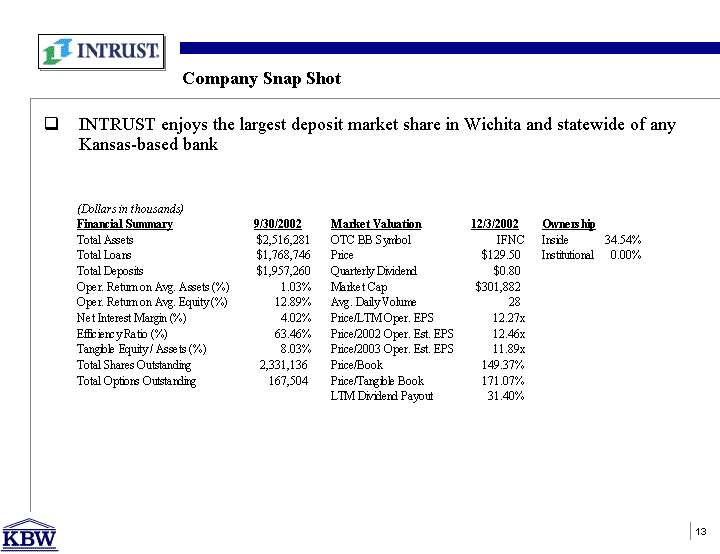
| Company Snap Shot INTRUST enjoys the largest deposit market share in Wichita and statewide of any Kansas-based bank Kansas-based bank Kansas-based bank |

| Source: Bloomberg. Price/Volume Graph Date Volume (000) INTRUST 5/16/94 2.5 50 5/17/94 2.5 50 5/18/94 2.5 50 5/19/94 2.5 50 5/20/94 2.5 50 5/23/94 2.5 50 5/24/94 2.5 50 5/25/94 2.5 50 5/26/94 2.5 50 5/27/94 2.5 50 5/30/94 2.5 50 5/31/94 2.5 50 6/1/94 2.5 50 6/2/94 2.5 50 6/3/94 2.5 50 6/6/94 2.5 50 6/7/94 2.5 50 6/8/94 2.5 50 6/9/94 2.5 50 6/10/94 2.5 50 6/13/94 2.5 50 6/14/94 2.5 50 6/15/94 2.5 50 6/16/94 2.5 50 6/17/94 2.5 50 6/20/94 2.5 50 6/21/94 2.5 50 6/22/94 2.5 50 6/23/94 2.5 50 6/24/94 2.5 50 6/27/94 2.5 50 6/28/94 2.5 50 6/29/94 2.5 50 6/30/94 2.5 50 7/1/94 2.5 50 7/4/94 2.5 50 7/5/94 2.5 50 7/6/94 2.5 50 7/7/94 2.5 50 7/8/94 2.5 50 7/11/94 2.5 50 7/12/94 2.5 50 7/13/94 2.5 50 7/14/94 2.5 50 7/15/94 2.5 50 7/18/94 2.5 50 7/19/94 2.5 50 7/20/94 2.5 50 7/21/94 2.5 50 7/22/94 2.5 50 7/25/94 2.5 50 7/26/94 2.5 50 7/27/94 2.5 50 7/28/94 2.5 50 7/29/94 2.5 50 8/1/94 2.5 50 8/2/94 2.5 50 8/3/94 2.5 50 8/4/94 2.5 50 8/5/94 2.5 50 8/8/94 2.5 50 8/9/94 0.7 52.5 8/10/94 0.7 53.75 8/11/94 0.7 53.75 8/12/94 0.7 53.75 8/15/94 0.7 53.75 8/16/94 0.7 53.75 8/17/94 0.7 53.75 8/18/94 0.7 53.75 8/19/94 0.7 53.75 8/22/94 0.7 53.75 8/23/94 0.7 53.75 8/24/94 0.7 53.75 8/25/94 0.7 53.75 8/26/94 0.7 53.75 8/29/94 0.7 53.75 8/30/94 0.7 53.75 8/31/94 0.7 53.75 9/1/94 0.7 53.75 9/2/94 0.7 53.75 9/5/94 0.7 53.75 9/6/94 0.7 53.75 9/7/94 0.7 53.75 9/8/94 0.7 53.75 9/9/94 0.7 53.75 9/12/94 0.7 53.75 9/13/94 0.7 53.75 9/14/94 0.7 53.75 9/15/94 0.7 53.75 9/16/94 0.7 53.75 9/19/94 0.7 53.75 9/20/94 0.7 53.75 9/21/94 0.7 53.75 9/22/94 0.7 53.75 9/23/94 0.7 53.75 9/26/94 0.7 53.75 9/27/94 0.7 53.75 9/28/94 0.7 53.75 9/29/94 0.7 53.75 |

| Historical Trading Multiples--Price to LTM EPS Source: Bloomberg LP. Data as of 12/3/02. |

| Historical Trading Multiples--Price to Book Source: Bloomberg LP. Data as of 12/3/02. |
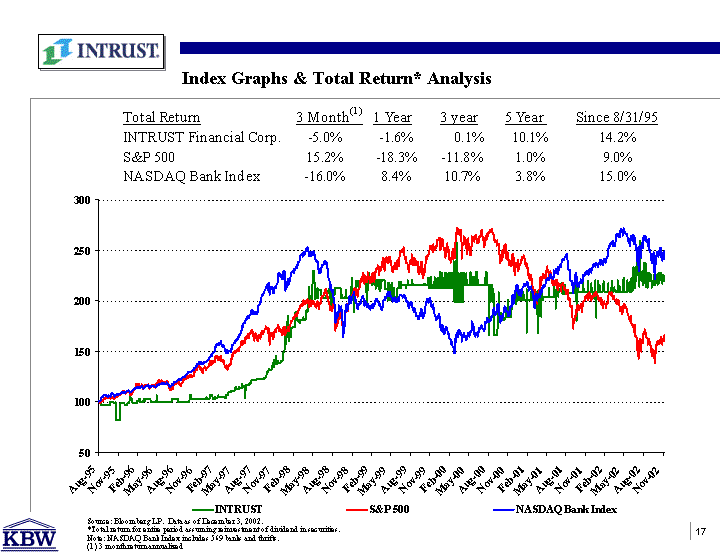
| Source: Bloomberg LP. Data as of December 3, 2002. *Total return for entire period assuming reinvestment of dividend in securities. Note: NASDAQ Bank Index includes 569 banks and thrifts. (1) 3 month return annualized Index Graphs & Total Return* Analysis INTRUST S&P 500 NASDAQ Bank Index 8/16/95 100 100 100 8/17/95 100 99.83 100.67 8/18/95 100 99.86 101.14 8/21/95 100 99.67 101.31 8/22/95 100 99.92 100.8 8/23/95 100 99.49 101.08 8/24/95 100 99.55 101.1 8/25/95 96.72 100.02 101.59 8/28/95 96.72 99.84 102.81 8/29/95 96.72 100.01 103.23 8/30/95 96.72 100.17 104.43 8/31/95 96.72 100.34 104.98 9/1/95 96.72 100.69 104.72 9/4/95 96.72 100.69 104.72 9/5/95 96.72 101.64 105.33 9/6/95 96.72 101.82 105.68 9/7/95 96.72 101.84 105.63 9/8/95 96.72 102.27 105.96 9/11/95 96.72 102.49 106.53 9/12/95 96.72 102.95 106.36 9/13/95 96.72 103.36 106.93 9/14/95 96.72 104.22 107.36 9/15/95 96.72 104.18 106.94 9/18/95 96.72 104.07 106.18 9/19/95 96.72 104.33 105.95 9/20/95 96.72 104.79 106.42 9/21/95 96.72 104.11 106.53 9/22/95 96.72 103.89 105.83 9/25/95 96.72 103.9 105.82 9/26/95 96.72 103.83 105.81 9/27/95 96.72 103.76 105.49 9/28/95 96.72 104.63 105.56 9/29/95 96.72 104.36 106.73 10/2/95 96.72 103.88 106 10/3/95 96.72 103.99 105.9 10/4/95 96.72 103.84 105.65 10/5/95 96.72 104.05 105.79 10/6/95 96.72 104.02 106.26 10/9/95 96.72 103.29 105.76 10/10/95 100 103.13 105.42 10/11/95 100 103.48 105.83 10/12/95 100 104.13 106.36 10/13/95 100 104.38 107.35 10/16/95 100 104.12 107.8 10/17/95 100 104.79 107.72 10/18/95 100 104.91 109.18 10/19/95 100 105.48 108.73 10/20/95 100 104.91 108.81 10/23/95 100 104.48 107.97 10/24/95 100 104.74 108.28 10/25/95 100 104.02 107.49 10/26/95 98.36 102.99 106.08 10/27/95 98.36 103.52 106.03 10/30/95 98.36 104.16 105.97 10/31/95 98.36 103.84 105.62 11/1/95 98.36 104.33 105.7 11/2/95 98.36 105.31 106.29 11/3/95 100 105.46 107.14 11/6/95 81.97 105.09 107.19 11/7/95 81.97 104.71 106.97 11/8/95 81.97 105.67 107.34 11/9/95 81.97 105.94 107.3 11/10/95 81.97 105.85 107.74 11/13/95 81.97 105.77 107.42 11/14/95 81.97 105.24 107 11/15/95 81.97 106.07 107.03 11/16/95 81.97 106.67 107.74 11/17/95 81.97 107.16 107.76 11/20/95 81.97 106.59 107.81 11/21/95 81.97 107.19 107.9 11/22/95 81.97 106.86 108.23 11/23/95 81.97 106.86 108.23 11/24/95 81.97 107.14 108.22 11/27/95 98.36 107.38 108.38 11/28/95 98.36 108.3 108.68 11/29/95 98.36 108.51 108.79 11/30/95 98.36 108.11 109.47 12/1/95 98.36 108.4 109.45 12/4/95 98.36 109.59 109.89 12/5/95 98.36 110.31 110.14 12/6/95 98.36 110.75 110 12/7/95 98.36 110.04 109.63 12/8/95 98.36 110.27 109.63 12/11/95 98.36 110.63 109.63 12/12/95 98.36 110.5 109.51 12/13/95 98.36 111.02 110.1 12/14/95 98.36 110.17 109.78 12/15/95 98.36 110.07 109.97 12/18/95 96.72 108.36 108.93 12/19/95 96.72 109.28 108.9 12/20/95 96.72 108.21 109.59 12/21/95 96.72 109.02 109.93 12/22/95 96.72 109.28 110.19 12/25/95 96.72 109.28 110.19 12/26/95 96.72 109.7 110.53 12/27/95 96.72 109.74 110.79 12/28/95 96.72 109.67 110.96 12/29/95 98.36 109.99 111.22 1/1/96 98.36 109.99 111.22 MSGraph.Chart.8 |

| Sources: INTRUST Management. Historical INTRUST Repurchases Historical INTRUST Repurchases |

| Performance Comparison Therefore, dampening ROAE compared to peers. Source: SNL Financial. Data as of 9/30/02. Please refer to appendix for peer group composition. INTRUST and its Great Plains peers have achieved approximately 1% ROAA historically while National peers have achieved approximately 1.15% ROAA. |
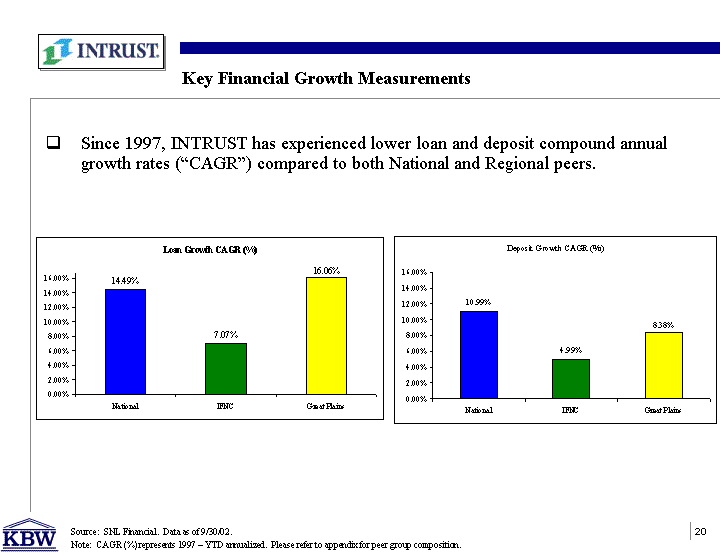
| Key Financial Growth Measurements Source: SNL Financial. Data as of 9/30/02. Note: CAGR (%) represents 1997 - YTD annualized. Please refer to appendix for peer group composition. Since 1997, INTRUST has experienced lower loan and deposit compound annual growth rates ("CAGR") compared to both National and Regional peers. growth rates ("CAGR") compared to both National and Regional peers. growth rates ("CAGR") compared to both National and Regional peers. |
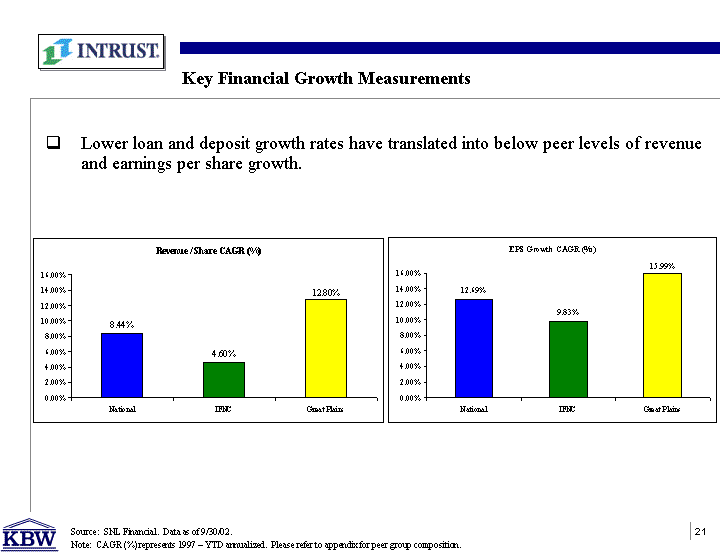
| Key Financial Growth Measurements Lower loan and deposit growth rates have translated into below peer levels of revenue and earnings per share growth. Source: SNL Financial. Data as of 9/30/02. Note: CAGR (%) represents 1997 - YTD annualized. Please refer to appendix for peer group composition. |

| Valuation Methodologies |

| Valuation Concept: Enterprise Value - construed to represent the shared ownership by all shareholders of the value of the entire company. Valuation Premise: Going Concern Value - shares of INTRUST have been valued by KBW on the basis of a going concern without giving effect to the following: Any anticipated effects or elements of value arising from the expectation or accomplishment of the Transaction. The level of consideration that could be received in the sale of 100% of the stock of INTRUST because the Transaction will not result in a change in control of INTRUST. Valuation Process and Methodologies--Overview |

| Valuation Methodologies: In the determination of going concern enterprise value, KBW examined the application of the three general approaches for valuing an interest in a business as recognized by appraisal and valuation experts, including: The Cost Approach or Asset Value Method The Market Approach or Comparable Company Method The Income Approach or Earnings (Investment) Method Valuation Process and Methodologies--Overview Cost Approach: KBW did not apply this approach to the valuation of INTRUST shares as a consequence of the following: Estimation of the market value of a financial institution's assets and liabilities, particularly loan and deposit portfolios is difficult to accomplish with an acceptable degree of accuracy. Recognition that few (if any) investors in financial institutions appear to value such concerns by reference to the individual values of assets and liabilities. |
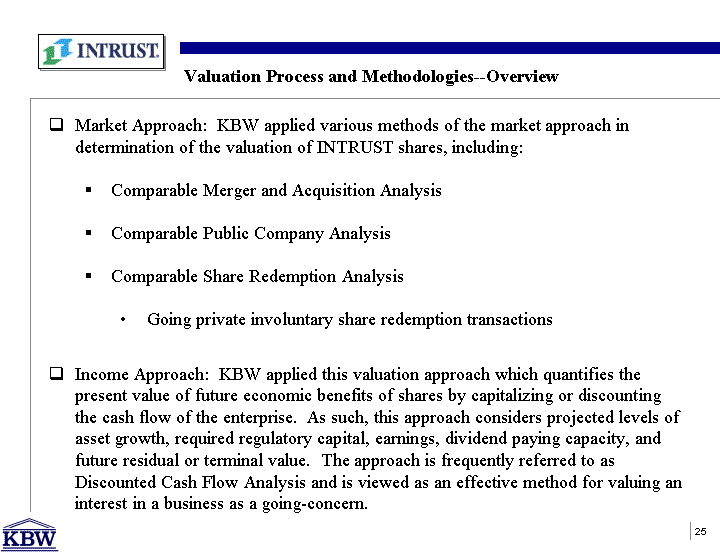
| Valuation Process and Methodologies--Overview Market Approach: KBW applied various methods of the market approach in determination of the valuation of INTRUST shares, including: Comparable Merger and Acquisition Analysis Comparable Public Company Analysis Comparable Share Redemption Analysis Going private involuntary share redemption transactions Income Approach: KBW applied this valuation approach which quantifies the present value of future economic benefits of shares by capitalizing or discounting the cash flow of the enterprise. As such, this approach considers projected levels of asset growth, required regulatory capital, earnings, dividend paying capacity, and future residual or terminal value. The approach is frequently referred to as Discounted Cash Flow Analysis and is viewed as an effective method for valuing an interest in a business as a going-concern. |

| Valuation Analysis-Market Approach Comparable Mergers & Acquisitions |

| Comparable Merger & Acquisition Transaction Analysis KBW identified two comparable groups of whole-bank sale transactions with deal values ranging from $150 million to $5 billion since the beginning of 1995 that KBW deemed relevant. The first group consists of 138 transactions of whole-banking institutions headquartered nationwide and the second group consisted of 11 transactions of banking companies headquartered in the Great Plains states. (See Appendix for detail) For each group, KBW applied the maximum, minimum and median transaction multiples (price to: book value, tangible book value, trailing earnings per share, estimated earnings per share, as well as the premium over core deposits and the one month average market price) to the related financial statistics for INTRUST to derive a range of implied values. KBW then took the median implied values and averaged them to derive a single implied value for each comparable acquisition group. KBW then adjusted the resulting two values to extract the component of the merger premium that was determined to result from the synergistic financial effect ("Synergy Cost-Savings Adjustment") of the comparable whole-bank sale transactions. |

| National Comparable Acquisitions Note: Most recent available financial data used for comparables. Sources: SNL Financial, company SEC filings. Green boxes indicate median per share valuation ranges. See appendix for detail. See appendix for detail. See appendix for detail. |

| Great Plains Comparable Acquisitions Note: Most recent available financial data used for comparables. Sources: SNL Financial, company SEC filings. Green boxes indicate median per share valuation ranges. Acquisitions in KS, IA, OK, MO, ND, SD & NE since 1/1/1995. See appendix for detail. Acquisitions in KS, IA, OK, MO, ND, SD & NE since 1/1/1995. See appendix for detail. Acquisitions in KS, IA, OK, MO, ND, SD & NE since 1/1/1995. See appendix for detail. |
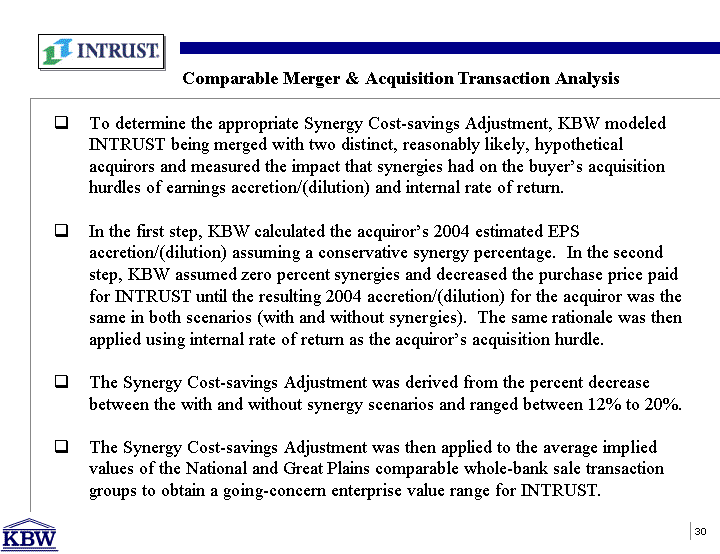
| Comparable Merger & Acquisition Transaction Analysis To determine the appropriate Synergy Cost-savings Adjustment, KBW modeled INTRUST being merged with two distinct, reasonably likely, hypothetical acquirors and measured the impact that synergies had on the buyer's acquisition hurdles of earnings accretion/(dilution) and internal rate of return. In the first step, KBW calculated the acquiror's 2004 estimated EPS accretion/(dilution) assuming a conservative synergy percentage. In the second step, KBW assumed zero percent synergies and decreased the purchase price paid for INTRUST until the resulting 2004 accretion/(dilution) for the acquiror was the same in both scenarios (with and without synergies). The same rationale was then applied using internal rate of return as the acquiror's acquisition hurdle. The Synergy Cost-savings Adjustment was derived from the percent decrease between the with and without synergy scenarios and ranged between 12% to 20%. The Synergy Cost-savings Adjustment was then applied to the average implied values of the National and Great Plains comparable whole-bank sale transaction groups to obtain a going-concern enterprise value range for INTRUST. |

| Comparable Acquisitions Summary Control Value $162 - $178 Midpoint $170 Enterprise Valuation Range Without Synergies Going concern Enterprise Value As if "Freely Tradable" Minority Value |

| Comparable Share Redemptions (1) Great Plains implied values are given 75% weighting versus 25% weight for National implied values. Please refer to appendix for detail on National and Great Plains comparable acquisitions & peer groups. Comparable Acquisitions Discounted Cash Flow Comparable Public Company Analysis Going Concern Enterprise Value Implied INTRUST Per Share Value Ranges Range Weighting(1) 25% Summary of Methodologies and Derived Valuation Range 75% Range: $137 - $170 Wtd Value: $145 |
| Valuation Analysis-Market Approach Comparable Public Company Analysis |
| Comparable Public Company Market Analysis KBW compared financial and operating information of INTRUST to a National peer group ("National peers") and Regional peer group ("Great Plains peers") consisting of banks with assets between $1 to $6 billion that KBW deemed relevant. The National peers consisted of 143 banks headquartered nationwide and the Great Plains peers consisted of 10 banks headquartered in KS, IA, MO, NE, ND, SD, OK. |
| Comparable Public Company Analysis KBW found that the Great Plains peer group had consistently traded at market values below the National peer group. KBW arrived at a range of going-concern enterprise values by applying the median trading multiples of the National and Great Plains Peer Groups (i.e. price to: historical earnings, projected operating earnings, book value and tangible book value) to INTRUST's corresponding financial data. That resulted in a freely tradable market value range for INTRUST which KBW increased to reflect a range of median merger market premiums (17% - 32%) received by an array of companies deemed by KBW to be comparable to INTRUST. The market premiums were calculated from whole banking institution sale transactions for the period 1995 to present. KBW then adjusted the resulting range of implied values by the Synergy Cost- Savings Adjustment (see Comparable Mergers & Acquisition Methodology) to extract the component of the merger premium that was determined to result from the synergistic financial effect (cost savings) of the comparable control sale transactions. |
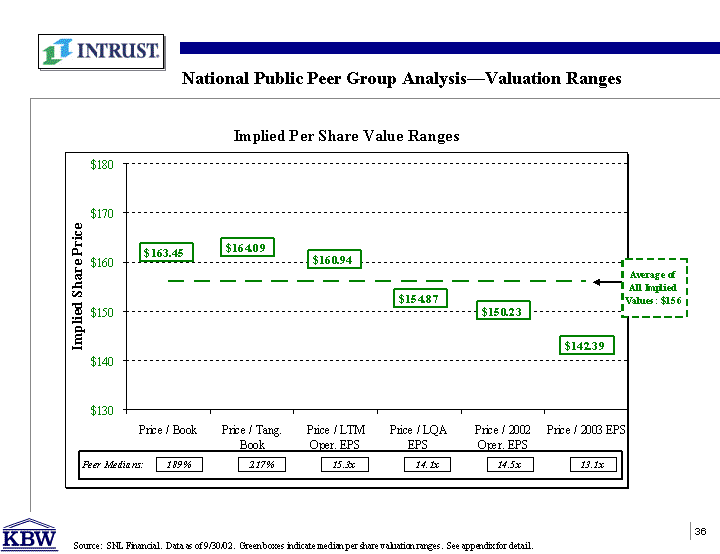
| National Public Peer Group Analysis-Valuation Ranges Source: SNL Financial. Data as of 9/30/02. Green boxes indicate median per share valuation ranges. See appendix for detail. |

| Great Plains Public Peer Group Analysis-Valuation Ranges Source: SNL Financial. Data as of 9/30/02. Green boxes indicate median per share valuation ranges. See appendix for detail. |

| Comparable Public Company Analysis Summary Great Plains $159 National $206 Whole Institution Sale Valuation with Synergies Whole Institution Sale Premium 17% 32% Great Plains $136 National $156 As if "Freely Tradable" Minority Value Control Value As if "Freely Tradable" Minority Value Going concern Enterprise Value |

| Comparable Public Company Analysis Summary Great Plains $159 National $206 Whole Institution Sale Valuation with Synergies $165 - $181 Midpoint $173 Enterprise Valuation Range Without Synergies Synergy Cost- Savings Adjustment 20% to 12% 20% to 12% Control Value As if "Freely Tradable" Minority Value Going concern Enterprise Value |
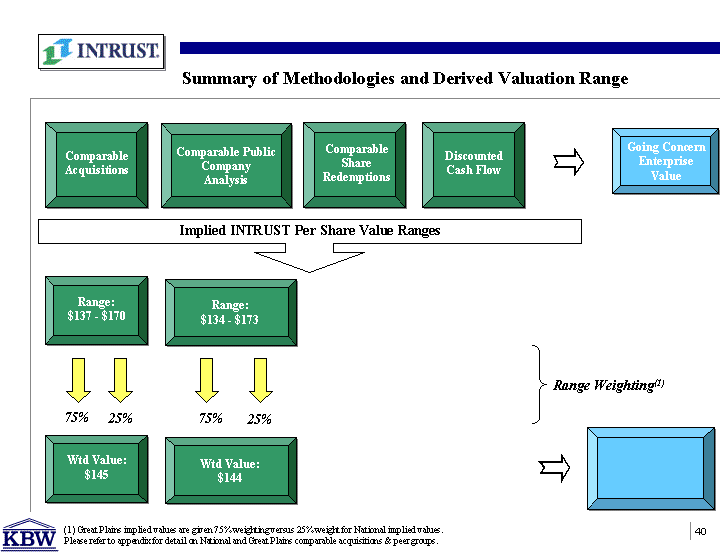
| Comparable Share Redemptions (1) Great Plains implied values are given 75% weighting versus 25% weight for National implied values. Please refer to appendix for detail on National and Great Plains comparable acquisitions & peer groups. Comparable Acquisitions Discounted Cash Flow Comparable Public Company Analysis Going Concern Enterprise Value Implied INTRUST Per Share Value Ranges Range Weighting(1) 25% Summary of Methodologies and Derived Valuation Range 75% 25% 75% Range: $137 - $170 Range: $134 - $173 Wtd Value: $145 Wtd Value: $144 |

| Valuation Analysis-Market Approach Comparable Share Redemption Analysis |

| Comparable Share Redemption Analysis KBW analyzed recent involuntary going private share redemption transactions and measured the transaction price in relation to: the premium over the 30 day average stock price, trailing earnings, book value and tangible book value. The medians were then used to imply values for INTRUST based on its corresponding financials. Averaging the median valuation multiples of the four financial metrics resulting in a range of $129 to $165 per share for INTRUST. Transaction sensitivity analysis indicates that pro forma EPS accretion and book value per share dilution is within the range of the comparable involuntary share redemption transactions. |

| Comparable Involuntary Share Redemption Transactions Source: Respective SC 13E3 filings and Proxy materials, SNL Financial and Bloomberg LP. (1) Premium based on market price one month prior to announcement. KBW researched, selected and analyzed the following recently announced involuntary going private share redemption transactions, involving banking institutions: |

| Comparable Involuntary Share Redemption Transactions Note: Most recent available financial data used for comparables. Sources: SNL Securities, company SEC filings. Green boxes indicate median per share valuation ranges. |

| Comparable Share Redemptions (1) Great Plains implied values are given 75% weighting versus 25% weight for National implied values. Please refer to appendix for detail on National and Great Plains comparable acquisitions & peer groups. Comparable Acquisitions Discounted Cash Flow Comparable Public Company Analysis Going Concern Enterprise Value Implied INTRUST Per Share Value Ranges Range Weighting(1) 25% 50% Summary of Methodologies and Derived Valuation Range 75% 25% 75% Range: $137 - $170 Range: $129 - $165 Range: $134 - $173 Wtd Value: $145 Wtd Value: $144 50% Wtd Value: $147 |

| Valuation Analysis-Income Approach Discounted Cash Flow Analysis |

| Discounted Cash Flow Analysis Income valuation method which quantifies projected future cash flows to common equity holders and discounts those cash flows, at a range of selected discount rates, to derive range of present value which represents the theoretical going concern enterprise value of INTRUST. INTRUST management and KBW compiled a financial forecast model for INTRUST through 2007. Using this projection, KBW assumed INTRUST maintained a peer comparable leverage ratio of 8% going forward and all other free cash flows were distributable to common equity holders. KBW capitalized this cash flow stream in 2007 assuming a terminal multiple range from 14x to 18x representing the range of control acquisition trailing earnings per share multiples adjusted by the Synergy Cost-Savings Adjustment referenced in the comparable merger and acquisition transaction analysis. |

| INTRUST Projected Financial Performance Source: Management estimates. |
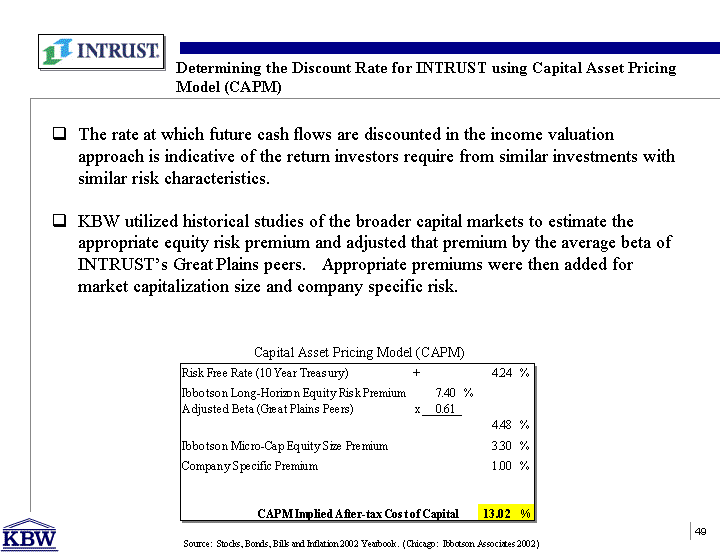
| Determining the Discount Rate for INTRUST using Capital Asset Pricing Model (CAPM) Source: Stocks, Bonds, Bills and Inflation 2002 Yearbook. (Chicago: Ibbotson Associates 2002) The rate at which future cash flows are discounted in the income valuation approach is indicative of the return investors require from similar investments with similar risk characteristics. KBW utilized historical studies of the broader capital markets to estimate the appropriate equity risk premium and adjusted that premium by the average beta of INTRUST's Great Plains peers. Appropriate premiums were then added for market capitalization size and company specific risk. Capital Asset Pricing Model (CAPM) |

| Valuation Analysis: Income Approach-Discounted Cash Flows DCF analysis assuming the focus discount rate of 13% and a median market multiple of 12.5x results in a $132 per share NPV. Numbers in 000s. Note: 13% discount rate applied to analysis based on capital asset pricing model . |

| Valuation Analysis: Income Approach-Discounted Cash Flows Total Transaction Value Per Share Value |

| Comparable Share Redemptions (1) Great Plains implied values are given 75% weighting versus 25% weight for National implied values. Please refer to appendix for detail on National and Great Plains comparable acquisitions & peer groups. Comparable Acquisitions Discounted Cash Flow Comparable Public Company Analysis Going Concern Enterprise Value Implied INTRUST Per Share Value Ranges Range Weighting(1) 25% 50% Summary of Methodologies and Derived Valuation Range 75% 25% 75% Range: $137 - $170 Range: $129 - $165 Range: $142 - $168 Range: $134 - $173 Wtd Value: $145 Wtd Value: $147 Wtd Value: $144 50% 50% 50% Wtd Value: $155 |

| Valuation Summary & Conclusions |

| KBW has derived a valuation range to assist the pricing committee in advising the Board of Directors on the financial and structural terms of the Transaction. KBW employed both market and income approaches and four established valuation methods that resulted in separate going concern enterprise value ranges. Based on its experience and expertise in valuing banking institutions, KBW weighted these methods and ranges considering, among other factors, certain characteristics of INTRUST including: The historical, current and projected economic characteristics of INTRUST's markets. The current and historical financial performance and valuation characteristics of INTRUST and its local and regional competitors. Managements financial projections as well as the pro forma financial impact of the Transaction on INTRUST. Valuation Summary & Conclusion |

| Comparable Share Redemptions (1) Great Plains implied values are given 75% weighting versus 25% weight for National implied values. Please refer to appendix for detail on National and Great Plains comparable acquisitions & peer groups. Comparable Acquisitions Discounted Cash Flow Comparable Public Company Analysis Going concern Enterprise Value Implied INTRUST Per Share Value Ranges Range Weighting(1) 25% 50% $145 - $155 Summary of Methodologies and Derived Valuation Range 75% 25% 75% Range: $137 - $170 Range: $129 - $165 Range: $142 - $168 Range: $134 - $173 Wtd Value: $145 Wtd Value: $147 Wtd Value: $155 Wtd Value: $144 50% 50% 50% |

| Financial Impact of Transaction to Remaining Shareholders |
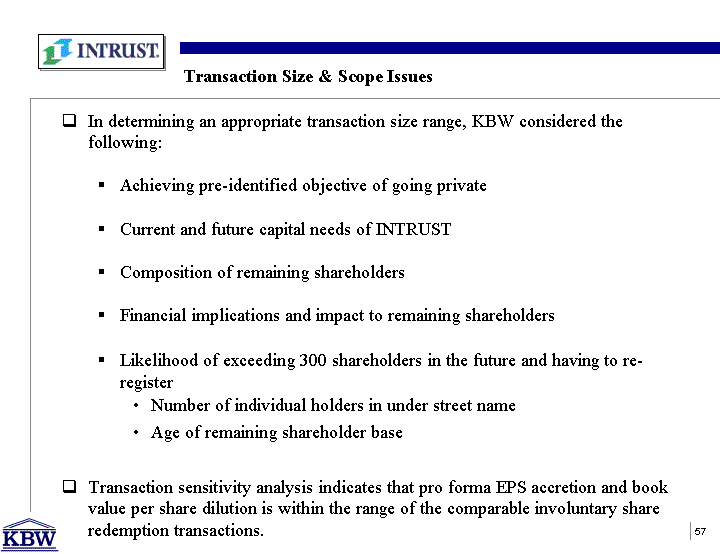
| In determining an appropriate transaction size range, KBW considered the following: Achieving pre-identified objective of going private Current and future capital needs of INTRUST Composition of remaining shareholders Financial implications and impact to remaining shareholders Likelihood of exceeding 300 shareholders in the future and having to re- register Number of individual holders in under street name Age of remaining shareholder base Transaction sensitivity analysis indicates that pro forma EPS accretion and book value per share dilution is within the range of the comparable involuntary share redemption transactions. Transaction Size & Scope Issues |

| Transaction Size & Scope Summary Transaction sensitivity analysis of targeted shareholding size Distribution of remaining "unknown" street name holders assumed to match "known" street name holder distribution. Assumes number of shareholders held under street name limited to the number of brokerage firms holding the stock (33 firms). Transaction value sensitivity analysis Non-Street Name Holders 399 399 Holders Under Street Name 216 33 (2) Total Beneficial Holders 615 432 |

| Transaction Size & Scope-Capital & Financial Assumptions Retirement of existing $57.5 million of trust preferred with a coupon of 8.24% $2.1 million non-cash charge for early retirement of trust preferred Replaced with $75.0 million of new trust preferred with an assumed average rate of 6.50% (scenario 1) or 7.50% (scenario 2) Additional liquidity for the Transaction from cash currently at parent company and dividend from bank subsidiary at an assumed cost of 3.5% |
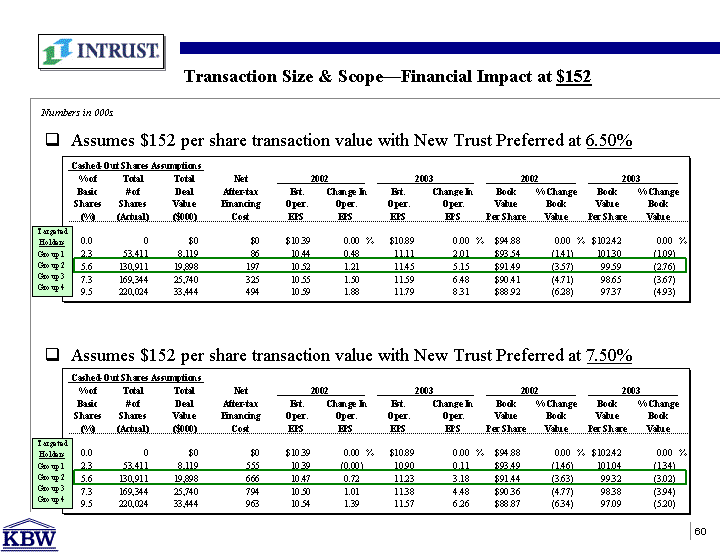
| Numbers in 000s. Transaction Size & Scope-Financial Impact at $152 Assumes $152 per share transaction value with New Trust Preferred at 6.50% Assumes $152 per share transaction value with New Trust Preferred at 7.50% |

| Numbers in 000s. Transaction Size & Scope-Capital Impact Assumes $152 per share transaction value |

| Cashed-out Shareholders: Liquidity at a premium to current market prices No sales commissions Foregone ongoing equity interest Limited opportunity, if any, to re-acquire an equity interest in INTRUST Taxable event Remaining Shareholders Reduced reporting requirement for company, officers and directors Reduced capital Reduced book value per share Accretive effect on net earnings per share Decreased share liquidity Increased share ownership Proposed Transaction Implications |

| Appendix |

| Appendix - Peer Group Detail |
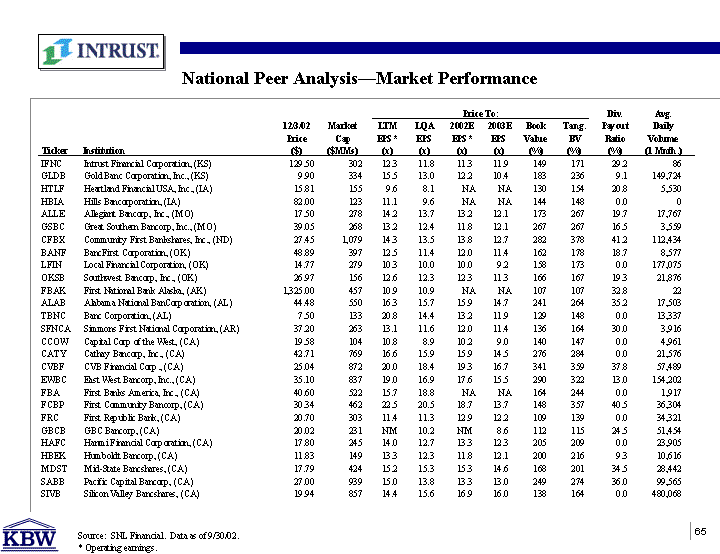
| National Peer Analysis-Market Performance Source: SNL Financial. Data as of 9/30/02. * Operating earnings. |

| National Peer Analysis-Market Performance Source: SNL Financial. Data as of 9/30/02. * Operating earnings. |
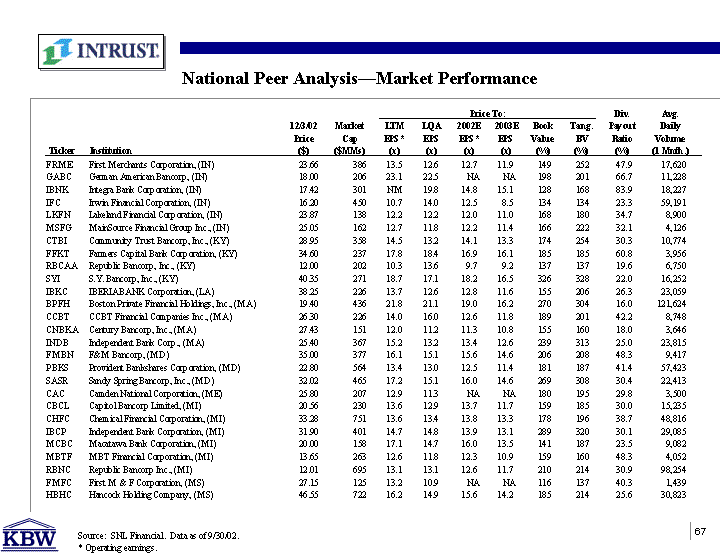
| National Peer Analysis-Market Performance Source: SNL Financial. Data as of 9/30/02. * Operating earnings. |
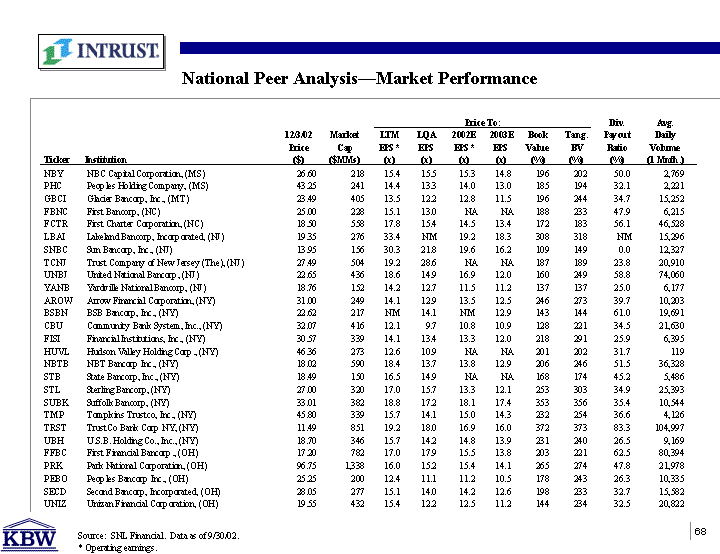
| National Peer Analysis-Market Performance Source: SNL Financial. Data as of 9/30/02. * Operating earnings. |
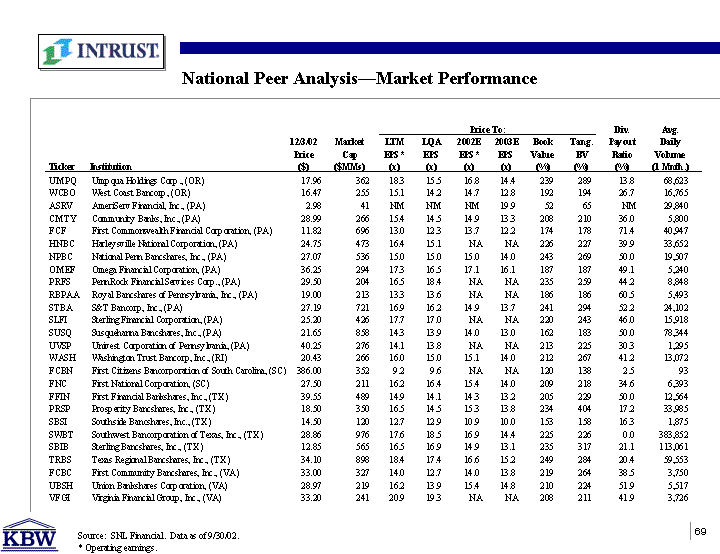
| National Peer Analysis-Market Performance Source: SNL Financial. Data as of 9/30/02. * Operating earnings. |

| National Peer Analysis-Financial Highlights Source: SNL Financial. Data as of 9/30/02. * Operating earnings. |

| Great Plains Analysis-Financial Highlights Source: SNL Financial. Data as of 9/30/02. |

| Great Plains Analysis-Capital & Asset Quality Analysis Source: SNL Financial. Data as of 9/30/02. |

| Great Plains Analysis-Market Performance Source: SNL Financial. Data as of 9/30/02. * Operating earnings. |

| Appendix - Comparable Acquisitions Detail |

| National Comparable Acquisitions Detail Most recent available financial data used for comparables. Sources: SNL Securities, company SEC filings. Boxes indicate median valuation ranges. |

| National Comparable Acquisitions Detail Most recent available financial data used for comparables. Sources: SNL Securities, company SEC filings. Boxes indicate median valuation ranges. |
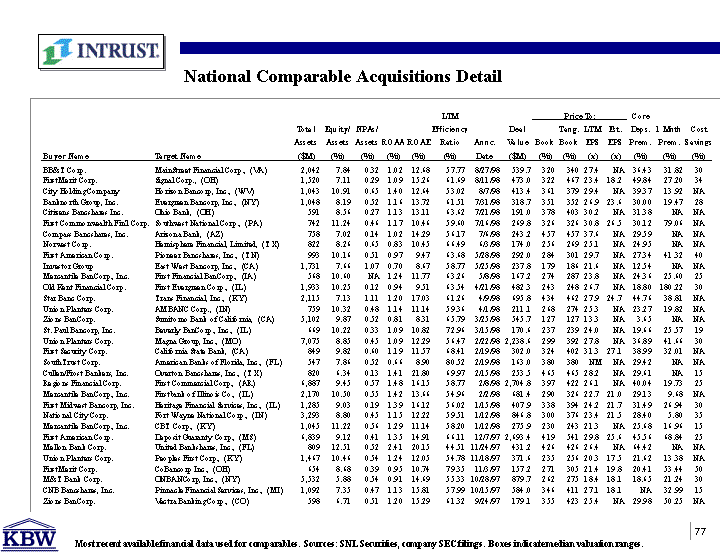
| National Comparable Acquisitions Detail Most recent available financial data used for comparables. Sources: SNL Securities, company SEC filings. Boxes indicate median valuation ranges. |

| National Comparable Acquisitions Detail Most recent available financial data used for comparables. Sources: SNL Securities, company SEC filings. Boxes indicate median valuation ranges. |

| National Comparable Acquisitions Detail Most recent available financial data used for comparables. Sources: SNL Securities, company SEC filings. Boxes indicate median valuation ranges. |

| Great Plains Comparable Acquisitions Detail |

| Appendix - National vs. Great Plains Benchmarking Detail |

| Return on Average Asset Components In recent years, INTRUST's interest margins have outperformed its National and Regional peers. Provision levels exceed its peers due to INTRUST's credit portfolio characteristics. Source: SNL Financial. Data as of 9/30/02. Please refer to appendix for peer group composition. |

| Return on Average Asset Components (Continued) Fee income is above peers due to INTRUST's trust and credit card businesses. These businesses also increase non-interest expense levels. Source: SNL Financial. Data as of 9/30/02. Please refer to appendix for peer group composition. |

| Return on Average Assets Components (Continued) Tax expense levels have historically been above peers, but have recently aligned. INTRUST and its Great Plains peers have achieved approximately 1% ROAA historically while National peers have achieved approximately 1.15% ROAA. Source: SNL Financial. Data as of 9/30/02. Please refer to appendix for peer group composition. |

| Return on Average Equity Components Therefore, dampening ROAE compared to peers. As INTRUST has retained capital, its equity multiplier has fallen. Source: SNL Financial. Data as of 9/30/02. Please refer to appendix for peer group composition. |

| Historical Capital Levels INTRUST and its Great Plains peers have historically been more efficiently leveraged-however INTRUST has accrued excess capital in recent periods. INTRUST augmented regulatory capital levels in 1998 which, coupled with growing retained earnings, has resulted in risk based capital levels moving closer to peers. Source: SNL Financial. Data as of 9/30/02. Please refer to appendix for peer group composition. |
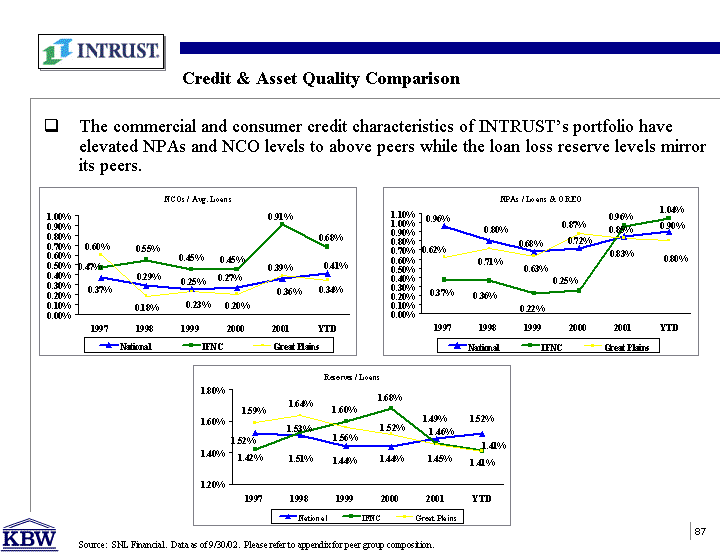
| Credit & Asset Quality Comparison The commercial and consumer credit characteristics of INTRUST's portfolio have elevated NPAs and NCO levels to above peers while the loan loss reserve levels mirror its peers. Source: SNL Financial. Data as of 9/30/02. Please refer to appendix for peer group composition. |

| Historical Market Valuation Levels INTRUST's lower earnings market capitalization rate (P/E ratio) and increased excess equity capital relative to peers has resulted in a lower price to book value versus Great Plains and National peers. Source: SNL Financial. Data as of 9/30/02. Please refer to appendix for peer group composition. |

| Appendix - Scatter Graph for Market Approach Analyses |

| Comparable Acquisitions Detail Scatter Graph Analysis National Comparable Acquisitions Great Plains Comparable Acquisitions Median Implied Value Median Implied Value |

| Comparable Public Company Analysis Scatter Graph Analysis National Peer Analysis Great Plains Peer Analysis Median Implied Value Median Implied Value |
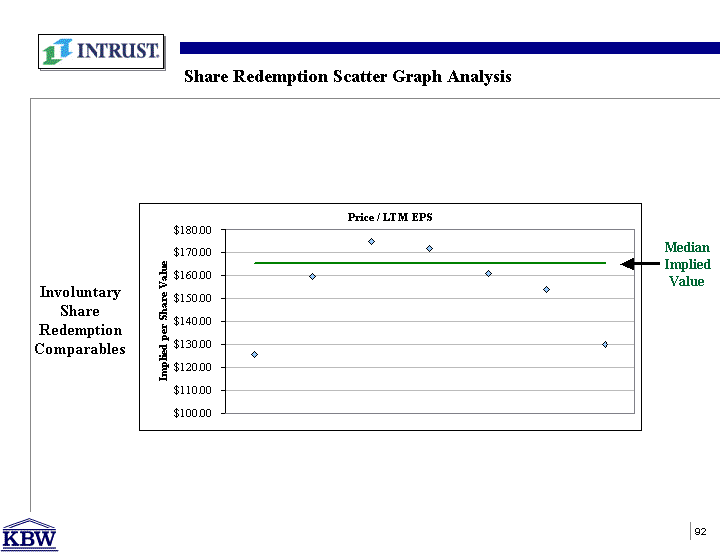
| Involuntary Share Redemption Comparables Share Redemption Scatter Graph Analysis Median Implied Value |